Welcome message from author
This document is posted to help you gain knowledge. Please leave a comment to let me know what you think about it! Share it to your friends and learn new things together.
Transcript

EUROPEAN ORGANIZATION FOR NUCLEAR RESEARCH
CERN{PPE/95{73
18 May 1995
Charged particle multiplicity and transverse energy measured in 32S central
interactions at 200 GeV per nucleon
S. AOKI7;a V. BISI11, A. C. BRESLIN4 , F. CASSOL2, M. G. CATANESI2, D. H. DAVIS6,A. DI BARTOLOMEO9 , S. DI LIBERTO8, M. J. ESTEN6, P. GIUBELLINO11, G. GRELLA9,K. HOSHINO7, M. KAZUNO10, M. KOBAYASHI7, K. KODAMA1, S. LUSSO11, A. MARZARI-CHIESA11, M. MASERA11, F. MEDDI8, M. MIYANISHI7, M. T. MUCIACCIA2,S. NAKANISHI7;b K. NAKAZAWA5, K. NIU7, K. NIWA7, M. NOMURA7, G. POULARD3,L. RAMELLO11, L. RICCATI11, G. ROMANO9, G. ROSA9, M. S. SARTORI11 , C. SGARBI8,H. SHIBUYA10, S. SIMONE2, H. TAJIMA7;b D. N. TOVEE6, N. USHIDA1, T. VIRGILI8;c.
1. Aichi University of Education, Kariya, Japan.
2. Dipartimento di Fisica dell' Universit�a and INFN, Bari, Italy.
3. CERN, Geneva, Switzerland.
4. Department of Physics, University College Dublin, Dublin, Ireland.
5. Faculty of Education, Gifu University, Gifu, Japan
6. Department of Physics & Astronomy, University College London, London,
UK.
7. Department of Physics, Nagoya University, Nagoya, Japan.
8. Dipartimento di Fisica, Universit�a `La Sapienza' and INFN, Rome, Italy.
9. Dipartimento di Fisica Teorica e SMSA dell'Universit�a and INFN, Salerno,
Italy.
10. Department of Physics, Toho University, Funabashi, Japan.
11. Dipartimento di Fisica Sperimentale dell' Universit�a and INFN, Turin, Italy.
Submitted to IL NUOVO CIMENTO A
aNow at Kobe University, Kobe, Japan.bNow at University of California,Santa Barbara, USA.cNow at University of Salerno and INFN,Salerno, Italy.

Abstract. - Interactions induced by 200 GeV per nucleon 32S ions on heavy targets wereselected by the HELIOS calorimeters and studied in nuclear emulsions. Global observables,such as charged particle multiplicity and transverse energy, were determined event-by-event.Multiplicity and transverse energy were measured as a function of the pseudorapidity over thelarge acceptance of the present experiment (0.6� � � 5:5). A comparison of the experimentaldata with those provided by the event generators FRITIOF and VENUS shows remarkabledi�erences both in the target spectator region and in the participant region. An attempt is madeto interpret these discrepancies in terms of plausible mechanisms, like baryon-pair productionor rescattering.
PACS 25.75 - Relativistic heavy-ion nuclear reactions.
1
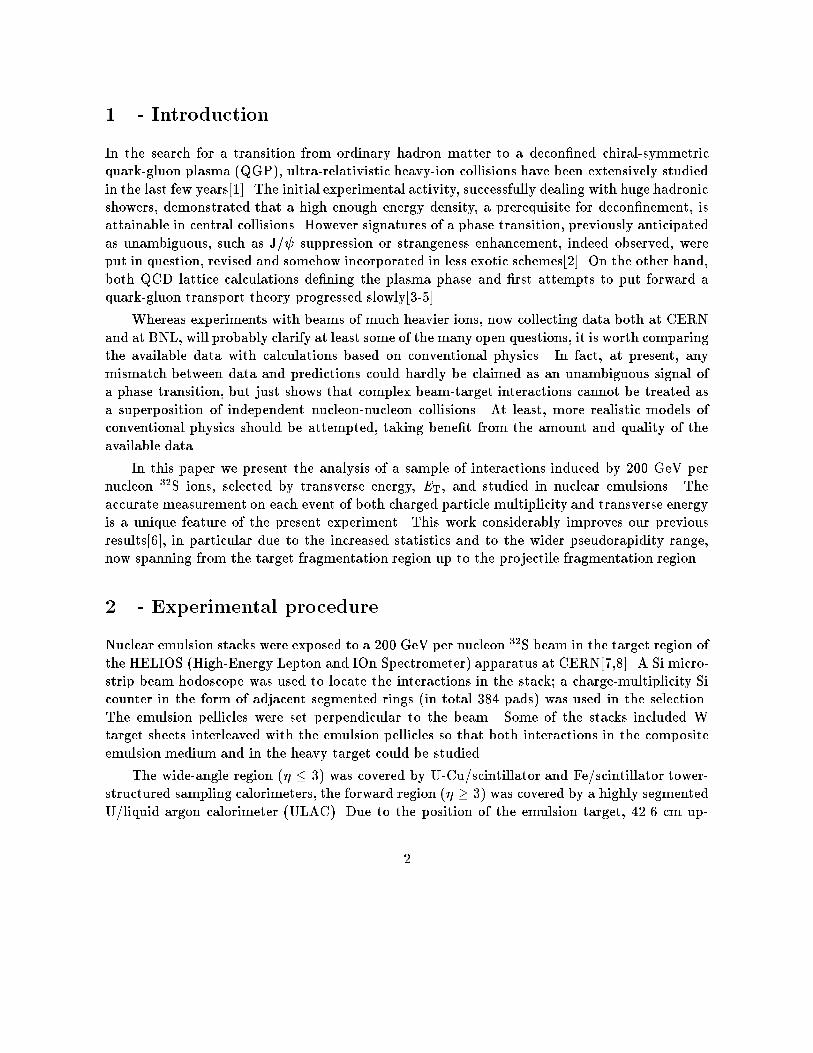
1 - Introduction.
In the search for a transition from ordinary hadron matter to a decon�ned chiral-symmetricquark-gluon plasma (QGP), ultra-relativistic heavy-ion collisions have been extensively studiedin the last few years[1]. The initial experimental activity, successfully dealing with huge hadronicshowers, demonstrated that a high enough energy density, a prerequisite for decon�nement, isattainable in central collisions. However signatures of a phase transition, previously anticipatedas unambiguous, such as J/ suppression or strangeness enhancement, indeed observed, wereput in question, revised and somehow incorporated in less exotic schemes[2]. On the other hand,both QCD lattice calculations de�ning the plasma phase and �rst attempts to put forward aquark-gluon transport theory progressed slowly[3-5].
Whereas experiments with beams of much heavier ions, now collecting data both at CERNand at BNL, will probably clarify at least some of the many open questions, it is worth comparingthe available data with calculations based on conventional physics. In fact, at present, anymismatch between data and predictions could hardly be claimed as an unambiguous signal ofa phase transition, but just shows that complex beam-target interactions cannot be treated asa superposition of independent nucleon-nucleon collisions. At least, more realistic models ofconventional physics should be attempted, taking bene�t from the amount and quality of theavailable data.
In this paper we present the analysis of a sample of interactions induced by 200 GeV pernucleon 32S ions, selected by transverse energy, ET, and studied in nuclear emulsions. Theaccurate measurement on each event of both charged particle multiplicity and transverse energyis a unique feature of the present experiment. This work considerably improves our previousresults[6], in particular due to the increased statistics and to the wider pseudorapidity range,now spanning from the target fragmentation region up to the projectile fragmentation region.
2 - Experimental procedure.
Nuclear emulsion stacks were exposed to a 200 GeV per nucleon 32S beam in the target region ofthe HELIOS (High-Energy Lepton and IOn Spectrometer) apparatus at CERN[7,8]. A Si micro-strip beam hodoscope was used to locate the interactions in the stack; a charge-multiplicity Sicounter in the form of adjacent segmented rings (in total 384 pads) was used in the selection.The emulsion pellicles were set perpendicular to the beam. Some of the stacks included Wtarget sheets interleaved with the emulsion pellicles so that both interactions in the compositeemulsion medium and in the heavy target could be studied.
The wide-angle region (� � 3) was covered by U-Cu/scintillator and Fe/scintillator tower-structured sampling calorimeters, the forward region (� � 3) was covered by a highly segmentedU/liquid argon calorimeter (ULAC). Due to the position of the emulsion target, 42.6 cm up-
2

stream of the standard HELIOS target, the pseudorapidity coverage was 0.1� � � 5:5 insteadof -0.1� � � 5:5; the target shift also implied a small overlap of backward and forward calorime-ters, and the e�ect was taken into account in the o�-line analysis by correcting the value of themeasured ET accordingly.
In order to enrich the data with central interactions, while keeping a sample of (nearly)unbiased events, the physics trigger was set with di�erent ET thresholds on the wide anglecalorimeters, and the fraction of recorded events with low ET was reduced by pre-set down-scaling factors. Interactions to be studied in emulsion were selected o�-line mostly at highET, but a number of them was also sampled at lower ET for reference. We note here that,although nuclear emulsion is a composite target, a su�ciently high ET-cut selects interactionson the heaviest elements (Ag and Br). Indeed, in such a case, even the contribution from Br ismarginal, hence we will refer to an Ag target in connection with high ET S-emulsion data.
The selected interactions were located and the tracks of all the outgoing charged parti-cles measured in emulsion to determine their angles with respect to the beam direction. Themeasurements were performed close to the primary vertex, within � 1 mm, and thus the mul-tiplicity does not include contributions from secondary activity and non-prompt decays. Thisprocedure just allowed the inclusion of a few electron pairs whose vertices were not detectable.It is estimated that they contribute to not more than 2 % of the charged multiplicity.
More details about the experimental set-up, data-taking and measurement procedure canbe found in references[6-9].
The charged particle multiplicity considered in the following refers solely to close-to-minimum ionizing particles ("shower tracks"), while heavily ionizing particles ("black" and"grey" prongs) were excluded. For resolution and e�ciency reasons we restricted ourselves tocharged particle multiplicity and transverse energy in the pseudorapidity range (0.6� � � 5:5).
The �nal data sample consists of 215 S-Ag and 175 S-W interactions.
3 - Models of nucleus-nucleus collisions.
3.1 - Event generators.
We compared our data with two widely used event generators, VENUS[10] and FRITIOF[11].Both generators belong to the class of string models, the main di�erence between them beingthe basic mechanism for string formation (colour exchange for VENUS, momentum exchangefor FRITIOF). In the case of VENUS we used two versions, namely 3.11 and 4.12, because the�rst was extensively used in the past for a comparison with experimental data, but the secondis much more reliable according to the authors, and contains numerous improvements. Furtherattempts are in progress to implement VENUS[12] and other string-model inspired codes, likeDPM and QGSM[13], in order to cope with both higher string densities, already relevant in
3

nucleus-nucleus collisions at SPS energies, and hard scattering processes, of growing importanceat RHIC and LHC energies. In these models, as in several others, nucleus-nucleus collisionsare treated as a linear superposition of nucleon-nucleon interactions. The number of primarycollisions, and thus the number of participating constituents, is determined by the geometry ofthe collision, i. e. by the impact parameter b. The transverse energy ow is then proportionalto the number of participant nucleons.
Still in the framework of conventional physics, the Relativistic Quantum Molecular Dy-namical model, RQMD[14] - an extension of concepts previously applied to intermediate-energynucleus-nucleus collisions - was recently proposed. It postulates the formation of "colour ropes"within a high string density. The coded RQMD was successfully compared with AGS data[15],and the comparison is being extended to SPS data[16].
An alternative approach could be provided by hydrodynamical models[17]. Here, nuclearmatter is treated as an expanding relativistic uid, allowing the formation of QGP under appro-priate initial conditions. Numerical calculations based on these models, that still contain severaluntested assumptions, were recently performed and compared with several sets of nucleus-nucleusdata [5,18]. Since the purpose of this paper is to present our experimental results and to comparethem with relatively simple and well established models, at present we will con�ne our attentionto FRITIOF and VENUS.
Minimum-bias 32S-Ag and 32S-W interactions were generated by VENUS 3.11 and 4.12,and FRITIOF 1.6, with no change in their standard parameters. However, in order to comparedirectly these data with emulsion measurements, charged particles generated with low momentawere not considered and the decay of strange particles, both mesons and baryons, was inhibited.In fact, low momentum charged particles, mostly emitted at large angles, appear in emulsion as"grey" prongs (see section 2), whereas strange particles have long decay paths and their decayproducts are not seen close to the primary vertex. Indeed, removal of low momentum particlesturned out to have a negligible e�ect in our angular acceptance, but the inhibition of strangeparticle decays a�ects considerably the charged particle multiplicity of the generated events,which decreases by 7% to 10%. Of course, this procedure slightly a�ects the ET distributions,but the e�ect turned out to be marginal due to the granularity of the calorimeters.
Figure 1 shows the ET distributions of the generated events on Ag and W, and the di�erentialcross-section d�
dET
reported by HELIOS[8] on the same targets. The normalisation of simulated toexperimental values has been performed according to the procedure shown in section 3.2. Bothversions of VENUS gave almost identical results, indistinguishable on the scale of �gure 1. Allthe distributions are similar, with a wide plateau followed by a steeply falling tail. Indeed, d�
dET
essentially re ects the geometry of the collision, and the shoulder of the curve corresponds tofull overlap of the colliding nuclei. Thus the ET variable is a valuable tag for impact parameter.
It is seen, however, that FRITIOF fails to reproduce the high-ET tail of the measureddi�erential cross-sections, while the agreement with VENUS, both versions, is considerably
4

better. This better agreement must be ascribed to intra-nucleus rescattering, taken into accountin VENUS[10].
3.2 - Normalization procedure and event classi�cation.
In order to compare experimental data with models in terms of centrality, a suitable normal-ization procedure was adopted because a mismatch in d�
dET
prevents a straightforward selectionbased on events within given intervals of ET. Indeed, it is very di�cult to achieve an absolutenormalization in nucleus-nucleus data, because unaccountably large contributions to �inel oftenarise from interactions with low ET, where neither data are available nor generators are reliable.
The model-generated ET-distributions were normalized, for each target, to the HELIOSabsolute cross-sections[8] by integrating them above a given value of transverse energy E0
Tto give
the same �0. Then, both HELIOS and generated distributions were integrated above di�erentvalues of ET � E0
T, and the corresponding fractions of �0 were determined. This procedure
enabled a correspondence to be established among the ET scales. Relative to HELIOS data,the model ET scales were multiplied by a factor 1.00, 1.01 and 1.08 for VENUS 3.11, VENUS4.12 and FRITIOF 1.6, respectively. Finally, an absolute scale of residual cross-sections (i.e.,cross-sections integrated above a certain value of ET) as a function of ET was established bycomputing the inelastic cross-sections for collisions between hard spheres. The value of E0
Twas
arbitrarily chosen to be 150 GeV, but stable results were obtained with (50 < E0
T< 200) GeV.
In this way, two event classes, "semicentral" (SCE) and "central" (CE) respectively, were �nallyde�ned for each target, corresponding to a residual cross-section of 2% (CE) and from 8% to2% (SCE) of the inelastic cross-section. Central interactions correspond to events where thereis full overlap of projectile and target nuclei.
In order to remove trigger and selection biases, essentially for the SCE samples, a weightwas assigned to each event; the weight (� 1) is proportional to the ratio between the known[8]value of d�
dETand the number of measured events at a given ET.
A suitable number of interactions was generated by VENUS and FRITIOF with a cut onthe impact parameter roughly corresponding to a residual �inel of 10%. The �nal samples werethen selected according to the above mentioned procedure.
Table 1 shows global features of both experimental and simulated data in the di�erentclasses. Here, peripheral events have been removed from the samples. Averages over experimen-tal values make use of the weights. Most of these data will be discussed in the next sections.
5

4 - Experimental results and comparison with models.
4.1 - Global observables.
Transverse energy ET and charged multiplicity Nch were measured independently on each se-lected interaction, so that a correlation between these two physical quantities could be easilyestablished and compared with that derived from simulated events. Figure 2 shows the corre-lation between ET and Nch, both measured in the interval (0.6� � � 5:5), and that from theevents generated by means of FRITIOF and VENUS.
It is found that both experimental and generated data show a sharp correlation between ET
and Nch, and that there is independence from the target, apart the maximum attainable values.However, whereas FRITIOF and VENUS 3.11 only slightly overestimate Nch for a given ET,VENUS 4.12 underestimates Nch, and the discrepancy increases for high ET. This is re ectedin the average value of ET per charged particle, as shown in Table 1. As noted by the authorsof VENUS as well[10], in the new version (4.12) rescattering improves the ET distributions buthas little in uence on Nch. Finally, we note that the spread of Nch for a given ET is considerablylarger in the experimental data than in the simulated events over the whole range of ET.
If we had to interpret �gure 2 as an entropy-temperature diagram[19], the continuous andmonotonic trend of the data would not suggest any sign of a phase transition.
4.2 - Pseudorapidity dependence of Nch and ET.
More detailed information about target and projectile fragmentation and about newly producedhadrons can be obtained from di�erential distributions as a function of the pseudorapidity �; thewide range of � attained in this experiment allows an independent analysis of target, intermediateand projectile fragmentation regions.
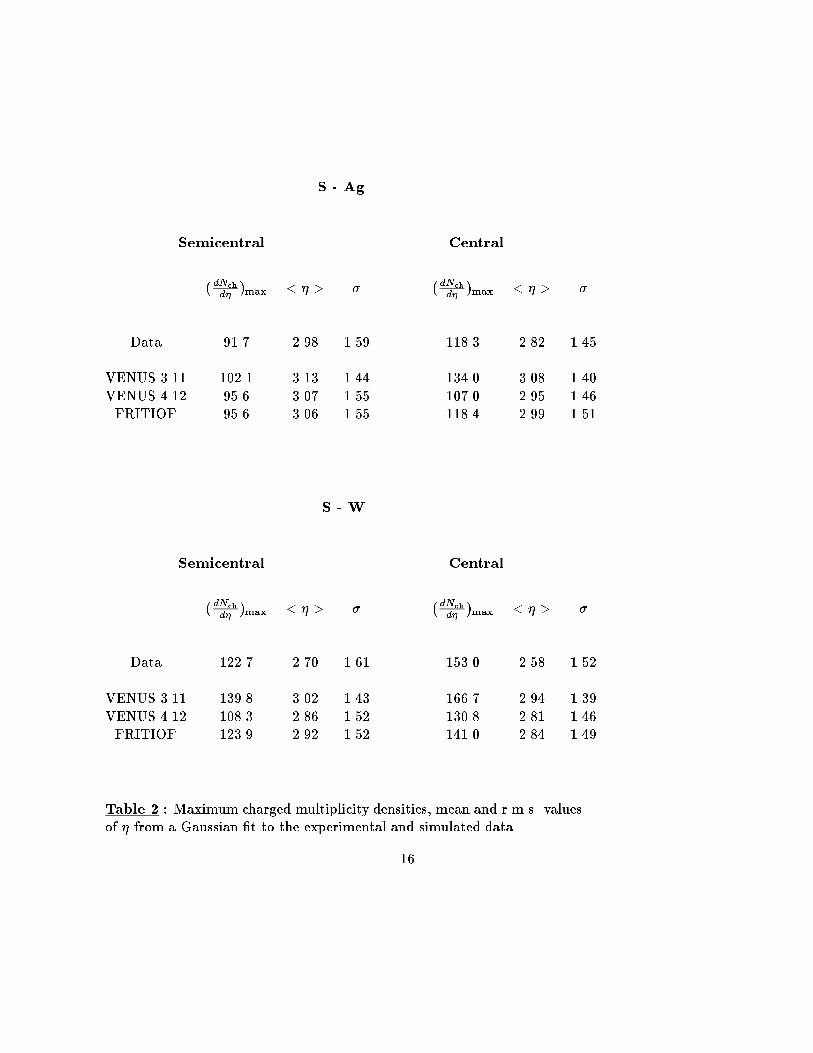
Figure 3 shows the charged multiplicity distributions for the di�erent targets and eventclasses, and the corresponding predictions from FRITIOF and VENUS. Table 2 represents max-imum densities, mean and r.m.s. values of � obtained from a Gaussian �t to the same data.No further normalization was applied to the simulated events in order not to mask overalldiscrepancies.
As a general trend, it is seen that the experimental mean values of � are systematicallysmaller than those computed by the generators, with a discrepancy increasing for the heaviertarget and for central events. However, except for S-W central interactions, FRITIOF seems toreproduce well both the maximum density and the shape of the distributions whereas VENUS3.11 shows a net excess of charged particles in the projectile region and VENUS 4.12 a lack ofthem, mostly in the target region.
Central interactions, in particular S-W interactions, show more asymmetric multiplicity
6

distributions, with a maximum density towards values of � lower than < � >. This e�ect ismuch less evident in the data produced by all the generators.
Figure 4 and table 3 show the transverse energy distributions and the results of Gaussian�ts on the same samples of events, and in a way similar to that used for Nch. Here, again,the experimental values of < � > are smaller than those obtained by the generators, and thediscrepancy now increases even more for the heavier target and for central events.
In addition, the experimental distributions are systematically broader than the simulatedones. Asymmetric experimental distributions are again observed, but the e�ect is now more
evident in the semicentral interactions on both targets. There is an overall agreement between
experimental and simulated data in the projectile region, while a large discrepancy, increas-ing with centrality, is observed in the target region, the worse result being now provided byFRITIOF.
4.3 - Pseudorapidity dependence of ET=Nch.
Figure 5 shows, for the di�erent samples, the transverse energy per charged particle, ET=Nch,as a function of �.
The experimental data show high values of this ratio (up to 1.0 GeV/charged particle) inthe backward region, a steep decrease towards the central region, a bump around � = 4, wherea value of 0.70-0.75 GeV/charged particle is attained, and again a steep decrease in the forwardregion. Both the shape of the distributions and the absolute value of the ratios do not dependmuch on the target and on the centrality of the collisions.
Results from each generator, as well, do not show an appreciable di�erence from sample tosample, but they di�er considerably among themselves and with respect to the experimentaldata. In particular, FRITIOF and VENUS 4.12 show a similar trend in the backward andcentral regions, but VENUS 4.12 falls more steeply in the forward region; VENUS 3.11, on thecontrary, shows a monotonic decrease over the whole range. Of course, most of the discrepanciescan be directly inferred from the distributions shown in �gures 3 and 4. For instance, the highaverage value of ET=Nch found in VENUS 4.12 can be ascribed to some overestimate of ET inthe central region, but mainly to an underestimate of Nch over the whole � range.
About the bump around �=4, that corresponds to a polar emission angle around �=40 mrad,we note that this cannot arise from an instrumental e�ect. In fact this e�ect could arise eitherfrom an overestimate of ET or an underdetermination of Nch around �=4, but from �gures 3and 4 we don't observe any irregularity in the distributions of the experimental data that couldsuggest such a bias. On the other hand, the e�ect is found in the samples with both Ag andW targets, whereas the con�guration of the corresponding emulsion stacks, and in particularthe thickness of the sheets, was very di�erent in the two cases[6]. Furthermore, an angle of 40mrad converts into a transverse linear dimension of about 20 �m at a distance of 0.5 mm from
7

the vertex, zone well inside the �eld of view of the microscopes under the chosen magni�cationand hence not likely to be biased. Finally, the same angular window is completely inside theacceptance of the forward calorimeter (ULAC) of the HELIOS set-up (the junction with othercalorimeters is at �=2.9), and again it is very di�cult to envisage, in such conditions, anyrelevant source of bias.
5 - Discussion.
5.1 - Correlation between Nch and ET.
We have shown that charged particle multiplicity and transverse energy integrated over a widerange of pseudorapidity are strongly correlated, and this allows either of them to be chosenas a tag for centrality. No other experimental data are available, at least in this range ofpseudorapidity, so that no direct comparison of this correlation can be made. Though FRITIOFand VENUS 3.11 reproduce the observed correlation with just some excess of Nch for a givenET (�gure 2), d�
dETfalls in FRITIOF as a consequence of too small values of ET, while it is well
reproduced in VENUS (�gure 1). Thus, having de�ned as "central" those collisions where acomplete overlap of projectile and target is reached (section 3.2), FRITIOF shows an averagemultiplicty close to the measured one, while it is higher in VENUS 3.11. In the case of VENUS4.12, on the contrary, a de�nite underestimate of Nch is obtained (table 1).
Finally, we note that, besides their di�erent meaning, Nch and ET involve the same kindof particles in di�erent ways. For example, Nch is dominated by charged pions that, dependingon the generator, target and centrality, contribute in our samples from 73% to 81% of the totalnumber of charged particles, whereas their contribution to ET ranges from 36% to 45% (from58% to 74% if the s from �o mesons are added as well).
5.2 - Pseudorapidity distributions.
More details can be observed from an analysis of dNch
d�and of dET
d�as functions of pseudorapidity.
We note that our results in most cases are in fair agreement with those from other experimentsat the same energy and with the same or similar targets, in particular EMU01[20] for multiplicitydistributions on emulsion and gold targets, when the di�erent selection in centrality is accountedfor, and WA80[21] for multiplicity and ET distributions, the latter ones within a much narrowerwindow of �.
According to the de�nition of pseudorapidity (� = � ln tan �=2), this coincides with therapidity (y = 1
2ln E+pz
E�pz) for light particles (p >> m), hence to a good approximation for pions.
For heavier particles the approximation is worse : for example, in our conditions, it is found forbaryons < � >'< y > +1 at �=4. As a consequence, particles with di�erent masses created
8

in the same rapidity window will show up separated if analysed in a pseudorapidity spectrum.According to this mechanism { though in our experiment we have no mass identi�cation { it isnot hazardous to interpret the forward excess of both Nch and ET produced by VENUS 3.11with respect to the experimental data (�gures 3 and 4) as a too copious production of baryon-antibaryon pairs, an excess not evident in the same distributions from the other generators(FRITIOF and VENUS 4.12). As an example, we show in �gure 6 dN=d� as a function of �separately for ��, K�, protons and antiprotons, as it is predicted by the various generators incentral S-W interactions. Obviously, in the p distribution, besides those produced in baryon-antibaryon pairs, the protons originating from target and projectile are also present in thecorresponding zone of pseudorapidity. In a similar way, distributions of dET=d� are shown in�gure 7, where the contribution of neutral particles has been added as well because their ET
is measured in the calorimeters, and in particular, instead of p or �p, all the baryons (includingneutrons and strange ones) were considered.
As anticipated, almost the whole excess of Nch produced by VENUS 3.11 in the forwarddirection can be ascribed to the huge contribution of p�p pairs. On the other hand, VENUS4.12 produces more strange particles than the other generators (also neutral ones, not shown in�gure 6), in better agreement with published experimental results[1,22].
Finally, the overall de�ciency of charged particles produced by VENUS 4.12 in the targetregion must be ascribed to the pions. In fact, charged kaons already represent about 10% ofthe average charged multiplicity, and even an unreasonable increase of them by a factor of 2would not �ll the gap. On the other hand, the predicted number of protons is already as muchas expected (see later) and their density around � = 2 was measured directly[23] and found tobe in agreement with this prediction (dN
dy� 20).
Surprisingly, all the generators show for pions almost the same ET distribution as a functionof �, while that for kaons nearly reproduces the corresponding charged multiplicity distribution.On the contrary, there is a large excess of ET in the forward region in VENUS 3.11 with respectto other generators in the sample of antibaryons, but less apparent than that of Nch in thesame zone because the number of produced �n is only '40% that of �p. In the ET distribution ofbaryons, �nally, there is a very large density in the backward region in VENUS 4.12, a factor of2 to 4 larger than in FRITIOF, and this is due not only to the larger contribution from �s, butalso to the unexpectedly large value of ET per baryon (from 0.5 to 1.1 GeV at �=2, as comparedto 0.25 to 0.7 GeV from FRITIOF).
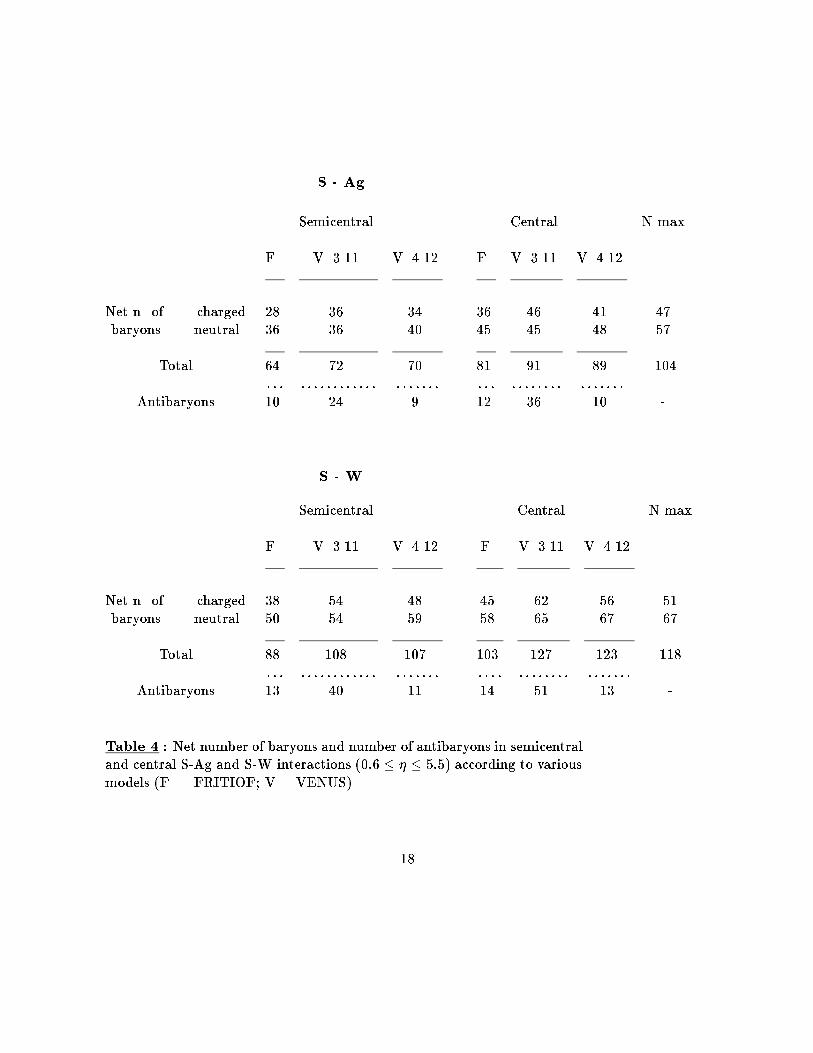
In order to have a more quantitative comparison among the generators, we show in Table4 the predicted net number of baryons (number of baryons minus number of antibaryons),subdivided into charged and neutral, and the total number of antibaryons (of any charge) withinthe interval 0:6 � � � 5:5. Data from the generators refer to the classes of the events consideredup to now. As a comparison, we also show the number of nucleons (N Max) expected to beinvolved in an interaction with impact parameter b = 0. We note that both versions of VENUSgive similar �gures for the net number of baryons, but VENUS 3.11 does not reproduce the
9

isotopic composition of the system projectile-target. Moreover, VENUS involves systematicallymore baryons than FRITIOF, and in some case, like in central S-W interactions, more thanthose foreseen by complete overlap (and even more, if those outside the angular acceptance aretaken into account). This is certainly due to the fact that rescattering was included in theseversions of VENUS, so that some of the spectator nucleons are involved as well.
5.3 - Transverse energy per charged particle.
The discussion of the data shown in �gure 5 is more complicated, because any discrepancybetween experimental data and simulations in the ratio ET=Nch for a given value of � coulddepend on many quantities, in particular the real fraction of neutral and charged particles, andthe same e�ect could be ascribed either to a discrepancy in ET or in Nch or in both.
Around �=1 and below, the experimental ratio ET=Nch is larger than that of both gener-ators. The discrepancy in this zone seems to be due to a lack of ET in the simulations, andthe better quantitative agreement with VENUS 4.12 should be ascribed to the already noticedlack of charged pions. As there is no experimental result on identi�ed particles in this zone, anymore accurate analysis is prevented. We note, however, that the ratio of neutrons-to-protonsis expected to approach that of the target in this zone, whereas it is lower in all simulations,although this fact alone cannot justify the discrepancy.
In the angular region covered by the HELIOS external spectrometer (1 � � � 2), themeasured spectra and composition of identi�ed particles, in particular the ratios p/K/�, leadto the observed value of about 0.7 GeV/charged particle[20]; similarly, around mid-rapidity(2 � � � 3), a region dominated by mesons, our result (0.6 to 0.7 GeV/charged particle)is consistent with other available data[1,21]. In this zone there is an overall agreement withVENUS 3.11 and with FRITIOF as well, though the shape of the distributions is very di�erent.The disagreement with VENUS 4.12 can be ascribed both to the lack of charged pions and tothe large contribution to ET from the baryons (�gure 7).
Around � = 4 (see �gure 5), our data show a sizeable increase of the ratioET=Nch, in contrastwith the trend of all the simulations. Here, we cannot compare our result with that from otherexperiments, but note that the excess with respect to a reasonably monotonic decrease is 10%or more, one order of magnitude greater than the known systematic and statistical errors of ourdetectors[6-9]. It would be tempting to interpret this excess in terms of baryons not accountedfor in the generators; however, in order to have an e�cient mechanism, there should be onaverage around 10 more neutral baryons produced in this narrow window of rapidity. On theother hand, it can be seen that both FRITIOF and VENUS 4.12 produce in this zone a netnumber of baryons compatible with them being the remnants of the projectile, so that the excessshould be in the form of neutral baryon-antibaryon pairs. This hypothesis could be supportedby an enhancement of ET in the experimental data noted in �gure 4 around � = 3:5 (but mostly
10

in the sample of semicentral interactions !).
An alternative or complementary hypothesis could be that in the simulations there is asubstantial lack of mesons (essentially � mesons) in the zone around � = 2:5, where the exper-imental values of ET=Nch show a valley. In other words, this would imply that rescattering isconsiderably more important than that accounted for by the generators. A hint in this directioncould be not only the lack of ET in the backward hemisphere, but also the lower experimentalvalues of < � > for all the samples as compared to the simulations, with a trend to produceeven larger discrepancies for more central interactions and heavier targets (tables 2 and 3). Ofcourse, the maximum e�ect is seen in the sample of S-W central interactions (�gure 3), but themechanism could be active in the other samples as well. In fact, we note from the generatorsthat pions already show a low value of ET/particle and since there are twice as many charged asneutral pions, there results an even lower value of ET/charged particle when compared to thatof kaons or baryons.
6 - Conclusions.
Taking advantage of the wide acceptance of both the emulsion detector and the HELIOScalorimeters, and by tagging central collisions, we have studied charged particle and transverseenergy distributions in 32S interactions at 200 GeV per nucleon on Ag and W targets.
Compared on the basis of normalized cross-sections, microscopic models like FRITIOF andVENUS ultimately fail to reproduce relevant experimental features, such as the absolute valueof the global observables ET and Nch, their ratio, and the shape of their pseudorapidity distri-butions.
No threshold e�ect is apparent in the data as a function of centrality, whereas sizeable targete�ects were detected.
A detailed comparison between our data and those produced by the simulations stronglysuggest an excess or a de�cit of some production mechanism (such as baryon pairs or rescatter-ing). Of course, an investigation based on the momentum distributions of identi�ed particles,possibly over the whole range of pseudorapidity, would shed more light on the present data.
A comparison with collective models, although very appealing, is not yet possible due tomajor theoretical uncertainties still limiting the knowledge of pure/mixed phase equations ofstate and transport phenomena in relativistic ion collisions.
Acknowledgments
It is a pleasure to thank our colleagues of the HELIOS Collaboration who helped us throughthe various stages of the experiment. Helpful discussions with Dr. K. Werner about VENUSsimulation were gratly appreciated.
11

References
(1) H. R. Schmidt and J. Schukraft, J. Phys G: Nucl. Part. Phys. 19
(1993)1705. See also the Proceedings of the last Quark Matter Con-ferences and references therein, e.g. Nucl. Phys. A544 (1992), Nucl.Phys. A566(1994).
(2) B. M�uller, "Physics and signatures of the Quark-Gluon Plasma",CERN preprint NUCL-TH-941005 (1994), submitted to Rep. Progr.Phys.; C. Gerschel, Nucl. Phys. A583(1995)643; S. Gavin et al., Z.Phys. C61(1994)351; A. Capella, "Strangeness enhancement in HeavyIon Collisions", Orsay Preprint LPTHE 94-113 (1994).
(3) "Quark Gluon Plasma", Adv. series on Directions in High EnergyPhysics, Vol. 6 (World Scienti�c, 1990 - R.C. Hwa Editor).
(4) F. Karsch, Nucl. Phys. B (Proc. Suppl.) 34(1994)63.
(5) E. Schnedermann and U. Heinz, Phys. Rev. C50(1994)1675.
(6) T.�Akesson et al., HELIOS-Emulsion Collaboration, Nucl. Phys.B342(1990)279.
(7) T. �Akesson et al., HELIOS Collaboration, Z. Phys. C38(1988)383;Phys. Lett. B214(1988)295.
(8) T.�Akesson et al., HELIOS Collaboration, Nucl. Phys. B353 (1991)1.
(9) T. �Akesson et al., HELIOS Collaboration, Nucl. Phys. B333
(1990)48.
(10) K. Werner, Z. Phys. C42(1989)85; K. Werner, Phys. Rep.232(1993)87.
(11) B. Andersson et al., Nucl. Phys. A447(1985)165c; B. Andersson etal., Nucl. Phys. B281(1987)289.
(12) K. Werner, "String Models for Ultrarelativistic Hadronic Interac-tions: Concepts, Limitations, and New Directions" Int. WorkshopCORINNE-II, (Nantes, 1994), Heidelberg preprint HD-TVP-94-20 andCERN preprint NUCL-TH-9411033(1994).
(13) A. Capella et al., Phys. Rep. 236(1994)225; J. Ranft et al.,Phys. Lett.B320(1994)346; H.J. Moehring et al., Phys. Rev.D47(1993)4146.
12

(14) H. Sorge et al., Z. Phys. C47(1990)629; H. Sorge et al., Phys. Lett.B289(1992)6.
(15) M. Gonin et al., Phys. Rev. C51(1995)310.
(16) H.Sorge et al., Z. Phys. C59(1993)85.
(17) J.D. Bjorken, Phys. Rev. D27(1983)140; H. von Gersdo�, L. McLer-ran, M. Kataja and P.V. Ruuskanen, Phys. Rev. D34(1986)794;K.S. Lee, U. Heinz, E. Schnedermann, Z. Phys. C48(1990)525; D.H.Rischke, H. Stocker, W. Greiner, Phys. Rev. D42(1990)2283. J.-P.Blaizot and J.-Y. Ollitrault, Hydrodynamics of Quark-Gluon-Plasmas,ref (3), p. 393.
(18) L. Bravina et al., Phys. Rev. C50(1994)2161; S. Muroya et al., "Nu-merical Analyses of CERN 200 GeV/A Heavy-Ion Collisions Basedon a Hydrodynamical Model with Phase Transition", CERN preprintNUCL-TH-9502002(1995).
(19) L. Van Hove, Phys. Lett. 118B(1982)138; see also B. M�uller in ref.(2).
(20) M. I. Adamovich et al., EMU01 Collaboration, Z. Phys.C56(1992)509.
(21) R. Albrecht et al., WA80 Collaboration, Z. Phys. C55(1992)539.
(22) R. Albrecht et al., WA80 Collaboration, Phys. Rev. C44(1991)2736;E. Andersen et al., NA36 Collaboration, Phys. Lett. B294(1992)127;T. Alber et al., NA35 Collaboration, Z. Phys. C64(1994)195.
(23) T. �Akesson et al., HELIOS Collaboration, Z. Phys. C46(1990)361; Z.Phys. C46(1990)369; Z. Phys. C53(1992)183.
13

Figure Captions :
Fig. 1 Di�erential ET cross-section from ref. [8]: (a) Ag target, and (b) Wtarget. Continuous and broken lines, respectively, refer to ET distri-butions of minimum-bias events generated by VENUS (both 3.11 and4.12) and FRITIOF (1.6).
Fig. 2 Correlation between ET and Nch. Entries from individual eventson emulsion (open circles) and W targets (dots). Crosses representVENUS and FRITIOF results; no target dependence is observed. Foreach cross, the horizontal arm indicates the ET bin and the verticalarm the Nch standard deviation.
Fig. 3 Pseudorapidity density distributions 1
Nev
dNch
d�for semicentral and cen-
tral event classes, separately shown for each target. Dots refer to ex-perimental data, lines to VENUS and FRITIOF, respectively.
Fig. 4 Pseudorapidity ET-distributions1
Nev
dET
d�, for the same classes as in
Fig. 3. Graphic symbols as in Fig. 3.
Fig. 5 Pseudorapidity distributions of the ratio <ET><Nch>
, for the same classesas in Fig. 3 and 4. Graphic symbols as in Fig. 3 and 4. The verticalbars indicate the error on the mean ratio, as estimated by its standarddeviation in each � bin.
Fig. 6 Pseudorapidity density distributions 1
Nev
dNd�
for separate charged par-ticles obtained from the models in central S-W interactions.
Fig. 7 Pseudorapidity ET-distributions1
Nev
dET
d�, for separate particles ob-
tained from the models in central S-W interactions.
14

N. of events ET (GeV) < Nch > rms <ET><Nch>
(GeV)
min max aver.
S-Ag SemicentralData 119 195 263 222 319 42 0.70
VENUS 3.11 530 184 258 217 339 39 0.64VENUS 4.12 564 190 254 214 284 30 0.75FRITIOF 581 180 242 206 332 32 0.62
S-Ag CentralData 58 263 - 275 389 39 0.71
VENUS 3.11 259 258 - 275 435 35 0.63VENUS 4.12 131 254 - 272 357 24 0.76FRITIOF 191 242 - 254 404 26 0.63
S-W SemicentralData 111 258 326 284 422 51 0.67
VENUS 3.11 461 262 325 288 462 40 0.62VENUS 4.12 451 244 316 283 371 28 0.76FRITIOF 494 244 290 261 422 29 0.62
S-W CentralData 30 326 - 334 502 47 0.66
VENUS 3.11 163 325 - 334 537 28 0.62VENUS 4.12 126 316 - 333 434 25 0.77FRITIOF 170 290 - 298 477 28 0.62
Table 1 : Global features of measured data and simulated events, bothselected according toET and to the criteria discussed in the text; secondariesin the range 0:6 � � � 5:5.
15
S - Ag
Semicentral Central
(dNch
d�)max < � > � (dNch
d�)max < � > �
Data 91.7 2.98 1.59 118.3 2.82 1.45
VENUS 3.11 102.1 3.13 1.44 134.0 3.08 1.40VENUS 4.12 95.6 3.07 1.55 107.0 2.95 1.46FRITIOF 95.6 3.06 1.55 118.4 2.99 1.51
S - W
Semicentral Central
(dNch
d�)max < � > � (dNch
d�)max < � > �
Data 122.7 2.70 1.61 153.0 2.58 1.52
VENUS 3.11 139.8 3.02 1.43 166.7 2.94 1.39VENUS 4.12 108.3 2.86 1.52 130.8 2.81 1.46FRITIOF 123.9 2.92 1.52 141.0 2.84 1.49
Table 2 : Maximum charged multiplicity densities, mean and r.m.s. valuesof � from a Gaussian �t to the experimental and simulated data.
16

S - Ag
Semicentral Central
(dET
d�)max (GeV) < � > � (dET
d�)max (GeV) < � > �
Data 65.6 2.91 1.57 81.8 2.70 1.55
VENUS 3.11 67.4 3.00 1.38 87.5 2.94 1.33VENUS 4.12 66.0 2.93 1.40 87.1 2.87 1.32FRITIOF 61.6 3.02 1.46 77.8 2.94 1.41
S - W
Semicentral Central
(dET
d�)max (GeV) < � > � (dET
d�)max (GeV) < � > �
Data 81.5 2.56 1.73 99.1 2.39 1.63
VENUS 3.11 89.9 2.86 1.36 107.2 2.79 1.32VENUS 4.12 88.3 2.77 1.38 108.4 2.72 1.30FRITIOF 79.2 2.89 1.43 92.2 2.82 1.39
Table 3 : Maximum transverse energy densities, mean and r.m.s. valuesof � from a Gaussian �t to the experimental and simulated data.
17
S - Ag
Semicentral Central N max
F. V. 3.11 V. 4.12 F. V. 3.11 V. 4.12
Net n. of charged 28 36 34 36 46 41 47baryons neutral 36 36 40 45 45 48 57
Total 64 72 70 81 91 89 104: : : : : : : : : : : : : : : : : : : : : : : : : : : : : : : : : : : : : : : :
Antibaryons 10 24 9 12 36 10 -
S - W
Semicentral Central N max
F. V. 3.11 V. 4.12 F. V. 3.11 V. 4.12
Net n. of charged 38 54 48 45 62 56 51baryons neutral 50 54 59 58 65 67 67
Total 88 108 107 103 127 123 118: : : : : : : : : : : : : : : : : : : : : : : : : : : : : : : : : : : : : : : : :
Antibaryons 13 40 11 14 51 13 -
Table 4 : Net number of baryons and number of antibaryons in semicentraland central S-Ag and S-W interactions (0:6 � � � 5:5) according to variousmodels (F. = FRITIOF; V.= VENUS).
18

Figure 1:

Figure 2:

Figure 3:

Figure 4:

Figure 5:

Figure 6:
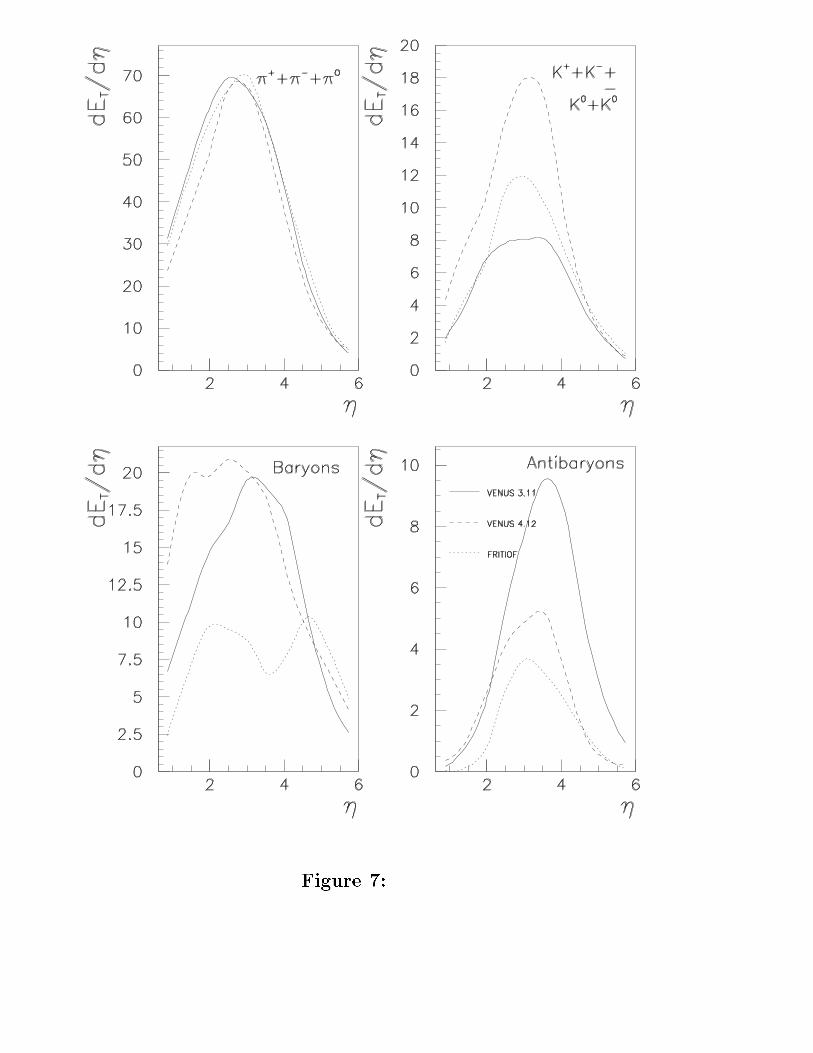
Figure 7:
Related Documents