Characterizing landscape pattern and ecosystem service value changes for urbanization impacts at an eco-regional scale Shiliang Su a , Rui Xiao a , Zhenlan Jiang b , Yuan Zhang c, * a College of Environmental & Resource Sciences, Zhejiang University, Hangzhou, China b Department of Geographical Sciences, Minjiang University, Fuzhou, China c Key Laboratory of Geographical Information Science, Ministry of Education, East China Normal University, No.3663 Zhongshanbei Road, Shanghai 200062, China Keywords: Landscape pattern Ecosystem service values Urbanization Eco-region Remote sensing Ecological landscape planning abstract This paper qualitatively examined urbanization impacts at an eco-regional scale by analyzing landscape pattern and ecosystem service value changes in four eco-regions in the Hang-Jia-Hu region (China): the Hang-Jia-Hu Plains agricultural eco-region (region 1), the Tianmu Mountain forest eco-region (region 2), the Hangzhou urban eco-region (region 3), and the Qiandao Lake watershed forests-wetlands eco-region (region 4). Our results showed that the four eco-regions exhibited a similar urbanization process of rapid population growth, economic development and urban expansion. The considerable urban expansion led to a loss of 8.5 billion RMB yuan ecosystem service values per year on average between 1994 and 2003. The problems associated with urbanization were namely that the level of the landscapes within regions 1, 2, and 3 became increasingly more diverse, irregular, fragmented and isolated. Region 4 presented the opposite trend. Multivariate regression further qualitatively explored the dynamics of landscape changes in response to urbanization as well as the interactions between landscape pattern and ecosystem service values. It was found that landscape fragmentation, configuration and diversity, which were induced by urbanization, could significantly impair the provisions of ecosystem services. By discussing the inside meaning of the obtained regression models, we also discussed some implications for landscape planning. Our results highlighted the significance of joint application of landscape metric analysis and ecosystem service values assessment in landscape planning. Ó 2011 Elsevier Ltd. All rights reserved. Introduction As population concentrations grew and economic activities intensified, the demand for developed land (e.g., housing, infra- structure, factories, and shopping centers) increased, and the consequent growth in urban areas appeared as “settlement expansion”, or urbanization (Weng, 2007). People living in urban areas now account for almost 50% of the world’s population, and the prospect is that the urbanization rate will reach 60% by 2030 (Avelar, Zah, & Tavares-Corrêa, 2009). Some landscape planners regard urban sprawl as an opportunity to improve quality of life and to promote economic development (Burchell et al., 2000, pp. 351e391); however, rapid urbanization has resulted in many ecological problems worldwide (Matteucci & Morello, 2009). Monitoring landscape pattern changes provides an indirect approach for characterizing the ecological consequences of urbanization (Shrestha, York, Boone, & Zhang, 2011; Solon, 2009; Weng, 2007) because such changes would influence a variety of ecological processes and functions (Turner, Gardner, & O’Neill, 2001; Weng, 2007), such as land quality (Su, Li, Yu et al., 2011), habitat (Ng, Xie, & Yu, 2011), water quality (Su, Li, Zhang et al., 2011; Su, Zhi et al., 2011; Tu, 2011), biodiversity (Turner et al., 2001), soil sealing (Su, Zhang, Zhang, Zhi, & Wu, 2011), vegetation carbon storage (Ren et al., 2011), and greenhouse gases emission (Matteucci & Morello, 2009). Recent literature has therefore paid considerable attention to monitoring landscape changes (Campos et al., 2011; Gao & Li, 2011; Kromroy, Ward, Castillo, & Juzwik, 2007; Schulz, Cayuela, Echeverria, Salas, & Benayas, 2010; Solon, 2009; Su, Jiang, Zhang, & Zhang, 2011). However, simple analysis of landscape pattern changes may not provide complete references for landscape planning because it fails to reflect the economic uses of landscapes. The two-fold goals of landscape planning may consequently not be realized: to conserve ecosystems and to achieve the potential economic value of landscapes (Wainger, King, Mack, Price, & Maslin, 2010). Ecosystem services are the benefits that ecosystems provide as supportive functions to maintain the daily life of living organisms * Corresponding author. Tel./fax: þ86 21 62235476. E-mail addresses: [email protected] (S. Su), [email protected] (R. Xiao), [email protected] (Z. Jiang), [email protected] (Y. Zhang). Contents lists available at SciVerse ScienceDirect Applied Geography journal homepage: www.elsevier.com/locate/apgeog 0143-6228/$ e see front matter Ó 2011 Elsevier Ltd. All rights reserved. doi:10.1016/j.apgeog.2011.12.001 Applied Geography 34 (2012) 295e305

Welcome message from author
This document is posted to help you gain knowledge. Please leave a comment to let me know what you think about it! Share it to your friends and learn new things together.
Transcript
at SciVerse ScienceDirect
Applied Geography 34 (2012) 295e305
Contents lists available
Applied Geography
journal homepage: www.elsevier .com/locate/apgeog
Characterizing landscape pattern and ecosystem service value changesfor urbanization impacts at an eco-regional scale
Shiliang Su a, Rui Xiao a, Zhenlan Jiang b, Yuan Zhang c,*
aCollege of Environmental & Resource Sciences, Zhejiang University, Hangzhou, ChinabDepartment of Geographical Sciences, Minjiang University, Fuzhou, ChinacKey Laboratory of Geographical Information Science, Ministry of Education, East China Normal University, No.3663 Zhongshanbei Road, Shanghai 200062, China
Keywords:Landscape patternEcosystem service valuesUrbanizationEco-regionRemote sensingEcological landscape planning
* Corresponding author. Tel./fax: þ86 21 62235476E-mail addresses: [email protected] (S. Su), x
[email protected] (Z. Jiang), [email protected]
0143-6228/$ e see front matter � 2011 Elsevier Ltd.doi:10.1016/j.apgeog.2011.12.001
a b s t r a c t
This paper qualitatively examined urbanization impacts at an eco-regional scale by analyzing landscapepattern and ecosystem service value changes in four eco-regions in the Hang-Jia-Hu region (China): theHang-Jia-Hu Plains agricultural eco-region (region 1), the Tianmu Mountain forest eco-region (region 2),the Hangzhou urban eco-region (region 3), and the Qiandao Lake watershed forests-wetlands eco-region(region 4). Our results showed that the four eco-regions exhibited a similar urbanization process of rapidpopulation growth, economic development and urban expansion. The considerable urban expansion ledto a loss of 8.5 billion RMB yuan ecosystem service values per year on average between 1994 and 2003.The problems associated with urbanization were namely that the level of the landscapes within regions1, 2, and 3 became increasingly more diverse, irregular, fragmented and isolated. Region 4 presented theopposite trend. Multivariate regression further qualitatively explored the dynamics of landscape changesin response to urbanization as well as the interactions between landscape pattern and ecosystem servicevalues. It was found that landscape fragmentation, configuration and diversity, which were induced byurbanization, could significantly impair the provisions of ecosystem services. By discussing the insidemeaning of the obtained regression models, we also discussed some implications for landscape planning.Our results highlighted the significance of joint application of landscape metric analysis and ecosystemservice values assessment in landscape planning.
� 2011 Elsevier Ltd. All rights reserved.
Introduction
As population concentrations grew and economic activitiesintensified, the demand for developed land (e.g., housing, infra-structure, factories, and shopping centers) increased, and theconsequent growth in urban areas appeared as “settlementexpansion”, or urbanization (Weng, 2007). People living in urbanareas now account for almost 50% of the world’s population, andthe prospect is that the urbanization rate will reach 60% by 2030(Avelar, Zah, & Tavares-Corrêa, 2009). Some landscape plannersregard urban sprawl as an opportunity to improve quality of life andto promote economic development (Burchell et al., 2000, pp.351e391); however, rapid urbanization has resulted in manyecological problems worldwide (Matteucci & Morello, 2009).
Monitoring landscape pattern changes provides an indirectapproach for characterizing the ecological consequences of
[email protected] (R. Xiao),om (Y. Zhang).
All rights reserved.
urbanization (Shrestha, York, Boone, & Zhang, 2011; Solon, 2009;Weng, 2007) because such changes would influence a variety ofecological processes and functions (Turner, Gardner, & O’Neill,2001; Weng, 2007), such as land quality (Su, Li, Yu et al., 2011),habitat (Ng, Xie, & Yu, 2011), water quality (Su, Li, Zhang et al., 2011;Su, Zhi et al., 2011; Tu, 2011), biodiversity (Turner et al., 2001), soilsealing (Su, Zhang, Zhang, Zhi, & Wu, 2011), vegetation carbonstorage (Ren et al., 2011), and greenhouse gases emission(Matteucci & Morello, 2009). Recent literature has therefore paidconsiderable attention to monitoring landscape changes (Camposet al., 2011; Gao & Li, 2011; Kromroy, Ward, Castillo, & Juzwik,2007; Schulz, Cayuela, Echeverria, Salas, & Benayas, 2010; Solon,2009; Su, Jiang, Zhang, & Zhang, 2011). However, simple analysisof landscape pattern changes may not provide complete referencesfor landscape planning because it fails to reflect the economic usesof landscapes. The two-fold goals of landscape planning mayconsequently not be realized: to conserve ecosystems and toachieve the potential economic value of landscapes (Wainger, King,Mack, Price, & Maslin, 2010).
Ecosystem services are the benefits that ecosystems provide assupportive functions to maintain the daily life of living organisms

S. Su et al. / Applied Geography 34 (2012) 295e305296
on the earth (Millennium Ecosystem Assessment, 2003; Sherrouse,Clement, & Semmens, 2011). Rapid urbanization has resulted insignificant alterations in the structure and functions of ecosystems,which are consequently impaired in their capacity to deliver theexpected services (Vitousek, Mooney, Lubchenco, & Melillo, 1997).Since the Millennium Ecosystem Assessment report was released,recent studies from economic perspectives have qualified theindirect influence of urbanization on ecological conditions usingthe concept of “ecosystem service values” (Millennium EcosystemAssessment, 2003). The assessment of ecosystem service values isone of the critical endeavors in ecological economics (Kozak, Lant,Shaikh, & Wang, 2011) and should be useful for ecological plan-ners (van der Horst, 2011) given its capacity to combine ecologicalprocesses and economic outcomes (Wainger et al., 2010). However,how to integrate the concept of “ecosystem service values” withecological planning remains unresolved (de Groot, Alkemade,Braat, Hein, & Willemen, 2010). Specifically, a joint analysis oflandscape patterns and ecosystem service values has been rarelyreported.
The global acceleration of urbanization leads to ecologicalproblems at multiple spatial scales. The use of predefined,ecologically meaningful landscape types has been advocated asreference units for ecological management (Banko, Wrbka,Schmitzberger, & Zethner, 2003; Su, Zhang et al., 2011). “Eco-region” denotes areas dominated by similar ecosystems andcharacterized by environmental resources of similar category,quantity, and quality (US. EPA, www.epa.gov/wed/pages/ecoregions.htm). Given the different potentials and capacities ofecosystems, eco-regions stratify the environment according totheir different responses to human disturbances (US. EPA, www.epa.gov/wed/pages/ecoregions.htm). An eco-region can providea holistic view for ecological management for the followingreasons (Galván, Juanes, & Puente, 2010; Yáñez-Arancibia & Day,2004): (1) eco-region partition becomes aware of the insepa-rable interactions between ecosystems and human beings; (2)eco-region partition considers humans as the primary determi-nant for most ecological changes; and (3) eco-region partitionrealizes the existence of ecological thresholds in response tohuman activities. Many countries have recently divided their owneco-regional zones, such as the USA, China, Chile, and Tanzania.Related literature on this topic has also increased significantly,varying from the concept of eco-region itself to approaches to eco-region zoning, functions, and ecological practices in different eco-regions. While the concept and approaches relating to the eco-region have experienced considerable advances, seldom havestudies been reported as characterizing the ecological conse-quences of urbanization at an eco-regional scale. More efforts aretherefore required to address this specific issue.
Remote sensing (RS) and geographic information systems (GIS)have been shown to be promising tools for investigating landscapepattern changes at various scales. Monitoring, modeling, andassessment of the pattern and structure of landscapes can beconducted using landscape metrics (Kromroy et al., 2007; Su, Jianget al., 2011). Recently, the comprehensive application of RS, GIS, andlandscape metrics has been utilized in applied geographical studiesregarding the ecological consequences of urbanization (Gao & Li,2011; Geri, Amici, & Rocchini, 2010; Li et al., 2011; Su, Jiang et al.,2011; Su, Xiao, & Zhang, 2011).
Although there are many other areas worldwide undergoingfast growth, we conducted the present study in the Hang-Jia-Huregion, which is one of the most urbanized and populatedmetropolitan parts of eastern coastal China. Multiple approaches,such as RS, GIS, landscape metrics, and multivariate statistics,were used to facilitate the analysis. Our specific objectives are (1)to qualitatively analyze the urbanization process and its
ecological consequences at an eco-regional scale in the Hang-Jia-Hu region between 1994 and 2003, (2) to conduct a joint analysisof landscape pattern changes and ecosystem service values, and(3) to discuss some implications for ecological landscapeplanning.
Background
Study area
The Hang-Jia-Hu region covers three municipalities (Hangzhou,Jiaxing, and Huzhou) of Zhejiang Province (Fig. 1) and has fourteenmillion inhabitants. The mean rainfall amounts to 1139 mm, theannual temperature averages 17.5 �C, and the amount of sunshineaverages 1762 hours per year (Su, Xiao et al., 2011). Mountains arethe main landform for the southwest region while the northeastcounterpart is comprised of plains. With the market transitionstarting in 1994, this area has been undergoing vigorous social-economic changes and intensive urbanization, and it nearlytripled its GDP from 1994 to 2003 (Su, Jiang et al., 2011). However,landscapes in this region have changed dramatically and becomemore fragmented and degraded. The landscape pattern changesthat it experienced may reflect those of rapidly growing cities inother subtropical parts of the world. Consequently, a case study ofthe Hang-Jia-Hu region can be a representative examination of theecological consequences of urbanization.
Partition of eco-regions in the Hang-Jia-Hu region
Partition of eco-regions in Zhejiang Province was based on a setof indicators from three aspects: the status of the ecologicalenvironment, the sensitivity of the ecological environment, andthe importance of ecosystem functions (Yu, Shao, Yu, Yu, & Hu,2006). The status of the ecological environment involves eightaspects: biodiversity, water resources and water environment,vegetation and forest resources, land resources, atmosphericenvironment and acid rain, marine environment and coastalresources, tourism resources, and natural disasters. The sensitivityof the ecological environment is assessed from six aspects: soilerosion, acid rain, water pollution, water stress, geological disas-ters, and meteorological disasters. Several particular ecosystemfunctions are evaluated for different areas according to theirimportance: biodiversity maintenance and habitat protection,water conservation and drinking water source protection, soilconservation, nutrient conservation, flood regulation and storage,natural and cultural heritage protection, and the provision ofgoods. All these indicators were aggregated by the analytic hier-archy process and GIS. Finally, eco-regions in Zhejiang Provincewere divided into 15 eco-regions by spatial zoning.
According to the eco-region classification system of ZhejiangProvince (Yu et al., 2006), the Hang-Jia-Hu region includes foureco-regions (Fig. 1). The four eco-regions are as follows: theHang-Jia-Hu Plains agriculture eco-region (region 1), the TianmuMountain forest eco-region (region 2), the Hangzhou urban eco-region (region 3), and the Qiandao Lake watershed forests-wetlands eco-region (region 4). The dominant ecosystemsdiffered among the four eco-regions. Considering their differentcapacities and responses to human activities, the major goal ofecological landscape planning is consequently distinct in eacheco-region: farmland protection is the core for region 1;preserving the ecological integrity of forests is given specialattention in region 2; maintaining urban growth in an orderlyand compact manner is the key task for planning in region 3; andfocusing on forest and wetland protection is the primary goal forregion 4.

Fig. 1. Location of Hang-Jia-Hu region and spatial division of four eco-regions as well as land use and land cover maps in 1994 and 2003.
S. Su et al. / Applied Geography 34 (2012) 295e305 297
Materials and methods
Land use and land cover data sets
The data of land use and land cover (LULC) were obtained fromSu, Jiang et al. (2011). Landsat Thematic Mapper (TM) images forthe years 1994 and 2003, after being geometrically registered,were classified using multiple endmember spectral mixtureanalysis and aggregated into four major land types: build-up,forest, water and farmland (Fig. 1). Details of the interpretationcan be found in Su, Jiang et al. (2011). Three main reasonsaccounted for selecting this scheme of LULC classification. First,these four LULC types represented the dominant ecosystems andreflected the land use intensity in the study area. Second, theselection keeps in accordance with the local official standards forland use classification and at the same time considers the ability ofTM images to interpret LULC patterns. The local official standardsfor land use classification divided the LULC into two hierarchicallevels. The fragmented landscape patterns reduced the efficiencyof the TM images in detecting second-level LULC types (e.g.,different forest species) given the relatively coarse resolution ofTM images (Su, Jiang et al., 2011). Finally, the choice facilitates theassessment of ecosystem service value because the value coeffi-cients were available for only seven LULC types in China. Moredetailed information regarding the ecosystem service values canbe found in Section 3.3.
Landscape metrics analysis
A large set of landscape metrics has been developed in therecent past. The abilities of landscape metrics to indicate anecological process have been discussed by several researchers (e.g.,Leitão & Ahern, 2002; Ribeiro & Lovett, 2009; Su, Jiang et al., 2011).The selection of landscape metrics in this paper was based on fourcriteria: (1) comparability with previous landscape ecologicalstudies (Kromroy et al., 2007; Leitão & Ahern, 2002; Pôças, Cunha, &Pereira, 2011; Solon, 2009; Su, Jiang et al., 2011; Weng, 2007); (2)ability to indicate ecological conditions (for details of the associa-tion between landscape metrics and ecological conditions, seeRibeiro & Lovett, 2009; Su, Jiang et al., 2011); (3) low redundancyamong landscape metrics (we performed a multicollinearity test bycalculating all the metrics at an eco-regional scale; for similarissues, see Leitão & Ahern, 2002); and (4) ability to reflect thecharacteristics of landscape patterns for the study area. Theselected landscape-level metrics were as follows: patch density(PD), area-weighted mean shape index (SHAPE_AM), Connectanceindex (CONNECT), Contagion (CONTAG) and Shannon’s diversityindex (SHDI). In addition, the percentage of landscape (PLAND), PD,SHAPE_AM, Interspersion and Justaposition Index (IJI) andEuclidean nearest neighbor distance (ENND)were also calculated atthe class level by FRAGSTATS 3.3 (McGarigal, Cushman, Neel, & Ene,2002). Besides these metrics, another metric, named the land useintensity index (LUII), was further used to describe the landscape
S. Su et al. / Applied Geography 34 (2012) 295e305298
changes. LUII was proposed by the Chinese Academy of Sciences,and the equation was presented as follows:
LUII ¼Xn
i¼1
Ai � Ci (1)
where LUII is the land use intensity index; Ai denotes thepercentage of different land use types; and Ci is the coefficient valueof intensity for different land use types. Specifically, Ci is assigned 4for build-ups, 3 for farmland and 2 for forest and water bodies.
Ecosystem service values assessment
To calculate ecosystem service values for each eco-region, wereferred to Costanza’s ecosystem service values assessment model(Costanza et al., 1997) as follows:
ESV ¼X
ðAk � VCkÞ (2)
where ESV denotes the total values of ecosystem services while Ak
and VCk represent the area and value coefficient for proxy biometype ‘k’, respectively.
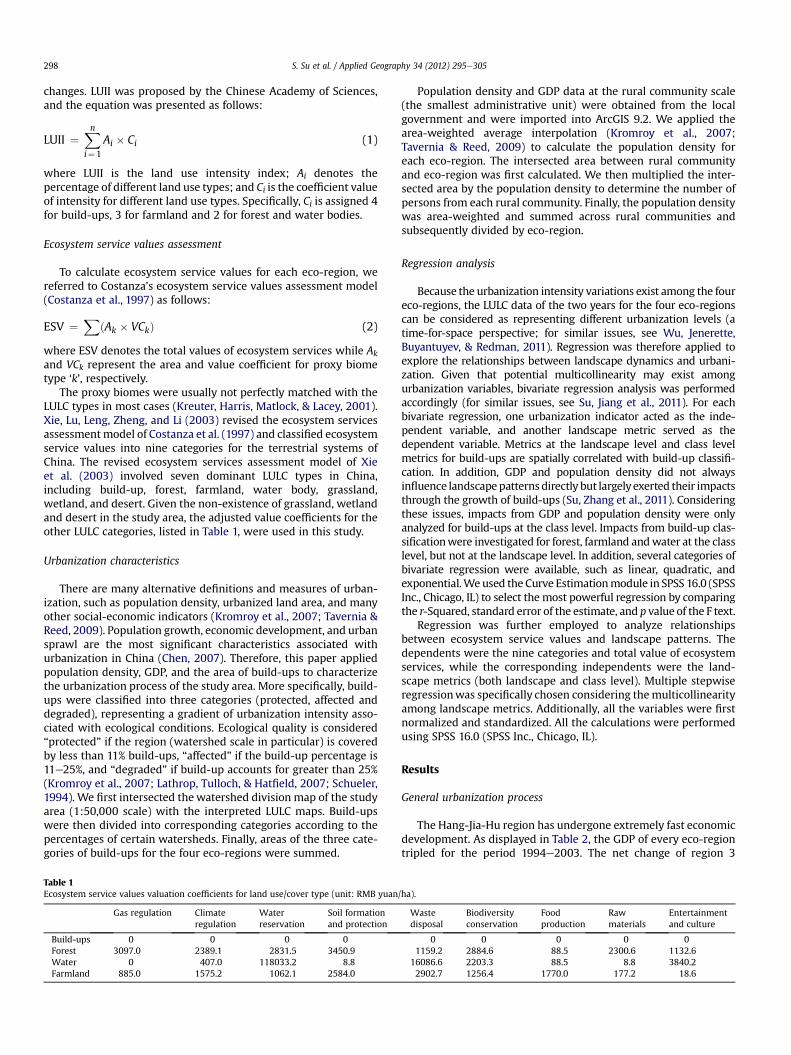
The proxy biomes were usually not perfectly matched with theLULC types in most cases (Kreuter, Harris, Matlock, & Lacey, 2001).Xie, Lu, Leng, Zheng, and Li (2003) revised the ecosystem servicesassessmentmodel of Costanza et al. (1997) and classified ecosystemservice values into nine categories for the terrestrial systems ofChina. The revised ecosystem services assessment model of Xieet al. (2003) involved seven dominant LULC types in China,including build-up, forest, farmland, water body, grassland,wetland, and desert. Given the non-existence of grassland, wetlandand desert in the study area, the adjusted value coefficients for theother LULC categories, listed in Table 1, were used in this study.
Urbanization characteristics
There are many alternative definitions and measures of urban-ization, such as population density, urbanized land area, and manyother social-economic indicators (Kromroy et al., 2007; Tavernia &Reed, 2009). Population growth, economic development, and urbansprawl are the most significant characteristics associated withurbanization in China (Chen, 2007). Therefore, this paper appliedpopulation density, GDP, and the area of build-ups to characterizethe urbanization process of the study area. More specifically, build-ups were classified into three categories (protected, affected anddegraded), representing a gradient of urbanization intensity asso-ciated with ecological conditions. Ecological quality is considered“protected” if the region (watershed scale in particular) is coveredby less than 11% build-ups, “affected” if the build-up percentage is11e25%, and “degraded” if build-up accounts for greater than 25%(Kromroy et al., 2007; Lathrop, Tulloch, & Hatfield, 2007; Schueler,1994). We first intersected the watershed division map of the studyarea (1:50,000 scale) with the interpreted LULC maps. Build-upswere then divided into corresponding categories according to thepercentages of certain watersheds. Finally, areas of the three cate-gories of build-ups for the four eco-regions were summed.
Table 1Ecosystem service values valuation coefficients for land use/cover type (unit: RMB yuan
Gas regulation Climateregulation
Waterreservation
Soil formationand protection
Build-ups 0 0 0 0Forest 3097.0 2389.1 2831.5 3450.9Water 0 407.0 118033.2 8.8Farmland 885.0 1575.2 1062.1 2584.0
Population density and GDP data at the rural community scale(the smallest administrative unit) were obtained from the localgovernment and were imported into ArcGIS 9.2. We applied thearea-weighted average interpolation (Kromroy et al., 2007;Tavernia & Reed, 2009) to calculate the population density foreach eco-region. The intersected area between rural communityand eco-region was first calculated. We then multiplied the inter-sected area by the population density to determine the number ofpersons from each rural community. Finally, the population densitywas area-weighted and summed across rural communities andsubsequently divided by eco-region.
Regression analysis
Because the urbanization intensity variations exist among the foureco-regions, the LULC data of the two years for the four eco-regionscan be considered as representing different urbanization levels (atime-for-space perspective; for similar issues, see Wu, Jenerette,Buyantuyev, & Redman, 2011). Regression was therefore applied toexplore the relationships between landscape dynamics and urbani-zation. Given that potential multicollinearity may exist amongurbanization variables, bivariate regression analysis was performedaccordingly (for similar issues, see Su, Jiang et al., 2011). For eachbivariate regression, one urbanization indicator acted as the inde-pendent variable, and another landscape metric served as thedependent variable. Metrics at the landscape level and class levelmetrics for build-ups are spatially correlated with build-up classifi-cation. In addition, GDP and population density did not alwaysinfluence landscapepatterns directly but largelyexerted their impactsthrough the growth of build-ups (Su, Zhang et al., 2011). Consideringthese issues, impacts from GDP and population density were onlyanalyzed for build-ups at the class level. Impacts from build-up clas-sificationwere investigated for forest, farmland andwater at the classlevel, but not at the landscape level. In addition, several categories ofbivariate regression were available, such as linear, quadratic, andexponential.Weused the Curve Estimationmodule in SPSS 16.0 (SPSSInc., Chicago, IL) to select the most powerful regression by comparingthe r-Squared, standard error of the estimate, and p value of the F text.
Regression was further employed to analyze relationshipsbetween ecosystem service values and landscape patterns. Thedependents were the nine categories and total value of ecosystemservices, while the corresponding independents were the land-scape metrics (both landscape and class level). Multiple stepwiseregressionwas specifically chosen considering themulticollinearityamong landscape metrics. Additionally, all the variables were firstnormalized and standardized. All the calculations were performedusing SPSS 16.0 (SPSS Inc., Chicago, IL).
Results
General urbanization process
The Hang-Jia-Hu region has undergone extremely fast economicdevelopment. As displayed in Table 2, the GDP of every eco-regiontripled for the period 1994e2003. The net change of region 3
/ha).
Wastedisposal
Biodiversityconservation
Foodproduction
Rawmaterials
Entertainmentand culture
0 0 0 0 01159.2 2884.6 88.5 2300.6 1132.6
16086.6 2203.3 88.5 8.8 3840.22902.7 1256.4 1770.0 177.2 18.6
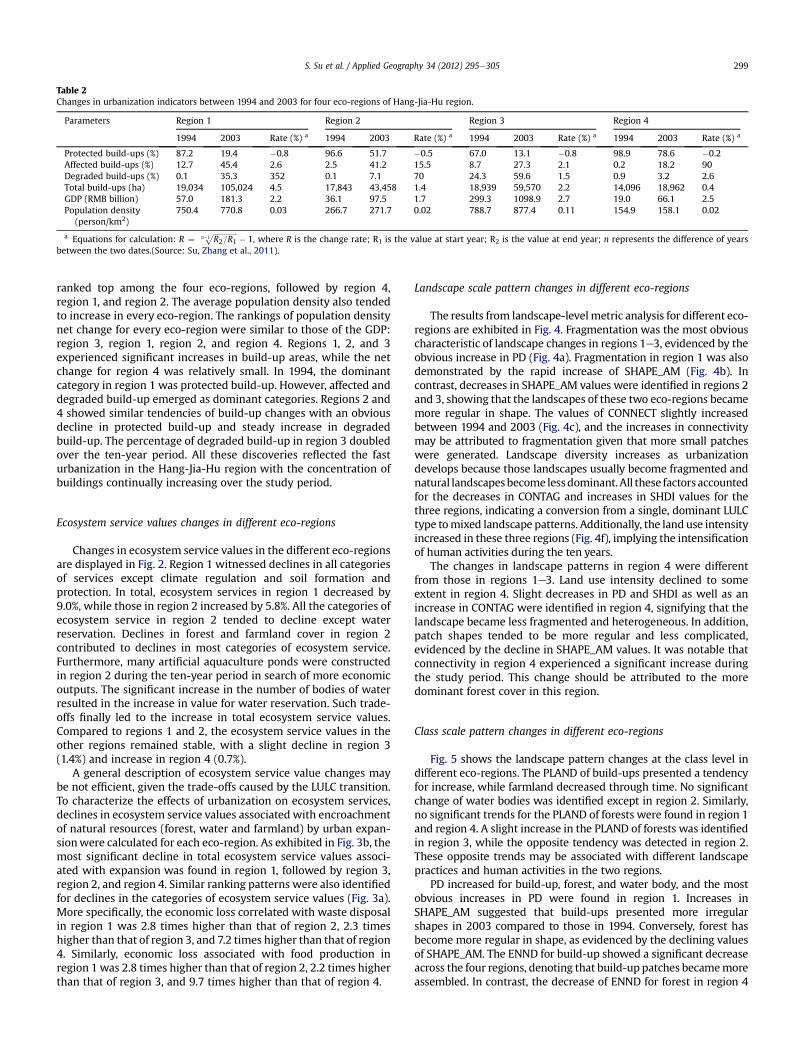
Table 2Changes in urbanization indicators between 1994 and 2003 for four eco-regions of Hang-Jia-Hu region.
Parameters Region 1 Region 2 Region 3 Region 4
1994 2003 Rate (%) a 1994 2003 Rate (%) a 1994 2003 Rate (%) a 1994 2003 Rate (%) a
Protected build-ups (%) 87.2 19.4 �0.8 96.6 51.7 �0.5 67.0 13.1 �0.8 98.9 78.6 �0.2Affected build-ups (%) 12.7 45.4 2.6 2.5 41.2 15.5 8.7 27.3 2.1 0.2 18.2 90Degraded build-ups (%) 0.1 35.3 352 0.1 7.1 70 24.3 59.6 1.5 0.9 3.2 2.6Total build-ups (ha) 19,034 105,024 4.5 17,843 43,458 1.4 18,939 59,570 2.2 14,096 18,962 0.4GDP (RMB billion) 57.0 181.3 2.2 36.1 97.5 1.7 299.3 1098.9 2.7 19.0 66.1 2.5Population density
(person/km2)750.4 770.8 0.03 266.7 271.7 0.02 788.7 877.4 0.11 154.9 158.1 0.02
a Equations for calculation: R ¼ ffiffiffiffiffiffiffiffiffiffiffiffiffiR2=R1
n�1p � 1, where R is the change rate; R1 is the value at start year; R2 is the value at end year; n represents the difference of years
between the two dates.(Source: Su, Zhang et al., 2011).
S. Su et al. / Applied Geography 34 (2012) 295e305 299
ranked top among the four eco-regions, followed by region 4,region 1, and region 2. The average population density also tendedto increase in every eco-region. The rankings of population densitynet change for every eco-region were similar to those of the GDP:region 3, region 1, region 2, and region 4. Regions 1, 2, and 3experienced significant increases in build-up areas, while the netchange for region 4 was relatively small. In 1994, the dominantcategory in region 1 was protected build-up. However, affected anddegraded build-up emerged as dominant categories. Regions 2 and4 showed similar tendencies of build-up changes with an obviousdecline in protected build-up and steady increase in degradedbuild-up. The percentage of degraded build-up in region 3 doubledover the ten-year period. All these discoveries reflected the fasturbanization in the Hang-Jia-Hu region with the concentration ofbuildings continually increasing over the study period.
Ecosystem service values changes in different eco-regions
Changes in ecosystem service values in the different eco-regionsare displayed in Fig. 2. Region 1 witnessed declines in all categoriesof services except climate regulation and soil formation andprotection. In total, ecosystem services in region 1 decreased by9.0%, while those in region 2 increased by 5.8%. All the categories ofecosystem service in region 2 tended to decline except waterreservation. Declines in forest and farmland cover in region 2contributed to declines in most categories of ecosystem service.Furthermore, many artificial aquaculture ponds were constructedin region 2 during the ten-year period in search of more economicoutputs. The significant increase in the number of bodies of waterresulted in the increase in value for water reservation. Such trade-offs finally led to the increase in total ecosystem service values.Compared to regions 1 and 2, the ecosystem service values in theother regions remained stable, with a slight decline in region 3(1.4%) and increase in region 4 (0.7%).
A general description of ecosystem service value changes maybe not efficient, given the trade-offs caused by the LULC transition.To characterize the effects of urbanization on ecosystem services,declines in ecosystem service values associated with encroachmentof natural resources (forest, water and farmland) by urban expan-sionwere calculated for each eco-region. As exhibited in Fig. 3b, themost significant decline in total ecosystem service values associ-ated with expansion was found in region 1, followed by region 3,region 2, and region 4. Similar ranking patterns were also identifiedfor declines in the categories of ecosystem service values (Fig. 3a).More specifically, the economic loss correlated with waste disposalin region 1 was 2.8 times higher than that of region 2, 2.3 timeshigher than that of region 3, and 7.2 times higher than that of region4. Similarly, economic loss associated with food production inregion 1 was 2.8 times higher than that of region 2, 2.2 times higherthan that of region 3, and 9.7 times higher than that of region 4.
Landscape scale pattern changes in different eco-regions
The results from landscape-levelmetric analysis for different eco-regions are exhibited in Fig. 4. Fragmentation was the most obviouscharacteristic of landscape changes in regions 1e3, evidenced by theobvious increase in PD (Fig. 4a). Fragmentation in region 1 was alsodemonstrated by the rapid increase of SHAPE_AM (Fig. 4b). Incontrast, decreases in SHAPE_AM values were identified in regions 2and 3, showing that the landscapes of these two eco-regions becamemore regular in shape. The values of CONNECT slightly increasedbetween 1994 and 2003 (Fig. 4c), and the increases in connectivitymay be attributed to fragmentation given that more small patcheswere generated. Landscape diversity increases as urbanizationdevelops because those landscapes usually become fragmented andnatural landscapesbecome lessdominant.All these factorsaccountedfor the decreases in CONTAG and increases in SHDI values for thethree regions, indicating a conversion from a single, dominant LULCtype tomixed landscape patterns. Additionally, the land use intensityincreased in these three regions (Fig. 4f), implying the intensificationof human activities during the ten years.
The changes in landscape patterns in region 4 were differentfrom those in regions 1e3. Land use intensity declined to someextent in region 4. Slight decreases in PD and SHDI as well as anincrease in CONTAG were identified in region 4, signifying that thelandscape became less fragmented and heterogeneous. In addition,patch shapes tended to be more regular and less complicated,evidenced by the decline in SHAPE_AM values. It was notable thatconnectivity in region 4 experienced a significant increase duringthe study period. This change should be attributed to the moredominant forest cover in this region.
Class scale pattern changes in different eco-regions
Fig. 5 shows the landscape pattern changes at the class level indifferent eco-regions. The PLAND of build-ups presented a tendencyfor increase, while farmland decreased through time. No significantchange of water bodies was identified except in region 2. Similarly,no significant trends for the PLAND of forests were found in region 1and region 4. A slight increase in the PLAND of forests was identifiedin region 3, while the opposite tendency was detected in region 2.These opposite trends may be associated with different landscapepractices and human activities in the two regions.
PD increased for build-up, forest, and water body, and the mostobvious increases in PD were found in region 1. Increases inSHAPE_AM suggested that build-ups presented more irregularshapes in 2003 compared to those in 1994. Conversely, forest hasbecome more regular in shape, as evidenced by the declining valuesof SHAPE_AM. The ENND for build-up showed a significant decreaseacross the four regions, denoting that build-up patches becamemoreassembled. In contrast, the decrease of ENND for forest in region 4
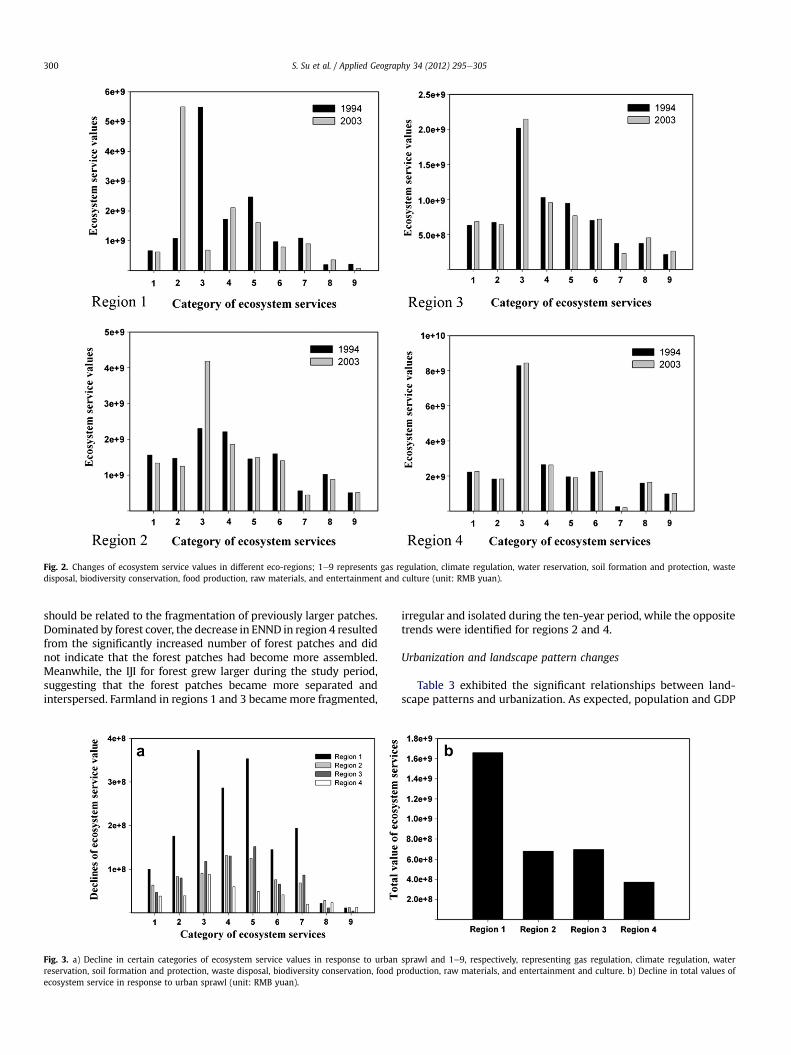
Fig. 2. Changes of ecosystem service values in different eco-regions; 1e9 represents gas regulation, climate regulation, water reservation, soil formation and protection, wastedisposal, biodiversity conservation, food production, raw materials, and entertainment and culture (unit: RMB yuan).
S. Su et al. / Applied Geography 34 (2012) 295e305300
should be related to the fragmentation of previously larger patches.Dominated by forest cover, the decrease in ENND in region 4 resultedfrom the significantly increased number of forest patches and didnot indicate that the forest patches had become more assembled.Meanwhile, the IJI for forest grew larger during the study period,suggesting that the forest patches became more separated andinterspersed. Farmland in regions 1 and 3 becamemore fragmented,
Fig. 3. a) Decline in certain categories of ecosystem service values in response to urbanreservation, soil formation and protection, waste disposal, biodiversity conservation, food pecosystem service in response to urban sprawl (unit: RMB yuan).
irregular and isolated during the ten-year period, while the oppositetrends were identified for regions 2 and 4.
Urbanization and landscape pattern changes
Table 3 exhibited the significant relationships between land-scape patterns and urbanization. As expected, population and GDP
sprawl and 1e9, respectively, representing gas regulation, climate regulation, waterroduction, raw materials, and entertainment and culture. b) Decline in total values of

Fig. 4. Landscape pattern changes in the four eco-regions of Hang-Jia-Hu region between 1994 and 2003.
S. Su et al. / Applied Geography 34 (2012) 295e305 301
exerted significant impacts on the landscape characteristics ofbuild-ups. PD for water body was negatively associated with thepercentage of protected build-ups and positively correlated withthe percentage of degraded build-ups and the total area of build-ups. SHAPE_AM for farmland associated with the total area ofbuild-ups positively. A positive exponential correlation betweenIJI_farmland and the percentage of affected build-up was alsoidentified. All these positive correlations demonstrate the impactsof urbanization on farmland.
Relationship between ecosystem service values and landscapepatterns
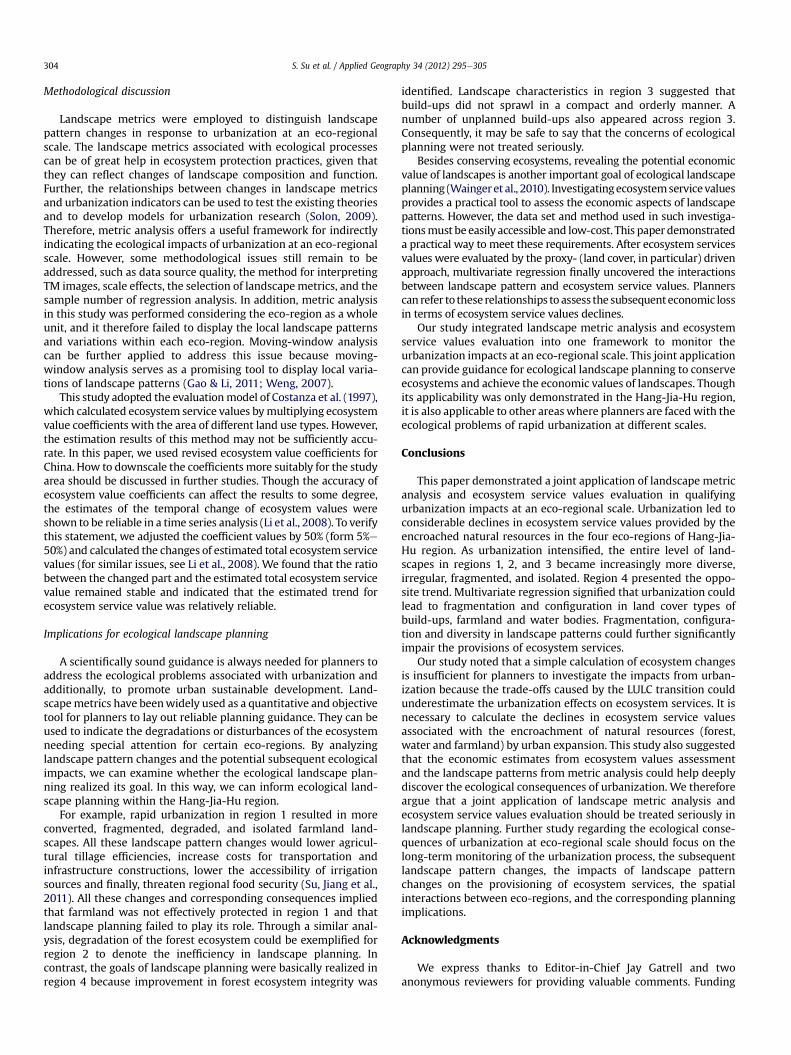
As shown in Table 4, the categories of ecosystem servicecorrelated significantly with landscape metrics, except waterreservation and soil formation and protection. Landscape-levelmetrics, such as SHDI and PD, acted as predictors for two categoriesof ecosystem services: waste disposal and biodiversity conserva-tion. Other categories and total values of ecosystem services wereprimarily explained by class level metrics. Specifically, the land-scape characteristics of forest and farmland accounted for mostcategories of ecosystem services. Entertainment and culture wasthe only category of ecosystem services that correlated to thelandscape characteristics of water body (SHAPE_AM_Water).
Discussion
Landscape pattern changes in response to urbanization at an eco-regional scale
Urbanization could lead to the increasing configuration of urbanland (Wu et al., 2011). Our results signified that this statement alsoholds up at an eco-regional scale because more irregularly shapedurban landscapes could be expected as urbanization intensified at aneco-regional scale, given the positive correlation betweenSHAPE_AM_Build-up and GDP (Table 3). Residents preferred to buildtheir houses in flat areas and near human settlements to limit thenumber of barriers to movement across landscapes (Su, Li, Zhanget al., 2011). Such a specific preference contributed to the
increased ENN_Build-up associated with GDP (Table 3). Thoughincreased build-ups were spatially near each another, at the sametime, they were interspersed in a disorderly manner among otherLULC patches (Solon, 2009). In particular, agricultural lands alwaysbecame the first victims of settlement sprawl (Su, Zhang et al., 2011).The scattered and irregular patterns of build-ups would definitelyresult in the transformation of agricultural landscapes. Our resultswere consistent with previous studies (Pôças et al., 2011; Su, Jianget al., 2011; Su, Xiao et al., 2011), and the configuration of farmlanddue to settlement sprawl was identified at an eco-regional scale, asdemonstrated by Equations (12) and (13) in Table 3. Water bodieswere also occupied by urban expansion (Du, Ottens, & Sliuzas, 2010).However, the changes of water body patches under urbanizationwere mainly associated with increases in the number of artificialponds instead of the encroachment by settlement sprawl in thestudy area. A number of aquaculture ponds were constructed insearch of high profit, leading to increased PD and reduced ENND forwater body patches when urbanization intensified (Table 3).
Ecosystem service values changes associated with urbanization atan eco-regional scale
A general description of ecosystem service values changesmainly relied on the transitions among different LULC types(Kreuter et al., 2001). Our results showed that ecosystem servicesvalues may not decline with urbanization in some cases, given thatthe water bodies and forest that provided higher values ofecosystem services may become more dominant. This does notmean that urbanization promotes ecosystem services delivery butthat the trade-offs associated with LULC transitions may potentiallycover the negative impacts. Therefore, a simple calculation ofecosystem changes is insufficient for planners to investigate theimpacts from urbanization. This study instead provided a relativelyrobust approach to qualifying such impacts, where declines inecosystem service values associated with the encroachment ofnatural resources (forest, water and farmland) by urban expansionwere calculated. The results showed that urban expansion led toconsiderable declines in ecosystem service values provided by theencroached natural resources.
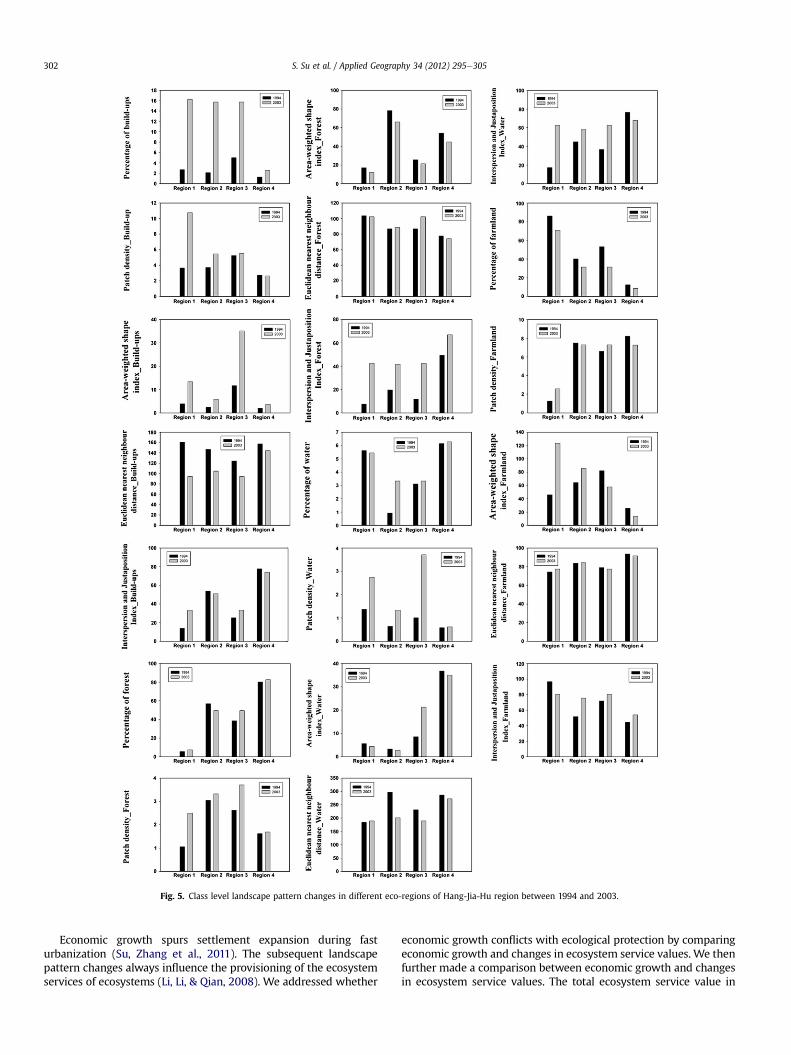
Fig. 5. Class level landscape pattern changes in different eco-regions of Hang-Jia-Hu region between 1994 and 2003.
S. Su et al. / Applied Geography 34 (2012) 295e305302
Economic growth spurs settlement expansion during fasturbanization (Su, Zhang et al., 2011). The subsequent landscapepattern changes always influence the provisioning of the ecosystemservices of ecosystems (Li, Li, & Qian, 2008). We addressed whether
economic growth conflicts with ecological protection by comparingeconomic growth and changes in ecosystem service values. We thenfurther made a comparison between economic growth and changesin ecosystem service values. The total ecosystem service value in
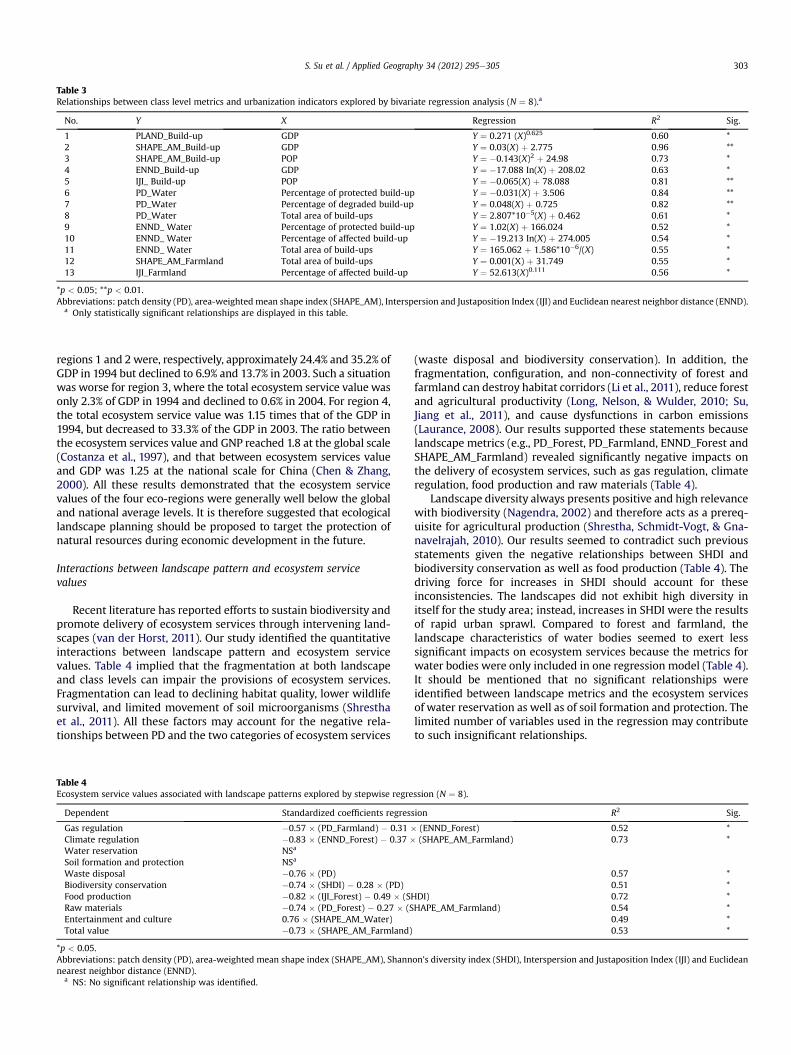
Table 3Relationships between class level metrics and urbanization indicators explored by bivariate regression analysis (N ¼ 8).a
No. Y X Regression R2 Sig.
1 PLAND_Build-up GDP Y ¼ 0.271 (X)0.625 0.60 *2 SHAPE_AM_Build-up GDP Y ¼ 0.03(X) þ 2.775 0.96 **3 SHAPE_AM_Build-up POP Y ¼ �0.143(X)2 þ 24.98 0.73 *4 ENND_Build-up GDP Y ¼ �17.088 In(X) þ 208.02 0.63 *5 IJI_ Build-up POP Y ¼ �0.065(X) þ 78.088 0.81 **6 PD_Water Percentage of protected build-up Y ¼ �0.031(X) þ 3.506 0.84 **7 PD_Water Percentage of degraded build-up Y ¼ 0.048(X) þ 0.725 0.82 **8 PD_Water Total area of build-ups Y ¼ 2.807*10�5(X) þ 0.462 0.61 *9 ENND_ Water Percentage of protected build-up Y ¼ 1.02(X) þ 166.024 0.52 *10 ENND_ Water Percentage of affected build-up Y ¼ �19.213 In(X) þ 274.005 0.54 *11 ENND_ Water Total area of build-ups Y ¼ 165.062 þ 1.586*10�6/(X) 0.55 *12 SHAPE_AM_Farmland Total area of build-ups Y ¼ 0.001(X) þ 31.749 0.55 *13 IJI_Farmland Percentage of affected build-up Y ¼ 52.613(X)0.111 0.56 *
*p < 0.05; **p < 0.01.Abbreviations: patch density (PD), area-weighted mean shape index (SHAPE_AM), Interspersion and Justaposition Index (IJI) and Euclidean nearest neighbor distance (ENND).
a Only statistically significant relationships are displayed in this table.
S. Su et al. / Applied Geography 34 (2012) 295e305 303
regions 1 and 2 were, respectively, approximately 24.4% and 35.2% ofGDP in 1994 but declined to 6.9% and 13.7% in 2003. Such a situationwas worse for region 3, where the total ecosystem service value wasonly 2.3% of GDP in 1994 and declined to 0.6% in 2004. For region 4,the total ecosystem service value was 1.15 times that of the GDP in1994, but decreased to 33.3% of the GDP in 2003. The ratio betweenthe ecosystem services value and GNP reached 1.8 at the global scale(Costanza et al., 1997), and that between ecosystem services valueand GDP was 1.25 at the national scale for China (Chen & Zhang,2000). All these results demonstrated that the ecosystem servicevalues of the four eco-regions were generally well below the globaland national average levels. It is therefore suggested that ecologicallandscape planning should be proposed to target the protection ofnatural resources during economic development in the future.
Interactions between landscape pattern and ecosystem servicevalues
Recent literature has reported efforts to sustain biodiversity andpromote delivery of ecosystem services through intervening land-scapes (van der Horst, 2011). Our study identified the quantitativeinteractions between landscape pattern and ecosystem servicevalues. Table 4 implied that the fragmentation at both landscapeand class levels can impair the provisions of ecosystem services.Fragmentation can lead to declining habitat quality, lower wildlifesurvival, and limited movement of soil microorganisms (Shresthaet al., 2011). All these factors may account for the negative rela-tionships between PD and the two categories of ecosystem services
Table 4Ecosystem service values associated with landscape patterns explored by stepwise regre
Dependent Standardized coefficients regress
Gas regulation �0.57 � (PD_Farmland) � 0.31 �Climate regulation �0.83 � (ENND_Forest) � 0.37 �Water reservation NSa
Soil formation and protection NSa
Waste disposal �0.76 � (PD)Biodiversity conservation �0.74 � (SHDI) � 0.28 � (PD)Food production �0.82 � (IJI_Forest) � 0.49 � (SHRaw materials �0.74 � (PD_Forest) � 0.27 � (SEntertainment and culture 0.76 � (SHAPE_AM_Water)Total value �0.73 � (SHAPE_AM_Farmland)
*p < 0.05.Abbreviations: patch density (PD), area-weighted mean shape index (SHAPE_AM), Shannnearest neighbor distance (ENND).
a NS: No significant relationship was identified.
(waste disposal and biodiversity conservation). In addition, thefragmentation, configuration, and non-connectivity of forest andfarmland can destroy habitat corridors (Li et al., 2011), reduce forestand agricultural productivity (Long, Nelson, & Wulder, 2010; Su,Jiang et al., 2011), and cause dysfunctions in carbon emissions(Laurance, 2008). Our results supported these statements becauselandscape metrics (e.g., PD_Forest, PD_Farmland, ENND_Forest andSHAPE_AM_Farmland) revealed significantly negative impacts onthe delivery of ecosystem services, such as gas regulation, climateregulation, food production and raw materials (Table 4).
Landscape diversity always presents positive and high relevancewith biodiversity (Nagendra, 2002) and therefore acts as a prereq-uisite for agricultural production (Shrestha, Schmidt-Vogt, & Gna-navelrajah, 2010). Our results seemed to contradict such previousstatements given the negative relationships between SHDI andbiodiversity conservation as well as food production (Table 4). Thedriving force for increases in SHDI should account for theseinconsistencies. The landscapes did not exhibit high diversity initself for the study area; instead, increases in SHDI were the resultsof rapid urban sprawl. Compared to forest and farmland, thelandscape characteristics of water bodies seemed to exert lesssignificant impacts on ecosystem services because the metrics forwater bodies were only included in one regression model (Table 4).It should be mentioned that no significant relationships wereidentified between landscape metrics and the ecosystem servicesof water reservation as well as of soil formation and protection. Thelimited number of variables used in the regression may contributeto such insignificant relationships.
ssion (N ¼ 8).
ion R2 Sig.
(ENND_Forest) 0.52 *(SHAPE_AM_Farmland) 0.73 *
0.57 *0.51 *
DI) 0.72 *HAPE_AM_Farmland) 0.54 *
0.49 *0.53 *
on’s diversity index (SHDI), Interspersion and Justaposition Index (IJI) and Euclidean
S. Su et al. / Applied Geography 34 (2012) 295e305304
Methodological discussion
Landscape metrics were employed to distinguish landscapepattern changes in response to urbanization at an eco-regionalscale. The landscape metrics associated with ecological processescan be of great help in ecosystem protection practices, given thatthey can reflect changes of landscape composition and function.Further, the relationships between changes in landscape metricsand urbanization indicators can be used to test the existing theoriesand to develop models for urbanization research (Solon, 2009).Therefore, metric analysis offers a useful framework for indirectlyindicating the ecological impacts of urbanization at an eco-regionalscale. However, some methodological issues still remain to beaddressed, such as data source quality, the method for interpretingTM images, scale effects, the selection of landscapemetrics, and thesample number of regression analysis. In addition, metric analysisin this study was performed considering the eco-region as a wholeunit, and it therefore failed to display the local landscape patternsand variations within each eco-region. Moving-window analysiscan be further applied to address this issue because moving-window analysis serves as a promising tool to display local varia-tions of landscape patterns (Gao & Li, 2011; Weng, 2007).
This study adopted the evaluationmodel of Costanza et al. (1997),which calculated ecosystem service values bymultiplying ecosystemvalue coefficients with the area of different land use types. However,the estimation results of this method may not be sufficiently accu-rate. In this paper, we used revised ecosystem value coefficients forChina. How to downscale the coefficients more suitably for the studyarea should be discussed in further studies. Though the accuracy ofecosystem value coefficients can affect the results to some degree,the estimates of the temporal change of ecosystem values wereshown to be reliable in a time series analysis (Li et al., 2008). To verifythis statement, we adjusted the coefficient values by 50% (form 5%e50%) and calculated the changes of estimated total ecosystem servicevalues (for similar issues, see Li et al., 2008). We found that the ratiobetween the changed part and the estimated total ecosystem servicevalue remained stable and indicated that the estimated trend forecosystem service value was relatively reliable.
Implications for ecological landscape planning
A scientifically sound guidance is always needed for planners toaddress the ecological problems associated with urbanization andadditionally, to promote urban sustainable development. Land-scapemetrics have beenwidely used as a quantitative and objectivetool for planners to lay out reliable planning guidance. They can beused to indicate the degradations or disturbances of the ecosystemneeding special attention for certain eco-regions. By analyzinglandscape pattern changes and the potential subsequent ecologicalimpacts, we can examine whether the ecological landscape plan-ning realized its goal. In this way, we can inform ecological land-scape planning within the Hang-Jia-Hu region.
For example, rapid urbanization in region 1 resulted in moreconverted, fragmented, degraded, and isolated farmland land-scapes. All these landscape pattern changes would lower agricul-tural tillage efficiencies, increase costs for transportation andinfrastructure constructions, lower the accessibility of irrigationsources and finally, threaten regional food security (Su, Jiang et al.,2011). All these changes and corresponding consequences impliedthat farmland was not effectively protected in region 1 and thatlandscape planning failed to play its role. Through a similar anal-ysis, degradation of the forest ecosystem could be exemplified forregion 2 to denote the inefficiency in landscape planning. Incontrast, the goals of landscape planning were basically realized inregion 4 because improvement in forest ecosystem integrity was
identified. Landscape characteristics in region 3 suggested thatbuild-ups did not sprawl in a compact and orderly manner. Anumber of unplanned build-ups also appeared across region 3.Consequently, it may be safe to say that the concerns of ecologicalplanning were not treated seriously.
Besides conserving ecosystems, revealing the potential economicvalue of landscapes is another important goal of ecological landscapeplanning (Waingeret al., 2010). Investigatingecosystemservicevaluesprovides a practical tool to assess the economic aspects of landscapepatterns. However, the data set and method used in such investiga-tionsmust be easily accessible and low-cost. This paper demonstrateda practical way to meet these requirements. After ecosystem servicesvalues were evaluated by the proxy- (land cover, in particular) drivenapproach, multivariate regression finally uncovered the interactionsbetween landscape pattern and ecosystem service values. Plannerscan refer to these relationships to assess the subsequenteconomic lossin terms of ecosystem service values declines.
Our study integrated landscape metric analysis and ecosystemservice values evaluation into one framework to monitor theurbanization impacts at an eco-regional scale. This joint applicationcan provide guidance for ecological landscape planning to conserveecosystems and achieve the economic values of landscapes. Thoughits applicability was only demonstrated in the Hang-Jia-Hu region,it is also applicable to other areaswhere planners are facedwith theecological problems of rapid urbanization at different scales.
Conclusions
This paper demonstrated a joint application of landscape metricanalysis and ecosystem service values evaluation in qualifyingurbanization impacts at an eco-regional scale. Urbanization led toconsiderable declines in ecosystem service values provided by theencroached natural resources in the four eco-regions of Hang-Jia-Hu region. As urbanization intensified, the entire level of land-scapes in regions 1, 2, and 3 became increasingly more diverse,irregular, fragmented, and isolated. Region 4 presented the oppo-site trend. Multivariate regression signified that urbanization couldlead to fragmentation and configuration in land cover types ofbuild-ups, farmland and water bodies. Fragmentation, configura-tion and diversity in landscape patterns could further significantlyimpair the provisions of ecosystem services.
Our study noted that a simple calculation of ecosystem changesis insufficient for planners to investigate the impacts from urban-ization because the trade-offs caused by the LULC transition couldunderestimate the urbanization effects on ecosystem services. It isnecessary to calculate the declines in ecosystem service valuesassociated with the encroachment of natural resources (forest,water and farmland) by urban expansion. This study also suggestedthat the economic estimates from ecosystem values assessmentand the landscape patterns from metric analysis could help deeplydiscover the ecological consequences of urbanization. We thereforeargue that a joint application of landscape metric analysis andecosystem service values evaluation should be treated seriously inlandscape planning. Further study regarding the ecological conse-quences of urbanization at eco-regional scale should focus on thelong-term monitoring of the urbanization process, the subsequentlandscape pattern changes, the impacts of landscape patternchanges on the provisioning of ecosystem services, the spatialinteractions between eco-regions, and the corresponding planningimplications.
Acknowledgments
We express thanks to Editor-in-Chief Jay Gatrell and twoanonymous reviewers for providing valuable comments. Funding
S. Su et al. / Applied Geography 34 (2012) 295e305 305
for this research was partially provided by the National NaturalScience Foundation (No. 41001202) and State Scholarship Fund (No.2011632110).
References
Avelar, S., Zah, R., & Tavares-Corrêa, C. (2009). Linking socioeconomic classes andland cover data in Lima, Peru: assessment through the application of remotesensing and GIS. International Journal of Applied Earth Observation and Geo-information, 11, 27e37.
Banko, G., Wrbka, T., Schmitzberger, I., & Zethner, G. (2003). Landscape types as theoptimal spatial domain for developing landscape indicators. Paris: Organizationfor Economic Co-operation and Development (OECD).
Burchell, R. W., Lowenstein, G., Dolphin, W. R., Galley, C. C., Downs, A., Seskin, S.,et al. (2000). The benefits of sprawl, Chapter 12A in the costs of sprawleRevisited.Washington, D.C.: Transportation Research Board and National ResearchCouncil.
Campos, M., Velázquez, A., Verdinelli, G. B., Skutsch, M., Juncà, M. B., & Priego-Santander, A. G. (2011). An interdisciplinary approach to depict landscapechange drivers: a case study of the Ticuiz agrarian community in Michoacan,Mexico. Applied Geography, 32, 409e419.
Chen, J. (2007). Rapid urbanization in China: a real challenge to soil protection andfood security. Catena, 69, 1e15.
Chen, Z., & Zhang, X. (2000). Value of ecosystem services in China. Chinese ScienceBulletin, 45, 870e876.
Costanza, R., d’Arge, R., de Groot, R., Farber, S., Grasso,M., Hannon, B., et al. (1997). Thevalue of theworld’s ecosystem services andnatural capital.Nature, 387, 253e260.
Du, N., Ottens, H., & Sliuzas, R. (2010). Spatial impact of urban expansion on surfacewater bodiesea case study of Wuhan, China. Landscape and Urban Planning, 94,175e185.
Galván, C., Juanes, J. A., & Puente, A. (2010). Ecological classification of Europeantransitional waters in the North-East Atlantic eco-region. Estuarine, Coastal andShelf Science, 87, 442e450.
Gao, J., & Li, S. (2011). Detecting spatially non-stationary and scale-dependentrelationships between urban landscape fragmentation and related factorsusing geographically weighted regression. Applied Geography, 31, 292e302.
Geri, F., Amici, V., & Rocchini, D. (2010). Human activity impact on the heterogeneityof a Mediterranean landscape. Applied Geography, 30, 370e379.
de Groot, R. S., Alkemade, R., Braat, L., Hein, L., & Willemen, L. (2010). Challenges inintegrating the concept of ecosystem services and values in landscape planning,management and decision making. Ecological Complexity, 7, 260e272.
van der Horst, D. (2011). Adoption of payments for ecosystem services: an appli-cation of the Hägerstrand model. Applied Geography, 31, 668e676.
Kozak, J., Lant, C., Shaikh, S., & Wang, G. (2011). The geography of ecosystem servicevalue: the case of the Des Plaines and Cache River wetlands, Illinois. AppliedGeography, 31, 303e311.
Kreuter, U. P., Harris, H. G., Matlock, M. D., & Lacey, R. E. (2001). Change in ecosystemservice values in the San Antonio area, Texas. Ecological Economics, 39, 333e346.
Kromroy, K., Ward, K., Castillo, P., & Juzwik, J. (2007). Relationships betweenurbanization and the oak resource of the Minneapolis/St. Paul Metropolitanarea from 1991 to 1998. Landscape and Urban Planning, 80, 375e385.
Lathrop, R. G., Tulloch, D. L., & Hatfield, C. (2007). Consequences of land use changein the New YorkeNew Jersey Highlands, USA: landscape indicators of forest andwatershed integrity. Landscape and Urban Planning, 79, 150e159.
Laurance,W. F. (2008). Theorymeets reality: howhabitat fragmentation research hastranscended island biogeographic theory. Biological Conservation,141,1731e1744.
Leitão, A. B., & Ahern, J. (2002). Applying landscape ecological concepts and metricsin sustainable landscape planning. Landscape and Urban Planning, 59, 65e93.
Li, T., Li, W., & Qian, Z. (2008). Variations in ecosystem service value in response toland use changes in Shenzhen. Ecological Economics, 69, 1427e1435.
Li, M., Zhu, Z., Vogelmann, J. E., Xu, D., Wen, W., & Liu, A. (2011). Characterizingfragmentation of the collective forests in southern China from multitemporalLandsat imagery: a case study from Kecheng district of Zhejiang province.Applied Geography, 31, 1026e1035.
Long, J. A., Nelson, T. A., &Wulder, M. A. (2010). Characterizing forest fragmentation:distinguishing change in composition from configuration. Applied Geography,30, 426e435.
McGarigal, K., Cushman, S. A., Neel, M. C., & Ene, E. (2002). FRAGSTATS: Spatialpattern analysis program for categorical maps. http://www.umass.edu/landeco/research/fragstats/fragstats.html.
Matteucci, S. D., & Morello, J. (2009). Environmental consequences of exurbanexpansion in an agricultural area: the case of the Argentinian Pampas ecor-egion. Urban Ecosystems, 12, 287e310.
Millennium Ecosystem Assessment. (2003). Ecosystems and human well-Being:Current state and trends. Washington, DC: Island Press.
Nagendra, H. (2002). Opposite trends in response for the Shannon and Simpsonindices of landscape diversity. Applied Geography, 22, 175e186.
Ng, C., Xie, Y., & Yu, X. (2011). Measuring the spatio-temporal variation of habitatisolation due to rapid urbanization: a case study of the Shenzhen River cross-boundary catchment, China. Landscape and Urban Planning, 103, 44e54.
Pôças, I., Cunha, M., & Pereira, L. S. (2011). Remote sensing based indicators ofchanges in a mountain rural landscape of Northeast Portugal. Applied Geog-raphy, 31, 871e880.
Ren, Y., Wei, X., Wei, X., Pan, J., Xie, P., Song, X., et al. (2011). Relationship betweenvegetation carbon storage and urbanization: a case study of Xiamen, China.Forest Ecology and Management, 261, 1214e1223.
Ribeiro, S. C., & Lovett, A. (2009). Associations between forest characteristics andsocio-economic development: a case study from Portugal. Journal of Environ-mental Management, 90, 2873e2881.
Schueler, T. R. (1994). The importance of imperviousness. Protection Technology, 1,100e111.
Schulz, J. J., Cayuela, L., Echeverria, C., Salas, J., & Benayas, J. M. R. (2010). Monitoringland cover change of the dryland forest landscape of Central Chile (1975e2008).Applied Geography, 30, 436e447.
Sherrouse, B. C., Clement, J. M., & Semmens, D. J. (2011). A GIS application forassessing, mapping, and quantifying the social values of ecosystem services.Applied Geography, 31, 748e760.
Shrestha, R. P., Schmidt-Vogt, D., & Gnanavelrajah, N. (2010). Relating plant diversityto biomass and soil erosion in a cultivated landscape of the eastern seaboardregion of Thailand. Applied Geography, 30, 606e617.
Shrestha, M. K., York, A. M., Boone, C. G., & Zhang, S. (2011). Land fragmentation dueto rapid urbanization in the Phoenix Metropolitan Area: analyzing the spatio-temporal patterns and drivers. Applied Geography, 32, 522e531.
Solon, J. (2009). Spatial context of urbanization: landscape pattern and changesbetween 1950 and 1990 in the Warsaw metropolitan area, Poland. Landscapeand Urban Planning, 93, 250e261.
Su, S., Jiang, Z., Zhang, Q., & Zhang, Y. (2011). Transformation of agricultural land-scapes under rapid urbanization: a threat to sustainability in Hang-Jia-Huregion, China. Applied Geography, 31, 439e449.
Su, S., Li, D., Yu, X., Zhang, Z., Zhang, Q., Xiao, R., et al. (2011). Assessing landecological security in Shanghai (China) based on catastrophe theory. StochasticEnvironmental Research and Risk Assessment, 25, 737e746.
Su, S., Li, D., Zhang, Q., Xiao, R., Huang, F., & Wu, J. (2011). Temporal trend and sourceapportionment of water pollution in different functional zones of QiantangRiver, China. Water Research, 45, 1781e1795.
Su, S., Xiao, R., & Zhang, Y. (2011). Multi-scale analysis of spatially varying rela-tionships between agricultural landscape patterns and urbanization usinggeographically weighted regression. Applied Geography, 32, 360e375.
Su, S., Zhang, Q., Zhang, Z., Zhi, J., & Wu, J. (2011). Rural settlement expansion andpaddy soil loss across an ex-urbanizing watershed in eastern coastal Chinaduring market transition. Regional Environmental Change, 11, 651e662.
Su, S., Zhi, J., Lou, L., Huang, F., Chen, X., & Wu, J. (2011). Spatio-temporal patternsand source apportionment of pollution in Qiantang River (China) using neural-based modeling and multivariate statistical techniques. Physics and Chemistry ofthe Earth, 36, 379e386.
Tavernia, B. G., & Reed, J. M. (2009). Spatial extent and habitat context influence thenature and strength of relationships between urbanization measures. Landscapeand Urban Planning, 92, 47e52.
Tu, J. (2011). Spatially varying relationships between land use and water qualityacross an urbanization gradient explored by geographically weighted regres-sion. Applied Geography, 31, 376e392.
Turner, M. G., Gardner, R. H., & O’Neill, R. V. (2001). Landscape Ecology in theory andpractice. New York: Springer-Verlag.
Vitousek, P. M., Mooney, H. A., Lubchenco, J., & Melillo, J. M. (1997). Humandomination of Earth’s ecosystems. Science, 277, 494e499.
Wainger, L. A., King, D. M., Mack, R. N., Price, E. W., & Maslin, T. (2010). Can theconcept of ecosystem services be practically applied to improve naturalresource management decisions? Ecological Economics, 69, 978e987.
Weng, Y. (2007). Spatiotemporal changes of landscape pattern in response tourbanization. Landscape and Urban Planning, 81, 341e353.
Wu, J., Jenerette, G. D., Buyantuyev, A., & Redman, C. L. (2011). Quantifyingspatiotemporal patterns of urbanization: the case of the two fastest growingmetropolitan regions in the United States. Ecological Complexity, 8, 1e8.
Xie, G., Lu, C., Leng, Y., Zheng, D., & Li, S. (2003). Ecological assets valuation of theTibetan Plateau. Journal of Natural Resources, 18, 189e196, in Chinese withEnglish abstract.
Yáñez-Arancibia, A., & Day, J. W. (2004). Environmental sub-regions in the Gulf ofMexico coastal zone: the ecosystem approach as an integrated managementtool. Ocean & Coastal Management, 47, 727e757.
Yu, J., Shao, W., Yu, H., Yu, J., & Hu, Z. (2006). A case study of ecological regionali-zation for Zhejiang Province. Environmental Pollution Control, 28, 620e623, inChinese with English abstract.
Related Documents