This article was downloaded by: [Universita Degli Studi di Firenze], [Davide Travaglini] On: 05 April 2012, At: 02:31 Publisher: Taylor & Francis Informa Ltd Registered in England and Wales Registered Number: 1072954 Registered office: Mortimer House, 37-41 Mortimer Street, London W1T 3JH, UK Plant Biosystems - An International Journal Dealing with all Aspects of Plant Biology: Official Journal of the Societa Botanica Italiana Publication details, including instructions for authors and subscription information: http://www.tandfonline.com/loi/tplb20 Characterization, structure and genetic dating of an old-growth beech-fir forest in the northern Apennines (Italy) D. Travaglini a , D. Paffetti a , L. Bianchi a , A. Bottacci b , F. Bottalico a , G. Giovannini a , A. Maltoni a , S. Nocentini a , C. Vettori c & G. Calamini a a Dipartimento di Economia, Ingegneria, Scienze e Tecnologie Agrarie e Forestali, University of Florence, Via San Bonaventura, 13, 50145, Florence, Italy b Corpo Forestale dello Stato, Ufficio Territoriale per la Biodiversità di Pratovecchio, Via Dante Alighieri, 41, 52015 Pratovecchio, Arezzo, Italy c Istituto di Genetica Vegetale, Consiglio Nazionale delle Ricerche, Via Madonna del Piano, 10, 50019, Sesto Fiorentino, Florence, Italy Available online: 03 Jan 2012 To cite this article: D. Travaglini, D. Paffetti, L. Bianchi, A. Bottacci, F. Bottalico, G. Giovannini, A. Maltoni, S. Nocentini, C. Vettori & G. Calamini (2012): Characterization, structure and genetic dating of an old-growth beech-fir forest in the northern Apennines (Italy), Plant Biosystems - An International Journal Dealing with all Aspects of Plant Biology: Official Journal of the Societa Botanica Italiana, 146:1, 175-188 To link to this article: http://dx.doi.org/10.1080/11263504.2011.650731 PLEASE SCROLL DOWN FOR ARTICLE Full terms and conditions of use: http://www.tandfonline.com/page/terms-and-conditions This article may be used for research, teaching, and private study purposes. Any substantial or systematic reproduction, redistribution, reselling, loan, sub-licensing, systematic supply, or distribution in any form to anyone is expressly forbidden. The publisher does not give any warranty express or implied or make any representation that the contents will be complete or accurate or up to date. The accuracy of any instructions, formulae, and drug doses should be independently verified with primary sources. The publisher shall not be liable for any loss, actions, claims, proceedings, demand, or costs or damages whatsoever or howsoever caused arising directly or indirectly in connection with or arising out of the use of this material.

Welcome message from author
This document is posted to help you gain knowledge. Please leave a comment to let me know what you think about it! Share it to your friends and learn new things together.
Transcript

This article was downloaded by: [Universita Degli Studi di Firenze], [Davide Travaglini]On: 05 April 2012, At: 02:31Publisher: Taylor & FrancisInforma Ltd Registered in England and Wales Registered Number: 1072954 Registered office: Mortimer House,37-41 Mortimer Street, London W1T 3JH, UK
Plant Biosystems - An International Journal Dealingwith all Aspects of Plant Biology: Official Journal of theSocieta Botanica ItalianaPublication details, including instructions for authors and subscription information:http://www.tandfonline.com/loi/tplb20
Characterization, structure and genetic dating of anold-growth beech-fir forest in the northern Apennines(Italy)D. Travaglini a , D. Paffetti a , L. Bianchi a , A. Bottacci b , F. Bottalico a , G. Giovannini a ,A. Maltoni a , S. Nocentini a , C. Vettori c & G. Calamini aa Dipartimento di Economia, Ingegneria, Scienze e Tecnologie Agrarie e Forestali, Universityof Florence, Via San Bonaventura, 13, 50145, Florence, Italyb Corpo Forestale dello Stato, Ufficio Territoriale per la Biodiversità di Pratovecchio, ViaDante Alighieri, 41, 52015 Pratovecchio, Arezzo, Italyc Istituto di Genetica Vegetale, Consiglio Nazionale delle Ricerche, Via Madonna del Piano,10, 50019, Sesto Fiorentino, Florence, Italy
Available online: 03 Jan 2012
To cite this article: D. Travaglini, D. Paffetti, L. Bianchi, A. Bottacci, F. Bottalico, G. Giovannini, A. Maltoni, S. Nocentini, C.Vettori & G. Calamini (2012): Characterization, structure and genetic dating of an old-growth beech-fir forest in the northernApennines (Italy), Plant Biosystems - An International Journal Dealing with all Aspects of Plant Biology: Official Journal of theSocieta Botanica Italiana, 146:1, 175-188
To link to this article: http://dx.doi.org/10.1080/11263504.2011.650731
PLEASE SCROLL DOWN FOR ARTICLE
Full terms and conditions of use: http://www.tandfonline.com/page/terms-and-conditions
This article may be used for research, teaching, and private study purposes. Any substantial or systematicreproduction, redistribution, reselling, loan, sub-licensing, systematic supply, or distribution in any form toanyone is expressly forbidden.
The publisher does not give any warranty express or implied or make any representation that the contentswill be complete or accurate or up to date. The accuracy of any instructions, formulae, and drug doses shouldbe independently verified with primary sources. The publisher shall not be liable for any loss, actions, claims,proceedings, demand, or costs or damages whatsoever or howsoever caused arising directly or indirectly inconnection with or arising out of the use of this material.

OLD GROWTH FORESTS
Characterization, structure and genetic dating of an old-growthbeech-fir forest in the northern Apennines (Italy)
D. TRAVAGLINI1, D. PAFFETTI1, L. BIANCHI1, A. BOTTACCI2, F. BOTTALICO1,
G. GIOVANNINI1, A. MALTONI1, S. NOCENTINI1, C. VETTORI3, & G. CALAMINI1
1Dipartimento di Economia, Ingegneria, Scienze e Tecnologie Agrarie e Forestali, University of Florence, Via San
Bonaventura, 13, 50145 Florence, Italy, 2Corpo Forestale dello Stato, Ufficio Territoriale per la Biodiversita di Pratovecchio,
Via Dante Alighieri, 41, 52015 Pratovecchio, Arezzo, Italy, and 3Istituto di Genetica Vegetale, Consiglio Nazionale delle
Ricerche, Via Madonna del Piano, 10, 50019 Sesto Fiorentino, Florence, Italy
AbstractAn old-growth beech forest stand with silver fir within the strict forest reserve of Sasso Fratino has been examined with thefollowing aims: to characterize forest stand on the basis of classic forest parameters and to assess forest stand structure bymeans of spatial functions; to provide genetic dating of the beech population. Total census of size and position of living treesand deadwood was performed on a 9200 m2 permanent plot. Vertical distribution of crowns in the stand was assessed usingthe TSTRAT function, horizontal stand structure using spatial point pattern analysis. Genetic dating was performed on asample of beech trees. DNA was isolated and each individual was genotyped at four chloroplast microsatellite loci.Microsatellite profiles were compared with the profiles of control DNA of known haplotypes. Results show a multi-stratavertical structure, a horizontal structure characterized by small gaps (5160 m2) where silver fir regeneration sets in.Deadwood is present with all the decay classes and with relatively high volumes. Genetic dating ascribes the Sasso Fratinobeech stand to the ancestral haplotype 2: this population can therefore be considered a hot spot of haplotype diversity of theglacial refugia present in central Italy.
Keywords: Old-growth, stand structure, deadwood, genetics, Fagus sylvatica L., Abies alba Mill.
Introduction
Old-growth forests are forest ecosystems which have
developed without human disturbances for many years;
they are usually perceived as complex natural systems
composed of old trees and decaying woody materials
which are important habitat for many species.
According to the Forest Resource Assessment
(FAO-FRA 2010), primary forests (i.e. forest of
native species where there are no clearly visible
indications of human activities and the ecological
processes have not been significantly disturbed)
account for 36% of global forest area; the most part
of these forests are in America (66%), whilst in
Europe, if we exclude the Russian Federation,
primary forest are rare (0.4%).
In Italy, human pressure on forests has a very long
history and today there are no true primary forests in
the Italian peninsula (Motta 2002). However, in
some remote areas of the Alps and Apennines, often
within protected areas, there are forests which have
been left to natural evolution for many years with
potential old-growth features.
A large number of studies have been conducted in
old-growth forests worldwide addressing such di-
verse topics as carbon, nutrient and water cycling,
stand structure, population dynamics, disturbance
regimes and habitat diversity (Wirth et al. 2009).
In Italy, the first studies on the characterization
and monitoring of old-growth forests were initiated
by Pavari in 1954. Nevertheless, only since the end of
the last century the research has been focused on
these complex forest ecosystems (e.g. Paci &
Salbitano 1998; Motta 2002; Piovesan et al. 2005).
The interest on old-growth forest studies has been
recently renewed by national projects aimed to
increase the knowledge on old-growth forest stands
in the Alps and Apennines (Blasi 2010; Chirici &
Correspondence: L. Bianchi, Dipartimento di Economia, Ingegneria, Scienze e Tecnologie Agrarie e Forestali, University of Florence, Via San Bonaventura,
13, 50145 Florence, Italy. Tel: þ39 055 3288650. Fax: þ39 055 319179. Email: [email protected]
Plant Biosystems, Vol. 146, No. 1, March 2012, pp. 175–188
ISSN 1126-3504 print/ISSN 1724-5575 online ª 2012 Societa Botanica Italiana
http://dx.doi.org/10.1080/11263504.2011.650731
Dow
nloa
ded
by [
Uni
vers
ita D
egli
Stud
i di F
iren
ze],
[D
avid
e T
rava
glin
i] a
t 02:
31 0
5 A
pril
2012

Nocentini 2010; Marchetti & Blasi 2010; Piovesan
et al. 2010). In these projects, the following topics
were addressed: ecology (Marchetti et al. 2010) and
stand structure (Ciancio et al. 2010; Iovino et al.
2010; Manes et al. 2010; Palombo et al. 2010;
Piovesan et al. 2010), deadwood (Burrascano et al.
2008; Lombardi et al. 2010; Motta et al. 2010),
vascular flora (Sabatini et al. 2010), lichens and
bryophytes (Brunialti et al. 2010; Potenza & Fascetti
2010; Ravera et al. 2010), carbon stock (Piovesan
et al. 2010), genetic diversity (Vettori et al. 2010),
monitoring systems (Blasi et al. 2010; Corona et al.
2010; Di Paolo et al. 2010) and, finally, possible
indications from old-growth studies in supporting
forest management and planning in areas with long
standing human impact (Nocentini 2010).
Objectives
The aim of this study is to further develop knowledge
on old-growth beech-fir forests in Apennine environ-
ment. We selected a beech (Fagus sylvatica L.) forest
stand with silver fir (Abies alba Mill.) which has had
very low human impact until 1959 when it was
included in a strict forest reserve and left to natural
evolution. Specific objectives of this paper are: (1) to
characterize forest stand on the basis of classic forest
parameters; (2) to assess forest stand structure by
means of spatial functions and (3) to provide genetic
dating of the population by evaluating the ancestry of
the stand compared to beech glaciation refuges
present in Italy.
Results are discussed in relation to the possibility of
defining reference parameters for the detection of
old-growth forests in the Mediterranean environ-
ment.
Material and methods
Study area
The study has been carried out in the strict nature
reserve of Sasso Fratino within the National Park of
Foreste Casentinesi, Monte Falterona and Cam-
pigna. The reserve was created in 1959. It covers 764
ha going from the Apennine ridge (1520 m a.s.l.) to
an elevation of 650 m a.s.l. in the Romagna region.
Climate is temperate-oceanic; mean annual tem-
perature is 9.08C; annual rainfall is 1750 mm.
Orography is irregular with steep slopes and some
small, almost flat areas; mean slope is usually more
than 65%. The area lies on Miocene sandstone marl
series which originated Inceptisols with acid humus
and high biological activity. The prevalent forest
types are: pure beech forests above 1300 m a.s.l.;
beech and silver fir mixed forests between 800 and
1300 m a.s.l. and mixed deciduous oak forests below
800 m a.s.l. Ground vegetation is composed of mesic
species. Wildlife is abundant; ungulate populations
are large and their pressure on vegetation has been
observed, particularly on tree regeneration (Massei
1981; Paci & Salbitano 1998; Bottacci 2009; Bianchi
et al. 2011).
The forest stand is located in the municipal district
of Bagno di Romagna (FO), within the historical
core of the reserve, close to the resort locally named
‘‘Quota 900’’ (Lat. 43850038.073300; Long.
1184803.181600). The study area lies on a slightly
sloping ground (30%) with an eastern aspect, at an
altitude between 950 and 1000 m a.s.l. The ground
is undulating due to the presence of streams. The
forest stand is composed of beech with silver fir.
Ground vegetation is scarce.
In the core of the reserve silvicultural activities
ended not less than 70 years ago; forest exploitations
were discontinuous in the past and of low intensity
due to difficult access (Sansone 1915; Hofmann
1965, 1985).
Data
Fieldworks were carried out in 2009 within a
quadrangular plot 9200 m2 large.
The geographic coordinates of the plot’s corners
were recorded by a GPS Trimble GeoXT series
2008. In addition, the coordinates of four reference
points located at the corners of a square 1600 m2
large drawn within the plot were recorded by GPS.
The census of living trees and deadwood was
performed. All living trees with a diameter at breast
height (DBH) greater than 2.5 cm were inventoried.
For each tree, the species was noted and the DBH was
measured by a calliper; the total tree height, the height-
to-base of the live crown and the projection of tree
crowns by vertical sighting (four crown radii projec-
tion) were measured by Vertex IV Hypsometer.
Standing and downed dead trees, stumps and coarse
woody debris were also inventoried. Deadwood
measurements were carried out according to the
method described by Lombardi et al. (2010). Dead-
wood decay levels were assessed through Hunter’s
classification system (Hunter 1990).
The position of each living tree and deadwood
piece was recorded by measuring distance from the
nearest plot corner and the angle of this distance and
N. The angle was measured by a Suunto KB-14/360
R compass; the distance was measured using the
Vertex IV.
Mean age of the prevailing species was assessed by
extracting a couple of cores from three living trees
belonging to the most frequent diameter class; the
cores were extracted at a height of 1.3 m above
ground with an angle of 1208 between the two cores.
The rings were counted in the laboratory.
176 D. Travaglini et al.
Dow
nloa
ded
by [
Uni
vers
ita D
egli
Stud
i di F
iren
ze],
[D
avid
e T
rava
glin
i] a
t 02:
31 0
5 A
pril
2012

For genetic dating of the stand, a sample of wood
was taken at the stem base of 27 beech trees; the trees
were selected considering the distribution of beech
within the plot (Figure 1a); the number of sampled
trees varied between 1 and 3 in each 5 cm diameter
class, starting from class 40 to class 125, including a
sample from 2 trees in the smallest class. In addition,
a sample of plant material was taken both from beech
regeneration and from deadwood; the sample from
regeneration was extracted from six young trees less
than 1.3 m tall. The plant material was conserved in
the laboratory at7208C.
Analysis
Stand structural analysis. To characterize the struc-
ture of the stand, the following parameters were
used: number of stems (N) per hectare, basal area
(BA) per hectare and volume (V) per hectare, mean
diameter ( �D, i.e. the diameter of the mean basal area
tree), mean height (HL, i.e. the height of the mean
basal area tree), dominant height (H100, i.e. the mean
height of the 100 trees per hectare with the largest
diameters), standard deviation of diameters
(SDDBH) and standard deviation of heights (SDH).
For deadwood, the total volume and the decay level
were computed for each surveyed deadwood type.
Volumes of living and dead trees were computed
with a double entry volume equation (Castellani
et al. 1984); the volume of the stumps and the
volume of deadwood in the forest floor were
computed as described by Lombardi et al. (2010).
The following structural features were also ad-
dressed: vertical structure, stand density, canopy gaps,
horizontal structure, spatial interactions between pre-
vailing tree species and between canopy gaps and small
trees. In addition, the spatial pattern of standing and
downed deadwood was assessed. Structural features
were quantified by means of spatial functions.
The vertical distribution of crowns in the stand
was assessed using the TSTRAT function. This
function assigns individual trees to vertical strata or
canopy layers. To do this, TSTRAT defines multiple
vertical height cut-off points based on tree heights
and crown lengths and assigns individual trees to
vertical strata depending on the relative position of
tree crowns to these height cut-off points. The
algorithm considers a tree’s competition zone which
corresponds to the area at the top of the crown where
the majority of photosynthesis occurs (Latham et al.
1998). If the competition zone is equal to b, the
height cut-off point for the ith strata (Hsi) is equal to:
Hsi ¼ ð1� bÞ �CL þHBLC ð1Þ
where b ranges between 0 and 1; CL is the crown
length of the tallest tree (in case of trees of equivalent
height, the tree with the longest crown is considered
first by TSTRAT) and HBLC is the height-to-base
of the live crown of the tallest tree.
The height cut-off point of the upper stratum
(Hs1) is computed first by TSTRAT and all trees
having a total height equal to or greater than Hs1 are
placed in the upper stratum. Then, the cut-off points
of underlying strata are computed using Equation 1,
but excluding from computation the trees already
assigned to the stratum. The process is repeated until
all the trees are accounted for or until some
predefined lower limit for strata definition is reached.
In this study, we set a lower limit for strata at a
height of 5 m on the basis of field observation; all
trees with heights below this lower limit were placed
in the lower stratum. In the examined condition, the
use of b¼ 0.6 (Kutsch et al. 2009) produced a likely
distribution of crowns into vertical strata.
Stand density was measured on the basis of the
percentage canopy cover. For simplicity, the crowns
were shaped as circles with a radius equal to the
mean of the radii measured in the field. Stand
density was computed as the percentage of stand area
covered by crowns. Crown projection area was
assessed excluding crown overlapping and the
portion of the crowns outside the plot.
Canopy gaps were extracted and distinguished
from openings between trees (i.e. areas smaller than
that created by the loss of at least one whole crown).
To do this, the method based on morphological
functions described by Koukoulas and Blackburn
(2004) was applied to the crowns placed in the upper
stratum.
Horizontal stand structure was assessed using the
spatial point pattern analysis. In particular, the
univariate Ripley’s K function (Ripley 1977) was
applied to classify the horizontal structure into
random, regular or clustered (e.g. Kuuluvainen
et al. 1996; Motta & Edouard 2005). The Ripley’s
K function provides statements about changes trends
in the horizontal stand structure around individual
trees as the distance from a standpoint increases. In
practice, the function identifies the extent to which
the tree distribution pattern is more or less dense
than the random Poisson distribution as the distance
d from the tree base increases (Pretzsch 2010). In
case of n trees within a stand having an area equal to
A, the Ripley’s K function for the distance d is equal
to:
K dð Þ ¼ AXn
i¼1
Xn
j¼1
oijðdÞn2
for i 6¼ j ð2Þ
where oij(d) is the distance between the trees i and j.
In this study, the L(d) function, i.e. the transfor-
mation of K(d) developed by Besag (1977), was used
to identifying and testing deviation in the observed
Old-growth beech-fir forest in Italy 177
Dow
nloa
ded
by [
Uni
vers
ita D
egli
Stud
i di F
iren
ze],
[D
avid
e T
rava
glin
i] a
t 02:
31 0
5 A
pril
2012

Figure 1. (a) Spatial distribution of living trees and deadwood within the plot. (b) Canopy cover and canopy gaps seen from below. The
crowns are coloured according to their distribution into vertical strata. In the lower stratum (stratum 4), the crowns are numbered according
to the cluster distribution of tress in this stratum.
178 D. Travaglini et al.
Dow
nloa
ded
by [
Uni
vers
ita D
egli
Stud
i di F
iren
ze],
[D
avid
e T
rava
glin
i] a
t 02:
31 0
5 A
pril
2012
point pattern from the random distribution. This
transformation linearizes K(d) and stabilizes the
variance; in addition, the results provided by L(d)
are easier to interpret as the function has an expected
value equal to 0 in case of random distribution:
L dð Þ ¼ffiffiffiffiffiffiffiffiffiffiffiKðdÞp
r� d for i 6¼ j ð3Þ
Horizontal spatial pattern was assessed for all trees
of the stand and for groups of trees grouped in
relation to tree species and the distribution of trees
into vertical strata; groups of trees with less than 30
individuals were not considered.
The L(d) function was computed for d ranging
from 1 to 50 m to limit margin effects; at each step,
the distance d was augmented by 1 m. The Monte
Carlo simulations were used to assess the signifi-
cance of deviation from random distribution; 99
randomizations were generated that provided a 95%
confidence envelop (Stoyan & Stoyan 1994). L(d)
greater than the envelop indicates a clustering
pattern; L(d) lower than the envelop indicates a
regular pattern; L(d) within the envelope indicates a
random pattern.
To investigate the spatial interaction between two
species, we used the bivariate K12(d) function which
is a generalization of K(d) function (Lotwick &
Silverman 1982):
K12 dð Þ ¼ n2K12ðdÞ þ n1K21ðdÞn1 þ n2
ð4Þ
where n1 and n2 are the number of trees of species 1
and 2, respectively.
The analysis was made using the L12(d) function
which is the transformation of K12(d) function:
L12 dð Þ ¼ffiffiffiffiffiffiffiffiffiffiffiffiffiffiK12ðdÞ
p
r� d ð5Þ
The L12(d) function was computed for d ranging
from 1 to 25 m. To test the significance of deviation
from null hypothesis of spatial independence be-
tween tree species, we adopted a 95% confidence
envelop from the toroidal shift null model (Wiagand
& Moloney 2004; Barbeito et al. 2008). In case of
attraction between species 1 and species 2, L12(d) is
greater than the confidence envelope; in case of
repulsion between the two species, L12(d) is lower
than the confidence envelope; in case of spatial
independence between species 1 and species 2,
L12(d) is within the confidence envelope.
In this study, the L12(d) function was used to
investigate spatial interaction between the two
prevailing species in the stand. In addition, the
L12(d) function was used to test the potential
influence of canopy gaps on the regeneration proces-
ses by investigating the spatial relationships between
canopy gaps and trees assigned to the lower stratum
by TSTRAT. To do this, a grid-based approach was
used as proposed by Wiegand et al. (2006). Gaps
were represented as adjacent cells each with a side
0.25 m long. Cells were treated as points located at
the centre of each cell. The L12(d) function was then
used by keeping fix the position of gaps.
The spatial pattern of deadwood was also investi-
gated. In case of standing deadwood (standing dead
trees, snags and stumps), the L(d) function was used.
In case of lying deadwood (downed dead trees and
coarse woody debris), the mean direction of the
pieces of deadwood and the circular variance were
computed. Analogous to a standard deviation
measure, the circular variance tells how well the
directional mean vector represents the set of input
vectors. Circular variance ranges from 0 to 1: if all
the input vectors have very similar directions, the
circular variance is near to 0; when input vector
directions span the entire compass, the circular
variance is near 1. The directional mean vector was
then compared with the direction of the maximum
slope computed on the bases of contour lines
extracted from topographic map.
Genetic analysis. DNA was isolated from plant
material (100 mg as starting material) using the
DNeasy plant kit (QiAgen, Germany) following the
manufacturer specifications.
Each individual was genotyped at the following
four chloroplast microsatellite loci: ccmp4, ccmp7
(Weising and Gardner 1999), DT (Forward: 50-AATTGTTAATAATCCTTTCG-30; Reverse: 50-GTTTCTGATATATTTTTACCG-30) and OA
(Forward: 50-GAAACTGAAAAGATTGAATG-30;Reverse: 50-CCTCTTTCTATCAAAATATCC-30).
Polymerase Chain Reaction (PCR) amplifications
were performed in a Thermal Cycler model 9700
(Applied Biosystem, Foster, CA, USA) in a final
volume of 20 ml, with 4–40 ng of DNA, 5.4 pmoles of
each primer, 250 mM for each dNTPs, 2 ml of reaction
buffer, 2.5 mM MgCl2 and 1 U of Platinum Taq DNA
Table I. Number of stems (N), basal area (BA), volume (V), mean
diameter ( �D) and mean height (HL) of living trees.
Species
N
(n ha71)
BA
(m2 ha71)
V
(m3 ha71)
�D
(cm)
HL
(m)
F. sylvatica L. 97 43.80 984.9 75.8 40.3
A. alba Mill. 78 13.50 204.0 46.9 27.5
T. baccata L. 1 0.05 0.1 25.2 –
S. nigra L. 1 0.05 0.1 25.2 –
Total 177 57.40 1,189.1 – –
Old-growth beech-fir forest in Italy 179
Dow
nloa
ded
by [
Uni
vers
ita D
egli
Stud
i di F
iren
ze],
[D
avid
e T
rava
glin
i] a
t 02:
31 0
5 A
pril
2012

polymerase (Invitrogen, CA, USA). Amplification
thermal profile was as follows: first denaturation step
at 958C for 5 min, followed by 30 cycles (denaturation
at 948C for 1 min, annealing for 1 min at primer
temperature annealing and extension at 728C for
1 min) and a final elongation at 728C for 30 min.
PCR products were run on an automated sequencer
ABI 310 (Applied Biosystems), and sizing was carried
out with the GeneMapper1
vers. 4.0 (Applied Biosys-
tems).
The microsatellite profiles of the four loci were
compared simultaneously with the profiles of control
DNA of known haplotypes already characterized by
Vettori et al. (2004).
Figure 2. Stem number–diameter distribution for total trees (a), F. sylvatica L. (b) and A. alba Mill. (c), diameter–height curves (d) and
vertical structure (e).
Table II. Height cut-off point (Hs), number of stems, basal area (BA) and percentage canopy cover of vertical strata computed by TSTRAT
(*2 individuals of beech and 11 individuals of silver fir tall less than 5 m were assigned to the stratum 4).
Stratum Hs (m)
F. sylvatica L.
(n ha71)
A. alba Mill.
(n ha71)
T. baccata L.
(n ha71)
S. nigra L.
(n ha71)
BA
(m2 ha71)
Canopy
cover (%)
1 28.84 93 25 0 0 55.4 84.0
2 17.28 2 7 0 0 1.0 3.8
3 9.36 0 14 0 0 0.7 2.9
4 5.00* 2 32 1 1 0.3 3.4
180 D. Travaglini et al.
Dow
nloa
ded
by [
Uni
vers
ita D
egli
Stud
i di F
iren
ze],
[D
avid
e T
rava
glin
i] a
t 02:
31 0
5 A
pril
2012
Results
Stand characteristics
Tree species composition was characterized by
beech and silver fir; European yew (Taxus
baccata L.), European black elderberry (Sambucus
nigra L.) and sycamore maple (Acer pseudoplatanus
L.) were sporadically represented within the
stand; the latter was not inventoried within the
study plot.
Beech is the prevailing species; with 54% of the
total number of trees, it contributes for more than
75% of total basal area and volume. Beech trees are
quite large: HL was equal to 40 m with a maximum
height of 45 m; �D was equal to 76 cm with a
maximum DBH of 126 cm. Silver fir, with approxi-
mately 44% of total number, accounts for less than
25% of basal area and volume. Fir trees are smaller,
HL was equal to 27 m with a maximum height of
44 m; �D was equal to 47 cm with a maximum DBH
of 105 cm (Table I).
Tree distribution in 5 cm diameter classes shows a
bimodal shape with one peak in the 75 cm diameter
class and the other one in the 10 cm class (Figure
2a). For beech, the distribution is unimodal, right-
skewed and rather uniform (Figure 2b); for silver fir,
the distribution was bimodal and more diversified
than for beech (Figure 2c). The higher diameter
differentiation of silver fir is highlighted by SDDBH:
for all the trees in the stand SDDBH is equal to
31.3 cm, for beech it is equal to 21.2 cm and for
silver fir 29.8 cm.
Ring count on cores extracted from beech trees in
the 70 cm diameter class ranges between 130 and
145. However, because the cores were extracted at
breast height, age of beech trees is expected to be
greater than this number; in addition, analysis
revealed that the centre of the stem was never
sampled by the cores.
Vertical structure
For the whole stand H100 was equal to 39 m. The
diameter–height curves for beech and silver fir are
shown in Figure 2d. The vertical distribution of
crowns computed by TSTRAT consisted of four
strata. The upper stratum (1) has a height cut-off
point equal to 29 m; the intermediate strata have a
cut-off points equal to 17 m (2) and 9 m (3),
respectively; for the lower stratum (4) the height
cut-off point was set to 5 m on the basis of field
observation. Table II shows the number of stems and
basal area computed for each stratum.
The distribution of crowns into strata was not
uniform, and the multi-strata profile accounted for
the forest stand was mostly due to silver fir as
shown in Figure 2e. Most of the trees, especially
beech, had their crowns within the upper stratum
whilst only silver fir had crowns within all the
vertical strata. The higher height differentiation of
silver fir is highlighted by SDH: for all the trees in
the stand SDH was equal to 14.0 m, for beech and
silver fir was equal to 6.2 m and 14.3 m, respec-
tively.
Table III shows the size (minimum, maximum and
mean) of diameters and crowns for each vertical
stratum.
Stand density and canopy gaps
The percentage canopy cover of the stand was equal
to 86%. Canopy coverage was rather continuous in
the upper stratum even if locally broken by canopy
gaps; in this stratum the percentage canopy cover
was equal to 84%. In the underlying strata, the
density was sparse: for strata 2, 3 and 4, the canopy
coverage was lower than 4% (Table II).
A total of nine canopy gaps were identified inside
the plot, which covered a total area of 764 m2 (8% of
the plot). Gap size varied between 40 and 60 m2, 80
and 100 m2 and 140 and 160 m2 (Figure 1b).
Horizontal structure and spatial interactions
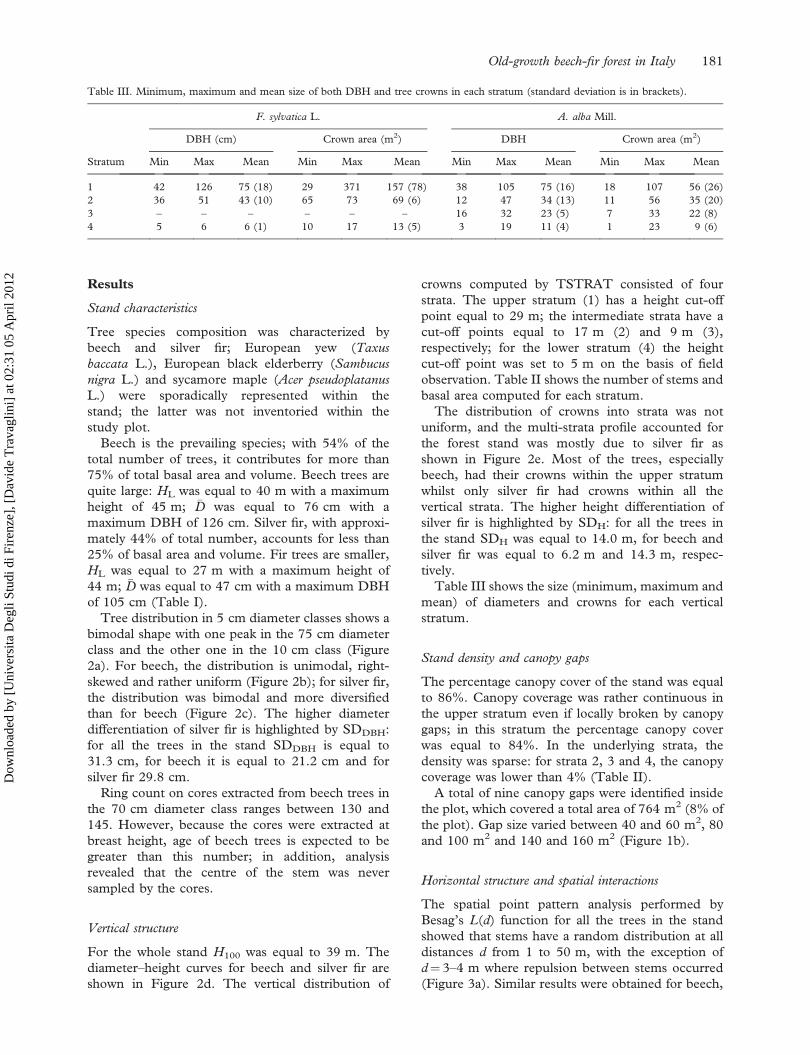
The spatial point pattern analysis performed by
Besag’s L(d) function for all the trees in the stand
showed that stems have a random distribution at all
distances d from 1 to 50 m, with the exception of
d¼ 3–4 m where repulsion between stems occurred
(Figure 3a). Similar results were obtained for beech,
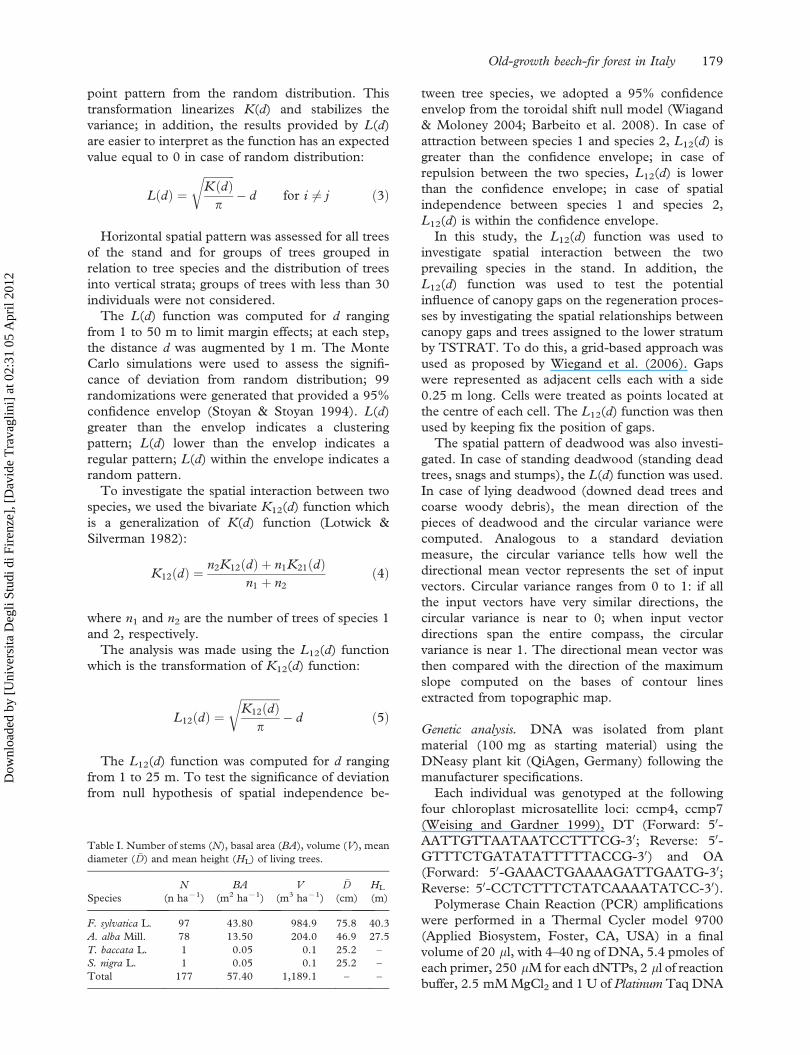
Table III. Minimum, maximum and mean size of both DBH and tree crowns in each stratum (standard deviation is in brackets).
F. sylvatica L. A. alba Mill.
DBH (cm) Crown area (m2) DBH Crown area (m2)
Stratum Min Max Mean Min Max Mean Min Max Mean Min Max Mean
1 42 126 75 (18) 29 371 157 (78) 38 105 75 (16) 18 107 56 (26)
2 36 51 43 (10) 65 73 69 (6) 12 47 34 (13) 11 56 35 (20)
3 – – – – – – 16 32 23 (5) 7 33 22 (8)
4 5 6 6 (1) 10 17 13 (5) 3 19 11 (4) 1 23 9 (6)
Old-growth beech-fir forest in Italy 181
Dow
nloa
ded
by [
Uni
vers
ita D
egli
Stud
i di F
iren
ze],
[D
avid
e T
rava
glin
i] a
t 02:
31 0
5 A
pril
2012
silver fir and trees assigned to the upper stratum
(stratum 1): beech had a random distribution with the
exception of d¼ 2–3 m (Figure 3b); silver fir had a
random distribution at all distances (Figure 3c); trees
in the upper stratum had a random distribution with
the exception of d¼ 1–6 m (Figure 3d). Repulsion
Figure 3. L(d) versus distance d for all trees (a), F. sylvatica L. (b), A. alba Mill. (c), trees assigned to the upper stratum (d), trees assigned to
the lower stratum (e), standing deadwood (h). L1,2(d) versus distance d between F. sylvatica L. and A. alba Mill. (f) and between canopy gaps
and group of trees in the lower stratum (g). Grey line is the 95% confidence envelop.
Table IV. Volume of deadwood per deadwood type.
Species
Standing dead
trees (m3 ha71)
Snag
(m3 ha71)
Downed dead
trees (m3 ha71)
Coarse woody
debris (m3 ha71)
Stumps
(m3 ha71)
Total
(m3 ha71)
F. sylvatica L. 0.00 0.03 0.00 21.34 0.00 21.37
A. alba Mill. 0.01 15.58 0.00 27.60 0.61 43.80
Other species 0.00 0.00 0.00 0.06 0.00 0.06
Total 0.01 15.61 0.00 49.00 0.61 65.23
182 D. Travaglini et al.
Dow
nloa
ded
by [
Uni
vers
ita D
egli
Stud
i di F
iren
ze],
[D
avid
e T
rava
glin
i] a
t 02:
31 0
5 A
pril
2012

found at the shorter distances can be explained as an
effect of the competition between trees.
The stems in the lower stratum (stratum 4)
showed a different spatial pattern. In this stratum,
which is mainly composed of silver firs, stems were
significantly clustered at distances between 5 and
17 m; for distances outside this range the stems
had a random distribution (Figure 3e). On the
basis of this result, seven groups of trees were
identified inside stratum 4, one group of beech and
six groups of silver fir; the groups were formed by
individuals located at a distance of 5–17 m each
from the other. The group of beech consists of
only 2 individuals, whilst the group of silver fir
consists of a number of individuals ranging from 2
to 8 (Figure 1b).
The spatial relationships calculated by L12(d)
function between beech and silver fir and between
canopy gaps and groups of trees in the lower stratum
produced the following results: spatial independence
was found between beech and silver fir (Figure 3f);
attraction was found between gaps and groups of
trees in the lower stratum between 1 m and 8 m
(Figure 3g).
Deadwood
The total volume of deadwood was 65 m3 ha71, 2/3
of which was silver fir. The ratio between dead and
living volume is equal to 5.5%.
Most of the deadwood lies on the ground as
branches and stems pieces, equally distributed
between beech and silver fir. In addition, standing
dead trees, snags and silver fir stumps occurred
inside the plot (Table IV).
Standing dead trees and snags were included
within vertical strata 3 and 4 and have a diameter
at the tree base ranging between 6 and 110 cm.
Stump were naturally originated and have a diameter
at the base ranging between 17 and 65 cm. All the
decay classes were found in the study plot. Decay
classes 4 and 5 represent almost 50% of total
deadwood volume (cf. Lombardi et al. 2010).
Standing deadwood (standing dead trees, snags
and stumps) showed a random distribution at
distances lower than 36 m (Figure 3h). Lying dead-
wood (downed dead trees and coarse woody debris)
was uniformly distributed across the study plot
(Figure 1a). The directional mean vector of
lying deadwood was 898N, with a circular variance
of 0.32.
Genetic dating
All the individuals showed the same chloroplast
microsatellite allelic combination (311, 222, 115 and
143) and a single haplotype was identified. The
comparison between microsatellite profiles of the
four loci and control DNA of known haplotypes
(Vettori et al. 2004) showed that the only haplotype
in the Sasso Fratino stand was haplotype 2 (Table
V).
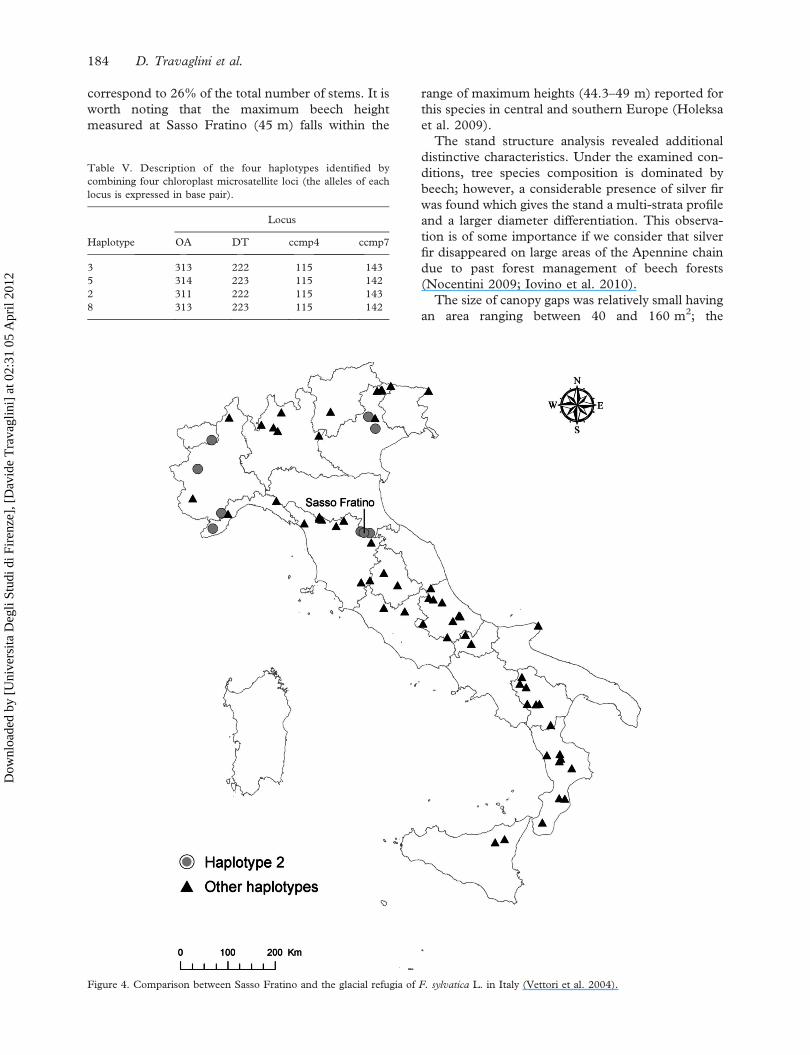
This haplotype corresponds to one of the most
ancestral haplotypes present in the glacial refugia in
Italy. It is distributed in the western Alps, whilst it is
rare along the Apennine chain where it is present
only in two Italian locations: Passo dei Mandrioli –
Bagno di Romangna (FO) and Monte Falterona –
Stia (AR; Figure 4).
Discussion
The Sasso Fratino stand we have studied has
distinctive characteristics with respect to Italian
beech forests. Basal area and standing volume are,
respectively, two times and five times higher than
mean values reported by the National Forest
Inventory (INFC, Inventario Nazionale delle Foreste
e dei Serbatoi Forestali di Carbonio) for beech
forests; deadwood volume is eight times greater than
that reported by INFC (2005).
Some similarities can be found with other old-
growth beech forests along the Italian peninsula. For
instance, in the central Apennines, Piovesan et al.
(2010) found that basal area, standing volume and
deadwood volume range between 41 and 48 m2
ha71, 497 and 715 m3 ha71, 19 and 91 m3 ha71. In
southern Italy, Iovino et al. (2010) found a dead-
wood volume of about 70 m3 ha71, a basal area
ranging between 26 and 70 m2 ha71 and a standing
volume between 390 and 972 m3 ha71. For beech
forest stands, the following data are reported by
Lombardi et al. (2010): living volume between 666
and 1030 m3 ha71 and deadwood volume between
26 and 89 m3 ha71.
Tree size and frequency of large trees are
additional distinctive characteristics of the examined
forest stand. The unusual values of mean diameter
and mean height measured within the plot, denoting
suitable site conditions for beech and silver fir, are
higher than those reported for other old-growth
forests in the Apennines (Iovino et al. 2010; Manetti
et al. 2010). At Sasso Fratino, the number of trees
with a DBH greater than 70 cm is equal to 68 trees
per hectare (50 were beech and 18 silver fir), which
correspond to 38% of the total number of stems. In
the beech stand of Cozzo Ferriero (PZ), Iovino et al.
(2010) found a number of stems with DBH greater
than 60 cm equal to 27%; 25–30 stems per hectare
with a DBH greater than 70 cm are reported by
Piovesan et al. (2010) for old-growth beech forest
stands in the central Apennines. At Sasso Fratino,
the number of trees taller than 40 m is 46 trees per
hectare (36 were beech and 10 silver fir), which
Old-growth beech-fir forest in Italy 183
Dow
nloa
ded
by [
Uni
vers
ita D
egli
Stud
i di F
iren
ze],
[D
avid
e T
rava
glin
i] a
t 02:
31 0
5 A
pril
2012
correspond to 26% of the total number of stems. It is
worth noting that the maximum beech height
measured at Sasso Fratino (45 m) falls within the
range of maximum heights (44.3–49 m) reported for
this species in central and southern Europe (Holeksa
et al. 2009).
The stand structure analysis revealed additional
distinctive characteristics. Under the examined con-
ditions, tree species composition is dominated by
beech; however, a considerable presence of silver fir
was found which gives the stand a multi-strata profile
and a larger diameter differentiation. This observa-
tion is of some importance if we consider that silver
fir disappeared on large areas of the Apennine chain
due to past forest management of beech forests
(Nocentini 2009; Iovino et al. 2010).
The size of canopy gaps was relatively small having
an area ranging between 40 and 160 m2; the
Figure 4. Comparison between Sasso Fratino and the glacial refugia of F. sylvatica L. in Italy (Vettori et al. 2004).
Table V. Description of the four haplotypes identified by
combining four chloroplast microsatellite loci (the alleles of each
locus is expressed in base pair).
Haplotype
Locus
OA DT ccmp4 ccmp7
3 313 222 115 143
5 314 223 115 142
2 311 222 115 143
8 313 223 115 142
184 D. Travaglini et al.
Dow
nloa
ded
by [
Uni
vers
ita D
egli
Stud
i di F
iren
ze],
[D
avid
e T
rava
glin
i] a
t 02:
31 0
5 A
pril
2012
maximum area measured for canopy gaps corre-
sponds, in the upper stratum, to the mean crown
area of a beech and three times to the mean crown
area of a silver fir. These gap sizes are in line with
those reported by Paci and Ciampelli (1996) for the
Sasso Fratino forest. These authors, on the basis of
studies conducted on forest regeneration in response
to the opening of gaps, found that the regeneration of
shade tolerant species, like beech and silver fir, is
favoured by small and medium size gaps (5400 m2).
The tendency of silver fir to regenerate in the
presence of small gaps (200 m2) has been observed
by Ciancio et al. (1985) in the Calabrian silver fir
forests in southern Apennine and more recently by
Albanesi et al. (2008).
Beech regeneration was scarcely represented with-
in the examined plot, whilst silver fir regeneration
was relatively abundant if we consider as regenera-
tion trees in the lower stratum. The distribution of
regeneration was clustered and clusters were close to
the gaps, usually within 8 m from them. This result
confirms the relationships between silver fir regene-
ration and small canopy gaps.
In the studied area, most of deadwood consists of
branches and stem pieces lying on the ground. A
large range of sizes and decay classes was found for
all deadwood components. However, the occurrence
of large standing and downed trees, which usually
characterizes the last stages of stand development,
was not so high within the stand where we found only
eight pieces of deadwood with a diameter470 cm.
Lying deadwood had a directional mean vector very
similar to the direction of the maximum slope. As
observed in other parts of the Sasso Fratino forest,
slope, together with flowing rainfall and snow
thawing, might affect the layout of lying deadwood
and, especially on steep slopes, it can favour move-
ment and deposition of woody materials towards
creeks and streams.
Old-growth forests are considered to have great
value for species conservation by providing a special
habitat for an array of forest-dependent wildlife.
These older populations may also serve as reservoirs
of genetic diversity and reproductive fitness, impor-
tant for maintaining populations of native trees
under pressure from environmental changes (Mos-
seler et al. 2003). Therefore, it can be supposed that
old-growth forests are ancestral sites for beech, and
genetic analysis of chloroplast DNA can permit the
dating of a population defining its ancestrality.
Previous studies conducted by palaeobotanical
and genetic analyses on Fagus spp. have indicated
that: (i) at the end of Tertiary period the ancestral
Fagus orientalis complex was present in Italy and that
only at the beginning of the Pliocene F. sylvatica
became differentiated from F. orientalis, slowly turn-
ing to a predominant role among the Fagus species in
West Europe (Paffetti et al. 2007); (ii) beech survived
the last glacial period in multiple refuge areas; (iii)
central European refugia were separated from the
Mediterranean refugia (Magri et al. 2006) and (iv)
the Italian peninsula was one of the main European
refugia during the last glaciation for many forest tree
species (Petit et al. 2003).
In particular, the last glacial period has determined
a fragmentation event which had the most important
role in shaping the genetic structure of the present
Italian beech forests. A remarkable geographical
subdivision of chloroplast genetic diversity in Italian
beech was found, and the populations displaying
high divergence were in central–southern Italy
(Vettori et al. 2004).
Therefore, considering that the genetic dating
ascribes the Sasso Fratino beech stand to the
ancestral haplotype 2, this population can be con-
sidered a hot spot of haplotype diversity of the glacial
refugia present in central Italy. This haplotype 2 was
previously detected in the northern Apennines
(Vettori et al. 2004), and therefore, it can be assumed
that during the glacial periods of the Quaternary, this
haplotype remained trapped in these area. In fact, the
beech populations in Italy were mainly restricted to a
few and/or small areas (especially in the centre-south;
Magri 1998). Therefore, it can be supposed that with
the retreat of the glaciers the populations spread to
higher altitudes and to northern latitudes, thereby
coming into contact and mixing haplotypes. Our
results are in agreement with Magri (1998) and
Vettori et al. (2004), who hypothesized, based on
pollen analysis and chloroplast genetic diversity,
respectively, that the northern beech populations
originated from the Apennine region, whilst Slovenia
(the Balkans) might have been the starting point of
the recolonization of the eastern Alps. Therefore, the
actual population of Sasso Fratino is the descendent
of the autochthone ancestral beech population pre-
sent during last glaciation and it can be dated to
15,000 years ago, representing an important ‘‘genetic
diversity reserve’’ which deserves high conservation
priority.
Conclusions
Results obtained within the strict reserve of Sasso
Fratino can provide information on potential attri-
butes characterizing old-growthness of Mediterra-
nean beech forest stands. Tree species composition is
an attribute that must be considered in relation to
site condition and forest history. In the past, species
like silver fir were quite common within beech stands
in the Apennine mountain area, whilst pure and
uniform beech forests are often the results of past
forest management (Burrascano et al. 2008; Nocen-
tini 2009; Vrska et al. 2009).
Old-growth beech-fir forest in Italy 185
Dow
nloa
ded
by [
Uni
vers
ita D
egli
Stud
i di F
iren
ze],
[D
avid
e T
rava
glin
i] a
t 02:
31 0
5 A
pril
2012

Vertical structure is another important attribute
which is correlated to species composition. At Sasso
Fratino, the stand structure is multi-strata. Under
the examined condition, silver fir plays an important
role in this regard having a higher diameter and
height differentiation than beech.
Concerning deadwood, even though a large range
of sizes and decay classes was found for all deadwood
components, however, the occurrence of large
standing and downed trees, and dead/living volume
ratio, which usually characterizes the last stages of
stand development, was not so high within the stand.
The number of large trees is a parameter used to
characterize old-growthness of forest stands. In
beech dominated forests of central Europe, Nilsson
et al. (2002) found a number of trees with a DBH
greater than 70 cm of about 30 stems per hectare.
This density of large trees has been found in the
Apennine beech forests by Piovesan et al. (2010) and
it is confirmed by our study. However, it is worth
noting that the occurrence of large trees in a stand is
very dependent on site conditions and forest history
and, as such, its use as old-growthness indicator
must be checked.
Forest genetics can play an important role for the
identification and characterization of old-growth
forests. In this study, genetic analysis has demon-
strated that the beech of Sasso Fratino belongs to a
glacial refugia of the northern Apennines and that
this population is the descendent of the rare
autochthonous ancestral beech population which
was present during the last glaciation.
Finally, although the Sasso Fratino beech-fir old-
growth stand cannot be taken as an exact ‘‘model’’
for managing other beech stands, nevertheless it can
provide some indication for forest management.
Specifically, our structural analysis pointed out that
the canopy gaps are relatively small and that there is a
spatial relationship between silver fir regeneration
and canopy gaps. Our findings confirm that forest
management for Apennine beech forest stands with
the object of favouring mixture with silver fir could
be based on a small group selection system opening
gaps5200 m2 in the upper forest canopy. But only
continuous monitoring of stand reaction to this type
of treatment will provide the basis for an adaptive
management approach suited to the evolution and
characters of each individual stand.
Acknowledgements
This work was funded by the Italian Ministry of
Education, University and Research within the
framework of the project PRIN2007 ‘‘Innovative
methods for the identification, characterization and
management of old-growth forests in the Mediterra-
nean environment’’ (National Coordinator: G. Chir-
ici). The authors wish to thank the National Forest
Service (Corpo Forestale dello Stato) for its support
in the fieldworks.
References
Albanesi E, Gugliotta OI, Mercurio I, Mercurio R. 2008. Effects
of gap size and within-gap position on seedlings establishment
in silver fir stands. iForest 1: 55–59 [online: Feb 2008 28].
Available: http://www.sisef.it/iforest/. Accessed Apr 2011 28.
Barbeito I, Pardos M, Calama R, Canellas I. 2008. Effect of stand
structure on Stone pine (Pinus pinea L.) regeneration
dynamics. Forestry 81: 617–629.
Besag JE. 1977. In: Ripley BD. 1977. Modelling spatial patterns
(with discussion). J R Stat Soc Ser B 39: 172–212.
Bianchi L, Bottacci A, Calamini G, Maltoni A, Mariotti B, Quilghini
G, et al. 2011. Structure and dynamics of a beech forest in a fully
protected area in the northern Apennines (Sasso Fratino, Italy).
iForest 4: 136–144 [online 2011-06-01]. Available: http://
www.sisef.it/iforest/show.php?id=564. Accessed July 2011 6.
Blasi C. 2010. Introduction. Plant Biosyst 144: 128–129.
Blasi C, Marchetti M, Chiavetta U, Aleffi M, Audisio P, Azzella
MM, et al. 2010. Multi-taxon and forest structure sampling for
identification of indicators and monitoring of old-growth
forest. Plant Biosyst 144: 160–170.
Bottacci A, editor. 2009. La Riserva Naturale Integrale di Sasso
Fratino: 1959–2009. 50 anni di conservazione della biodiversi-
ta. Corpo Forestale dello Stato, Ufficio territoriale per la
Biodiversita di Pratovecchio.
Brunialti G, Frati L, Aleffi M, Marignani M, Rosati L, Burrascano
S, et al. 2010. Lichens and bryophytes as indicators of old-
growth features in Mediterranean forests. Plant Biosyst 144:
221–233.
Burrascano S, Lombardi F, Marchetti M. 2008. Old-growth forest
structure and deadwood: Are they indicators of plant species
composition? A case study from central Italy. Plant Biosyst
142: 313–323.
Castellani C, Scrinzi G, Tabacchi G, Tosi V. 1984. Inventario
Forestale Nazionale Italiano (I.F.N.I.) Tavole di cubatura a
doppia entrata. Trento: Ministero dell’Agricoltura e delle
Foreste. Direzione Generale per l’Economia Montana e per le
Foreste. Istituto Sperimentale per l’Assestamento Forestale e
per l’Alpicoltura (I.S.A.F.A.).
Chirici G, Nocentini S. 2010. Old-growth forest in Italy: Recent
research developments and future perspectives. L’Italia Fore-
stale e Montana 65: 475–480.
Ciancio O, Iovino F, Menguzzato G, Mirabella A. 1985. L’abete
(Abies alba Mill.) in Calabria: possibilita e limiti di diffusione e
ridiffusione. Ann Ist Sper Selv XVI: 5–249.
Ciancio O, Iovino F, Menguzzato G, Nicolaci A, Veltri A. 2010.
Stand structure of a Calabrian pine old-growth forest:
Indications for forest management and landscape conservation.
L’Italia Forestale e Montana 5: 529–544.
Corona P, Blasi C, Chirici G, Facioni L, Fattorini L, Ferrari B.
2010. Monitoring and assessing old-growth forest stands by
plot sampling. Plant Biosyst 144: 171–179.
Di Paolo S, Giuliarelli D, Ferrari B, Barbati A, Corona P. 2010.
Support of multispectral very high resolution remotely sensed
imagery for old-growth beech forest detection. L’Italia Fore-
stale e Montana 5: 519–527.
FAO-FRA. 2010. Global forest resource assessment 2010. Main
Report. FAO Forestry Paper, 163. Rome: Food and Agricul-
ture Organization of the United Nation. Available: http://
www.fao.org/forestry/fra/fra2010/en/. Accessed Apr 2011 4.
Hofmann A. 1965. L’abieti-faggeto di Sasso Fratino ed i suoi
aspetti fitosociologici. Archivio Botanico e Biogeografico
Italiano. Tipografia Valbonesi, Forlı XLI: 1–15.
186 D. Travaglini et al.
Dow
nloa
ded
by [
Uni
vers
ita D
egli
Stud
i di F
iren
ze],
[D
avid
e T
rava
glin
i] a
t 02:
31 0
5 A
pril
2012

Hofmann A. 1985. La foresta vergine. L’Italia Forestale e
Montana XL: 317–336.
Holeksa J, Saniga M, Szwagrzyk J, Czerniak M, Staszynska K,
Kapusta P. 2009. A giant tree stand in the West Carpathians—
An exception or a relic of formerly widespread mountain
European forests? For Ecol Manage 257: 1577–1585.
Hunter ML. 1990. Wildlife, forests, and forestry: Principles of
managing forests for biological diversity. Englewood Cliffs:
Prentice Hall.
INFC. 2005. Inventario Nazionale delle Foreste e dei Serbatoi
Forestali di Carbonio. Ministero delle Politiche Agricole
Alimentari e Forestali, Ispettorato Generale – Corpo Forestale
dello Stato. CRA – Istituto Sperimentale per l’Assestamento
Forestale e per l’Alpicoltura.
Iovino F, Marziliano PA, Menguzzato G, Nicolaci A. 2010.
Strutture delle faggete vetuste del Cilento e del Pollino. L’Italia
Forestale e Montana 65: 657–678.
Koukoulas S, Blackburn GA. 2004. Quantifying the spatial
properties of forest canopy gaps using LIDAR imagery and
GIS. Int J Remote Sens 25: 3049–3071.
Kutsch WL, Wirth C, Kattge J, Nollert S, Herbst M, Kappen L.
2009. Chapter 4. Ecophysiological characteristics of mature
trees stands – Consequences for old-growth forest productivity.
In: Wirth C, Gleixner G, Heimann M, editors. Old-growth
forests, ecological studies. vol. 207. Berlin, Heidelberg:
Springer. pp. 57–79.
Kuuluvainen T, Penttinen A, Leinonen K, Nygren M. 1996.
Statistical opportunities for comparing stand structure hetero-
geneity in managed and primeval forest: An example from boreal
spruce forest in southern Finland. Silva Fennica 30: 315–328.
Latham PA, Zuuring HR, Coble DW. 1998. A method for
quantifying vertical forest structure. For Ecol Manage 104:
157–160.
Lombardi F, Chirici G, Marchetti M, Tognetti R, Lasserre B,
Corona P, et al. 2010. Deadwood in forest stands close to old-
growthness under Mediterranean conditions in the Italian
peninsula. L’Italia Forestale e Montana 65: 481–504.
Lotwick HW, Silverman BW. 1982. Methods for analysing spatial
processes of several types of points. J R Stat Soc Ser B 44: 406–
413.
Magri D. 1998. Quaternary history of Fagus in the Italian
peninsula. Ann Bot 61: 147–154.
Magri D, Vendramin GG, Comps B, Dupanloup I, Geburek T,
Gomory D, et al. 2006. A new scenario for the quaternary
history of European beech populations: Palaeobotanical
evidence and genetic consequences. New Phytol 171: 199–
221.
Manetti MC, Fabbio G, Giannini T, Gugliotta OI, Guidi G. 2010.
Old-growth forests: Report from the plots established by Aldo
Pavari. L’Italia Forestale e Montana 65: 751–764.
Manes F, Ricotta C, Salvatori E, Bajocco S, Blasi C. 2010. A
multiscale analysis of canopy structure in Fagus sylvatica L. and
Quercus cerris L. old-growth forests in the Cilento and Vallo di
Diano National Park. Plant Biosyst 144: 202–210.
Marchetti M, Blasi C. 2010. Old-growth forests in Italy: Towards
a first network. L’Italia Forestale e Montana 6: 679–698.
Marchetti M, Tognetti R, Lombardi F, Chiavetta U, Palumbo G,
Sellitto M, et al. 2010. Ecological portrayal of old-growth forests
and persistent woodlands in the Cilento and Vallo di Diano
National Park (southern Italy). Plant Biosyst 144: 130–147.
Massei M. 1981. Piano di Gestione Naturalistica della Riserva
Naturale Integrale di Sasso Fratino valevole per il decennio
1980–89. Ministero dell’Agricoltura e delle Foreste. Gestione
Ex Azienda di Stato per le Foreste Demaniali. Firenze: Centro
Stampa Pelagi. 90 pp.
Mosseler A, Major JE, Rajora OP. 2003. Old-growth red spruce
forests as reservoirs of genetic diversity and reproductive
fitness. Theor Appl Genet 106: 931–937.
Motta R. 2002. Old-growth forests and silviculture in the Italian
Alps: The case study of the strict reserve of Paneveggio (TN).
Plant Biosyst 136: 223–232.
Motta R, Berretti R, Borchi S, Bresciani A, Garbarino M, Trucchi
D. 2010. Stand structure and coarse woody debris profile of
«La Verna» forest (Arezzo, Italy). L’Italia Forestale e Montana
5: 591–605.
Motta R, Edouard JL. 2005. Stand structure and dynamics in a
mixed and multilayered forest in the Upper Susa Valley,
Piedmont, Italy. Can J For Res 35: 21–36.
Nilsson SG, Niklasson M, Heidin J, Aronsson G, Gutowski JM,
Linder P, et al. 2002. Densities of large and dead trees in old-
growth temperate and boreal forests. For Ecol Manage 161:
189–204.
Nocentini S. 2009. Structure and management of beech (Fagus
sylvatica L.) forests in Italy. iForest 2: 105–113 [Jun 2009 10].
Available: http://www.sisef.it/iforest/show.php?id¼499. Ac-
cessed Apr 2011 7.
Nocentini S. 2010. Old-growth forests in Italy: Inputs for forest
management and planning in areas with long-standing human
impact. L’Italia Forestale e Montana 5: 545–555.
Paci M, Ciampelli F. 1996. Risposta della vegetazione all’apertura
di gap nella Riserva Naturale Integrale di Sasso Fratino. Monti
e Boschi 2: 50–58.
Paci M, Salbitano F. 1998. The role of studies on vegetation
dynamics in undisturbed natural reserves towards the need of
knowledge for close-to-nature silvicultural treatments: The
case study of Natural Reserve of Sasso Fratino (Foreste
Casentinesi, northern-central Apennines). In: Morandini R,
Merlo M, Paivinnen R, editors. AISF-EFI international
conference on ‘‘Forest Management in Designated Conserva-
tion & Recreation Areas’’, 7–11 October 1998, Florence, Italy.
University of Padua Press. pp. 145–156.
Paffetti D, Vettori C, Caramelli D, Vernesi C, Lari M, Paganelli A,
et al. 2007. Unexpected presence of Fagus orientalis complex in
Italy as inferred from 45,000-year-old DNA pollen samples
from Venice lagoon. BMC Evol Biol 7: S6.
Palombo C, Lasen C, Scire M, Garfı V, Lombardi F, Tognetti R,
et al. 2010. Structural and dendrochronological characteriza-
tion of mountain pine persistent woodlands on the Monti del
Sole – Dolomiti Bellunesi National Park. L’Italia Forestale e
Montana 6: 737–749.
Petit RJ, Aguinagalde I, de Beaulieu J-L, Bittkau C, Brewer S,
Cheddadi R, et al. 2003. Glacial refugia: Hotspots but not melting
pots of genetic diversity. Science 300: 1563–1565.
Piovesan G, Alessandrini A, Baliva M, Chiti T, D’Andrea E, De
Cinti B, et al. 2010. Structural patterns, growth processes,
carbon stocks in an Italian network of old-growth beech forests.
L’Italia Forestale e Montana 65: 557–590.
Piovesan G, Di Filippo A, Alessandrini A, Biondi F, Schirone B.
2005. Structure, dynamics and dendroecology of an old-
growth Fagus forest in the Apennines. J Veg Sci 16: 13–28.
Potenza G, Fascetti S. 2010. Lobarion as indicator of ancient
forest in the Appennino Lucano (Basilicata – southern Italy).
L’Italia Forestale e Montana 6: 765–774.
Pretzsch H. 2010. Forest dynamics, growth and yield. From
measurement to model. New York: Springer. 664 pp.
Ravera S, Genovesi V, Falasca A, Marchetti M, Chirici G. 2010.
Lichen diversity of old-growth forests in Molise (central–
southern Italy). L’Italia Forestale e Montana 5: 505–517.
Ripley BD. 1977. Modelling spatial patterns (with discussion). J R
Stat Soc Ser B 39: 172–212.
Sabatini FM, Burrascano S, Blasi C. 2010. Niche heterogeneity
and old-growth forests conservation value. L’Italia Forestale e
Montana 5: 621–636.
Sansone A. 1915. Relazione sull’Azienda del demanio forestale
dello Stato (1.7.1910–30.6.1914). Min Agric Ind E Comm
Roma: 61–97.
Old-growth beech-fir forest in Italy 187
Dow
nloa
ded
by [
Uni
vers
ita D
egli
Stud
i di F
iren
ze],
[D
avid
e T
rava
glin
i] a
t 02:
31 0
5 A
pril
2012
Stoyan D, Stoyan H. 1994. Fractals, random shapes and point
fields. Method of geometrical statistics. Chichester: John Wiley
& Sons.
Vettori C, Paffetti D, Ciani L, Giannini R. 2010. Fonte Novello
old-growth forest. L’Italia Forestale e Montana 5: 637–651.
Vettori C, Vendramin GG, Anzidei M, Pastorelli R, Paffetti D,
Giannini R. 2004. Geographic distribution of chloroplast
variation in Italian populations of beech (Fagus sylvatica L.).
Theor Appl Genet 109: 1–9.
Vrska T, Adam D, Hort L, Kolar T, Janık D. 2009. European
beech (Fagus sylvatica L.) and silver fir (Abies alba Mill.)
rotation in the Carpathians—A developmental cycle or a linear
trend induced by man? For Ecol Manage 258: 347–356.
Weising K, Gardner RC. 1999. A set of conserved PCR primers
for the analysis of simple sequence repeat polymorphisms in
chloroplast genomes of dicotyledonous angiosperms. Genome
42: 9–19.
Wiagand T, Moloney A. 2004. Rings, circles, and null model for
point pattern analysis in ecology. Oikos 104: 209–229.
Wiegand T, Kissling WD, Cipriotti PA, Aguiar MR. 2006.
Extending point pattern analysis for object of finite size and
irregular shape. J Ecol 94: 825–837.
Wirth C, Gleixner G, Heimann M, editors. 2009. Old-growth
forests. Function, fate and value. ecological studies, vol. 207.
Berlin, Heidelberg: Springer. 512 pp.
188 D. Travaglini et al.
Dow
nloa
ded
by [
Uni
vers
ita D
egli
Stud
i di F
iren
ze],
[D
avid
e T
rava
glin
i] a
t 02:
31 0
5 A
pril
2012
Related Documents