Journal of Alloys and Compounds 509 (2011) 1716–1721 Contents lists available at ScienceDirect Journal of Alloys and Compounds journal homepage: www.elsevier.com/locate/jallcom Characterization of zinc oxide nanoparticles synthesized by polymer assisted deposition method R.C. Pawar, J.S. Shaikh, P.S. Shewale, P.S. Patil ∗ Thin Films Materials Laboratory, Department of Physics, Shivaji University, Kolhapur 416004, India article info Article history: Received 2 January 2010 Received in revised form 4 October 2010 Accepted 6 October 2010 Available online 14 October 2010 Keywords: Zinc oxide nanoparticles Polymer assisted deposition TritonX100 abstract Zinc oxide nanoparticles (ZNPs) are synthesized onto glass substrates by employing simple and low cost solution based modified polymer assisted deposition (PAD) method. Trionx100 is used as a capping agent and zinc acetate as the zinc source. TritonX100 concentration is varied from 0.02 to 0.45 M for the synthesis of pure ZnO NPs. TG–DTA analysis was employed to determine the decomposition temperature of TritonX100 and zinc acetate, which lead to the formation of ZnO. The films were further characterized by powder X-ray diffraction (XRD), scanning electron microscopy (SEM) and high-resolution transmission electron microscope (HR-TEM), Fourier transforms infrared spectroscopy (FT-IR) and room temperature photoluminescence (PL). The results indicate that the synthesized nanoparticles (NPs) exhibits the room temperature PL with two emission peaks, one corresponding to ZnO band edge emission and the other one to point defect states created due to oxygen deficiency. The first peak undergoes blue-shift due to change in NPs size while there is no shift in the second peak. Nevertheless, with increase in TritonX100 concentration the peak intensity of defect peak decreases, indicating that the highly pure NPs have been successfully synthesized by PAD method. © 2010 Elsevier B.V. All rights reserved. 1. Introduction Recently, the studies on use of polymers to synthesize metal- oxide based NPs of controlled size have gain momentum. Polymers enable active binding of metal ions present in the precursor that inhibit grain growth and hence facilitates production of NPs. Quan- tum size effects are observed in the particles, and the energy gap between the conduction and valence bands exhibits a blue-shift with decrease in particle size. Semiconductor particles that are in the nanometer size regime have attracted significant atten- tion because of their atom-like size dependent properties [1]. The crystallization inorganic material in the presence of polymers has been efficient method to obtain composite materials. Two differ- ent aspects are combined; first, polymers can act as template and second is polymer controlled crystallization. Among the various nanomaterials ZnO, with direct wide band gap energy of 3.37 eV and a large exciton binding energy (60 meV), has become one of the most important functional materials with unique properties of near-ultraviolet emission, optical transparency, electric conduc- tivity and piezoelectricity [2,3]. These ZNPs have new exciting properties and wide technological applications such as photo- catalysis, chemical remediation, photoinitiation of polymerization reactions, quantum dot devices and solar energy conversion. Fur- ∗ Corresponding author. Tel.: +91 231 2609229; fax: +91 231 2691533. E-mail address: psp [email protected] (P.S. Patil). thermore, it is well known that low-dimensional structures may have superior optical properties over bulk material due to the quantum confinement effect. These days, the focus is moving on to the synthesis of ZnO nanostructures. The techniques used for synthesizing ZnO nanostructures mainly include templated growth [4], patterned catalytic growth [5], substrates-induced vapor deposition [6], solution-phase deposition [7], electrochemi- cal route [8] and chemical reaction [9]. These methods require high temperature, expensive substrates, high cost, tedious procedures, sophisticated equipments and rigorous experimental conditions, which can be called ‘noble’ methods. Hence it is necessary to find out a simple and low cost method to synthesize ZnO nanostruc- tures to tackle the problems. In view of this, we followed a simple, inexpensive, environmentally benign, solution-based method with some modification to produce NPs without templates and catalysts [10]. In the present work we report the synthesis of ZNPs by PAD method. TritonX100 is used as a capping agent. Films are prepared by drop-casting the TX and zinc acetate prepared solution on to glass substrates and annealed at 400 ◦ C for 5 h in air. Annealed films are used for further characterizations. 2. Experimental The ZNPs synthesized in this work are deposited onto glass substrates using the following procedure. The 0.1 M zinc acetate dihydrate was added into 4 ml deionized water at room temperature. Subsequently, 0.02 M polyethylene glycol- p-isooctylphenyl ether [TritonX100, TX] was added into the solution and 1 ml of 0925-8388/$ – see front matter © 2010 Elsevier B.V. All rights reserved. doi:10.1016/j.jallcom.2010.10.019

Welcome message from author
This document is posted to help you gain knowledge. Please leave a comment to let me know what you think about it! Share it to your friends and learn new things together.
Transcript
Cd
RT
a
ARRAA
KZPT
1
oeitbwitcbesnatotpcr
0d
Journal of Alloys and Compounds 509 (2011) 1716–1721
Contents lists available at ScienceDirect
Journal of Alloys and Compounds
journa l homepage: www.e lsev ier .com/ locate / ja l l com
haracterization of zinc oxide nanoparticles synthesized by polymer assistedeposition method
.C. Pawar, J.S. Shaikh, P.S. Shewale, P.S. Patil ∗
hin Films Materials Laboratory, Department of Physics, Shivaji University, Kolhapur 416004, India
r t i c l e i n f o
rticle history:eceived 2 January 2010eceived in revised form 4 October 2010ccepted 6 October 2010vailable online 14 October 2010
eywords:
a b s t r a c t
Zinc oxide nanoparticles (ZNPs) are synthesized onto glass substrates by employing simple and lowcost solution based modified polymer assisted deposition (PAD) method. Trionx100 is used as a cappingagent and zinc acetate as the zinc source. TritonX100 concentration is varied from 0.02 to 0.45 M for thesynthesis of pure ZnO NPs. TG–DTA analysis was employed to determine the decomposition temperatureof TritonX100 and zinc acetate, which lead to the formation of ZnO. The films were further characterizedby powder X-ray diffraction (XRD), scanning electron microscopy (SEM) and high-resolution transmission
inc oxide nanoparticlesolymer assisted depositionritonX100
electron microscope (HR-TEM), Fourier transforms infrared spectroscopy (FT-IR) and room temperaturephotoluminescence (PL). The results indicate that the synthesized nanoparticles (NPs) exhibits the roomtemperature PL with two emission peaks, one corresponding to ZnO band edge emission and the otherone to point defect states created due to oxygen deficiency. The first peak undergoes blue-shift due tochange in NPs size while there is no shift in the second peak. Nevertheless, with increase in TritonX100
tensiby PA
concentration the peak insuccessfully synthesized
. Introduction
Recently, the studies on use of polymers to synthesize metal-xide based NPs of controlled size have gain momentum. Polymersnable active binding of metal ions present in the precursor thatnhibit grain growth and hence facilitates production of NPs. Quan-um size effects are observed in the particles, and the energy gapetween the conduction and valence bands exhibits a blue-shiftith decrease in particle size. Semiconductor particles that are
n the nanometer size regime have attracted significant atten-ion because of their atom-like size dependent properties [1]. Therystallization inorganic material in the presence of polymers haseen efficient method to obtain composite materials. Two differ-nt aspects are combined; first, polymers can act as template andecond is polymer controlled crystallization. Among the variousanomaterials ZnO, with direct wide band gap energy of 3.37 eVnd a large exciton binding energy (60 meV), has become one ofhe most important functional materials with unique propertiesf near-ultraviolet emission, optical transparency, electric conduc-
ivity and piezoelectricity [2,3]. These ZNPs have new excitingroperties and wide technological applications such as photo-atalysis, chemical remediation, photoinitiation of polymerizationeactions, quantum dot devices and solar energy conversion. Fur-∗ Corresponding author. Tel.: +91 231 2609229; fax: +91 231 2691533.E-mail address: psp [email protected] (P.S. Patil).
925-8388/$ – see front matter © 2010 Elsevier B.V. All rights reserved.oi:10.1016/j.jallcom.2010.10.019
ty of defect peak decreases, indicating that the highly pure NPs have beenD method.
© 2010 Elsevier B.V. All rights reserved.
thermore, it is well known that low-dimensional structures mayhave superior optical properties over bulk material due to thequantum confinement effect. These days, the focus is movingon to the synthesis of ZnO nanostructures. The techniques usedfor synthesizing ZnO nanostructures mainly include templatedgrowth [4], patterned catalytic growth [5], substrates-inducedvapor deposition [6], solution-phase deposition [7], electrochemi-cal route [8] and chemical reaction [9]. These methods require hightemperature, expensive substrates, high cost, tedious procedures,sophisticated equipments and rigorous experimental conditions,which can be called ‘noble’ methods. Hence it is necessary to findout a simple and low cost method to synthesize ZnO nanostruc-tures to tackle the problems. In view of this, we followed a simple,inexpensive, environmentally benign, solution-based method withsome modification to produce NPs without templates and catalysts[10].
In the present work we report the synthesis of ZNPs by PADmethod. TritonX100 is used as a capping agent. Films are preparedby drop-casting the TX and zinc acetate prepared solution on toglass substrates and annealed at 400 ◦C for 5 h in air. Annealed filmsare used for further characterizations.
2. Experimental
The ZNPs synthesized in this work are deposited onto glass substrates usingthe following procedure. The 0.1 M zinc acetate dihydrate was added into 4 mldeionized water at room temperature. Subsequently, 0.02 M polyethylene glycol-p-isooctylphenyl ether [TritonX100, TX] was added into the solution and 1 ml of
R.C. Pawar et al. / Journal of Alloys and Compounds 509 (2011) 1716–1721 1717
100080060040020000
20
40
60
80
100a
b
Temp( 0C)
Temp( 0C)
Wt(
%)
Wt(
%)
-0.4
-0.2
0.0
0.2
0.4
IV
III
II
I
100080060040020000
20
40
60
80
100
-0.4
-0.2
0.0
0.2
0.4
Tem
p D
ifference( 0C
/mg
)T
emp
Differen
ce( 0C/m
g)
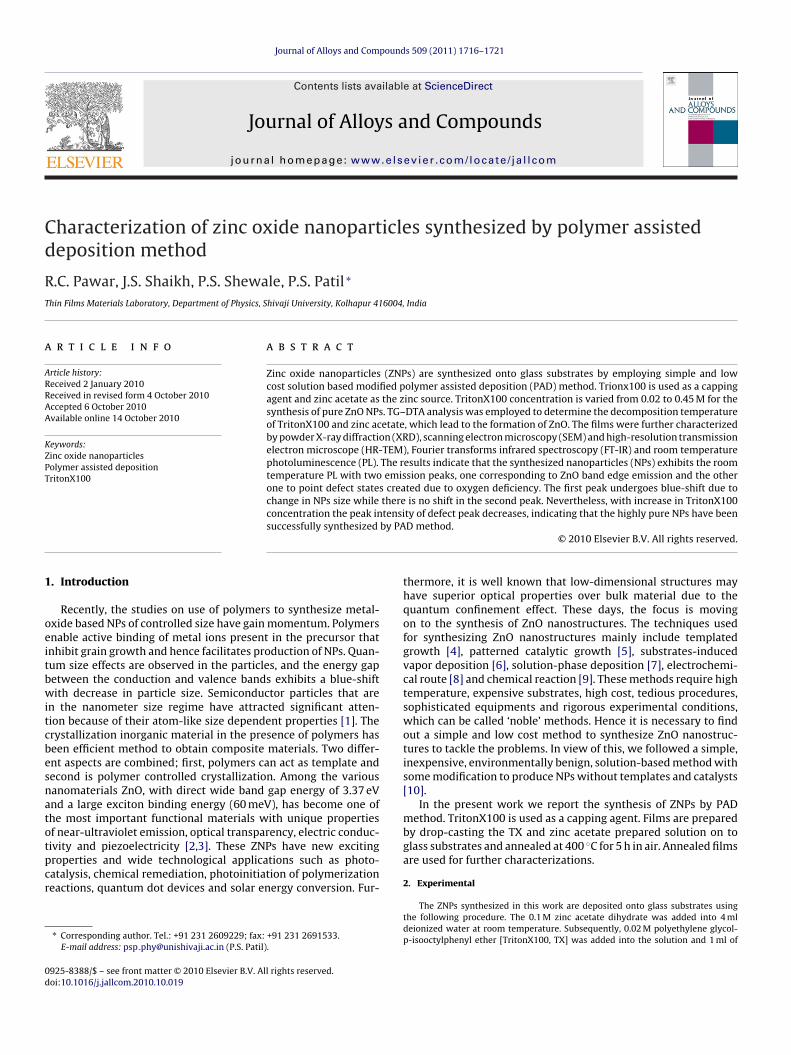
Fig. 1. (a) TG–DTA curves for studying decomposition behavior of zinc acetate dihy-drate [Zn(CH3COO)2·2H2O] and (b) mixture of zinc acetate and TritonX100 in airatmosphere.
agsaZ
cNof(oTaTuTcbwS
2 · 2H
+ 2H
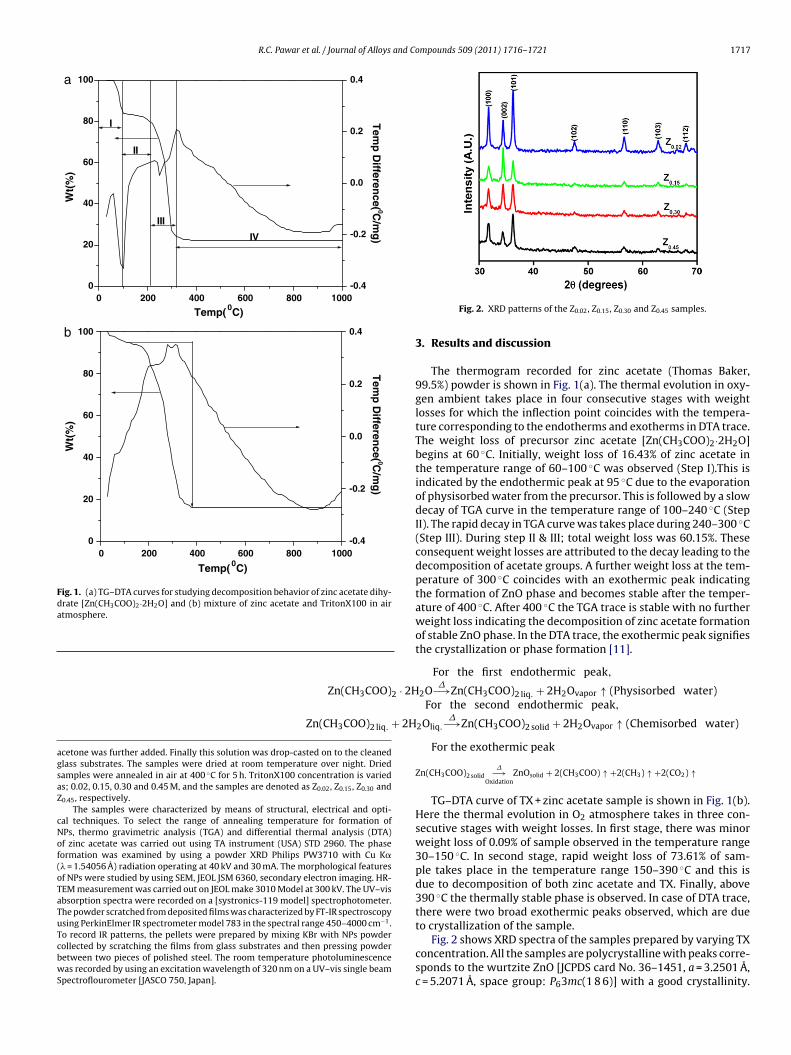
to crystallization of the sample.Fig. 2 shows XRD spectra of the samples prepared by varying TX
concentration. All the samples are polycrystalline with peaks corre-
cetone was further added. Finally this solution was drop-casted on to the cleanedlass substrates. The samples were dried at room temperature over night. Driedamples were annealed in air at 400 ◦C for 5 h. TritonX100 concentration is varieds; 0.02, 0.15, 0.30 and 0.45 M, and the samples are denoted as Z0.02, Z0.15, Z0.30 and0.45, respectively.
The samples were characterized by means of structural, electrical and opti-al techniques. To select the range of annealing temperature for formation ofPs, thermo gravimetric analysis (TGA) and differential thermal analysis (DTA)f zinc acetate was carried out using TA instrument (USA) STD 2960. The phaseormation was examined by using a powder XRD Philips PW3710 with Cu K�� = 1.54056 A) radiation operating at 40 kV and 30 mA. The morphological featuresf NPs were studied by using SEM, JEOL JSM 6360, secondary electron imaging. HR-EM measurement was carried out on JEOL make 3010 Model at 300 kV. The UV–visbsorption spectra were recorded on a [systronics-119 model] spectrophotometer.he powder scratched from deposited films was characterized by FT-IR spectroscopysing PerkinElmer IR spectrometer model 783 in the spectral range 450–4000 cm−1.o record IR patterns, the pellets were prepared by mixing KBr with NPs powderollected by scratching the films from glass substrates and then pressing powderetween two pieces of polished steel. The room temperature photoluminescence
Zn(CH3COO)
Zn(CH3COO)2 liq.
as recorded by using an excitation wavelength of 320 nm on a UV–vis single beampectroflourometer [JASCO 750, Japan].
Fig. 2. XRD patterns of the Z0.02, Z0.15, Z0.30 and Z0.45 samples.
3. Results and discussion
The thermogram recorded for zinc acetate (Thomas Baker,99.5%) powder is shown in Fig. 1(a). The thermal evolution in oxy-gen ambient takes place in four consecutive stages with weightlosses for which the inflection point coincides with the tempera-ture corresponding to the endotherms and exotherms in DTA trace.The weight loss of precursor zinc acetate [Zn(CH3COO)2·2H2O]begins at 60 ◦C. Initially, weight loss of 16.43% of zinc acetate inthe temperature range of 60–100 ◦C was observed (Step I).This isindicated by the endothermic peak at 95 ◦C due to the evaporationof physisorbed water from the precursor. This is followed by a slowdecay of TGA curve in the temperature range of 100–240 ◦C (StepII). The rapid decay in TGA curve was takes place during 240–300 ◦C(Step III). During step II & III; total weight loss was 60.15%. Theseconsequent weight losses are attributed to the decay leading to thedecomposition of acetate groups. A further weight loss at the tem-perature of 300 ◦C coincides with an exothermic peak indicatingthe formation of ZnO phase and becomes stable after the temper-ature of 400 ◦C. After 400 ◦C the TGA trace is stable with no furtherweight loss indicating the decomposition of zinc acetate formationof stable ZnO phase. In the DTA trace, the exothermic peak signifiesthe crystallization or phase formation [11].
For the first endothermic peak,
2O�−→Zn(CH3COO)2 liq. + 2H2Ovapor ↑ (Physisorbed water)
For the second endothermic peak,
2Oliq.�−→Zn(CH3COO)2 solid + 2H2Ovapor ↑ (Chemisorbed water)
For the exothermic peak
Zn(CH3COO)2 solid�−→
OxidationZnOsolid + 2(CH3COO) ↑ +2(CH3) ↑ +2(CO2) ↑
TG–DTA curve of TX + zinc acetate sample is shown in Fig. 1(b).Here the thermal evolution in O2 atmosphere takes in three con-secutive stages with weight losses. In first stage, there was minorweight loss of 0.09% of sample observed in the temperature range30–150 ◦C. In second stage, rapid weight loss of 73.61% of sam-ple takes place in the temperature range 150–390 ◦C and this isdue to decomposition of both zinc acetate and TX. Finally, above390 ◦C the thermally stable phase is observed. In case of DTA trace,there were two broad exothermic peaks observed, which are due
sponds to the wurtzite ZnO [JCPDS card No. 36–1451, a = 3.2501 A,c = 5.2071 A, space group: P63mc(1 8 6)] with a good crystallinity.
1718 R.C. Pawar et al. / Journal of Alloys and Compounds 509 (2011) 1716–1721
record
NoS
t
womcts(b
m
TT
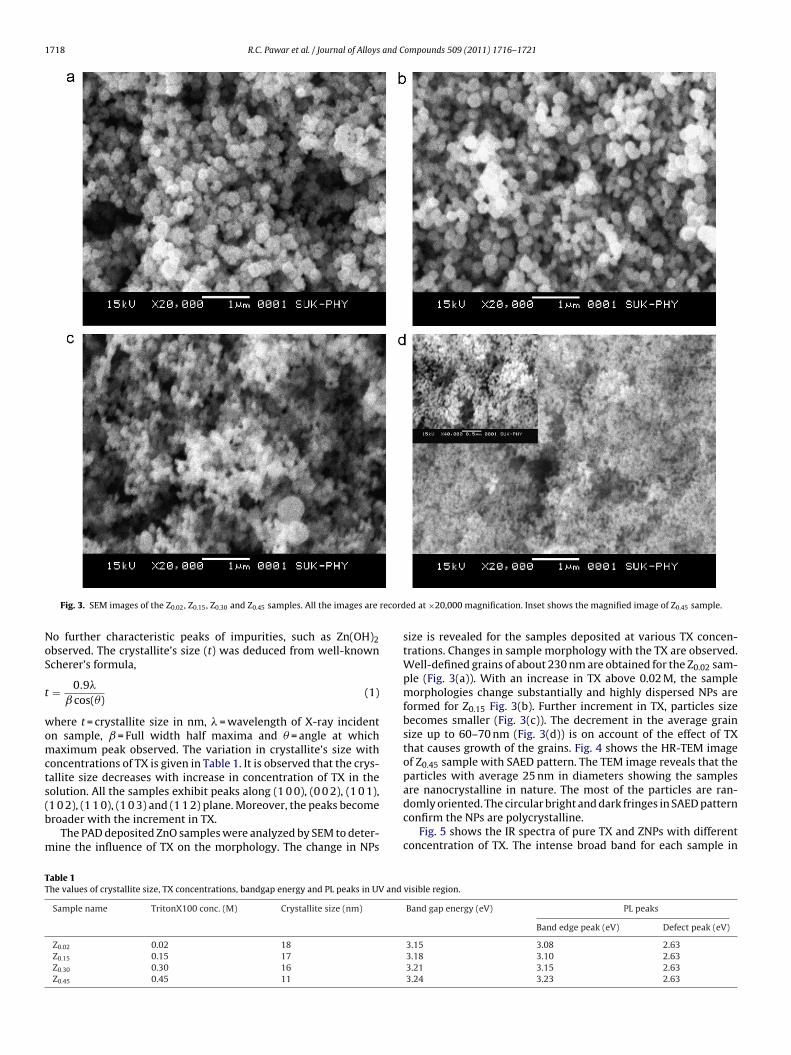
Fig. 3. SEM images of the Z0.02, Z0.15, Z0.30 and Z0.45 samples. All the images are
o further characteristic peaks of impurities, such as Zn(OH)2bserved. The crystallite’s size (t) was deduced from well-knowncherer’s formula,
= 0.9�
ˇ cos(�)(1)
here t = crystallite size in nm, � = wavelength of X-ray incidentn sample, ˇ = Full width half maxima and � = angle at whichaximum peak observed. The variation in crystallite’s size with
oncentrations of TX is given in Table 1. It is observed that the crys-allite size decreases with increase in concentration of TX in the
olution. All the samples exhibit peaks along (1 0 0), (0 0 2), (1 0 1),1 0 2), (1 1 0), (1 0 3) and (1 1 2) plane. Moreover, the peaks becomeroader with the increment in TX.The PAD deposited ZnO samples were analyzed by SEM to deter-ine the influence of TX on the morphology. The change in NPs
able 1he values of crystallite size, TX concentrations, bandgap energy and PL peaks in UV and
Sample name TritonX100 conc. (M) Crystallite size (nm)
Z0.02 0.02 18Z0.15 0.15 17Z0.30 0.30 16Z0.45 0.45 11
ed at ×20,000 magnification. Inset shows the magnified image of Z0.45 sample.
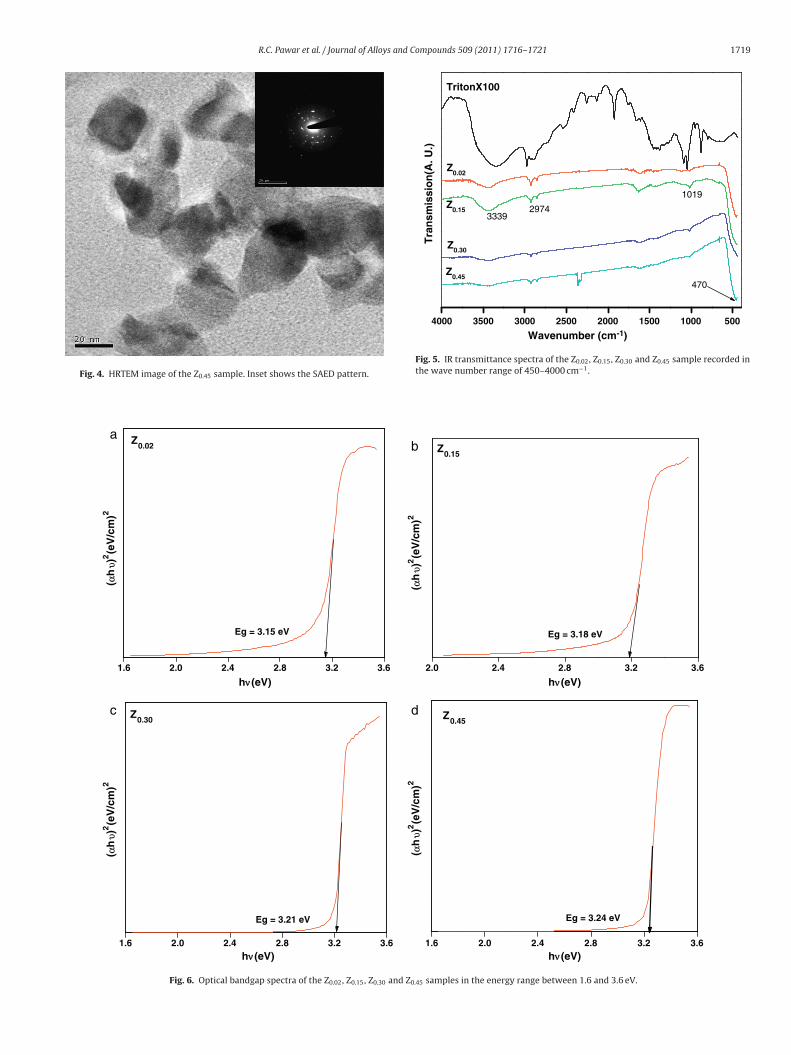
size is revealed for the samples deposited at various TX concen-trations. Changes in sample morphology with the TX are observed.Well-defined grains of about 230 nm are obtained for the Z0.02 sam-ple (Fig. 3(a)). With an increase in TX above 0.02 M, the samplemorphologies change substantially and highly dispersed NPs areformed for Z0.15 Fig. 3(b). Further increment in TX, particles sizebecomes smaller (Fig. 3(c)). The decrement in the average grainsize up to 60–70 nm (Fig. 3(d)) is on account of the effect of TXthat causes growth of the grains. Fig. 4 shows the HR-TEM imageof Z0.45 sample with SAED pattern. The TEM image reveals that theparticles with average 25 nm in diameters showing the samples
are nanocrystalline in nature. The most of the particles are ran-domly oriented. The circular bright and dark fringes in SAED patternconfirm the NPs are polycrystalline.Fig. 5 shows the IR spectra of pure TX and ZNPs with differentconcentration of TX. The intense broad band for each sample in
visible region.
Band gap energy (eV) PL peaks
Band edge peak (eV) Defect peak (eV)
3.15 3.08 2.633.18 3.10 2.633.21 3.15 2.633.24 3.23 2.63
R.C. Pawar et al. / Journal of Alloys and Compounds 509 (2011) 1716–1721 1719
Fig. 4. HRTEM image of the Z0.45 sample. Inset shows the SAED pattern.
5001000150020002500300035004000
1019
29743339
470
TritonX100
Z0.02
Z0.15
Z0.30
Z0.45
Tra
nsm
issi
on
(A. U
.)
Wavenumber (cm-1)
Fig. 5. IR transmittance spectra of the Z0.02, Z0.15, Z0.30 and Z0.45 sample recorded inthe wave number range of 450–4000 cm−1.
3.63.22.82.42.01.6
hν ν (eV) hν ν (eV)
hν ν (eV)hν ν (eV)
Za
c d
b0.02
Eg = 3.15 eV
3.63.22.82.42.0
Z0.15
Eg = 3.18 eV
3.63.22.82.42.01.6
Z0.45
Eg = 3.24 eV
3.63.22.82.42.01.6
( αh
υ)2(e
V/c
m)2
( αh
υ)2(e
V/c
m)2
( αh
υ)2(e
V/c
m)2
( αh
υ)2(e
V/c
m)2
Z0.30
Eg = 3.21 eV
Fig. 6. Optical bandgap spectra of the Z0.02, Z0.15, Z0.30 and Z0.45 samples in the energy range between 1.6 and 3.6 eV.
1 and Compounds 509 (2011) 1716–1721
tnsTpswrZo
ttto1fZpTfdHdw[(
tprQmmb
E2
]−
wboTbmgmstsco
ZveblciiietIo
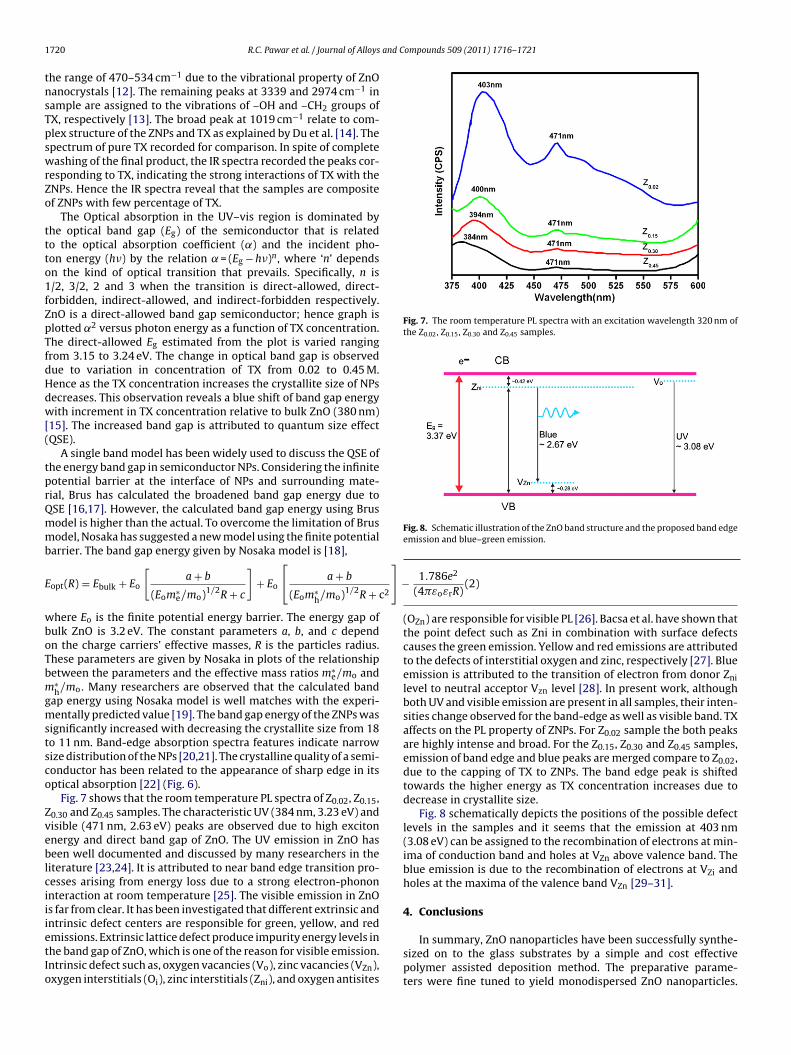
Fig. 7. The room temperature PL spectra with an excitation wavelength 320 nm ofthe Z0.02, Z0.15, Z0.30 and Z0.45 samples.
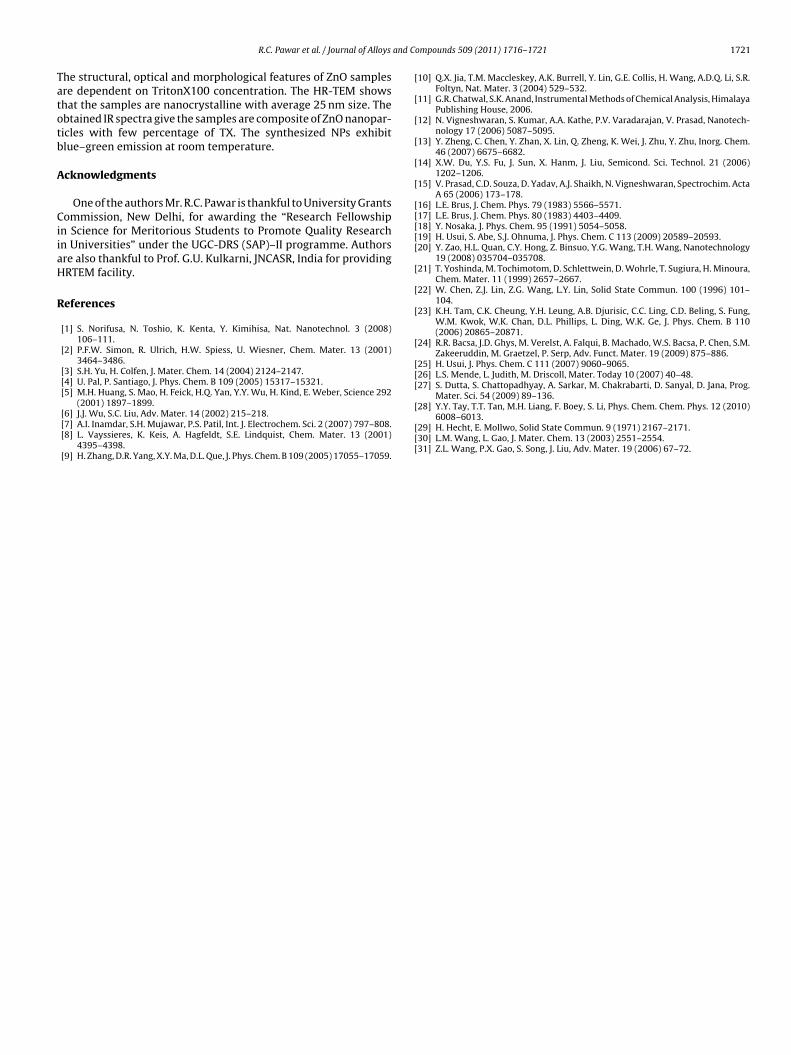
Fig. 8. Schematic illustration of the ZnO band structure and the proposed band edge
720 R.C. Pawar et al. / Journal of Alloys
he range of 470–534 cm−1 due to the vibrational property of ZnOanocrystals [12]. The remaining peaks at 3339 and 2974 cm−1 inample are assigned to the vibrations of –OH and –CH2 groups ofX, respectively [13]. The broad peak at 1019 cm−1 relate to com-lex structure of the ZNPs and TX as explained by Du et al. [14]. Thepectrum of pure TX recorded for comparison. In spite of completeashing of the final product, the IR spectra recorded the peaks cor-
esponding to TX, indicating the strong interactions of TX with theNPs. Hence the IR spectra reveal that the samples are compositef ZNPs with few percentage of TX.
The Optical absorption in the UV–vis region is dominated byhe optical band gap (Eg) of the semiconductor that is relatedo the optical absorption coefficient (˛) and the incident pho-on energy (h�) by the relation ˛ = (Eg − h�)n, where ‘n’ dependsn the kind of optical transition that prevails. Specifically, n is/2, 3/2, 2 and 3 when the transition is direct-allowed, direct-orbidden, indirect-allowed, and indirect-forbidden respectively.nO is a direct-allowed band gap semiconductor; hence graph islotted ˛2 versus photon energy as a function of TX concentration.he direct-allowed Eg estimated from the plot is varied rangingrom 3.15 to 3.24 eV. The change in optical band gap is observedue to variation in concentration of TX from 0.02 to 0.45 M.ence as the TX concentration increases the crystallite size of NPsecreases. This observation reveals a blue shift of band gap energyith increment in TX concentration relative to bulk ZnO (380 nm)
15]. The increased band gap is attributed to quantum size effectQSE).
A single band model has been widely used to discuss the QSE ofhe energy band gap in semiconductor NPs. Considering the infiniteotential barrier at the interface of NPs and surrounding mate-ial, Brus has calculated the broadened band gap energy due toSE [16,17]. However, the calculated band gap energy using Brusodel is higher than the actual. To overcome the limitation of Brusodel, Nosaka has suggested a new model using the finite potential
arrier. The band gap energy given by Nosaka model is [18],
opt(R) = Ebulk + Eo
[a + b
(Eom∗e/mo)1/2R + c
]+ Eo
[a + b
(Eom∗h/mo)1/2R + c
here Eo is the finite potential energy barrier. The energy gap ofulk ZnO is 3.2 eV. The constant parameters a, b, and c dependn the charge carriers’ effective masses, R is the particles radius.hese parameters are given by Nosaka in plots of the relationshipetween the parameters and the effective mass ratios m∗
e/mo and∗h/mo. Many researchers are observed that the calculated band
ap energy using Nosaka model is well matches with the experi-entally predicted value [19]. The band gap energy of the ZNPs was
ignificantly increased with decreasing the crystallite size from 18o 11 nm. Band-edge absorption spectra features indicate narrowize distribution of the NPs [20,21]. The crystalline quality of a semi-onductor has been related to the appearance of sharp edge in itsptical absorption [22] (Fig. 6).
Fig. 7 shows that the room temperature PL spectra of Z0.02, Z0.15,0.30 and Z0.45 samples. The characteristic UV (384 nm, 3.23 eV) andisible (471 nm, 2.63 eV) peaks are observed due to high excitonnergy and direct band gap of ZnO. The UV emission in ZnO haseen well documented and discussed by many researchers in the
iterature [23,24]. It is attributed to near band edge transition pro-esses arising from energy loss due to a strong electron-phononnteraction at room temperature [25]. The visible emission in ZnOs far from clear. It has been investigated that different extrinsic and
ntrinsic defect centers are responsible for green, yellow, and redmissions. Extrinsic lattice defect produce impurity energy levels inhe band gap of ZnO, which is one of the reason for visible emission.ntrinsic defect such as, oxygen vacancies (Vo), zinc vacancies (VZn),xygen interstitials (Oi), zinc interstitials (Zni), and oxygen antisites1.786e2
(4�εoεrR)(2)
emission and blue–green emission.
(OZn) are responsible for visible PL [26]. Bacsa et al. have shown thatthe point defect such as Zni in combination with surface defectscauses the green emission. Yellow and red emissions are attributedto the defects of interstitial oxygen and zinc, respectively [27]. Blueemission is attributed to the transition of electron from donor Znilevel to neutral acceptor Vzn level [28]. In present work, althoughboth UV and visible emission are present in all samples, their inten-sities change observed for the band-edge as well as visible band. TXaffects on the PL property of ZNPs. For Z0.02 sample the both peaksare highly intense and broad. For the Z0.15, Z0.30 and Z0.45 samples,emission of band edge and blue peaks are merged compare to Z0.02,due to the capping of TX to ZNPs. The band edge peak is shiftedtowards the higher energy as TX concentration increases due todecrease in crystallite size.
Fig. 8 schematically depicts the positions of the possible defectlevels in the samples and it seems that the emission at 403 nm(3.08 eV) can be assigned to the recombination of electrons at min-ima of conduction band and holes at VZn above valence band. Theblue emission is due to the recombination of electrons at VZi andholes at the maxima of the valence band VZn [29–31].
4. Conclusions
In summary, ZnO nanoparticles have been successfully synthe-sized on to the glass substrates by a simple and cost effectivepolymer assisted deposition method. The preparative parame-ters were fine tuned to yield monodispersed ZnO nanoparticles.
and C
Tatotb
A
CiiaH
R
[
[
[
[
[
[
[[[[[
[
[
[
[
[[[
Mater. Sci. 54 (2009) 89–136.
R.C. Pawar et al. / Journal of Alloys
he structural, optical and morphological features of ZnO samplesre dependent on TritonX100 concentration. The HR-TEM showshat the samples are nanocrystalline with average 25 nm size. Thebtained IR spectra give the samples are composite of ZnO nanopar-icles with few percentage of TX. The synthesized NPs exhibitlue–green emission at room temperature.
cknowledgments
One of the authors Mr. R.C. Pawar is thankful to University Grantsommission, New Delhi, for awarding the “Research Fellowship
n Science for Meritorious Students to Promote Quality Researchn Universities” under the UGC-DRS (SAP)–II programme. Authorsre also thankful to Prof. G.U. Kulkarni, JNCASR, India for providingRTEM facility.
eferences
[1] S. Norifusa, N. Toshio, K. Kenta, Y. Kimihisa, Nat. Nanotechnol. 3 (2008)106–111.
[2] P.F.W. Simon, R. Ulrich, H.W. Spiess, U. Wiesner, Chem. Mater. 13 (2001)3464–3486.
[3] S.H. Yu, H. Colfen, J. Mater. Chem. 14 (2004) 2124–2147.[4] U. Pal, P. Santiago, J. Phys. Chem. B 109 (2005) 15317–15321.[5] M.H. Huang, S. Mao, H. Feick, H.Q. Yan, Y.Y. Wu, H. Kind, E. Weber, Science 292
(2001) 1897–1899.[6] J.J. Wu, S.C. Liu, Adv. Mater. 14 (2002) 215–218.[7] A.I. Inamdar, S.H. Mujawar, P.S. Patil, Int. J. Electrochem. Sci. 2 (2007) 797–808.[8] L. Vayssieres, K. Keis, A. Hagfeldt, S.E. Lindquist, Chem. Mater. 13 (2001)
4395–4398.[9] H. Zhang, D.R. Yang, X.Y. Ma, D.L. Que, J. Phys. Chem. B 109 (2005) 17055–17059.
[
[[[
ompounds 509 (2011) 1716–1721 1721
10] Q.X. Jia, T.M. Maccleskey, A.K. Burrell, Y. Lin, G.E. Collis, H. Wang, A.D.Q. Li, S.R.Foltyn, Nat. Mater. 3 (2004) 529–532.
11] G.R. Chatwal, S.K. Anand, Instrumental Methods of Chemical Analysis, HimalayaPublishing House, 2006.
12] N. Vigneshwaran, S. Kumar, A.A. Kathe, P.V. Varadarajan, V. Prasad, Nanotech-nology 17 (2006) 5087–5095.
13] Y. Zheng, C. Chen, Y. Zhan, X. Lin, Q. Zheng, K. Wei, J. Zhu, Y. Zhu, Inorg. Chem.46 (2007) 6675–6682.
14] X.W. Du, Y.S. Fu, J. Sun, X. Hanm, J. Liu, Semicond. Sci. Technol. 21 (2006)1202–1206.
15] V. Prasad, C.D. Souza, D. Yadav, A.J. Shaikh, N. Vigneshwaran, Spectrochim. ActaA 65 (2006) 173–178.
16] L.E. Brus, J. Chem. Phys. 79 (1983) 5566–5571.17] L.E. Brus, J. Chem. Phys. 80 (1983) 4403–4409.18] Y. Nosaka, J. Phys. Chem. 95 (1991) 5054–5058.19] H. Usui, S. Abe, S.J. Ohnuma, J. Phys. Chem. C 113 (2009) 20589–20593.20] Y. Zao, H.L. Quan, C.Y. Hong, Z. Binsuo, Y.G. Wang, T.H. Wang, Nanotechnology
19 (2008) 035704–035708.21] T. Yoshinda, M. Tochimotom, D. Schlettwein, D. Wohrle, T. Sugiura, H. Minoura,
Chem. Mater. 11 (1999) 2657–2667.22] W. Chen, Z.J. Lin, Z.G. Wang, L.Y. Lin, Solid State Commun. 100 (1996) 101–
104.23] K.H. Tam, C.K. Cheung, Y.H. Leung, A.B. Djurisic, C.C. Ling, C.D. Beling, S. Fung,
W.M. Kwok, W.K. Chan, D.L. Phillips, L. Ding, W.K. Ge, J. Phys. Chem. B 110(2006) 20865–20871.
24] R.R. Bacsa, J.D. Ghys, M. Verelst, A. Falqui, B. Machado, W.S. Bacsa, P. Chen, S.M.Zakeeruddin, M. Graetzel, P. Serp, Adv. Funct. Mater. 19 (2009) 875–886.
25] H. Usui, J. Phys. Chem. C 111 (2007) 9060–9065.26] L.S. Mende, L. Judith, M. Driscoll, Mater. Today 10 (2007) 40–48.27] S. Dutta, S. Chattopadhyay, A. Sarkar, M. Chakrabarti, D. Sanyal, D. Jana, Prog.
28] Y.Y. Tay, T.T. Tan, M.H. Liang, F. Boey, S. Li, Phys. Chem. Chem. Phys. 12 (2010)6008–6013.
29] H. Hecht, E. Mollwo, Solid State Commun. 9 (1971) 2167–2171.30] L.M. Wang, L. Gao, J. Mater. Chem. 13 (2003) 2551–2554.31] Z.L. Wang, P.X. Gao, S. Song, J. Liu, Adv. Mater. 19 (2006) 67–72.
Related Documents