Characterization of uranium-contaminated sediments from beneath a nuclear waste storage tank from Hanford, Washington: Implications for contaminant transport and fate Wooyong Um a, * , Jonathan P. Icenhower a , Christopher F. Brown a , R. Jeffery Serne a , Zheming Wang a , Cleveland J. Dodge a,b , Arokiasamy J. Francis b a Pacific Northwest National Laboratory, P7-22, Richland, WA 99354, USA b Brookhaven National Laboratory, Upton, NY 11973-5000, USA Received 23 July 2009; accepted in revised form 11 November 2009; available online 17 November 2009 Abstract The concentration and distribution of uranium (U) in sediment samples from three boreholes recovered near radioactive waste storage tanks at Hanford, Washington, USA, were determined in detail using bulk and micro-analytical techniques. The source of contamination was a plume that contained an estimated 7000 kg of dissolved U that seeped into the subsurface as a result of an accident that occurred during filling of tank BX-102. The desorption character and kinetics of U were also deter- mined by experiment in order to assess the mobility of U in the vadose zone. Most samples contained too little moisture to obtain quantitative information on pore water compositions. Concentrations of U (and contaminant phosphate—P) in pore waters were therefore estimated by performing 1:1 sediment-to-water extractions and the data indicated concentrations of these elements were above that of uncontaminated “background” sediments. Further extraction of U by 8 N nitric acid indi- cated that a significant fraction of the total U is relatively immobile and may be sequestered in mobilization-resistant phases. Fine- and coarse-grained samples in sharp contact with one another were sub-sampled for further scrutiny and identification of U reservoirs. Segregation of the samples into their constituent size fractions coupled with microwave-assisted digestion of bulk samples showed that most of the U contamination was sequestered within the fine-grained fraction. Isotope exchange ( 233 U) tests revealed that 51% to 63% of the U is labile, indicating that the remaining fund of U is locked up in mobiliza- tion-resistant phases. Analysis by Micro-X-ray Fluorescence and Micro-X-ray Absorption Near-Edge Spectroscopy (l-XRF and l-XANES) showed that U is primarily associated with Ca and is predominately U(VI). The spectra obtained on U- enriched “hot spots” using Time-Resolved Laser-Induced Fluorescence Spectroscopy (TRLIFS) provide strong evidence for uranophane-type [Ca(UO 2 ) 2 (SiO 3 OH) 2 (H 2 O) 5 ] and uranyl phosphate [Ca(UO 2 ) 2 (PO 4 ) 2 (H 2 O) 10–12 ] phases. These data show that disseminated micro-precipitates can form in narrow pore spaces within the finer-grained matrix and that these objects are likely not restricted to lithic fragment environments. Uranium mobility may therefore be curtailed by precipitation of uranyl silicate and phosphate phases, with additional possible influence exerted by capillary barriers. Consequently, equi- librium-based desorption models that predict the concentrations and mobility of U in the subsurface matrix at Hanford are unnecessarily conservative. Published by Elsevier Ltd. 1. INTRODUCTION Models for the subsurface transport of contaminant ura- nium (U) depend, in part, on a lucid grasp of the complex biogeochemical processes attending reactions between aqueous solution and the matrix solids. Equilibrium-based 0016-7037/$ - see front matter Published by Elsevier Ltd. doi:10.1016/j.gca.2009.11.014 * Corresponding author. Tel.: +1 509 376 4627. E-mail address: [email protected] (W. Um). www.elsevier.com/locate/gca Available online at www.sciencedirect.com Geochimica et Cosmochimica Acta 74 (2010) 1363–1380

Welcome message from author
This document is posted to help you gain knowledge. Please leave a comment to let me know what you think about it! Share it to your friends and learn new things together.
Transcript

Available online at www.sciencedirect.com
www.elsevier.com/locate/gca
Geochimica et Cosmochimica Acta 74 (2010) 1363–1380
Characterization of uranium-contaminated sedimentsfrom beneath a nuclear waste storage tank from Hanford,
Washington: Implications for contaminant transport and fate
Wooyong Um a,*, Jonathan P. Icenhower a, Christopher F. Brown a, R. Jeffery Serne a,Zheming Wang a, Cleveland J. Dodge a,b, Arokiasamy J. Francis b
a Pacific Northwest National Laboratory, P7-22, Richland, WA 99354, USAb Brookhaven National Laboratory, Upton, NY 11973-5000, USA
Received 23 July 2009; accepted in revised form 11 November 2009; available online 17 November 2009
Abstract
The concentration and distribution of uranium (U) in sediment samples from three boreholes recovered near radioactivewaste storage tanks at Hanford, Washington, USA, were determined in detail using bulk and micro-analytical techniques. Thesource of contamination was a plume that contained an estimated 7000 kg of dissolved U that seeped into the subsurface as aresult of an accident that occurred during filling of tank BX-102. The desorption character and kinetics of U were also deter-mined by experiment in order to assess the mobility of U in the vadose zone. Most samples contained too little moisture toobtain quantitative information on pore water compositions. Concentrations of U (and contaminant phosphate—P) in porewaters were therefore estimated by performing 1:1 sediment-to-water extractions and the data indicated concentrations ofthese elements were above that of uncontaminated “background” sediments. Further extraction of U by 8 N nitric acid indi-cated that a significant fraction of the total U is relatively immobile and may be sequestered in mobilization-resistant phases.Fine- and coarse-grained samples in sharp contact with one another were sub-sampled for further scrutiny and identificationof U reservoirs. Segregation of the samples into their constituent size fractions coupled with microwave-assisted digestion ofbulk samples showed that most of the U contamination was sequestered within the fine-grained fraction. Isotope exchange(233U) tests revealed that �51% to 63% of the U is labile, indicating that the remaining fund of U is locked up in mobiliza-tion-resistant phases. Analysis by Micro-X-ray Fluorescence and Micro-X-ray Absorption Near-Edge Spectroscopy (l-XRFand l-XANES) showed that U is primarily associated with Ca and is predominately U(VI). The spectra obtained on U-enriched “hot spots” using Time-Resolved Laser-Induced Fluorescence Spectroscopy (TRLIFS) provide strong evidencefor uranophane-type [Ca(UO2)2(SiO3OH)2(H2O)5] and uranyl phosphate [Ca(UO2)2(PO4)2(H2O)10–12] phases. These datashow that disseminated micro-precipitates can form in narrow pore spaces within the finer-grained matrix and that theseobjects are likely not restricted to lithic fragment environments. Uranium mobility may therefore be curtailed by precipitationof uranyl silicate and phosphate phases, with additional possible influence exerted by capillary barriers. Consequently, equi-librium-based desorption models that predict the concentrations and mobility of U in the subsurface matrix at Hanford areunnecessarily conservative.Published by Elsevier Ltd.
0016-7037/$ - see front matter Published by Elsevier Ltd.
doi:10.1016/j.gca.2009.11.014
* Corresponding author. Tel.: +1 509 376 4627.E-mail address: [email protected] (W. Um).
1. INTRODUCTION
Models for the subsurface transport of contaminant ura-nium (U) depend, in part, on a lucid grasp of the complexbiogeochemical processes attending reactions betweenaqueous solution and the matrix solids. Equilibrium-based

1364 W. Um et al. / Geochimica et Cosmochimica Acta 74 (2010) 1363–1380
models are now sufficiently refined that they can accuratelymodel the sorption and desorption of U in the subsurface,and some of these integrated models may be relevant toother sites with gross mineralogical, hydrological, and geo-chemical attributes. For example, the investigations con-ducted at the Naturita Site, Colorado (Curtis et al., 2004,2006; Davis et al., 2004, 2006), have resulted in the con-struction of a flexible and sophisticated sorption model thatmay have application to other uranium-contaminatedareas, such as the Hanford Site, Washington State. Onthe other hand, both equilibrium and kinetic mechanismscan contribute to the retardation of U migration as porefluids percolate from the hydraulically unsaturated zoneto the water table. There is an awareness reflected in the lit-erature that an a priori prediction of which process or pro-cesses will dominate at a particular site is not possible, andthat the geochemical factors that affect U migration mustbe unraveled at each site. For example, Payne and Airy(2006) concluded on the basis of �20 years’ investigationat the Koongarra uranium deposit (Northern Australia)that a comprehensive, global model for U transport couldnot be validated, but the data could be used to inform gen-eral model abstractions. Therefore, a primary objective instudying the migration of U in the subsurface is to ascertainwhether or not a refined equilibrium-based model can accu-rately predict uranium mobility or whether a more complexset of kinetic reactions demands modification of the model.
In this investigation, we begin with an overview of theequilibrium- and kinetic-based models that have been usedto describe the distribution of U in the subsurface, and howthese models may be applied to the contaminated sedimentsat the Hanford Site.
1.1. Equilibrium descriptions of uranium fate in the
subsurface
In oxidizing environments, such as the vadose zone atHanford, U is expected to be relatively mobile (Zacharaet al., 2005, 2007) and some part of its retardation behavioris thought to be based on reversible sorption onto mineralsurfaces. Sorption of U on a variety of mineral surfaceshas been extensively studied in the literature (Hsi and Lang-muir, 1985; Waite et al., 1994; Pabalan and Turner, 1996;Prikryl et al., 2001; Davis et al., 2006) and the partitioningof uranium between aqueous solution and solid substratesis quantified by the distribution coefficient, or KD:
KD ¼ U concentration on the mineral surface=
U concentration in solutionðmL=gÞ ð1Þ
In practice, the KD is an empirical parameter that ismeasured experimentally on relevant sediment samples atthe conditions of interest. One limitation of the KD ap-proach is that partitioning changes as the aqueous solutionevolves chemically through space and time, as pointed out,for example, by Kohler et al. (2004). The dependence of KD
values on solution geochemistry has been noted by manyinvestigators (e.g., Kalmykov and Choppin, 2000; Curtiset al., 2004). It is now well known that values of U KD
are strongly a function of pH and carbonate concentration;from acidic to neutral pH values, the KD varies by five
orders of magnitude (Davis et al., 2004; Curtis et al.,2006). Thus, the nature of KD values, in the sense of a fixedvalue parameter, render them suspect for describing thelong-term mobility of uranium in the subsurface.
On the other hand, a number of investigators (e.g., Da-vis et al., 2004; Um et al., 2007) have proposed SurfaceComplexation Models (SCMs) that take into account vari-ations in the geochemistry of the aqueous solution (pH,concentration of dissolved carbonate, activity of Ca2+, thepresence of competing ions, etc.) and changes at the mineralsurface (number and identity of reactive surface species, therelative amounts of edge versus basal planes in phyllosili-cates, etc.). These models have been used to accurately pre-dict the mobility of uranium at the Naturita Site, Colorado(Curtis et al., 2004, 2006; Davis et al., 2004, 2006), whichshares some gross characteristics with the Hanford Site,including a semi-arid climate, a quartzo-feldspathic domi-nated sediment, and a carbonate-saturated pore watercomposition.
1.2. Non-equilibrium distribution of uranium in the
subsurface
Attainment of equilibrium among uranium, the solu-tion, and mineral surfaces may not be the dominant controlon U mobility in the subsurface. For example, Qafoku et al.(2005) conducted water saturated column experiments oncontaminated Hanford sediments in order to trace the re-lease of U over time. Steady-state concentrations in theeffluent would be the expectation if U mobility was gov-erned by equilibrium partitioning, but even after one hun-dred pore volumes of solution were coursed through thesediment, concentrations of U never attained steady-statevalues. These results are indicative of kinetic, and not equi-librium, control of U release. Upon closer scrutiny of thesediments a number of investigators (Catalano et al.,2004; Liu et al., 2004, 2006; McKinley et al., 2006) discov-ered that uranium is precipitated in narrow crevasses infeldspar grains that are part of granitic lithic fragments thatmake up �4% of the Hanford sediments. This result is sur-prising because concentrations of U in bulk pore water arebelow saturation with respect to oxidized uranium (uranyl)minerals. These investigators attributed the presence of ura-nium micro-precipitates to diffusion of uranyl cations(UO2
2þ) into isolated void spaces, which in combinationwith dissolved silica from feldspar precipitate to form ura-nyl silicate minerals. Re-mobilization is hindered by theslow dissolution kinetics of uranyl solids and the sluggishtransport of U from the site of detachment to bulk porefluid (Liu et al., 2004; McKinley et al., 2006; Ilton et al.,2008). If these results turn out to be characteristic of thebehavior of U in the sediments, an equilibrium-based KD
model will fail to accurately predict the mobility of uraniumat the Hanford Site.
1.3. Uranium contamination at the Hanford Site
Atomic weapons production at the Hanford Site (Fig. 1)facilities required irradiation of vast quantities of uraniumdioxide (UO2) to yield 239Pu, the desired fissile element

Fig. 1. Physiographic map of Washington with a generalized map of the Hanford (top) and the BX Tank Farm location in the 200E area(bottom). Tanks with shading are known or suspected to have leaked. Geophysical well logs are shown in red, the new boreholes in thisinvestigation are shown in blue, and the location of older push holes, including E33-41 and E33-45, are shown in black. (For interpretation ofthe references to color in this figure legend, the reader is referred to the web version of this article.)
Uranium-contaminated sediments from Hanford, Washington, USA 1365
involved in a nuclear chain reaction. Various methods forextracting plutonium from the UO2 matrix resulted inindustrial-scale quantities of aqueous solutions containinghigh concentrations of U, activation and fission products,and minor non-radioactive metals. The liquid and solidwaste is currently stored in 177 underground single- anddouble-shell steel tanks that are grouped into different areasaround the Hanford Site known as “Tank Farms” andthese are subdivided into Waste Management Areas(WMA’s) (Brown et al., 2007a,b; Zachara et al., 2007).To date, a large number (68 out of 149) of the single-shelltanks are known or are suspected to have leaked high-levelwaste into the sediments beneath the tanks farms. One of
the largest accidental releases occurred in 1951 in the 241-BX-Tank Farm. The 12 tanks in this WMA are locatedin 200 East (Fig. 1), which was one of the principal sitesof activated UO2 fuel rod reprocessing that included thebismuth–phosphate separation technique. The accident re-sulted during “sequential filling” of the connected tankswhen a waste transfer pipe exiting from tank BX-102 be-came occluded. As a result, hydrostatic pressure built upuntil a disconnected ancillary port ruptured causing releaseof nearly 3.5 � 105 L of highly radioactive waste to the sub-surface (Jones et al., 2001). The neutralized bismuth–phos-phate processed waste that escaped contained more than7000 kg of uranium and 37 kg of phosphorous (P). An

1366 W. Um et al. / Geochimica et Cosmochimica Acta 74 (2010) 1363–1380
estimate of the chemical composition of the material fromtank BX-102 is given in Zachara et al. (2007). Other leaksare also likely to have occurred among tanks and associatedtransfer lines and diversion boxes, but the amount of re-leased U is currently unknown (Serne et al., 2002).
A number of investigations have been conducted toascertain the extent of the pollution migration from thisspill, the potential sinks of U, and the mechanisms contrib-uting to the mobility of radionuclide elements (e.g., Cata-lano et al., 2004; Liu et al., 2004; McKinley et al., 2006;Zachara et al., 2007; Stubbs et al., 2009; Um et al., 2009).The concern engendered by this and other leaks is thatplumes containing radionuclide elements will likely reachthe Columbia River, a major surface water resource inthe Pacific Northwest. Recent laboratory studies of Han-ford sediments extracted from boreholes have highlightedthe resistance of the contaminant uranium to mobilization(Qafoku et al., 2005), and a variety of spectroscopic meth-ods have identified uranyl silicate minerals, especially thoseof the uranophane and boltwoodite groups, as the primarysinks for uranium (Catalano et al., 2004; Liu et al., 2004,2006; McKinley et al., 2006). Note, however, that thesestudies focused on sediments recovered from boreholeE33-45, and the sediments from this investigation wererecovered from three new boreholes (C5134, C5132, andC5124) that are more distal to E33-45 and tap shallowerlithologic units (Fig. 1). A purpose of this study is to deter-mine if the conclusions reached for U distribution andsequestration in sediments from borehole E33-45 applyequally well to shallower portions of sediments affectedby this spill, or if other mechanisms, notably sorption, ex-erts a dominant control on uranium mobility.
In order to answer this question, the principal sinks of Umust be identified and the mechanisms that result in releaseof U to pore water solutions must be fully understood.Potentially, both equilibrium (reversible adsorption to min-eral surfaces, precipitation of discrete uranium minerals,partitioning of U into a host phase) and disequilibrium (dis-solution/precipitation kinetics, limited diffusive transport ofsoluble U through narrow interstices in the soil matrix) pro-cesses can occur, and it is likely that one will dominate theother. Therefore, before a predictive model can be appliedto the uranium contamination problem at the Hanford Site,the geochemical factors affecting U mobility must be deter-mined. We seek to uncover the mineralogical, physical, andchemical controls on U transport by scrutinizing sedimentcore samples recovered proximate to the BX-102 tank atthe Hanford Site. We employed a set of analytical tech-niques to characterize the mineralogy, particle-size distribu-tion, and extent of contamination of the affected Hanfordsediments. Concentrations of U and P in pore waters werecalculated using a water extraction technique. We then con-ducted several tests (acid and carbonate–bicarbonateextraction, and 233U isotope exchange) to determine thequantity of U that is easily mobilized and that which isimmobile. This latter reservoir of U was examined by avariety of techniques, including synchrotron-based X-rayAbsorption Spectroscopy (XAS) and Micro-X-ray Fluores-cence (l-XRF), and Time-Resolved Laser-Induced Fluores-cence Spectroscopy (TRLIFS) to identify the phase or
phases that harbor uranium. The results presented belowshow that the immobile uranium is sequestered in U(VI) sil-icates and phosphates, the latter of which have not beenpreviously reported at the Hanford Site. Further, the resultspoint towards an association between fine-grained materialin “capillary boundaries” and uranium contamination thathas not previously been identified.
1.4. Geology and sedimentary characteristics
The 241-BX Tank Farms were constructed within thePleistocene Hanford formation and Holocene eolian depos-its that mantle the giant Cold Creek flood bar (Wood et al.,2000). The geology beneath the BX WMA has been thesubject of numerous reports, including those by Price andFecht (1976), Caggiano (1996), Narbutovskih (1998), andWood et al. (2000). Sediments overlying basalt bedrockconsist of predominantly Ice Age flood deposits of the Han-ford formation. Local erosional remnants of the ColdCreek unit (formerly referred to as the Plio-Pleistoceneunit) and/or the Ringold Formation lie between the Han-ford formation and the basalt. The upper 10.7 m (35 ft) ofthe Hanford formation was removed during constructionof the tank farms and the stockpiled sediments were laterused as backfill around the underground storage tanks(Wood et al., 2000). A simple stratigraphic cross-sectionis shown in Fig. 2, while the terminology used for the BXWMA is summarized in Table 1.
The mineralogy of the sediments is dominated by quartzand feldspar and the fine-grained fraction contains a varietyof phyllosilicates, mainly clays. Minor phases includeamphibole (mainly hornblende), opaque phases, and biotitein various weathered states. Lithic fragments, comprisedmainly of “granitic” (sensu lato) and basaltic clasts, makeup a sizeable portion (up to 10%) of various strata. Aremarkable feature of the sediments is the variation in grainsize distributions over a small lateral or vertical scale.Although well-developed grading is manifested in manyrecovered core samples or exposed outcroppings, it is notunusual to find cobbles or even boulders interspersed withfiner sediments. The variation in sediment size distributionand grading is a reflection of the range of current velocitiesthat were in existence during flooding. In all cases, the boul-ders, cobbles, and pebbles that make up the coarser fractionare well-rounded, indicating protracted transport. In addi-tion, there are numerous fine-grained stringers or lenticularbodies of sediment distributed throughout a coarser-grained matrix. These fine-grained bodies may exert animportant influence on the mobility of uranium, as dis-cussed below.
1.5. Sampling strategy and relationship to previous work
Sediments from three new boreholes were recovered andare the subject of this investigation. A concise description ofthe equipment used to obtain borehole sediments using the“direct-push” method can be found in McKinley et al.(2007). At least two individual specimens from differentdepths were retrieved from each borehole and, in addition,a grab sample (described below) was also taken from

Fig. 2. Generalized, composite stratigraphy for the Late Cenozoic Sediments in the vicinity of the BX WMA (modified after Wood et al.,2000).
Table 1Simplified stratigraphic description of lithologic units at Hanford, Washington.
Stratigraphicsymbol
Formation Facies/subunit
Description Genesis
Holocene/fill NA Backfill Poorly sorted cobbles, pebbles, and coarse tomedium sand with some silt
Anthropogenic
H1 Hanfordformation
Unit H1 An upper gravel sequence consisting of high-energy, gravel-dominated facies interbedded withlenticular and discontinuous layers of sand-dominated facies
Cataclysmic flood deposits
H2 Unit H2 Sand sequence consisting predominantly of sand-dominated facies, with multiple graded beds ofplane to foreset-bedded sand or gravelly sand,which sometimes grade upward to silty sand or silt
CCU Cold Creek unit(formerly Plio-Pleistocene unit)
Silt facies Silt sequence consisting of interstratified wellsorted calcareous silt and fine sand
Fluvial overbank and/oreolian deposits (with someweakly developed paleosols)
CCU and/orRingoldFormation
Sandy gravelto gravellysand facies
Sandy gravel to gravelly sand sequence consistingpredominantly of unconsolidated basaltic sandsand gravels
Pre-Pleistocene alluvium
Uranium-contaminated sediments from Hanford, Washington, USA 1367
borehole C5132 (Table 2). One laboratory duplicate samplewas collected during core opening (borehole C5132) and is
designated by the nomenclature DUP. Additionally, sampleB1JWW6C from push hole C5134 was split into two
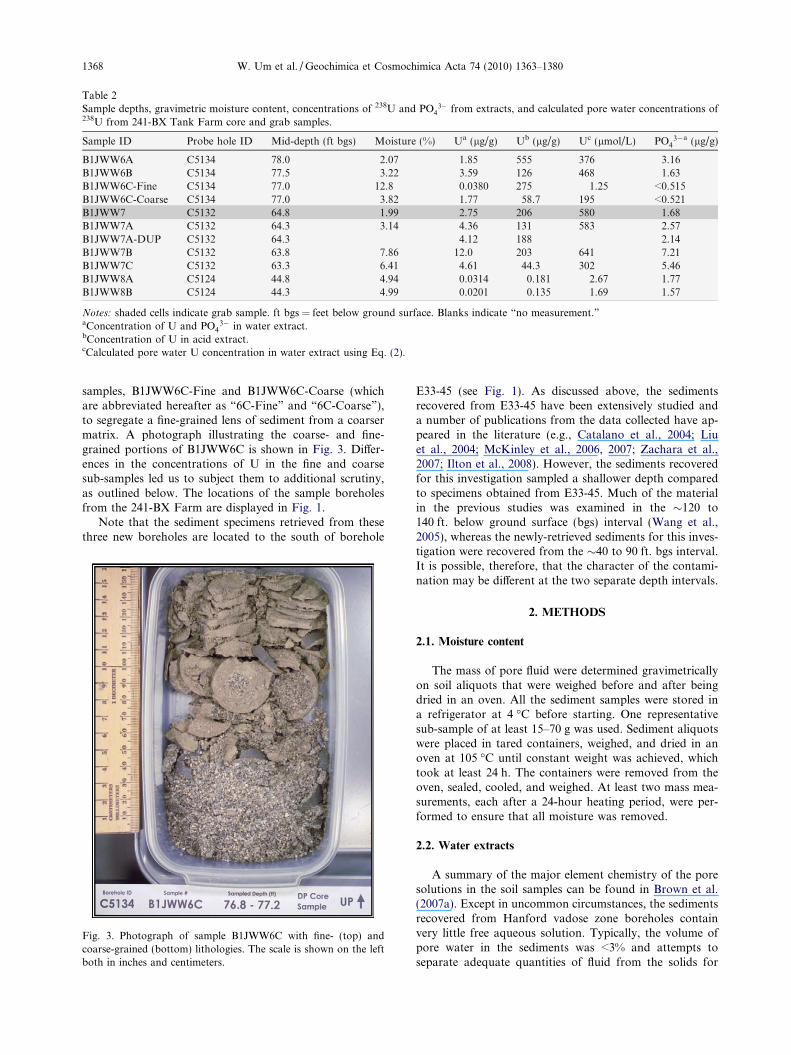
Table 2Sample depths, gravimetric moisture content, concentrations of 238U and PO4
3� from extracts, and calculated pore water concentrations of238U from 241-BX Tank Farm core and grab samples.
Notes: shaded cells indicate grab sample. ft bgs = feet below ground surface. Blanks indicate “no measurement.”aConcentration of U and PO4
3� in water extract.bConcentration of U in acid extract.cCalculated pore water U concentration in water extract using Eq. (2).
1368 W. Um et al. / Geochimica et Cosmochimica Acta 74 (2010) 1363–1380
samples, B1JWW6C-Fine and B1JWW6C-Coarse (whichare abbreviated hereafter as “6C-Fine” and “6C-Coarse”),to segregate a fine-grained lens of sediment from a coarsermatrix. A photograph illustrating the coarse- and fine-grained portions of B1JWW6C is shown in Fig. 3. Differ-ences in the concentrations of U in the fine and coarsesub-samples led us to subject them to additional scrutiny,as outlined below. The locations of the sample boreholesfrom the 241-BX Farm are displayed in Fig. 1.
Note that the sediment specimens retrieved from thesethree new boreholes are located to the south of borehole
Fig. 3. Photograph of sample B1JWW6C with fine- (top) andcoarse-grained (bottom) lithologies. The scale is shown on the leftboth in inches and centimeters.
E33-45 (see Fig. 1). As discussed above, the sedimentsrecovered from E33-45 have been extensively studied anda number of publications from the data collected have ap-peared in the literature (e.g., Catalano et al., 2004; Liuet al., 2004; McKinley et al., 2006, 2007; Zachara et al.,2007; Ilton et al., 2008). However, the sediments recoveredfor this investigation sampled a shallower depth comparedto specimens obtained from E33-45. Much of the materialin the previous studies was examined in the �120 to140 ft. below ground surface (bgs) interval (Wang et al.,2005), whereas the newly-retrieved sediments for this inves-tigation were recovered from the �40 to 90 ft. bgs interval.It is possible, therefore, that the character of the contami-nation may be different at the two separate depth intervals.
2. METHODS
2.1. Moisture content
The mass of pore fluid were determined gravimetricallyon soil aliquots that were weighed before and after beingdried in an oven. All the sediment samples were stored ina refrigerator at 4 �C before starting. One representativesub-sample of at least 15–70 g was used. Sediment aliquotswere placed in tared containers, weighed, and dried in anoven at 105 �C until constant weight was achieved, whichtook at least 24 h. The containers were removed from theoven, sealed, cooled, and weighed. At least two mass mea-surements, each after a 24-hour heating period, were per-formed to ensure that all moisture was removed.
2.2. Water extracts
A summary of the major element chemistry of the poresolutions in the soil samples can be found in Brown et al.(2007a). Except in uncommon circumstances, the sedimentsrecovered from Hanford vadose zone boreholes containvery little free aqueous solution. Typically, the volume ofpore water in the sediments was <3% and attempts toseparate adequate quantities of fluid from the solids for

Uranium-contaminated sediments from Hanford, Washington, USA 1369
analysis using ultracentrifugation (UFA) proved unsuccess-ful. In response to the relatively dry nature of the speci-mens, we carried out 1:1 water-to-sediment extractions inorder to estimate the concentration of U solution in thepore water using simple mass balance considerations:
½M �Uext � V ext ¼ ½M �Upw � V pw ð2Þ
where ½M �Uext, ½MUpw�, Vext, and Vpw represent the concentra-
tion of U (mol/L) in the extract, the concentration of U inpore water (mol/L), the volume of the water extract (L),and the volume of the pore water (L), respectively. The porewater concentration of dissolved P was calculated in thesame fashion. The extracts were prepared by adding an ex-act weight of de-ionized water (DIW) to approximately60–80 g of sediment sub-sampled from each liner or driveshoe grab sample. The weight of DIW needed was calculatedbased on the weight of the field-moist samples and their pre-viously determined moisture contents. The sum of the exist-ing moisture (pore water) and the DIW was fixed at the massof the dry sediment. An appropriate amount of DIW wasadded to screw cap jars containing the sediment samples.The jars were sealed and briefly shaken by hand, then placedon a mechanical orbital shaker for 1 h. The samples were al-lowed to settle, generally overnight, until the supernatant li-quid was clear. The procedure assumes that only dilution ofpore water took place during extraction and that only minoramounts of dissolution of the solid matrix occurred whencontacted by DIW. The supernatant was carefully decanted,filtered, and analyzed for uranium.
Concentrations of 238U and P were determined using aninductively coupled plasma-mass spectrometer (ICP-MS)(PerkinElmer) using PNNL procedures based on EPAMethod 6020 (EPA, 2000a) using high-purity calibrationstandards to generate calibration curves and verify contin-uing calibration during the analytical run. Multiple dilu-tions of each 1:1 water extract were prepared andanalyzed to investigate and correct for matrix interferences.
2.3. Acid extraction
Water extract tests performed over an interval of timeindicated that concentrations of U in contact solutionsfailed to reach steady-state conditions, indicating that asource of uranium is present in the sediments that reactedslowly. We hypothesized that some of this U was seques-tered in phases that were resistant to release into pore water.Accordingly, additional tests were conducted on sedimentsto ascertain the amount of recalcitrant U in the sample.Approximately 20 g of oven-dried sediment was contactedwith 8 M nitric acid at a ratio of approximately 5 parts acidto 1 part sediment. The slurries were heated to about 80 �Cfor several hours, after which the fluid was separated by fil-tration through 0.45-lm membranes. The acid extracts wereanalyzed for 238U using ICP-MS. The acid digestion proce-dure is based on EPA Method 3050B (EPA, 2000b).
2.4. Particle-size distribution and surface area measurement
The dry sieving method was used to determine the par-ticle-size distribution for selected bulk sediment samples
(6C-Fine and 6C-Coarse). The method is based on the pro-cedure described in Standard Test Method for Particle-Size
Analysis of Soils (ASTM, 1986). The silt/clay(<0.0625 mm), very fine sand (0.0625 mm < size <0.125 mm), fine sand (0.125 mm < size < 0.250 mm), med-ium sand (0.250 mm < size < 0.500 mm), coarse sand(0.5 mm < size < 1.0 mm), very coarse sand (1.0 mm < si-ze < 2.0 mm), and gravel (>2.0 mm) size fractions for eachsediment sample were separated by dry sieving.
The specific surface areas of bulk fraction of both 6C-Fine and 6C-Coarse sediments were measured using aMicromeritics surface area analyzer (Model 2010 Microm-eritics Ins. Corp., Norcross, Georgia) with the N2-BETmethod (Brunauer et al., 1938).
2.5. Microwave digestion and total uranium
The total concentrations of uranium were determined inthe bulk 6C-Fine and in each size fraction of the 6C-Coarsesample by complete dissolution in a strong acid mixture.The rate of dissolution of the sediment materials was accel-erated using a special CEM MARS 5 microwave digestor(CEM, Matthews, NC, USA). The microwave digestionsolution consisted of 16 M HNO3 (17%), 12 M HCl (7%),32 M HF (3.3%), 0.5 g of H3BO3 (1.5%), and DIW(71.2%). The digestion solution-to-sediment ratio used inthis method was 30 mL to 0.35 g. The reactors that enclosedthe acid solution and the soil specimen were specially de-signed Teflon containers for microwave-assisted digestion.Typically, the digestion required about 1 h at 90 ± 5 �C toattain complete dissolution. The resulting solutions were fil-tered (0.45-lm syringe filters) and analyzed for dissolveduranium using ICP-MS.
2.6. Carbonate–bicarbonate uranium extraction
The concentration of labile (easily removable fraction)uranium in the sediment bulk sample was determined usinga sodium bicarbonate/carbonate mixed solution(1.44 � 10�2 M in NaHCO3 and 2.8 � 10�3 M in Na2CO3).The notion of “labile” uranium rests on the suppositionthat uranium weakly sorbed onto sediment grains will bevulnerable to release back into solution due to formationof strong uranium bicarbonate and carbonate aqueouscomplexes. The relatively mild bicarbonate–carbonate solu-tion is unlikely to liberate much uranium locked up in min-eral matrices (Kohler et al., 2004) and is, therefore,considered to be a good index of easily-removed uranium.The reagent pH was �9.1, and the solid-to-solution ratiowas 10 g per L. Leachate aliquots were collected in two sep-arate containers for further analysis, one aliquot for mea-surement of U concentration and the second for pHdetermination. Solutions were filtered using 0.45-lm syr-inge filters and analyzed for uranium using ICP-MS. Theleached uranium concentration was determined as a func-tion of time ranging from 1 to 90 days. The mass of ura-nium was corrected for the small volume change aftereach aliquot (2 mL) was removed at the sample collectiontime.

1370 W. Um et al. / Geochimica et Cosmochimica Acta 74 (2010) 1363–1380
2.7. Determination of labile uranium using isotope exchange
techniques
A suite of isotope exchange experiments was also con-ducted to determine labile uranium concentrations in thesediment samples. This method assumes that the concentra-tion of labile uranium is subject to equilibrium require-ments and that the number of sites onto which uraniumcan sorb is relatively fixed. Therefore, a solution of syn-thetic groundwater in contact with the sediment causes anequilibrium amount of labile uranium to desorb. If the solu-tion were then spiked with an uranium isotope that couldbe differentiated analytically from the resident uranium iso-topes, equilibrium among the uranium isotopes, solution,and the solids should be established. The ability to measurethe concentrations of different uranium isotopes will resultin the quantification of the easily removed fraction of ura-nium in the specimen. The interested reader is encouragedto consult Kohler et al. (2004) for further details.
Accordingly, each of 6C-Fine and -Coarse sample wascontacted with a synthetic groundwater with a solid-to-solution ratio of 10 g/L in 250 mL for 1 day, after whichthe slurry was spiked with 233U stock solution. Immediatelyafter spiking, a sub-sample was collected, which yielded aconcentration of 32.7 pCi/mL of 233U. The 233U isotopewas selected because it can easily be distinguished from res-ident uranium (238U) by the liquid scintillation countingmethod. Synthesized groundwater was previously equili-brated with excess CaCO3 solid for 7 days and used after fil-tration. The chemical composition of synthesizedgroundwater is shown in Table 3. Duplicate tests wererun to check for reproducibility. The spiked slurries weremixed gently on a platform shaker, and effluent sampleswere collected periodically (1, 3, 5, 7, 10, 14, 21, and30 days). Effluent aliquots were filtered using a 0.45-lm fil-ter at each collection time and analyzed for 233U and totaluranium with a liquid scintillation counter and ICP-MS,respectively. The pH was also measured at each collectiontime. The labile uranium concentration on sediment wascalculated using the following equation:
238Clabile ¼ ð233Utotal=233UdissolvedÞ � 238Cdissolved ð3Þ
where 238Clabile,233Utotal,
233Udissolved, and 238Cdissolved de-note the labile 238U concentration, the initial total amountof 233U spike, the dissolved 233U activity in solution, andthe dissolved 238U concentration in solution, respectively.Concentrations of 238Clabile can be converted to labile
Table 3Composition of synthesized groundwater (pH �8.1).
Constituents Concentration (M)
Na+ 1.53 � 10�3
K+ 4.30 � 10�4
Ca2+ 4.97 � 10�4
Mg2+ 5.29 � 10�4
HCO3� 1.03 � 10�3
CO32� 1.11 � 10�5
SO42� 9.81 � 10�4
NO3� 1.19 � 10�3
uranium concentration per gram of sediment by dividing238Clabile by the solid concentration used.
2.8. Synchrotron-based Micro-XRF and Micro-XANES
High-energy Micro-X-ray Fluorescence (l-XRF) wasused to examine the elemental composition as well as thespatial association of selected metals in the sediment sam-ples. Each sample was prepared in two configurations: (1)as a layered powder on Kaptone tape, and (2) as a 1/16-inch-thick sample. Two spots containing uranium wereanalyzed for each sample. The soil samples were placed inaluminum sample holders, the holders were sealed withKapton tape, and analysis was performed on beamlineX27A at the National Synchrotron Light Source (NSLS)at Brookhaven National Laboratory. Data for l-XRF werecollected on the samples at an incident X-ray energy of17.4 keV using a 13-element germanium (Ge) detector. Ele-mental mapping was obtained on a 400 � 400-lm areausing a focused beam of approximately 5–10 lm. Two-dimensional image maps were acquired for 10 elements,including Ca, Cr, Cu, Fe, Mn, Pb, Sr, Ti, U and Zn. Datawere analyzed to determine the spatial and chemical distri-bution of uranium with the other elements.
Specific areas in the sample that contained elevated ura-nium concentrations were identified prior to Micro-X-rayAbsorption Near Edge Structure (l-XANES) analysis.The oxidation state of uranium in the sediment was deter-mined using l-XANES analysis on a 10 � 15-lm spot atthe uranium Llll edge (17.166 keV). Bulk XANES analysison a 1 � 15-mm spot was also conducted on beamlineX11A to obtain an average oxidation state for uranium inthe sediments. Calibration standards, namely, uranyl ni-trate [UVIO2(NO3)2] and uranium dioxide (UIVO2) wereused to establish the absorption edge positions for U(VI)and U(IV), respectively. Spectra were normalized to theedge-jump using ATHENA software (Ravel and Newville,2005).
2.9. Time-resolved laser-induced fluorescence spectroscopy
(TRLIFS)
TRLIF spectroscopy was performed in a Cryo Indus-tries RC-152 cryostat at near liquid helium temperature(LHeT) of 6 ± 1 K on three sediment samples. The samplesinclude 6C-Fine, 6C-Coarse, and B1JWW6A (or 6A), thelatter of which is a lithologically homogeneous (i.e., notsubdivided into coarse and fine fractions) specimen thatcontained relatively high concentrations of P. The advan-tage afforded by TRLIF spectroscopy is its high sensitivityand requirement of a very small sample volume. Solid ura-nium-bearing phases as well as dissolved uranium species(Wang et al., 2004, 2005) can be analyzed at detection levelsthat cannot be achieved by Raman, Nuclear Magnetic Res-onance (NMR), X-ray Absorption Fine Structure (XAFS),or other spectroscopic techniques. Because the fluorescencespectra depends on the nature of the bonding relationshipbetween uranium and the surrounding atoms, the spectralsignature of each uranium species is useful for phase iden-tity. At room temperature, the fluorescent spectra for many
Table 4Summary of particle-size distributions for bulk BX direct-pushsamples B1JWW6C-Fine and B1JWW6C-Coarse.
Size fractions 6C-Fine(wt.%)
6C-Coarse(wt.%)
Gravel (>2.0 mm) 0.38 5.45Very coarse sand(1.0 mm < size < 2.0 mm)
4.27 40.8
Coarse sand(0.5 mm < size < 1.0 mm)
5.23 29.9
Medium sand(0.25 mm < size < 0.5 mm)
0.90 6.24
Find sand(0.125 mm < size < 0.25 mm)
20.7 9.29
Very fine sand(0.0625 mm < size < 0.125 mm)
36.1 4.61
Silt and clay (<0.0625 mm) 32.4 3.70
Uranium-contaminated sediments from Hanford, Washington, USA 1371
species suffer from quenching due to impurities and otherfactors, but at cryogenic temperatures, the diminishmentof such quenching results in a sharp, intense spectrum.
The three sediment samples were analyzed in a sealed2 mm � 4 mm fused silica cuvette. The sample cell was ex-posed directly to the vapor flow of liquid He, and the sam-ple temperature was controlled by tuning both the liquidHe flow rate and the electric current applied to the internalheater of the cryostat. The fluorescence emission spectrawere obtained by excitation at 415 nm with the frequency-doubled output of a MOPO-730 pulsed laser pumped witha Nd:YAG laser. The spectrograph wavelength was cali-brated with a xenon lamp (Spectra Physics model 6033).Time-resolved fluorescence emission spectra were collectedwith a thermoelectrically cooled Princeton Instrument PI-MAX time-gated intensified charge-coupled camera at theexit port of an Acton SpectroPro 300i double monochro-mator spectrograph. The data record was controlled byWinSpec data acquisition software and analyzed usingIGOR software (WaveMetrics).
3. RESULTS
3.1. Moisture content
Moisture contents for samples from the 241-BX TankFarm are listed in Table 2. The moisture content of thespecimens varied between �2% and 13% depending onthe relative amounts of gravel, sand, silt and clay-size mate-rials. Samples exhibiting relatively high moisture contentswere generally fine-grained, as represented by the sample6C-Fine from borehole C5134. These results imply that ele-vated moisture measured in several of the direct-push sam-ples is likely controlled by sample lithology rather than anindication of past liquid releases in the environs.
3.2. Water extraction
The water extract data for 238U are recorded in Table 2.Water-leachable 238U is elevated in all of the BX TankFarm direct-push samples analyzed. The peak water-extractable 238U concentration measured in the uncontam-inated “background” borehole (C3391) by Lindenmeieret al. (2003) was 1.40 � 10�3 lg/g. Comparing this valueto the range of U concentrations measured in these 241-BX direct-push samples (2.01 � 10�2 to 12.0 lg/g) confirmsthe supposition that these samples contain Hanford-processuranium. The concentrations of uranium in the pore waterswere calculated using Eq. (2) and U concentrations in thewater extracts. Calculated pore water U and PO4
3� concen-trations are also listed in Table 2. Concentrations of Urange from 1.25 to 640 lmol/L. Peak PO4
3� concentrationswere found at the �63-foot bgs depth in samplesB1JWW7B and B1JWW7C. Both 6C-Fine and -Coarse sed-iments showed no detectable phosphate concentrations inwater extracts (Table 2). However, other sediments col-lected at shallower depths and B1JWW6A sediment showedhigher PO4
3� concentrations in water extract than that ofHanford uncontaminated deep depth sediment (Lindenme-ier et al., 2003; Um et al., 2009).
3.3. Acid extracts
The acid-extractable concentrations of 238U are listed inTable 2. Acid-extractable 238U concentrations were elevatedin all of the samples compared to background levels, withthe exception of samples from borehole C5124. The concen-trations ranged from a low of 44.3 to a high of 555 lg/g inthe C5132 and C5134 push holes, respectively. Note thatthe quantities of U liberated by the acid extracts were extre-mely high; some samples contained more than three ordersof magnitude more acid-leachable than water-extractableU. These data indicate that the total fund of uranium inthe sediments is not represented by mobile forms and thata large fraction is sequestered by mobilization-resistantphases.
3.4. Particle-size distribution and surface area measurement
Because a potential relationship exists between uraniumconcentrations and sediment particle size, we examined theparticle-size distributions of a fine-grained lens and that ofa more typical coarser-grained matrix. Particle-size distri-bution data for two sediments, 6C-Fine and 6C-Coarse,are shown in Table 4. The 6C-Fine sample is a very finesand- and clay/silt-dominated sediment with a negligibleamount of gravel-size fraction (<0.4 wt.% for particles lar-ger than 2 mm). Notably, the three finest size fractions (finesand, very fine sand, and silt and clay) make up nearly 90%of the material in the 6C-Fine sample. In contrast, coarseand very coarse sand fractions dominate the 6C-Coarse sed-iment. This distribution of particle sizes in sample 6C-Coarse, mainly sand-size with only a minor silt/clay frac-tion, is typical for the sand-dominated Hanford formation.
The measured surface area for bulk fraction of 6C-Fineand 6C-Coarse sediments is 5.58 ± 0.15 and 3.16 ±0.15 m2/g, respectively. Although 6C-Fine sample showshigher surface area values, the difference in surface area be-tween 6C-Fine and 6C-Coarse is not significant, suggestinga paucity of clay minerals possessing high surface areas in6C-Fine bulk fraction.

Carbonate leaching of bulk samples
Time (days)0 20 40 60 80 100
U c
once
ntra
tion
(µg/
g)
0
100
200
300
400
500
600Coarse-1Coarse-2Fine-1Fine-2
Fig. 4. Plot of uranium concentration versus time for theB1JWWC-Fine and -Coarse samples subjected to carbonateleaching. The suffixes “�1” and “�2” refer to duplicate runs.
Table 6Summary of uranium concentrations and apparent desorption KD
(and KD-surface area) values for the 6C-Fine and 6C-Coarse speci-mens. Concentrations are based on the mass of sediment. Theapparent desorption K values are for illustrative purposes only
1372 W. Um et al. / Geochimica et Cosmochimica Acta 74 (2010) 1363–1380
3.5. Microwave digestion and total uranium
As the next step in ascertaining a relationship betweenparticle size and uranium concentration, total uraniumwas determined by the microwave-assisted digestion meth-od and the results are recorded in Table 5. The uraniumconcentration of bulk sediment of sample 6C-Fine wascompared with the bulk and various size fractions of sam-ple 6C-Coarse. The concentrations of uranium in the bulk6C-Fine and -Coarse samples are 390 and 108 lg/g, respec-tively. These data indicate that there is a connection be-tween sediment particle size and the amount of uraniumpresent in a sample. This supposition is bolstered by the re-sults for uranium concentrations in the various size frac-tions split off from bulk 6C-Coarse (Table 5). Values oftotal U concentrations ranged from 49 to 352 lg/g, and,in general, total U concentrations increased as the particlesize fraction decreased. As Table 5 reveals, the highest Uconcentration was found in the silt/clay-size fraction inthe 6C-Coarse sediment, although it is not immediatelyclear from these data alone why this is the case. A detailedreckoning of minerals in each size fraction might lend someimportant evidence, but this analysis has not yet beenperformed.
3.6. Carbonate–bicarbonate extraction
Two specimens of each of the 6C-Fine and -Coarse weresubjected to sodium bicarbonate–carbonate solution (pH�9.1) leaching to determine the concentration of labile U.The concentration of U liberated from the coarse-grainedspecimen reached a steady-state value after 10–20 days’reaction. The change in concentration of U in the coarse-grained sample was not significant after the first 10 days(Fig. 4). There was a relatively rapid increase of U releasedin the first 5 days from 6C-Fine sediment compared to thatof the 6C-Coarse sample, indicating steady-state release oc-curred earlier in the 6C-Coarse sediment. A possible expla-nation is that the coarser-grained sediment contained largerpore spaces, which would facilitate ingress of the bicarbon-
Table 5Total U(VI) concentration of U from microwave-aided digestion ofsamples B1JWW6C-Fine and B1JWW6C-Coarse in bulk and persize fraction.
Size fractions 6C-FineU(lg/g)
6C-CoarseU(lg/g)
Bulk 390 108Gravel (>2.0 mm) 61.3Very coarse sand(1.0 mm < size < 2.0 mm)
56.9
Coarse sand(0.5 mm < size < 1.0 mm)
49.0
Medium sand(0.25 mm < size < 0.5 mm)
97.3
Find sand(0.125 mm < size < 0.25 mm)
178
Very fine sand(0.0625 mm < size < 0.125 mm)
259
Silt and clay (<0.0625 mm) 352
ate–carbonate solution to sites that harbored uranium. Incontrast, the finer-grained specimen contains much smallerpore sizes, so transport of dissolved uranium from the sed-iment and into bulk solution may be diffusion limited.
The results of this test, and a summary of U concentra-tion values for the 6C-Fine and -Coarse specimens, arelisted in Table 6. This table also records apparent desorp-tion KD values, which are included to illustrate the differ-ence in U behavior between fine- and coarse-grainedsediments. The large differences in KD values (�2 orders-of-magnitude; see below) for fine- and coarse-grained sedi-ments is not likely a reflection of geochemical control (suchas differences in pH, dissolved CO2, etc.) in adjacent sedi-ments, but of differences in U binding mechanisms. Thus,the listed KD values are merely meant to draw attention
D
and should NOT be used to infer equilibrium concentrations of Ubetween sediment and aqueous solution.
aKD-surface area is a surface area normalized KD value and it wasdetermined from KD divided by the measured surface area of 6C-Fine (5.58 ± 0.15 m2/g) and 6C-Coarse (3.16 ± 0.15 m2/g).

Isotope Exchange
Time (Days)
233U
con
cent
ratio
n (p
Ci/m
L)
0
10
20
30
40
Coarse-1Coarse-2Fine-1Fine-2
A.
Labile 238U
Time (days)
0 5 10 15 20 25 30 35
0 5 10 15 20 25 30 35
238U
con
cent
ratio
n (µ
g/g)
0
50
100
150
200
250
300
350 Coarse-1Coarse-2Fine-1Fine-2
B.
Fig. 5. Plot of 233U concentration (pCi/mL) (A) and calculatedlabile 238U concentration (lg/g) (B) versus time for isotopeexchange experiments with B1JWWC-Fine and -Coarse samples.The suffixes “�1” and “�2” refer to duplicate runs.
Uranium-contaminated sediments from Hanford, Washington, USA 1373
to the problem of applying the KD concept to some Han-ford sediments.
Labile U-leaching results after 21 days’ reaction showedaverage concentrations of 72.1 and 292 lg U/g for samples6C-Coarse and 6C-Fine, respectively (Table 6). Based onthese labile U concentrations from carbonate leachingand U concentrations in pore water calculated from thewater extracts (297 and 4.63 � 104 lg/L for 6C-Fine and6C-Coarse sediments, respectively), calculated U desorp-tion KD values are 983 and 1.56 mL/g. These apparentKD values are numerically similar to those measured basedon acid extraction and pore water U concentrations(KD = 927 and 1.27 mL/g for 6C-Fine and 6C-Coarse sed-iment, respectively). The amount of uranium extracted bythe bicarbonate–carbonate leachate (72.1 and 292 lg/g ura-nium for 6C-Coarse- and 6C-Fine samples, respectively) isless than, but approaches the same values in concentrationas that from the microwave-assisted digestion (108 and390 lg/g U, respectively). This could be interpreted as67% and 75% of the uranium from the coarse- and fine-grained specimens, respectively, are in a labile form. How-ever, these values may reflect an over-estimation of theamount of labile U if there is a contribution from dissolu-tion of U-silicate minerals in the leach solution. In similarstudies, the carbonate–bicarbonate leaching solution witha pH of 9.1 was shown to be reactive towards U-silicates(Um et al., 2009).
3.7. Isotope exchange
The amount of labile U was also estimated by the frac-tional distribution of 233U between the solid and aqueousphases after obtaining isotopic equilibrium with 238U. Theevolution of 233U (pCi/mL), determined by LSC, and thecalculated labile 238U (lg/g), over time for duplicate 6C-Coarse and -Fine samples are illustrated in Fig. 5. Thetwo sediments showed that a stable concentration of dis-solved 233U was acquired after 21 days reaction (Fig. 5A).For example, the 6C-Coarse sediment sample showed con-stant (within experimental uncertainty) dissolved and calcu-lated labile 238U concentrations, even after the fifth day ofexperiment. This rapidly attained steady-state was similarin behavior to that of the carbonate leaching result forthe 6C-Coarse sediment. Relatively rapid attainment ofconstant chemical composition in the 6C-Coarse sedimentresulted from fast exchange of 233U with adsorbed 238Uon larger mineral surfaces because the coarser-grained sed-iments have fewer diffusion barriers to U exchange. On theother hand, the labile 238U concentration of the 6C-Finesediment increased at a relatively fast rate during early reac-tion time (up to 7 days), then slowly increased to reach con-stant values (Fig. 5B). In addition, because of the slowlydecreasing 233U activity, the calculated labile U concentra-tion in the 6C-Fine sediment showed a slow, continuous in-crease after a relatively fast increase up to 15 days (Fig. 5B).An increase in the calculated labile U concentration cou-pled with a relatively slowly attained isotopic equilibriumin 6C-Fine sediment compared to the 6C-Coarse sampleindicates diffusion-controlled U desorption/dissolution islikely occurring. The steady increase in uranium concentra-
tion during the experiment may be due to continuous butslow dissolution of U-bearing precipitates (or co-precipi-tates). Though fractional volumes are small, precipitatedU(VI) phases (e.g., uranyl silicates) may be present in addi-tion to an adsorbed U phase in 6C-Fine, and slow release ofuranium from these reservoirs may affect the results of thetest.
The average concentrations of labile uranium calculatedby Eq. (3) are 55.1 and 247 lg/g U in the 6C-Coarse and -Fine specimens, respectively (Table 6). These U(VI) concen-trations are 51% and 63% of total U(VI) concentrations(108 and 390 lg/g for 6C-Coarse and -Fine sediment,respectively) obtained by microwave digestion. Comparedto the concentrations of labile U determined by the bicar-bonate–carbonate extraction, the labile U determined byisotope exchange are 76% and 85% of that determined bythe bicarbonate–carbonate leaching method for the coarse-and fine-grained specimens.
Based on the results of 21 days of isotope exchangeexperiments, U desorption KD values were calculated andcompared with those calculated using other methods (Ta-ble 6). These include the data on U concentrations obtainedby the bicarbonate–carbonate extraction, the isotope ex-change experiments, and the strong acid extraction. Asmentioned above, average labile U concentrations deter-mined from isotope exchange are 247 and 55.1 lg/g for

1374 W. Um et al. / Geochimica et Cosmochimica Acta 74 (2010) 1363–1380
6C-Fine and -Coarse samples, respectively. These valuestranslate to U desorption KD values of 832 and 1.19 mL/gfor 6C-Fine and -Coarse sediment, respectively. These KD
values are lower than those previously computed frombicarbonate–carbonate leaching (983 and 1.56 mL/g) andstrong acid extraction (927 and 1.27 mL/g). However, giventhe large differences in methods and assumptions, thedesorption KD values determined by the three techniquesare remarkably similar. Further, the KD values computedfrom the three methods are likely to reside within the uncer-tainty of measurement. Though we did not attempt to per-form a rigorous quantification of the uncertainty, if areasonable error of 10% were assigned to the KD values,they are statistically identical. The results do, however, indi-cate a difference in KD values between the 6C-Fine and -Coarse sediments that cannot be attributed to statisticalfluctuations. Thus, concentrations of uranium releasedfrom the fine-grained sediment are lower than that of thecoarse-grained specimen.
3.8. Synchrotron Micro-XRF and Micro-XANES
Even though the macroscopic studies of bulk sedimentand size fractions described above provided an estimateof U concentration on sediment, more specific quantitativeinformation is required to understand U speciation andbinding mechanisms on individual sediment grains. We at-tempted to determine the presence of micro-precipitatesthat harbor uranium by careful quantitative X-ray diffrac-
0.4
0.3
0.2
0.1
0.0
0.0 0.1 0.2 0.3 0.4 (mm)
0.4
0.3
0.2
0.1
0.0
0.0 0.1 0(m
0.0 0.1 0(m
0.4
0.3
0.2
0.1
0.0
0.4
0.3
0.2
0.1
0.0
0.0 0.1 0.2 0.3 0.4 (mm)
intensity
Ca
U Mn
Fe
Fig. 6. Elemental map (400 � 400 lm) of B1JWW6C-Fine sediment (Spois shown on the left and below the images. The intensity scale is shown onFe, Cr, Ti, Mn, and U. Resolution is 10 lm.
tion of the various size fractions (data not presented), butwere unsuccessful even for silt/clay fraction containing highU concentration. We resorted to identifying areas in thesediments that yielded high concentrations of uranium bysubjecting the sediments to micro X-ray Fluorescence (l-XRF) techniques.
The l-XRF maps of the 6C-Fine and -Coarse sedimentsare shown in Figs. 6–8. Each false color map shows the dis-tribution of Ca, Fe, Cr, Ti, Mn, and U on a 400 � 400 lmarea in the sediment samples. Each pixel measures10 � 15 lm, and the color intensity indicates the qualitativeconcentration of the metal; blue indicates the lowest relativeconcentration and white the highest relative concentration.
Interpretation of Figs. 6–8 should be tempered with thefollowing caveat. Although the X-ray peaks are well-re-solved and present no problems with overlap, the high“noise” exhibited by the background made a quantitativebackground subtraction difficult. Thus, it is possible thatsome of the X-rays picked up by the detector representbackground counts, and may not be, therefore, indicativeof the presence of certain elements. For this reason, wemade every effort to not over-interpret the results shownbelow.
Fig. 6 shows the elemental distribution of metals in thefine sediment fraction (6C-Fine) at one spot in the sample.This figure shows large areas containing Ca, Fe, Mn, andU, while a smaller area is noted for Ti and Cr. Because ofthe wide distribution of U in the sample, there is a correla-tion with all of the metals. However, spatial considerations
0.4
0.3
0.2
0.1
0.0
.2 0.3 0.4 m)
.2 0.3 0.4 m)
0.4
0.3
0.2
0.1
0.0
0.0 0.1 0.2 0.3 0.4 (mm)
0.0 0.1 0.2 0.3 0.4 (mm)
Ti
Cr
t 1) prepared as a layered powder sample. The scale, in millimeters,the lower left-hand side of the figure. Clockwise (from top left): Ca,

0.4
0.3
0.2
0.1
0.0
0.4
0.3
0.2
0.1
0.0
0.4
0.3
0.2
0.1
0.0
0.4
0.3
0.2
0.1
0.0
0.4
0.3
0.2
0.1
0.0
0.4
0.3
0.2
0.1
0.0
Ca Fe Cr
U Mn Ti
0.0 0.1 0.2 0.3 0.4 (mm)
0.0 0.1 0.2 0.3 0.4 (mm)
0.0 0.1 0.2 0.3 0.4 (mm)
0.0 0.1 0.2 0.3 0.4 (mm)
0.0 0.1 0.2 0.3 0.4 (mm)
0.0 0.1 0.2 0.3 0.4 (mm)
intensity
Fig. 7. Elemental map (400 � 400 lm) of B1JWW6C-Coarse sediment (Spot 2) prepared as a layered powder sample. The scale, inmillimeters, is shown on the left and below the images. The intensity scale is shown on the lower left-hand side of the figure. Clockwise (fromtop left): Ca, Fe, Cr, Ti, Mn, and U. Resolution is 10 lm.
0.4
0.3
0.2
0.1
0.0
0.4
0.3
0.2
0.1
0.0
0.4
0.3
0.2
0.1
0.0
0.4
0.3
0.2
0.1
0.0
0.4
0.3
0.2
0.1
0.0
0.4
0.3
0.2
0.1
0.0
Ca Fe Cr
U Mn Ti
0.0 0.1 0.2 0.3 0.4 (mm)
0.0 0.1 0.2 0.3 0.4 (mm)
0.0 0.1 0.2 0.3 0.4 (mm)
0.0 0.1 0.2 0.3 0.4 (mm)
0.0 0.1 0.2 0.3 0.4 (mm)
0.0 0.1 0.2 0.3 0.4 (mm)
intensity
Fig. 8. Elemental map (400 � 400 lm) of B1JWW6C-Coarse sediment (Spot 1) prepared as a 1/16-inch-thick sample. The scale, inmillimeters, is shown on the left and below the images. The intensity scale is shown on the lower left-hand side of the figure. Clockwise (fromtop left): Ca, Fe, Cr, Ti, Mn, and U. Resolution is 10 lm.
Uranium-contaminated sediments from Hanford, Washington, USA 1375
indicate that U correlates mainly with Ca-containingphases. Some U correlations were observed for metals with
limited distribution, such as Mn and Ti. Micro-XANESanalysis of U was done at the pixel of the sample that

1376 W. Um et al. / Geochimica et Cosmochimica Acta 74 (2010) 1363–1380
showed the highest concentration of U (white). Comparisonof the XANES analysis of U in the sediment with known Ustandards showed it to be present as the hexavalent formU(VI) (see below, Fig. 9).
Fig. 7 shows the elemental distribution of metals in thecoarse sediment fraction (6C-Coarse) at one spot in thesample. Uranium was associated to the greatest relative ex-tent with areas containing Ca, Fe, Cr, and Mn but the Fe,Cr, and Mn X-rays are not as intense as those for Ca. Weinterpret these figures to indicate that U and Ca are moststrongly correlated. Because calcium carbonate (solid) ispresent in both sediments [2.2 and 2.0 wt.% as CaCO3 for6C-Fine and -Coarse, respectively (Brown et al., 2007a)],U might also be present as a solid solution with calcite(Reeder et al., 2000, 2001; Kelly et al., 2006).
In an earlier paper, Arai et al. (2007) found significantevidence for the presence of metatorbernite [Cu(UO2)2(-PO4)2�8H2O] in 300-Area vadose zone sediments. In thatcase, the association of uranium with Cu was likely dueto the co-disposal of large quantities of copper waste inadjacent shallow excavations that were used to store a widevariety of liquid wastes. Although there is no documenta-tion of copper disposal in the BX Tank Farm that is thesubject of this investigation, we deemed that it would beuseful to search for the presence of copper, given its prom-inence in other parts of the Hanford Site. Although tracesof copper were detected by l-XRF (X-ray maps notshown), there was no association between Cu and U, lead-ing us to conclude that no evidence for metatorbernite isapparent in this locale.
B1JWW6C
Energy (eV)17100 17150 17200 17250 17300 17350
Nor
mal
ized
Flu
ores
cenc
e In
tens
ity
0
2
4
6
17168
17170
17171
17171
17171
17171
AbsorptionEdge (eV)
U(IV)
Coarse-Spot 2
Coarse-Spot 1
Fine-Spot 2
Fine-Spot 1
U(VI)
Fig. 9. Normalized XANES spectra at the U Llll Edge forB1JWW6C-Fine and -Coarse fractions of sediments. The absorp-tion edges for 6C-Fine sediment fractions and Spot 1 for 6C-Coarsesediment indicate that U is in the hexavalent form, while Spot 2 ofthe coarse sediment indicates a possible mixed oxidation state forU. Spot size is 10 � 15 lm.
In some instances, the U X-rays were not very intenseand correlated poorly with other metals. Fig. 8 is an exam-ple of an analyzed area from a 1/16-inch-thick preparationof the 6C-Coarse sediment sample. The distribution of U ismore diffuse than in the preceding figures and U does notappear to correlate with other metals. Micro-XANES anal-ysis was not successful in obtaining definitive oxidationstate information on the thick samples because of weakinstrument output signals. However, bulk XANES analysisfor the 6C-Coarse sample showed that the uranium absorp-tion edge was at 17,171 eV (Fig. 9; see below), confirmingthat uranium was present in the hexavalent form.
The XANES spectra of two spots in the 6C-Fine and -Coarse sediments (Fig. 9) illustrate that the U spectra arevery similar. The absorption edges of three of the four bulksamples (not shown) are coincident with that of the U(VI)standard (17,171 eV), and shows that the majority of ura-nium atoms in these specimens are in the hexavalent form.The one possible exception to this is the 6C-Coarse Spot 2,in which the absorption edge is slightly lower (17,170 eV)than the others, possibly indicating that uranium is in amixed valance state (Ilton et al., 2004).
3.9. Time-resolved laser-induced fluorescence spectroscopy
At LHeT all three sediment samples (6C-Fine, 6C-Coarse, and 6A) displayed strong fluorescence spectra.Comparison of the sharpest spectra for the unknownphases in 6C-Coarse and -Fine with well-characterizedstandards (Wang et al., 2005, 2008) was used to ascertainthe identity of the unknown uranyl phases (Fig. 10). Withinthe error of the measurements, the dominant species in thecoarse- and fine-grained sediment samples are consistentwith uranophane [Ca(UO2)2SiO3(OH)2�5(H2O)] and bolt-woodite [(Na,K)(SiO4)�1.5H2O]. TRLIF spectra of U-sili-cates (uranophane and boltwoodite) and of sedimentswith adsorbed U(VI) collected on samples from a separateHanford U-tank farm (Um et al., 2009) manifested differentspectra patterns. The TRLIF spectra presented herein dis-plays a pattern that is similar to sediments containing U-sil-icates, rather than the pattern characteristic of U-sorbedsediments. Due to significant differences in TRLIF spectrabetween sediments and U-bearing calcium carbonate min-erals (calcite and aragonite), U(VI) was not considered tobe harbored by calcium carbonate minerals (Fig. 10). Thisresult is also consistent with previous findings in whichthe major uranium species from beneath Tank BX-102was identified as an uranophane-type secondary uranylmineral (Catalano et al., 2004; Wang et al., 2005).
We further refined our comparison of the spectra for theunknown phases to that of an uranyl phosphate mineral(Fig. 11). In contrast to the pattern manifested by uranylsilicates, we found bands in the spectra of the 6A samplethat are sharper and narrower, which are more consistentwith uranyl phosphates (Wang et al., 2008). Hydrous formsof sodium uranyl phosphate, such as sodium meta-autuniteand autunite [Na2(UO2)2(PO4)2(H2O)10–12], are common inboth naturally weathered uranium deposits and in contam-inated sediments (Finch and Murakami, 1999). Becauseautunite possesses a very small Ksp value (Langmuir,

Wavelength (nm)460 480 500 520 540 560 580 600
Rel
ativ
e In
tens
ity x
10-5
100
200
300
400
500
6C coarse
6C fine
Uranophane
Calcite
Schoepite
Aragonite
Boltwoodite
504 nm526 nm
550 nm
Fig. 10. TRLIFS data for B1JWWC-Coarse and -Fine sediment(both with 1.2 ms delay) and standard compounds boltwoodite,uranophane, U-bearing calcite, U-bearing aragonite, and schoe-pite. The data are consistent with a phase in the uranophane familyof uranyl silicates in the 6C-Coarse and 6C-Fine sediment samples.
B1JWW6A0 ms delay
Wavelength (nm)450 500 550 600 650
Rel
ativ
e In
tens
ity x
10-5
0
20
40
60
80
1000.01 ms gate width0.10 ms gate width10.0 ms gate widthuranyl phosphate
Fig. 11. TRLIFS pattern for sample B1JWW6A. The sharpestimage corresponds to a 0 ms delay coupled with a 0.10 ms gatewidth. The shape of the spectra is consistent with that of uranylphosphate.
Uranium-contaminated sediments from Hanford, Washington, USA 1377
1997), and because of the relatively high phosphate concen-tration in the BX-102 direct-push sediment water extracts(Table 2), the existence of uranyl phosphates at the Han-ford Site is plausible.
4. DISCUSSION
4.1. Desorption KD values and uranium mobility
Desorption KD values listed in Table 6 indicate relativelyconstant values obtained by different methods for both the6C-Coarse and 6C-Fine specimens. Although KD values arenormalized with surface area, the KD-surface area values of
each sample are similar for three different methods usedfor U-leaching (Table 6). These data can be construed asevidence for separate, constant KD values for fine-grainedlenticular bodies and the coarser-grained matrix. Still muchhigher values of KD-surface area were found in 6C-Fine sedi-ment compared to those of 6C-Coarse sediment, indicatingthat there is another factor other than surface area to ac-count for measured high desorption KD values in 6C-Finesediment. On the other hand, the data shows that there isboth a labile fraction of U (51–63%) as well as a reservoirthat is recalcitrant with respect to mobilization. Thus,although the sorption and desorption of U from the labilefraction can be modeled using equilibrium concepts, thereis a significant fraction of U that is still relatively immobile.Successful modeling of the movement of this fraction of Uwill require an understanding of the dissolution kinetics ofthe solids that retain U, and diffusion from the limited vol-ume pore space to bulk solution.
4.2. The link between immobile forms of uranium and
hydraulic conductivity
Previous investigations by Catalano et al. (2004) and Liuet al. (2004, 2006) emphasized the presence of uranium asuranyl silicate micro-precipitates in lithic fragments ofgranite. If these micro-precipitates represent the major frac-tion of contaminant uranium in the sediments, then model-ing the release of uranium from the lithic fragments wouldgo a long way toward understanding the movement of ura-nium in the vadose zone (Ilton et al., 2008). The data fromthis investigation show, however, that a relatively recalci-trant phase or phases harbor uranium and reside in the fi-ner-grained fraction of the sediment. A recent study byStubbs et al. (2009) showed that high concentration of ura-nium was also found in coatings at the Hanford sediments,which can be isolated and separated into the finer-grainedfraction. Alternatively, lithic fragments containing micro-precipitates may be disproportionately distributed into thefine sand to clay-size fraction, but the microscopic evidencedoes not bear this out.
Comparison of the concentrations of U in fine- andcoarse-grained samples indicates that uranium is concen-trated in the former. Fractionation of U between two lith-ologic units may be the result of a strong contrast inhydraulic properties. Field tests at Hanford have shownthat contrasts in grain size of the porous matrix will havea strong influence on contaminant migration (Conradet al., 2007). In these tests, tracers in aqueous solutionshowed that a vertically descending plume experienced sig-nificant lateral spreading when coming into contact withsediments with contrasting grain sizes. Other investigationshave shown that U(VI) will concentrate in fine-grained sed-iments that boarder coarse-grained lithologies (Whickeret al., 2007).
Collectively, these studies and the data presented in thisinvestigation indicate that there are a number of mecha-nisms that lead to U retention in Hanford Site sediments.There is unambiguous evidence that uranium micro-precip-itates form in cracks and crevices in feldspar grains withinlithic fragments (e.g., Catalano et al., 2004; Liu et al.,

1378 W. Um et al. / Geochimica et Cosmochimica Acta 74 (2010) 1363–1380
2004, 2006; Stubbs et al., 2009), but this investigation dem-onstrates that U may also be retained in the fine-grainedportion of sediments as well. The evidence for the presenceof uranyl phosphates is also significant and these appear toreside in depths shallower than those investigated before,and may have been previously overlooked. Therefore, thisstudy can be seen as an extension of the earlier uranium mi-cro-precipitate investigations. The key to understandingcontaminant migration and pore water transport at Han-ford may lie in understanding the behavior of aqueous solu-tions at the interface between coarse- and fine-grainedcomponents of the sediment.
5. CONCLUSIONS
An examination of sediment samples retrieved fromboreholes beneath BX tanks that held radioactive wasteshow evidence for the transit of a contaminant plumethrough the vadose zone. A variety of tests reveal higherthan background concentrations of 238U in the sedimentsamples, especially in the finer-grained fractions. Concen-trations of dissolved phosphorous are also relatively highcompared to uncontaminated background samples. A de-tailed examination of a fine-grained lens set in a coarser-grained matrix indicates that a sizeable fraction of uraniumis in a mobile form in both the fine and coarse material (51–63%). However, a significant portion of 238U is also seques-tered in an immobile form, whose migration cannot bemodeled using equilibrium concepts. Examination of ura-nium-rich “hot spots” by micro-analytical techniques (l-XANES) indicate that the dominant oxidation state of ura-nium is hexavalent [i.e., U(VI)]. Data obtained from l-XRFand TRLIFS are consistent with uranyl silicates and phos-phates as the major U-harboring phases. Thus, the data areconsistent with uranium sequestration occurring by forma-tion of micro-precipitates (of both uranyl phosphate andsilicate) within small pore volumes in the sediment, and thata larger amount is represented in the finer-grained fractionsfound in lenticular bodies that are interspersed throughoutthe Hanford formation. These data therefore lend more evi-dence to the idea that there are significant and recalcitrantsinks for uranium both at relatively shallow and deeperdepths within the sedimentary column. This investigationalso provides a vital link to understanding the migrationof contaminants that encounter different lithologies pos-sessing different hydraulic qualities. Modeling the migrationof contaminants and the movement of pore waters maythus depend on understanding the effects of capillary barri-ers that form when fine- and coarse-grained sediments arejuxtaposed.
ACKNOWLEDGMENTS
This work was conducted as part of the Tank Farm VadoseZone Project led by CH2M HILL Hanford Group, Inc., in supportof the U.S. Department of Energy (DOE)’s Office of River Protec-tion. The authors wish to thank John G. Kristofzski, Fredrick M.Mann, David A. Myers, Michael P. Connelly, and Harold A. Syd-nor with CH2M HILL Hanford Group, Inc. and Dwayne Crum-pler with Columbia Energy and Environmental Services for theirplanning support and technical review of this work. We would also
like to express our gratitude to Robert Lober with the DOE Officeof River Protection for his support and interest. We gratefullyacknowledge Kent D. Reynolds, Dave Skoglie, Kelly Olson, andMark Repko (Duratek Federal Services, Inc.) for their efforts inselecting depths to sample and executing the field work that ob-tained the samples. Finally, the authors would like to thank JeffreyG. Catalano (Washington University in St. Louis) and two anony-mous reviewers for thoughtful and constructive critiques.
REFERENCES
Arai Y., Marcus M. A., Tamura N., Davis J. A. and Zachara J. M.(2007) Spectroscopic evidence for uranium bearing precipitatesin vadose zone sediments at the Hanford 300-Area site. Environ.
Sci. & Tech. 41, 4633–4639.
ASTM (1986) Standard Test Method for Particle Size Analysis of
Soils. ASTM-D422-86, Am. Soc. Test. Mater., West Cons-hohocken, PA.
Brown C. F., Icenhower J. P., Um W., Bjornstad B. N., Valenta M.M., Iovin C., Lanigan D. C., Clayton R. E., Geiszler K. N.,Clayton E. T., Kutnyakov I. V., Baum S. R., Lindberg M. J.and Orr R. D. (2007a) Characterization of Direct-Push Vadose
Zone Sediments from the 241-B and 241-BX Tank Farms,PNNL-17162, Richland, Pac. Northwest Nat. Lab., WA.
Brown C. F., Valenta M. M., Serne R. J., Bjornstad B. N., LaniganD. C., Iovin C., Clayton R. E., Geiszler K. N., Clayton E. T.,Kutnyakov I. V., Baum S. R., Lindberg M. J. and Orr R. D.(2007b) Characterization of Direct Push Vadose Zone Sediments
from the 241-U Single-Shell Tank Farm, PNNL-17163. Pac.Northwest Nat. Lab., Richland, WA.
Brunauer S., Emmett P. H. and Teller E. (1938) Adsorption ofgases in multi-molecular layers. J. Am. Chem. Soc. 60, 309–319.
Caggiano J. A. (1996) Assessment Groundwater Monitoring Plan for
Single Shell Tank Waste Management Area B-BX-BY. WHC-SD-ENV-AP-002, West. Hanf. Co., Richland, WA.
Catalano G. J., Heald S. M., Zachara J. M. and Brown, Jr., G. E.(2004) Spectroscopic and diffraction study of uranium specia-tion in contaminated vadose zone sediments from the HanfordSite, Washington State. Environ. Sci. & Tech. 38, 2822–2828.
Conrad M. E., DePaolo D. J., Maher K., Gee G. W. and Ward A.L. (2007) Field evidence for strong chemical separation ofcontaminants in the Hanford vadose zone. Vadose Zone J. 6,
1031–1041.
Curtis G. P., Fox P., Kohler M. and Davis J. A. (2004)Comparison of in situ uranium KD values with a laboratorydetermined surface complexation model. Appl. Geochem. 19,
1643–1653.
Curtis G. P., Davis J. A. and Naftz D. L. (2006) Simulation ofreactive transport of uranium(VI) in groundwater with variablechemical conditions. Water Resour. Res. 42, W04404.
Davis J. A., Meece D. E., Kohler M. and Curtis G. P. (2004)Approaches to surface complexation modeling of uraniumadsorption on aquifer sediments. Geochim. Cosmochim. Acta
68, 3621–3641.
Davis J. A., Curtis G. P., Wilkins M. J., Kohler M., Fox P., NaftzD. L. and Lloyd J. R. (2006) Processes affecting transport ofuranium in a suboxic aquifer. Phys. Chem. Earth 31, 548–555.
EPA (2000a) Method 6020. Inductively Coupled Plasma-Mass
Spectrometry. Test methods for Evaluating Solid Waste, Phys-
ical/Chemical Methods. U.S. Environ. Prot. Ag, Washington,DC.
EPA (2000b) Method 3050B: Acid Digestion of Sediments, Sludges,
and Soils. U.S. Environ. Prot. Ag, Washington, DC.Finch R. J. and Murakami T. (1999) Systematics, paragenesis of U
minerals. In Uranium: Mineralogy, Geochemistry and the

Uranium-contaminated sediments from Hanford, Washington, USA 1379
Environment (eds. P. C. Burns and R. J. Finch). Min. Soc. Am.,
Washington, DC.
Hsi C.-K. and Langmuir D. (1985) Adsorption of uranyl ontoferric oxyhydroxides: application of the surface complexationsite-binding model. Geochim. Cosmochim. Acta 49, 1931–
1941.
Ilton E. S., Haiduc A., Moses C. O., Heald S. M., Elbert D. C. andVeblen D. R. (2004) Heterogeneous reduction of uranyl bymicas: crystal chemical and solution controls. Geochim. Cos-
mochim. Acta 68, 2417–2435.
Ilton E. S., Qafoku N. P., Liu C., Moore D. A. and Zachara J. M.(2008) Advective removal of intraparticle uranium from con-taminated vadose zone sediments, Hanford. U.S. Environ. Sci.
& Tech. 42, 1565–1571.
Jones T. E., Simpson B. C., Wood M. I. and Corbin R. A. (2001)Preliminary Inventory Estimates for Single-shell Tank Leaks in
B, BX, and BY Tank Farms. RPP-7389, CH2M HILL HanfordGroup, Richland, WA.
Kalmykov S. N. and Choppin G. R. (2000) Mixed Ca2+/UO22þ/
CO32� complex formation at different ionic strengths. Rad.
Acta 88, 603–606.
Kelly S. D., Rasbury E. T., Chattopadhyay S., Kropf A. J. andKemner K. M. (2006) Evidence of a stable uranyl site in ancientorganic-rich calcite. Environ. Sci. & Tech. 40, 2262–2268.
Kohler M., Curtis G. P., Meece D. E. and Davis J. A. (2004)Methods for estimating absorbed uranium(VI) and distributioncoefficients of contaminated sediments. Environ. Sci. & Tech.
38, 240–247.
Langmuir D. (1997) Aqueous Environmental Geochemistry. PrenticeHall, Upper Saddle River, NJ.
Lindenmeier C. W., Serne R. J., Bjornstad B. N., Gee G. W.,Schaef H. T., Lanigan D. C., Lindberg M. J., Clayton R. E.,LeGore V. L., Kutnyakov I. V., Baum S. R., Geiszler K. N.,Brown C. F., Valenta M. M., Vickerman T. S. and Royack L. J.(2003) Characterization of Vadose Zone Sediment: RCRA
Borehole 299-E33-338 Located Near the B-BX-BY Waste
Management Area. PNNL-14121, Pac. Northwest Nat. Lab.,Richland, Washington.
Liu C., Zachara J. M., Qafoku O. S., McKinley J. P., Heald S. M.and Wang Z. (2004) Dissolution of uranyl microprecipitates insubsurface sediments at Hanford Site, USA. Geochim. Cosmo-
chim. Acta 68, 4519–4537.
Liu C. X., Zachara J. M., Yantasee W., Majors P. D. andMcKinley J. P. (2006) Microscopic reactive diffusion ofuranium in the contaminated sediments at Hanford, UnitedStates. Water Res. 42, Art. No. W12420.
McKinley J. P., Zachara J. M., Liu C., Heald S. C., Prenitzer B. I.and Kempshall B. W. (2006) Microscale controls on the fate ofcontaminant uranium in the vadose zone, Hanford Site,Washington. Geochim. Cosmochim. Acta 70, 1873–1887.
McKinley J. P., Zachara J. M., Wan J., McCready D. E. and HealdS. M. (2007) Geochemical controls on contaminant uranium invadose Hanford Formation sediments at the 200 Area and 300Area, Hanford Site, Washington. Vadose Zone J. 6(4), 1004–
1017.
Narbutovskih S. M. (1998) Results of Phase I Groundwater Quality
Assessment for Single Shell Tank Waste Management Areas B-
BX-BY at the Hanford Site. PNNL-11826, Pac. Northwest Nat.Lab., Richland, WA.
Pabalan R. T. and Turner D. R. (1996) Uranium(+6) sorption onmontmorillonite: experimental and surface complexation mod-eling study. Aqua. Geochem. 2, 203–226.
Payne T. E. and Airy P. L. (2006) Radionuclide migration at theKoongarra uranium deposit, Northern Australia—lessons fromthe Alligator Rivers analogue project. Phys. Chem. Earth 31,
572–586.
Price W. H. and Fecht K. R. (1976) Geology of the 241-BX Tank
Farm. ARH-LD-130, Atl. Rich. Hanf. Co., Richland, WA.Prikryl J. D., Jain A., Turner D. R. and Pabalan R. T. (2001)
Uranium(VI) sorption behavior on silicate mineral mixtures. J.
Contam. Hydrol. 47, 241–253.
Qafoku N. P., Zachara J. M., Liu C., Gassman P. L., Qafoku O. S.and Smith S. C. (2005) Kinetic desorption and sorption ofU(VI) during reactive transport in a contaminated Hanfordsediment. Environ. Sci. & Tech. 39, 3157–3165.
Ravel B. and Newville M. (2005) ATHENA, ARTEMIS,HEPHAESTUS: Data analysis for X-ray absorption spectros-copy using IFEFFIT. J. Synch. Rad. 12, 537–541.
Reeder R. J., Nugent M., Lamble G. M., Tait C. D. and Morris D.E. (2000) Uranyl incorporation into calcite and aragonite:XAFS and luminescence studies. Environ. Sci. & Tech. 34, 638–
644.
Reeder R. J., Nugent M., Tait C. D., Morris D. E., Heald S. M.,Beck K. M., Hess W. P. and Lanzirotti A. (2001) Coprecip-itation of uranium(VI) with calcite: XAFS, micro-XAS, andluminescence characterization. Geochim. Cosmochim. Acta 65,
3491–3503.
Serne R. J., Last G. V., Gee G. W., Schaef H. T., Lanigan D. C.,Lindenmeier C. W., Lindberg M. J., Clayton R. E., Legore V.L., Orr R. D., Kutnyakov I. V., Baum S. R., Geiszler K. N.,Brown C. F., Valenta M. M. and Vickerman T. S. (2002)Characterization of Vadose Zone Sediment: Borehole 299-E33-
45 Near BX-102 in the B-BX-BY Waste Management Area.PNNL-14083, Pac. Northwest Nat. Lab., Richland, WA.
Stubbs J. E., Veblen L. A., Elbert D. C., Zachara J. M., Davis J. A.and Veblen D. R. (2009) Newly recognized hosts for uranium inthe Hanford Site vadose zone. Geochim. Cosmochim. Acta 73,
1563–1576.
Um W., Serne R. J. and Krupka K. M. (2007) Surface complex-ation modeling of U(VI) sorption to Hanford sediment withvarying geochemical conditions. Environ. Sci. & Tech. 41, 3587–
3592.
Um W., Wang Z., Serne R. J., Williams B. D., Brown C. F., DodgeC. J. and Francis A. J. (2009) Uranium phases in contaminatedsediments below Hanford’s U tank farm. Environ. Sci. & Tech.
43, 4280–4286.
Waite T. D., Davis J. A., Payne T. E., Waychunas G. A. and Xu N.(1994) Uranium(VI) adsorption to ferrihydrite: application of asurface complexation model. Geochim. Cosmochim. Acta 58,
5465–5478.
Wang Z., Zachara J. M., Wassana Y., Gassman P. L., Liu C. andJoly A. G. (2004) Cryogenic laser induced fluorescence char-acterization of U(VI) in Hanford vadose zone pore waters.Environ. Sci. & Tech. 38, 5591–5597.
Wang Z., Zachara J. M., Gassman P. L., Liu C., Qafoku O.,Yantasee W. and Catalano J. G. (2005) Fluorescence spectros-copy of U(VI)-silicates and U(VI)-contaminated sediment.Geochim. Cosmochim. Acta 69, 1391–1403.
Wang Z., Zachara J. M., Liu C., Gassman P. L., Felmy A. R. andClark S. B. (2008) A cryogenic fluorescence spectroscopic studyof uranyl carbonate, phosphate and oxyhydroxide minerals.Radiochim. Acta 96, 1–8.
WaveMetrics, IGOR Pro 6. Available from: <www.wavemetrics.com>.
Whicker J. J., Pinder, III, J. E., Ibrahim S. A., Stone J. M.,Breshears D. D. and Baker K. N. (2007) Uranium partitioncoefficients (Kd) in forest surface soil reveal long equilibriumtimes and vary by site and soil size fraction. H. Phys. 93, 36–46.
Wood M. I., Jones T. E., Schalla R., Bjornstad B. N. andNarbutovskih S. M. (2000) Subsurface Conditions Description of
the B-BX-BY Waste Management Area. HNF-5507, Rev. 0,CH2M HILL Hanford Group, Inc., Richland, WA.

1380 W. Um et al. / Geochimica et Cosmochimica Acta 74 (2010) 1363–1380
Zachara J. M., Davis J. A., McKinley J. P., Wellman D. M., LiuC., Qafoku N. P. and Yabusaki S. B. (2005) Uranium
Geochemistry in Vadose Zone and Aquifer Sediments from the
300 Area Uranium Plume, PNNL-15121, Pac. Northwest Nat.Lab, Richland, WA.
Zachara J. M., Serne J., Freshley M., Mann F., Anderson F.,Wood M., Jones T. and Myers D. (2007) Geochemical
processes controlling migration of tank wastes in Hanford’svadose zone. Vadose Zone J. 6, 985–1003.
Associate editor: Peggy A. O’Day
Related Documents