Characterization of the Particle-Matrix Interface in Rubber-Modified Epoxy by Atomic Force Microscopy 0. 1. SHAFFER,',' R. BAGHER1,2,4 J. Y. QIAN,'-3 V. DIMONIE,',' R. A. PEARSON,','r4 and M. S. EL-AASSER,'-3r* 'Emulsion Polymers institute, *Polymer interfaces Center, 3Department of Chemical Engineering, and 4Department of Materials Science & Engineering, Lehigh University, Bethlehem, Pennsylvania 1801 5 SYNOPSIS Atomic force microscopy (AFM) was used to study the interphase regions in rubber-tough- ened epoxy polymers. The nature of the interphase region was varied by either the adducting of reactive oligomers or by crosslinking the shell polymer on core/shell latex particles. The adducted reactive oligomers were comprised of carboxyl-terminated, butadiene-actrylonitrile copolymers (CTBN) prereacted with either (1) a low molecular weight diglycidyl ether of bisphenol A-based epoxy, which results in an interphase with increased crosslink density, or (2) a high molecular weight epoxy based on the diglycidyl ether of propylene glycol (DEGP), which results in an interphase with decreased crosslink density. The second type of rubber particles is custom-made submicron core/shell latex particles of a poly(butadiene- co-styrene)[P(BS)] core with an acrylate shell. Two acrylate shells were (1) PMMA/AN shell containing 25% acrylonitile and (2) a similar PMMA/AN with 5% divinyl benzene. The toughness of these blends was characterized using linear elastic fracture mechanics. The features on the fracture surfaces were examined using both AFM and FESEM (field emission scanning electron microscopy). AFM was able to detect features not observed in SEM and also to quantify all of the fracture surface features. In particular, the height-to- width ratio of the rim surrounding cavitated particles provided a useful means for deter- mining the ductility of the interphase region. Attempts were made to determine the size of the interphase region using the frictional mode and the tip-adhesion forces. Unfortunately, the results of both approaches are inconclusive at the present time; this is most likely due to the deformation surrounding the rubber particles detected in the fast fracture regions. 0 1995 John Wiley & Sons, Inc. INTRODUCTION In the early 1980s Binnig and co-workers devel- oped the scanning tunneling microscope (STM) to image a structure as well as study the electrical properties of insulators thin enough to allow elec- tron tunneling. In order to image thick insulators that did not permit electron tunneling, Binnig, Quate, and Gerber developed the atomic force microscope (AFM) in 1986.' Now it is possible to image polymers, 3-5 glass, metal oxides, and * To whom correspondence should be addressed at Lehigh University, Department of Chemical Engineering, 111 Research Drive, Bethlehem, PA 18015. Journal of Applied Polymer Science, Val. 58, 465-484 (1995) 0 1995 John Wiley & Sons, Inc. CCC OOZl-8995/95/OZ0465-20 biological material in air8p9 or liquids such as water 'O-" or organic media.13 We can also use the AFM in a variety of surface studies such as fric- tion, l4*I5 elasticity, and adhesion 16-18 with excel- lent spatial resolution. This investigation explores the possibility of using the AFM for studying the interface region of rubber-toughened epoxy resins. The modification of glassy polymers by the in- troduction of rubber particles into the matrix in- creases the toughness of the brittle material and has proven to be quite successful.'g~'O Many in- vestigators have studied the role of the rubber particles, but little has been done to understand the role of the particle-matrix interface. By changing the ductility of this interface we hope to elucidate its role in providing improvements in 465

Welcome message from author
This document is posted to help you gain knowledge. Please leave a comment to let me know what you think about it! Share it to your friends and learn new things together.
Transcript
Characterization of the Particle-Matrix Interface in Rubber-Modified Epoxy by Atomic Force Microscopy
0. 1. SHAFFER,',' R. BAGHER1,2,4 J. Y. QIAN,'-3 V. DIMONIE,',' R. A. PEARSON,','r4 and M. S. EL-AASSER,'-3r*
'Emulsion Polymers institute, *Polymer interfaces Center, 3Department of Chemical Engineering, and 4Department of Materials Science & Engineering, Lehigh University, Bethlehem, Pennsylvania 1801 5
SYNOPSIS
Atomic force microscopy (AFM) was used to study the interphase regions in rubber-tough- ened epoxy polymers. The nature of the interphase region was varied by either the adducting of reactive oligomers or by crosslinking the shell polymer on core/shell latex particles. The adducted reactive oligomers were comprised of carboxyl-terminated, butadiene-actrylonitrile copolymers (CTBN) prereacted with either (1) a low molecular weight diglycidyl ether of bisphenol A-based epoxy, which results in an interphase with increased crosslink density, or (2) a high molecular weight epoxy based on the diglycidyl ether of propylene glycol (DEGP), which results in an interphase with decreased crosslink density. The second type o f rubber particles is custom-made submicron core/shell latex particles of a poly(butadiene- co-styrene)[P(BS)] core with an acrylate shell. Two acrylate shells were (1) PMMA/AN shell containing 25% acrylonitile and (2) a similar PMMA/AN with 5% divinyl benzene. The toughness of these blends was characterized using linear elastic fracture mechanics. The features on the fracture surfaces were examined using both AFM and FESEM (field emission scanning electron microscopy). AFM was able to detect features not observed in SEM and also to quantify all of the fracture surface features. In particular, the height-to- width ratio of the rim surrounding cavitated particles provided a useful means for deter- mining the ductility of the interphase region. Attempts were made to determine the size of the interphase region using the frictional mode and the tip-adhesion forces. Unfortunately, the results of both approaches are inconclusive at the present time; this is most likely due to the deformation surrounding the rubber particles detected in the fast fracture regions. 0 1995 John Wiley & Sons, Inc.
INTRODUCTION
In the early 1980s Binnig and co-workers devel- oped the scanning tunneling microscope ( S T M ) to image a structure as well as study the electrical properties of insulators thin enough to allow elec- tron tunneling. In order to image thick insulators that did not permit electron tunneling, Binnig, Quate, and Gerber developed the atomic force microscope (AFM) in 1986.' Now it is possible to image polymers, 3-5 glass, metal oxides, and
* To whom correspondence should be addressed at Lehigh University, Department of Chemical Engineering, 111 Research Drive, Bethlehem, PA 18015. Journal of Applied Polymer Science, Val. 58, 465-484 (1995) 0 1995 John Wiley & Sons, Inc. CCC OOZl-8995/95/OZ0465-20
biological material in air8p9 or liquids such as water 'O-" or organic media.13 We can also use the AFM in a variety of surface studies such as fric- tion, l4*I5 elasticity, and adhesion 16-18 with excel- lent spatial resolution. This investigation explores the possibility of using the AFM for studying the interface region of rubber-toughened epoxy resins.
The modification of glassy polymers by the in- troduction of rubber particles into the matrix in- creases the toughness of the brittle material and has proven to be quite successful.'g~'O Many in- vestigators have studied the role of the rubber particles, but little has been done to understand the role of the particle-matrix interface. By changing the ductility of this interface we hope to elucidate its role in providing improvements in
465
466 SHAFFER ET AL.
fast-f ract ure, non-whitened or undamaged zone
notch ' whitened or damaged zone
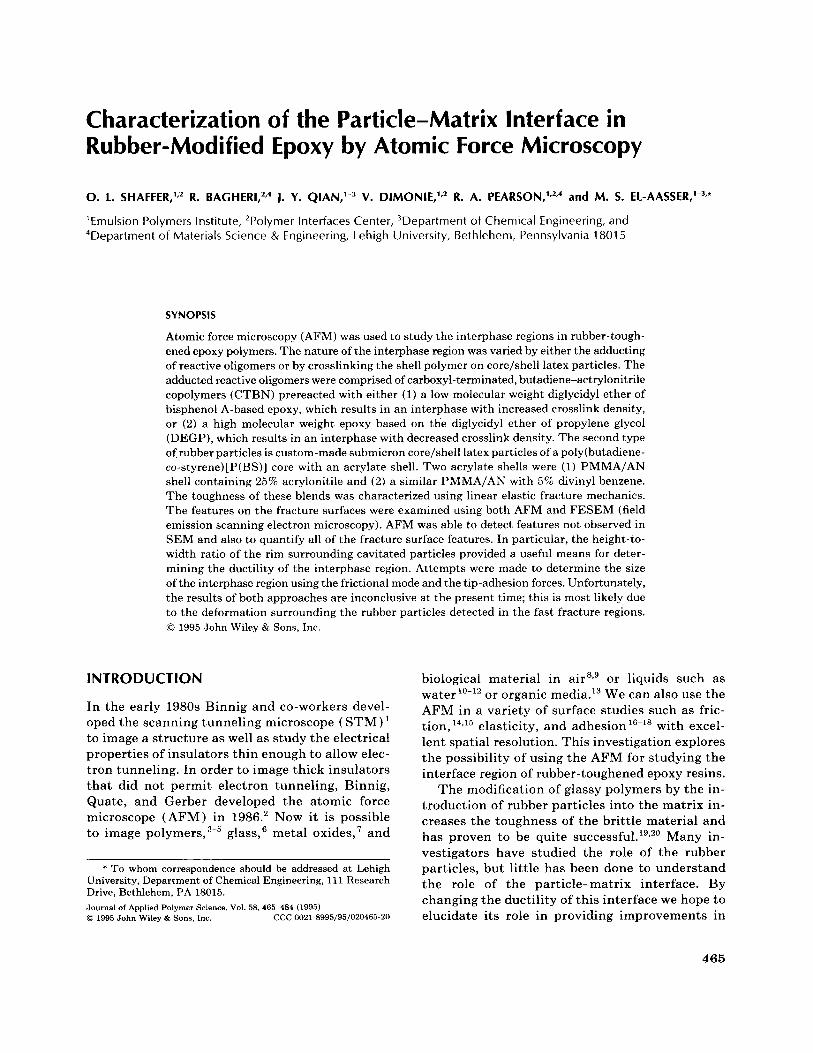
Figure 1 Fractured surface from a three-point-bend test.
toughness. Electron microscopy, both scanning and transmission, have been used to study the morphology of fractured surfaces and morphology, respectively. The size and size distribution of the rubber particles can be measured, and by staining the rubber,'* it is possible to image the presence of the rubber in the cavitated particles. By micro- toming the sample into thin sections of about 100 nm and staining the rubber particles, the mor- phology below the surface can be investigated by TEM. Also, if the rubber particles or features of interest are too small to be seen by SEM, the sur- face can be replicated and then examined by TEM." Optical microscopy has been used to study the cross-sections of fractured rubber-modified materials in order to examine the extent of damage below the surface such as cavitation and shear banding." Of these techniques, SEM is the most widely utilized technique to study fracture mech- anisms. Unfortunately, it is difficult t o quantify the depths of the holes or heights of any interesting features observed using SEM. AFM imaging of the fractured surface provides quantitative informa- tion of the features on the fracture surface. More- over, frictional images should be able to detect the rubber in the cavitated particles, and adhesion forces between the AFM tip and the sample should be able to determine the size of the particle-matrix
A
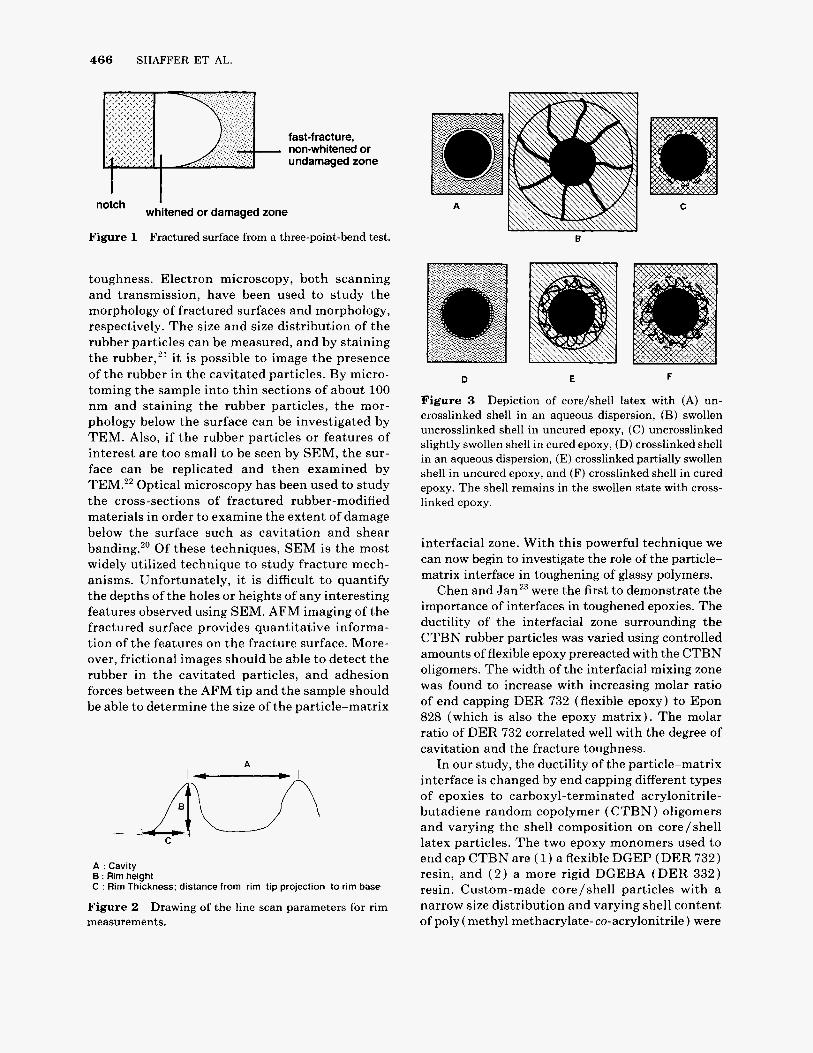
A : Cavity B : Rim height C : Rim Thickness; distance from rim tip projection to rim base
Figure 2 measurements.
Drawing of the line scan parameters for rim
D E F
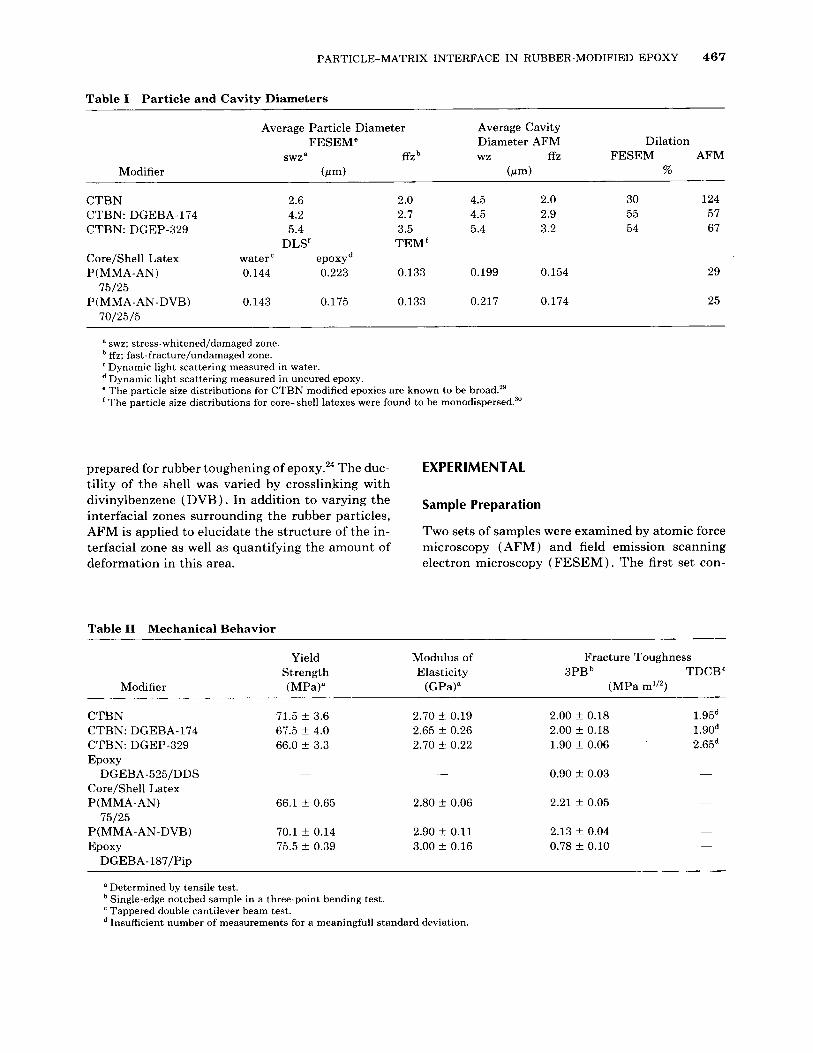
Figure 3 Depiction of core/shell latex with (A) un- crosslinked shell in an aqueous dispersion, (B) swollen uncrosslinked shell in uncured epoxy, (C) uncrosslinked slightly swollen shell in cured epoxy, (D) crosslinked shell in an aqueous dispersion, (E) crosslinked partially swollen shell in uncured epoxy, and (F) crosslinked shell in cured epoxy. The shell remains in the swollen state with cross- linked epoxy.
interfacial zone. With this powerful technique we can now begin to investigate the role of the particle- matrix interface in toughening of glassy polymers.
Chen and Jan23 were the first to demonstrate the importance of interfaces in toughened epoxies. The ductility of the interfacial zone surrounding the CTBN rubber particles was varied using controlled amounts of flexible epoxy prereacted with the CTBN oligomers. The width of the interfacial mixing zone was found to increase with increasing molar ratio of end capping DER 732 (flexible epoxy) to Epon 828 (which is also the epoxy matrix). The molar ratio of DER 732 correlated well with the degree of cavitation and the fracture toughness.
In our study, the ductility of the particle-matrix interface is changed by end capping different types of epoxies to carboxyl-terminated acrylonitrile- butadiene random copolymer ( CTBN ) oligomers and varying the shell composition on core/shell latex particles. The two epoxy monomers used to end cap CTBN are ( 1 ) a flexible DGEP (DER 732) resin, and ( 2 ) a more rigid DGEBA (DER 332) resin. Custom-made core /shell particles with a narrow size distribution and varying shell content of poly (methyl methacrylate- co-acrylonitrile ) were
PARTICLE-MATRIX INTERFACE IN RUBBER-MODIFIED EPOXY 467
Table I Particle and Cavity Diameters
Average Particle Diameter Average Cavity FESEM" Diameter AFM Dilation
swza ffib wz f f Z FESEM AFM Modifier (w4 (w) %
CTBN 2.6 2.0 4.5 2.0 30 124 CTBN: DGEBA-174 4.2 2.7 4.5 2.9 55 57 CTBN: DGEP-329 5.4 3.5 5.4 3.2 54 67
Core/Shell Latex water' epoxyd P(MMA-AN) 0.144 0.223 0.133 0.199 0.154 29
P(MMA-AN-DVB) 0.143 0.175 0.133 0.217 0.174 25
D L S ~ TEM'
75/25
70/25/5
swz; stress-whitened/damaged zone. ff'z; fast-fracture/undamaged zone.
Dynamic light scattering measured in uncured epoxy. The particle size distributions for CTBN modified epoxies are known to be broad." The particle size distributions for core-shell latexes were found to be monodispersed?'
' Dynamic light scattering measured in water.
prepared for rubber toughening of epoxy.24 The duc- tility of the shell was varied by crosslinking with divinylbenzene (DVB). In addition to varying the interfacial zones surrounding the rubber particles, AFM is applied to elucidate the structure of the in- terfacial zone as well as quantifying the amount of deformation in this area.
EXPERIMENTAL
sample Preparation
Two sets of samples were examined by atomic force microscopy ( AFM) and field emission scanning electron microscopy (FESEM). The first set con-
Table I1 Mechanical Behavior
Modifier
Yield Modulus of Strength Elasticity (MPa)" (GPa)a
Fracture Toughness
(MPa m1'2) 3PB TDCB"
CTBN 71.5 f 3.6 2.70 .t 0.19 2.00 t 0.18 1.95d CTBN: DGEBA-174 67.5 t 4.0 2.65 t 0.26 2.00 t 0.18 1.90d CTBN: DGEP-329 66.0 t 3.3 2.70 k 0.22 1.90 t 0.06 2.65d EPOXY
DGEBA-525/DDS - - 0.90 5 0.03 -
Core/Shell Latex P(MMA-AN) 66.1 f 0.65 2.80 .t 0.06 2.21 t 0.05 -
P(MMA-AN-DVB) 70.1 f 0.14 2.90 f 0.11 2.13 t 0.04 -
75.5 f 0.39 3.00 f 0.16 0.78 k 0.10 - EPOXY
75/25
DGEBA-l87/Pip
a Determined by tensile test. Single-edge notched sample in a three-point bending test. Tappered double cantilever beam test. Insuficient number of measurements for a meaningful1 standard deviation
468 SHAFFER ET AL.
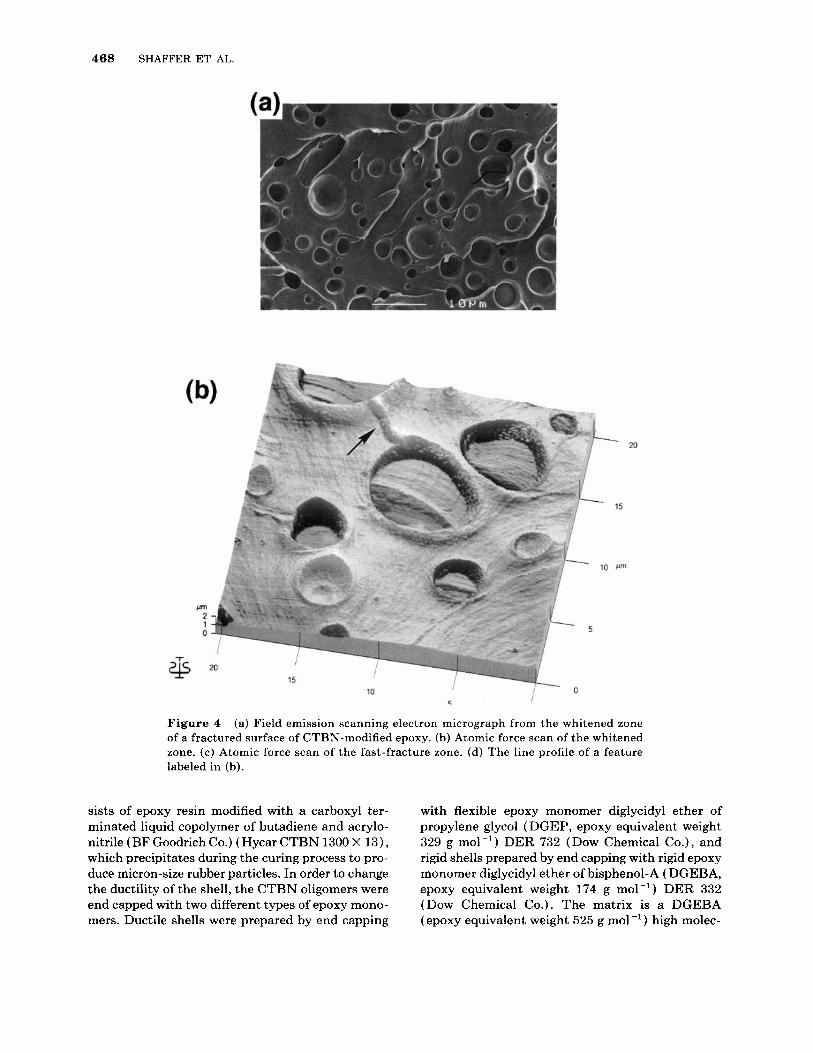
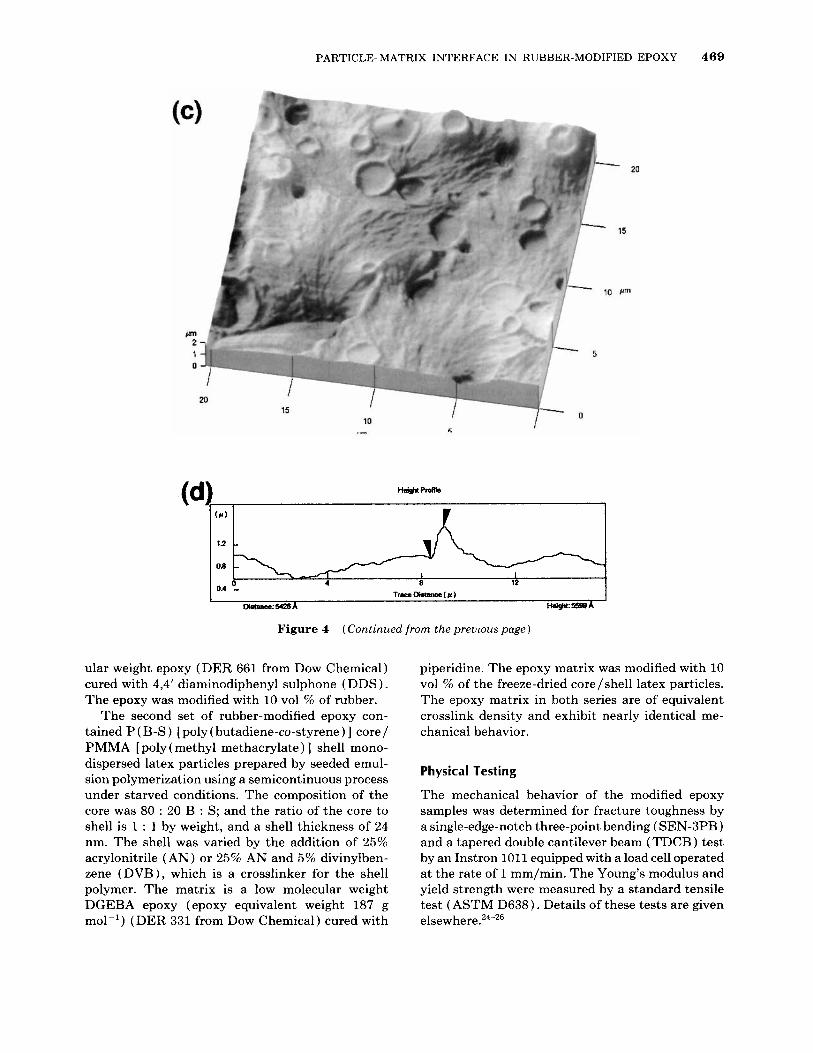
Figure 4 (a) Field emission scanning electron micrograph from the whitened zone of a fractured surface of CTBN-modified epoxy. (b) Atomic force scan of the whitened zone. (c) Atomic force scan of the fast-fracture zone. (d) The line profile of a feature labeled in (b).
sists of epoxy resin modified with a carboxyl ter- minated liquid copolymer of butadiene and acrylo- nitrile (BF Goodrich Co.) (Hycar CTBN 1300 X 13) , which precipitates during the curing process to pro- duce micron-size rubber particles. In order to change the ductility of the shell, the CTBN oligomers were end capped with two different types of epoxy mono- mers. Ductile shells were prepared by end capping
with flexible epoxy monomer diglycidyl ether of propylene glycol ( DGEP, epoxy equivalent weight 329 g mo1-l) DER 732 (Dow Chemical Co.), and rigid shells prepared by end capping with rigid epoxy monomer diglycidyl ether of bisphenol-A ( DGEBA, epoxy equivalent weight 174 g mol-') DER 332 (Dow Chemical Co.). The matrix is a DGEBA (epoxy equivalent weight 525 g mol-') high molec-
PARTICLE-MATRIX INTERFACE IN RUBBER-MODIFIED EPOXY 469
Figure 4 (Continued from the previous page)
ular weight epoxy (DER 661 from Dow Chemical) cured with 4,4' diaminodiphenyl sulphone (DDS) . The epoxy was modified with 10 vol % of rubber.
The second set of rubber-modified epoxy con- tained P (B-S) [ poly (butadiene-co-styrene) ] core/ PMMA [ poly (methyl methacrylate) ] shell mono- dispersed latex particles prepared by seeded emul- sion polymerization using a semicontinuous process under starved conditions. The composition of the core was 80 : 20 B : S; and the ratio of the core to shell is 1 : 1 by weight, and a shell thickness of 24 nm. The shell was varied by the addition of 25% acrylonitrile (AN) or 25% AN and 5% divinylben- zene (DVB), which is a crosslinker for the shell polymer. The matrix is a low molecular weight DGEBA epoxy (epoxy equivalent weight 187 g mol-') (DER 331 from Dow Chemical) cured with
piperidine. The epoxy matrix was modified with 10 vol % of the freeze-dried core/shell latex particles. The epoxy matrix in both series are of equivalent crosslink density and exhibit nearly identical me- chanical behavior.
Physical Testing
The mechanical behavior of the modified epoxy samples was determined for fracture toughness by a single-edge-notch three-point bending ( SEN-3PB) and a tapered double cantilever beam (TDCB) test by an Instron 1011 equipped with a load cell operated at the rate of 1 mm/min. The Young's modulus and yield strength were measured by a standard tensile test ( ASTM D638). Details of these tests are given e l ~ e w h e r e . ~ ~ - ~ ~
470 SHAFFER ET AL.
Atomic Force Microscopy
The fractured surfaces from the SEN-3PB test were examined by a Park Autoprobe CP atomic force mi- croscope (AFM) of the optical deflection type a t constant force in the contact (repulsive) mode in which the tip is always touching the surface when the feedback loop is on. Line profiles of cavitated particles were generated on scanned images to mea- sure the diameters of the cavities. The rim that formed around each cavity was measured for its height and thickness, as shown in Figure 2. Because of deformation occurring adjacent to the cavitated rubber particles, it was very important to choose a cavitated particle that was not near another cavity. Also, each line profile scan measurement was made a t a similar point of fracture of the rim surrounding the cavity. This was done to ensure comparable data points of examination for each cavitated particle, regardless of cavity size. The direction of all the fractures is from the bottom of the image to the top of the image.
The lateral (friction) mode was also applied. Here, the component measured is the twisting of the lever caused by the friction of the tip on the surface of the sample as the sample is scanned by a 100 pm piezo scanner. An operating force of - 10 nN was applied using an all-silicon Ultralever@ having a force constant of 0.06 N/m. The ultralever was chosen because of its high aspect ratio of 3:l and conical tips. The typical radius of curvature for the Ultralever@ tips is 10 nm, which is needed to image submicron diameter ~avi t ies . '~ Both the dam- aged-whitened zone and the fast-fracture undam- aged zone were imaged in all the samples.
AFM tip-sample adhesion forces were measured by moving the sample vertically with respect to the tip and measuring the deflection signal of the can- tilever. First, a scan was collected and then the tip positioned in the region of interest. Regions chosen for force curves were the epoxy matrix, inside a cav- itated rubber particle, and the interphase region be- tween the cavitated rubber particle and epoxy ma- trix. Given the spring constant (supplied by Park) of the cantilever, the tip-sample adhesion force was calculated.
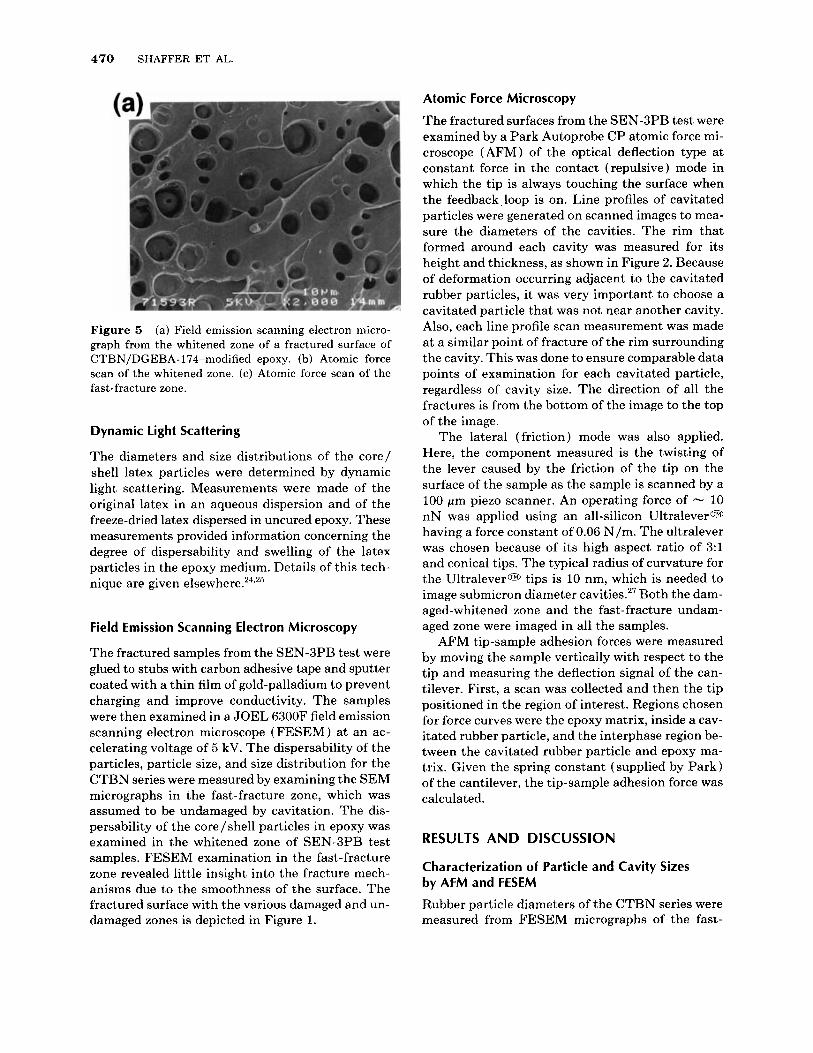
Figure 5 (a) Field emission scanning electron micro- graph from the whitened zone of a fractured surface of CTBN/DGEBA-174-modified epoxy. (b) Atomic force scan of the whitened zone. ( c ) Atomic force scan of the fast-fracture zone.
Dynamic light Scattering
The diameters and size distributions of the core/ shell latex particles were determined by dynamic light scattering. Measurements were made of the original latex in an aqueous dispersion and of the freeze-dried latex dispersed in uncured epoxy. These measurements provided information concerning the degree of dispersability and swelling of the latex particles in the epoxy medium. Details of this tech- nique are given e l ~ e w h e r e . ~ ~ , ~ ~
Field Emission Scanning Electron Microscopy
The fractured samples from the SEN-3PB test were glued to stubs with carbon adhesive tape and sputter coated with a thin film of gold-palladium to prevent charging and improve conductivity. The samples were then examined in a JOEL 6300F field emission scanning electron microscope (FESEM) a t an ac- celerating voltage of 5 kV. The dispersability of the particles, particle size, and size distribution for the CTBN series were measured by examining the SEM micrographs in the fast-fracture zone, which was assumed to be undamaged by cavitation. The dis- persability of the core/shell particles in epoxy was examined in the whitened zone of SEN-3PB test samples. FESEM examination in the fast-fracture zone revealed little insight into the fracture mech- anisms due to the smoothness of the surface. The fractured surface with the various damaged and un- damaged zones is depicted in Figure 1.
RESULTS AND DISCUSSION
Characterization of Particle and Cavity Sizes by AFM and FESEM
Rubber particle diameters of the CTBN series were measured from FESEM micrographs of the fast-
PARTICLE-MATRIX INTERFACE IN RUBBER-MODIFIED EPOXY 47 1
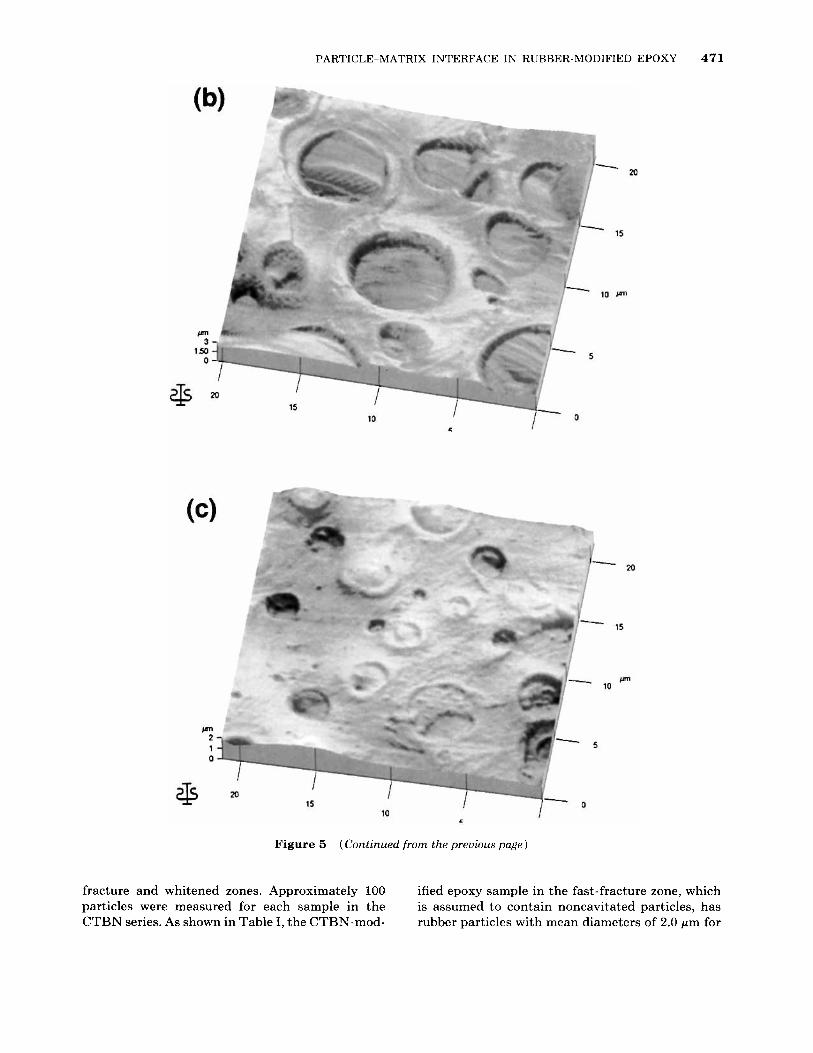
Figure 5 (Continued from the previous page)
fracture and whitened zones. Approximately 100 particles were measured for each sample in the CTBN series. As shown in Table I, the CTBN-mod-
ified epoxy sample in the fast-fracture zone, which is assumed to contain noncavitated particles, has rubber particles with mean diameters of 2.0 pm for
472 SHAFFER ET AL.
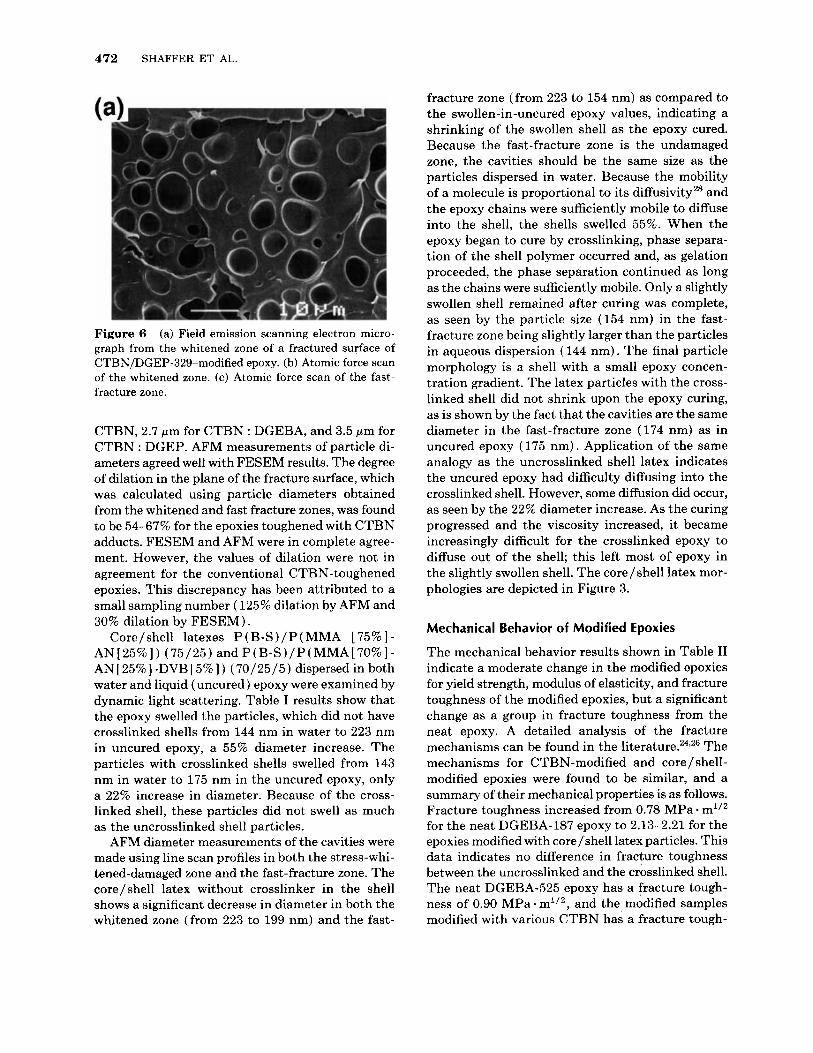
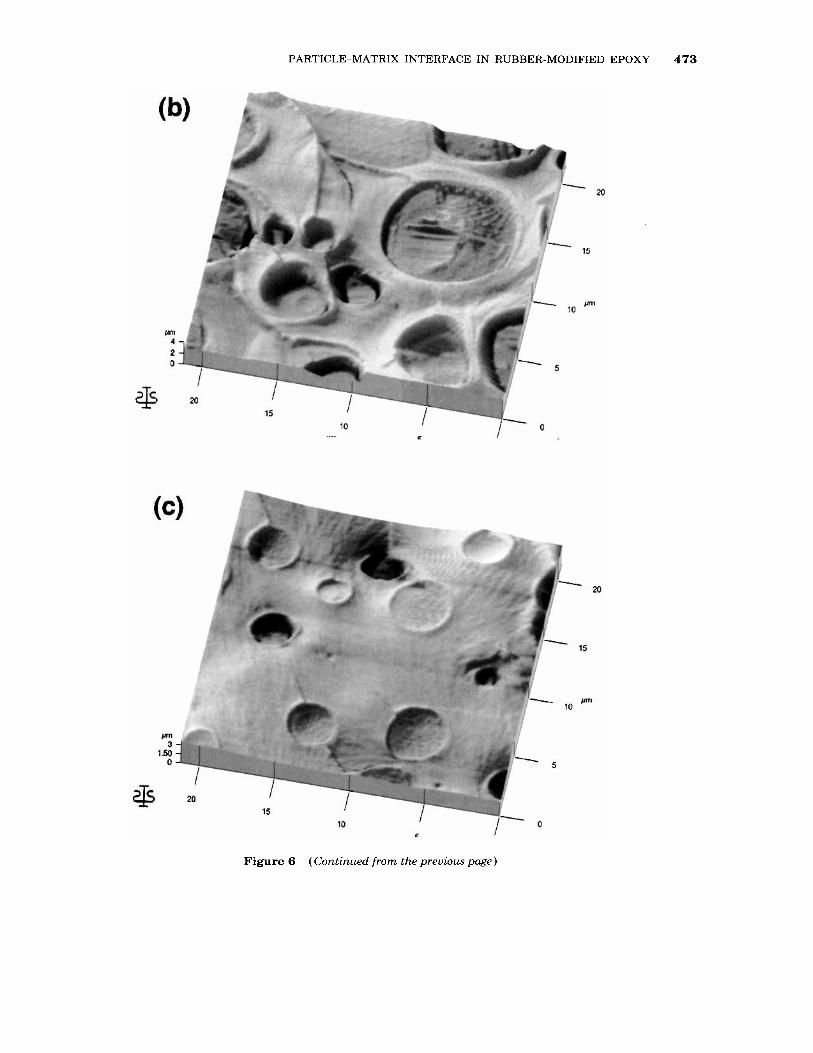
Figure 6 (a) Field emission scanning electron micro- graph from the whitened zone of a fractured surface of CTBN/DGEP-329-modified epoxy. (b) Atomic force scan of the whitened zone. (c) Atomic force scan of the fast- fracture zone.
CTBN, 2.7 pm for CTBN : DGEBA, and 3.5 pm for CTBN : DGEP. AFM measurements of particle di- ameters agreed well with FESEM results. The degree of dilation in the plane of the fracture surface, which was calculated using particle diameters obtained from the whitened and fast fracture zones, was found to be 54-67% for the epoxies toughened with CTBN adducts. FESEM and AFM were in complete agree- ment. However, the values of dilation were not in agreement for the conventional CTBN-toughened epoxies. This discrepancy has been attributed to a small sampling number ( 125% dilation by AFM and 30% dilation by FESEM) .
Core/shell latexes P(B-S) /P(MMA [75%]- AN [ 25% ] ) ( 75/25) and P (B-S) /P (MMA [ 70% ] - AN [ 25%] -DVB [ 5%]) (70/25/5) dispersed in both water and liquid (uncured) epoxy were examined by dynamic light scattering. Table I results show that the epoxy swelled the particles, which did not have crosslinked shells from 144 nm in water to 223 nm in uncured epoxy, a 55% diameter increase. The particles with crosslinked shells swelled from 143 nm in water to 175 nm in the uncured epoxy, only a 22% increase in diameter. Because of the cross- linked shell, these particles did not swell as much as the uncrosslinked shell particles.
AFM diameter measurements of the cavities were made using line scan profiles in both the stress-whi- tened-damaged zone and the fast-fracture zone. The core /shell latex without crosslinker in the shell shows a significant decrease in diameter in both the whitened zone (from 223 to 199 nm) and the fast-
fracture zone (from 223 to 154 nm) as compared to the swollen-in-uncured epoxy values, indicating a shrinking of the swollen shell as the epoxy cured. Because the fast-fracture zone is the undamaged zone, the cavities should be the same size as the particles dispersed in water. Because the mobility of a molecule is proportional to its diffusivityZ8 and the epoxy chains were sufficiently mobile to diffuse into the shell, the shells swelled 55%. When the epoxy began to cure by crosslinking, phase separa- tion of the shell polymer occurred and, as gelation proceeded, the phase separation continued as long as the chains were sufficiently mobile. Only a slightly swollen shell remained after curing was complete, as seen by the particle size (154 nm) in the fast- fracture zone being slightly larger than the particles in aqueous dispersion ( 144 nm) . The final particle morphology is a shell with a small epoxy concen- tration gradient. The latex particles with the cross- linked shell did not shrink upon the epoxy curing, as is shown by the fact that the cavities are the same diameter in the fast-fracture zone (174 nm) as in uncured epoxy ( 175 nm) . Application of the same analogy as the uncrosslinked shell latex indicates the uncured epoxy had difficulty diffusing into the crosslinked shell. However, some diffusion did occur, as seen by the 22% diameter increase. As the curing progressed and the viscosity increased, it became increasingly difficult for the crosslinked epoxy to diffuse out of the shell; this left most of epoxy in the slightly swollen shell. The core/shell latex mor- phologies are depicted in Figure 3.
Mechanical Behavior of Modified Epoxies
The mechanical behavior results shown in Table I1 indicate a moderate change in the modified epoxies for yield strength, modulus of elasticity, and fracture toughness of the modified epoxies, but a significant change as a group in fracture toughness from the neat epoxy. A detailed analysis of the fracture mechanisms can be found in the l i t e r a t ~ r e . ~ ~ * ~ ~ The mechanisms for CTBN-modified and core/ shell- modified epoxies were found to be similar, and a summary of their mechanical properties is as follows. Fracture toughness increased from 0.78 MPa - m1I2 for the neat DGEBA-187 epoxy to 2.13-2.21 for the epoxies modified with core/shell latex particles. This data indicates no difference in fracture toughness between the uncrosslinked and the crosslinked shell. The neat DGEBA-525 epoxy has a fracture tough- ness of 0.90 MPa * ml/', and the modified samples modified with various CTBN has a fracture tough-
PARTICLE-MATRIX INTERFACE IN RUBBER-MODIFIED EPOXY 473
Figure 6 (Continued from the previous page)
474 SHAFFER ET AL.
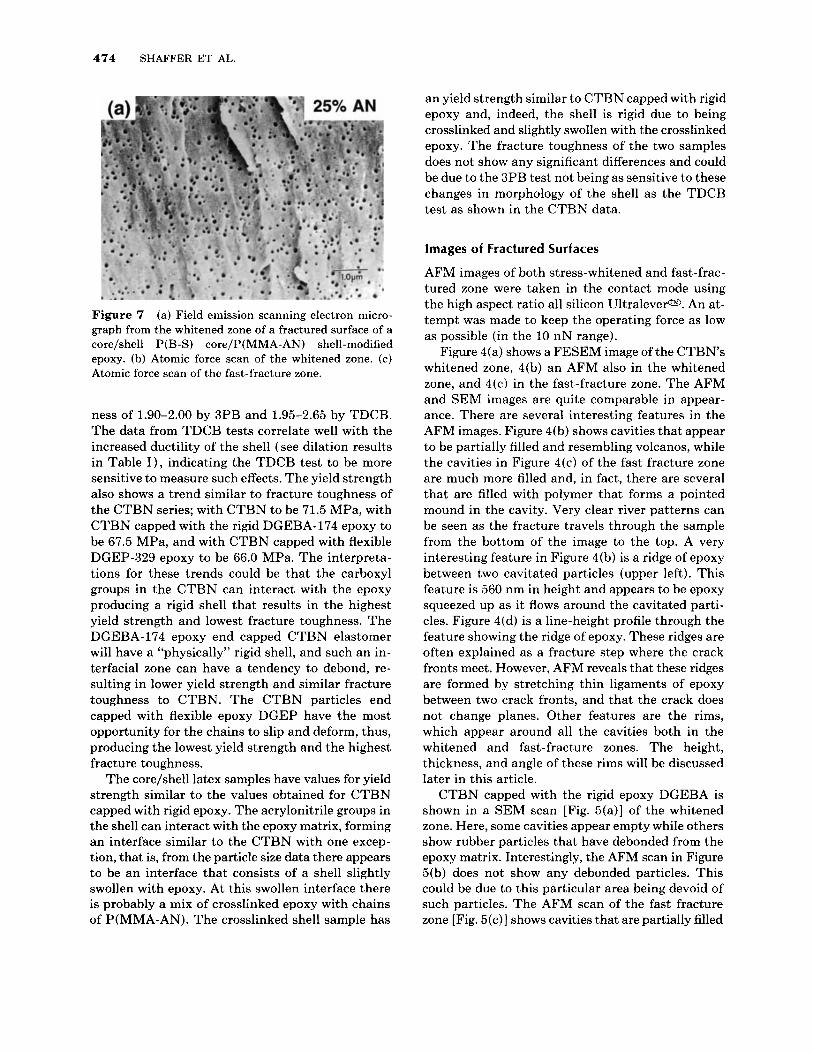
Figure 7 (a) Field emission scanning electron micro- graph from the whitened zone of a fractured surface of a core/shell P(B-S) core/P(MMA-AN) shell-modified epoxy. (b) Atomic force scan of the whitened zone. (c) Atomic force scan of the fast-fracture zone.
ness of 1.90-2.00 by 3PB and 1.95-2.65 by TDCB. The data from TDCB tests correlate well with the increased ductility of the shell (see dilation results in Table I ) , indicating the TDCB test to be more sensitive to measure such effects. The yield strength also shows a trend similar to fracture toughness of the CTBN series; with CTBN to be 71.5 MPa, with CTBN capped with the rigid DGEBA-174 epoxy to be 67.5 MPa, and with CTBN capped with flexible DGEP-329 epoxy to be 66.0 MPa. The interpreta- tions for these trends could be that the carboxyl groups in the CTBN can interact with the epoxy producing a rigid shell that results in the highest yield strength and lowest fracture toughness. The DGEBA-174 epoxy end capped CTBN elastomer will have a “physically” rigid shell, and such an in- terfacial zone can have a tendency to debond, re- sulting in lower yield strength and similar fracture toughness to CTBN. The CTBN particles end capped with flexible epoxy DGEP have the most opportunity for the chains to slip and deform, thus, producing the lowest yield strength and the highest fracture toughness.
The core/shell latex samples have values for yield strength similar to the values obtained for CTBN capped with rigid epoxy. The acrylonitrile groups in the shell can interact with the epoxy matrix, forming an interface similar to the CTBN with one excep- tion, that is, from the particle size data there appears to be an interface that consists of a shell slightly swollen with epoxy. At this swollen interface there is probably a mix of crosslinked epoxy with chains of P(MMA-AN). The crosslinked shell sample has
an yield strength similar to CTBN capped with rigid epoxy and, indeed, the shell is rigid due to being crosslinked and slightly swollen with the crosslinked epoxy. The fracture toughness of the two samples does not show any significant differences and could be due to the 3PB test not being as sensitive to these changes in morphology of the shell as the TDCB test as shown in the CTBN data.
Images of Fractured Surfaces
AFM images of both stress-whitened and fast-frac- tured zone were taken in the contact mode using the high aspect ratio all silicon Ultralevera. An at- tempt was made to keep the operating force as low as possible (in the 10 nN range).
Figure 4(a) shows a FESEM image of the CTBN’s whitened zone, 4(b) an AFM also in the whitened zone, and 4(c) in the fast-fracture zone. The AFM and SEM images are quite comparable in appear- ance. There are several interesting features in the AFM images. Figure 4(b) shows cavities that appear to be partially filled and resembling volcanos, while the cavities in Figure 4(c) of the fast fracture zone are much more filled and, in fact, there are several that are filled with polymer that forms a pointed mound in the cavity. Very clear river patterns can be seen as the fracture travels through the sample from the bottom of the image to the top. A very interesting feature in Figure 4(b) is a ridge of epoxy between two cavitated particles (upper left). This feature is 560 nm in height and appears to be epoxy squeezed up as it flows around the cavitated parti- cles. Figure 4(d) is a line-height profile through the feature showing the ridge of epoxy. These ridges are often explained as a fracture step where the crack fronts meet. However, AFM reveals that these ridges are formed by stretching thin ligaments of epoxy between two crack fronts, and that the crack does not change planes. Other features are the rims, which appear around all the cavities both in the whitened and fast-fracture zones. The height, thickness, and angle of these rims will be discussed later in this article.
CTBN capped with the rigid epoxy DGEBA is shown in a SEM scan [Fig. 5(a)] of the whitened zone. Here, some cavities appear empty while others show rubber particles that have debonded from the epoxy matrix. Interestingly, the AFM scan in Figure 5(b) does not show any debonded particles. This could be due to this particular area being devoid of such particles. The AFM scan of the fast fracture zone [Fig. 5(c)] shows cavities that are partially filled

PARTICLE-MATRIX INTERFACE IN RUBBER-MODIFIED EPOXY 475
Figure 7 (Continued from the previous page)
476 SHAFFER ET AL
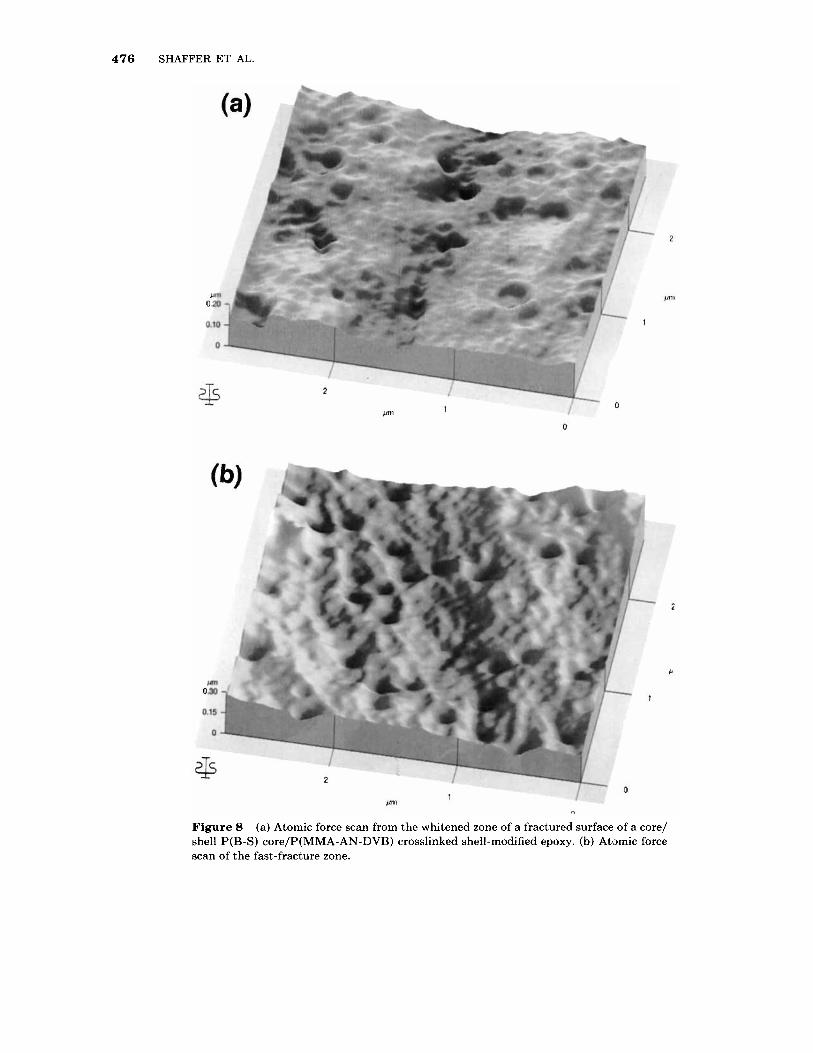
Figure 8 (a) Atomic force scan from the whitened zone of a fractured surface of a core/ shell P(B-S) core/P(MMA-AN-DVB) crosslinked shell-modified epoxy. (b) At,amic force scan of the fast-fracture zone.
PARTICLE-MATRIX INTERFACE IN RUBBER-MODIFIED EPOXY 477
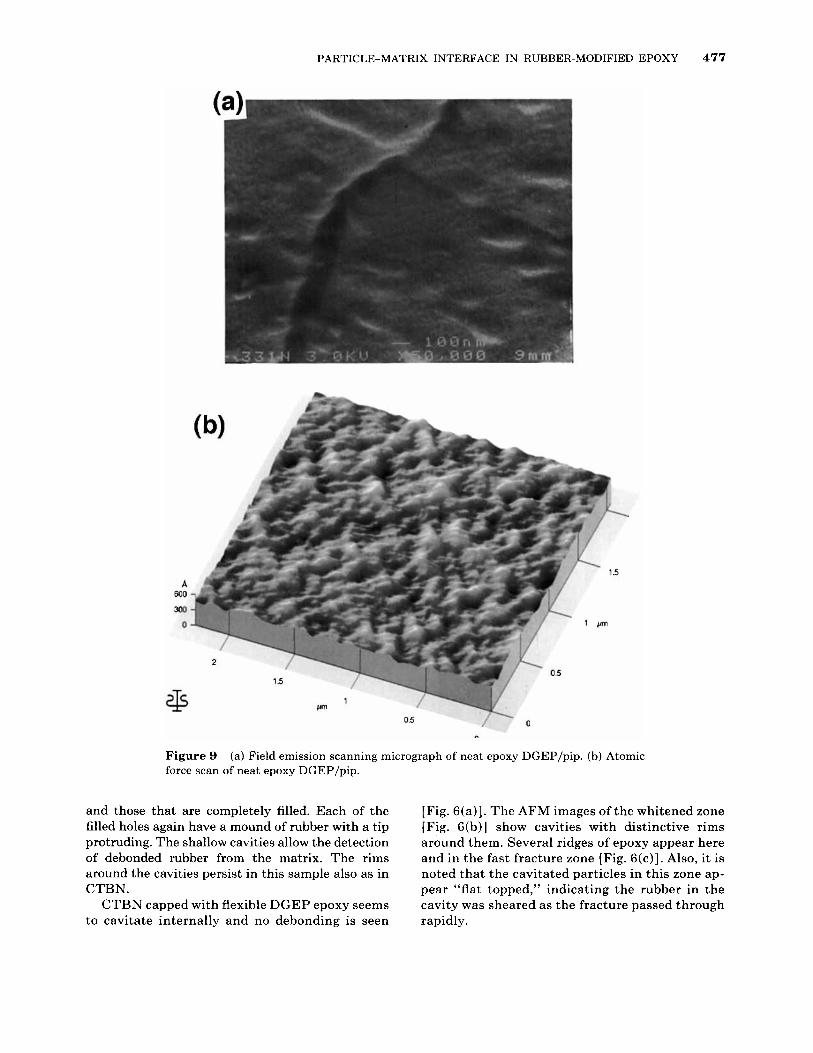
Figure 9 force scan of neat epoxy DGEP/pip.
(a) Field emission scanning micrograph of neat epoxy DGEP/pip. (b) Atomic
and those that are completely filled. Each of the filled holes again have a mound of rubber with a tip protruding. The shallow cavities allow the detection of debonded rubber from the matrix. The rims around the cavities persist in this sample also as in CTBN.
CTBN capped with flexible DGEP epoxy seems to cavitate internally and no debonding is seen
[Fig. 6(a)]. The AFM images of the whitened zone [Fig. 6(b)] show cavities with distinctive rims around them. Several ridges of epoxy appear here and in the fast fracture zone [Fig. 6(c)]. Also, it is noted that the cavitated particles in this zone ap- pear “flat topped,” indicating the rubber in the cavity was sheared as the fracture passed through rapidly.
478 SHAFFER ET AL.
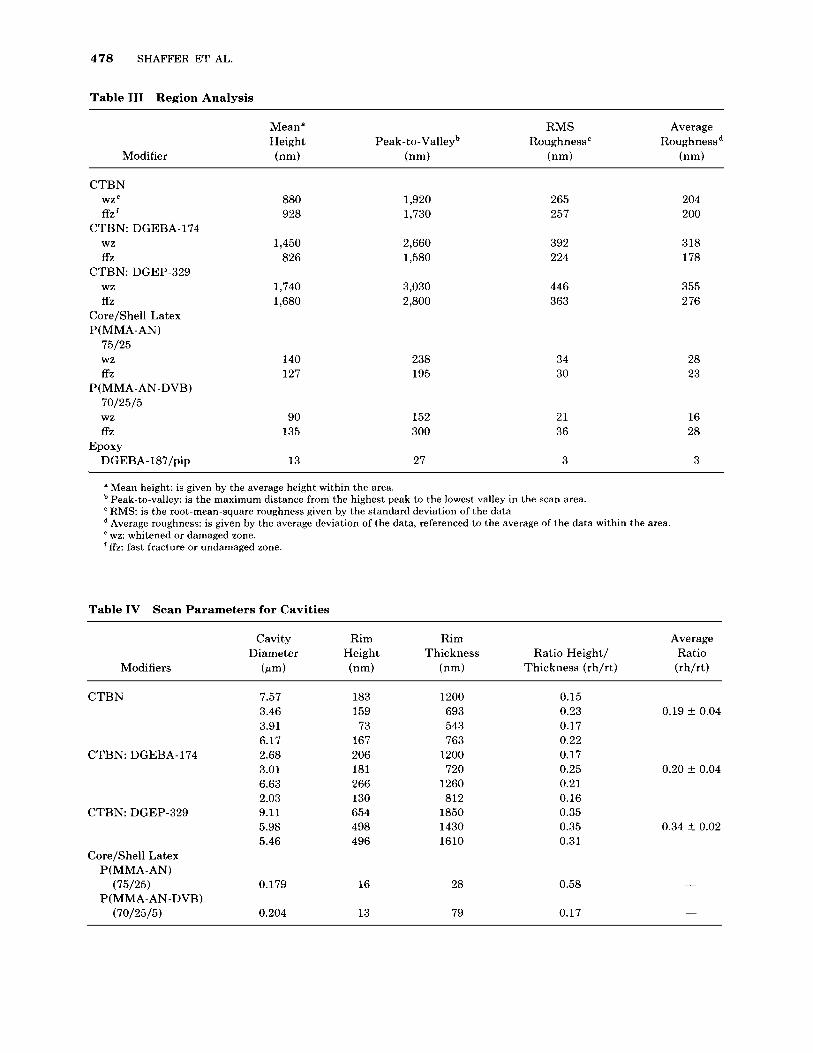
Table I11 Region Analysis
Mean' RMS Average Height Peak-to-Valleyb Roughness" Roughnessd (nm) (nm) (nm) (nm) Modifier
CTBN WZe
ffz f CTBN: DGEBA-174
WZ
ffz CTBN: DGEP-329
WZ
ff i Core/Shell Latex P( MMA-AN)
75/25
ffz
70/25/5
ffz EPOXY
DGEBA-l87/pip
WZ
P( MMA-AN-DVB)
WZ
880 928
1,920 1,730
265 257
204 200
1,450 826
2,660 1,580
392 224
318 178
355 276
1,740 1,680
3,030 2.800
446 363
140 127
238 195
34 30
28 23
90 135
152 300
21 36
16 28
13 27 3 3
a Mean height: is given hy the average height within the area.
' RMS: is the root-mean-square roughness given by the standard deviation of the data Peak-to-valley: is the maximum distance from the highest peak to the lowest valley in the scan area.
Average roughness: is given by the average deviation of the data, referenced to the average of the data within the area wz: whitened or damaged zone. ffz: fast fracture or undamaged zone.
Table IV Scan Parameters for Cavities
Cavity Rim Rim Average Diameter Height Thickness Ratio Height/ Ratio
Modifiers (w-4 (nm) (nm) Thickness (rh/rt) (rh/rt)
CTBN 7.57 3.46 3.91 6.17 2.68 3.01 6.63 2.03 9.11 5.98 5.46
183 159 73
167 206 181 266 130 654 498 496
1200 693 543 763
1200 720
1260 812
1850 1430 1610
0.15 0.23 0.19 f 0.04 0.17 0.22 0.17 0.25 0.20 ? 0.04 0.21 0.16 0.35 0.35 0.34 5 0.02 0.31
CTBN: DGEBA-174
CTBN: DGEP-329
Core/Shell Latex
(75/25)
(70/25/5)
P( MMA-AN)
P(MMA-AN-DVB) 0.179 16 28 0.58 -
0.204 13 79 0.17 -
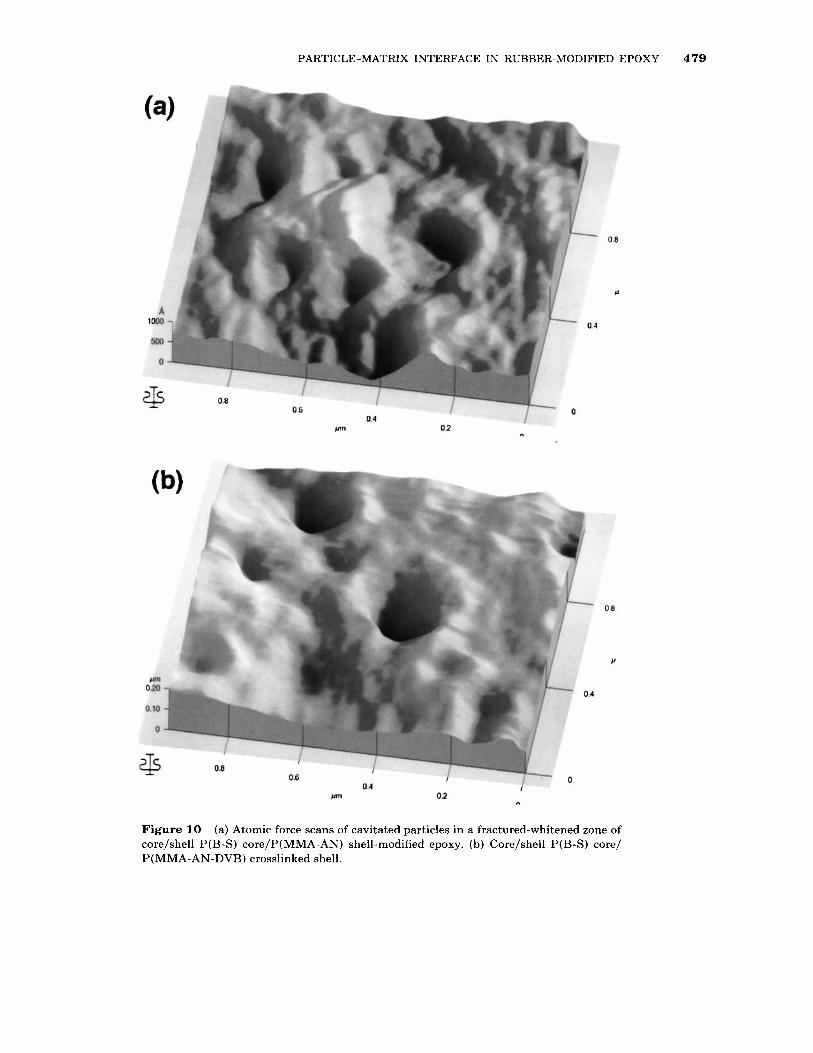
PARTICLE-MATRIX INTERFACE IN RUBBER-MODIFIED EPOXY 479
Figure 10 (a) Atomic force scans of cavitated particles in a fractured-whitened zone of core/shell P(B-S) core/P(MMA-AN) shell-modified epoxy. (b) Core/shell P(B-S) core/ P(MMA-AN-DVB) crosslinked shell.
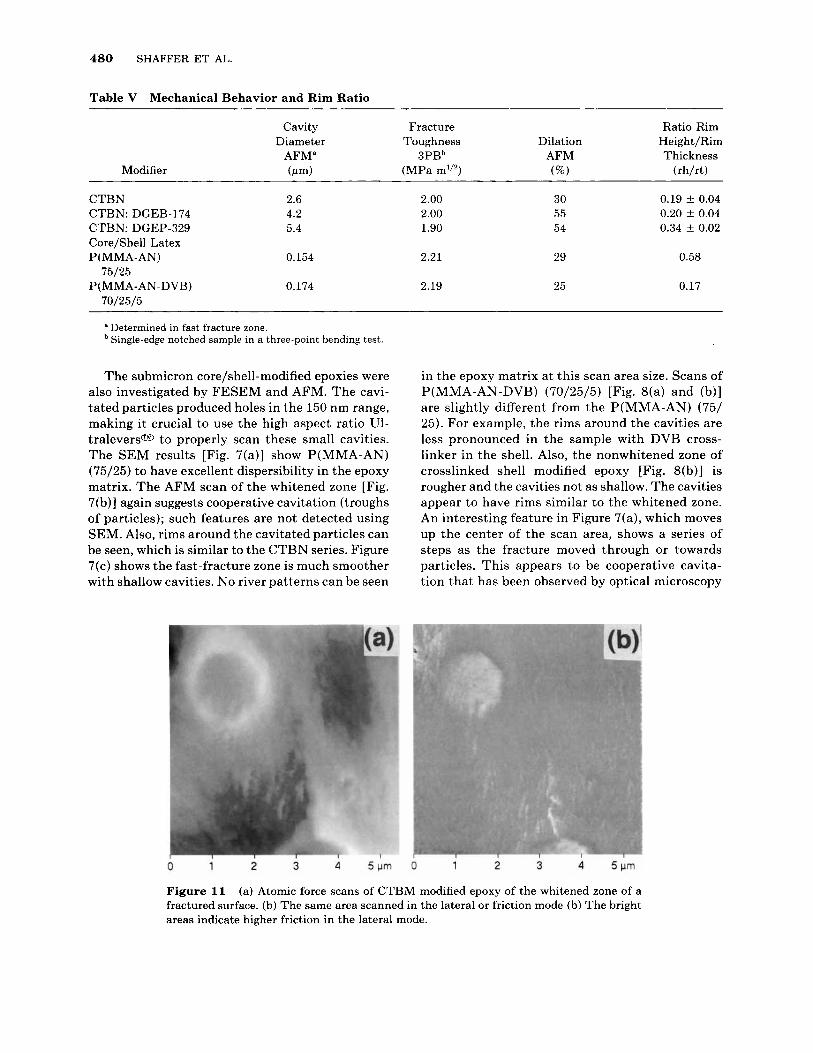
480 SHAFFER ET AL.
Table V Mechanical Behavior and Rim Ratio
Cavity Fracture Ratio Rim Diameter Toughness Dilation Height/Rim
AFM" 3PBb AFM Thickness Modifier (w) (MPa m1I2) (%I (rh/rt)
CTBN CTBN: DGEB-174 CTBN: DGEP-329 Core/Shell Latex P(MMA-AN)
75/25
70/25/5 P(MMA-AN-DVB)
2.6 4.2 5.4
0.154
0.174
2.00 2.00 1.90
2.21
2.19
30 55 54
29
25
0.19 k 0.04 0.20 k 0.04 0.34 k 0.02
0.58
0.17
a Determined in fast fracture zone. Single-edge notched sample in a three-point bending test.
The submicron core/shell-modified epoxies were also investigated by FESEM and AFM. The cavi- tated particles produced holes in the 150 nm range, making it crucial to use the high aspect ratio U1- t ra leversa to properly scan these small cavities. The SEM results [Fig. 7(a)] show P(MMA-AN) (75/25) to have excellent dispersibility in the epoxy matrix. The AFM scan of the whitened zone [Fig. 7(b)] again suggests cooperative cavitation (troughs of particles); such features are not detected using SEM. Also, rims around the cavitated particles can be seen, which is similar to the CTBN series. Figure 7(c) shows the fast-fracture zone is much smoother with shallow cavities. No river patterns can be seen
in the epoxy matrix a t this scan area size. Scans of P(MMA-AN-DVB) (70/25/5) [Fig. 8(a) and (b)] are slightly different from the P(MMA-AN) (75/ 25). For example, the rims around the cavities are less pronounced in the sample with DVB cross- linker in the shell. Also, the nonwhitened zone of crosslinked shell modified epoxy [Fig. 8(b)] is rougher and the cavities not as shallow. The cavities appear to have rims similar to the whitened zone. An interesting feature in Figure 7(a), which moves up the center of the scan area, shows a series of steps as the fracture moved through or towards particles. This appears to be cooperative cavita- tion that has been observed by optical microscopy
Figure 11 (a) Atomic force scans of CTBM modified epoxy of the whitened zone of a fractured surface. (b) The same area scanned in the lateral or friction mode (b) The bright areas indicate higher friction in the lateral mode.
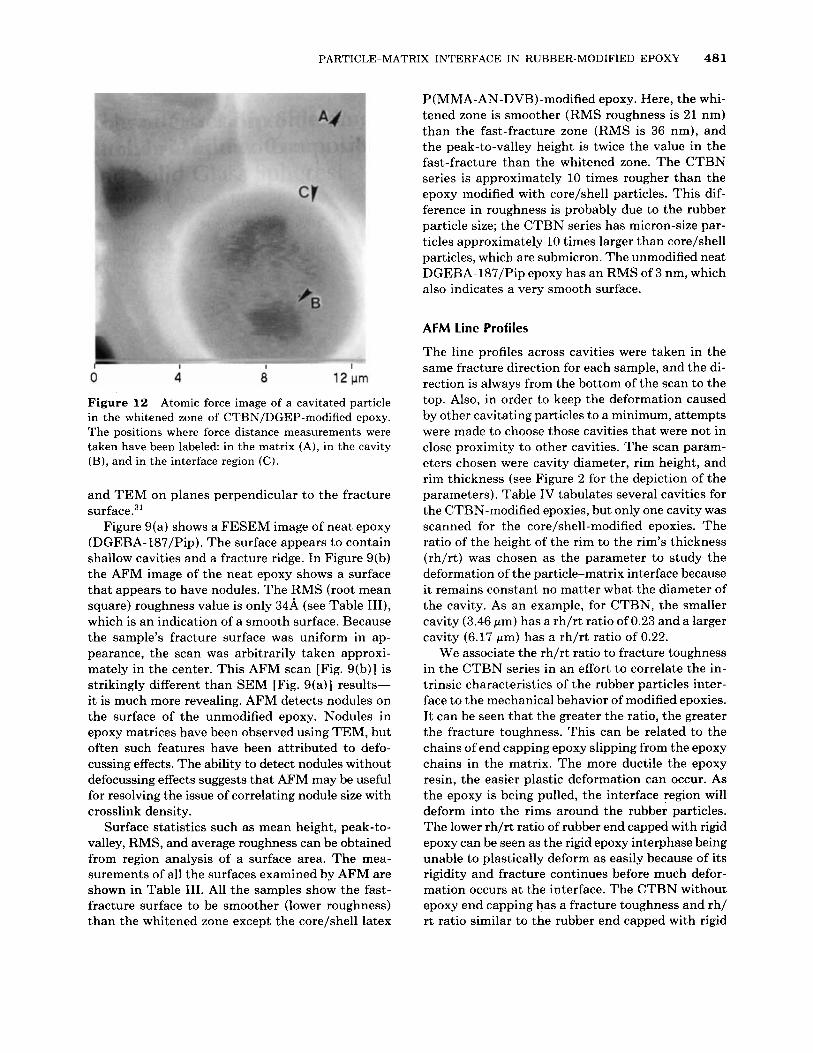
PARTICLE-MATRIX INTERFACE IN RUBBER-MODIFIED EPOXY 481
Figure 12 Atomic force image of a cavitated particle in the whitened zone of CTBN/DGEP-modified epoxy. The positions where force distance measurements were taken have been labeled in the matrix (A), in the cavity (B), and in the interface region (C).
and TEM on planes perpendicular to the fracture surface.31
Figure 9(a) shows a FESEM image of neat epoxy (DGEBA-l87/Pip). The surface appears to contain shallow cavities and a fracture ridge. In Figure 9(b) the AFM image of the neat epoxy shows a surface that appears to have nodules. The RMS (root mean square) roughness value is only 34A (see Table 111), which is an indication of a smooth surface. Because the sample’s fracture surface was uniform in ap- pearance, the scan was arbitrarily taken approxi- mately in the center. This AFM scan [Fig. 9(b)] is strikingly different than SEM [Fig. 9(a)] results- it is much more revealing. AFM detects nodules on the surface of the unmodified epoxy. Nodules in epoxy matrices have been observed using TEM, but often such features have been attributed to defo- cussing effects. The ability to detect nodules without defocussing effects suggests that AFM may be useful for resolving the issue of correlating nodule size with crosslink density.
Surface statistics such as mean height, peak-to- valley, RMS, and average roughness can be obtained from region analysis of a surface area. The mea- surements of all the surfaces examined by AFM are shown in Table 111. All the samples show the fast- fracture surface to be smoother (lower roughness) than the whitened zone except the core/shell latex
P(MMA-AN-DVB)-modified epoxy. Here, the whi- tened zone is smoother (RMS roughness is 21 nm) than the fast-fracture zone (RMS is 36 nm), and the peak-to-valley height is twice the value in the fast-fracture than the whitened zone. The CTBN series is approximately 10 times rougher than the epoxy modified with core/shell particles. This dif- ference in roughness is probably due to the rubber particle size; the CTBN series has micron-size par- ticles approximately 10 times larger than core/shell particles, which are submicron. The unmodified neat DGEBA-l87/Pip epoxy has an RMS of 3 nm, which also indicates a very smooth surface.
AFM Line Profiles
The line profiles across cavities were taken in the same fracture direction for each sample, and the di- rection is always from the bottom of the scan to the top. Also, in order to keep the deformation caused by other cavitating particles to a minimum, attempts were made to choose those cavities that were not in close proximity to other cavities. The scan param- eters chosen were cavity diameter, rim height, and rim thickness (see Figure 2 for the depiction of the parameters). Table IV tabulates several cavities for the CTBN-modified epoxies, but only one cavity was scanned for the core/shell-modified epoxies. The ratio of the height of the rim to the rim’s thickness (rh/rt) was chosen as the parameter to study the deformation of the particle-matrix interface because it remains constant no matter what the diameter of the cavity. As an example, for CTBN, the smaller cavity (3.46 pm) has a rh/rt ratio of 0.23 and a larger cavity (6.17 pm) has a rh/rt ratio of 0.22.
We associate the rh/rt ratio to fracture toughness in the CTBN series in an effort to correlate the in- trinsic characteristics of the rubber particles inter- face to the mechanical behavior of modified epoxies. It can be seen that the greater the ratio, the greater the fracture toughness. This can be related to the chains of end capping epoxy slipping from the epoxy chains in the matrix. The more ductile the epoxy resin, the easier plastic deformation can occur. As the epoxy is being pulled, the interface region will deform into the rims around the rubber particles. The lower rh/rt ratio of rubber end capped with rigid epoxy can be seen as the rigid epoxy interphase being unable to plastically deform as easily because of its rigidity and fracture continues before much defor- mation occurs at the interface. The CTBN without epoxy end capping has a fracture toughness and rh/ rt ratio similar to the rubber end capped with rigid
482 SHAFFER ET AL.
J I I I -10 '
010 0.'5 1 .o 1.5 2.0 Sample displacement, pm
o-l-
-lo! -1 5 0.0 0.5 1 .o 1.5 2.0
Sample displacement, pm
1 I -5 ' o!o 0.L ,I0 1.5 2.0
Sample displacement, pm
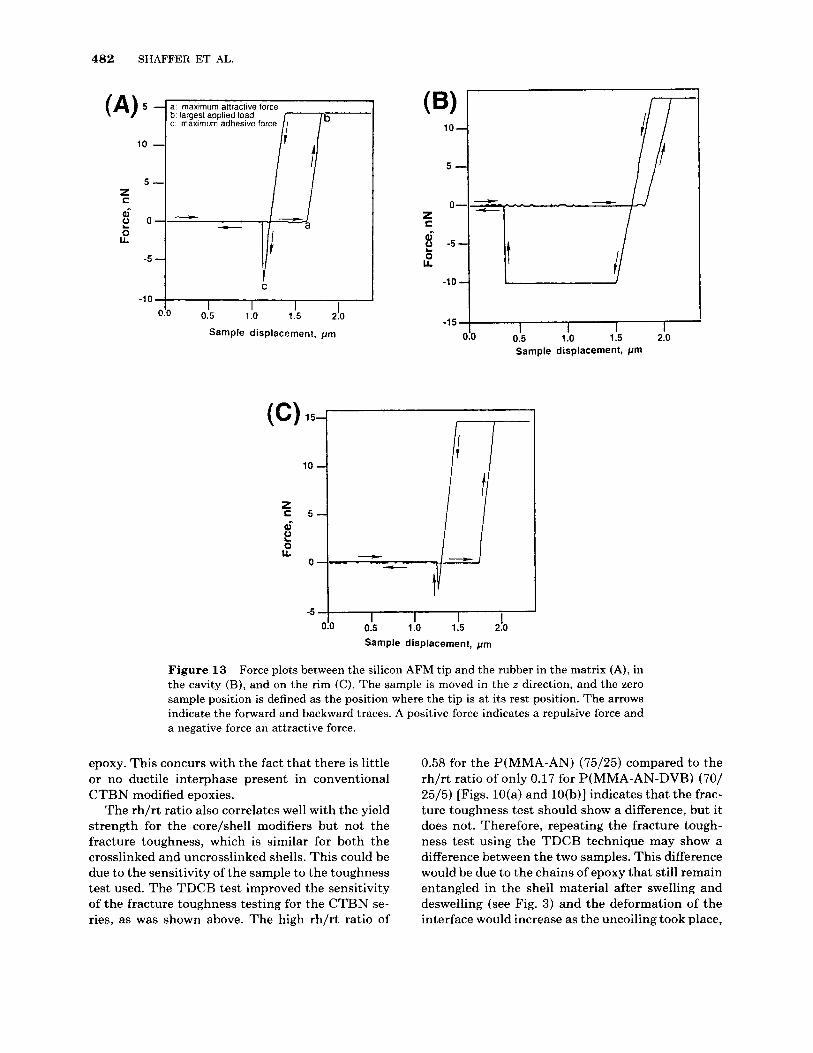
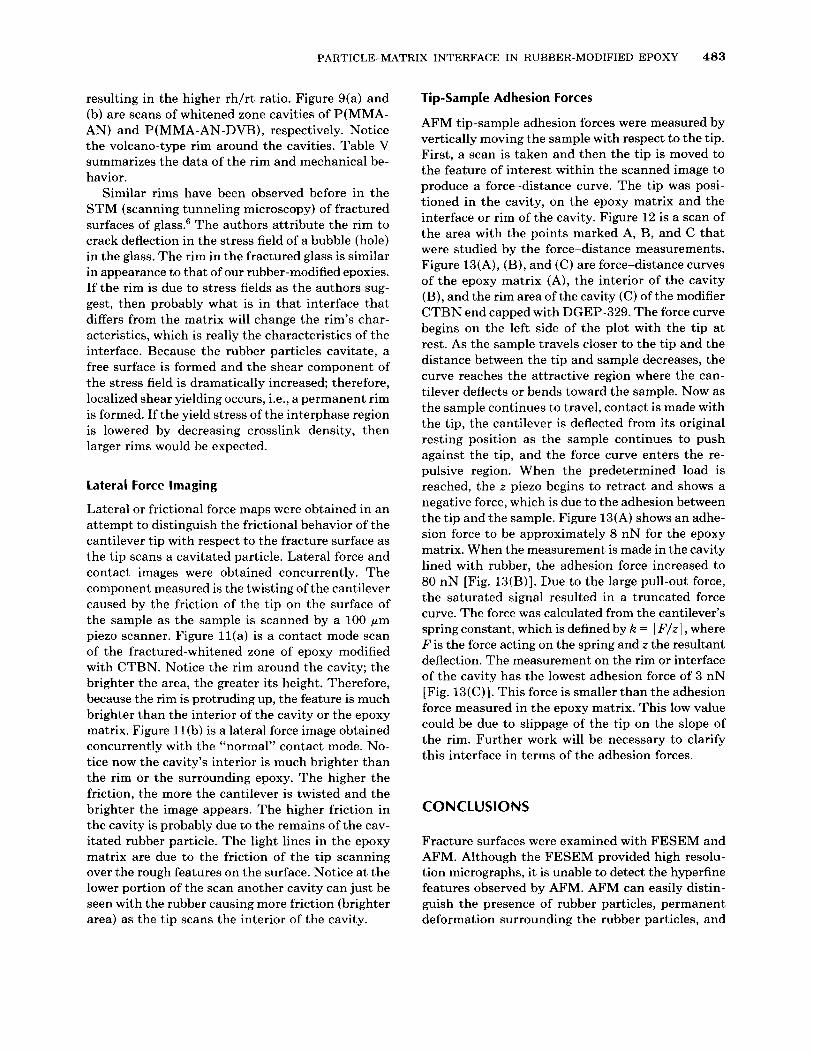
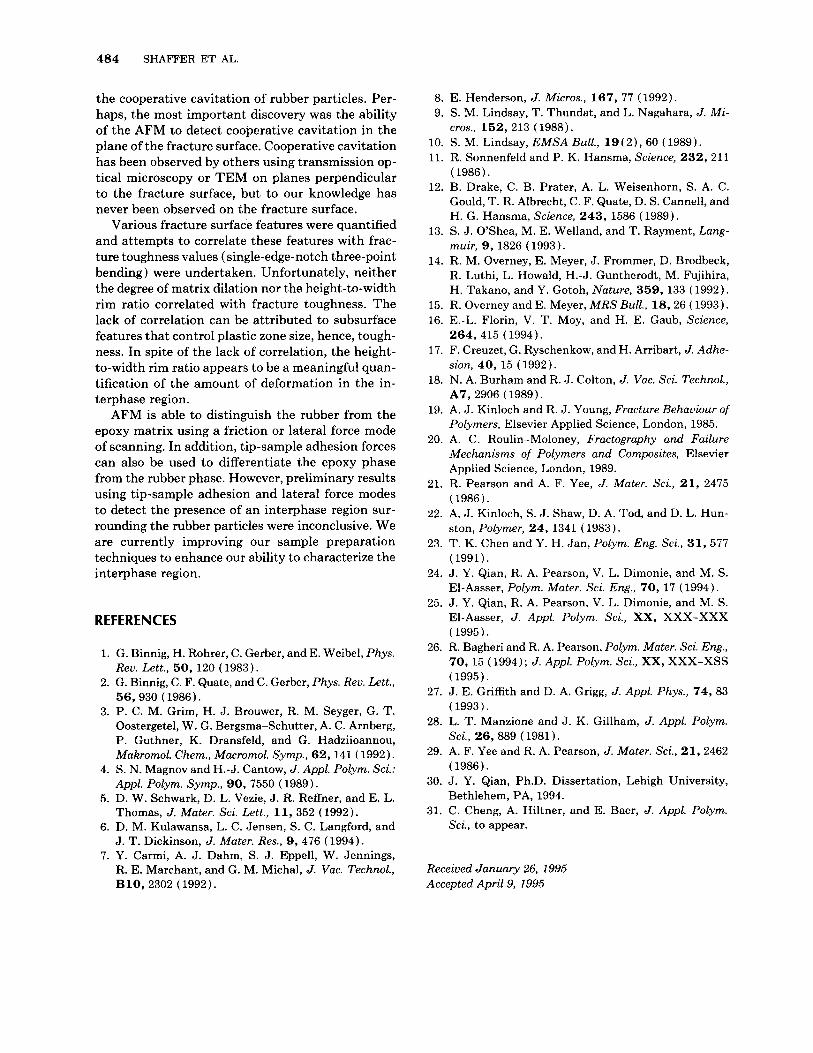
Figure 13 Force plots between the silicon AFM tip and the rubber in the matrix (A), in the cavity (B), and on the rim (C). The sample is moved in the z direction, and the zero sample position is defined as the position where the tip is at its rest position. The arrows indicate the forward and backward traces. A positive force indicates a repulsive force and a negative force an attractive force.
epoxy. This concurs with the fact that there is little or no ductile interphase present in conventional CTBN modified epoxies.
The rh/rt ratio also correlates well with the yield strength for the core/shell modifiers but not the fracture toughness, which is similar for both the crosslinked and uncrosslinked shells. This could be due to the sensitivity of the sample to the toughness test used. The TDCB test improved the sensitivity of the fracture toughness testing for the CTBN se- ries, as was shown above. The high rh/rt ratio of
0.58 for the P(MMA-AN) (75/25) compared to the rh/rt ratio of only 0.17 for P(MMA-AN-DVB) (70/ 25/5) [Figs. 10(a) and 10(b)] indicates that the frac- ture toughness test should show a difference, but it does not. Therefore, repeating the fracture tough- ness test using the TDCB technique may show a difference between the two samples. This difference would be due to the chains of epoxy that still remain entangled in the shell material after swelling and deswelling (see Fig. 3) and the deformation of the interface would increase as the uncoiling took place,
PARTICLE-MATRIX INTERFACE IN RUBBER-MODIFIED EPOXY 483
resulting in the higher rh/rt ratio. Figure 9(a) and (b) are scans of whitened zone cavities of P(MMA- AN) and P( MMA-AN-DVB), respectively. Notice the volcano-type rim around the cavities. Table V summarizes the data of the rim and mechanical be- havior.
Similar rims have been observed before in the STM (scanning tunneling microscopy) of fractured surfaces of glass.6 The authors attribute the rim to crack deflection in the stress field of a bubble (hole) in the glass. The rim in the fractured glass is similar in appearance to that of our rubber-modified epoxies. If the rim is due to stress fields as the authors sug- gest, then probably what is in that interface that differs from the matrix will change the rim’s char- acteristics, which is really the characteristics of the interface. Because the rubber particles cavitate, a free surface is formed and the shear component of the stress field is dramatically increased therefore, localized shear yielding occurs, i.e., a permanent rim is formed. If the yield stress of the interphase region is lowered by decreasing crosslink density, then larger rims would be expected.
lateral Force Imaging
Lateral or frictional force maps were obtained in an attempt to distinguish the frictional behavior of the cantilever tip with respect to the fracture surface as the tip scans a cavitated particle. Lateral force and contact images were obtained concurrently. The component measured is the twisting of the cantilever caused by the friction of the tip on the surface of the sample as the sample is scanned by a 100 pm piezo scanner. Figure l l ( a ) is a contact mode scan of the fractured-whitened zone of epoxy modified with CTBN. Notice the rim around the cavity; the brighter the area, the greater its height. Therefore, because the rim is protruding up, the feature is much brighter than the interior of the cavity or the epoxy matrix. Figure 11 (b) is a lateral force image obtained concurrently with the “normal” contact mode. No- tice now the cavity’s interior is much brighter than the rim or the surrounding epoxy. The higher the friction, the more the cantilever is twisted and the brighter the image appears. The higher friction in the cavity is probably due to the remains of the cav- itated rubber particle. The light lines in the epoxy matrix are due to the friction of the tip scanning over the rough features on the surface. Notice at the lower portion of the scan another cavity can just be seen with the rubber causing more friction (brighter area) as the tip scans the interior of the cavity.
Tip-Sample Adhesion Forces
AFM tip-sample adhesion forces were measured by vertically moving the sample with respect to the tip. First, a scan is taken and then the tip is moved to the feature of interest within the scanned image to produce a force-distance curve. The tip was posi- tioned in the cavity, on the epoxy matrix and the interface or rim of the cavity. Figure 12 is a scan of the area with the points marked A, B, and C that were studied by the force-distance measurements. Figure 13(A), (B), and (C) are force-distance curves of the epoxy matrix (A), the interior of the cavity (B), and the rim area of the cavity ( C ) of the modifier CTBN end capped with DGEP-329. The force curve begins on the left side of the plot with the tip at rest. As the sample travels closer to the tip and the distance between the tip and sample decreases, the curve reaches the attractive region where the can- tilever deflects or bends toward the sample. Now as the sample continues to travel, contact is made with the tip, the cantilever is deflected from its original resting position as the sample continues to push against the tip, and the force curve enters the re- pulsive region. When the predetermined load is reached, the z piezo begins to retract and shows a negative force, which is due to the adhesion between the tip and the sample. Figure 13(A) shows an adhe- sion force to be approximately 8 nN for the epoxy matrix. When the measurement is made in the cavity lined with rubber, the adhesion force increased to 80 nN [Fig. 13(B)]. Due to the large pull-out force, the saturated signal resulted in a truncated force curve. The force was calculated from the cantilever’s spring constant, which is defined by k = I F/z 1 , where F is the force acting on the spring and z the resultant deflection. The measurement on the rim or interface of the cavity has the lowest adhesion force of 3 nN [Fig. 13(C)]. This force is smaller than the adhesion force measured in the epoxy matrix. This low value could be due to slippage of the tip on the slope of the rim. Further work will be necessary to clarify this interface in terms of the adhesion forces.
CONCLUSIONS
Fracture surfaces were examined with FESEM and AFM. Although the FESEM provided high resolu- tion micrographs, it is unable to detect the hyperfine features observed by AFM. AFM can easily distin- guish the presence of rubber particles, permanent deformation surrounding the rubber particles, and
484 SHAFFER ET AL.
the cooperative cavitation of rubber particles. Per- haps, the most important discovery was the ability of the AFM to detect cooperative cavitation in the plane of the fracture surface. Cooperative cavitation has been observed by others using transmission op- tical microscopy or TEM on planes perpendicular to the fracture surface, but to our knowledge has never been observed on the fracture surface.
Various fracture surface features were quantified and attempts to correlate these features with frac- ture toughness values ( single-edge-notch three-point bending) were undertaken. Unfortunately, neither the degree of matrix dilation nor the height-to-width rim ratio correlated with fracture toughness. The lack of correlation can be attributed to subsurface features that control plastic zone size, hence, tough- ness. In spite of the lack of correlation, the height- to-width rim ratio appears to be a meaningful quan- tification of the amount of deformation in the in- terphase region.
AFM is able to distinguish the rubber from the epoxy matrix using a friction or lateral force mode of scanning. In addition, tip-sample adhesion forces can also be used to differentiate the epoxy phase from the rubber phase. However, preliminary results using tip-sample adhesion and lateral force modes to detect the presence of an interphase region sur- rounding the rubber particles were inconclusive. We are currently improving our sample preparation techniques to enhance our ability to characterize the interphase region.
REFERENCES
1.
2.
3.
4.
5.
6.
7.
G. Binnig, H. Rohrer, C. Gerber, and E. Weibel, Phys. Rev. Lett., 50, 120 (1983). G. Binnig, C. F. Quate, and C. Gerber, Phys. Rev. Lett., 5 6 , 9 3 0 (1986). P. C. M. Grim, H. J. Brouwer, R. M. Seyger, G. T. Oostergetel, W. G. Bergsma-Schutter, A. C. Arnberg, P. Guthner, K. Dransfeld, and G. Hadziioannou, Makromol. Chem., Macromol. Symp., 6 2 , 1 4 1 ( 1992). S. N. Magnov and H.-J. Cantow, J . Appl. Polym. Sci.: Appl. Polym. Symp., 90, 7550 ( 1989). D. W. Schwark, D. L. Vezie, J. R. Reffner, and E. L. Thomas, J . Muter. Sci. Lett., 1 1 , 352 ( 1992). D. M. Kulawansa, L. C. Jensen, S. C. Langford, and J. T. Dickinson, J. Muter. Res., 9, 476 (1994). Y. Carmi, A. J. Dahm, S. J. Eppell, W. Jennings, R. E. Marchant, and G. M. Michal, J. Vac. Technol., B 1 0 , 2 3 0 2 (1992).
8. 9.
10. 11.
12.
13.
14.
15. 16.
17.
18.
19.
20.
21.
22.
23.
24.
25.
26.
27.
28.
29.
30.
31.
E. Henderson, J . Micros., 1 6 7 , 77 (1992). S. M. Lindsay, T. Thundat, and L. Nagahara, J . Mi- cros., 1 5 2 , 213 (1988). S. M. Lindsay, EMSA Bull., 1 9 ( 2 ) , 60 (1989) . R. Sonnenfeld and P. K. Hansma, Science, 2 3 2 , 2 1 1 (1986). B. Drake, C. B. Prater, A. L. Weisenhorn, S. A. C. Gould, T. R. Albrecht, C. F. Quate, D. S. Cannell, and H. G. Hansma, Science, 2 4 3 , 1586 (1989). S. J. O’Shea, M. E. Welland, and T. Rayment, Lang- muir, 9,1826 (1993). R. M. Overney, E. Meyer, J. Frommer, D. Brodbeck, R. Luthi, L. Howald, H.-J. Guntherodt, M. Fujihira, H. Takano, and Y. Gotoh, Nature, 3 5 9 , 1 3 3 ( 1992). R. Overney and E. Meyer, MRS Bull., 1 8 , 2 6 ( 1993). E.-L. Florin, V. T. Moy, and H. E. Gaub, Science, 2 6 4 , 4 1 5 ( 1994). F. Creuzet, G. Ryschenkow, and H. Arribart, J . Adhe- sion, 4 0 , 1 5 (1992). N. A. Burham and R. J. Colton, J . Vac. Sci. Technol., A7, 2906 (1989) . A. J. Kinloch and R. J. Young, Fracture Behaviour of Polymers, Elsevier Applied Science, London, 1985. A. C. Roulin-Moloney, Fractography and Failure Mechanisms of Polymers and Composites, Elsevier Applied Science, London, 1989. R. Pearson and A. F. Yee, J . Muter. Sci., 2 1 , 2475 (1986) . A. J. Kinloch, S. J. Shaw, D. A. Tod, and D. L. Hun- ston, Polymer, 24, 1341 (1983) . T. K. Chen and Y. H. Jan, Polym. Eng. Sci., 3 1 , 5 7 7 (1991) . J . Y. Qian, R. A. Pearson, V. L. Dimonie, and M. S. El-Aasser, Polym. Muter. Sci. Eng., 70, 17 (1994). J. Y. Qian, R. A. Pearson, V. L. Dimonie, and M. S. El-Aasser, J . Appl. Polym. Sci., XX, XXX-XXX ( 1995). R. Bagheri and R. A. Pearson, Polym. Muter. Sci. Eng., 70, 15 (1994); J . Appl. Polym. Sci., XX, XXX-XSS ( 1995). J. E. Griffith and D. A. Grigg, J. Appl. Phys., 7 4 , 8 3 (1993) . L. T. Manzione and J. K. Gillham, J . Appl. Polym. Sci., 2 6 , 8 8 9 ( 1981 ). A. F. Yee and R. A. Pearson, J . Muter. Sci., 21,2462 ( 1986). J. Y. Qian, Ph.D. Dissertation, Lehigh University, Bethlehem, PA, 1994. C. Cheng, A. Hiltner, and E. Baer, J . Appl. Polym. Sci., to appear.
Received January 26, 1995 Accepted April 9, 1995
Related Documents


