proteins STRUCTURE O FUNCTION O BIOINFORMATICS Characterization of the near native conformational states of the SAM domain of Ste11 protein by NMR spectroscopy Sebanti Gupta and Surajit Bhattacharjya* Division of Structural and Computational Biology, School of Biological Sciences, Nanyang Technological University, Singapore 637551, Singapore ABSTRACT The sterile alpha motif or SAM domain is one of the most frequently present protein interaction modules with diverse func- tional attributions. SAM domain of the Ste11 protein of budding yeast plays important roles in mitogen-activated protein kinase cascades. In the current study, urea-induced, at subdenaturing concentrations, structural, and dynamical changes in the Ste11 SAM domain have been investigated by nuclear magnetic resonance spectroscopy. Our study revealed that a num- ber of residues from Helix 1 and Helix 5 of the Ste11 SAM domain display plausible alternate conformational states and largest chemical shift perturbations at low urea concentrations. Amide proton (H/D) exchange experiments indicated that Helix 1, loop, and Helix 5 become more susceptible to solvent exchange with increased concentrations of urea. Notably, Helix 1 and Helix 5 are directly involved in binding interactions of the Ste11 SAM domain. Our data further demonstrate that the existence of alternate conformational states around the regions involved in dimeric interactions in native or near native conditions. Proteins 2014; 00:000–000. V C 2014 Wiley Periodicals, Inc. Key words: nuclear magnetic resonance; low-energy alternate states; near-native conformations; Ste11 SAM domain. INTRODUCTION Proteins undergo conformational excursion under native solution conditions whereby the natively folded conformation of a protein, or the lowest energy state, is highly populated (>99%) with other conformational states of higher energy are parsley populated. Correla- tions of structure, folding, and function of proteins require characterization of not only the folded states but also these lowly populated conformational states. 1–3 The structural fluctuations of protein molecules can range from local conformational changes to a large scale or global opening of the folded structure. Folding models of protein molecules describe conformational variations in a funnel shaped free energy landscapes. 1–3 The population and energy level of the excited states of proteins can be modulated by temperature and denaturants. 4–8 Nuclear magnetic resonance (NMR) spectroscopy has been serving as a key technique to elucidate the high energy states of proteins. 8–11 NMR experiments carried out at subdenaturing conditions (in presence of low concentrations of chaotropes) including amide proton temperature-dependence, amide proton exchange with solvent D 2 O or H/D exchange, relaxation measurements have provided valuable insights into the excited states of proteins at the near native conditions. 4–7,12–14 Notably, the temperature-dependent amide proton chemical shift change in proteins can identify structural changes or alternate conformations close to the native state, whereas partially folded states or folding intermediates of proteins are recognized by H/D exchange. 4,6,7,14–17 Additional Supporting Information may be found in the online version of this article. Abbreviations: HSQC, heteronuclear single quantum coherence; NMR, nuclear magnetic resonance; SAM, Sterile alpha motif; SAM domain, sterile alpha motif domain. Grant sponsor: Ministry of Education (MOE), Singapore; Grant number: ARC18-13. *Correspondence to: Surajit Bhattacharjya, Division of Structural and Computa- tional Biology, School of Biological Sciences, Nanyang Technological University, 60 Nanyang Drive, Singapore 637551, Singapore. E-mail: [email protected] Received 21 April 2014; Revised 1 July 2014; Accepted 15 July 2014 Published online 26 July 2014 in Wiley Online Library (wileyonlinelibrary.com). DOI: 10.1002/prot.24652 V V C 2014 WILEY PERIODICALS, INC. PROTEINS 1

Welcome message from author
This document is posted to help you gain knowledge. Please leave a comment to let me know what you think about it! Share it to your friends and learn new things together.
Transcript
proteinsSTRUCTURE O FUNCTION O BIOINFORMATICS
Characterization of the near nativeconformational states of the SAMdomain of Ste11 protein by NMRspectroscopySebanti Gupta and Surajit Bhattacharjya*
Division of Structural and Computational Biology, School of Biological Sciences, Nanyang Technological University, Singapore 637551, Singapore
ABSTRACT
The sterile alpha motif or SAM domain is one of the most frequently present protein interaction modules with diverse func-
tional attributions. SAM domain of the Ste11 protein of budding yeast plays important roles in mitogen-activated protein
kinase cascades. In the current study, urea-induced, at subdenaturing concentrations, structural, and dynamical changes in
the Ste11 SAM domain have been investigated by nuclear magnetic resonance spectroscopy. Our study revealed that a num-
ber of residues from Helix 1 and Helix 5 of the Ste11 SAM domain display plausible alternate conformational states and
largest chemical shift perturbations at low urea concentrations. Amide proton (H/D) exchange experiments indicated that
Helix 1, loop, and Helix 5 become more susceptible to solvent exchange with increased concentrations of urea. Notably,
Helix 1 and Helix 5 are directly involved in binding interactions of the Ste11 SAM domain. Our data further demonstrate
that the existence of alternate conformational states around the regions involved in dimeric interactions in native or near
native conditions.
Proteins 2014; 00:000–000.VC 2014 Wiley Periodicals, Inc.
Key words: nuclear magnetic resonance; low-energy alternate states; near-native conformations; Ste11 SAM domain.
INTRODUCTION
Proteins undergo conformational excursion under
native solution conditions whereby the natively folded
conformation of a protein, or the lowest energy state, is
highly populated (>99%) with other conformational
states of higher energy are parsley populated. Correla-
tions of structure, folding, and function of proteins
require characterization of not only the folded states but
also these lowly populated conformational states.1–3 The
structural fluctuations of protein molecules can range
from local conformational changes to a large scale or
global opening of the folded structure. Folding models of
protein molecules describe conformational variations in a
funnel shaped free energy landscapes.1–3 The population
and energy level of the excited states of proteins can be
modulated by temperature and denaturants.4–8 Nuclear
magnetic resonance (NMR) spectroscopy has been
serving as a key technique to elucidate the high
energy states of proteins.8–11 NMR experiments carried
out at subdenaturing conditions (in presence of low
concentrations of chaotropes) including amide proton
temperature-dependence, amide proton exchange with
solvent D2O or H/D exchange, relaxation measurements
have provided valuable insights into the excited states of
proteins at the near native conditions.4–7,12–14 Notably,
the temperature-dependent amide proton chemical shift
change in proteins can identify structural changes or
alternate conformations close to the native state, whereas
partially folded states or folding intermediates of proteins
are recognized by H/D exchange.4,6,7,14–17
Additional Supporting Information may be found in the online version of this
article.
Abbreviations: HSQC, heteronuclear single quantum coherence; NMR, nuclear
magnetic resonance; SAM, Sterile alpha motif; SAM domain, sterile alpha
motif domain.
Grant sponsor: Ministry of Education (MOE), Singapore; Grant number: ARC18-13.
*Correspondence to: Surajit Bhattacharjya, Division of Structural and Computa-
tional Biology, School of Biological Sciences, Nanyang Technological University,
60 Nanyang Drive, Singapore 637551, Singapore. E-mail: [email protected]
Received 21 April 2014; Revised 1 July 2014; Accepted 15 July 2014
Published online 26 July 2014 in Wiley Online Library (wileyonlinelibrary.com).
DOI: 10.1002/prot.24652
VVC 2014 WILEY PERIODICALS, INC. PROTEINS 1
The sterile alpha motif or SAM domain is a multifunc-
tional protein module involved in diverse function rang-
ing from cell signaling, transcription repression, synaptic
scaffold to translational control.18–20 SAM domain was
originally identified with single copy of 65–70 residues
during the multiple sequence alignment studies in Ste11
and Ste50 proteins from MAP-kinase signaling cascade of
budding yeast along with few other proteins involved in
the development of fruit flies.21,22 To date, SAM
domains have been identified in more than 1300 proteins
in all genomes and only comparable to the number of
SH2 (Src Homology 2) domain detected among different
organisms.20,23 Unlike SH2 and SH3 (Src Homology 3)
domains, SAM domains reflect functional diversity and
even a close homologue can perform various func-
tions.18 SAM domains have been known to be involved
in homo- and hetero-oligomerizations24–27 and can also
interact with other non-SAM containing proteins.28–30
Extensive self-association of SAM domain is evident in
case of TEL and Yan, necessary to regulate transcription
of DNA.31,32 Further, SAM domain of the Shank pro-
tein has been found to bind with metal ions Zn21 that
helps in stabilization of a multi-protein assembly at the
neural synapses.33 Additionally, binding interaction of
SAM with RNA has been described in case of Smg pro-
tein from Drosophila melanogaster and Vts 1 protein
from yeast.34,35 Furthermore, SAM domains showed
detectable interactions with the lipid membrane.36,37
Very recently, SAM domain of Sla1p has been found to
be involved in clathrin-mediated endocytosis process.38
NMR spectroscopy and X-ray crystallography based
structure determination of SAM domains from several
proteins demonstrated a conserved fold consisting of five
helices of different length.25,32,33,39–41
Despite vast importance of the conserved SAM fold in
diverse mode of functions, studies on structural stability,
folding properties, and dynamics of these domains are
sparse.36,42,43 The two-dimensional (3-D) structure of
the Ste11 SAM domain determined by NMR showed that
the SAM domain of Ste11 exists as a homodimer in solu-
tion.44 The interfacial interactions of the dimeric structure
of Ste111 SAM, involving residues of Helix 4 and Helix 5,
are found to be critical for the stability and folded struc-
ture.42,44 The smaller size and the dimeric assembly of
the SAM domain of Ste11 protein have prompted us to
utilize Ste11 SAM as a model for the folding and dynamics
study. Ste11 is one of the major components of MAP
kinase pathway of budding yeast.44–46 The interaction
between Ste11 and Ste50 is mediated by their SAM
domains, important for activation of Ste11 kinase.46,47 In
this work, we have examined conformational and dynami-
cal characteristics of the Ste11 SAM domain under subde-
naturing concentrations of urea. We have employed
temperature-dependent amide proton chemical shift
changes, 15N relaxation, H/D exchange experiments to
probe alternate conformations of the Ste11 SAM domain.
MATERIALS AND METHODS
Protein expression and purification
Ste11 SAM (D37-R104)44 domain from Saccharomyces
cerevisiae was sub cloned into the pET14b vector with a
thrombin cleavable N-terminal His6 tag and over
expressed into Escherichia coli BL21 (DE3) cells, grown at
37�C either in LB or M9 medium containing [15N]
ammonium chloride (Cambridge Isotope Laboratories).
The cells were induced with 1 mM IPTG at an OD600 of
0.6–0.7. After incubating for 6–12 hours at 16�C for pro-
tein production, cells were centrifuged and resuspended
in 20 mM Tris–hydrochloride buffer of pH 8.0. The cell
solution was lysed by sonication and the supernatant was
applied to Nickel–NTA column for His tag-based purifi-
cation (Qiagen). Strongly bound target protein was
eluted with buffer containing 500 mM imidazole. The
purified protein was extensively dialyzed against 10 mM
sodium phosphate buffer, containing 300 mM NaCl and
20 mM b-ME at pH 5.8. Sample of Ste11 SAM was
loaded onto a Hiload Superdex 75 10/300 GL analytical
column with the AKTA FPLC UPC-900 system (GE
Healthcare UK, England). The column was equilibrated
with 10 mM sodium phosphate buffer containing
300 mM sodium chloride and 20 mM b-ME, pH 5.8.
The sample was eluted at a flow rate of 0.5 mL/min and
detected at 276 nm. The amino acid sequence of Ste11
SAM was numbered as D1-R68.
NMR spectroscopy
All the NMR experiments were performed on a Bruker
DRX 600 MHz spectrometer equipped with an actively
shielded cryoprobe. NMR data were processed using the
NMRPipe and NMRDraw48,49 suite and analyzed by
Sparky (T.D. Goddard and D.G. Kneller, University of
California, San Francisco). The chemical shifts were
directly or indirectly referenced to DSS.
Urea titration experiment
Urea titration experiments were recorded at 298 K for
Ste11 SAM domain by adding aliquots from a 10 M urea
stock solution, prepared in 10 mM sodium phosphate
buffer, 300 mM NaCl, and 20 mM b-ME, pH 5.8 into
the NMR tube containing the 15N labeled native Ste11
SAM at 0.6 mM concentration. The samples were
allowed to equilibrate for 20 min before the recording of
2-D 1H–15N HSQC spectra. The reductions in the inten-
sity of HSQC cross peaks as a function of the denaturant
concentration was fitted to the equation,50
Yobs5 aN1bN D½ �ð Þ41 1 expf2 m D�2Cm=RT�½½
Here Yobs represents the intensity of a HSQC peak, aN
and bN are intercept and slope of the pre- and
S. Gupta and S. Bhattacharjya
2 PROTEINS
postunfolding regimes, m is the slope at the midpoint of
the unfolding transition, [D] is the concentration of the
denaturant, and Cm is the denaturant concentration at
the midpoint of the transition, RT is 0.57 kcal mol21.
The urea-induced chemical shift changes in 15N and HN
resonances was determined using the following equation
which is designated as chemical shift perturbation (CSP),
D(H,N) 5 [{(DH)(WH)}2 1 {(DN)(WN)}2]1/2 where WH
and WN are weighting factors for 1H and 15N chemical
shifts, respectively (WH 5 1, WN 5 0.154)51 and DH and
DN are the chemical shift difference for amide proton
and 15N, respectively.
Temperature dependence of amide protonchemical shift
Temperature-dependent amide proton chemical shift
for Ste11 SAM were performed by recording series of
HSQC spectra at seven different temperatures, 283 K,
286 K, 289 K, 292 K, 295 K, 298 K, and 301 K. These
experiments were done for native and four different con-
centrations of denaturant (0.5 M, 0.75 M, 1.0 M, and
1.5 M urea) in 10 mM sodium phosphate buffer,
300 mM NaCl, 20 mM b-ME, pH 5.8. For each amide
proton, a straight line was fitted to the chemical shift
temperature dependence and the residuals were plotted
to observe the curved temperature profile.4,7
Hydrogen-Deuterium exchange experiment
To study amide proton exchange, lyophilized Ste11
SAM was dissolved in D2O buffer of 10 mM sodium
phosphate, 300 mM NaCl, and 20 mM b-ME at pH 5.8.
A series of 2-D 1H–15N HSQC spectra were recorded
within an interval of 30 min. Hydrogen exchange rates
(kex) were fitted to a single exponential decay equation,
I(t) 5 I(0) 3 exp(Kex � t). Where I(t) and I(0) are the
intensities at the given time t and t 5 0, respectively, and
Kex is the rate constant of the hydrogen-deuterium
exchange reaction. The protection factors were deter-
mined from a ratio of calculated intrinsic exchange rates
of the amide protons of Ste11 SAM domain and experi-
mentally measured exchange rates.52 The H-D exchange
experiments were recorded for native as well as four dif-
ferent urea concentrations, 0.25 M, 0.5 M, 0.75 M, and
1.5 M.
Relaxation measurement
The 15N longitudinal (R1 5 1/T1) and transverse
(R2 5 1/T2) relaxation rate constants of 15N labeled
Ste11 SAM domain samples, in 10 mM sodium phos-
phate buffer, 300 mM NaCl, 20 mM b-ME, pH 5.8,
were determined by collecting a series of 1H–15N HSQC
spectra at different time interval with sensitivity
enhancement in a Bruker DRX 600 MHz at 298 K tem-
perature.53 The relaxation delays for T1 measurement
were 5 ms, 40 ms, 80 ms, 130 ms, 210 ms, 330 ms,
470 ms, 630 ms, 800 ms, 1000 ms, and 3000 ms with
repeating the experiments at the time points of 80 ms
and 470 ms for error estimation. For T2 measurement
the data were acquired with delays of 14.4 ms, 28.8 ms,
43.2 ms, 57.6 ms, 72.0 ms, 86.4 ms, 100.8 ms, 115.2
ms, 129.6 ms, 144.0 ms, and 158.4 ms with the dupli-
cate points at 72.0 ms for error estimation. The relaxa-
tion rate constants were determined by fitting the cross
peak intensities to a monoexponential function.44,54
Steady state 15N-{1H} heteronuclear NOE experiments
were performed with and without the saturation of the1H resonances. 1H saturation was accomplished by 120�
pulses spaced at 5 ms interval for a period of 3 s with
an interscan relaxation delay of 2 s. All these experi-
ments were repeated for two different denaturant (urea)
concentrations; 0.5 M and 2 M. The T1 and T2 relaxa-
tion experiments were repeated twice and a total of
2048 complex data points with 96 or 128 complex
increment were collected for these relaxation experi-
ments. For 15N-{1H} heteronuclear NOE experiments,
spectra were recorded with 2048 complex data points
with 256 complex t1 points. Further analysis of the
backbone dynamic parameters was carried out accord-
ing to the Lipari–Szabo model-free method by using
the program Tensor2.55 The model free parameters
were extracted using the experimentally determined 15N
relaxation rate parameters and the heteronuclear NOE
values. An isotropic diffusion model was used to obtain
order parameters (S2, S2f , and S2
S) and internal mobility
(se and Kex) following model selection procedure as
described by Mandel et al.56
RESULTS
Urea-induced unfolding of dimeric Ste11SAM domain
In a previous study, we investigated urea-induced
unfolding of the native and interfacial mutants of Ste11
SAM at 150 mM NaCl.42 The 3-D structure of the
homo-dimeric Ste11 SAM domain was determined at
300 mM NaCl.44 Here, we have examined urea-mediated
global unfolding transitions of the Ste11 SAM at
300 mM NaCl. To monitor the unfolding of Ste11 SAM,
a series of HSQC spectra were collected with increasing
urea concentrations, ranging from 0.5 M to 6 M. We
have observed reduction in intensity of HSQC cross
peaks of the native dimer as urea concentrations were
increased beyond 2 M. 15N–1H HSQC spectra indicated
that SAM domain assumes largely unfolded conforma-
tions at 6 M urea (Supporting Information Fig. S1). The
equilibrium unfolding of the Ste11 SAM domain was fur-
ther fitted into two state unfolding transitions (see Mate-
rials and Methods). Analyses of these transition curves
and midpoint of transition (Cm) indicated that the native
Urea-Induced Near Native Conformational Change in Ste11 SAM
PROTEINS 3
like global fold of the domain are sustained up to 3.2 M
urea (Supporting Information Fig. S2). Consequently, we
have restricted our structural and dynamics analysis at
�2 M urea concentrations ensuring perturbations within
the near native states of the domain.
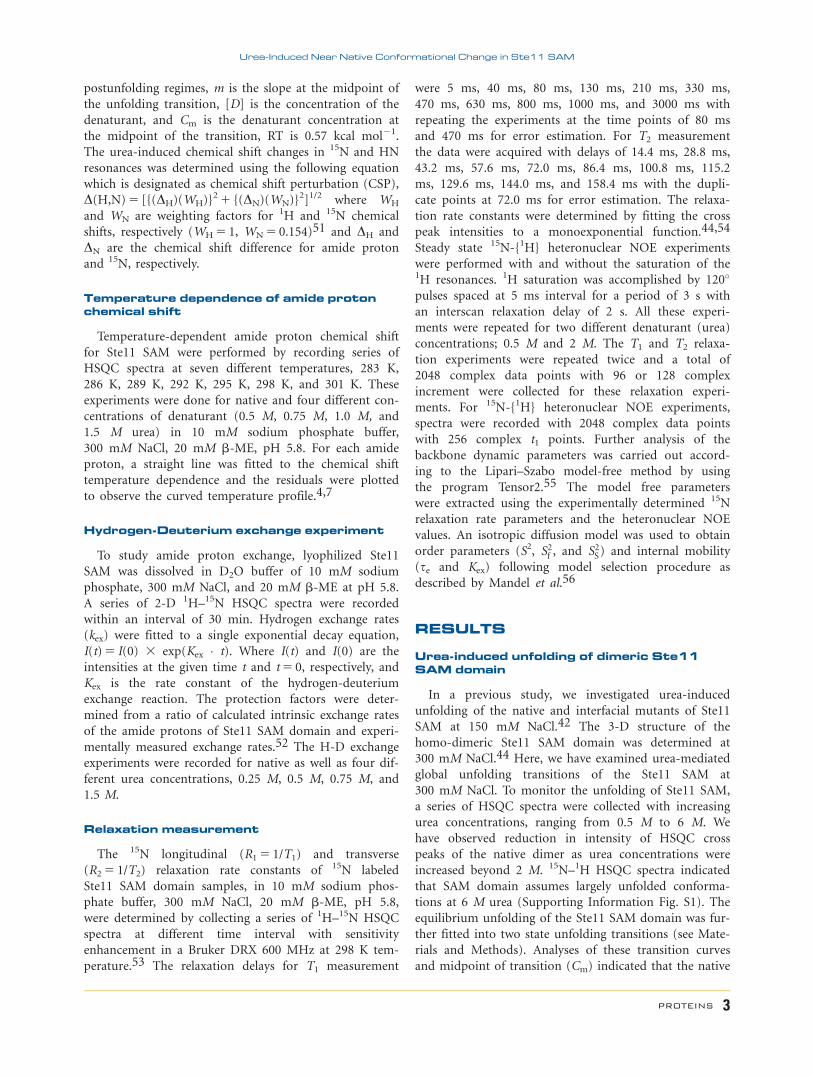
Urea-induced chemical shift changes inSte11 SAM
Amide proton and 15N chemical shifts are sensitive
probes for the environment of a given residue in a pro-
tein structure.57 We have calculated the CSPs of the
Ste11 SAM domain to determine plausible denaturant
binding regions. Figure 1 (Panel A) shows the bar dia-
gram plotting of combined chemical shift changes in 15N
and 1HN at 2 M urea concentration. Effect of urea on
the chemical shifts at 0.5 M concentration was less pro-
nounced and an average CSP has been estimated to be to
0.01 ppm that eventually increased to 0.018 ppm in the
presence of 1 M urea (Supporting Information Fig. S3).
Residues F9, V10, L12, E15, T20, Q21, Y22, Q28, L31,
V32, T33, E34, I44, L45, S63, F66, and R68 have experi-
enced above average CSP in 1 M urea (Supporting Infor-
mation Fig. S3). As noted, in 2 M urea average CSP
increases to 0.024 ppm whereby more residues, for exam-
ple, F9, V10, Q11, L12, L14, E15, G18, Q21, Y22, I27,
L31, V32, T33, E34, I44, L45, A47, N51, L57, S63, S65,
F66, Q67, and R68 exhibited higher (�0.024 ppm)
chemical shift changes [Fig. 1(A)]. The changes in CSPs
at 2 M urea are mapped onto the structure of SAM
domain [Fig. 1(B)].
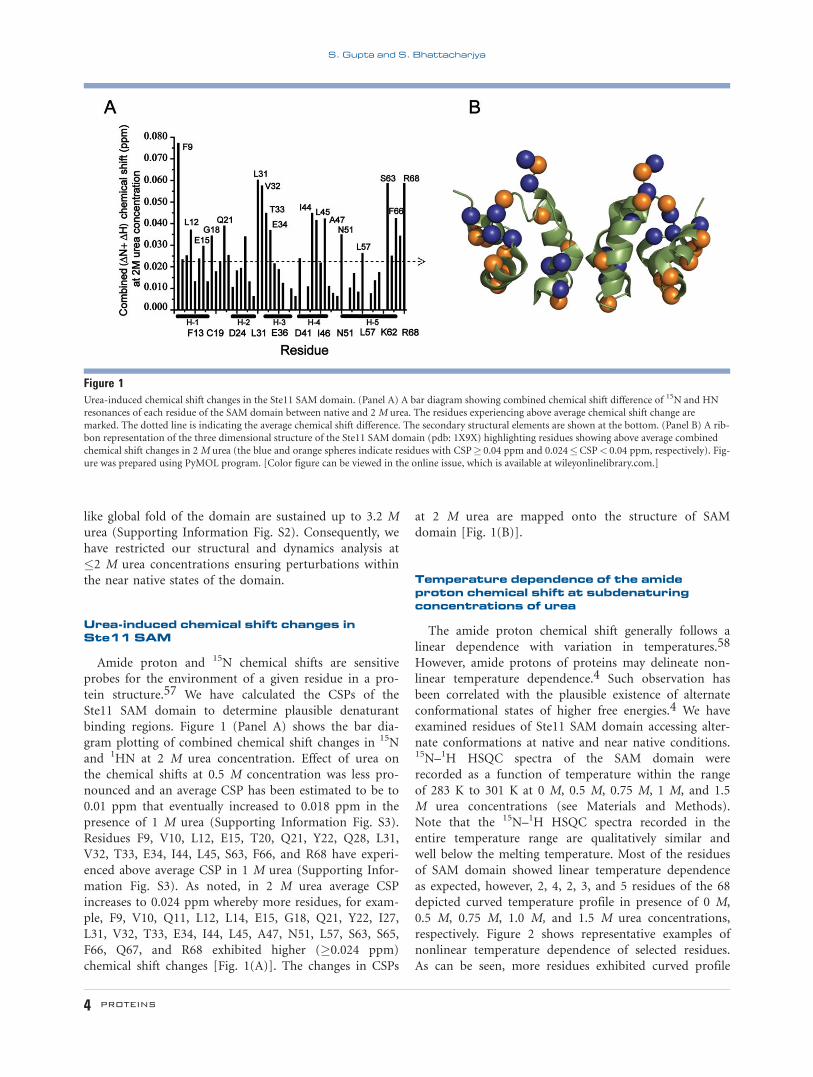
Temperature dependence of the amideproton chemical shift at subdenaturingconcentrations of urea
The amide proton chemical shift generally follows a
linear dependence with variation in temperatures.58
However, amide protons of proteins may delineate non-
linear temperature dependence.4 Such observation has
been correlated with the plausible existence of alternate
conformational states of higher free energies.4 We have
examined residues of Ste11 SAM domain accessing alter-
nate conformations at native and near native conditions.15N–1H HSQC spectra of the SAM domain were
recorded as a function of temperature within the range
of 283 K to 301 K at 0 M, 0.5 M, 0.75 M, 1 M, and 1.5
M urea concentrations (see Materials and Methods).
Note that the 15N–1H HSQC spectra recorded in the
entire temperature range are qualitatively similar and
well below the melting temperature. Most of the residues
of SAM domain showed linear temperature dependence
as expected, however, 2, 4, 2, 3, and 5 residues of the 68
depicted curved temperature profile in presence of 0 M,
0.5 M, 0.75 M, 1.0 M, and 1.5 M urea concentrations,
respectively. Figure 2 shows representative examples of
nonlinear temperature dependence of selected residues.
As can be seen, more residues exhibited curved profile
Figure 1Urea-induced chemical shift changes in the Ste11 SAM domain. (Panel A) A bar diagram showing combined chemical shift difference of 15N and HNresonances of each residue of the SAM domain between native and 2 M urea. The residues experiencing above average chemical shift change are
marked. The dotted line is indicating the average chemical shift difference. The secondary structural elements are shown at the bottom. (Panel B) A rib-bon representation of the three dimensional structure of the Ste11 SAM domain (pdb: 1X9X) highlighting residues showing above average combined
chemical shift changes in 2 M urea (the blue and orange spheres indicate residues with CSP� 0.04 ppm and 0.024�CSP< 0.04 ppm, respectively). Fig-ure was prepared using PyMOL program. [Color figure can be viewed in the online issue, which is available at wileyonlinelibrary.com.]
S. Gupta and S. Bhattacharjya
4 PROTEINS
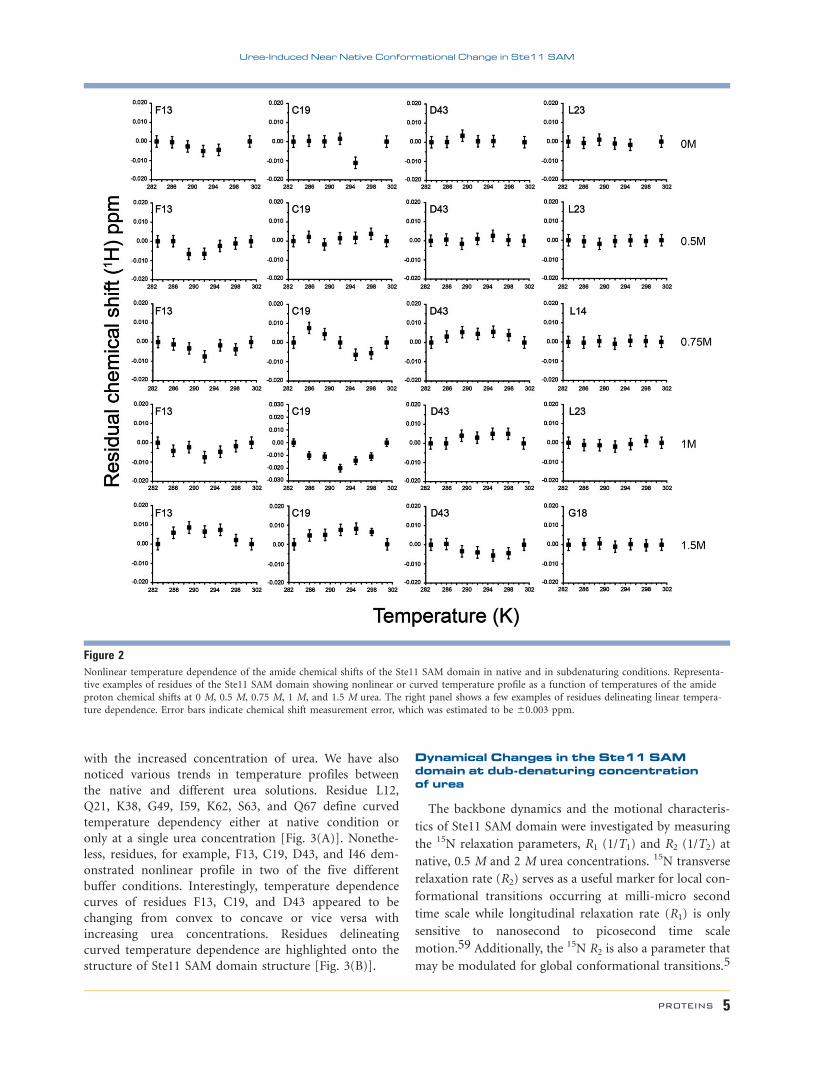
with the increased concentration of urea. We have also
noticed various trends in temperature profiles between
the native and different urea solutions. Residue L12,
Q21, K38, G49, I59, K62, S63, and Q67 define curved
temperature dependency either at native condition or
only at a single urea concentration [Fig. 3(A)]. Nonethe-
less, residues, for example, F13, C19, D43, and I46 dem-
onstrated nonlinear profile in two of the five different
buffer conditions. Interestingly, temperature dependence
curves of residues F13, C19, and D43 appeared to be
changing from convex to concave or vice versa with
increasing urea concentrations. Residues delineating
curved temperature dependence are highlighted onto the
structure of Ste11 SAM domain structure [Fig. 3(B)].
Dynamical Changes in the Ste11 SAMdomain at dub-denaturing concentrationof urea
The backbone dynamics and the motional characteris-
tics of Ste11 SAM domain were investigated by measuring
the 15N relaxation parameters, R1 (1/T1) and R2 (1/T2) at
native, 0.5 M and 2 M urea concentrations. 15N transverse
relaxation rate (R2) serves as a useful marker for local con-
formational transitions occurring at milli-micro second
time scale while longitudinal relaxation rate (R1) is only
sensitive to nanosecond to picosecond time scale
motion.59 Additionally, the 15N R2 is also a parameter that
may be modulated for global conformational transitions.5
Figure 2Nonlinear temperature dependence of the amide chemical shifts of the Ste11 SAM domain in native and in subdenaturing conditions. Representa-tive examples of residues of the Ste11 SAM domain showing nonlinear or curved temperature profile as a function of temperatures of the amide
proton chemical shifts at 0 M, 0.5 M, 0.75 M, 1 M, and 1.5 M urea. The right panel shows a few examples of residues delineating linear tempera-
ture dependence. Error bars indicate chemical shift measurement error, which was estimated to be 60.003 ppm.
Urea-Induced Near Native Conformational Change in Ste11 SAM
PROTEINS 5
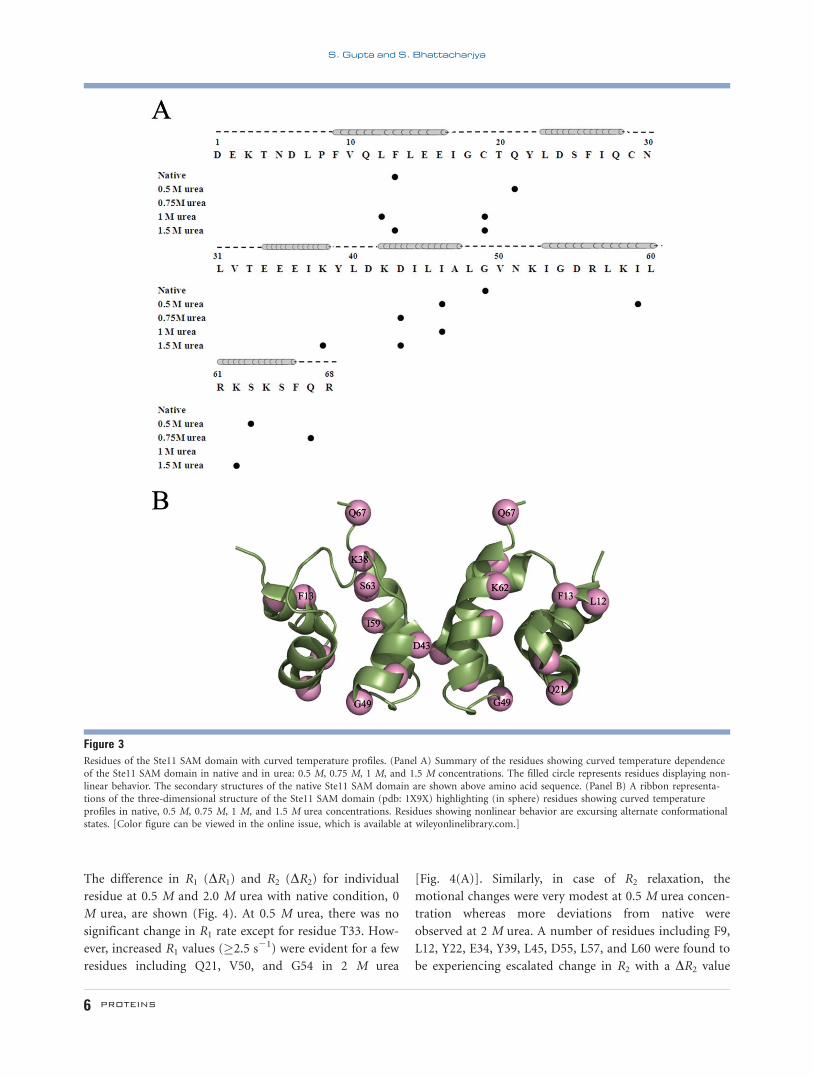
The difference in R1 (DR1) and R2 (DR2) for individual
residue at 0.5 M and 2.0 M urea with native condition, 0
M urea, are shown (Fig. 4). At 0.5 M urea, there was no
significant change in R1 rate except for residue T33. How-
ever, increased R1 values (�2.5 s21) were evident for a few
residues including Q21, V50, and G54 in 2 M urea
[Fig. 4(A)]. Similarly, in case of R2 relaxation, the
motional changes were very modest at 0.5 M urea concen-
tration whereas more deviations from native were
observed at 2 M urea. A number of residues including F9,
L12, Y22, E34, Y39, L45, D55, L57, and L60 were found to
be experiencing escalated change in R2 with a DR2 value
Figure 3Residues of the Ste11 SAM domain with curved temperature profiles. (Panel A) Summary of the residues showing curved temperature dependenceof the Ste11 SAM domain in native and in urea: 0.5 M, 0.75 M, 1 M, and 1.5 M concentrations. The filled circle represents residues displaying non-
linear behavior. The secondary structures of the native Ste11 SAM domain are shown above amino acid sequence. (Panel B) A ribbon representa-tions of the three-dimensional structure of the Ste11 SAM domain (pdb: 1X9X) highlighting (in sphere) residues showing curved temperature
profiles in native, 0.5 M, 0.75 M, 1 M, and 1.5 M urea concentrations. Residues showing nonlinear behavior are excursing alternate conformationalstates. [Color figure can be viewed in the online issue, which is available at wileyonlinelibrary.com.]
S. Gupta and S. Bhattacharjya
6 PROTEINS
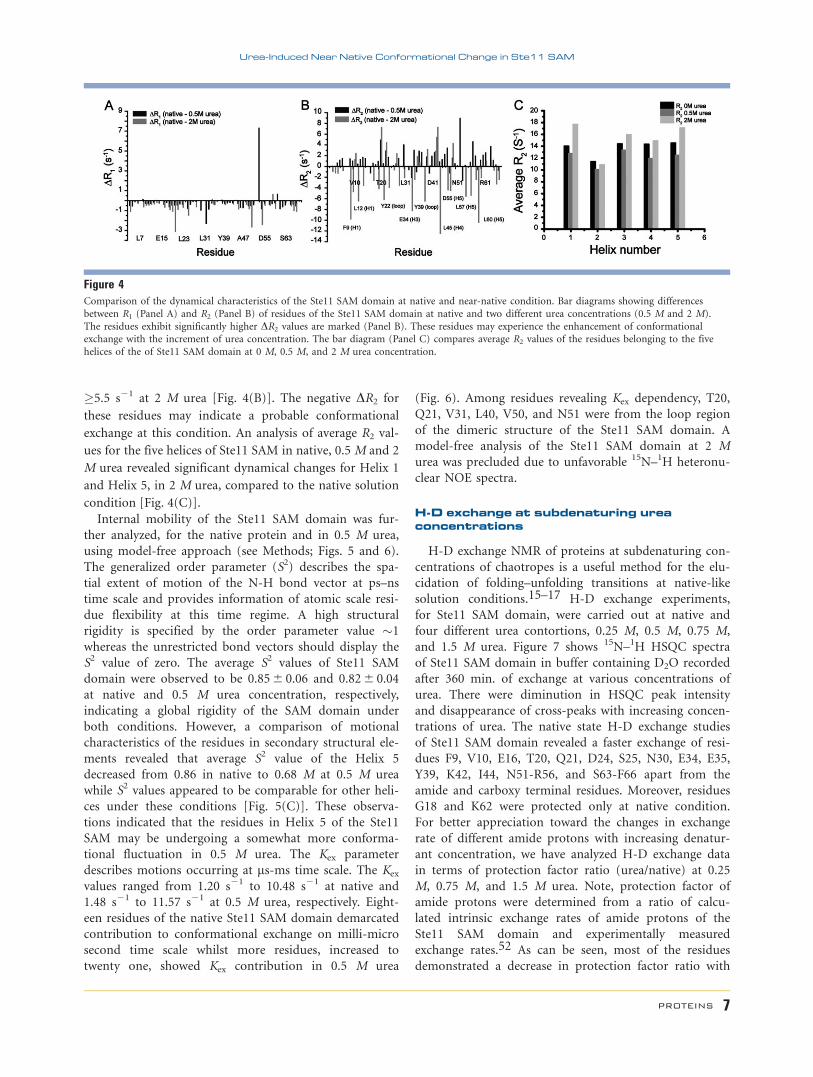
�5.5 s21 at 2 M urea [Fig. 4(B)]. The negative DR2 for
these residues may indicate a probable conformational
exchange at this condition. An analysis of average R2 val-
ues for the five helices of Ste11 SAM in native, 0.5 M and 2
M urea revealed significant dynamical changes for Helix 1
and Helix 5, in 2 M urea, compared to the native solution
condition [Fig. 4(C)].
Internal mobility of the Ste11 SAM domain was fur-
ther analyzed, for the native protein and in 0.5 M urea,
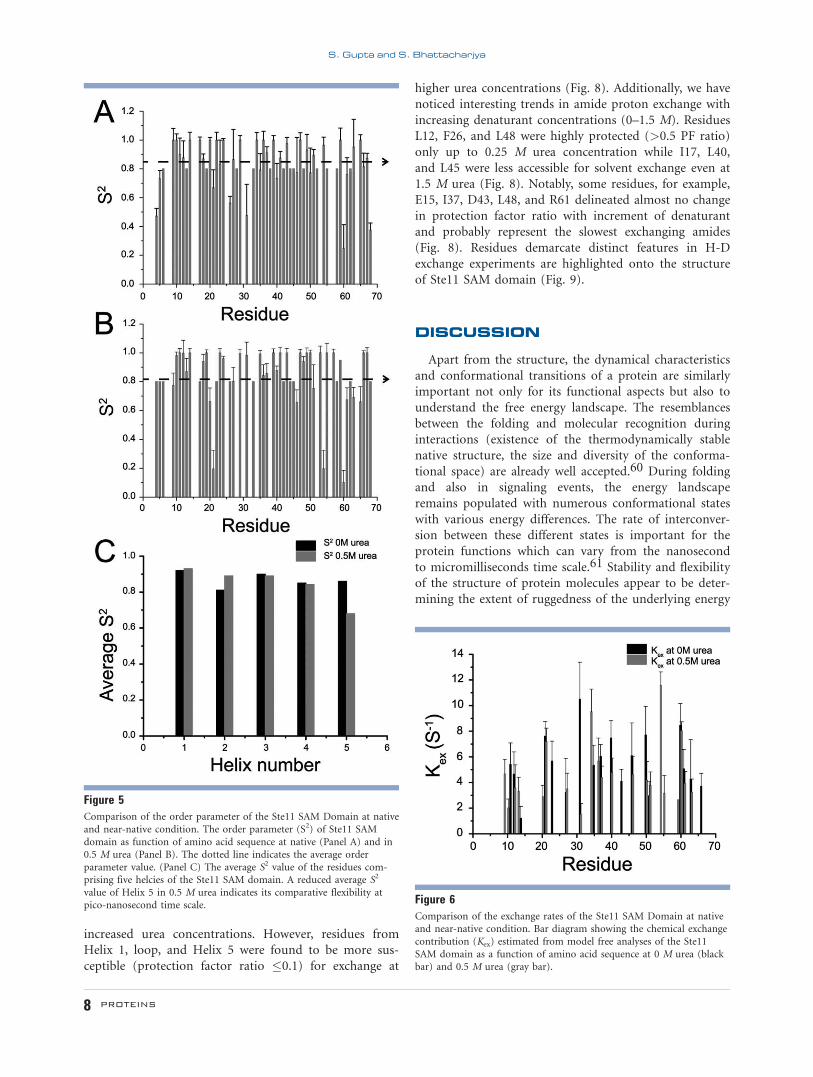
using model-free approach (see Methods; Figs. 5 and 6).
The generalized order parameter (S2) describes the spa-
tial extent of motion of the N-H bond vector at ps–ns
time scale and provides information of atomic scale resi-
due flexibility at this time regime. A high structural
rigidity is specified by the order parameter value �1
whereas the unrestricted bond vectors should display the
S2 value of zero. The average S2 values of Ste11 SAM
domain were observed to be 0.85 6 0.06 and 0.82 6 0.04
at native and 0.5 M urea concentration, respectively,
indicating a global rigidity of the SAM domain under
both conditions. However, a comparison of motional
characteristics of the residues in secondary structural ele-
ments revealed that average S2 value of the Helix 5
decreased from 0.86 in native to 0.68 M at 0.5 M urea
while S2 values appeared to be comparable for other heli-
ces under these conditions [Fig. 5(C)]. These observa-
tions indicated that the residues in Helix 5 of the Ste11
SAM may be undergoing a somewhat more conforma-
tional fluctuation in 0.5 M urea. The Kex parameter
describes motions occurring at ms-ms time scale. The Kex
values ranged from 1.20 s21 to 10.48 s21 at native and
1.48 s21 to 11.57 s21 at 0.5 M urea, respectively. Eight-
een residues of the native Ste11 SAM domain demarcated
contribution to conformational exchange on milli-micro
second time scale whilst more residues, increased to
twenty one, showed Kex contribution in 0.5 M urea
(Fig. 6). Among residues revealing Kex dependency, T20,
Q21, V31, L40, V50, and N51 were from the loop region
of the dimeric structure of the Ste11 SAM domain. A
model-free analysis of the Ste11 SAM domain at 2 M
urea was precluded due to unfavorable 15N–1H heteronu-
clear NOE spectra.
H-D exchange at subdenaturing ureaconcentrations
H-D exchange NMR of proteins at subdenaturing con-
centrations of chaotropes is a useful method for the elu-
cidation of folding–unfolding transitions at native-like
solution conditions.15–17 H-D exchange experiments,
for Ste11 SAM domain, were carried out at native and
four different urea contortions, 0.25 M, 0.5 M, 0.75 M,
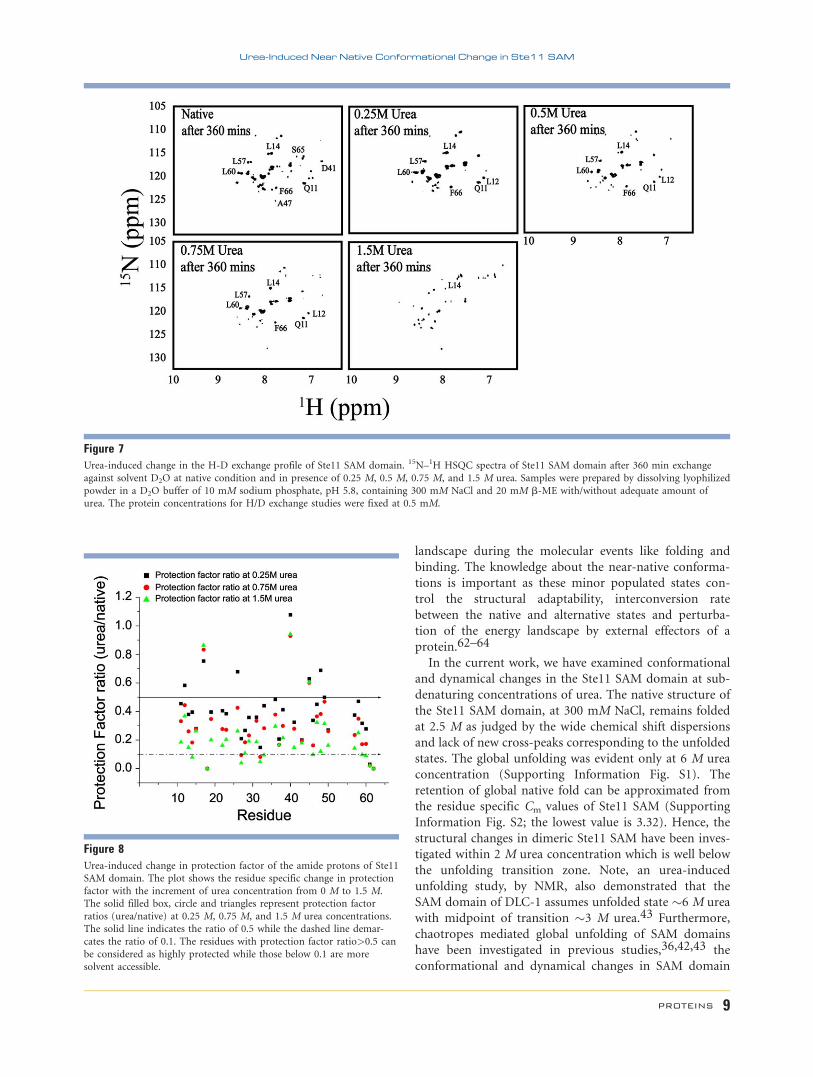
and 1.5 M urea. Figure 7 shows 15N–1H HSQC spectra
of Ste11 SAM domain in buffer containing D2O recorded
after 360 min. of exchange at various concentrations of
urea. There were diminution in HSQC peak intensity
and disappearance of cross-peaks with increasing concen-
trations of urea. The native state H-D exchange studies
of Ste11 SAM domain revealed a faster exchange of resi-
dues F9, V10, E16, T20, Q21, D24, S25, N30, E34, E35,
Y39, K42, I44, N51-R56, and S63-F66 apart from the
amide and carboxy terminal residues. Moreover, residues
G18 and K62 were protected only at native condition.
For better appreciation toward the changes in exchange
rate of different amide protons with increasing denatur-
ant concentration, we have analyzed H-D exchange data
in terms of protection factor ratio (urea/native) at 0.25
M, 0.75 M, and 1.5 M urea. Note, protection factor of
amide protons were determined from a ratio of calcu-
lated intrinsic exchange rates of amide protons of the
Ste11 SAM domain and experimentally measured
exchange rates.52 As can be seen, most of the residues
demonstrated a decrease in protection factor ratio with
Figure 4Comparison of the dynamical characteristics of the Ste11 SAM domain at native and near-native condition. Bar diagrams showing differences
between R1 (Panel A) and R2 (Panel B) of residues of the Ste11 SAM domain at native and two different urea concentrations (0.5 M and 2 M).
The residues exhibit significantly higher DR2 values are marked (Panel B). These residues may experience the enhancement of conformationalexchange with the increment of urea concentration. The bar diagram (Panel C) compares average R2 values of the residues belonging to the five
helices of the of Ste11 SAM domain at 0 M, 0.5 M, and 2 M urea concentration.
Urea-Induced Near Native Conformational Change in Ste11 SAM
PROTEINS 7
increased urea concentrations. However, residues from
Helix 1, loop, and Helix 5 were found to be more sus-
ceptible (protection factor ratio �0.1) for exchange at
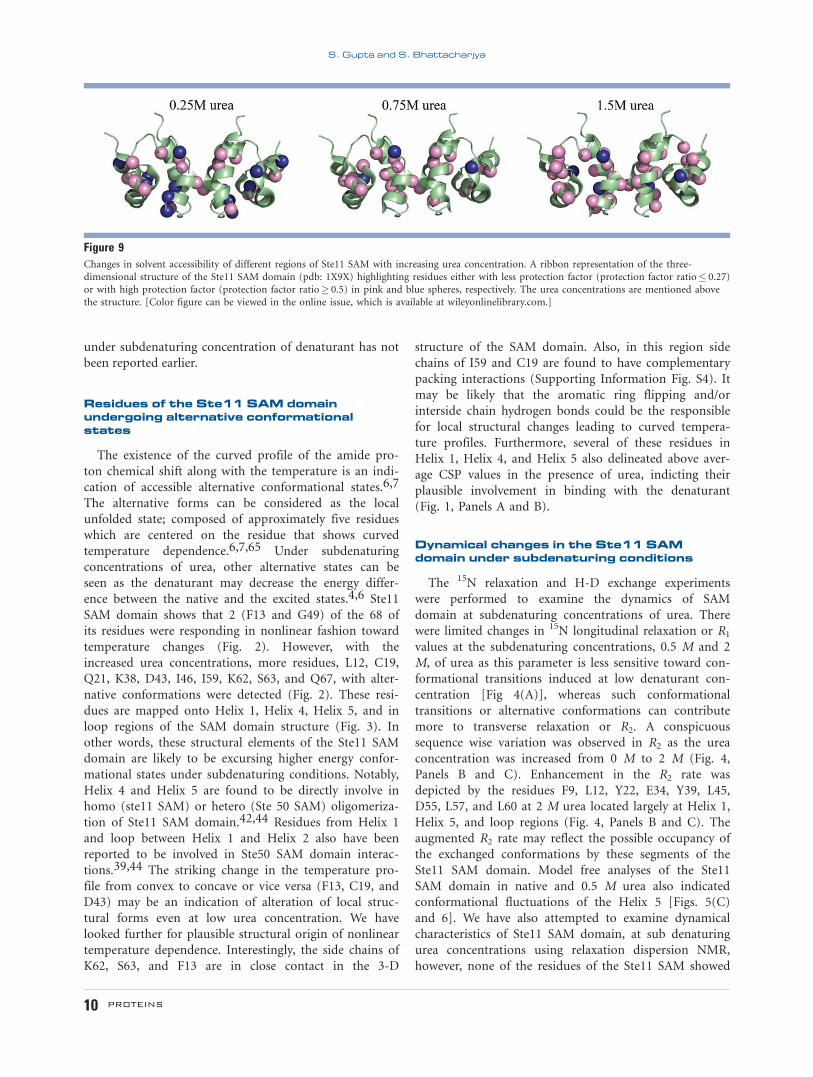
higher urea concentrations (Fig. 8). Additionally, we have
noticed interesting trends in amide proton exchange with
increasing denaturant concentrations (0–1.5 M). Residues
L12, F26, and L48 were highly protected (>0.5 PF ratio)
only up to 0.25 M urea concentration while I17, L40,
and L45 were less accessible for solvent exchange even at
1.5 M urea (Fig. 8). Notably, some residues, for example,
E15, I37, D43, L48, and R61 delineated almost no change
in protection factor ratio with increment of denaturant
and probably represent the slowest exchanging amides
(Fig. 8). Residues demarcate distinct features in H-D
exchange experiments are highlighted onto the structure
of Ste11 SAM domain (Fig. 9).
DISCUSSION
Apart from the structure, the dynamical characteristics
and conformational transitions of a protein are similarly
important not only for its functional aspects but also to
understand the free energy landscape. The resemblances
between the folding and molecular recognition during
interactions (existence of the thermodynamically stable
native structure, the size and diversity of the conforma-
tional space) are already well accepted.60 During folding
and also in signaling events, the energy landscape
remains populated with numerous conformational states
with various energy differences. The rate of interconver-
sion between these different states is important for the
protein functions which can vary from the nanosecond
to micromilliseconds time scale.61 Stability and flexibility
of the structure of protein molecules appear to be deter-
mining the extent of ruggedness of the underlying energy
Figure 5Comparison of the order parameter of the Ste11 SAM Domain at native
and near-native condition. The order parameter (S2) of Ste11 SAM
domain as function of amino acid sequence at native (Panel A) and in0.5 M urea (Panel B). The dotted line indicates the average order
parameter value. (Panel C) The average S2 value of the residues com-prising five helcies of the Ste11 SAM domain. A reduced average S2
value of Helix 5 in 0.5 M urea indicates its comparative flexibility atpico-nanosecond time scale. Figure 6
Comparison of the exchange rates of the Ste11 SAM Domain at nativeand near-native condition. Bar diagram showing the chemical exchange
contribution (Kex) estimated from model free analyses of the Ste11
SAM domain as a function of amino acid sequence at 0 M urea (blackbar) and 0.5 M urea (gray bar).
S. Gupta and S. Bhattacharjya
8 PROTEINS
landscape during the molecular events like folding and
binding. The knowledge about the near-native conforma-
tions is important as these minor populated states con-
trol the structural adaptability, interconversion rate
between the native and alternative states and perturba-
tion of the energy landscape by external effectors of a
protein.62–64
In the current work, we have examined conformational
and dynamical changes in the Ste11 SAM domain at sub-
denaturing concentrations of urea. The native structure of
the Ste11 SAM domain, at 300 mM NaCl, remains folded
at 2.5 M as judged by the wide chemical shift dispersions
and lack of new cross-peaks corresponding to the unfolded
states. The global unfolding was evident only at 6 M urea
concentration (Supporting Information Fig. S1). The
retention of global native fold can be approximated from
the residue specific Cm values of Ste11 SAM (Supporting
Information Fig. S2; the lowest value is 3.32). Hence, the
structural changes in dimeric Ste11 SAM have been inves-
tigated within 2 M urea concentration which is well below
the unfolding transition zone. Note, an urea-induced
unfolding study, by NMR, also demonstrated that the
SAM domain of DLC-1 assumes unfolded state �6 M urea
with midpoint of transition �3 M urea.43 Furthermore,
chaotropes mediated global unfolding of SAM domains
have been investigated in previous studies,36,42,43 the
conformational and dynamical changes in SAM domain
Figure 7Urea-induced change in the H-D exchange profile of Ste11 SAM domain. 15N–1H HSQC spectra of Ste11 SAM domain after 360 min exchange
against solvent D2O at native condition and in presence of 0.25 M, 0.5 M, 0.75 M, and 1.5 M urea. Samples were prepared by dissolving lyophilized
powder in a D2O buffer of 10 mM sodium phosphate, pH 5.8, containing 300 mM NaCl and 20 mM b-ME with/without adequate amount ofurea. The protein concentrations for H/D exchange studies were fixed at 0.5 mM.
Figure 8Urea-induced change in protection factor of the amide protons of Ste11SAM domain. The plot shows the residue specific change in protection
factor with the increment of urea concentration from 0 M to 1.5 M.The solid filled box, circle and triangles represent protection factor
ratios (urea/native) at 0.25 M, 0.75 M, and 1.5 M urea concentrations.The solid line indicates the ratio of 0.5 while the dashed line demar-
cates the ratio of 0.1. The residues with protection factor ratio>0.5 can
be considered as highly protected while those below 0.1 are moresolvent accessible.
Urea-Induced Near Native Conformational Change in Ste11 SAM
PROTEINS 9
under subdenaturing concentration of denaturant has not
been reported earlier.
Residues of the Ste11 SAM domainundergoing alternative conformationalstates
The existence of the curved profile of the amide pro-
ton chemical shift along with the temperature is an indi-
cation of accessible alternative conformational states.6,7
The alternative forms can be considered as the local
unfolded state; composed of approximately five residues
which are centered on the residue that shows curved
temperature dependence.6,7,65 Under subdenaturing
concentrations of urea, other alternative states can be
seen as the denaturant may decrease the energy differ-
ence between the native and the excited states.4,6 Ste11
SAM domain shows that 2 (F13 and G49) of the 68 of
its residues were responding in nonlinear fashion toward
temperature changes (Fig. 2). However, with the
increased urea concentrations, more residues, L12, C19,
Q21, K38, D43, I46, I59, K62, S63, and Q67, with alter-
native conformations were detected (Fig. 2). These resi-
dues are mapped onto Helix 1, Helix 4, Helix 5, and in
loop regions of the SAM domain structure (Fig. 3). In
other words, these structural elements of the Ste11 SAM
domain are likely to be excursing higher energy confor-
mational states under subdenaturing conditions. Notably,
Helix 4 and Helix 5 are found to be directly involve in
homo (ste11 SAM) or hetero (Ste 50 SAM) oligomeriza-
tion of Ste11 SAM domain.42,44 Residues from Helix 1
and loop between Helix 1 and Helix 2 also have been
reported to be involved in Ste50 SAM domain interac-
tions.39,44 The striking change in the temperature pro-
file from convex to concave or vice versa (F13, C19, and
D43) may be an indication of alteration of local struc-
tural forms even at low urea concentration. We have
looked further for plausible structural origin of nonlinear
temperature dependence. Interestingly, the side chains of
K62, S63, and F13 are in close contact in the 3-D
structure of the SAM domain. Also, in this region side
chains of I59 and C19 are found to have complementary
packing interactions (Supporting Information Fig. S4). It
may be likely that the aromatic ring flipping and/or
interside chain hydrogen bonds could be the responsible
for local structural changes leading to curved tempera-
ture profiles. Furthermore, several of these residues in
Helix 1, Helix 4, and Helix 5 also delineated above aver-
age CSP values in the presence of urea, indicting their
plausible involvement in binding with the denaturant
(Fig. 1, Panels A and B).
Dynamical changes in the Ste11 SAMdomain under subdenaturing conditions
The 15N relaxation and H-D exchange experiments
were performed to examine the dynamics of SAM
domain at subdenaturing concentrations of urea. There
were limited changes in 15N longitudinal relaxation or R1
values at the subdenaturing concentrations, 0.5 M and 2
M, of urea as this parameter is less sensitive toward con-
formational transitions induced at low denaturant con-
centration [Fig 4(A)], whereas such conformational
transitions or alternative conformations can contribute
more to transverse relaxation or R2. A conspicuous
sequence wise variation was observed in R2 as the urea
concentration was increased from 0 M to 2 M (Fig. 4,
Panels B and C). Enhancement in the R2 rate was
depicted by the residues F9, L12, Y22, E34, Y39, L45,
D55, L57, and L60 at 2 M urea located largely at Helix 1,
Helix 5, and loop regions (Fig. 4, Panels B and C). The
augmented R2 rate may reflect the possible occupancy of
the exchanged conformations by these segments of the
Ste11 SAM domain. Model free analyses of the Ste11
SAM domain in native and 0.5 M urea also indicated
conformational fluctuations of the Helix 5 [Figs. 5(C)
and 6]. We have also attempted to examine dynamical
characteristics of Ste11 SAM domain, at sub denaturing
urea concentrations using relaxation dispersion NMR,
however, none of the residues of the Ste11 SAM showed
Figure 9Changes in solvent accessibility of different regions of Ste11 SAM with increasing urea concentration. A ribbon representation of the three-
dimensional structure of the Ste11 SAM domain (pdb: 1X9X) highlighting residues either with less protection factor (protection factor ratio� 0.27)or with high protection factor (protection factor ratio� 0.5) in pink and blue spheres, respectively. The urea concentrations are mentioned above
the structure. [Color figure can be viewed in the online issue, which is available at wileyonlinelibrary.com.]
S. Gupta and S. Bhattacharjya
10 PROTEINS
any response to these experiments, possibly due to the
absence of conformational time scale required for relaxa-
tion dispersion studies. Equilibrium H/D exchange
experiments at subdenaturing conditions can probe con-
formational stability or structural regions affected by
denaturant. At the native state of Ste11 SAM domain,
amide protons of most of the secondary structural
regions (Helix 1–Helix 5) were found to be highly pro-
tected. We find that additions of subdenaturing concen-
trations of urea have caused a progressive enhancement
of the exchange of a number of amide protons of the
Ste11 SAM domain as judged by the dramatic reduction
in protection factor ratios (Figs. 8 and 9). We find that
residues from Helix 1, loop, and Helix 5 were even more
prone to exchange with solvent in the presence of low
subdenaturing denaturant concentration of urea (Figs. 8
and 9).
Implications in folding and interactions
Our results, urea-induced chemical shift change, tem-
perature profile of amide protons, 15N relaxation and H-
D exchange experiments, obtained for the Ste11 SAM
domain at subdenaturing solution conditions containing
urea might have potential implications in folding energy
landscape and binding interactions of the SAM domain.
Collectively, we find that among the five helices, residues
in Helix 1, Helix 5 are primarily responsible for urea-
induced CSPs and demonstrate alternate conformational
states. These helical segments are also dynamically
affected in comparison to other helices in the structure
of Ste11 SAM domain. It may be noted that the Helix 5
of the Ste11 SAM domain, and also for other canonical
SAM domain, is longer in length. It may be postulated
that the long helices of proteins may display higher sta-
bility due to more number of hydrogen bonds. However,
our results show that the long Helix 5 of the Ste11 SAM
delineates most of the conformational and dynamical
variations at the near native conditions. Such characteris-
tics of the Helix 5 may be linked with plausible func-
tional requirement of the Ste11 SAM domain. It is
noteworthy that Helix 5 and Helix 1, are involved bind-
ing interactions with Ste50 SAM domain.39,42,44 A
number of residues of the Helix 5 are also found to be
engaged in interactions at the dimeric interface of the
Ste11 SAM domain.44 It is therefore appealing to specu-
late that these high energy conformational states might
have implications in binding with other SAM domains.
Remarkably, alternate conformational states for the sub-
strate binding sites are observed for other proteins
including SUMO-1, ubiquitin, and NEDD8.4,66 In these
proteins, high energy conformational states are involved
in substrate interactions. Considering the overlap
between the near native folding and molecular recogni-
tion in the energy landscape, we hypothesize that the
regions accessing alternate conformational states of the
Ste11 SAM might be potentially involved in determining
the ruggedness of the free energy landscape.
ACKNOWLEDGMENT
We would like to acknowledge Dr. Anirban Bhunia for
helping with NMR experiments.
REFERENCES
1. Henzler-Wildman K, Kern D. Dynamic personalities of proteins.
Nature 2007;450:964–972.
2. Smock RG, Gierasch LM. Sending signals dynamically. Science 2009;
324:198–203.
3. Dinner AR, �Salib A, Smitha LJ, Dobsona CM, Karplus M. Under-
standing protein folding via free-energy surfaces from theory and
experiment. Trends Biochem Sci 2000;25:331–339.
4. Kumar A, Srivastava S, Hosur RV. NMR characterization of the
energy landscape of SUMO-1 in the native-state ensemble. J Mol
Biol 2007;367:1480–1493.
5. Kumar A, Srivastava S, Mishra RK, Mittal R, Hosur RV. Local struc-
tural preferences and dynamics restrictions in the urea-denatured
state of SUMO-1: NMR characterization. Biophys J 2006;90:2498–
2509.
6. Williamson MP. Many residues in cytochrome c populate alternative
states under equilibrium conditions. Proteins 2003;53:731–739.
7. Baxter NJ, Hosszu LLP, Waltho JP, Williamson MP. Characterisation
of low free-energy excited states of folded proteins. J Mol Biol 1998;
284:1625–1639.
8. Dyson HJ, Wright PE. Elucidation of the protein folding landscape
by NMR. Methods Enzymol 2005;394:299–321.
9. Dyson HJ, Wright PE. Equilibrium NMR studies of unfolded and
partially folded proteins. Nat Struct Biol 1998;5:499–503.
10. Dyson HJ, Wright PE. Nuclear magnetic resonance methods for elu-
cidation of structure and dynamics in disordered states. Methods
Enzymol 2001;339:258–270.
11. Dyson HJ, Wright PE. Unfolded proteins and protein folding stud-
ied by NMR. Chem Rev 2004;104:3607–3622.
12. Bai Y, Milne JS, Mayne L, Englander SW. Protein stability parame-
ters measured by hydrogen exchange. Proteins 1994;20:4–14.
13. Bhavesh NS, Sinha R, Mohan PMK, Hosur RV. NMR elucidation of
early folding hierarchy in HIV-1 protease. J Biol Chem 2003;278:
19980–19985.
14. Gupta S, Bhattacharjya S. NMR characterization of the near native
and unfolded states of the PTB domain of DOK1: alternate confor-
mations and residual clusters. PLoS ONE 2014;9:e90557.
15. Bai Y. Protein folding pathways studied by pulsed- and native-state
hydrogen exchange. Chem Rev 2006;106:1757–1768.
16. Bai Y, Sosnick TR, Mayne L, Englander SW. Protein folding inter-
mediates: native-state hydrogen exchange. Science 1995;269:192–197.
17. Englander SW. Protein folding intermediates and pathways studied
by hydrogen exchange. Annu Rev Biophys Biomol Struct 2000;29:
213–238.
18. Kim CA, Bowie JU. SAM domains: uniform structure, diversity of
function. Trends Biochem Sci 2003;28:625–628.
19. Qiao F, Bowie JU. The many faces of SAM. Science 2005;2005:re7.
20. Pawson T, Nash P. Assembly of cell regulatory systems through pro-
tein interaction domains. Science 2003;300:445–452.
21. Ponting CP. SAM: a novel motif in yeast sterile and Drosophila pol-
yhomeotic proteins. Protein Sci 1995;4:1928–1930.
22. Schultz J, Ponting CP, Hofmann K, Bork P. SAM as a protein inter-
action domain involved in developmental regulation. Protein Sci
1997;6:249–253.
23. Pawson T. Specificity in signal transduction: from phosphotyrosine-
sh2 domain interactions to complex cellular systems. Cell 2004;116:
191–203.
Urea-Induced Near Native Conformational Change in Ste11 SAM
PROTEINS 11
24. Peterson AJ, Kyba M, Bornemann D, Morgan K, Brock HW, Simon
J. A domain shared by the Polycomb group proteins Scm and ph
mediates heterotypic and homotypic interactions. Mol Cell Biol
1997;17:6683–6692.
25. Kim CA, Sawaya MR, Cascio D, Kim W, Bowie JU. Structural orga-
nization of a sex-comb-on-midleg/polyhomeotic copolymer. J Biol
Chem 2005;280:27769–27775.
26. Poirel H, Lopez RG, Lacronique V, Valle VD, Mauchauff�e M, Berger
R, Ghysdael J, Bernard OA. Characterization of a novel ETS gene,
TELB, encoding a protein structurally and functionaly related to
TEL. Oncogene 2000;19:4802–4806.
27. Ramachander R, Kim CA, Phillips ML, Mackereth CD, Thanos CD,
McIntosh LP, Bowie JU. Oligomerization-dependent association of
the SAM domains from Schizosaccharomyces pombe Byr2 and Ste4.
J Biol Chem 2002;277:39585–39593.
28. Hock B, B€ohme B, Karn T, Yamamoto T, Kaibuchi K, Holtrich U,
Holland S, Pawson T, R€ubsamen-Waigmann H, Strebhardt K. PDZ-
domain-mediated interaction of the Eph-related receptor tyrosine
kinase EphB3 and the ras-binding protein AF6 depends on the
kinase activity of the receptor. Proc Natl Acad Sci USA 1998;95:
9779–9784.
29. Stein E, Lane AA, Cerretti DP, Schoecklmann HO, Schroff AD, Van
Etten RL, Daniel TO. Eph receptors discriminate specific ligand
oligomers to determine alternative signaling complexes, attachment,
and assembly responses. Gene Dev 1998;12:667–678.
30. Kasten M, Giordano A. Cdk10, a Cdc2-related kinase, associates
with the Ets2 transcription factor and modulates its transactivation
activity. Oncogene 2001;20:1832–1838.
31. Kim CA, Phillips ML, Kim W, Gingery M, Tran HH, Robinson MA,
Faham S, Bowie JU. Polymerization of the SAM domain of TEL in
leukemogenesis and transcriptional repression. EMBO J 2001;20:
4173–4182.
32. Qiao F, Song H, Kim AC, Sawaya MR, Hunter JB, Gingery M,
Rebay I, Courey AJ, and Bowie JU. Derepression by depolymeriza-
tion;structural insight into the regulation of Yan by Mae. Cell 2004;
118:11.
33. Baron MK, Boeckers TM, Vaida B, Faham S, Gingery M, Sawaya
MR, Salyer D, Gundelfinger ED, Bowie JU. An architectural frame-
work that may lie at the core of the postsynaptic density. Science
2006;311:531–535.
34. Aviv T, Lin Z, Lau S, Rendl LM, Sicheri F, Smibert CA. The RNA-
binding SAM domain of Smaug defines a new family of post-
transcriptional regulators. Nat Struct Biol 2003;10:614–621.
35. Johnson PE, Donaldson LW. RNA recognition by the Vts1p SAM
domain. Nat Struct Mol Biol 2006;13:177–178.
36. Barrera FN, Garz�on MT, G�omez J, Neira JL. Equilibrium unfolding
of the C-terminal SAM domain of p73. Biochemistry 2002;41:5743–
5753.
37. Barrera FN, Poveda JA, Gonz�alez-Ros JM, Neira JL. Binding of the
C-terminal sterile a motif (SAM) domain of human p73 to lipid
membranes. J Biol Chem 2003;278:46878–46885.
38. Di Pietro SM, Cascio D, Feliciano D, Bowie JU, Payne GS. Regula-
tion of clathrin adaptor function in endocytosis: novel role for the
SAM domain. EMBO J 2010;29:1033–1044.
39. Kim AC, Gingery M, Pilpa RM, Bowie JU. The SAM domain of
polyhomeotic forms a helical polymer Nat Struct Mol Biol 2002;9:5.
40. Kwan JJ, Warner N, Maini J, Chan Tung KW, Zakaria H, Pawson T,
Donaldson LW. Saccharomyces cerevisiae Ste50 binds the MAPKKK
Ste11 through a head-to-tail SAM domain interaction. J Mol Biol
2006;356:142–154.
41. Stapleton D, Balan, I., Pawson, T., and Sicheri, F. The crystal struc-
ture of an Eph receptor SAM domain reveal a mechanism for mod-
ular dimerization. Nat Struct Mol Biol 1999;6:6.
42. Bhunia A, Domadia PN, Xu X, Gingras R, Ni F, Bhattacharjya S.
Equilibrium unfolding of the dimeric SAM domain of MAPKKK
Ste11 from the budding yeast: role of the interfacial residues in
structural stability and binding. Biochemistry 2008;47:651–659.
43. Yang S, Noble CG, Yang D. Characterization of DLC1-SAM equilib-
rium unfolding at the amino acid residue level. Biochemistry 2009;
48:4040–4049.
44. Bhattacharjya S, Xu P, Gingras R, Shaykhutdinov R, Wu C,
Whiteway M, Ni F. Solution structure of the dimeric SAM domain
of MAPKKK Ste11 and its interactions with the adaptor protein
Ste50 from the budding yeast: implications for Ste11 activation and
signal transmission through the Ste50-Ste11 complex. J Mol Biol
2004;344:1071–1087.
45. Bhattacharjya S, Xu, P., Chakrapani, M., Johnston, L., and Ni, F.
polymerization of the SAM domain of MAPKKK Ste11 from the
budding yeast: implication for efficient signaling through the MAPK
cascades. Protein Sci 2005;14:8.
46. Stevenson BJ, Rhodes N, Errede B, Sprague Jr GF. Constitutive
mutants of the protein kinase STE11 activate the yeast pheromone
response pathway in the absence of the G protein. Gene Dev 1992;
6:1293–1304.
47. Wu C, Leberer E, Thomas DY, Whiteway M. Functional characteri-
zation of the interaction of Ste50p with Ste11p MAPKKK in Saccha-
romyces cerevisiae. Mol Biol Cell 1999;10:2425–2440.
48. Delaglio F, Grzesiek S, Vuister GW, Zhu G, Pfeifer J, Bax A.
NMRPipe: a multidimensional spectral processing system based on
UNIX pipes. J Biomol NMR 1995;6:277–293.
49. Johnson BA, Blevins RA. NMR View: a computer program for the
visualization and analysis of NMR data. J Biomol NMR 1994;4:603–
614.
50. Van Mierlo CPM, Van Den Oever JMP, Steensma E. Apoflavodoxin
(un)folding followed at the residue level by NMR. Protein Sci 2000;
9:145–157.
51. Anthis NJ, Haling JR, Oxley CL, Memo M, Wegener KL, Lim CJ,
Ginsberg MH, Campbell ID. b integrin tyrosine phosphorylation is
a conserved mechanism for regulating talin-induced integrin activa-
tion. J Biol Chem 2009;284:36700–36710.
52. Bai Y, Milne JS, Mayne L, Englander SW. Primary structure effects
on peptide group hydrogen exchange. Proteins 1993;17:75–86.
53. Farrow NA, Muhandiram R, Singer AU, Pascal SM, Kay CM, Gish
G, Shoelson SE, Pawson T, Forman-Kay JD, Kay LE. Backbone
dynamics of a free and phosphopeptide-complexed Src homology 2
domain studied by 15N NMR relaxation. Biochemistry 1994;33:
5984–6003.
54. Bhunia A, Domadia PN, Mohanram H, Bhattacharjya S. NMR
structural studies of the Ste11 SAM domain in the dodecyl phos-
phocholine micelle. Proteins 2009;74:328–343.
55. Dosset P, Hus JC, Blackledge M, Marion D. Efficient analysis of
macromolecular rotational diffusion from heteronuclear relaxation
data. J Biomol NMR 2000;16:23–28.
56. Mandel AM, Akke M, Palmer Iii AG. Backbone dynamics of Esche-
richia coli ribonuclease HI: correlations with structure and function
in an active enzyme. J Mol Biol 1995;246:144–163.
57. Zuiderweg ERP. Mapping protein-protein interactions in solution
by NMR spectroscopy. Biochemistry 2002;41:1–7.
58. Baxter NJ, Williamson MP. Temperature dependence of 1H chemical
shifts in proteins. J Biomol NMR 1997;9:359–369.
59. Kay LE, Torchia DA, Bax A. Backbone dynamics of proteins as stud-
ied by 15N inverse detected heteronuclear NMR spectroscopy:
application to staphylococcal nuclease. Biochemistry 1989;28:8972–
8979.
60. Verkhivker GM, Bouzida D, Gehlhaar DK, Rejto PA, Freer ST, Rose
PW. Complexity and simplicity of ligand-macromolecule interac-
tions: the energy landscape perspective. Curr Opin Struc Biol 2002;
12:197–203.
61. Hansen DF, Feng H, Zhou Z, Bai Y, Kay LE. Selective characteriza-
tion of microsecond motions in proteins by NMR relaxation. J Am
chem Soc 2009;131:16257–16265.
62. Kumar S, Ma B, Tsai CJ, Sinha N, Nussinov R. Folding and binding
cascades: dynamic landscapes and population shifts. Protein Sci
2000;9:10–19.
S. Gupta and S. Bhattacharjya
12 PROTEINS
63. Feher VA, Cavanagh J. Millisecond-timescale motions contribute to
the function of the bacterial response regulator protein Spo0F.
Nature 1999;400:289–293.
64. Whitten ST, Garc�ıa-Moreno E B, Hilser VJ. Local conformational
fluctuations can modulate the coupling between proton binding and
global structural transitions in proteins. Proc Natl Acad Sci USA
2005;102:4282–4287.
65. Tunnicliffe RB, Waby JL, Williams RJ, Williamson MP. An experi-
mental investigation of conformational fluctuations in proteins G
and L. Structure 2005;13:1677–1684.
66. Kitahara R, Yamaguchi Y, Sakata E, Kasuya T, Tanaka K, Kato
K, Yokoyama S, Akasaka K. Evolutionally conserved inter-
mediates between ubiquitin and NEDD8. J Mol Biol 2006;363:
395–404.
Urea-Induced Near Native Conformational Change in Ste11 SAM
PROTEINS 13
Related Documents