Universidade de Lisboa Faculdade de Ciências Departamento de Química e Bioquímica CHARACTERIZATION OF THE GENETIC STRUCTURE OF THE AZOREAN POPULATION CLÁUDIA MARGARIDA AGUIAR CASTELO BRANCO Doutoramento em Genética Molecular 2007

Welcome message from author
This document is posted to help you gain knowledge. Please leave a comment to let me know what you think about it! Share it to your friends and learn new things together.
Transcript
Universidade de Lisboa
Faculdade de Ciências
Departamento de Química e Bioquímica
CHARACTERIZATION OF THE GENETIC STRUCTURE OF
THE AZOREAN POPULATION
CLÁUDIA MARGARIDA AGUIAR CASTELO BRANCO
Doutoramento em Genética Molecular
2007
Universidade de Lisboa
Faculdade de Ciências
Departamento de Química e Bioquímica
Hospital do Divino Espírito Santo de
Ponta Delgada, EPE Unidade de Genética e Patologia Moleculares
CHARACTERIZATION OF THE GENETIC STRUCTURE OF
THE AZOREAN POPULATION
CLÁUDIA MARGARIDA AGUIAR CASTELO BRANCO
Doutoramento em Genética Molecular
Tese orientada pela Investigadora Doutora Luisa Mota Vieira
(Orientador interno Professora Doutora Margarida Amaral)
2007
De acordo com o disposto no artigo 40º do Regulamento de Estudos Pós-Graduados da
Universidade de Lisboa, Deliberação nº 961/2003, publicada no Diário da República II
Série nº 153, de 5 de Julho de 2003, foram utilizados nesta dissertação resultados dos
seguintes artigos:
Branco CC, Pacheco PR, Cabrol E, Gomes CT, Cabral R, Mota-Vieira L. Linkage disequilibrium on
Xq13.3, NRY and HLA regions in São Miguel Island (Azores) population. 2007, submitted.
Branco CC, São-Bento M, Gomes CT, Cabral R, Pacheco PR, Mota-Vieira L. Azores Islands:
genetic origin, gene flow and diversity patterns. 2007, submitted.
Branco CC, Cabrol E, São-Bento M, Gomes CT, Cabral R, Vicente AM, Pacheco PR, Mota-Vieira
L. Evaluation of linkage disequilibrium on the Xq13.3 region: comparison between the Azores
Islands and mainland Portugal. Am J Hum Biol. 2007, in press.
Branco CC, Pacheco PR, Cabral R, Vicente AM, Mota-Vieira L. Genetic signature of the São
Miguel Island population (Azores) assessed by 21 microsatellite loci. Am J Hum Biol. 2007, in press.
Branco CC, Palla R, Lino S, Pacheco PR, Cabral R, de Fez L, Peixoto BR, Mota-Vieira L.
Assessment of the Azorean ancestry by Alu insertion polymorphisms. Am J Hum Biol. 2006; 18:
223-226.
Branco CC, Mota-Vieira L. Surnames in Azores: Analysis of the isonymy structure. Hum Biol. 2005;
77: 37-44.
Cabral R, Branco CC, Costa S, Caravello GU, Tasso M, Peixoto BR, Mota-Vieira L. Geography of
surnames in Azores: specificity and spatial distribution analysis. Am J Hum Biol. 2005; 17: 634-645.
Pacheco PR, Branco CC, Cabral R, Costa S, Araújo AL, Peixoto BR, Mendonça P and Mota-Vieira
L. The Y-chromosomal heritage of the Azores Islands population. Ann Hum Genet. 2005; 69:
145-156.
Branco CC, Mota-Vieira L. Population structure of São Miguel Island (Azores, Portugal): A
surname study. Hum Biol. 2003; 75: 929-939.
No cumprimento do disposto na referida deliberação, esclarecemos serem da nossa
responsabilidade a execução das experiências que estiveram na base dos resultados
apresentados (excepto quando referido em contrário), assim como a sua interpretação e
discussão.
3
PREFACE
Genomic medicine, a biomedical research area which uses the individual information to
provide better health care, has been considerably developed since the Human Genome
Project. One of its current challenges is the identification of the risk or susceptibility for
multifactorial diseases and the study of their frequency in populations. The knowledge
produced in this research area, will, most certainly, be responsible for new treatment
strategies, such as pharmacogenomics, resulting in more effective and less toxic drugs.
This PhD thesis had as major objective contribute to the characterisation of the genetic
background and population structure of the Azorean population. The information
retrieved from this work is essential in the comprehension of the Azorean diversity and
ancestry, which, on the other hand, will be important for the development of genomic
medicine, in particular, for the design of future mapping studies in this population.
A detailed overview of the literature concerning human diversity markers, population structure and the advantages of isolated versus outbred populations are given in chapters I, II and III, respectively. Chapter I focuses briefly on the contribution of molecular and non-molecular markers, where an introduction of the importance of surnames and of human genome polymorphisms is shown. The use of linkage disequilibrium and its importance in the human genome architecture is demonstrated. Chapter II describes the evolutionary forces, such as genetic drift, selection, mutation and migration, which play a relevant role in the population’s structure. Moreover, genetic distance measures and inbreeding are also presented. Chapter III compares isolated and outbred populations in terms of advantages for genetic studies. Examples of five human isolated populations are exhibited.
Chapter IV is devoted to the characterization of the study population, the Azores. Its geographic location, demography, discovery and settlement are introduced. A brief description of other genetic studies in this population and the objectives of this scientific research are given.
Chapters V, VI and VII assemble the scientific work performed in this PhD thesis,
which are object of publication in international journals. Chapter V concerns the
structure of Azorean population through the analysis of surnames. Chapter VI
approaches the Azorean ancestry, with studies of Y-chromosome lineages and Alu
4

insertion polymorphisms. Finally, chapter VII reports the Azorean diversity and
structure based on genetic markers located both in autosomes and X-chromosome.
The last chapter of this thesis, chapter VIII, provides a general integrative discussion of
the results placing them in perspective with state-of-the-art data in population genetics
field. Perspectives for future work are also highlighted.
5
ACKNOWLEDGMENTS
“Sometimes our light goes out but is blown into flame by another human being. Each of us owes deepest thanks to those
who have rekindled this light.”
Albert Schweitzer
Nesta longa caminhada de quatro anos são tantos os agradecimentos que espero não
descurar nenhum.
Devo começar pela força motora deste doutoramento, a minha orientadora,
Investigadora Doutora Luísa Mota Vieira, que numa tarde de Primavera se sentou ao
meu lado e iniciou uma longa conversa na qual ficou decidido o meu projecto de
doutoramento. Não posso deixar de mencionar a sua inquestionável orientação,
disponibilidade, atenção, interesse, curiosidade, e constante presença, características
estas que, embora façam parte da sua personalidade, muito contribuíram para que este
projecto chegasse a “bom porto”. A ela dedico a minha total gratidão e amizade.
Às minhas colegas de trabalho e amigas, Paula e Rita, pelas suas questões, ajuda,
preocupações, conselhos, disponibilidade, compreensão, e sentimentos. Fiquem certas
de que contribuíram para a minha “sanidade mental” tantas vezes ameaçada pelas
dificuldades. No entanto, não me lembro apenas das dificuldades, igualmente estiveram
presentes nas alegrias, que sem dúvida alguma foram muitas.
Ao Bernardo, pela sua natureza curiosa, pelas suas perguntas infindáveis, pela correcção
do inglês dos artigos e finalmente pela sua amizade, expresso a minha total alegria por
te ter conhecido e me ter tornado parte do teu circulo de amigos.
Aos restantes membros da UGPM, os que por cá passaram e os que ficam, e amigos,
Laura, Ester, Raquel, Sílvia, Cristina, Marta, Quico, Felipe, Cidália, Mónica, Luís e
Alexandra, um grande beijinho.
6
Devo expressar da mesma forma o meu reconhecimento à minha co-orientadora,
Professora Doutora Margarida Amaral, pela confiança depositada no meu projecto de
investigação e pela sua ajuda em todo o processo logístico.
A todos os dadores de sangue e profissionais de saúde envolvidos nas colheitas das
dádivas de sangue, o meu reconhecimento e gratidão.
Ao membros dos Conselhos de Administração do Hospital do Divino Espírito Santo de
Ponta Delgada, EPE, que prontamente aceitaram e receberam de bom grado uma
estudante de doutoramento. Pelo seu interesse, visão e apoio, o meu muito obrigada.
Aos membros do júri pelas perguntas e interesse científico, o meu reconhecimento.
Aos meus amigos, Maria João, Ana e Marco, pelos vossos ouvidos, expresso o meu
apreço. Desejo-vos muita sorte na viagem que vão agora fazer e que sejam felizes.
À minha madrinha, Marília, pelo seu “empurrão”, personalidade e confiança; à minha
tia Margarida, pela sua compreensão, apoio e viagens divertidas, o meu muito obrigado.
Às minhas irmãs, Célia e Aurelina, e irmão, João, pelo amor, apoio, presença e
interesse. Por serem quem são, dedico-vos todo o meu amor e amizade. Às minhas
sobrinhas e afilhadas, Mariana, Sofia e Daniela, adoro-vos.
Aos meus avós, que já partiram, Irondina, José e António, e à que ficou, Maria Augusta,
pela preserverança e exemplo de persistência e vida, pelo amor e apoio, toda a minha
saudade e amor.
Por último, mas não no meu coração, aos meus pais, João e Fátima, pelo apoio, pelo
amor, pela presença, pela coragem e exemplo de vida, dou-vos todo o meu amor.
7
TABLE OF CONTENTS
PREFACE 4ACKNOWLEDGMENTS 6FIGURES INDEX 13TABLES INDEX 14ABREVIATIONS 15LIST OF USEFUL WEBSITES 17RESUMO 18SUMMARY 21
CHAPTER I. UNDESTANDING HUMAN DIVERSITY: CONTRIBUTION OF MOLECULAR AND NON MOLECULAR MARKERS 22
I.1. What can we learn from surnames 24 I.1.1. Isonymy, inbreeding and relationship coefficients 27 I.1.2. Surname diversity and migration 29 I.2. The human genome polymorphisms 33 I.2.1. Single Nucleotide Polymorphisms 33 I.2.2. Variable Number of Tandem Repeats 37 I.2.2.1. Satellites 37 I.2.2.2. Minisatellites 38 I.2.2.3. Microsatellite or short tandem repeats 39 I.2.3. Transposable elements 40 I.2.3.1. LINE – L1 41 I.2.3.2. SINE – Alu markers 42 I.2.4. Copy number variation 43 I.3. Linkage disequilibrium: Insight to the human genome architecture 44 I.3.1. Linkage disequilibrium and the international HapMap project 48
CHAPTER II. POPULATION STUDIES: KNOWING THE PAST TO PREDICT THE FUTURE 52
II.1. Population history, demography and evolutionary forces 54 II.1.1. Human population background: paternal and maternal lineages 56 II.1.2. Evolutionary forces 63 II.1.2.1. Genetic drift 64 II.1.2.2. Selection 68 II.1.2.3. Mutation and recombination 70 II.1.2.4. Migration or gene flow 74 II.2. Genetic distance and population structure 77 II.2.1. Genetic distance measures 77
8
II.2.2. Population structure and inbreeding 78
CHAPTER III. GENETIC ISOLATES VERSUS OUTBRED POPULATIONS 82
III.1. The Finnish population 86
III.2. The Sardinian population 89 III.3. The Old Order Amish population 91
III.4. The Hutterites population 93
III.5. The Saguenay-Lac-St-Jean population 94
CHAPTER IV. THE AZORES 97
IV.1. Geographic location and demographic characterization 98
IV.2. Discovery and settlement 100
IV.3. Genetic studies on the Azorean population 103
IV.4. Objectives of the scientific research 108
CHAPTER V. STRUCTURE OF AZOREAN POPULATION: VIEW FROM SURNAMES 109
V.1. Population Structure of São Miguel Island, Azores: A surname Study 110 V.1.1. Summary 110 V.1.2. Introduction 110 V.1.3. Material and Methods 111 V.1.3.1. Localities 111 V.1.3.2. Surnames 111 V.1.3.3. Mathematical methods 112 V.1.4. Results 114 V.1.4.1. Surname distribution 114 V.1.4.2. Isonymy analysis 115 V.1.5. Discussion 118 V.2. Surnames in Azores: Analysis of the isonymy structure 121 V.2.1. Summary 121 V.2.2. Introduction 121 V.2.3. Material and Methods 122 V.2.4. Results and Discussion 122 V.2.4.1. Surname distribution in Azorean population 122 V.2.4.2. Isonymy parameters 123 V.2.5. Conclusions 126 V.3. Geography of surnames in Azores: Specificity and spatial distribution
analysis 128 V.3.1. Summary 128 V.3.2. Introduction 128 V.3.3. Material and Methods 129
9
V.3.3.1. Dataset 129 V.3.3.2. Specificity Analysis 129 V.3.3.3. Spatial Autocorrelation Analysis 129 V.3.4. Results 132 V.3.4.1. Surname distribution 132 V.3.4.2. Specificity analysis 133 V.3.4.3. Spatial autocorrelation analysis (Moran’s I coefficient) 135 V.3.5. Discussion 141
CHAPTER VI. AZOREAN ANCESTRY 144 VI.1. The Y-chromosomal heritage of the Azores Islands population 145 VI.1.1. Summary 145 VI.1.2. Introduction 145 VI.1.3. Material and Methods 146 VI.1.3.1. Terminology and nomenclature 146 VI.1.3.2. Population samples 146 VI.1.3.3. PCR amplification of Y-SNPs and endonuclease digestion 147 VI.1.3.4. PCR amplification of Y-STRs 148 VI.1.3.5. Statistical analysis 148 VI.1.4. Results 149 VI.1.4.1. Y-chromosome biallelic polymorphisms 149 VI.1.4.2. Y-chromosome STR polymorphisms 150 VI.1.4.3. Y-chromosome STR polymorphism within haplogroups 153 VI.1.5. Discussion 154 VI.1.5.1. Prevalent Y-chromosome lineages in Azores Islands 154 VI.1.5.2. Variability of Y-chromosome STRs in Azores Islands 158 VI.1.6. Concluding remarks 159 VI.2. Assessment of the Azorean ancestry by Alu insertion polymorphisms 160 VI.2.1. Summary 160 VI.2.2. Introduction 160 VI.2.3. Material and Methods 161 VI.2.3.1. Population samples 161 VI.2.3.2. Alu genotyping 161 VI.2.3.3. Statistical analysis 162 VI.2.4. Results and Discussion 163 VI.2.5. Concluding remarks 166
CHAPTER VII. AZOREAN DIVERSITY AND STRUCTURE 167
VII.1. Genetic signature of the São Miguel Island population (Azores) assessed by 21 microsatellite loci 168
VII.1.1. Summary 168
10
VII.1.2. Introduction 168 VII.1.3. Material and Methods 168 VII.1.3.1. Population samples 168 VII.1.3.2. STR typing 169 VII.1.3.3. Statistical analysis 169 VII.1.4. Results 170 VII.1.5. Discussion 171 VII.2. Azores islands: genetic origin, gene flow and diversity pattern 174 VII.2.1. Summary 174 VII.2.2. Introduction 174 VII.2.3. Material and Methods 175 VII.2.3.1. Population samples 175 VII.2.3.2. STR genotyping 175 VII.2.3.3. Statistical analysis 176 VII.2.4. Results 176 VII.2.5. Discussion 181
VII.3. Evaluation of linkage disequilibrium on the Xq13.3 region: comparison between the Azores Islands and mainland Portugal 185 VII.3.1. Summary 185 VII.3.2. Introduction 185 VII.3.3. Material and Methods 186 VII.3.3.1. Population samples 186 VII.3.3.2. STRs typing 186 VII.3.3.3. Statistical analysis 187 VII.3.4. Results 187 VII.3.5. Discussion 188
VII.4. Linkage disequilibrium on Xq13.3, NRY and HLA regions in São Miguel Island (Azores) population 190 VII.4.1. Summary 190 VII.4.2. Introduction 190 VII.4.3. Material and Methods 191 VII.4.3.1. Population samples and genotyping 191 VII.4.3.2. Statistical analysis 191 VII.4.4. Results and Discussion 192
CHAPTER VIII. GENERAL DISCUSSION 195
VIII.1. Genetic origin of the Azorean population 197 VIII.2. Genetic diversity, relationship and linkage disequilibrium in the Azorean islanders 199
VIII.3. Inbreeding and population structure 202
11
VIII.4. Gene flow patterns 207 VIII.5. Concluding remarks and future perspectives 209
REFFERENCES 211
APPENDIXES 233
Appendix IX.1. Allele frequencies for 21 STR loci in São Miguel and mainland Portugal populations 234
Appendix IX.2. Allele frequencies for 15 STR loci in all Azorean islands 236
Appendix IX.3. Allele frequencies for 8 STR loci located on the X-chromosome in all Azorean islands and mainland Portugal 241
Appendix IX.4. HLA class I and II allele frequencies in São Miguel population 245
Appendix IX.5. Publications on the Azorean population 246
12
Figures Index
Figure I.1. Isonymy within and between population 27Figure I.2. Scheme of typical correlograms and of their likely interpretation 32Figure I.3. Characterization of the human genome. A. General composition. B. Genes and pseudogens content 34Figure I.4. Schematic representation of SNPs 35Figure II.1. Human mitochondrial DNA 57Figure II.2. Worldwide distribution of mtDNA haplogroups 59Figure II.3. Human Y-chromosome 60Figure II.4. Worldwide distribution of Y-chromosome haplogroups 62Figure II.5. Bottleneck and founder effects representation 65Figure III.1. Map of Finland demonstrating the settlement waves 87Figure III.2. The timescale of the year of first Finnish publication of some diseases 88Figure III.3. Map of Sardinia 90Figure III.4. Map of Lancaster county 91Figure III.5. The Huterites geographical location 93Figure III.6. Map of Saguenay-Lac-Saint-Jean 95Figure IV.1. Map of Azores Islands 98Figure IV.2. Demographic evolution of the Azores Islands population 99Figure V.1. Map of São Miguel Island (Azores) 112Figure V.2. Relationship between the number of surnames and the number of times they appear in the 2001 telephone book in São Miguel Island 115Figure V.3. Dendogram obtained from the matrix of Nei's distance between the eleven localities of São Miguel Island 118Figure V.4. Logarithmic distribution of surnames in Azores 125Figure V.5. Cluster analysis based on the matrix of Nei's distance for the Azorean population 127Figure V.6. Map of the Azores archipelago denoting the 19 municipalities 131Figure V.7. Spatial correlogram of the 113 Bonferroni significant correlograms of surname frequencies in Azores 140Figure V.8. Average correlograms representing the five patterns of Bonferroni significant I correlograms 140Figure VI.1. Geographic location of the Azores archipelago 147Figure VI.2. Phylogenetic tree of the Y-chromosome haplogroups and their percent frequencies in the Azores sample 151Figure VI.3. Multidimensional scaling of genetic relationships between populations based on Y-STRs 151Figure VI.4. Population relationships based on six Alu markers. A. Neighbor-Joining tree using FST genetic distances. B. Principal component analysis based on allele frequencies 165Figure VII.1. Population relationships based on 11 STRs. A. Neighbor-Joining tree based on Nei's genetic distances. B. Principal component analysis based on allele frequencies 172Figure VII.2. Principal component analysis based on allele frequencies in Azores 180Figure VII.3. Principal component analysis based on Slatkins FST genetic distance using 13 autosomal STRs 181Figure VII. 4. Comparison of the LD extent in Azores and mainland Portugal evaluated as average multiallelic D' values versus physical distances 188Figure VII.5. Comparison of the LD extension Xq13.3, NRY and HLA region, evaluated as average multiallelic D' values versus physical distances for the São Miguel Island population 193Figure VIII.1. Population structure for the Azorean and mainland Portugal populations based on 21 STR markers 206Figure VIII.2. Centroid analysis based on Alu frequencies 209
13
TABLES INDEX
Table III.1. Examples of genome scans in isolated populations 84Table III.2. Benefits of isolated and outbred populations 85Table IV.1. Demography data of the Azores Islands 99Table V.1. Surnames frequency and distribution in São Miguel Island localities 116
Table V.2. Results obtained in the calculation of isonymy (I), inbreeding coefficient (FST), Fisher's α and Karlin-McGregor ν for each locality in São Miguel Island 117Table V.4. Summary of surnames distribution and isonymy parameters for the Azorean islands 124Table V.5. Azores: Geographic, demographic and telephone subscribers data 134Table V.6. Specific surnames for each Azorean Island 136Table V.7. Autocorrelation coefficients (Moran's I) for the considered surnames in the Azorean population 137Table VI.1. Allele frequencies and gene diversity value at 7 Y-chromosome STR loci in Azorean population 152Table VI.2. Frequencies of Y-chromosome haplotypes by haplogroup in the Azorean population 155Table VI.3. Alu insertion frequencies, heterozygosity and gene diversity for Azores and mainland Portugal 163Table VII.1. Hardy-Weinberg equilibrium (HWE), gene diversity (GD) and inbreeding coefficient (FIS) for São Miguel and mainland Portugal based on 21 STRs 170Table VII.2. Hardy-Weinberg equilibrium (HWE) and gene diversity (GD) for 15 STR markers in the Azorean islands 177Table VII.3. Migration rates among all Azorean islands 179Table VII.4. Haplotype number (HN), gene diversity (GD) and standardized multiallelic coefficient (D’) for Azorean and mainland Portugal populations 187Table VII.5. Haplotype number (HN), gene diversity (GD) and standardized multiallelic coefficient (D’) for the three genomic regions in the São Miguel Island population 192Table VIII.1. Inbreeding coefficient based on surnames and allele frequencies of 15 STR loci in all Azorean islands 204Table VIII.2. Genetic differentiation between populations considering 11 autosomal STR markers and Azores as a whole 205
14
Abreviations
ABREVIATIONS
AD Alzheimer’s disease AMH Anatomically modern human ARSACS Autosomal recessive spastic ataxia of Charlevoix-Saguenay ASD Autism spectrum disorder BMI Body mass index bp Base pairs BRCA Breast cancer gene CEPH Centre d’ Etude du Polymorphisme Humain CEU CEPH project in Utah CHB Han Chinese population of Beijing CHD Congenital heart disease cM CentiMorgan CNPs Copy number polymorphisms CNVs Copy number variations D Depression D-leut Dariusleut DM1 Myotonic dystrophy DNA Deoxyribonucleic acid FMR Fragile X mental retardation HEXA Hexosaminidase A gene HIV Human imunodeficiency virus HG Haplogroups HLA Human leucocyte antigen HOGA Gyrate atrophy of choroids and retina HVR Hypervariable regions HWE Hardy-Weinberg equilibrium I Intrusion IAM Infinite allele model IBD Identical by descent IBD+D Isolation by distance and depression IBD+DDP Isolation by distance and double depression IBDM Isolation by distance model IDE Insulin degrading enzyme ISVs Intermediate-sized variants JC Jukes-Cantor model JPT Japanese ancestry from the Tokyo area kb Kilobases LCT Lactase gene LCVs Large-scale copy number variants LD Linkage disequilibrium LDD Long-distance differentiation L-leut Leherleut
15
Abreviations
LINES Long interspersed nuclear elements MAF Minor allele frequency Mb Megabases MDS Multi dimensional scaling MHC Major histocompatibility complex MJD Machado-Joseph disease mtDNA Mitochondrial DNA Ne Population size NF1 Neurofibromin 1 gene NIDDM Non-insulin-dependent diabetes mellitus NJ Neighbor-Joining NPL Non-parametric linkage NRY Nonrecombining portion of the Y-chromosome Numts Nuclear mitochondrial pseudogenes PAH Hepatic phenylalanine hydroxylase PDHc Pyruvate dehydrogenase complex PKU Phenylketonuria OMIM Online mendelian inheritance in man OOA Old Order Amish PCR Polymerase chain reaction RC-L1s Retrotransposition-competent L1s REV General reversible model RNA Ribonucleic acid SA Spatial autocorrelation S-leut Schmiedeleut SGCG Gamma-sarcoglycan gene SINES Short interspersed nuclear elements SLSJ Saguenay-Lac-Saint-Jean SMM Stepwise mutation model SNPs Single nucleotide polymorphisms SPSS Statistical package for social Sciences STRs Short tandem repeats Ta Transcribed active TPMT Thiopurine S-methyltransferase tSNPs tag single nucleotide polymorphisms UPGMA Unweighted pair group method with arithmetic mean US United States UTM Universal transverse mercator VNTRs Variable number of tandem repeats YBP Years before present YHRD Y-Chromosome haplotype reference database YRI Yoruba people of Ibidan Peninsula in Nigeria
16
Useful websites
LIST OF USEFUL WEBSITES
ALFRED - Allele Frequency Database http://alfred.med.yale.edu/alfred/index.asp
American Society of Human Genetics http://www.ashg.org/genetics/ashg/ashgmenu.htm
Arlequin (software) http://lgb.unige.ch/arlequin/
Copy Number Variation Project http://www.sanger.ac.uk/humgen/cnv
Database of Nuclear DNA http://www.ertzaintza.net/cgi-bin/db2www.exe/adn.d2w
European Directory DNA Diagnostic Laboratories http://www.eddnal.com/
Ensembl Database http://www.ensembl.org/index.html
European Society of Human Genetics http://www.eshg.org
Genetic Data Analysis (software) http://hydrodictyon.eeb.uconn.edu/people/plewis/software.php
GENEPOP (software, web version) http://genepop.curtin.edu.au
Gold (software) http://www.sph.umich.edu/csg/abecasis/GOLD/
Human Gene Mutation Database http://www.hgmd.cf.ac.uk/ac/index.php
Human Genome Database http://www.gdb.org
Human Genome Project http://www.ornl.gov/sci/techresources/Human_Genome/home.shtml
Human Genome Variation Database http://hgvbase.cgb.ki.se
IMGT/HLA Database http://www.ebi.ac.uk/imgt/hla
National Centre for Biotechnology Information http://www.ncbi.nlm.nih.gov
Online Mendelian Inheritance in Man http://www.ncbi.nlm.nih.gov/sites/entrez?db=OMIM
Orphanet http://www.orphanet.pt/
Portuguese Society of Human Genetics http://www.spgh.net
Rare diseases database http://www.rarediseases.org/
Single Nucleotide Polymorphism Database http://www.ncbi.nlm.nih.gov/projects/SNP
SPSS (software) http: //www.spss.com
STRBase http://www.cstl.nist.gov/biotec/strbase
Structure (software) http://pritch.bsd.uchicago.edu/software.html
The International HapMap Project http://www.hapmap.org
UCSC Genome Bioinformatics http://genome.ucsc.edu
Wikipédia http://pt.wikipedia.org/wiki/P%C3%A1gina_principal
Y-Chromosome Consortium http://ycc.biosci.arizona.edu
Y-STR haplotype Database http://www.ystr.org
17
Resumo
RESUMO
O estudo da diversidade genética humana possibilita um melhor conhecimento dos
padrões de distribuição das doenças genéticas numa população, bem como contribui
para a caracterização da evolução humana. O arquipélago dos Açores (Portugal),
situado no norte do oceano Atlântico, é composto por nove ilhas vulcânicas distribuídas
desigualmente por três grupos geográficos: o oriental com duas ilhas – São Miguel e
Santa Maria –, o central que inclui cinco ilhas – Terceira, Pico, Faial, São Jorge e
Graciosa –, e o ocidental com Flores e Corvo. A fim de compreender e determinar o
fundo genético da população açoriana, a presente tese teve por base duas abordagens
principais: os nomes de família (sobrenomes) e os marcadores genéticos localizados em
diferentes cromossomas.
A avaliação da origem genética da população dos Açores foi realizada através da análise
de linhagens paternas (cromossoma Y) e marcadores Alu. O cromossoma Y apresenta
algumas vantagens que possibilitam traçar linhagens, nomeadamente não sofre
recombinação e é transmitido de pais para filhos. Contudo, quando um pai apenas tem
filhas essa linhagem pode-se perder. Assim, o estudo das origens de uma população
deve ser complementado com marcadores localizados nos cromossomas autossómicos,
por exemplo, os polimorfismos de inserção Alu. Estes polimorfismos possibilitam a
inferência directa do estado ancestral (ausência de inserção), e a sua aplicação aos
estudos da evolução populacional é vantajosa. Além disso, as inserções Alu representam
ambas as contribuições – paterna e materna –, uma vez que estão sujeitas a eventos de
recombinação e outras forças evolutivas. Os resultados das linhagens paternas na
população Açoriana revelaram nove haplogrupos (HG) diferentes, na sua maioria
frequentes na Europa. Assim, os dados apontam para uma grande contribuição de
indivíduos do continente português, bem como, embora em frequências mais baixas, de
indivíduos do Médio-Oriente (HG J*) e do norte de África (HG E*(xE3)). Igualmente,
os resultados baseados nos marcadores Alu indicam uma proximidade elevada entre
populações portuguesas, marroquinas e espanholas, nomeadamente, Catalãos e
Andaluzos. Esta proximidade reflecte-se na árvore filogenética, onde os Açores e
Portugal continental ramificam com Catalunha, Andaluzia, Marrocos e Argélia, bem
como corrobora com os resultados obtidos nas análises do cromossoma Y e dos
marcadores autossómicos.
18
Resumo
A determinação da diversidade genética com marcadores neutros permite conhecer se as
forças evolutivas, designadamente, a deriva genética e a selecção, imprimem a sua
influência na assinatura genética de uma população. Na presente tese, a diversidade da
população Açoriana foi calculada com base em diferentes marcadores, a saber:
sobrenomes, Short Tandem Repeats (STRs autossómicos, Y e X) e polimorfismos de
inserção Alu. Os valores médios de diversidade obtidos nos diferentes estudos mostram
que, no general, a população açoriana é muito diversa, apresentando valores mais
elevados do que os encontrados no continente português. O estudo de abundância dos
sobrenomes e de variabilidade dos microssatélites em cada ilha açoriana revelou que as
ilhas mais diversas são Terceira e São Miguel. Ambos os estudos apontam para que as
ilhas mais pequenas – Corvo, Graciosa e Santa Maria –, apresentem, como esperado,
valores mais baixos de variabilidade. A análise de parentesco entre ilhas foi avaliada
usando os sobrenomes e 15 STRs. Duas imagens diferentes emergem: os sobrenomes
mostram uma proximidade maior entre os grupos central e ocidental, e os STRs
posicionam o grupo central mais próximo do oriental. Esta dualidade pode ser explicada
pelo facto dos sobrenomes exibirem uma imagem mais recente, que considera as
características sócio-económicas das ilhas, enquanto os dados dos microssatélites
revelam a evolução baseada nas características do povoamento do arquipélago, onde se
evidenciam São Miguel e Terceira como agentes principais no povoamento das
restantes ilhas. Ambas as abordagens são complementares. Em termos de desequilíbrio
de ligação (LD), o grupo ocidental apresentou um valor de LD multialélico (D’) mais
elevado (0,328), no entanto, este valor indica a ausência de LD neste grupo de ilhas. Os
grupos central e oriental mostram valores semelhantes, ambos com ausência de LD. Em
suma, os Açores, bem como Portugal continental, evidenciam LD apenas para
distâncias físicas curtas. Estes dados sugerem que será necessário um número elevado
de marcadores para realizar estudos de mapeamento fino de genes de susceptibilidade
para doenças complexas. No entanto, outras características (por exemplo, o mesmo
ambiente e a possibilidade de construir grandes pedigrees através de registos civis e da
igreja) fazem desta população um recurso possível para futuros estudos genéticos.
O coeficiente de consanguinidade populacional tem um papel determinante na
identificação da subdivisão de populações humanas. As estimativas baseadas em STRs
e sobrenomes evidenciam valores diferentes. O coeficiente de consanguinidade
calculado a partir dos nomes de família para a ilha de São Miguel é cerca de sete vezes
19
Resumo
menor do que o obtido com base nos 21 STRs. Ambas as determinações têm
inconsistências e nenhum valor preciso é conseguido; no entanto, todas as análises
demonstram que a população açoriana é uma população aberta. De acordo com Wright
(1984), valores inferiores a 0.05, como os verificados nas populações de Portugal
continental e Açores, indicam pouca diferenciação genética. A presença de estrutura
genética numa população pode conduzir a dados falsos e, possivelmente, a erros de
interpretação. Assim, apesar de estarem dispersos por três grupos geográficos e
constituírem uma população admixed, os Açores não apresentam subdivisão genética, e
podem, portanto, ser considerados como um todo homogéneo, uma vez que as
diferenças genéticas entre ilhas não são estatisticamente significativas.
Os padrões de dispersão dos indivíduos têm impacto significativo na admixture e na
estrutura genética de uma população. As taxas de migração foram calculadas a partir de
sobrenomes e microssatélites. O valor de migração para a ilha do Corvo baseado em
STRs sugere que esta população está sedentária. Um valor controverso foi obtido a
partir dos sobrenomes, onde esta ilha apresenta o valor mais elevado de migração
indicando a saída de indivíduos desta para as outras ilhas. Ambos os estudos,
sobrenomes e STRs, evidenciam o movimento dos indivíduos para as ilhas maiores, a
saber, São Miguel e Terceira. Os resultados de dispersão espacial dos sobrenomes
revelam que o movimento dos indivíduos ocorre essencialmente entre ilhas mais
próximas (isolamento pela distância).
Em conclusão, os dados apresentados ao longo desta tese melhoram o conhecimento do
fundo genético da população açoriana: os açorianos são uma população aberta com
diversidade genética elevada, fluxo genético relativo e sem extenso desequilíbrio de
ligação. Além disso, os padrões da diversidade são uma consequência directa da história
do povoamento do arquipélago. Os resultados aqui explanados complementam o
passado, estabelecendo a ponte entre a genética e a história; melhoram o conhecimento
do presente; e contribuem para compreender o futuro, uma vez que o fundo genético,
bem como o ambiente, influenciam certamente o tipo e a distribuição das doenças na
população açoriana.
Palavras-chave: Fundo genético, diversidade genética, estrutura populacional,
desequilíbrio de ligação, Açores.
20
Summary
SUMMARY
The study of human genetic variation allows a better understanding of disease patterns
of a population, as well as, contributes to the comprehension and description of human
evolution. In the present thesis, we present a broader view of the genetic structure of the
Azorean population. The Azores is composed of nine volcanic islands unevenly
distributed by three geographic groups: Eastern, Central and Western. We address the
diversity and genetic background of this population considering surnames, SNPs, Alu
insertion polymorphisms and different STR markers, located in different chromosomes
(autosomal, Y and X).
The assessment of the genetic ancestry of the Azoreans, based on Alu insertion
polymorphisms and Y-chromosome lineages, shows that the main contributors were the
mainland Portuguese with an important participation of Middle eastern and north
African populations. Additionally, the results of migration using surnames and STRs
evidence relative gene flow among islanders. Considering molecular markers, the
Azoreans generally present a higher genetic diversity when compared to mainland
Portugal and other European populations. The surnames and molecular markers reveal
no genetic structure, although the Azores are dispersed through three geographical
groups and constitute an admixed population. In terms of linkage disequilibrium (LD),
which was estimated in the HLA, Xq13.3 and NRY regions, the archipelago, similarly
to mainland Portugal, shows LD only for short physical distances. All analyses suggest
that the Azoreans are an outbred population, where the identification of IBD regions
will require high density of genetic markers. Thus, the results demonstrate that both
surnames and molecular markers are complementary and aid in the genetic
characterization of a population.
In general, this thesis improved the knowledge of the genetic signature of Azoreans,
complement the past by connecting genetics and history and will contribute to predict
the future in terms of disease distribution in this population.
Keywords: Genetic signature, genetic diversity, population structure, linkage
disequilibrium, Azores Islands.
21

“Why not let people differ about their answers to the great mysteries of the Universe? Let each seek oneʹs own way to the
highest, to oneʹs own sense of supreme loyalty in life, oneʹs ideal of life. Let each philosophy, each world‐view bring forth its truth
and beauty to a larger perspective, that people may grow in vision, stature and dedication.”
Algernon Black
CHAPTER I
UNDERSTANDING HUMAN DIVERSITY: CONTRIBUTION OF
MOLECULAR AND NON-MOLECULAR MARKERS
22
CHAPTER I Understanding Human Diversity
I. Understanding human diversity: contribution of molecular and
non-molecular markers
In the animal kingdom, some species, such as, Asian lion, puma and cheetah, show very
little genetic diversity (Driscoll et al. 2002); however, most organisms, inc1uding
humans, have a considerable amount of genetic variation (Li and Sadler 1991). The
proportion of genetic diversity that exists between human populations is relatively low.
An early study, based on protein polymorphisms, estimated a 15% diversity between
groups (Lewontin 1972). More recently, autosomal variation studies have shown that
~83-88% is found within populations and ~9-13% between continental populations
(Jorde et al. 2000; Romualdi et al. 2002).
Around the world, genetic variation is geographically structured. Several scenarios for
this strucutre are possible; for example, there are species in which it is observed sharp
regional/ continental discontinuities, making variation different between groups, and
those who are geographically undifferentiated, where variation is due to differences
between individuals (Barbujani and Goldstein 2004).
An understanding of how genetic diversity is structured in the human species is not only
of anthropological and political importance, but also of medical relevance with
important implications for human evolution, forensics and distribution of genetic
diseases in populations (Cavalli-Sforza and Feldman 2003; The International HapMap
Consortium 2005; Tishkoff and Kidd 2004; Foster and Sharp 2004; Jorde et al. 2000).
For instance, if major differences in allele frequencies exist between populations,
individuals from different origins may often be expected to respond differently to
medical treatments (Wilson et al. 2001).
Studies of genetic diversity from restricted geographical areas, where large numbers of
individuals are sampled and a reasonable geographic coverage of the variation is
achieved, generally reveal spatial gradients of allele frequencies (Barbujani et al. 1995;
Rosser et al. 2000; Karafet et al. 2001) that are only occasionally disrupted by local
discontinuities corresponding to linguistic or geographical barriers (Barbujani and Sokal
1990). This suggests that isolation by distance (i.e. decreasing gene flow with increasing
geographical distances) may be the most appropriate description of human genetic
23
CHAPTER I Understanding Human Diversity
diversity (Cavalli-Sforza et al. 1994). In contrast, worldwide studies of human diversity
based on “populations” generally find that individuals cluster discretely depending on
their continents of origin (Cavalli-Sforza et al. 1988; Bamshad et al. 2003; Rosenber et
al. 2002; Lao et al. 2006), and this is sometimes taken to mean that human genetic
diversity is structured according to etnia (Risch et al. 2002; Burchard et al. 2003). The
discrepancy in results between regional and global surveys of human genetic diversity
could suggest that gradients in allele frequencies are restricted to smaller geographic
regions, whereas the continents are distinguished by discontinuities in genetic diversity.
Alternatively, the discrepancies may result from differences in study design as
suggested, for example, by Kittles and Weiss (2003). Serre and Paabo (2004)
demonstrated that when individuals are sampled homogeneously from around the globe,
the pattern seen is one of gradients of allele frequencies that extend over the entire
world, rather than discrete clusters. Therefore, there is no reason to assume that major
genetic discontinuities exist between different continents or “races”1.
To understand the population genetic structure it is necessary the description of the
differences in polymorphism content and diversity patterns between different groups,
subpopulations or metapopulations. The most obvious way to attain this characterization
is through the study of molecular markers. However, approaches using cultural,
demographic and socioeconomic information may also play an important role in the
understanding of diversity, inbreeding and migration.
I.1. What can we learn from surnames
Cultural traits are transmitted from ancestors to their descendants, in a process
analogous to inheritance, and are subject to changes, similar to mutations, by interaction
between individuals, such as, teaching and imitation. In fact, they enhance the
relationships within human groups, defining social entities comparable to certain
biological species and populations (Manrubia and Zanette 2002).
Surnames are cultural traits (Cavalli-Sforza and Feldman 1981) whose transmission
bears strong similarity with that of some biological features. In systems where surname
1 This is a strong support against those who still believe in the existence of “races” or even “superior races”.
However, to group humans according to their common features, the most accepted term is etnia or ancestry.
24
CHAPTER I Understanding Human Diversity
attribution is through the paternal line, surnames simulate neutral alleles of a gene
transmitted by the Y-chromosome. Thus, the expectations of the neutral theory of
evolution, which is entirely described by random genetic drift, mutation, selection and
migration, are satisfied (Zei et al. 1983). This property of surnames, together with their
availability in large numbers, from present, as well as, from historical populations,
makes them useful for the study of population structure (Pettener et al. 1998).
In recent decades, surnames have been used as genetic markers to estimate inbreeding
changes in a population (Crow and Mange 1965; Pinto Cisternas et al. 1985; Gueresi et
al. 2001; Boattini et al. 2006; Colantonio et al. 2006), to measure the degree of
population subdivision (Lasker and Kaplan 1985; Madrigal et al. 2001; Colantonio et
al. 2002; Esparza et al. 2006), and to analyze changes in genetic relationships between
populations (Lasker 1977; Weiss 1980; Chen and Cavalli-Sforza 1983; Relethford
1988; Pettener et al. 1998; Calderon et al. 2006).
Surnames began to be used for studying the genetic structure of populations after Crow
and Mange (1965) published an article on the measurement of inbreeding from
frequency of isonymous marriages. Twelve years later, Lasker (1977) described a
method for estimating the genetic relationship between populations through isonymy
(Ri). This method has been widely used (Lasker and Mascie-Taylor 1983;
Pinto-Cisternas et al. 1990; Rodríguez-Larralde 1993) and new aspects of population
genetics were approached (Rodriguez-Larralde et al. 2000). Others, for example, Chen
and Cavalli-Sforza 1983; Relethford 1988; Morton and Yasuda 1980 and Zei et al.
1983, have studied similarities between populations adapting Malécot's genetic kinship
between populations to surnames (Malécot 1950). Furthermore, Pinto-Cisternas et al.
(1990) and Barrai et al. (1990) have derived variances for parameters estimated from
surnames (Rodriguez-Larralde 1993).
The use of surnames models, similarly to other genetic models, is dependent of some
assumptions. The method of Crow and Mange (1965) assumes, among other things, that
surnames are monophyletic, that non-random mating is symmetrical with respect to sex,
and that changes of spelling, illegitimacy, or adoption do not occur. However, in large
heterogeneous societies these assumptions do not hold, therefore, “... less confidence
can be placed in precise estimates of kinship…” Relethford (1988). Nevertheless, the
relative value of these estimates is still informative, especially when large sample sizes
25
CHAPTER I Understanding Human Diversity
and the same source of information and methodology are used in an entire country. In
reality, isolation by distance has been determined with the use of surnames as well as
the existence of population clusters within countries, where surname distribution and,
presumably, genetic composition are more homogeneous (Barrai et al. 1997;
Rodriguez-Larralde et al. 2000).
Nowadays, in many countries, millions of surnames of telephone users, often available
on CD-Roms or online, can be efficiently analyzed in a short time. As examples, the
surname structure of Switzerland (Barrai et al. 1996), Germany (Barrai et al. 1997),
Italy (Barrai et al. 1999), Austria (Barrai et al. 2000), France (Mourrieras et al. 1995),
and the Netherlands (Barrai et al. 2002) were studied, taking into account, in total, more
than 20 million surnames. Investigated at different geographic scales, surname-inferred
genetic structures were sometimes regarded with a certain suspicion because they are
simulated markers for a single locus. A good example of the doubts about surname
studies was expressed by Rogers (1991) “The method ... requires an assumption that
has not been appreciated: it is necessary to assume that all males in some ancestral
generation, the founding stock, had unique surnames. Because this assumption is
seldom justified in real populations, the applicability of the isonymy method is
extremely limited. Even worse, the estimates it provides refer to an unspecified founding
stock, and this implies that these estimates are devoid of information”. Nonetheless, the
isonymy method was applied to genealogical databases (Gagnon and Heyer 2001;
Gagnon and Toupance 2002), and consanguinity was estimated both from surnames and
genealogies. Results indicate that random isonymy, estimated from family names, is not
devoid of information; on the contrary, it fits well with consanguinity estimates
obtained from the genealogical records (Manni et al. 2005).
Manrubia and Zanette (2002) have shown that results for the stationary distribution of
surnames frequency are in good agreement with field data for modern human
populations in different countries. Through an analysis of the transient time required for
this distribution to reach its asymptotic shape, they demonstrated that some deviations
observed in real data might actually reflect the composition of the founder population.
This result has implications in the study of polyphyletism. Indeed, if the same surname
can have multiple origins and, consequently, the individuals carrying it are not always
phylogenetically related, the shape of the surname distribution will be affected. The
26
CHAPTER I Understanding Human Diversity
strong resemblance between the cultural inheritance of the surname and the biological
process in which nonrecombining neutral alleles are passed to offspring has justified
applying results from field data (Barrai et al. 1996). In the few cases, where data on
genetic diversity was available, it was possible to retrieve information on past
populations by comparing both sets of data (Sykes and Irven 2000). A specific example
comes from the small island of Tristan da Cunha, where 300 inhabitants represent only
seven surnames and five mitochondrial lineages reflects without doubt the small size of
the founder population (Soodyall et al. 1997; Manrubia and Zanette 2002).
I.1.1. Isonymy, inbreeding and relationship coefficients
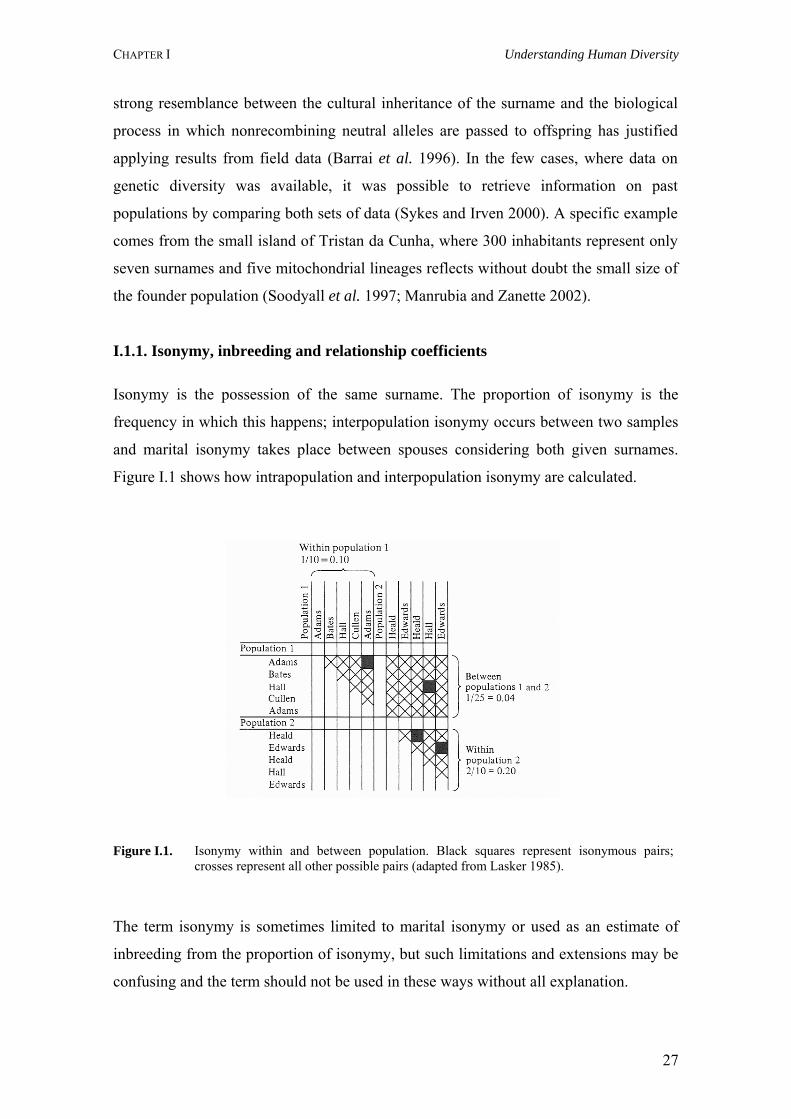
Isonymy is the possession of the same surname. The proportion of isonymy is the
frequency in which this happens; interpopulation isonymy occurs between two samples
and marital isonymy takes place between spouses considering both given surnames.
Figure I.1 shows how intrapopulation and interpopulation isonymy are calculated.
Figure I.1. Isonymy within and between population. Black squares represent isonymous pairs; crosses represent all other possible pairs (adapted from Lasker 1985).
The term isonymy is sometimes limited to marital isonymy or used as an estimate of
inbreeding from the proportion of isonymy, but such limitations and extensions may be
confusing and the term should not be used in these ways without all explanation.
27
CHAPTER I Understanding Human Diversity
There are several methods to calculate isonymy. According to Relethford (1988), the
random isonymy between populations i and j is
Iij=Σpkipkj
where pki and pkj are the relative frequencies of surname k in the populations i and j,
respectively. On the other hand, according to Rodriguez-Larralde et al. (1993) unbiased
random isonymy within the population is calculated by the formula:
Iii=Σk(pik)2–1/Ni
where pik is the relative frequency of surname k in the ith population, and Ni is the
sample size of the same population.
Population structure constitutes deviations from panmixia, such as, those due to limited
number of ancestors, to gender, to preference of certain types of consanguineous
marriage, and to limited migration in social or geographic space (Rodriguez-Larralde et
al. 2003). Several studies have shown that cultural, demographic and socioeconomic
factors (religious beliefs, pattern of between-generation transfer of familial property,
and increased number of relatives following a demographic expansion) influence the
consanguinity level of populations (Manni et al. 2005; Rodriguez-Larralde et al. 2003).
Inbreeding has been extensively analyzed by the use of surnames in populations with
different degrees of isolation in Europe, Asia and north America (Colantonio et al.
2003 and references therein). In 1965, Crow and Mange used the marital isonymy to
estimate the frequency of consanguineous marriages as a measure of inbreeding. Based
on Wright’s hierarchical model, they defined the total inbreeding by isonymy and its
random and non-random components, in order to describe the effects of subdivision of
a population in causing deviations from random mating. Currently, it is widely
accepted that the calculation of the random component of inbreeding (FST) within the
subpopulation is obtained from the formula, where I is the isonymy within
subpopulation i:
FST=Iii/4
The calculation of FST for the whole population is based on the formula suggested by
Relethford (1988):
FST=Σwiϕii
where ϕii is the random component of inbreeding (Iii/4) of the ith subpopulation, and wi
is the weight due to sample size, Ni/Nt, being Nt the sample size of the whole
28
CHAPTER I Understanding Human Diversity
population.
The random component of the inbreeding coefficient when calculated from surnames is
merely a statement concerning the average commonality of surnames between males
and females in the population multiplied by a constant. The constant used is one-
quarter, because this is the likelihood of a gene being shared by the homologous
autosomal chromosomes of an offspring of first-degree relatives. The same fraction
applies to other degrees of relationship following the logic adopted by Crow and
Mange (1965). The likelihood of a gene being shared by first-degree relatives
themselves is one in two. Therefore, their coefficient of relationship by isonymy, Ri, is
the proportion of isonymy multiplied by one half. As applied to the males and females
of a population this is,
Ri=Σpiqi/2
if one extends the logic and the assumption of the monophyly of surnames to two
populations this can be expressed as
Ri=Σ(Si1Si2)/2piqi/2ΣSi1 ΣSi2
in which Si1 is the number of occurrences of the ith surname in a sample from
population 1 and Si2 is the number of occurrences of the same surname in a sample
from population 2. Unlike the inbreeding coefficient by isonymy, the coefficient of
relationship by isonymy is not divided into random and non-random components, it is a
measure of the random component.
I.1.2. Surname diversity and migration
Human migration has been studied from many points of view. When using a surname
model to study its effects, it is only considered as the mechanism that redistributes
genes geographically. Human migration draws pedigree lines on maps. The pattern of
those lines depicts an aspect of human population structure with significance to
population genetics – inbreeding. Moreover, such mapping of pedigree lines can be
used to explain distributions of human genetic polymorphisms. Human genes cannot
move except by the movements of people who carry them (at least before artificial
insemination). Therefore, historically, human migration accounted for all the movement
of genes (Lasker 1985).
29
CHAPTER I Understanding Human Diversity
Gene movement may be seen in the distances from birthplaces of parents to the
birthplaces of their children. Tracing individual pedigrees has been done by geneticists
and others, but such studies inevitably have a geographic aspect. Pedigrees, however,
are not representative of the population as a whole. Male ancestors are usually easier to
identify and trace than female, so the male line is usually more complete than female
and mixed lines. As consequence the picture based on a collection of pedigrees is likely
to be biased or to cover only the very few recent generations that can be completely
ascertained (Lasker 1985).
The identification of the various evolution agents of the genetic structure of human
populations and the assessment of their relative weight are one of the main aims of
population genetics. The high level of genetic polymorphism observed in human
populations has led to a search for adaptative explanations of genetic variation.
However, microevolutionary events often seem better explained by migration effects,
particularly immigration. Immigration implies addition of genes, which may profoundly
affect gene frequencies of the receiving population, thus, becoming a driving
evolutionary force. The amount of immigration has relatively little significance
compared to the structure of the phenomenon, since, for instance, genetic difference
between immigrants and receiving populations is believed to increase with geographical
distance. One of the immigration determining elements is the choice of mates. In order
to predict the nature of genetic changes, selective mating can be studied by analysing
the shape and the central tendency of the distribution of distances between the places of
birth of spouses (Biondi et al. 1993).
In 1983, Zei and collaborators proposed a method to estimate migration based on the
observation that surnames generate, at equilibrium, a distribution that fits the model
introduced by Karlin and McGregor (1967). This model presents the distribution of
alleles expected according to the neutral theory of evolution. In a population of constant
finite size, the equilibrium is reached when the number of surnames entering the
population by mutation and migration equals that lost by drift. Surname mutation is
relatively rare, so it can be assumed that new surnames enter into a population mainly
by immigration. Moreover, in a very large population, the statistical properties of the
surname distribution can be strongly correlated with genetic diversity (Barrai et al.
1996; Manrubia and Zanette 2002). Zei et al. (1983) observed that Fisher’s logarithmic
30
CHAPTER I Understanding Human Diversity
distribution (Fisher 1943) derived to represent the variation in the abundance of
surnames, that is, diversity. The use of that distribution to predict the number of
surnames in a sample represents an excellent approximation of the Karlin-McGregor
distribution. Fisher's distribution is theoretically more satisfactory for surnames than
Pareto's, since it is easier to fit. Finally, Zei et al. (1983) were able to integrate the
parameters introduced by Fisher (α) with the parameters of the Karlin-McGregor
distribution (ν) combining ease of computation with meaningful theoretical
interpretation through the following formulas:
Fisher’s α and
α=1/Iii
Karlin-McGregor’s ν
ν=α/(Ni+α)
establishing the relationship between Fisher’s α, Karlin-McGregor’s ν and population
size.
Additionally, the study of the spatial distribution of genetic variation has been
considered important in population studies (Rosenberg et al. 1999; Lefevre-Witier
2006). Spatial autocorrelation (SA) is the dependence of the values of a variable at
specified geographic locations on the values of the same variable at neighbouring
locations. Spatially autocorrelated data violate the assumption of independence required
for most standard statistical tests, calling for special tests designed to remove the
dependence of the variable on geography. Although the analysis of SA is often
associated with removing the internal dependence of variables on the underlying spatial
structure during hypothesis testing, the SA analysis can lead to important discoveries
about the scale where spatial patterns occur, which in turn may suggest underlying
factors with similar patterns. Spatial autocorrelation analysis has been used to study a
variety of phenomena, such as, the genetic structure of plant, animal and human
populations (Sokal et al. 1986; Epperson 1992; Barbujani and Sokal 1991), mortality
(Setzer 1985) and their morphological patterns (Epperson and Clegg 1986; Sokal and
Uyherschaut 1987).
Spatial autocorrelation summarizes the genetic similarity between populations in
relation to their geographical proximity. In particular, spatial autocorrelation helps to
focus on the similarity of values of a variable, i.e. the frequency of a surname, between
31
CHAPTER I Understanding Human Diversity
pairs of populations within arbitrary classes of distance (Caravello and Tasso 1999).
This method allows estimation of the spatial distribution of surnames in the considered
territory, in order to emphasize the specific processes of diffusion of individuals. It was
developed by Moran (1950), perfected by Ripley (1981), as well as by Cliff and Ord
(1973), whereas Sokal and Oden (1978a,b) were the first to apply it to biological
problems. The following formula allows an estimate of this autocorrelation coefficient:
n n n I=nΣΣwij(pi–p)(pj–p)/WΣ(pi–p)2
i=1j=1 i=1
where pi and pj are the relative frequency of surnames at the ith and jth localities, p is
the mean across the n municipalities, wij is equal to 1 for all the pairs of municipalities
falling in the studied distance class and equal to 0 for all the other pairs, and W is the
sum of all wij values in that distance class. In large samples Moran’s I coefficient varies
between -1 to +1, where positive significant values (I>0) indicate similar frequencies
and negative significant values (I<0) indicate dissimilarity (Barbujani et al. 1992).
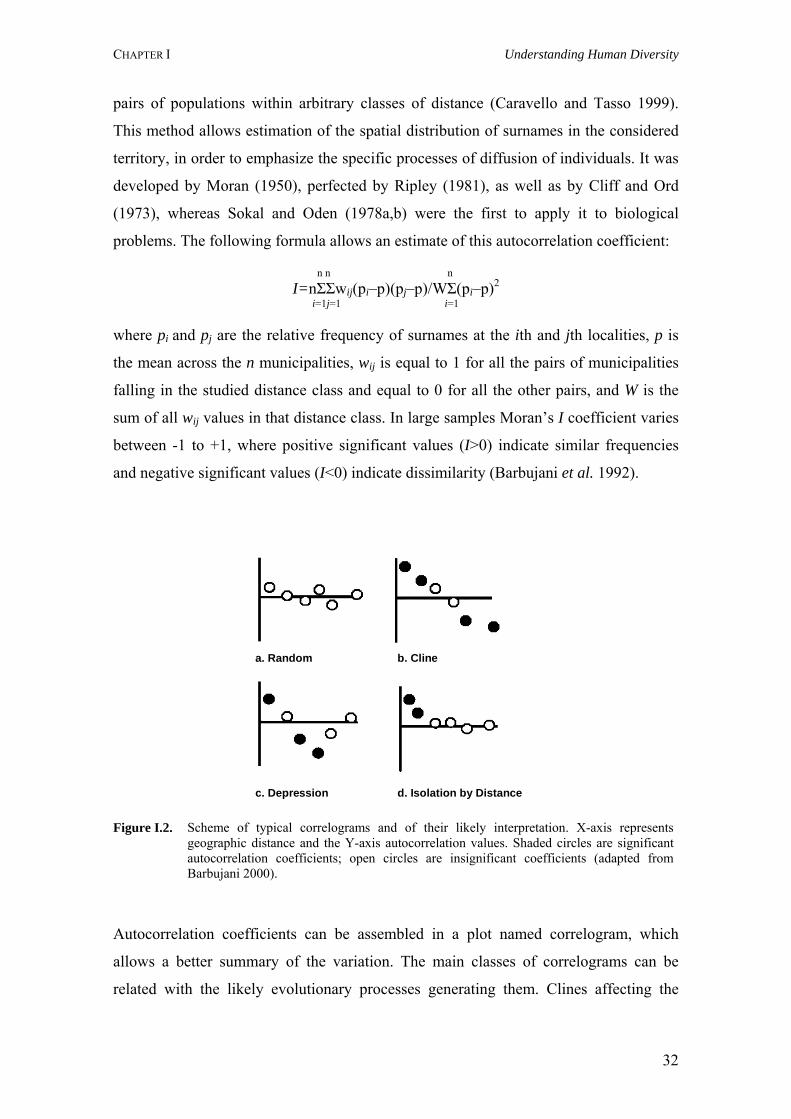
Figure I.2. Scheme of typical correlograms and of their likely interpretation. X-axis represents geographic distance and the Y-axis autocorrelation values. Shaded circles are significant autocorrelation coefficients; open circles are insignificant coefficients (adapted from Barbujani 2000).
a. Random
c. Depression
b. Cline
d. Isolation by Distance
a. Random
c. Depression
b. Cline
d. Isolation by Distance
Autocorrelation coefficients can be assembled in a plot named correlogram, which
allows a better summary of the variation. The main classes of correlograms can be
related with the likely evolutionary processes generating them. Clines affecting the
32
CHAPTER I Understanding Human Diversity
entire study area (Figure I.2b) or only a part of it (Figure I.2c) can be discriminated
from the patterns expected under random genetic variation (Figure I.2a). In statistical
terms, the null hypothesis is clearly random distribution of allele frequencies in space.
In population genetics terms, however, geographic randomness would be surprising. As
a rule, geographically close populations exchange more migrants than distant
populations and the degree of relative isolation between localities is roughly
proportional to their geographic distance (Barbujani and Sokal 1991; Barbujani 2000).
I.2. The human genome polymorphisms
The success of the Human Genome Project2 has given us an exceptional understanding
of the structure and organization of our genome (Figure I.3). Variability is observed in
the human genome through single nucleotide polymorphisms (SNPs), variable number
of tandem repeats (VNTRs; e.g. mini and microsatellites), presence/ absence of
transposable elements (e.g. Alu elements) and structural alterations (e.g. deletions,
duplications and inversions; Freeman et al. 2006).
I.2.1. Single nucleotide polymorphisms
Variations in DNA (deoxyribonucleic acid) sequence can have a major impact on how
humans respond to disease, to environment and to drugs or other therapies. This makes
single nucleotide polymorphisms of great value for biomedical research, for medical
diagnostics and for developing pharmaceutical products (Jobling et al. 2004).
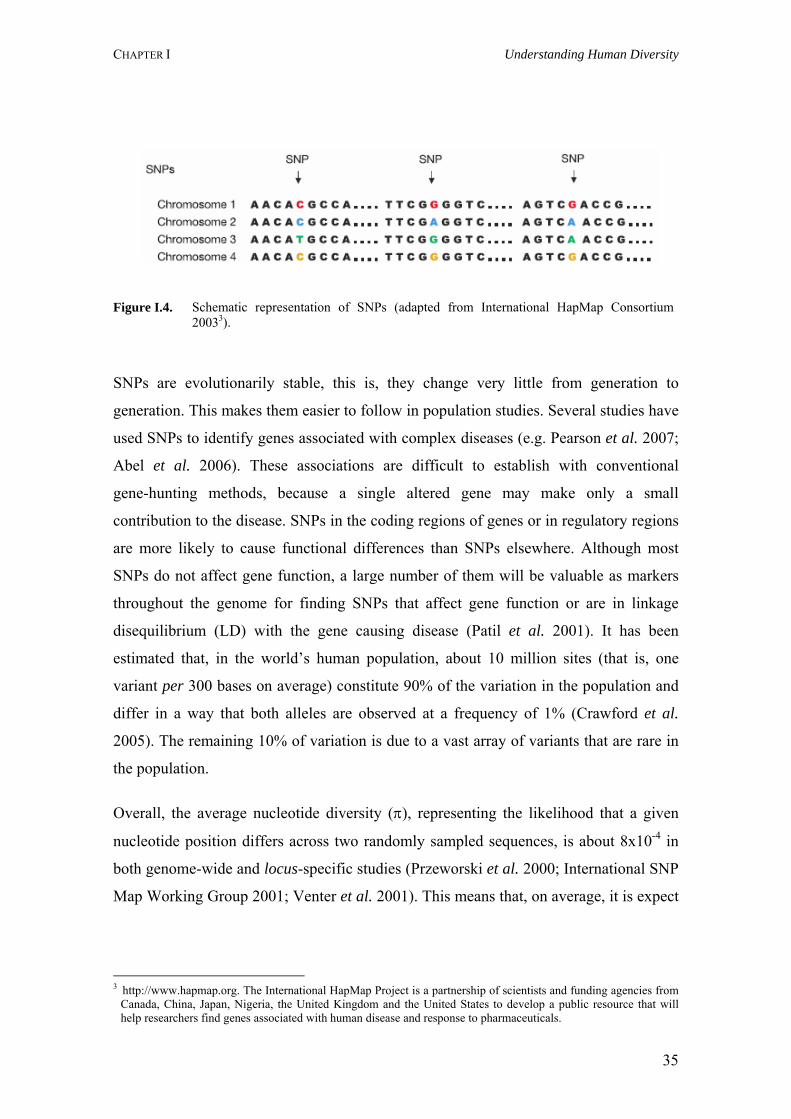
A SNP is a DNA sequence variation occurring when a single nucleotide – A, T, C or
G – in the genome, or other shared sequence, differs between members of a species or
between paired chromosomes in an individual (Figure I.4).
2 http://www.ornl.gov/sci/techresources/Human_Genome/home.shtml. Begun formally in 1990, the Human Genome
Project was a 13-year effort coordinated by the U.S. Department of Energy and the National Institutes of Health. The project originally was planned to last 15 years, but rapid technological advances accelerated the completion date to 2003. During the early years of the project, the Wellcome Trust (United Kingdom) became a major partner, but additional contributions came from Japan, France, Germany, China, and others.
33
CHAPTER I Understanding Human Diversity
A.
B.
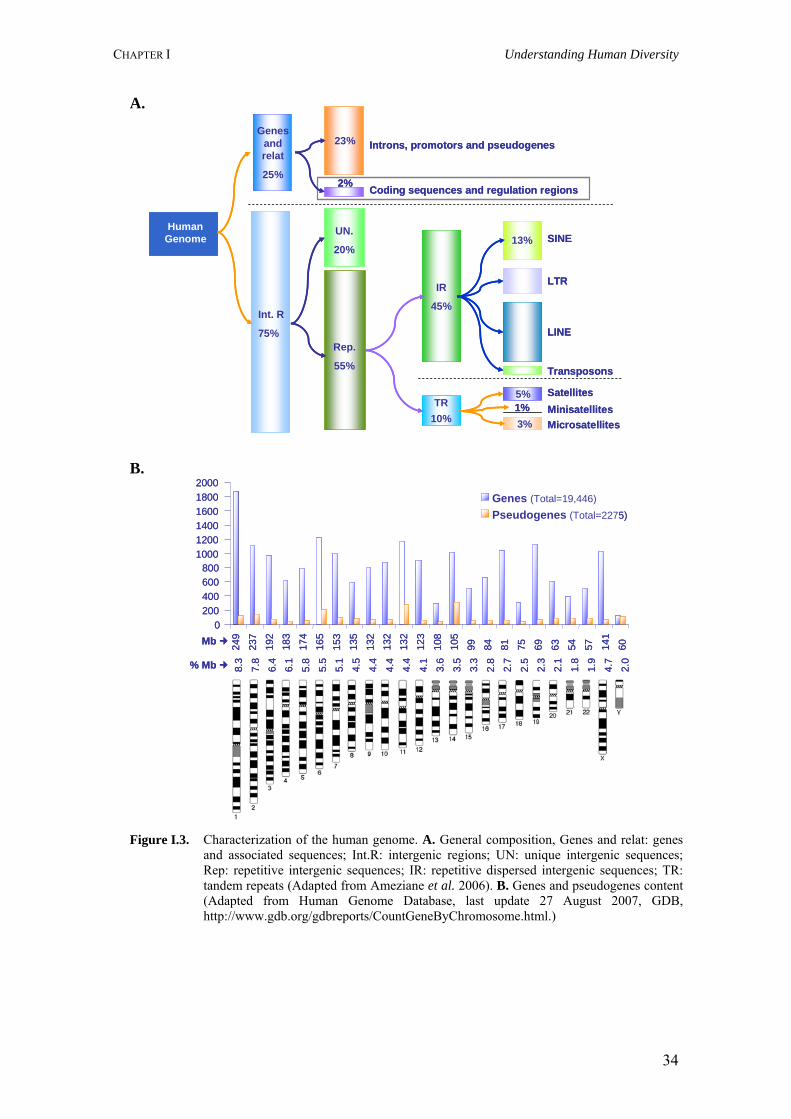
Figure I.3. Characterization of the human genome. A. General composition, Genes and relat: genes and associated sequences; Int.R: intergenic regions; UN: unique intergenic sequences; Rep: repetitive intergenic sequences; IR: repetitive dispersed intergenic sequences; TR: tandem repeats (Adapted from Ameziane et al. 2006). B. Genes and pseudogenes content (Adapted from Human Genome Database, last update 27 August 2007, GDB, http://www.gdb.org/gdbreports/CountGeneByChromosome.html.)
HumanGenome
Int. R
75%
Genes and relat
25%2%
UN.
20%
Rep.
55%
23%
TR10%
13%
IR
45%
5%
3%1%
Introns, promotors and pseudogenes
Coding sequences and regulation regions
SINE
LTR
LINE
Transposons
SatellitesMinisatellitesMicrosatellites
HumanGenomeHuman
Genome
Int. R
75%
Int. R
75%
Genes and relat
25%2%
UN.
20%
Rep.
55%
23%
TR10%
13%
IR
45%
5%
3%1%
Introns, promotors and pseudogenes
Coding sequences and regulation regions
SINE
LTR
LINE
Transposons
SatellitesMinisatellitesMicrosatellites
0200400600800
100012001400160018002000
Genes (Total=19,446)Pseudogenes (Total=2275)
249
237
192
183
174
165
153
135
132
132
132
123
108
105
99 84 81 75 69 63 54 57 141
60Mb
8.3
7.8
6.4
6.1
5.8
5.5
5.1
4.5
4.4
4.4
4.4
4.1
3.6
3.5
3.3
2.8
2.7
2.5
2.3
2.1
1.8
1.9
4.7
2.0% Mb
0200400600800
100012001400160018002000
Genes (Total=19,446)Pseudogenes (Total=2275)
249
237
192
183
174
165
153
135
132
132
132
123
108
105
99 84 81 75 69 63 54 57 141
60Mb
8.3
7.8
6.4
6.1
5.8
5.5
5.1
4.5
4.4
4.4
4.4
4.1
3.6
3.5
3.3
2.8
2.7
2.5
2.3
2.1
1.8
1.9
4.7
2.0% Mb
34
CHAPTER I Understanding Human Diversity
Figure I.4. Schematic representation of SNPs (adapted from International HapMap Consortium 20033).
SNPs are evolutionarily stable, this is, they change very little from generation to
generation. This makes them easier to follow in population studies. Several studies have
used SNPs to identify genes associated with complex diseases (e.g. Pearson et al. 2007;
Abel et al. 2006). These associations are difficult to establish with conventional
gene-hunting methods, because a single altered gene may make only a small
contribution to the disease. SNPs in the coding regions of genes or in regulatory regions
are more likely to cause functional differences than SNPs elsewhere. Although most
SNPs do not affect gene function, a large number of them will be valuable as markers
throughout the genome for finding SNPs that affect gene function or are in linkage
disequilibrium (LD) with the gene causing disease (Patil et al. 2001). It has been
estimated that, in the world’s human population, about 10 million sites (that is, one
variant per 300 bases on average) constitute 90% of the variation in the population and
differ in a way that both alleles are observed at a frequency of 1% (Crawford et al.
2005). The remaining 10% of variation is due to a vast array of variants that are rare in
the population.
Overall, the average nucleotide diversity (π), representing the likelihood that a given
nucleotide position differs across two randomly sampled sequences, is about 8x10⁻⁴ in
both genome-wide and locus-specific studies (Przeworski et al. 2000; International SNP
Map Working Group 2001; Venter et al. 2001). This means that, on average, it is expect
3 http://www.hapmap.org. The International HapMap Project is a partnership of scientists and funding agencies from
Canada, China, Japan, Nigeria, the United Kingdom and the United States to develop a public resource that will help researchers find genes associated with human disease and response to pharmaceuticals.
35
CHAPTER I Understanding Human Diversity
to find one SNP about every 1250 bp. The value of π varies significantly between
chromosomes, from 5.19x10⁻⁴ for chromosome 22 to 8.79x10⁻¹ for chromosome 15.
Additionally, there is some suggestion that SNP density varies along chromosomes
(Venter et al. 2001), and explanations have been put forward based on variation in
GC-content or in the efficiency of DNA mismatch repair.
It has been estimated that >5 million common SNPs, each with a frequency varying
from 10% to 50%, account for the bulk of human DNA sequence difference. Alleles
making up blocks of such SNPs in close physical proximity are often correlated and
define a limited number of SNP haplotypes, each of which reflect descendence from a
single, ancient ancestral chromosome. New haplotypes are formed by additional
mutations, or by recombination when the maternal and paternal chromosomes exchange
corresponding segments of DNA, resulting in a chromosome that is a mosaic of the two
parental haplotypes. The coinheritance of SNP alleles on these haplotypes leads to
associations between these alleles in the population, known as linkage disequilibrium,
LD (Patil et al. 2001).
The strong associations between SNPs in a region have a practical value, this is,
genotyping only few, carefully chosen in the region, will provide enough information to
understand the remainder of the common SNPs in that region. As a result, only a few of
these ‘tag’ SNPs are required to identify each of the common haplotypes in a region
(International HapMap Consortium 2003, 2005). On the basis of empirical studies, it
has been estimated that most of the information about genetic variation represented by
the 10 million common SNPs in the population could be provided by genotyping
200,000 to 1,000,000 tag SNPs across the genome (International HapMap Consortium
2003, 2005). For common SNPs, which tend to be older than rare SNPs, the patterns of
LD largely reflect historical recombination and demographic events. Some
recombination events occur repeatedly at “hotspots”. The result of these processes is
that current chromosomes are mosaics of ancestral chromosome regions. This explains
the observations that haplotypes and patterns of LD are shared by apparently unrelated
chromosomes within a population and generally among populations (International
HapMap Consortium 2003, 2005; Gray et al. 2000).
36
CHAPTER I Understanding Human Diversity
I.2.2. Variable Number of Tandem Repeats
Variable Number of Tandem Repeats (VNTRs) constitute a class highly heterogeneous
of genetic markers, more dynamic and common in eukaryotic genomes. The variation of
these markers involves changes in the numbers of repeated DNA sequences arranged in
tandem arrays. While the high variability of these multiallelic markers is a useful
property in many aspects, the underlying high mutation rates mean that, in contrast to
SNPs, alleles with the same size and sequence may not reflect identity by descent, but
identity by state, and, therefore, the ancestral state cannot be determined (Naslund et al.
2005).
VNTRs are classified according to the size of their repeat units, the typical number of
units in arrays, and sometimes their level of variability. Because their nomenclature is
not systematic, three major divisions emerge: (i) satellite, where a single repeat
sequence family can constitute several percent of the total genome, and can occur in
individual repeat arrays as large as 5 Mb (megabases); (ii) minisatellites, which may be
present at hundreds to thousands of different loci per genome; and (iii) microsatellites,
that are extremely abundant in short repeat sequences (Armour et al. 1999). Many
VNTRs are considered as neutral markers. However, there are well known examples in
every class of VNTRs that play functional roles, and in which variation in repeat copy
number can have phenotypic effects. Various mini and microsatellites that lie within the
coding regions of genes, or in regulatory regions, affect gene expression or the function
of gene products. Some satellites located in centromeres and telomere repeat arrays are
important functional components of chromosomes (Naslund et al. 2005).
I.2.2.1. Satellites
Satellites, sometimes named macrosatellites, are large tandem arrays spanning hundreds
of kilobases to megabases, and composed of repeat units of a wide range of sizes that
can display a higher-order structure. A good example is alpha satellite with a repeat
monomer of 171 bp, which forms a component of centromeres. This higher-order
structure can be repeated hundreds or thousands of times to form an array several Mb in
size. Innitially, satellites were used to genotype individuals but, because of their large
size and repetitive nature, its use declined (Jobling et al. 2004; Warburton et al. 1993).
37
CHAPTER I Understanding Human Diversity
The mutation processes at these loci cannot be studied directly, probably it involves
unequal crossing over between homologous chromosomes misaligned. Historically,
some satellite polymorphisms have been used in human evolutionary studies (e.g.
Oakey and Tyler-Smith 1990), but nowadays they have been superseded by loci which
are easier to type, analyze and understand.
I.2.2.2. Minisatellites
Minisatellites consist of repeat units from about 8 to 100 bp in length, with copy
numbers from as low as 5 to well over 1000. Minisatellites are qualitatively different in
their variability, mutation rates, mutation processes and chromosomal locations. They
are among the most dynamic loci in the genome, some displaying hypervariability, with
very large numbers of alleles of different lengths and structures, mutation rates as high
as 14% per generation, and complex mutation processes involving both inter- and
intra-allelic events (Denoeud et al. 2003). They provided the first highly polymorphic,
multiallelic markers for linkage studies (Bell et al. 1982; Nakamura et al. 1987) and
were used in the early stages of human genome mapping (NIH/ CEPH Collaborative
Mapping Group 1992). Although the abundance of polymorphic minisatellites suggests
that they are fast-evolving sequences, most of them are, in fact, quite stable.
Chromosomal distribution of minisatellites in the human genome is highly skewed
toward telomeres and ancestrally telomeric regions (Amarger et al. 1998). When allele
length variation is considered, minisatellites show high levels of diversity, with typical
heterozygosity values of well over 90%. Sequence analysis reveals an additional level
of diversity – all minisatellites examined contain not homogeneous repeat units, but
variant repeats differing by base substitutions and small indels (Denoeud et al. 2003).
GC-rich minisatellites tend to be clustered towards the ends of chromosomes (Royle et
al. 1988), suggesting that they might be associated with recombination hotspots either
as cause or consequence (Jarman and Wells 1989).
38
CHAPTER I Understanding Human Diversity
I.2.2.3. Microsatellite or short tandem repeats
Microsatellites are sequences of a single motif (1-6 bp) which is repeated many times in
tandem. They are also called simple sequences and short tandem repeats (STRs;
Edwards et al. 1991). Historically, the term microsatellite has been used to describe
only repeats of the dinucleotide motif CA/GT (Litt and Luty 1989). If these repeats are
long enough and uninterrupted, STRs are excellent genetic markers due to their high
level of polymorphism. Microsatellites are generally assumed to be evenly distributed
over genomes but rare within coding regions. There are, however, some human diseases
caused by expansions of polymorphic trinucleotide repeats in genes, such as, fragile X4
and myotonic dystrophy5 (e.g. Fu et al. 1991, Aslanidis et al. 1992, Rubinsztein 1999).
STR markers were first used for genetic mapping (e.g. Weissenbach et al. 1992) and as
diagnostic tools to detect human diseases (e.g. Mills et al. 1992). Nowadays,
microsatellites are regularly used in population and ecological studies. Additionally,
microsatellites are excellent markers for studying gene flow, effective population size
(Ne), paternity and relatedness. They can also be used to study the level and effects of
inbreeding. However, there are also some drawbacks. The reduction or complete loss of
amplification of some alleles, due to base substitutions or indels within the priming site,
constitutes a main problem. These so called missing alleles will not necessarily be
recognized when there is a product from the other homologue allele. This can lead to an
underestimation of heterozygosity, compared with that expected on the basis of
Hardy-Weinberg equilibrium (HWE).
Studies of evolutionary processes of microsatellites have shown that (i) the mutation of
repeat units depends on the allele size and purity; (ii) the mutation process is upwardly
biased; and (iii) there are some constraints on allele length (Ellegren 2000). To estimate
population differentiation measures and genetic distances using STRs, theoretical
4 The fragile X syndrome is a dominant genetic disorder with reduced penetrance caused by mutation of the FMR1
gene (Xq27.3). Mutation at that site is found in 1 in about 2000 males and 1 in about 259 females (for revision, please, see Abbeduto et al. 2007).
5 Myotonic dystrophy (DM) is a autosomal dominant, chronic, slowly progressing, highly variable inherited multisystemic disease that can manifest at any age from birth to old age. There are currently two known types of adult onset DM: Myotonic dystrophy type 1 (DM1, 19q13-2), also known as Steinert's disease, and Myotonic dystrophy type 2 (DM2, 3q13.3-q24), commonly referred to as PROMM or proximal myotonic myopathy (for revision, please, see Heatwole and Moxley 2007).
39
CHAPTER I Understanding Human Diversity
mutation models for the evolutionary processes of microsatellites are needed. Two
theoretical models have been considered (Deka et al. 1991): the infinite allele model
(IAM, Kimura and Crow 1964) and the stepwise mutation model (SMM, Kimura and
Ohta 1978). Both models will be described in section II.1.2.3. (Mutation and
Recombination) of the present thesis.
I.2.3. Transposable elements
While it is widely recognized that the majority of the human genome is not directly
involved in the production of proteins, our understanding of the noncoding regions
spanning between genes remains far from complete. The role of mobile elements in the
shaping of eukaryotic genomes is becoming more and more recognized. Mobile
elements make up over 45% of the human genome. These elements continue to amplify
and, as a result of negative effects of their transposition, they contribute to some human
diseases, for example, neurofibromatosis6 (Wallace et al. 1991), haemophilia7 (Ganguly
et al. 2003) and breast cancer8 (Teugels et al. 2005). All eukaryotic genomes contain
mobile elements, although the proportion and activity of the classes of elements varies
widely between genomes. Mobile elements are important in insertional mutagenesis and
unequal homologous recombination events. They use extensive cellular resources in
their replication, expression and amplification. There is considerable debate as to
whether they are primarily an intracellular plague that attacks the host genome and
exploits cellular resources, or whether they are tolerated because of their occasional
positive influences in genome evolution. These repeat elements present copy numbers
ranging from a few hundred to several hundred thousand including the 868,000 LINES
(Long Interspersed Nuclear Elements) and 1,558,000 SINES (Short Interspersed 6 Neurofibromatosis is an autosomal dominant genetic disorder. It encompasses a set of distinct genetic disorders that
cause tumors to grow along nervous tissues and, in addition, can affect the development of non-nervous tissues, such as, bones and skin. Neurofibromatosis type 1 gene (17q11.2) produces neurofibromin (a GTPase activating enzyme). Neurofibromatosis type 2 gene (22q12 ) produces merlin, a cytoskeletal protein (for revision, please, see Field et al. 2007).
7 Haemophilia is a disorder of the blood-clotting system. There are different types of haemophilia. Hemophilia A and B are X-linked recessive disorders. Haemophilia A is a deficiency of clotting factor VIII (Xq28) and is also known as classical haemophilia and is the cause of about 80% of cases. Haemophilia B is a deficiency of clotting factor IX (Xq27.1-q27.2) and is the cause of about 20% of cases (for revision, please, see Dargaud and Negrier 2007).
8 Breast cancer is a malignant tumor that forms from the uncontrolled growth of abnormal breast cells. The cause of most breast cancers is unknown; however, 5-10% of breast cancers tend to cluster in families. These cancers can be caused by mutations in particular genes, such as, BRCA1 (17q21) or BRCA2 (13q12.3). These genes belong to a class of genes known as tumor suppressor genes (for revision, please, see Goldberg and Borgen 2006).
40
CHAPTER I Understanding Human Diversity
Nuclear Elements). The best studied examples are, respectively, the L1 and Alu
retrotransposons (Batzer and Deininger 2002; Kazazian 2004; Hedges and Batzer 2005).
I.2.3.1. LINE – L1
L1 is an abundant family of non-long terminal repeat retrotransposons that comprises
around 17% of human DNA (Smit 1996). The vast majority (99.8%) of L1s can no
longer retrotranspose because they are 5’ truncated, internally rearranged, or mutated
(Gilbert et al. 2002). However, the average human genome is estimated to contain
approximately 60-100 retrotransposition-competent L1s (RC-L1s), and around 10% of
these elements are classified as highly active or “hot” (Sassaman et al. 1997; Brouha et
al. 2003). The majority of RC-L1s are members of the Ta (Transcribed active)
subfamily (Skowronski et al. 1988), and many are polymorphic with respect to
presence, indicating that they have retrotransposed since the origin of the human species
(Boissinot et al. 2000; Myers et al. 2002).
RC-L1 retrotransposition continues to impact the human genome, for instance,
disease-producing de novo L1 retrotransposition events have been identified in humans,
such as, choroideremia9 (van den Hurk et al. 2007) and pyruvate dehydrogenase
complex (PDHc) deficiency10 (Mine et al. 2007; Ostertag and Kazazian 2001). RC-L1s
can also mobilize sequences derived from both their 5’ and 3’ flanks in cis by a process
termed “L1-mediated transduction” (Pickeral et al. 2000). Finally, the RC-L1 encoded
proteins also may function in trans, resulting in the mobilization of Alu elements and
the formation of processed pseudogenes, which together comprise ~10% of genomic
DNA (Dewannieux et al. 2003; Ejima and Yang 2003). Thus, either directly or through
the promiscuous mobilization of cellular RNAs, L1 retrotransposition continues to
shape the genome.
9 Choroideremia is an X-linked recessive disease (Xq21.2) that leads to the degeneration of the choriocapillaris, the
retinal pigment epithelium, and the photoreceptor of the eye (for revision, please, see MacDonald et al. 2004). 10 PDHc deficiency is an X-linked disease and represents a common cause of congenital lactic acidosis. Most
patients with PDH deficiency have a mutation in the α chain of the PDHE1 enzyme. The gene of the α chain is localised to Xp22.1 (for revision, please, see Maj et al. 2006).
41
CHAPTER I Understanding Human Diversity
I.2.3.2. SINE – Alu markers
The name “Alu elements” was given to these repeated sequences because members of
this family contain a recognition site for the restriction enzyme AluI (Houck et al.
1979). Full-length Alu elements are ~300 bp long and are commonly found in introns, 3′
untranslated regions of genes and intergenic genomic regions. Initial estimates indicated
that these mobile elements were present in the human genome at an extremely high
copy number (~500,000 copies; Rubin et al. 1980). Recently, a detailed analysis of the
draft sequence of the human genome has shown that, out of more than one million
copies, Alu elements are the most abundant SINEs, which makes them the most
abundant of all mobile elements in the human genome (International Human Genome
Sequencing Consortium 2001). Because of their high copy number, the Alu gene family
comprises more than 10% of the mass of the human genome (International Human
Genome Sequencing Consortium 2001) and, as they accumulate preferentially in
gene-rich regions, Alus are not uniformly distributed in the human genome (Korenberg
and Rykoloski 1988). They lack all the machinery necessary to transpose, but studies
demonstrated that Alu are able to commandeer the requisite mobilization machinery
from L1 (Chen et al. 2002). Alu elements unique to the human genome were initially
identified on the basis of a shared high number of diagnostic point mutations, and
polymorphic nature respecting their presence or absence in diverse human genomes
(Batzer et al. 1990; Matera et al. 1990). Almost all of the recently integrated human Alu
elements belong to one of several small and closely related ‘young’Alu subfamilies,
known as Y, Yc1, Yc2, Ya5, Ya5a2, Ya8, Yb8 and Yb9 (Batzer et al. 1990; Matera et
al. 1990; Batzer et al. 1995; Carrol et al. 2001).
The analysis of human Alu insertion polymorphisms has been used to address several
questions about human origins and demography (Perna et al. 1992; Hammer et al. 1994;
Batzer et al. 1996; Stoneking et al. 1997; Comas et al. 2000; Jorde et al. 2000; Nasidze
et al. 2001). They have several characteristics that make them unique for the study of
human population genetics. Individuals that share Alu insertion polymorphisms have
inherited the Alu elements from a common ancestor, which makes the Alu insertion
alleles identical by descent (IBD). In addition, there is no evidence for any type of
process that specifically removes Alu elements from the genome; even when a rare
deletion occurs, it leaves behind a molecular signature (Edwards 1992). The ancestral
42
CHAPTER I Understanding Human Diversity
state of Alu insertion polymorphisms is known to be the absence of the Alu element at a
particular genomic location (Batzer and Deininger 1991; Perna et al. 1992). The
ancestral state of a genomic polymorphism allows us to draw trees of population
relationships without making too many assumptions (Perna et al. 1992; Batzer et al.
1996; Stoneking et al. 1997).
I.2.4. Copy number variation
Genetic variation in the human genome ranges from large, microscopically visible
chromosome anomalies to single nucleotide changes. Recently, multiple studies have
discovered an abundance of submicroscopic copy number variation of DNA segments
ranging from kilobases to megabases in size (Iafrate et al. 2004; Sebat et al. 2004;
Sharp et al. 2005; Tuzun et al. 2005; McCarroll et al. 2006; Redon et al. 2006).
Deletions, insertions, duplications and complex multisite variants (Fredman et al. 2004),
collectively termed copy number variations (CNVs) or copy number polymorphisms
(CNPs), are found in all humans (Feuk et al. 2006a) and other mammals (Freeman et al.
2006). CNV is a DNA segment of 1 kb or larger, present at variable copy number in
comparison with a reference genome (Feuk et al. 2006a). A CNV can be simple in
structure, such as, tandem duplication, or may involve complex gains or losses of
homologous sequences at multiple sites in the genome. CNVs do not include variants
that arise from the insertion/ deletion of transposable elements. Therefore, CNV
encompasses previously introduced terms, such as, large-scale copy number variants
(LCVs; Iafrate et al. 2004), copy number polymorphisms (Sebat et al. 2004), and
intermediate-sized variants (ISVs; Tuzun et al. 2005), but not retroposon insertions.
Recently, Iafrate et al. (2004) and Sebat et al. (2004) reported the widespread presence
of copy number variation in normal individuals, and these observations have since been
replicated and expanded (e.g. de Vries et al. 2005; Sharp et al. 2005; Tuzun et al. 2005;
McCarroll et al. 2006; Repping et al. 2006).
CNVs influence gene expression, phenotypic variation and adaptation, by disrupting
genes and altering gene dosage (McCarroll et al. 2006; Repping et al. 2006), and can
cause disease, as in microdeletion or microduplication disorders (Inoue and Lupski
2002; Shaw-Smith et al. 2004), or even confer risk to complex disease traits, such as,
43
CHAPTER I Understanding Human Diversity
HIV-1 infection and glomerulonephritis11 (Gonzalez et al. 2005; Aitman et al. 2006).
Furthermore, CNVs can influence gene expression indirectly through position effects,
predispose to deleterious genetic changes, or provide substrates for chromosomal
change in evolution (Feuk et al. 2006a,b; Freeman et al. 2006).
Large duplications and deletions have been known for some time to be present in the
human genome, initially from cytogenetic observations (e.g. Coco and Penchaszadeh
1982), but their frequency was presumed to be low and for the most part directly related
either to tandemly repeated genes or to specific genetic disorders (e.g. Inoue and Lupski
2002). In addition, they were often localized to repeat-rich regions, such as, telomeres,
centromeres and heterochromatin (e.g. Giglio et al. 2001).
In a recent study, Redon et al. (2006) found that 285 out of 1961 (14.5%) genes in the
OMIM12 morbid map overlapped with CNVs. These authors observed numerous
examples of possible relevance to both Mendelian and complex diseases. Additionally,
CNVs were identified within the regions commonly deleted in contiguous gene
syndromes13, such as, DiGeorge, Smith-Magenis, Williams-Beuren, Prader-Willi and
Angelman syndromes, which may be relevant for discriminating uncharacterized or
atypical cases.
I.3. Linkage disequilibrium: Insight to the human genome architecture
The knowledge of the human genome architecture significantly contributes to the
understanding of disease susceptibility and development. This can be attained by the
characterization of the fine-scale structure of LD. LD plays a fundamental role in gene
mapping, both as a tool for fine mapping of complex disease genes and in proposed
11 Glomerulonephritis, also known as glomerular nephritis, is a primary or secondary immune-mediated renal disease
characterized by inflammation of the glomeruli. Low copy number of FCGR3B gene was associated with glomerulonephritis in the autoimmune disease systemic lupus erythematosus (for revision, please, see Couser 1998).
12 OMIM - Online Mendelian Inheritance in Man, http://www.ncbi.nlm.nih.gov/sites/entrez?db=OMIM. This database is a catalog of human genes and genetic disorders authored and edited by Dr. Victor A. McKusick and his colleagues at Johns Hopkins University (http://www.jhu.edu) and elsewhere, and developed for the World Wide Web by NCBI, the National Centre for Biotechnology Information (http://www.ncbi.nlm.nih.gov). The OMIM database contains textual information and references.
13 Contiguous gene syndromes are a group of disorders due to deletion of multiple gene loci adjacent to one another. They are characterized by multiple, apparently unrelated, clinical features.
44
CHAPTER I Understanding Human Diversity
genome-wide association studies. LD is also of interest for what it can reveal about
evolution of populations. Moreover, studies of LD may enable us to learn more about
the biology of recombination (Coop et al. 2007; Wang et al. 2006). In fact, the HapMap
consortium (2005) estimated that around 80% of all recombination has taken place in
about 15% of the sequence.
LD is the non-random association of alleles in adjacent loci. When a particular allele at
one locus is found together on the same chromosome with a specific allele at a second
locus, more often than expected if the loci were segregating independently in a
population, the loci are in disequilibrium. This concept of LD is formalized by one of
the earliest measures of disequilibrium to be proposed, D (Lewontin and Kojima 1960).
D, in common with most other measures of LD, quantifies disequilibrium as the
difference between the observed frequency of a two loci haplotype and the frequency it
would be expected to show if the alleles are segregating at random. Adopting the
standard notation for two adjacent loci, A and B, the observed frequency of the
haplotype that consists of alleles A and B is represented by PAB. Assuming the
independent assortment of alleles at the two loci, the expected halotype frequency is
calculated as the product of the allele frequency of each of the two alleles, or PA×PB,
where PA is the frequency of allele A at the first locus and PB is the frequency of allele
B at the second locus (Abecasis et al. 2005; Jobling et al. 2004; Tishkoff and Verrelli
2003; Arcos-Burgos and Muenke 2002; Pritchard and Przeworski 2001). Consequently,
one of the simplest measures of disequilibrium is
D=PAB-PA×PB
LD is created when a new mutation occurs on a chromosome that carries a particular
allele at a nearby locus, and is gradually eroded by recombination. Recurrent mutations
can also lessen the association between alleles at adjacent loci.
The extent of LD in populations is expected to decrease with both time (t) and
recombinational distance (r, or the recombination fraction) between markers.
Theoretically, LD decays with time and distance according to the following formula:
Dt=(1-r)tD0
45
CHAPTER I Understanding Human Diversity
where D0 is the extent of disequilibrium at some starting point and Dt, is the extent of
disequilibrium t generations later.
A wide variety of statistics, with different strengths depending on the context, have been
proposed to measure the amount of LD. Although the measure D has the intuitive
concepts of LD, its numerical value is of little use for measuring the strength and
comparing levels of LD. This is due to the dependence of D on allele frequencies. The
two most common measures are the absolute value of D’ and r2 (Pritchard and
Przeworski 2001).
The absolute value of D’ is determined by dividing D by its maximum possible value,
given the allele frequencies at the two loci. The case of D’=1 is known as complete LD.
Values of D’<1 indicate that the complete ancestral LD has been disrupted. The
magnitude of values of D’<1 has no clear interpretation. Estimates of D’ are strongly
inflated in small samples. Therefore, statistically significant values of D’ that are near
one provide a useful indication of minimal historical recombination, but intermediate
values should not be used for comparisons of the strength of LD between studies, or to
measure the extent of LD (Latini 2004; Varilo 2000, 2003; Angius 2001, 2002).
The measure r2 is in some ways complementary to D’. The measure r2 is equal to D2
divided by the product of the allele frequencies at the two loci (Hill and Roberson
1966). Expected levels of LD are a function of recombination. The more recombination
between two sites, the more they are shuffled with respect to one another, decreasing
LD. Also, LD is a function of N, emphasizing that LD is a property of populations.
Another approach for quantifying LD is through the population recombination
parameter 4Nec(ρ). This approach avoids reliance on pairwise measures of LD, which
differ from marker to marker, and facilitates comparisons between regions.
Mutation and recombination might have the most evident impact on linkage
disequilibrium. There are additional contributors to the extent and distribution of
disequilibrium. LD can be inflated by demographic factors, including inbreeding,
population structure and bottlenecks. Recombination rates are known to vary by more
than an order of magnitude across the genome (Jobling et al. 2004). Because breakdown
of LD is primarily driven by recombination, the extent of LD is expected to vary in
inverse relation to the local recombination rate. Some SNPs, such as, those at CpG
46
CHAPTER I Understanding Human Diversity
dinucleotides, might have high mutation rates and, therefore, show little or no LD with
nearby markers, even in the absence of historical recombination. Rapid population
growth decreases LD by reducing genetic drift. Population subdivision is likely to have
been an important factor in establishing the patterns of LD in humans.
There are two primary routs by which selection can affect the extent of disequilibrium.
The first is a hitchhiking effect, in which an entire haplotype that flanks a favoured
variant can be rapidly swept to high frequency or even fixation (Jobling et al. 2004).
Although the effect is generally milder, selection against deleterious variants can also
inflate LD, as the deleterious haplotypes are swept from the population. Genetic
hitchhiking is expected to affect the frequency distribution of variants at segregating
sites such that derived variants will be in higher frequency than expected under a neutral
equilibrium model. Genetic hitchhiking is also expected to skew the frequency
distribution of variants at segregating site toward rare alleles, resulting in a significantly
negative value of Tajima’s D14 (Thornton 2005). It is unknown to what extent this mode
of selection increases pairwise LD between high frequency alleles. However, selective
sweeps affect sites over a genetic distance on the order of the selection coefficient;
consequently, for a single sweep to affect >1 Mb, the advantage of the variant would
have to be large (at least 0.01). The second way in which selection can affect LD is
through epistatic selection for combinations of alleles at two or more loci on the same
chromosome. This form of selection leads to the association of particular alleles at
different loci (Gu et al. 2007; Abecasis et al. 2005). In a gene conversion event, a short
stretch of one copy of a chromosome is transferred to the other copy during meiosis.
The effect is equivalent to two very closely spaced recombination events, and can break
down LD in a manner similar to recombination or recurrent mutation (Abecasis et al.
2005; Pritchard and Przeworski 2001).
LD has been extensively studied in several populations, for example and more recently,
Croatia (Vitart et al. 2006) and Korea (Lee and Kim 2006). Abbott et al. 2006 studied
Niue Islanders and report that they are genetically isolated and have a homogeneous
southeast Asian ancestry. Moreover, they observe that the Niue population has reduced
14 The Tajima’s D is a widely used test of neutrality in population genetics. It illustrates the allele frequency
distribution of nucleotide sequence data and is based on the difference between two estimators of θ (the population mutation rate, 4Neµ). Tajima’s estimator uses the average number of pairwise differences between sequences.
47
CHAPTER I Understanding Human Diversity
autosomal genetic diversity and high levels of linkage disequilibrium that are consistent
with the influence of genetic drift mechanisms, such as, a founder effect or bottlenecks.
Abbott and collaborators also conclude that high-powered linkage disequilibrium
studies, designed to map ancestral polymorphisms that influence complex genetic
disease susceptibility, may be feasible in this population. Another study by Vitart et al.
(2005) analysed 955 unrelated individuals of local ancestry from nine Scottish rural
regions and the urban center of Edinburgh, as well as, 96 unrelated individuals from the
general UK population. They observed that, despite little overall differentiation on the
basis of allele frequencies, there were clear differences among subpopulations in the
extent of pairwise LD, measured between a subset of X-linked markers. Vitart and
colleagues also reports that there are strategic advantages in studying rural
subpopulations, in terms of increased power and reduced cost. They conclude that
similar rural-urban contrasts are likely to exist in many other populations with stable
rural subpopulations, which could influence the design of genetic association studies
and national biobank data collections.
I.3.1. Linkage disequilibrium and the international HapMap project
The completion of the International HapMap Project marks the start of a new phase in
human genetics. In order to gain further knowledge in the common patterns of DNA
sequence variation, the International HapMap Project was launched in October 2002.
This project created a public genome-wide database of common human sequence
variation and will provide information to allow indirect association studies to any
functional candidate gene, to any region suggested by family-based linkage analysis, or
ultimately to whole genome scans of disease risk factors (International HapMap
Consortium 2003, 2005). The project shares information rapidly and without restriction
on its use. The most important goal of HapMap is to develop a research tool that helps
investigators to discover genetic factors that contribute to susceptibility to disease, to
protection against illness and to drug response. In its scope and potential consequences,
this project has much in common with the Human Genome Project, which sequenced
the human genome. Whereas the sequencing project covered the entire genome,
including the 99.9% of the genome where humans are all the same, the HapMap
48
CHAPTER I Understanding Human Diversity
characterizes the common patterns within the 0.1% where humans differ from each
other (International HapMap Consortium 2003, 2005).
Phase I of the HapMap Project set as a goal genotyping at least one common SNP every
5 kb across the genome in each of 270 DNA samples. These individuals are 30
mother-father-offspring trios from the Yoruba people of Ibidan Peninsula in Nigeria
(referred to as YRI), 30 such trios from the CEPH project in Utah (CEU), 45 unrelated
individuals from the Han Chinese population of Beijing (CHB), and 45 unrelated
individuals of Japanese ancestry from the Tokyo area (JPT, for many analyses the CHB
and JPT samples are combined within a single “analysis panel”). For practicality, and
motivated by the allele frequency distribution of variants in the human genome, a minor
allele frequency (MAF) of 0.05 or greater was targeted for study (McVean et al. 2005).
The project has a Phase II, which is attempting genotyping of an additional 4.6 million
SNPs in each of the HapMap samples.
Although not designed specifically to enable admixture mapping, the HapMap has
helped lay the groundwork for this approach. Admixture mapping requires a map of
SNPs that are highly differentiated in frequency across population groups. By typing
many SNPs in samples from multiple geographical regions, the data have helped to
identify such SNPs for the design of genome-wide admixture mapping panels and can
be further used to identify candidate SNPs with large allele frequency differences for
follow-up of positive admixture scan results. The advent of genome-wide variation
resources, such as the HapMap, opens a new era in population genetics, offering an
unprecedented opportunity to investigate the evolutionary forces that have shaped
variation in natural populations (International HapMap Consortium 2003, 2005).
The main application of the HapMap data is in the selection of tag single nucleotide
polymorphisms (tSNPs) to use in association studies (Montpetit et al. 2006). The
usefulness of this selection process needs to be verified in populations outside those
used for the HapMap project. In addition, it is not known how well the data represent
the general population, as only 90-120 chromosomes were used for each population and
since the genotyped SNPs were selected so as to have high frequencies. In this study,
Montpetit et al. (2006) analyzed more than 1000 individuals from Estonia. The
population of this northern European country has been influenced by many different
waves of migrations from Europe and Russia. These authors genotyped 1536 randomly
49
CHAPTER I Understanding Human Diversity
selected SNPs from two 500 kb ENCODE regions on chromosome 2. They observed
that the tSNPs selected from the CEU HapMap samples captured most of the variation
in the Estonia sample. Using the reverse approach, tags selected from the Estonia
sample could almost equally well describe the CEU sample. Finally, Montpetit and
collaborators observed that the sample size, the allelic frequency, and the SNP density
in the dataset used to select the tags each have important effects on the tagging
performance. Overall, this study supported the use of HapMap data in other Caucasian
populations, but the SNP density and the bias towards high frequency SNPs have to be
taken into account when designing association studies.
Another study by Conrad et al. (2006) reports haplotype structure across 12 Mb of DNA
sequence in 927 individuals representing 52 populations. The geographic distribution of
haplotypes reflects human history, with a loss of haplotype diversity as distance
increases from Africa. Although the extent of LD varies markedly across populations,
considerable sharing of haplotype structure exists, and inferred recombination hotspot
locations generally match across groups. To respond to the question: To what extent do
the HapMap populations predict patterns of haplotype diversity found in a worldwide
set of populations?, Conrad and colleagues (2006) compared their results with the four
samples in the International HapMap Project. They observed that the HapMap samples
contain the majority of common haplotypes found in most populations: averaging across
populations, 83% of common 20 kb haplotypes in a population are also common in the
most similar HapMap sample. The authors conclude that, although the portability of tag
SNPs based on the HapMap is reduced in low LD Africans, the HapMap will be helpful
for the design of genome-wide association mapping studies in nearly all human
populations.
Bansal et al. (2007) present a statistical method to identify large inversion
polymorphisms using unusual LD patterns from high density SNP data. The method is
designed to detect chromosomal segments that are inverted (in a majority of the
chromosomes) in a population with respect to the reference human genome sequence.
These authors demonstrate the power of this method to detect such inversion
polymorphisms through simulations done using the HapMap data. Application of this
method to the data from the first phase of the International HapMap project resulted in
176 candidate inversions ranging from 200 kb to several megabases in length. Bansal
50
CHAPTER I Understanding Human Diversity
and collaborators predicted inversions include an 800 kb polymorphic inversion at
7p22, a 1.1 Mb inversion at 16p12, and a novel 1.2 Mb inversion on chromosome 10
that is supported by the presence of two discordant fosmids. Analysis of the genomic
sequence around inversion breakpoints showed that 11 predicted inversions are flanked
by pairs of highly homologous repeats in the inverted orientation. In addition, for three
candidate inversions, the inverted orientation is represented in the Celera genome
assembly. Although the power of the method to detect inversions is restricted because
of inherently noisy LD patterns in population data, inversions predicted by our method
represent strong candidates for experimental validation and analysis.
51
“…Weʹve discovered the secret of life…”
Francis Crick
CHAPTER II
POPULATION STUDIES:
KNOWING THE PAST TO PREDICT THE FUTURE
52
CHAPTER II Population Studies
II. Population studies: knowing the past to predict the future
Human molecular evolution is based on the concept that patterns of DNA sequence
variation determine aspects of human heritage and are shaped by a group of
evolutionary influences, such as, genetic drift, selection, mutation and migration.
Therefore, genetic variability in the genome reflects both evolutionary adaptive
locus-specific and population-level processes that affect all components of the genome
equally. Genetic research often focuses on distinguishing inconsistencies in patterns of
variation between genomic regions to help fill the gap between particular genes and
traits (Underhill 2003). By studying the degree of genetic molecular variation, it is
possible, in principle, to reconstruct past events, namely, expansions and settlements
(Cavalli-Sforza et al. 1994). However, since the bulk of common variation in the
genome occurs between individuals, the difference between populations is low, making
it more challenging to investigate ambiguities concerning affinities and origins of
populations. It is the component of inter population variance that best provides insights
into the evolution of the extant populations (Cavalli-Sforza and Feldman 2003).
In theory, the evolutionary forces can influence the Hardy-Weinberg equilibrium. Two
scientists, Geoffrey Hardy and Wilhelm Weinberg (1908), working independently and
based on Mendel's principles of inheritance, developed the concept that is known today
as the Hardy-Weinberg Principle, which states: "In a large, randomly breeding (diploid)
population, allelic frequencies will remain the same from generation to generation;
assuming no unbalanced mutation, gene migration, selection or genetic drift." When a
population meets all of the Hardy-Weinberg conditions it is said to be in
Hardy-Weinberg equilibrium. If p is the frequency of one allele (A) and q is the
frequency of the alternative allele (a) for a biallelic locus, then the HWE expected
frequency will be p2 for the AA genotype, 2pq for the Aa genotype, and q2 for the aa
genotype. The three genotypic proportions should sum to 1, as should the allele
frequencies (Hardy 1908; Weinberg 1908). This equilibrium can be mathematically
expressed based on a simple binomial or multinomial distribution of the gene
frequencies as:
p2+2pq+q2=1
53
CHAPTER II Population Studies
The most common way to assess HWE is through a goodness-of-fit chi-square (χ2) test
(Weir 1996). The null hypothesis is that alleles are chosen randomly, and the genotypic
proportions follow HWE expected proportions (i.e. p2, 2pq and q2). Alternatively, the
second allele is dependent on the first allele being selected. This results in the genotypic
proportions deviating from the HWE expected proportions (Wittke-Tompson et al.
2005; Weir 1996).
HWE predicts how gene frequencies will be transmitted from generation to generation
given the specific set of assumptions previously described. Populations in their natural
environment can never meet all of the conditions required to achieve HWE, thus, their
allele frequencies will change from one generation to the next and the population will
evolve. Just how far the population deviates from HWE is an indication of the intensity
of the external factors. On the other hand, deviation from Hardy-Weinberg equilibrium
has also become an accepted test for genotyping errors (Hosking et al. 2004; Leal
2005). However, it is generally considered that testing departures from HWE to detect
genotyping error is not sensitive. Cox and Kraft (2006) examined various models of
genotyping error, including error caused by neighbouring SNPs that degrade the
performance of genotyping assays. They also calculated the power of chi-square
goodness-of-fit tests for deviation from HWE to detect such error. They observed that,
generally, genotyping error does not generate sufficient deviation from Hardy-Weinberg
equilibrium to be detected and genotyping error due to neighbouring SNPs attenuates
risk estimates, often drastically.
II.1. Population history, demography and evolutionary forces
The main way to gain insight into past population processes is to analyze and interpret
current patterns of genetic variation (von Haeseler 1995). Data on ancient DNA can also
help, but they are scarce and will not become abundant in the near future (Cooper and
Poinar 2000). One difficulty with modern genes lies in the fact that any given pattern of
variation may potentially be explained by several different evolutionary phenomena. A
cline or gradient pattern, for example, may reflect adaptation to variable environments,
or a population expansion at one moment in time, or continuous gene flow between
groups that initially differed in allele frequencies. However, it is possible to discard at
least some implausible models by jointly analyzing many loci (selection tends to affect
54
CHAPTER II Population Studies
single genes, whereas demographic changes determine similar patterns across the
genome), or by exploiting non-genetic information, such as, archaeological and
paleobiological data (Barbujani and Bertorelle 2001).
Demographic events can cause an uneven distribution of genetic disorders in different
human populations, for example, the occurrence Tay-Sachs disease15 in Ashkenazi Jews
(Risch et al. 2003; Weiss 1993), and non-insulin-dependent diabetes mellitus (NIDDM,
or diabetes type 2) in Amerindians (Weiss 1993). The interaction between history,
demography and genetics is, therefore, of basic importance for the understanding of
genetic structure of human populations.
Currently available genetic and archaeological evidence is generally interpreted as
supportive of a recent single origin of modern humans in east Africa. However, this is
where the near consensus on human settlement history ends, and considerable
uncertainty clouds more detailed aspects of human colonization history. Liu et al.
(2006) using genetic data of 783 autosomal microsatellites in 52 human populations
estimated parameters of the expansion of modern humans. Their best estimates suggest
an initial expansion of modern humans ~56,000 years ago from a small founding
population of ~1000 effective individuals. Their model further points to high growth
rates in newly colonized habitats.
The genetic history of a group of populations is usually analyzed by reconstructing a
tree of their origins. Reliability of the reconstruction depends on the validity of the
hypothesis that genetic differentiation of the populations is mostly due to population
fissions followed by independent evolution. Dating the fissions requires comparisons
with paleoanthropological and paleontological dates, which are few and uncertain
(Cavalli-Sforza 1997). A method of absolute genetic dating uses mutation rates as
molecular clocks; it was applied to human evolution using microsatellites, which have a
sufficiently high mutation rate. Results agree with a recent expansion of modern
humans from Africa. An alternative method of analysis, useful when there is adequate
geographic coverage of regions, is the geographic study of frequencies of alleles or
15 Tay-Sachs disease is an autosomal recessive disorder caused by mutations on the HEXA gene (15q23-q24). This
gene codes for a subunit of an enzyme called beta-hexosaminidase A. The disease occurs when harmful quantities of a fatty acid derivative called ganglioside accumulate in the brain neurons (for revision, please, see Fernandes Filho and Shapiro 2004).
55
CHAPTER II Population Studies
haplotypes. As in the case of trees, it is necessary to summarize data from many loci for
conclusions to be acceptable. Results must be independent from the loci used.
Multivariate analyses like principal components or multidimensional scaling reveal a
number of hidden patterns and evaluate their relative importance (Cavalli-Sforza 1997).
Most patterns found in the analysis of human living populations are likely to be
consequences of demographic expansions, determined by technological developments
affecting food availability, transportation or military power. During such expansions,
both genes and languages are spread to potentially vast areas. In principle, this tends to
create a correlation between the respective evolutionary trees. The correlation is usually
positive and often remarkably high. It can be decreased or hidden by phenomena of
language replacement and gene replacement, usually partial, due to gene flow
(Cavalli-Sforza 1997).
II.1.1. Human population background: paternal and maternal lineages
Explorations into prehistory have been traditionally archaeological; however, additional
perspectives have been provided by linguistic and genetic studies. The accumulation of
sequence variation in nonrecombining sex-specific loci (mitochondrial DNA and
Y-chromosome) provides a powerful way to recover genetic prehistory. Nevertheless,
the records retained may diverge because of natural selection or differences between
male and female behaviours (Underhill 2003).
Since only one mitochondrial DNA (mtDNA) or Y-chromosome lineage can be
transmitted by a couple to each of their offspring, compared with four autosomal alleles,
the mtDNA and Y-chromosome have a much smaller effective population size –
one-quarter that of the autosomes. This makes them much more prone to founder effects
during population constrictions. As a result, the mtDNA and Y-chromosome exhibit
striking population-specific diversity, which greatly facilitates the identification of
founders, aiding in the reconstruction of ancient migrations (Lell and Wallace 2000).
Human mtDNA is a circular double-stranded molecule (Figure II.1), with 16,569 bp in
length that codes for 13 subunits of the oxidative phosphorylation system, 2 ribosomal
RNAs (rRNAs, ribonucleic acid), and 22 transfer RNAs (tRNAs; Anderson et al. 1981;
for revison, please see Pakendorf and Stoneking 2005). It is present in hundreds to
56
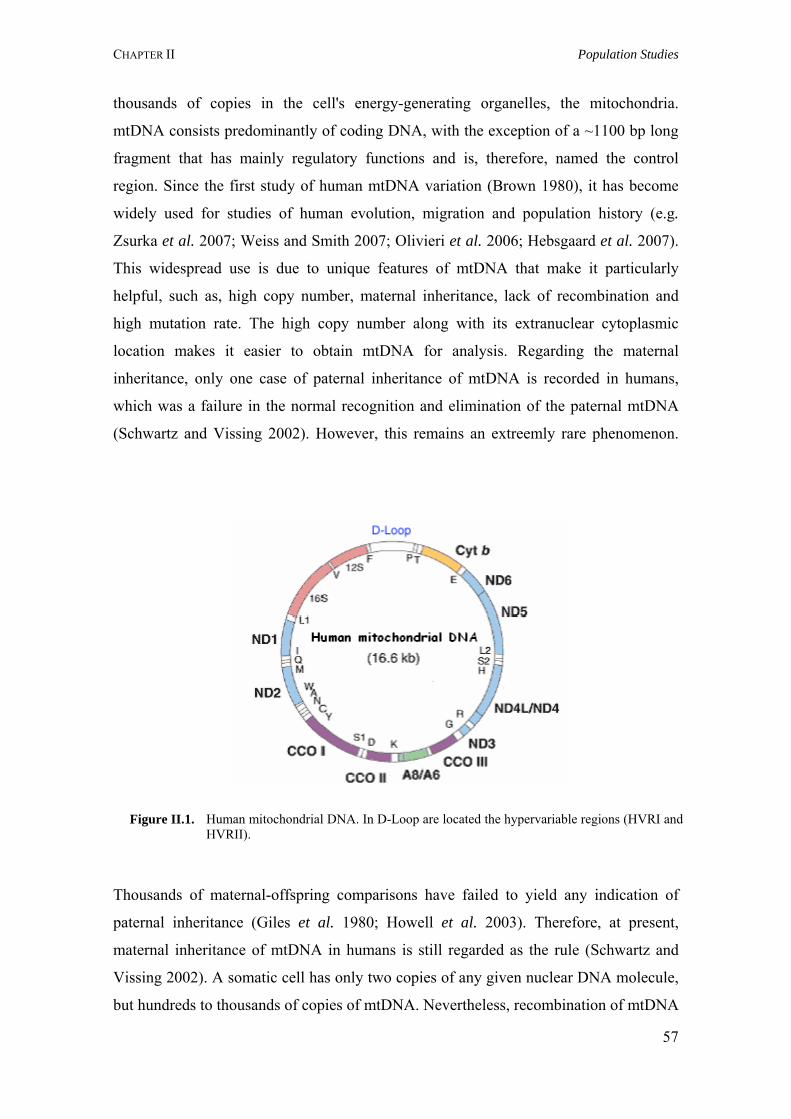
CHAPTER II Population Studies
thousands of copies in the cell's energy-generating organelles, the mitochondria.
mtDNA consists predominantly of coding DNA, with the exception of a ~1100 bp long
fragment that has mainly regulatory functions and is, therefore, named the control
region. Since the first study of human mtDNA variation (Brown 1980), it has become
widely used for studies of human evolution, migration and population history (e.g.
Zsurka et al. 2007; Weiss and Smith 2007; Olivieri et al. 2006; Hebsgaard et al. 2007).
This widespread use is due to unique features of mtDNA that make it particularly
helpful, such as, high copy number, maternal inheritance, lack of recombination and
high mutation rate. The high copy number along with its extranuclear cytoplasmic
location makes it easier to obtain mtDNA for analysis. Regarding the maternal
inheritance, only one case of paternal inheritance of mtDNA is recorded in humans,
which was a failure in the normal recognition and elimination of the paternal mtDNA
(Schwartz and Vissing 2002). However, this remains an extreemly rare phenomenon.
Figure II.1. Human mitochondrial DNA. In D-Loop are located the hypervariable regions (HVRI and HVRII).
Thousands of maternal-offspring comparisons have failed to yield any indication of
paternal inheritance (Giles et al. 1980; Howell et al. 2003). Therefore, at present,
maternal inheritance of mtDNA in humans is still regarded as the rule (Schwartz and
Vissing 2002). A somatic cell has only two copies of any given nuclear DNA molecule,
but hundreds to thousands of copies of mtDNA. Nevertheless, recombination of mtDNA
57
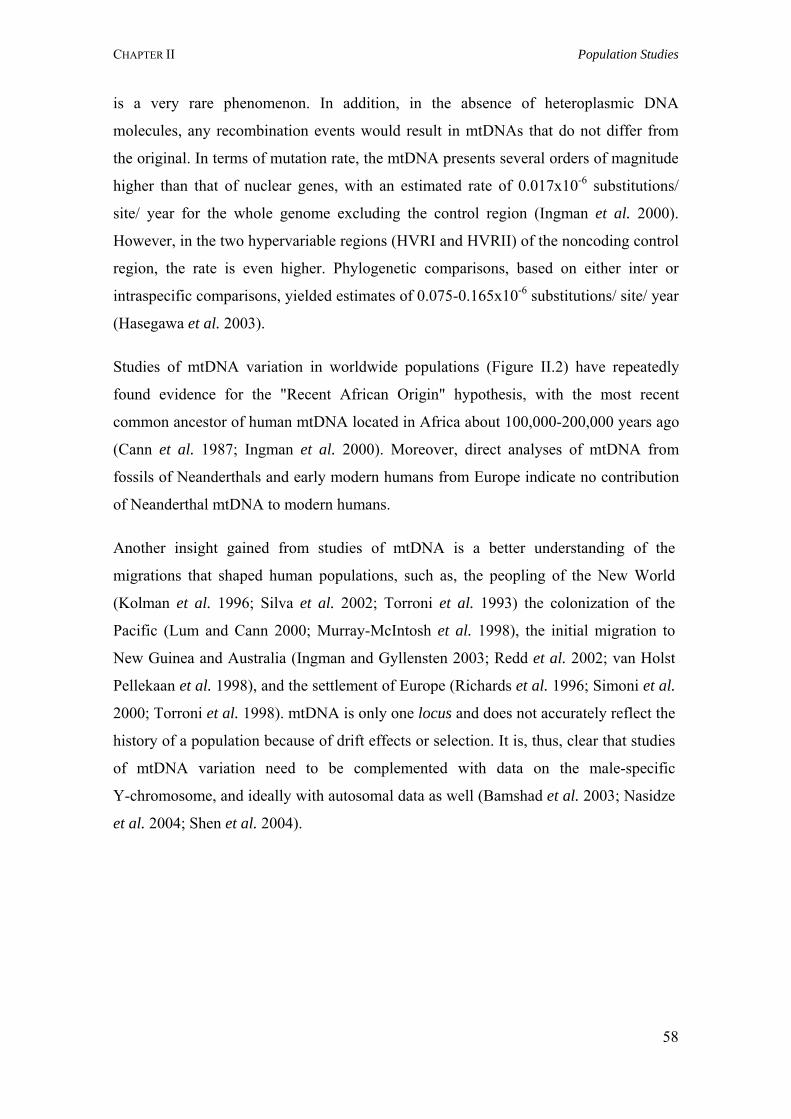
CHAPTER II Population Studies
is a very rare phenomenon. In addition, in the absence of heteroplasmic DNA
molecules, any recombination events would result in mtDNAs that do not differ from
the original. In terms of mutation rate, the mtDNA presents several orders of magnitude
higher than that of nuclear genes, with an estimated rate of 0.017x10⁻⁶ substitutions/
site/ year for the whole genome excluding the control region (Ingman et al. 2000).
However, in the two hypervariable regions (HVRI and HVRII) of the noncoding control
region, the rate is even higher. Phylogenetic comparisons, based on either inter or
intraspecific comparisons, yielded estimates of 0.075-0.165x10⁻⁶ substitutions/ site/ year
(Hasegawa et al. 2003).
Studies of mtDNA variation in worldwide populations (Figure II.2) have repeatedly
found evidence for the "Recent African Origin" hypothesis, with the most recent
common ancestor of human mtDNA located in Africa about 100,000-200,000 years ago
(Cann et al. 1987; Ingman et al. 2000). Moreover, direct analyses of mtDNA from
fossils of Neanderthals and early modern humans from Europe indicate no contribution
of Neanderthal mtDNA to modern humans.
Another insight gained from studies of mtDNA is a better understanding of the
migrations that shaped human populations, such as, the peopling of the New World
(Kolman et al. 1996; Silva et al. 2002; Torroni et al. 1993) the colonization of the
Pacific (Lum and Cann 2000; Murray-McIntosh et al. 1998), the initial migration to
New Guinea and Australia (Ingman and Gyllensten 2003; Redd et al. 2002; van Holst
Pellekaan et al. 1998), and the settlement of Europe (Richards et al. 1996; Simoni et al.
2000; Torroni et al. 1998). mtDNA is only one locus and does not accurately reflect the
history of a population because of drift effects or selection. It is, thus, clear that studies
of mtDNA variation need to be complemented with data on the male-specific
Y-chromosome, and ideally with autosomal data as well (Bamshad et al. 2003; Nasidze
et al. 2004; Shen et al. 2004).
58
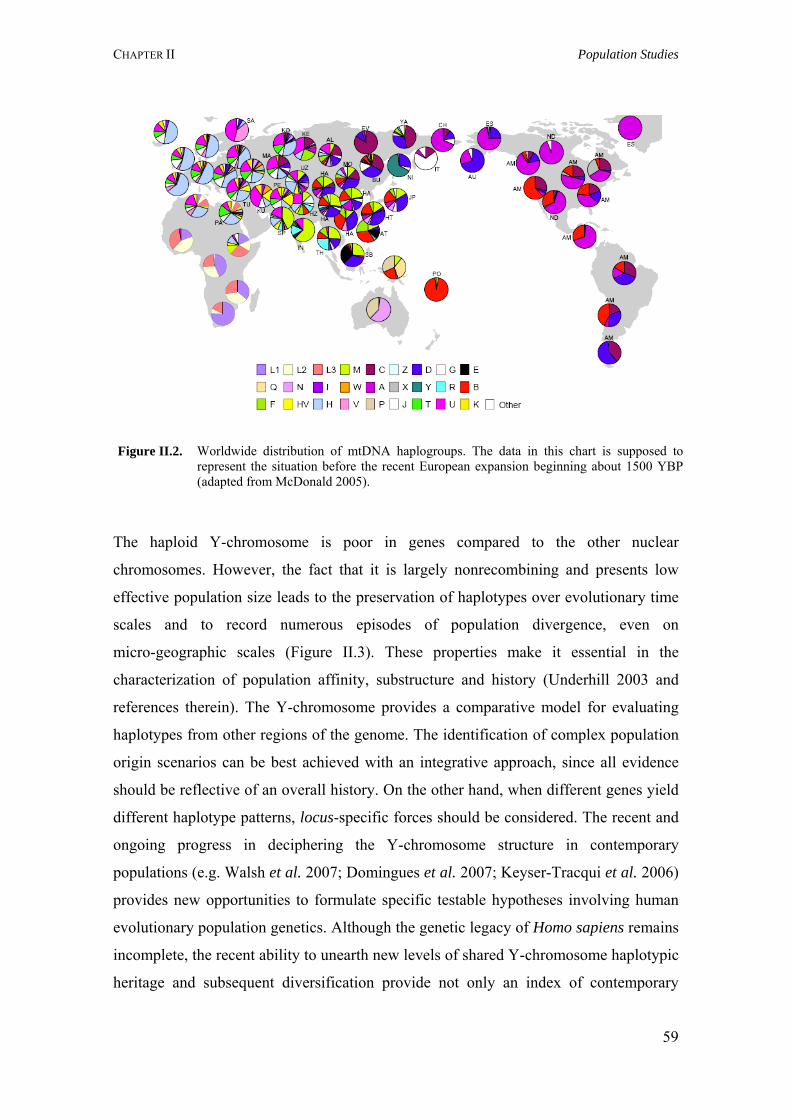
CHAPTER II Population Studies
Figure II.2. Worldwide distribution of mtDNA haplogroups. The data in this chart is supposed to represent the situation before the recent European expansion beginning about 1500 YBP (adapted from McDonald 2005).
The haploid Y-chromosome is poor in genes compared to the other nuclear
chromosomes. However, the fact that it is largely nonrecombining and presents low
effective population size leads to the preservation of haplotypes over evolutionary time
scales and to record numerous episodes of population divergence, even on
micro-geographic scales (Figure II.3). These properties make it essential in the
characterization of population affinity, substructure and history (Underhill 2003 and
references therein). The Y-chromosome provides a comparative model for evaluating
haplotypes from other regions of the genome. The identification of complex population
origin scenarios can be best achieved with an integrative approach, since all evidence
should be reflective of an overall history. On the other hand, when different genes yield
different haplotype patterns, locus-specific forces should be considered. The recent and
ongoing progress in deciphering the Y-chromosome structure in contemporary
populations (e.g. Walsh et al. 2007; Domingues et al. 2007; Keyser-Tracqui et al. 2006)
provides new opportunities to formulate specific testable hypotheses involving human
evolutionary population genetics. Although the genetic legacy of Homo sapiens remains
incomplete, the recent ability to unearth new levels of shared Y-chromosome haplotypic
heritage and subsequent diversification provide not only an index of contemporary
59
CHAPTER II Population Studies
population structure, but also a preamble to human prehistory and substantial
foundation for comparisons with other genomic regions (Underhill 2003).
Figure II.3. Human Y-chromosome. The NRY accounts around 95% of the Y-chromosome.
NR
Y (9
5%)
NR
Y (9
5%)
The particular distinctive clinal patterns of NRY (nonrecombining portion of the
Y-chromosome) haplotypes (Figure II.4), together with patterns of associated genetic
diversification with geography mark trajectories of gene flow and, by inference, the
movement of populations (Nonakal et al. 2007; Karafet et al. 2001). Additionally, the
lower effective population size of Y-chromosomes relative to other components of the
human genome make this chromosome particularly sensitive to the influences of drift
and founder effect. Whatever the causes of this property (e.g. localized natural selection,
gender-based differential reproductive success, and/ or migratory behaviour), it is
particularly useful since it explains the characteristic high stratification of NRY
diversity with geography relative to other genes including mtDNA (Underhill 2003).
Currently, over 400 binary polymorphisms (SNPs and Alus) describe the
Y-chromosome tree. Several mutually reinforcing binary mutations divide the
Y-chromosome haplotype phylogeny into two distinctive components, haplogroup A
and the remainder of all other haplogroups, specifically B through R (Y-chromosome
60
CHAPTER II Population Studies
Consortium16). The ancestral alleles associated with these ancient polymorphisms are
localized exclusively to a minority of both extant north African and subSaharan
populations, whereas the majority of other Africans and all non-Africans carry only the
derived mutant alleles (Underhill 2003). This mode indicates that almost all modern
Y-chromosomes trace their ancestry to a common primogenitor, as expected in a stable
genealogy. These Y-chromosome data contradict the possibility that early hominids
contributed significantly, if at all, to the gene pool of anatomically modern humans
(Capelli et al. 2001; Ke et al. 2001). This is evidence that all modern human
Y-chromosomes trace their ancestry to Africa and that the descendants of the derived
lineage left Africa and eventually completely replaced previous archaic human
Y-chromosome lineages. A second distinctive monophyletic haplogroup called B,
defined by several binary polymorphisms, is also restricted to African populations. Both
A and B lineages are diverse and suggest a deeper genealogical heritage than other
haplotypes. Representatives of these lineages are distributed across Africa, but generally
at low frequencies (Underhill 2003). The phylogenetic position of A and B lineages
nearest the root of the Y-tree, their survivorship in isolated populations and accumulated
variation are suggestive of an early diversification and dispersal of human populations
within Africa, and an early widespread distribution of human populations in that
continent. The discovery of Homo sapiens fossils in Ethiopia dating to 160,000 years
ago is consistent with an African origin of our species (White et al. 2003; Underhill
2003).
16 Y-Chromosome Consortium website: http://ycc.biosci.arizona.edu. This consortium has established a system of
defining Y-DNA haplogroups by letters A through R, with further subdivisions.
61
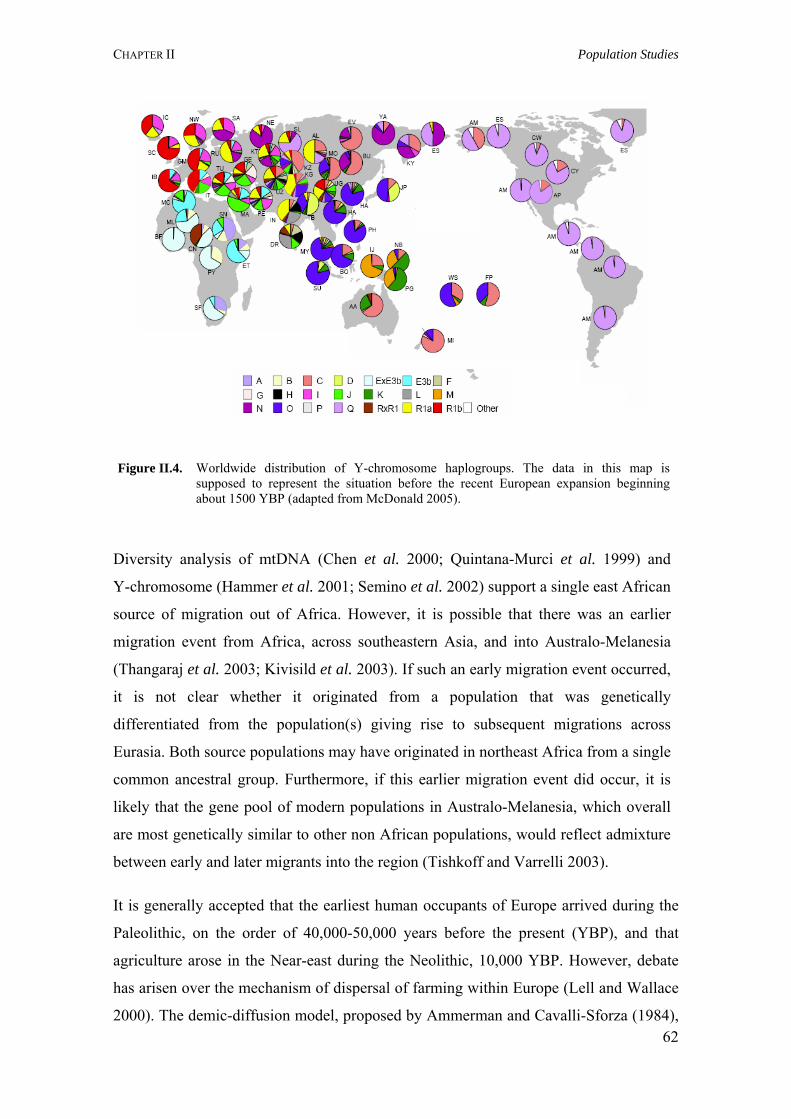
CHAPTER II Population Studies
Figure II.4. Worldwide distribution of Y-chromosome haplogroups. The data in this map is supposed to represent the situation before the recent European expansion beginning about 1500 YBP (adapted from McDonald 2005).
Diversity analysis of mtDNA (Chen et al. 2000; Quintana-Murci et al. 1999) and
Y-chromosome (Hammer et al. 2001; Semino et al. 2002) support a single east African
source of migration out of Africa. However, it is possible that there was an earlier
migration event from Africa, across southeastern Asia, and into Australo-Melanesia
(Thangaraj et al. 2003; Kivisild et al. 2003). If such an early migration event occurred,
it is not clear whether it originated from a population that was genetically
differentiated from the population(s) giving rise to subsequent migrations across
Eurasia. Both source populations may have originated in northeast Africa from a single
common ancestral group. Furthermore, if this earlier migration event did occur, it is
likely that the gene pool of modern populations in Australo-Melanesia, which overall
are most genetically similar to other non African populations, would reflect admixture
between early and later migrants into the region (Tishkoff and Varrelli 2003).
It is generally accepted that the earliest human occupants of Europe arrived during the
Paleolithic, on the order of 40,000-50,000 years before the present (YBP), and that
agriculture arose in the Near-east during the Neolithic, 10,000 YBP. However, debate
has arisen over the mechanism of dispersal of farming within Europe (Lell and Wallace
2000). The demic-diffusion model, proposed by Ammerman and Cavalli-Sforza (1984), 62
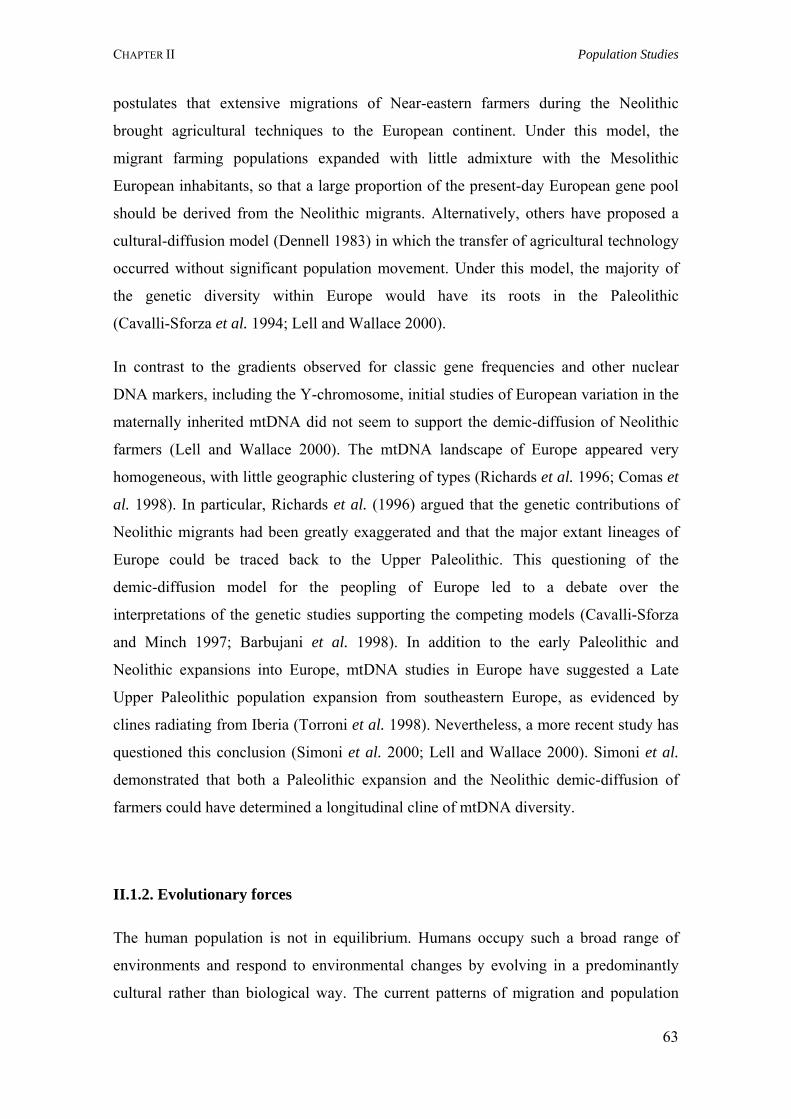
CHAPTER II Population Studies
postulates that extensive migrations of Near-eastern farmers during the Neolithic
brought agricultural techniques to the European continent. Under this model, the
migrant farming populations expanded with little admixture with the Mesolithic
European inhabitants, so that a large proportion of the present-day European gene pool
should be derived from the Neolithic migrants. Alternatively, others have proposed a
cultural-diffusion model (Dennell 1983) in which the transfer of agricultural technology
occurred without significant population movement. Under this model, the majority of
the genetic diversity within Europe would have its roots in the Paleolithic
(Cavalli-Sforza et al. 1994; Lell and Wallace 2000).
In contrast to the gradients observed for classic gene frequencies and other nuclear
DNA markers, including the Y-chromosome, initial studies of European variation in the
maternally inherited mtDNA did not seem to support the demic-diffusion of Neolithic
farmers (Lell and Wallace 2000). The mtDNA landscape of Europe appeared very
homogeneous, with little geographic clustering of types (Richards et al. 1996; Comas et
al. 1998). In particular, Richards et al. (1996) argued that the genetic contributions of
Neolithic migrants had been greatly exaggerated and that the major extant lineages of
Europe could be traced back to the Upper Paleolithic. This questioning of the
demic-diffusion model for the peopling of Europe led to a debate over the
interpretations of the genetic studies supporting the competing models (Cavalli-Sforza
and Minch 1997; Barbujani et al. 1998). In addition to the early Paleolithic and
Neolithic expansions into Europe, mtDNA studies in Europe have suggested a Late
Upper Paleolithic population expansion from southeastern Europe, as evidenced by
clines radiating from Iberia (Torroni et al. 1998). Nevertheless, a more recent study has
questioned this conclusion (Simoni et al. 2000; Lell and Wallace 2000). Simoni et al.
demonstrated that both a Paleolithic expansion and the Neolithic demic-diffusion of
farmers could have determined a longitudinal cline of mtDNA diversity.
II.1.2. Evolutionary forces
The human population is not in equilibrium. Humans occupy such a broad range of
environments and respond to environmental changes by evolving in a predominantly
cultural rather than biological way. The current patterns of migration and population
63
CHAPTER II Population Studies
growth are similar to those that have predominated over much of human prehistory.
These observations raise questions such as: Have human allele frequencies been frozen
in time? Are humans still undergoing natural selection? Can we expect any changes to
the human phenotype and will humans speciate? (Jobling et al. 2004). Some of these
questions address the microevolutionary pressures – mutation, genetic drift, migration
and selection – operating on modern humans, while other queries focus on the
macroevolutionary future – whether speciation is likely or inevitable.
II.1.2.1. Genetic drift
Genetic drift – along with natural selection, mutation and migration – is one of the basic
mechanisms of evolution. It describes changes in allele frequency from one generation
to the next due to sampling variance. The frequency of an allele in the offspring
generation will vary according to the probability distribution of the frequency of the
allele in the parent generation. Many aspects of genetic drift depend on the size of the
population. This is especially important in small mating populations, where chance
fluctuations from generation to generation can be large. Such fluctuations in allele
frequency between successive generations may result in some alleles disappearing from
the population. For example, two separate populations that begin with the same allele
frequency might "drift" by random fluctuation into two divergent populations with
different allele sets, for example, alleles that are present in one have been lost in the
other (Pardo et al. 2005; Arcos-Burgos and Muenke 2002).
In small populations subject to drift, the rate of evolutionary change can be speeded up
dramatically, and allele and genotype frequencies can change unpredictably from one
generation to the next: the smaller the population, the more extreme these fluctuations
tend to be. Like selection, genetic drift is a process of differential reproductive success;
nevertheless, the key element of this evolutionary force is that the individuals that
survive and reproduce are random, i.e. unrelated to their phenotype and genotype (Willi
et al. 2007; Rudan et al. 2006). Because it is a random process, the outcome in any
generation is unpredictable; however, certain generalities can be made and reliably
predict the cumulative effects of genetic drift. On average it is expected that (i) small
populations will show large but random fluctuations in allele and genotype frequencies,
64
CHAPTER II Population Studies
i.e. some alleles will be lost over time, reducing the amount of genetic variation in the
population, eventually, only one allele will become fixed; and (ii) replicate populations
will diverge genetically over time and because everything happening within a
generation is random, the population will appear to be in Hardy-Weinberg equilibrium
at any time. Genetic drift can be observed by the occurrence of two main processes:
bottleneck and founder effect (Figure II.5).
A population bottleneck is a significant reduction in the size of a population that causes
the extinction of many genetic lineages within that population, thus, decreasing genetic
diversity. Several studies have demonstrated the occurrence of bottlenecks in the human
population (e.g. Rootsi et al. 2007; Battilana et al. 2006; Kasperaviciute et al. 2004).
Schmegner et al. (2005) studying the NF117 gene demonstrated that the recent European
population went through a bottleneck during the last 150,000 years of its history.
Moreover, considering this timeframe, the bottleneck could either reflect a speciation
event which led to the anatomically modern human (AMH), or a severe reduction of the
population size during the emigration of AMHs out of Africa or the immigration into
Europe.
Figure II.5. Bottleneck and founder effects representation. Circles of different colours represent different alleles. Both effects result in loss of allelic diversity (adapted from Jobling et al. 2004).
17 For further knowledge on the NF1 gene, please, consult Chapter I of the present thesis.
65
CHAPTER II Population Studies
Another study by Behar et al. (2004) tested the effects of a maternal bottleneck on the
Ashkenazi Jewish population. They analysed mtDNA in 565 Ashkenazi Jews from
different parts of Europe. Their results showed that while several Ashkenazi Jewish
mtDNA haplogroup appear to derive from the Near-east, there is also evidence for a low
level of introgression from host European non-Jewish populations. The diversity
patterns obtained provide evidence for a prolonged period of low effective size in the
history of the Ashkenazi population. Overall, the data best fit a model of an early
bottleneck (~100 generations ago), perhaps corresponding to initial migrations of
ancestral Ashkenazi in the Near-east or to Europe. Behar et al. (2004) conclude that a
genetic bottleneck followed by the recent phenomenon of rapid population growth are
likely to have produced the conditions that led to the high frequency of many genetic
disease alleles in the Ashkenazi population. Another study by Kasperaviciute et al.
(2004) analysed the genetic composition of the Lithuanian population through mtDNA
and Y-chromosome markers. Significant differences between Lithuanian and Estonian
Y-chromosome STR haplotypes indicated that these populations have had different
demographic histories. Kasperaviciute et al. (2004) suggest that the observed pattern of
Y-chromosome diversity in Lithuanians may be explained by a population bottleneck
associated with Indo-European contact. Different Y-chromosome STR distributions in
Lithuanians and Estonians might be explained by different origins or, alternatively, be
the result of some period of isolation and genetic drift after the population split.
More recently and to explore the evolutionary forces that might have morphed human
genome architecture, Gherman et al. (2007) investigated the origin, composition, and
functional potential of “numts” (nuclear mitochondrial pseudogenes), partial copies of
the mitochondrial genome found abundantly in chromosomal DNA. Their data indicate
that these elements are unlikely to be advantageous, since they possess no gross
positional, transcriptional, or translational features that might indicate beneficial
functionality subsequent to integration. Using sequence analysis and fossil dating.
These authors also show a probable burst of integration of “numts” in the primate
lineage that centers on the prosimian–anthropoid split, mimics closely the temporal
distribution of Alu and processed pseudogene acquisition, and coincides with the major
climatic change at the Paleocene–Eocene boundary. Gherman and collaborators propose
a model according to which the gross architecture and repeat distribution of the human
genome can be largely accounted for by a population bottleneck early in the anthropoid
66
CHAPTER II Population Studies
lineage and subsequent effectively neutral fixation of repetitive DNA, rather than
positive selection or unusual insertion pressures.
The founder effect can be defined as what happens when a small group of individuals
leaves a larger population and establishes a new one. Hence, chance plays a important
role in determining which alleles are represented in the new population. The particular
alleles may not be representative of the larger population. As the new population grows,
the allele frequencies will usually continue to reflect the original small group (Zlotogora
2007; Jobling et al. 2004).
Founder populations have been the subject of complex disease studies because of their
decreased genetic heterogeneity, increased linkage disequilibrium and more
homogeneous environmental exposures. However, it is possible that disease alleles
identified in founder populations may not contribute significantly to susceptibility in
outbred populations (Zlotogora 2007; Laberge et al. 2005). Newman et al. (2004)
examined the Hutterites, a founder population of European descent, for 103
polymorphisms in 66 genes that are candidates for cardiovascular or inflammatory
diseases. The data revealed that this founder population is informative and offers
considerable advantages for genetic studies of common complex diseases. Hamet et al.
(2005) studied 120 extended families with at least one sib-pair affected with early-onset
hypertension and/ or dyslipidemia in the Saguenay-Lac-Saint-Jean (Quebec). They
observed founder effect over several generations and classes of living individuals. Other
studies (Rootsi et al. 2007; Kalaydjieva et al. 2005) demonstrated evidences of the
influence of founder effects in the genetic signature of the populations. For example,
Nebel et al. (2005) studying the Y-chromosome of Ashkenazi Jews demonstrated that of
the 495 Y-chromosomes, 57 (11.5%) were found to belong to R-M1718. The haplotype
structure, diversity and geographic distribution suggested a founder effect for this
haplogroup, introduced at an early stage into the evolving Ashkenazi community in
Europe. R-M17 chromosomes in Ashkenazi may represent vestiges of the mysterious
Khazars. In summary, the study of founder effects allows that traits transmitted through
generational lineage may be determined quantitatively within population subsets, thus,
accelerating the uncovering of causal haplotypes in complex diseases (Hamet et al.
2005).
18 According to the Y-Chromosome Consortium (http://ycc.biosci.arizona.edu) nomenclature the mutation R-M17
corresponds to R1a1* lineage.
67
CHAPTER II Population Studies
II.1.2.2. Selection
Natural selection, as defined by Darwin and elaborated by Fisher, is the differential
reproduction of genotypes in succeeding generations. Genotypic variation produces
individuals with varying capacities to survive and reproduce in different environments.
Selection can occur at any stage from the formation of a genotype at fertilization to the
individual generating viable progeny. Overall, it may include the (i) survival in
reproductive age, that is, viability and mortality; (ii) success in attracting a mate, i.e.
sexual selection; (iii) ability to fertilize, this is, fertility and gamete selection; and,
finally, (iv) number of progeny, i.e. fecundity (Nielsen 2005; Jobling et al. 2004). The
overall sum of these is the ability of an individual genotype to survive and reproduce, its
fitness, which is partly dependent on the environment. Relative fitness of a genotype
compared to other genotypes competing for the same resources is an important factor
when measuring selection. A selection coefficient of 0.1 represents a 10% decrease in
fitness of the genotype compared to the fittest one (Gilad et al. 2006; Jobling et al.
2004).
Simply, mutations that increase fitness undergo positive selection whereas mutations
that reduce the fitness are subject to negative selection, also known as purifying
selection. Positive selection has undoubtedly played a critical role in the evolution of
Homo sapiens. Of the many phenotypic traits that define our species, for example, the
enlarged brain, the advanced cognitive abilities, the complex vocal organs, bipedalism
and opposable thumbs, most are likely the product of strong positive selection.
Comparative genetics and genomics studies in recent years have uncovered a growing
list of genes that might have experienced positive selection during the evolution of
human and/ or primates (Wang et al. 2006; Voight et al. 2006; Sabeti et al. 2006).
These genes offer valuable insights into understanding the biological processes specific
to humans, and the evolutionary forces that gave rise to them.
However, to understand the dynamics of selection at diploid loci it should be considered
the impact of mutants on the fitness of the genotypes, and not on the individual alleles.
The two alleles within a diploid genotype can interact to determine the phenotypic
fitness of an organism in different ways. This in turn affects the efficiency of natural
selection in fixing or eliminating novel alleles (Nielsen 2005). For example, in
codominant selection, a novel deleterious allele will be eliminated more rapidly from
68
CHAPTER II Population Studies
the population if it reduces the fitness of the heterozygote, as well as, the homozygote.
Alternatively, in overdominant selection, a new allele may increase the fitness of an
heterozygote relative to that of both homozygotes. The two homozygous genotypes may
exhibit different reductions in fitness creating a balanced polymorphism. On contrary,
underdominant selection operates where new alleles reduce the fitness of the
heterozygote alone. Other processes, besides overdominant selection, can create a
balancing selection, for example, frequency-dependent selection, where the frequency
of a genotype determines its fitness. If a genotype has higher fitness at low frequencies
but lower fitness at higher frequencies, an intermediate equilibrium value will be
reached over time (Charlesworth 2006; Krawczak and Zschocke 2003). The major
histocompatibility complex (MHC) locus has been suggested to be under both
frequency-dependent and overdorninant selection (Muller-Hilke and Mitchison 2006).
Other classic examples of balanced polymorphisms in humans are those that protect
against malaria19 when heterozygous, but have a reduced fitness compared to wild-type
when homozygous. A number of these types of balanced polymorphisms have arisen in
different areas of malarial endemicity (Polley et al. 2007; Verra et al. 2006).
Changes in genetic regulation contribute to adaptations in natural populations and
influence susceptibility to human diseases. Despite their potential phenotypic
importance, the selective pressures acting on regulatory processes and gene expression
are largely unknown. Studies in model organisms suggest that the expression levels of
most genes evolve under stabilizing selection, although a few are consistent with
adaptive evolution (Gilad et al. 2006). Nonetheless, it has been proposed that gene
expression levels in primates evolve largely in the absence of selective constraints.
Gilad et al. (2006) demonstrated that stabilizing selection is likely to be the dominant
mode of gene expression evolution. An important implication is that mutations affecting
gene expression will often be deleterious and might underlie many human diseases.
Tishkoff et al. (2007) conducted a genotype-phenotype association study in 470
Tanzanians, Kenyans and Sudanese and identified three SNPs (G/C-14010, T/G-13915
19 Malaria is a potentially deadly tropical disease characterized by cyclical bouts of fever with muscle stiffness,
shaking and sweating. It is caused by a parasite of the Plasmodium genus that is transmitted by the female mosquito of Anopheles genus (for review, please, see Conway 2007).
69
CHAPTER II Population Studies
and C/G-13907) that are associated with lactase persistence20. These SNPs also show
derived alleles that significantly enhance transcription from the lactase (LCT) promoter
in vitro. Genotyping across a 3 Mb region demonstrated haplotype homozygosity
extending >2.0 Mb on chromosomes carrying C-14010, consistent with a selective
sweep over the past, approximately 7,000 years. Overall, they conclude that these data
provide a marked example of convergent evolution due to strong selective pressure
resulting from shared cultural traits, animal domestication and adult milk consumption.
The identification of signals of very recent positive selection provides information about
the adaptation of modern humans to local conditions (Voight et al. 2006). Voight and
colleagues (2006) report a genome-wide scan for signals of very recent positive
selection in favor of variants that have not yet reached fixation. They observed in three
continental groups widespread signals of recent positive selection. Most signals are
region-specific, though a significant excess are shared across groups. Contrary to some
earlier studies that suggested a paucity of recent selection in subSaharan Africans, they
found that the strongest signals of selection were from the Yoruba population. Finally,
these authors conclude that since the signals suggest the existence of genetic variants
that have substantially different fitnesses, it must indicate loci that are the source of
significant phenotypic variation. Though the relevant phenotypes are generally not
known, such loci should be of particular interest in mapping studies of complex traits.
II.1.2.3. Mutation and recombination
Mutation is the process generating new alleles. It provides the raw material on which
selection and the other forces of evolution can act. There are a broad variety of
mutational changes, and these occur at varying rates. Each mutation is a single change
occurring in a single cell. Evolutionary consequences only follow from those changes
that occur in the germline, and not those in somatic tissues, as somatic mutations are not
20 The enzyme lactase, located in the villus enterocytes of the small intestine, is responsible for digestion of lactose in
milk. Lactase activity is high and vital during infancy, but in most mammals, including most humans, lactase activity declines after the weaning phase. In other healthy humans, lactase activity persists at a high level throughout adult life, enabling them to digest lactose as adults. This dominantly inherited genetic trait is known as lactase persistence. The distribution of these different lactase phenotypes in human populations is highly variable and is controlled by a polymorphic element cis-acting of the lactase gene (2q21, for revision, please, see Sibley 2004).
70
CHAPTER II Population Studies
heritable. The dynamics of many types of mutations vary between the soma and the
germline. Because of the fidelity of DNA polymerases and the operation of DNA repair
mechanisms, germline mutations occur at low rates for individual nucleotides, although
they are inevitable in every replication cycle. It has been estimated that every human
carries, on average, 128 new mutations (Giannelli et al. 1999).
In the absence of other processes, an allele will decrease in frequency as it accumulates
mutations, a phenomenon known as mutation pressure. By knowing the mutation rate
for the whole gene (µ), the initial allele (P0) frequency, assuming no back mutation and
ignoring stochastic processes, the allele's frequency (pt) t generations later is calculated
by:
pt=p0e-µt
At low mutation rates, mutation pressure is a weak force that can only have appreciable
impact over long time scales. After 1000 generations, the wild-type allele of a gene 1
kb in size with a per generation nucleotide mutation rate of 2x10⁻⁹ will only decrease in
frequency from 1.0 to 0.998 (Jobling et al. 2004). However, the possibility of back
mutations and recurrent mutations was not analysed. If we consider a gene 1 kb in
length then the number of possible alleles is enormous, 41000. The probability of back
mutations and recurrent mutations is correspondingly small. This model is known as
the infinite alleles model (IAM; Crow and Kimura 1970). On the other hand,
considering the evolution of a polymorphic microsatellite, oscillating in size by number
of repeats, the opportunity for back mutation and recurrent mutation is much higher
than for SNPs. Thus, the IAM does not always appear to be a close approximation of
biological reality. Therefore, it is necessary different models for different types of
mutation. The stepwise mutation model (Ohta and Kimura 1973) provides a better fit to
microsatellite evolution. According to this model, mutation increase and decrease allele
length by one unit with equal probability (Hartl and Clark 1997; Jobling et al. 2004).
Initially, the SMM considered single-step changes only, but there is good empirical
evidence for a lower rate for multiple step mutations which the model can account for
(Di Rienzo et al. 1994). There are, however, other known aspects of microsatellite
evolution not incorporated within the SMM model, for example, the (i) positive
correlation between allele length and mutability; (ii) lower length threshold under which
mutation rate becomes undetectable; (iii) possible small bias towards expansions of
71
CHAPTER II Population Studies
short alleles, resulting in an increase in size of the microsatellite; (iv) possible
preference for deletions rather than expansions in longer alleles, producing an
equilibrium in allele length; and (v) massive expansions in triplet repeat diseases and
consequent negative selection. Other types of mutations, such as, rearrangements and
GC-rich minisatellites, do not fit any of the above models. Considering other aspects of
sequence evolution it is necessary to suppose that several changes might have occurred
at the same site, then more complex models of mutation must be developed. For
example, it could be necessary to consider the probability that an A will mutate to a C
and then subsequently back from a C to an A again. These models come into play when
considering sequence evolution over long time scales, where back mutations result in
the observed sequence divergence being an underestimate of the real number of
mutational changes. In the simplest model all nucleotide substitutions occur at the same
rate, while the most complex model allows a different rate for each nucleotide change.
These models can be represented as a substitution scheme and as a probability matrix.
The simplest example is known as the Jukes-Cantor model (JC, Jukes and Cantor 1969),
and one of the more complex models is the general reversible model (REV). There are a
number of intermediate models that contain some, but not all, of the complexity of the
REV model (Jobling et al. 2004; Hartl and Clark 1997). The frequency of each
nucleotide clearly influences the probability of nucleotide changes averaged over an
entire sequence. For example, an A to G transition may have the same rate as a C to T
transition, but if there are twice as many Cs in a sequence then the probability of an A to
G occurring within the sequence is not the same as that of a C to T. The JC model does
not take potential bias in base composition into account, but the REV model does
(Jobling et al. 2004; Hartl and Clark 1997).
Another process generating diversity is meiotic recombination which is a consequence
of sexual reproduction, and enhances the ability of populations to adapt to their
environment through the combining of advantageous alleles at different loci.
Recombination generates new combinations of alleles on the same DNA molecule,
known as haplotypes and in this way increases haplotype diversity. Consequently,
recombination is capable of breaking up advantageous allelic combinations.
Theoretically, by increasing the likelihood of disrupting a beneficial haplotype,
outbreeding can result in a drop in fitness known as outbreeding depression. While
alleles at loci on different chromosomes are randomly segregated during meiosis,
72
CHAPTER II Population Studies
alleles at loci closely linked on the same chromosome are not, as recombination
between them occurs infrequently (Jobling et al. 2004; Hartl and Clark 1997).
In comparison to mutation models, recombination models have traditionally been
relatively simple. The simplest model is that the rate of recombination is uniform. In
other words, the probability of a crossover occurring between a pair of markers is
determined only by the physical distance that separates them. The products of this type
of recombination event are two new haplotypes containing contiguous stretches of
alleles from each ancestral haplotype. Empirical studies of recombination in humans
and model organisms have revealed two biological properties of recombination that
conflict with the simplest model of recombination, this is, not every recombination
event results in a crossover (Jobling et al. 2004; Hartl and Clark 1997; Hellenthal and
Stephens 2006; Spencer et al. 2006).
Recombination rates are not uniform along a segment of DNA. Crossovers appear to be
concentrated in hotspots between which are regions recombinationally inert. At larger
scales, recombination rates vary along the chromosome in ways that are only now being
elucidated, but are often low near centromeres and high near telomeres (Jobling et al.
2004; Hartl and Clark 1997; Hellenthal and Stephens 2006). In humans, the rate of
recombination, as measured on the megabase scale, is positively associated with the
level of genetic variation, as measured at the gene scale. Despite considerable debate, it
is not clear whether these factors are causally linked or, if they are, whether this is
driven by the repeated action of adaptive evolution or molecular processes, such as,
double-strand break formation and mismatch repair (Spencer et al. 2006). Spencer and
colleagues (2006) introduced three innovations to the analysis of recombination and
diversity: (i) fine-scale genetic maps estimated from genotype experiments that identify
recombination hotspots at the kilobase scale, (ii) analysis of an entire human
chromosome, and (iii) the use of wavelet techniques to identify correlations acting at
different scales. They show that recombination influences genetic diversity only at the
level of recombination hotspots. Hotspots are also associated with local increases in
GC-content and the relative frequency of GC increasing mutations but have no effect on
substitution rates. Broad-scale association between recombination and diversity is
explained through covariance of both factors with base composition. These results
73
CHAPTER II Population Studies
evidence a direct and local influence of recombination hotspots on genetic variation and
the fate of individual mutations (Lindsay et al. 2007).
II.1.2.4. Migration or gene flow
Migration, often used as a synonym for gene flow, is probably the most powerful
microevolutionary factor leading to the uniformity of populations characteristics.
Theory predicts that whenever the relative weight of gene flow exceeds that of drift, as
is to be expected in modern human populations (Morton 1982), the frequencies of a
neutral allele at equilibrium will be distributed unimodally (Wright 1921). However, the
equilibrium distribution is established slowly and, as a consequence, sharper genetic
change may be expected in the regions in which past gene flow has been inefficient to
eliminate pre-existing genetic differences (Sokal et al. 1989; Barbujani et al. 1989).
Gene flow has, therefore, relied upon indirect methods that relate measures of
population subdivision to gene flow via a model for the population structure. Unlike
genetic drift, mutation and selection, migration cannot change species allele
frequencies, but it is capable of changing allele frequencies within a subpopulation. In
general, gene flow is the outcome when a migrant contributes to the next generation in
their new location, and migration is the movement from one occupied area to another.
Thus, to observe gene flow directly it is necessary to monitor the movement of migrants
and their reproductive success.
The simplest model of gene flow is the island model devised by Sewall Wright. A
metapopulation is split into “islands” of equal size N, which exchange genes at the same
rate, m, per generation. The assumptions of the island model include: (i) no
geographical substructure apart from the division into islands – all islands are
equivalent, (ii) each population persists indefinitely, (iii) no mutation, (iv) no selection,
(v) each population has reached equilibrium between mutation and genetic drift, and (vi)
the migrants are a random sample from the source “island”.
The stepping-stone model (Kimura and Weiss 1964) removes from the “island” one the
lack of geographic substructure. The stepping-stone introduces the idea of geographical
distance by only allowing the exchange of genes between adjacent discrete
74
CHAPTER II Population Studies
subpopulations. This model also assumes equal rates of migration between
subpopulations. Both models have been used to show that even very low rates of
migration between subpopulations are capable of retarding their genetic differentiation
(Jobling et al. 2004; Hartl and Clark 1997).
Migration can be modelled as occurring within a continuous population, rather than
discrete subpopulations, by considering that mating choices are limited by distance, and
that these distances are typically less than the overall range of the population. This is the
basis for isolation by distance model (IBDM, Wright 1943; Malécot 1950). Within such
model, genetic similarity develops in neighbourhoods as a function of dispersal
distances, for example, parent birthplaces. Neighbouring populations frequently
exchange individuals by an ongoing process of bi-directional migration. However, a
third, hybrid population does not usually result from this kind of exchange. The term
admixture is often reserved for the formation of a hybrid population from the mixing of
ancestral populations that have previously been in relative isolation from one another.
The range expansion of one population into a region inhabited by a previously isolated
population is one of such scenario. Therefore, admixture can be thought as being
initiated at a specific point in time, when the populations first came into contact. When
we examine modern populations, we detect not simply the proportions of admixture
established when the populations first met, but the summation of cumulative gene flow
from when they first met to the present-day (Price et al. 2007; Mao et al. 2007). Thus,
the consequences of admixture and gene flow may be difficult to distinguish. Naturally,
the imprint of past admixture in modern populations has also been modified by drift,
selection and mutation processes.
The isolation and expansion that result in subsequent admixture can be driven by
environmental changes. During the recent ice ages, the environment at more northerly
latitudes became uninhabitable. Humans and other plant and animal species found
refuge in more hospitable climate, known as “glacial refugia”. These refugia were often
isolated from one another. For example, it is known three major European glacial
refugia: the Iberian Peninsula, Italy and the Balkans. After the end of the last ice age,
many species started the long process of re-colonizing the more northerly latitudes from
these refugia. During this period, many previously isolated populations were in contact
75
CHAPTER II Population Studies
with each other, therefore, the genetic consequences can be analyzed through admixture
(Rootsi et al. 2004; Iriondo et al. 2003; Torroni et al. 2001; Jobling et al. 2004).
Admixture shapes genetic diversity in a number of different ways. Our ability to detect
admixture depends in part on how differentiated the source populations were from one
another, the more different the ancestral populations were, the easier it is to detect
admixture. There are some problems with the assessment of admixture in a single
genome, some alleles may have their ancestry in one parental population while other
alleles have their ancestry in another. This is a consequence of sexual reproduction and
diploidy. In fact, it is highly unlikely that any individual in an admixed population will
be able to trace all their genes to a single source population; different genomes within
an admixed population are likely to exhibit differing amounts of admixture. Thus, an
estimate of population admixture can only be an average of the admixture among the
individual genomes within it (Jobling et al. 2004; Price et al. 2007; Mao et al. 2007).
All generic admixtures will lead to a variety of phenotypic effects. Any quantitative trait
that is generically encoded and well differentiated between populations will be altered
in admixed populations. In societies where surnames follow clear lines of inheritance,
they have often been used for population genetic analyses as mentioned in Chapter I of
the present thesis. Admixture studies are no exception. Patterns of surname
introgression have been clearly shown to be correlated with levels of admixture in a
number of different populations (Chakraborty 1986; McEvoy et al. 2006). These
conclusions have subsequently been reinforced by genetic typing. Nevertheless,
surname analysis is useful when admixture has occurred within the timeframe of
surname usage, which varies greatly from population to population, and may be very
recent. However, if records are detailed enough, surname analysis can reveal how
admixture processes may have changed over time (Jobling et al. 2004).
Disease prevalences are often clearly different between ancestral populations. An
obvious medical consequence of admixture is that the hybrid population is expected to
have disease prevalence’s for Mendelian disorders that are intermediate between those
of the ancestral populations. When the most frequent diseases differ between the
populations, this can lead to an overall lowering of the disease burden through a
reduction in the probability of having two parents carrying the same deleterious
recessive allele (Jobling et al. 2004; Alegre et al. 2007).
76
CHAPTER II Population Studies
II.2. Genetic distance and population structure
II.2.1. Genetic distance measures
Measures of genetic distance are statistics that allow us to compare the relatedness of
populations or molecules (Jobling et al. 2004). The greater the evolutionary distance
between them, the greater the value of the statistic. If a measure is greater between
population A and B than between C and D, we can say that C and D are more closely
related than are A and B. Such measures allow the exploration of population structure
and molecular diversity in greater detail, by pairwise comparisons, rather than by
averaging over all populations or molecules. Additionally, it is possible to convert
distance measures to an evolutionary time scale (Jobling et al. 2004), and observations,
such as, C and D share a more recent common ancestor than A and B are probable.
Conversely, genetic distance measures also allow the construction of phylogenies of
populations or molecules (e.g. Kumar et al. 2007; Khan et al. 2007).
There are a number of commonly used measures of genetic distances between
populations. Despite the abundance of measures, which arose in response to different
data types and different expectations about evolutionary processes. For example,
diversity data from markers with a high mutation rate may be analyzed with a genetic
distance measure that emphasizes the contribution of mutational processes to population
divergence (Jobling et al. 2004). If we consider two populations X and Y with the
frequency of the ith allele being xi and yi, respectively, the simplest measure of genetic
distance between them sums the difference between the allele frequencies, Σ(xi-yi). This
needs to be squared to avoid differences in sign, Σ(xi-yi)2. However, sufficient weight to
alleles with frequencies close to 0% or 100% is not given. Two commonly used
classical measures of genetic distance are FST and Nei's standard genetic distance, D
(Nei 1973). Both of these vary between 0 (for identical populations), and 1 (for
populations that share no alleles). For use as a genetic distance, FST is specifically
formulated for two populations and can be defined as:
FST=Vp/p(1-p)
where p and Vp are the mean and variance of gene frequencies between the two
populations, respectively. This is just a weighted form of the simple measure considered
above, that increases the influence given to alleles that are almost fixed (p~100%) or
77
CHAPTER II Population Studies
barely polymorphic (p~0%). Nevertheless, there are a variety of different methods for
estimating FST. Nei's standard genetic distance, D, relates the probability of drawing two
identical alleles from the two different populations (which is Σxiyi) to the probability of
drawing identical alleles from the same population Σ(xi2 and yi
2) by the following
equation:
D=-ln(Σxiyi/Σxi2(yi
2)1/2)
By making assumptions about the processes that are driving the divergence of
populations, we can relate distance measures to absolute time. This relationship can
then be used to generate a corrected version of the statistic that can be shown, under
certain assumptions, to be linear with respect to evolutionary time (Khaitovich et al.
2005; Ayub et al. 2003). However, bottlenecks and migration can disrupt the linear
relationship between a given genetic distance measure and time. Linearity of the genetic
distance measure is a useful property especially when constructing phylogenies. The
other major property that affects the usefulness of a measure is its variance: the lower
the variance of the statistic, the higher the confidence (Jobling et al. 2004). Whatever
measure of genetic distance between populations is used, its significance must be tested,
i.e. determine if the distance is significantly different from zero. This is especially
important for human populations, which are often closely related (Jobling et al. 2004).
II.2.2. Population structure and inbreeding
Genetic subdivision or structure affects both the evolution and the persistence of
populations. For instance, subdivision has been shown to have an important effect on
the probability of fixation of beneficial and deleterious alleles, the evolution of mating
systems or the probability of population extinction. One of the reasons of this influence
is that subdivision changes the way in which the different evolutionary processes
(selection, genetic drift, mutation and migration) act on allele frequency, compared to a
continuous population. As a result, the population's genetic load (i.e. the decline in
fitness due to accumulation of deleterious alleles) can be strongly determined by
population structure (Glémin et al. 2003).
Subdivision can vary in several ways, including the size and the number of the
subpopulations and the rate of migration between subpopulations. Changes in these
parameters can significantly modify the balance between drift and selection within
78
CHAPTER II Population Studies
subpopulations and, thus, genetic load: (i) for slightly deleterious and partially
recessive alleles, subpopulation size determines both the response to selection and the
strength of genetic drift; larger subpopulations should be associated with lower
frequencies of deleterious alleles; (ii) migration between subpopulations restores
genetic variability within subpopulations, enhancing selection; and (iii) the number of
subpopulations influences population genetic variance. Increasing the number of
subpopulations should result in a higher genetic differentiation between them and, thus,
a higher potential for fitness to be restored by migration. It is also interesting to note
that subdivision can have variable effects according to the characteristics of deleterious
mutations. For instance, genetic variance within subpopulations could decrease for
nearly additive alleles but it can increase for highly recessive alleles.
Population subdivision results in the loss of genetic variation within subpopulations due
to evolutionary forces. This means that population subdivision would result in
decreased heterozygosity relative to the expected heterozygosity under random mating
as if the whole population was a single breeding unit. Wright developed three fixation
indexes to evaluate population subdivision: FIS (Individual within the Subpopulation),
FST (Subpopulation within the Total population) and FIT (Individual within the Total
population). FIS is a measure of the deviation of genotypic frequencies from panmictic
frequencies in terms of heterozygous deficiency or excess. It is what is known as the
inbreeding coefficient, which is conventionally defined as the probability that two
alleles in an individual are identical by descent. The technical description is the
correlation of uniting gametes relative to gametes drawn at random from within a
subpopulation averaged over subpopulations. It is calculated in a single population as:
FIS=HEXP-HOBS/HEXP
where HOBS is the observed heterozygosity and HEXP is the expected heterozygosity
calculated on the assumption of random mating (Hartl and Clark 1997). It shows the
degree to which heterozygosity is reduced below the expectation. Compared with HWE
expectations, the value of FIS ranges between -1 and +1. Negative FIS values indicate
heterozygote excess (outbreeding), and positive values indicate heterozygote deficiency
(inbreeding). Additionally, FST measures the reduction in heterozygosity in a
subpopulation. FST is the most inclusive measure of population substructure and the
most useful for examining the overall genetic divergence among subpopulations. Also
79
CHAPTER II Population Studies
called coancestry coefficient (Weir and Cockerham 1984) or “fixation index”, it is
defined as correlation of gametes within subpopulations relative to gametes drawn at
random from the entire population. Its calculation is performed by using the
subpopulation average heterozygosity and total population expected heterozygosity. FST
is always positive; it ranges between 0 (panmixia: no subdivision, random mating and
no genetic divergence within the population) and 1 (complete isolation: extreme
subdivision). FST values up to 0.05 indicate negligible genetic differentiation, whereas
>0.25 means very great genetic differentiation within the population analyzed (Hartl
and Clark 1997). FST is usually calculated for different genes, and then averaged across
all loci and all populations. Using the FST values, less differentiation is seen between
human populations within continents than between continents, which is consistent with
simple isolation by distance. This highly versatile parameter is also used as a genetic
distance measure between two populations instead of a fixation index among many
populations (Weir 1996). FIT is rarely used. It is the overall inbreeding coefficient of an
individual relative to the total population.
One process that contributes to population subdivision is inbreeding. Inbreeding and
assortative mating are deviations from the Hardy-Weinberg assumption of random
mating. It results from mating between relatives, and is probably the most common
deviation from the Hardy-Weinberg model (Jobling et al. 2004; Hartl and Clark 1997).
Assortative mating, like inbreeding, leads to non-random patterns of mating; however,
the basis for assortative mating is not relatedness but phenotypic similarity or
dissimilarity. Both processes sort existing variation, altering genotypic frequencies
within populations. Except in extreme cases, inbreeding and assortative mating do not
dramatically alter allele frequencies. Nevertheless, their consequences for the evolution
of populations can be highly significant. True inbreeding is the deviation from random
mating within an individual population. Because inbreeding involves disproportionate
mating between relatives, its effect is to increase homozygosity across all loci. One
observable consequence of inbreeding is that the proportion of heterozygotes is
significantly lower than expected under the HWE model across multiple loci (Jobling et
al. 2004; Hartl and Clark 1997). Population size can also greatly impact the extent and
rate of loss of heterozygosity. In large populations, most individuals are effectively
unrelated, so the effect of inbreeding decreases rapidly as average relatedness among
individuals decreases (Jobling et al. 2004; Hartl and Clark 1997).
80

CHAPTER II Population Studies
Inbreeding can be calculated most directly through pedigree analysis, though this is
often not possible in natural populations. Alternatively, we can estimate it indirectly
from the observed alleles and genotypic frequencies, as the frequency of heterozygotes
observed relative to that expected under HWE (2pq). In this way, then, inbreeding is a
measure of the fractional reduction in heterozygosity relative to a panmictic population
with the same allele frequencies.
81
“The human genome underlies the fundamental unity of all members of the human family, as well as the recognition of their inherent dignity and diversity. In a symbolic sense, it is the heritage of humanity.”
Universal Declaration on the
Human Genome and Human Rights
CHAPTER III
GENETIC ISOLATES VERSUS OUTBRED POPULATIONS
82
CHAPTER III Genetic Isolates vs Outbred Populations
III. Genetic isolates versus outbred populations
The question “Are genetic isolated populations more useful for the mapping of genes
than outbred populations?” is still a subject of large discussion in the scientific
community21. Some researchers have argued that small isolated populations are valuable
for linkage and LD mapping, whereas others have argued that populations are only ideal
when they have maintained constant size throughout much of their history and others
find no advantage in isolated populations. It is clear that the appearance of
biotechnologies that allow the genome-wide genotyping of large quantities of markers,
at a relatively low cost per sample, played an evident role in the decrease in the
importance of human genetic isolates.
Generally, genetic isolates are subpopulations resulting from the founder effect of a
small number of individuals as a consequence of bottleneck. These populations exist in
geographical, cultural or geographical and cultural context over many generations
without genetic interchange from other subpopulations. In recent years, there has been
success in mapping genes causing several diseases, mainly those exhibiting rare
classical Mendelian recessive models of inheritance, essencially through linkage
analysis. The initial successes, which came by studying isolated populations, such as,
the Finnish and the Old Order Amish, have exponentially increased the interest in these
kinds of populations (Arcos-Burgos and Muenke 2002 and references therein). Some of
these successfully mapped diseases include, for example, gyrate atrophy of choroids and
retina22 (HOGA; Mitchell et al. 1988), retinoschisis23 (Alitalo et al. 1987) and Uscher
syndrome type III24 (Sankila et al. 1995) in the Finnish population and bipolar disorder
21 Since 2003, with a two year interval, an international meeting entitled “Genetic of complex diseases and isolated
populations” occurs to discuss the use of isolated populations in human genetics. In 2007, it was held, in the city of Turim, Italy, the 3rd meeting. For further information, please, consult the website: http://www.fobiotech.org/geneticisolates2007/home.html.
22 Gyrate atrophy of the choroid and retina is an autosomal recessive chorioretinal dystrophy that begins in childhood and leads to blindness in the fourth to seventh decade of life. The primary defect is deficiency of ornithine-delta-amino-transferase (10q26), which results in accumulation of ornithine (for revision, please, see Hasanoğlu et al. 1996).
23 Retinoschisis is an recessive X-linked genetic disease characterized by intraretinal splitting due to degeneration. The abnormality may not be clinically manifest until middle life. The retinoschisis gene (RS1; Xp22.2) encodes for a protein called retinoschisin (for revision, please, see Sikkink et al. 2007).
24 Usher syndrome type III is autosomal recessive disorder characterized by postlingual, progressive hearing loss, variable vestibular dysfunction, and onset of retinitis pigmentosa symptoms. Mutations in at least two genes are responsible for Usher syndrome type III; however, CLRN1 (3q25) is the only gene that has been identified. This gene codes for clarin 1 protein (for revision, please, see Roux 2005).
83
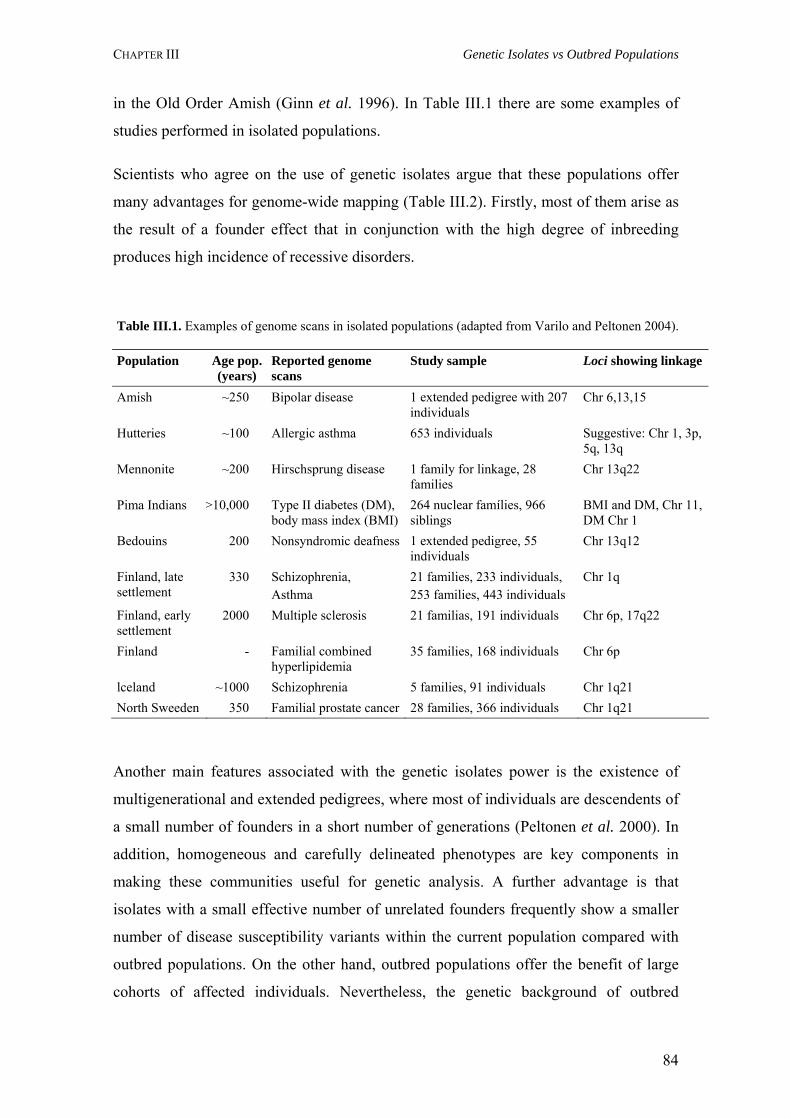
CHAPTER III Genetic Isolates vs Outbred Populations
in the Old Order Amish (Ginn et al. 1996). In Table III.1 there are some examples of
studies performed in isolated populations.
Scientists who agree on the use of genetic isolates argue that these populations offer
many advantages for genome-wide mapping (Table III.2). Firstly, most of them arise as
the result of a founder effect that in conjunction with the high degree of inbreeding
produces high incidence of recessive disorders.
Table III.1. Examples of genome scans in isolated populations (adapted from Varilo and Peltonen 2004).
Population Age pop. (years)
Reported genome scans
Study sample Loci showing linkage
Amish ~250 Bipolar disease 1 extended pedigree with 207 individuals
Chr 6,13,15
Hutteries ~100 Allergic asthma 653 individuals Suggestive: Chr 1, 3p, 5q, 13q
Mennonite ~200 Hirschsprung disease 1 family for linkage, 28 families
Chr 13q22
Pima Indians >10,000 Type II diabetes (DM), body mass index (BMI)
264 nuclear famílies, 966 siblings
BMI and DM, Chr 11, DM Chr 1
Bedouins 200 Nonsyndromic deafness 1 extended pedigree, 55 individuals
Chr 13q12
Finland, late settlement
330 Schizophrenia, Asthma
21 families, 233 individuals, 253 families, 443 individuals
Chr 1q
Finland, early settlement
2000 Multiple sclerosis 21 familias, 191 individuals Chr 6p, 17q22
Finland - Familial combined hyperlipidemia
35 families, 168 individuals Chr 6p
lceland ~1000 Schizophrenia 5 families, 91 individuals Chr 1q21 North Sweeden 350 Familial prostate cancer 28 families, 366 individuals Chr 1q21
Another main features associated with the genetic isolates power is the existence of
multigenerational and extended pedigrees, where most of individuals are descendents of
a small number of founders in a short number of generations (Peltonen et al. 2000). In
addition, homogeneous and carefully delineated phenotypes are key components in
making these communities useful for genetic analysis. A further advantage is that
isolates with a small effective number of unrelated founders frequently show a smaller
number of disease susceptibility variants within the current population compared with
outbred populations. On the other hand, outbred populations offer the benefit of large
cohorts of affected individuals. Nevertheless, the genetic background of outbred
84
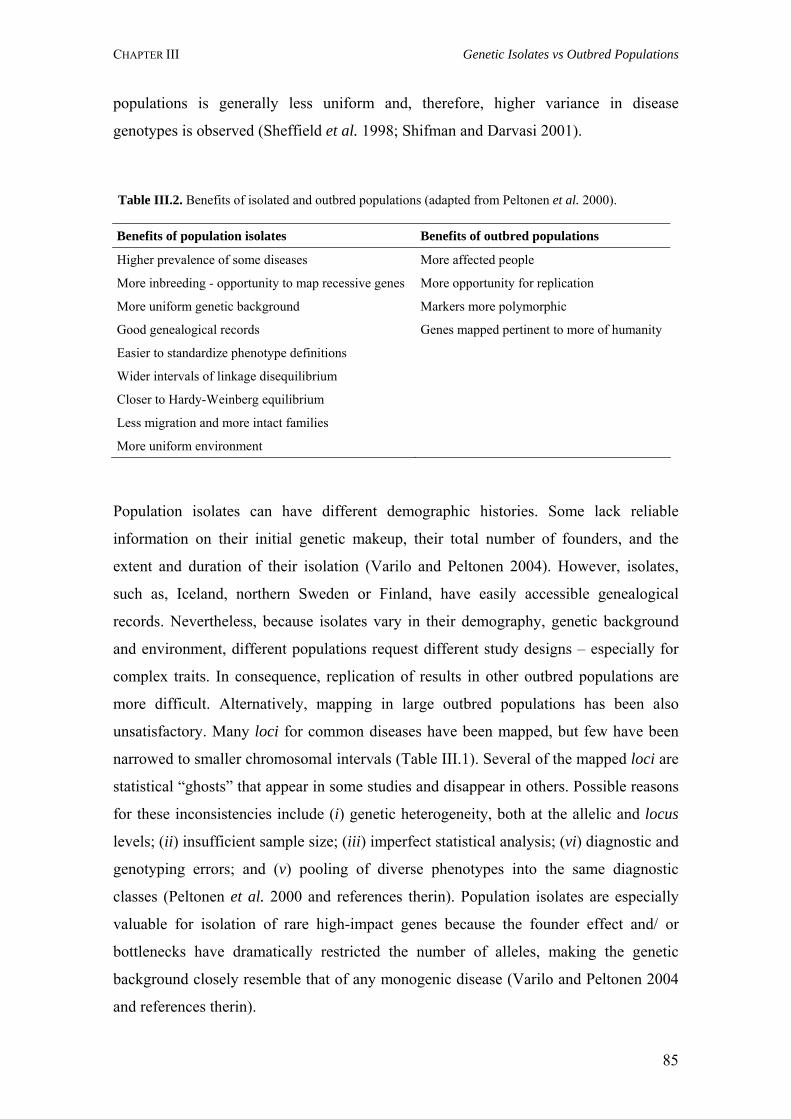
CHAPTER III Genetic Isolates vs Outbred Populations
populations is generally less uniform and, therefore, higher variance in disease
genotypes is observed (Sheffield et al. 1998; Shifman and Darvasi 2001).
Table III.2. Benefits of isolated and outbred populations (adapted from Peltonen et al. 2000).
Benefits of population isolates Benefits of outbred populations
Higher prevalence of some diseases More affected people
More inbreeding - opportunity to map recessive genes More opportunity for replication
More uniform genetic background Markers more polymorphic
Good genealogical records Genes mapped pertinent to more of humanity
Easier to standardize phenotype definitions
Wider intervals of linkage disequilibrium
Closer to Hardy-Weinberg equilibrium
Less migration and more intact families
More uniform environment
Population isolates can have different demographic histories. Some lack reliable
information on their initial genetic makeup, their total number of founders, and the
extent and duration of their isolation (Varilo and Peltonen 2004). However, isolates,
such as, Iceland, northern Sweden or Finland, have easily accessible genealogical
records. Nevertheless, because isolates vary in their demography, genetic background
and environment, different populations request different study designs – especially for
complex traits. In consequence, replication of results in other outbred populations are
more difficult. Alternatively, mapping in large outbred populations has been also
unsatisfactory. Many loci for common diseases have been mapped, but few have been
narrowed to smaller chromosomal intervals (Table III.1). Several of the mapped loci are
statistical “ghosts” that appear in some studies and disappear in others. Possible reasons
for these inconsistencies include (i) genetic heterogeneity, both at the allelic and locus
levels; (ii) insufficient sample size; (iii) imperfect statistical analysis; (vi) diagnostic and
genotyping errors; and (v) pooling of diverse phenotypes into the same diagnostic
classes (Peltonen et al. 2000 and references therin). Population isolates are especially
valuable for isolation of rare high-impact genes because the founder effect and/ or
bottlenecks have dramatically restricted the number of alleles, making the genetic
background closely resemble that of any monogenic disease (Varilo and Peltonen 2004
and references therin).
85
CHAPTER III Genetic Isolates vs Outbred Populations
Small constant size populations can be expected to exhibit LD over large genomic
regions and greatly reduced allelic and haplotype diversity, both due to genetic drift.
Consequently, such populations may be especially powerful for the initial phase of
mapping common trait loci, when adequate study samples are available (Peltonen et al.
2000; Kere 2001). In fine mapping studies a substantial advantage is gained by
accessing multiple populations with divergent demographic histories, despite practical
limitations. The long-range LD needed for coarse, genome-wide mapping of complex
traits can be found in carefully selected subpopulations, within an otherwise expanded
population (Shifman and Darvasi 2001).
Although there is some discordance in the scientific community, one fact that cannot be
neglected is that in some culturally and genetically isolated populations, it is possible to
monitor their similar environment, social customs and eating habits and, by reducing the
environmental “noise”, facilitate the detection of causative genetic and/ or
environmental factors. Moreover, the better the characteristics of the populations and
their history, the better are the opportunities to design the optimal strategy for disease
gene identification.
In the present chapter only a relatively brief description of human isolated populations
that are well characterized and constitute case-studies in human genetic isolates,
including the Finnish, the Sardinian, the Old Order Amish, the Hutterites and, finally,
the Saguenay-Lac-Saint-Jean population. It is not the intention to exemplify all isolated
populations reported in the literature and around the world.
III.1. The Finnish population
The demographic history of Finland is similar to many isolates, that is, a small number
of original founders followed by subsequent isolation, rapid expansion and major
bottlenecks have allowed genetic drift to shape its gene pool. Both Y-chromosomal
haplotypes and mitochondrial sequences show low genetic diversity among Finns
compared with other European populations and confirm the long-standing isolation of
Finland. The vast majority of Finns descend from two immigration waves occurring
about 4,000 and 2,000 years ago. The earlier wave involved eastern Uralic speakers and
the later Indo-European speakers from the south. The size of the founding population(s)
86
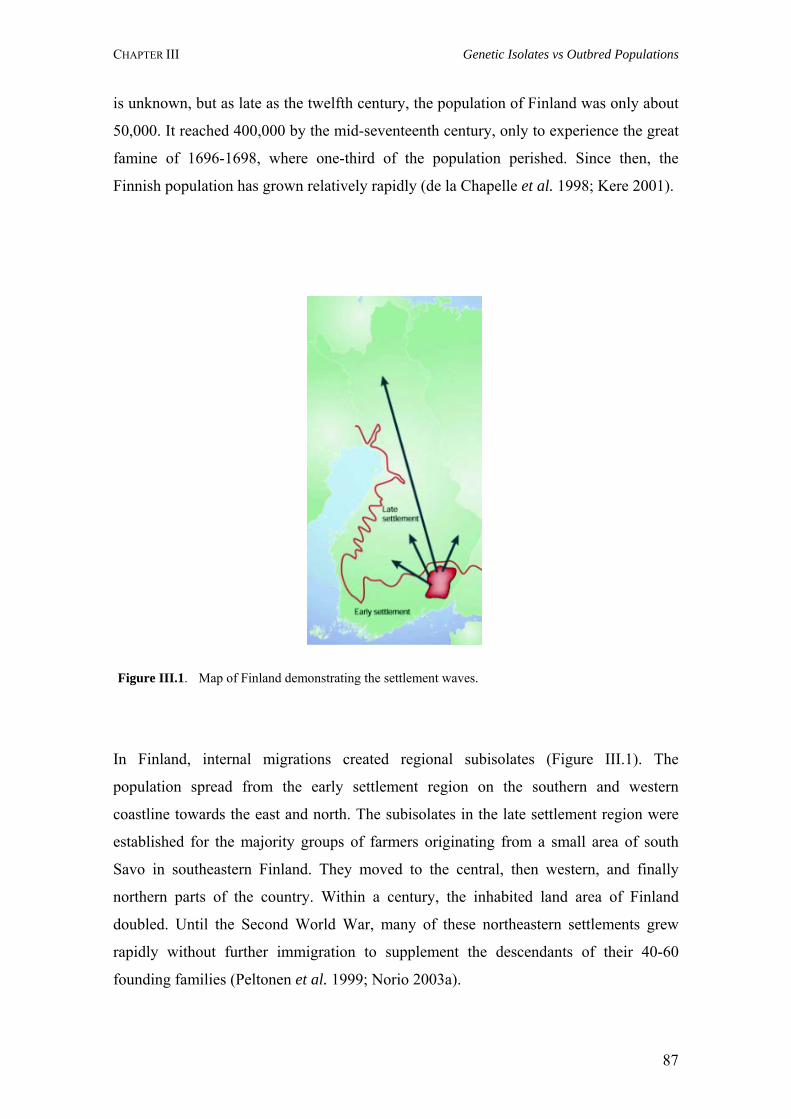
CHAPTER III Genetic Isolates vs Outbred Populations
is unknown, but as late as the twelfth century, the population of Finland was only about
50,000. It reached 400,000 by the mid-seventeenth century, only to experience the great
famine of 1696-1698, where one-third of the population perished. Since then, the
Finnish population has grown relatively rapidly (de la Chapelle et al. 1998; Kere 2001).
Figure III.1. Map of Finland demonstrating the settlement waves.
In Finland, internal migrations created regional subisolates (Figure III.1). The
population spread from the early settlement region on the southern and western
coastline towards the east and north. The subisolates in the late settlement region were
established for the majority groups of farmers originating from a small area of south
Savo in southeastern Finland. They moved to the central, then western, and finally
northern parts of the country. Within a century, the inhabited land area of Finland
doubled. Until the Second World War, many of these northeastern settlements grew
rapidly without further immigration to supplement the descendants of their 40-60
founding families (Peltonen et al. 1999; Norio 2003a).
87
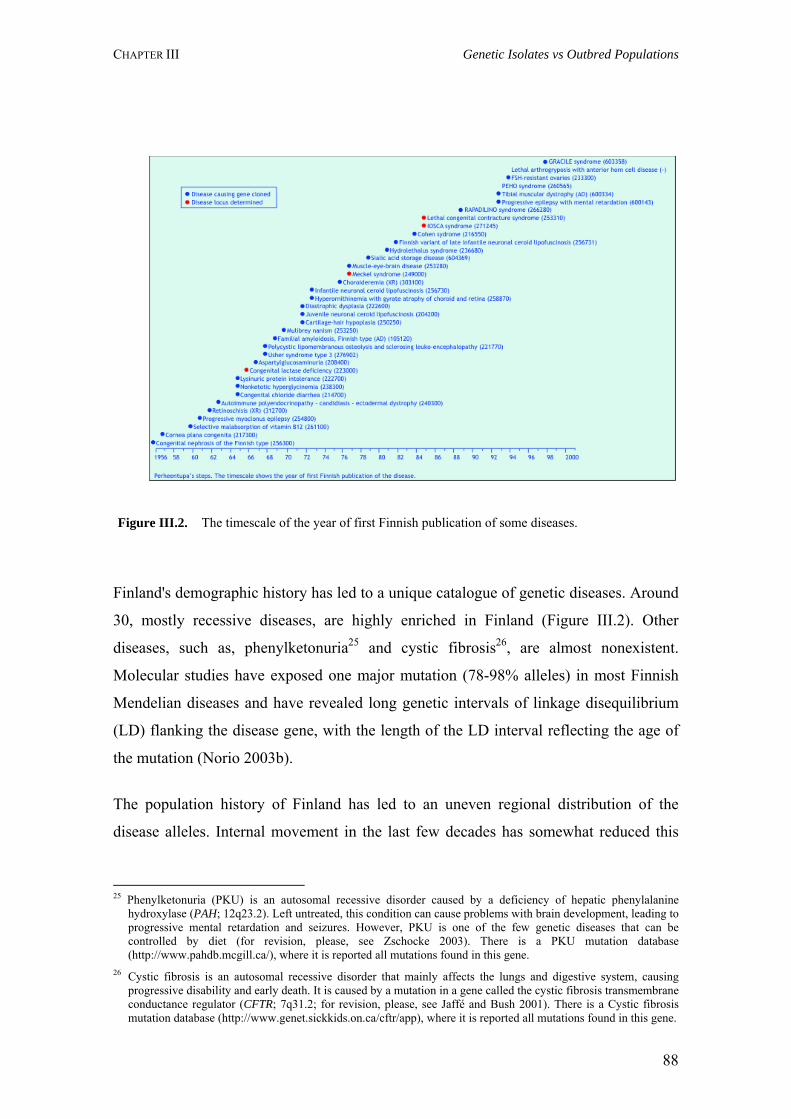
CHAPTER III Genetic Isolates vs Outbred Populations
Figure III.2. The timescale of the year of first Finnish publication of some diseases.
Finland's demographic history has led to a unique catalogue of genetic diseases. Around
30, mostly recessive diseases, are highly enriched in Finland (Figure III.2). Other
diseases, such as, phenylketonuria25 and cystic fibrosis26, are almost nonexistent.
Molecular studies have exposed one major mutation (78-98% alleles) in most Finnish
Mendelian diseases and have revealed long genetic intervals of linkage disequilibrium
(LD) flanking the disease gene, with the length of the LD interval reflecting the age of
the mutation (Norio 2003b).
The population history of Finland has led to an uneven regional distribution of the
disease alleles. Internal movement in the last few decades has somewhat reduced this
25 Phenylketonuria (PKU) is an autosomal recessive disorder caused by a deficiency of hepatic phenylalanine
hydroxylase (PAH; 12q23.2). Left untreated, this condition can cause problems with brain development, leading to progressive mental retardation and seizures. However, PKU is one of the few genetic diseases that can be controlled by diet (for revision, please, see Zschocke 2003). There is a PKU mutation database (http://www.pahdb.mcgill.ca/), where it is reported all mutations found in this gene.
26 Cystic fibrosis is an autosomal recessive disorder that mainly affects the lungs and digestive system, causing progressive disability and early death. It is caused by a mutation in a gene called the cystic fibrosis transmembrane conductance regulator (CFTR; 7q31.2; for revision, please, see Jaffé and Bush 2001). There is a Cystic fibrosis mutation database (http://www.genet.sickkids.on.ca/cftr/app), where it is reported all mutations found in this gene.
88
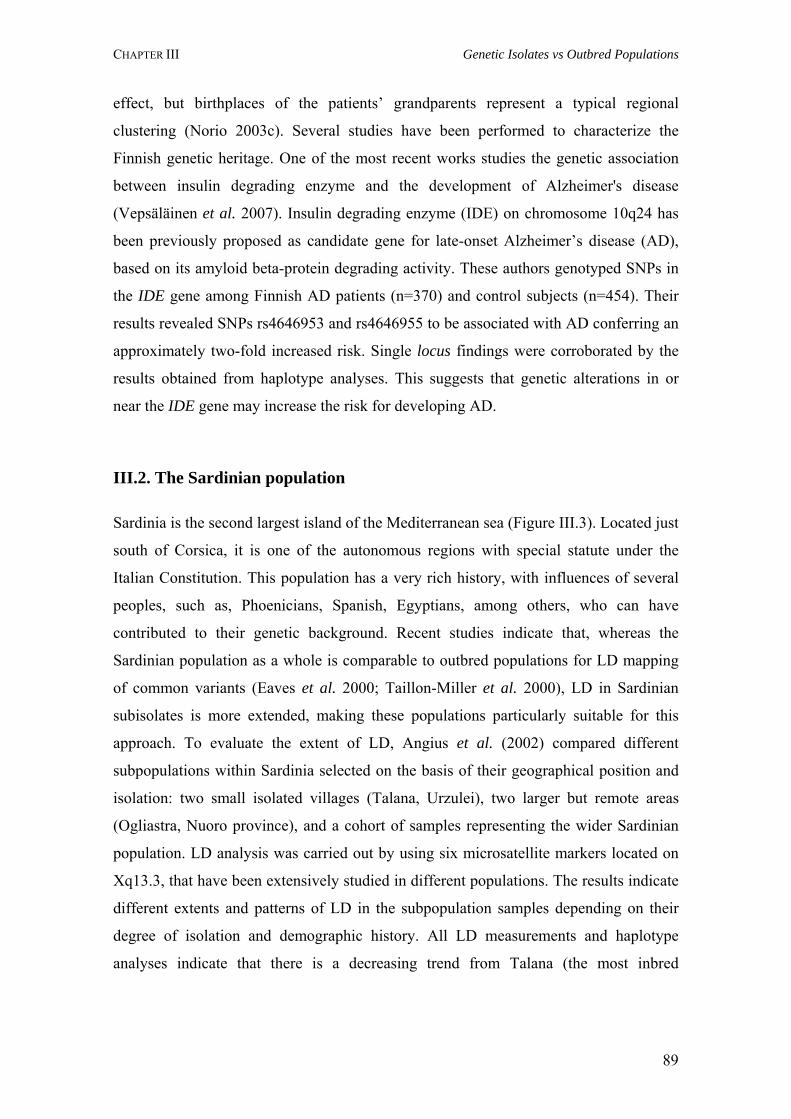
CHAPTER III Genetic Isolates vs Outbred Populations
effect, but birthplaces of the patients’ grandparents represent a typical regional
clustering (Norio 2003c). Several studies have been performed to characterize the
Finnish genetic heritage. One of the most recent works studies the genetic association
between insulin degrading enzyme and the development of Alzheimer's disease
(Vepsäläinen et al. 2007). Insulin degrading enzyme (IDE) on chromosome 10q24 has
been previously proposed as candidate gene for late-onset Alzheimer’s disease (AD),
based on its amyloid beta-protein degrading activity. These authors genotyped SNPs in
the IDE gene among Finnish AD patients (n=370) and control subjects (n=454). Their
results revealed SNPs rs4646953 and rs4646955 to be associated with AD conferring an
approximately two-fold increased risk. Single locus findings were corroborated by the
results obtained from haplotype analyses. This suggests that genetic alterations in or
near the IDE gene may increase the risk for developing AD.
III.2. The Sardinian population
Sardinia is the second largest island of the Mediterranean sea (Figure III.3). Located just
south of Corsica, it is one of the autonomous regions with special statute under the
Italian Constitution. This population has a very rich history, with influences of several
peoples, such as, Phoenicians, Spanish, Egyptians, among others, who can have
contributed to their genetic background. Recent studies indicate that, whereas the
Sardinian population as a whole is comparable to outbred populations for LD mapping
of common variants (Eaves et al. 2000; Taillon-Miller et al. 2000), LD in Sardinian
subisolates is more extended, making these populations particularly suitable for this
approach. To evaluate the extent of LD, Angius et al. (2002) compared different
subpopulations within Sardinia selected on the basis of their geographical position and
isolation: two small isolated villages (Talana, Urzulei), two larger but remote areas
(Ogliastra, Nuoro province), and a cohort of samples representing the wider Sardinian
population. LD analysis was carried out by using six microsatellite markers located on
Xq13.3, that have been extensively studied in different populations. The results indicate
different extents and patterns of LD in the subpopulation samples depending on their
degree of isolation and demographic history. All LD measurements and haplotype
analyses indicate that there is a decreasing trend from Talana (the most inbred
89
CHAPTER III Genetic Isolates vs Outbred Populations
Figure III.3. Map of Sardinia.
population, LD up to 9.5-11.5 Mb) to the more outbred Sardinian population (LD only
for intervals <2 Mb). In one village (Talana), five haplotype classes accounting for 80%
of the entire sample perfectly matched five Ogliastra clusters, supporting the origin of
the village from the Ogliastra genetic pool. In contrast, the other isolated village
(Urzulei) showed a different pattern of haplotypes with a closer relationship to the
Nuoro region subpopulation. LD analyses therefore show that even neighbouring isolate
villages may differ in their genetic background. These authors highlight the importance
of selecting appropriate populations and/ or subpopulations for the analysis of complex
traits. Isolated subpopulations showing different extents of LD can provide a powerful
method for mapping complex traits by LD scanning at relatively low marker density.
More recently, studies on the thiopurine S-methyltransferase (TPMT), which is an
enzyme involved in the normal metabolic inactivation of thiopurine drugs, demonstrated
that the Sardinians come out as outliers when compared with other European
populations, an observation consistent with previous genetic inferences that Sardinia has
90
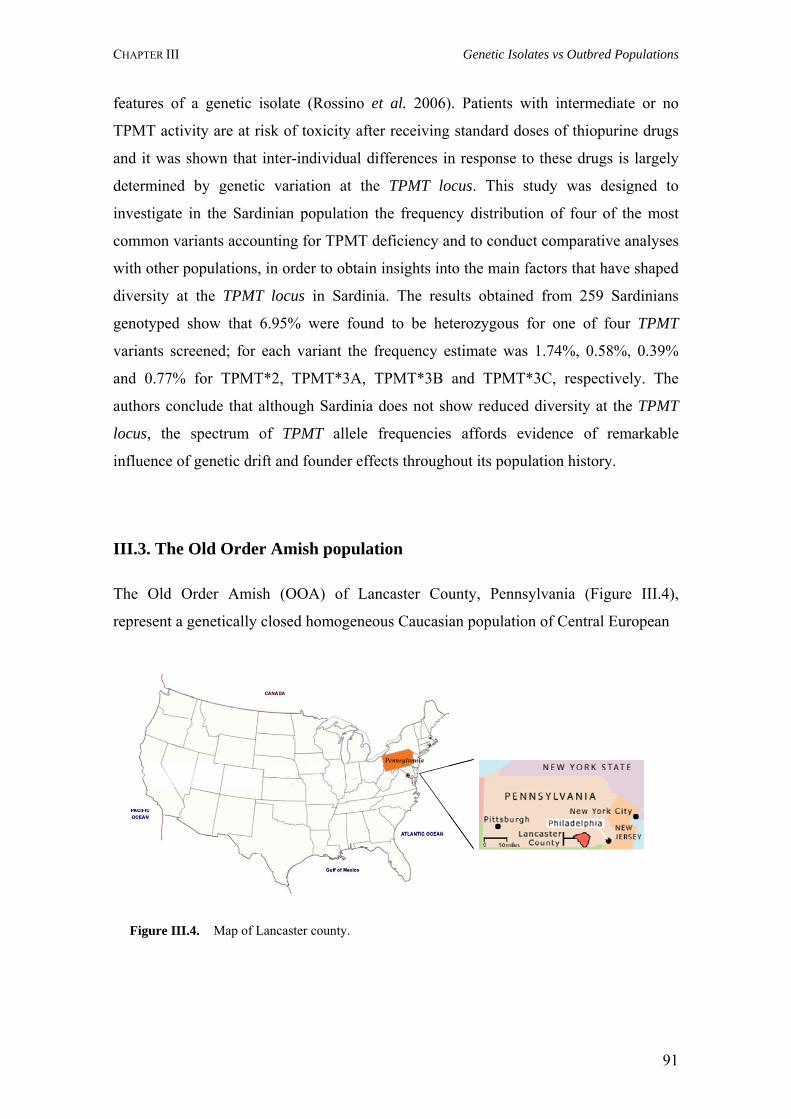
CHAPTER III Genetic Isolates vs Outbred Populations
features of a genetic isolate (Rossino et al. 2006). Patients with intermediate or no
TPMT activity are at risk of toxicity after receiving standard doses of thiopurine drugs
and it was shown that inter-individual differences in response to these drugs is largely
determined by genetic variation at the TPMT locus. This study was designed to
investigate in the Sardinian population the frequency distribution of four of the most
common variants accounting for TPMT deficiency and to conduct comparative analyses
with other populations, in order to obtain insights into the main factors that have shaped
diversity at the TPMT locus in Sardinia. The results obtained from 259 Sardinians
genotyped show that 6.95% were found to be heterozygous for one of four TPMT
variants screened; for each variant the frequency estimate was 1.74%, 0.58%, 0.39%
and 0.77% for TPMT*2, TPMT*3A, TPMT*3B and TPMT*3C, respectively. The
authors conclude that although Sardinia does not show reduced diversity at the TPMT
locus, the spectrum of TPMT allele frequencies affords evidence of remarkable
influence of genetic drift and founder effects throughout its population history.
III.3. The Old Order Amish population
The Old Order Amish (OOA) of Lancaster County, Pennsylvania (Figure III.4),
represent a genetically closed homogeneous Caucasian population of Central European
Figure III.4. Map of Lancaster county.
91
CHAPTER III Genetic Isolates vs Outbred Populations
ancestry ideal for recruitment of large multiplex pedigrees and sib-pairs for genetic
studies. Religious persecution prompted the earliest Amish migration to the USA. In the
mid 1700s the original group was composed of about 200 individuals. Today OOA are
composed of over 30,000. They have excellent family records which include dates of
birth and death of all Amish dating back to the early 1700s. This population has a fairly
uniform standard of living and lifestyle, which reduces non-genetic variability and
boosts the power to discern determinants of genetically inherited traits. Additionally,
they have low migration rates, and do not practice birth control. Families are large,
averaging seven siblings and extended families live either in the same household or
nearby. Two-thirds of the family members can be traced to a single founder. All of these
factors facilitate the collection of multigenerational extended pedigrees with several
long-lived members. Furthermore, the large sib-ship sizes provide the unparalleled
opportunity to reconstruct genotypes of deceased long-lived pedigree members by
genotyping their living offspring (Sorkin et al. 2005).
Recently, van der Walt and collaborators (2005) described the maternal lineages and
Alzheimer disease risk in the Old Order Amish. The consequences of genetic isolation
and inbreeding within this group are evident by increased frequencies of many
monogenic diseases and several complex disorders. Conversely, the prevalence of
Alzheimer disease is lower in the Amish than in the general American population. Since
mitochondrial dysfunction has been proposed as an underlying cause of AD and a
specific haplogroup was found to affect AD susceptibility in Caucasians, they
investigated whether inherited mitochondrial haplogroups affect risk of developing AD
dementia in Ohio and Indiana Amish communities. Ninety-five independent matrilines
were observed across six large pedigrees and three small pedigrees then classified into
seven major European haplogroups. Haplogroup T is the most frequent haplogroup
represented overall in these maternal lines (35.4%), while observed in only 10.6% in
outbred American and European populations. Furthermore, haplogroups J and K are less
frequent (1.0%) than in the outbred data set (9.4-11.2%). Affected case matrilines and
unaffected control lines were chosen from pedigrees to test whether specific
haplogroups and their defining SNPs confer risk of AD. Van der Walt and colleagues
did not observe frequency differences between AD cases compared to controls overall
or when stratified by sex. Therefore, they suggest that the genetic effect responsible for
92
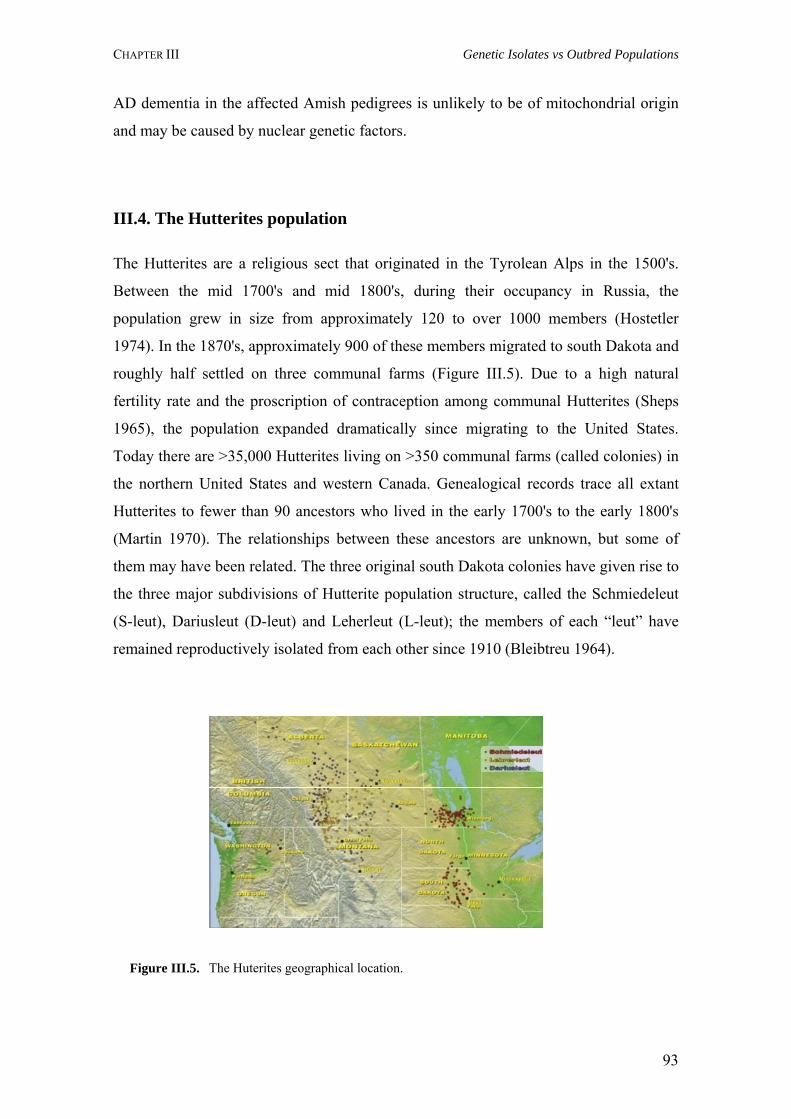
CHAPTER III Genetic Isolates vs Outbred Populations
AD dementia in the affected Amish pedigrees is unlikely to be of mitochondrial origin
and may be caused by nuclear genetic factors.
III.4. The Hutterites population
The Hutterites are a religious sect that originated in the Tyrolean Alps in the 1500's.
Between the mid 1700's and mid 1800's, during their occupancy in Russia, the
population grew in size from approximately 120 to over 1000 members (Hostetler
1974). In the 1870's, approximately 900 of these members migrated to south Dakota and
roughly half settled on three communal farms (Figure III.5). Due to a high natural
fertility rate and the proscription of contraception among communal Hutterites (Sheps
1965), the population expanded dramatically since migrating to the United States.
Today there are >35,000 Hutterites living on >350 communal farms (called colonies) in
the northern United States and western Canada. Genealogical records trace all extant
Hutterites to fewer than 90 ancestors who lived in the early 1700's to the early 1800's
(Martin 1970). The relationships between these ancestors are unknown, but some of
them may have been related. The three original south Dakota colonies have given rise to
the three major subdivisions of Hutterite population structure, called the Schmiedeleut
(S-leut), Dariusleut (D-leut) and Leherleut (L-leut); the members of each “leut” have
remained reproductively isolated from each other since 1910 (Bleibtreu 1964).
Figure III.5. The Huterites geographical location.
93
CHAPTER III Genetic Isolates vs Outbred Populations
In 2004, Newman and collaborators questioned if common disease susceptibility alleles
are the same in outbred and founder populations. Founder populations have been the
subjects of complex disease studies because of their decreased genetic heterogeneity,
increased linkage disequilibrium and more homogeneous environmental exposures.
However, it is possible that disease alleles identified in founder populations may not
contribute significantly to susceptibility in outbred populations. In this study these
authors examine the Hutterites for 103 polymorphisms in 66 genes that are candidates
for cardiovascular or inflammatory diseases. Newman et al. (2004) compare the
frequencies of alleles at these loci in the Hutterites to their frequencies in outbred
European-American populations and test for associations with cardiovascular
disease-associated phenotypes in the Hutterites. Their results show that alleles at these
loci are found at similar frequencies in the Hutterites and in outbred populations. In
addition, they report associations between 39 alleles or haplotypes and cardiovascular
disease phenotypes (p<0.05), with five loci remaining significant after adjusting for
multiple comparisons. These data indicate that this founder population offers
considerable advantages for genetic studies of common complex diseases.
III.5. The Saguenay-Lac-Saint-Jean population
Saguenay-Lac-Saint-Jean (SLSJ) is a geographically isolated region located 125 miles
northeast of Quebec City (Figure III.6). It is usually divided into three subregions, Bas
Saguenay, Haut Saguenay and Lac-St-Jean. From 1838 to 1911, almost 75% of the
28,656 immigrants came from Charlevoix, a region situated east of Quebec City,
whereas the remaining 25% came mostly from other eastern regions of the province.
The immigration has considerably diversified since 1911. Although the migration
balance has been negative since 1870, the population, 98% of whom are French
speaking, has risen from 5,000 inhabitants in 1852 to 50,000 in 1911 to ~300,000 today.
Several dominant and recessive autosomal disorders (e.g. myotonic dystrophy and
cystic fibrosis) have a higher prevalence, while others (e.g. spastic ataxia
Charlevoix-Saguenay type and polyneuropathy with or without agenesis of the corpus
94
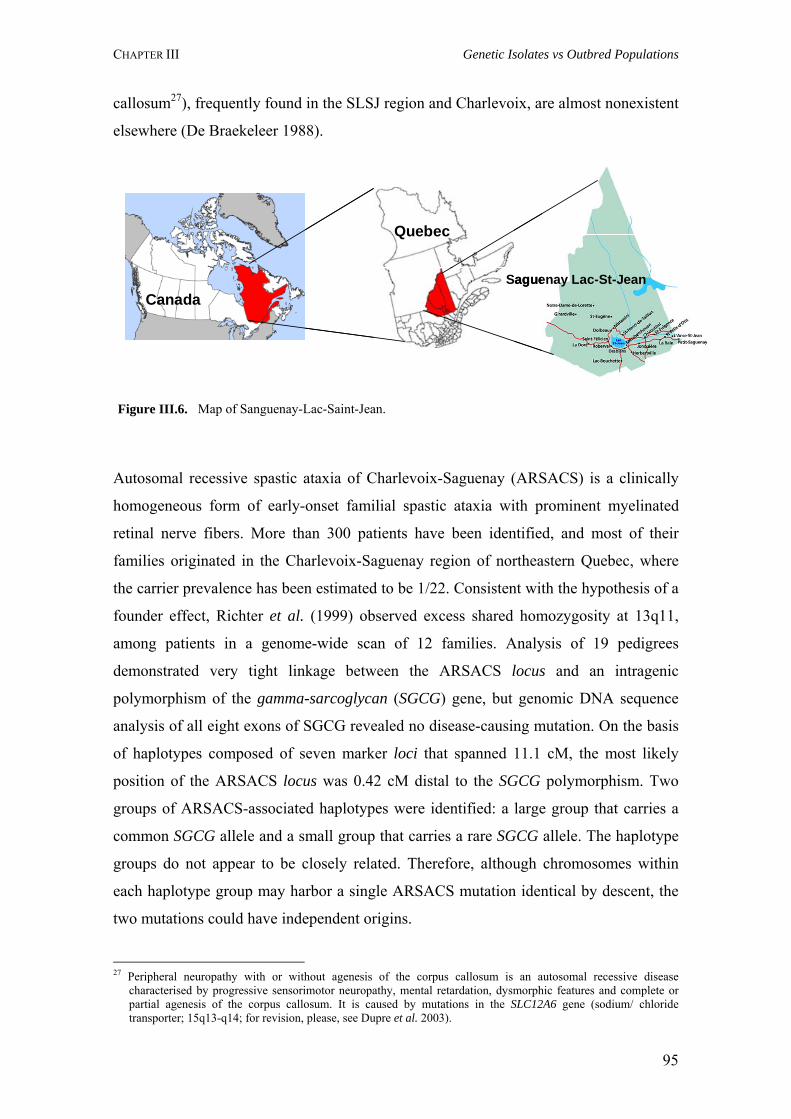
CHAPTER III Genetic Isolates vs Outbred Populations
callosum27), frequently found in the SLSJ region and Charlevoix, are almost nonexistent
elsewhere (De Braekeleer 1988).
Figure III.6. Map of Sanguenay-Lac-Saint-Jean.
Quebec
CanadaSaguenay Lac-St-Jean
Quebec
CanadaSaguenay Lac-St-Jean
Autosomal recessive spastic ataxia of Charlevoix-Saguenay (ARSACS) is a clinically
homogeneous form of early-onset familial spastic ataxia with prominent myelinated
retinal nerve fibers. More than 300 patients have been identified, and most of their
families originated in the Charlevoix-Saguenay region of northeastern Quebec, where
the carrier prevalence has been estimated to be 1/22. Consistent with the hypothesis of a
founder effect, Richter et al. (1999) observed excess shared homozygosity at 13q11,
among patients in a genome-wide scan of 12 families. Analysis of 19 pedigrees
demonstrated very tight linkage between the ARSACS locus and an intragenic
polymorphism of the gamma-sarcoglycan (SGCG) gene, but genomic DNA sequence
analysis of all eight exons of SGCG revealed no disease-causing mutation. On the basis
of haplotypes composed of seven marker loci that spanned 11.1 cM, the most likely
position of the ARSACS locus was 0.42 cM distal to the SGCG polymorphism. Two
groups of ARSACS-associated haplotypes were identified: a large group that carries a
common SGCG allele and a small group that carries a rare SGCG allele. The haplotype
groups do not appear to be closely related. Therefore, although chromosomes within
each haplotype group may harbor a single ARSACS mutation identical by descent, the
two mutations could have independent origins.
27 Peripheral neuropathy with or without agenesis of the corpus callosum is an autosomal recessive disease
characterised by progressive sensorimotor neuropathy, mental retardation, dysmorphic features and complete or partial agenesis of the corpus callosum. It is caused by mutations in the SLC12A6 gene (sodium/ chloride transporter; 15q13-q14; for revision, please, see Dupre et al. 2003).
95
CHAPTER III Genetic Isolates vs Outbred Populations
Dominantly transmitted myotonic dystrophy (DM1) is highly prevalent in SLSJ where
its carrier rate reaches 1/550, compared with 1/5,000 to 1/50,000 elsewhere. To shed
light on the origin of DM1 in Saguenay-Lac-Saint-Jean, Yotoya et al. (2005) screened
50 nuclear DM1 families and studied the genetic variation in a 2.05 Mb (2.9 cM)
segment spanning the site of the expansion mutation. The markers analyzed included 22
biallelic SNPs and two microsatellites. Among 50 independent DM1 chromosomes,
these authors distinguished ten DM1-associated haplotypes and grouped them into three
haplotype families – A, B and C –, based on the relevant extent of allele sharing
between them. To test whether the data were consistent with a single entry of the
mutation into SLSJ, Yotoya and collaborators evaluated the age of the founder effect
from the proportion of recombinant haplotypes. Taking the prevalent haplotype A1_21
(58%) as ancestral to all the disease-associated haplotypes in this study, the estimated
age of the founder effect was 19 generations, long predating the colonization of
Nouvelle-France. In contrast, considering A1_21 as ancestral to the haplotype family A
only, yielded the estimated founder age of nine generations, consistent with the
settlement of Charlevoix at the turn of 17th century and subsequent colonization of
SLSJ. These authors conclude that it was the carrier of haplotype A (present-day carrier
rate of 1/730) that was a "driver" of the founder effect, while minor haplotypes B and C,
with corresponding carrier rates of 1/3,000 and 1/10,000, respectively, contribute DM1
to the prevalence level known in other populations.
96

“There were, however, Portuguese, Spanish, Italians, English, Flemish, French, Scottish, Germans, Jews, and Moors then living who would
voyage to the islands, willingly or unwillingly, to become the root stock of an island people eventually proud to be known as Azoreans…”
Guill 1993
CHAPTER IV
THE AZORES
97
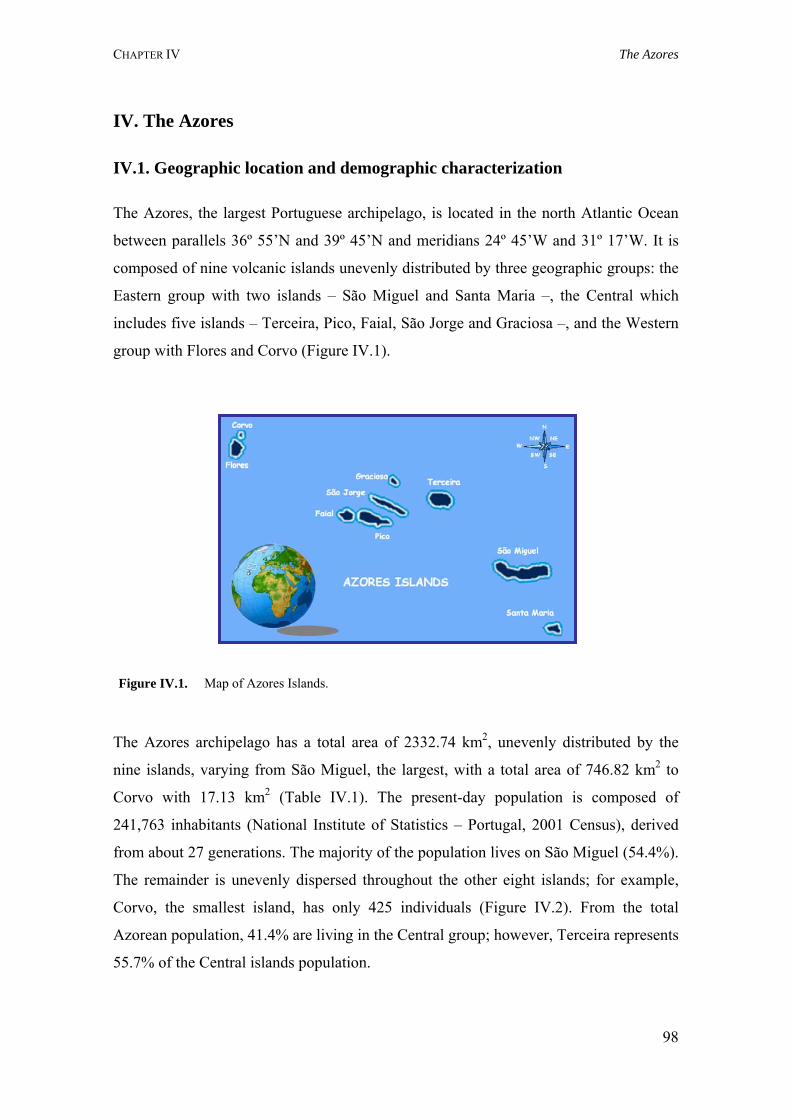
CHAPTER IV The Azores
IV. The Azores
IV.1. Geographic location and demographic characterization
The Azores, the largest Portuguese archipelago, is located in the north Atlantic Ocean
between parallels 36º 55’N and 39º 45’N and meridians 24º 45’W and 31º 17’W. It is
composed of nine volcanic islands unevenly distributed by three geographic groups: the
Eastern group with two islands – São Miguel and Santa Maria –, the Central which
includes five islands – Terceira, Pico, Faial, São Jorge and Graciosa –, and the Western
group with Flores and Corvo (Figure IV.1).
Figure IV.1. Map of Azores Islands.
The Azores archipelago has a total area of 2332.74 km2, unevenly distributed by the
nine islands, varying from São Miguel, the largest, with a total area of 746.82 km2 to
Corvo with 17.13 km2 (Table IV.1). The present-day population is composed of
241,763 inhabitants (National Institute of Statistics – Portugal, 2001 Census), derived
from about 27 generations. The majority of the population lives on São Miguel (54.4%).
The remainder is unevenly dispersed throughout the other eight islands; for example,
Corvo, the smallest island, has only 425 individuals (Figure IV.2). From the total
Azorean population, 41.4% are living in the Central group; however, Terceira represents
55.7% of the Central islands population.
98
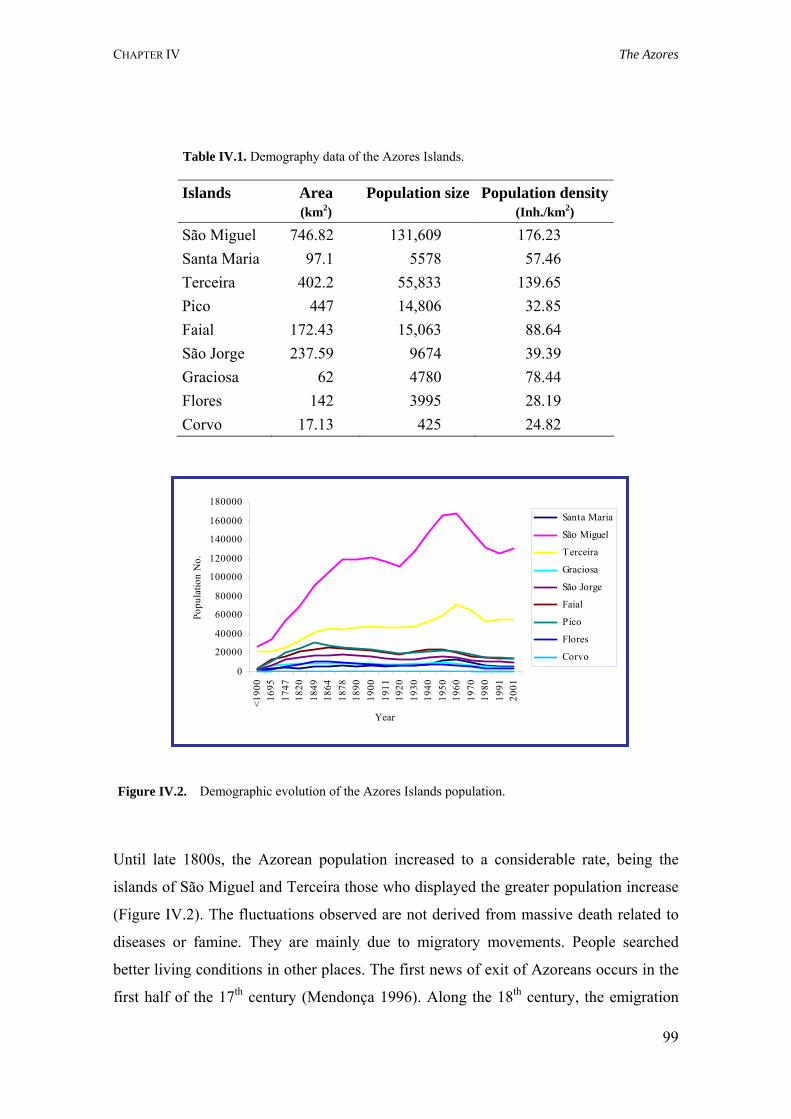
CHAPTER IV The Azores
Table IV.1. Demography data of the Azores Islands.
Islands Area (km2)
Population size Population density (Inh./km2)
São Miguel 746.82 131,609 176.23 Santa Maria 97.1 5578 57.46 Terceira 402.2 55,833 139.65 Pico 447 14,806 32.85 Faial 172.43 15,063 88.64 São Jorge 237.59 9674 39.39 Graciosa 62 4780 78.44 Flores 142 3995 28.19 Corvo 17.13 425 24.82
Figure IV.2. Demographic evolution of the Azores Islands population.
0
20000
40000
60000
80000
100000
120000
140000
160000
180000
<190
016
9517
4718
2018
4918
6418
7818
9019
0019
1119
2019
3019
4019
5019
6019
7019
8019
9120
01
Year
Popu
latio
n N
o.
Santa Maria
São Miguel
Terceira
Graciosa
São Jorge
Faial
Pico
Flores
Corvo
Until late 1800s, the Azorean population increased to a considerable rate, being the
islands of São Miguel and Terceira those who displayed the greater population increase
(Figure IV.2). The fluctuations observed are not derived from massive death related to
diseases or famine. They are mainly due to migratory movements. People searched
better living conditions in other places. The first news of exit of Azoreans occurs in the
first half of the 17th century (Mendonça 1996). Along the 18th century, the emigration
99
CHAPTER IV The Azores
towards Brazil becomes more regular, but it is during the 19th century that the migratory
phenomenon reaches unknown proportions, a total of 22,397 individuals migrated
between 1881-1885. In the 1960s, the population decreases considerably, once again by
migration, mainly towards the United States (US), Canada and Bermuda. In a ten year
period (1960-1970), 148,005 Azoreans emigrated to the United States, Canada and
Bermuda (Direcção Regional das Comunidades; Mendonça 1996), because the US
government changed its emigration policies, allowing the entrance of Azoreans in the
country.
IV.2. Discovery and settlement
The discovery of the Azorean archipelago is a controversial historical subject. Much
has been written, sometimes with nationalistic passion. One uncontroversial fact is
that the Azores was uninhabited when discovered. A Portuguese royal letter “Carta
Regia” dated 2 July 1439 is the first document that recognizes the existence of the
Azores Islands. This letter enumerates seven islands, and reveals that sheep had
already been loosed on the islands at the direction of Prince Henry of Portugal. The
Carta Regia further gives royal license to Henry to populate the islands, which lay,
according to subsequent documents, 260 leagues (832 nautical miles) into the Ocean.
A second reference to the existence of the Azores, a Majorcan map drawn by Gabriel
de Valseca in 1439, showing the Atlantic coast of Africa until south of the Canary
Islands appeared. It illustrates the position of the Canaries, Madeira, Porto Santo, and
seven islands in the proximate location of the Azores (Guill 1993, Marques 1991).
Two versions of the Azores discovery emerge more constantly in the literature (Arruda
1932), there are those who support the hypothesis that the geographical appearance of
the archipelago was in the 14th in the reign of Afonso V, and those who defend that the
discovery occurred in the first half of the 15th century (Mendonça 1996; Matos 1989;
Pires 1983). The first hypothesis is based on the presence of nine islands displayed in
the orientation north-south near the Iberian peninsula. However, the fact that there is a
poor representation of the geographic location of the islands and that there is no
evolution in term of map representation, similar to what happened with the Canary and
Madeira Islands, historians are more leaned to the second hypothesis, being the
100
CHAPTER IV The Azores
discovery of the Azores Islands in the first half of the 15th century (Marques 1991).
According to Marques (1991) the discovery occurred in 1427 by Diogo de Silves, pilot
of Henry. On August 15 of 1432, Gonçalo Cabral arrived to Santa Maria, the
easternmost island of the Azorean archipelago. It was the feast day of the Assumption
of Our Blessed Mother, or Santa Maria and, consequently, the island was named after
her. The island had forests, water fluxes and birdlife. Apparently, there were many birds
in flight, thought to be goshawks, and, hence, the islands got the Portuguese name
"Açor" or hawk (Guill 1993).
The discovery of the last two islands – Flores and Corvo – is also controversial.
However, it is known that it occurred after all other islands, probably in 1452 by Diogo
de Teive and his son, João de Teive (Mendonça 1996; Matos 1989; Marques 1991).
After the discovery of the Azores, Henry received in 1439 the king’s authorization to
populate the islands. To fulfil this task Gonçalo Velho initiates the peopling by the
Eastern group, Santa Maria and São Miguel (Matos 1989). Peopling was a slow and
difficult process. Someone wrote “…The Azorean settlement was done with people
from the interior of mainland Portugal, those who could not swim nor build boats,
making impossible the abandonment of the islands…” Historical data report that the
Portuguese crown was compelled to give out land and privileges in order to attract
people to the islands (Guill 1993). Gonçalo Velho gathered settlers from the mainland
and Madeira. To increase his labour force, he requested Henry to release to his guard
small time criminals, known as “degredados” (persons convicted of lesser crimes and
were serving time in prison or in designated periods of servitude). These “degredados”
were identified from other settlers by a ring piercing the left ear lobe. Velho added to
his work force some Moorish prisoners, captured in the Moroccan wars and not yet
ransomed by Moslem families or authorities. Velho called on the vicar of Tomar to send
priests and specialists in the construction of religious structures. Sugar production on
Madeira had been established with high profits. Therefore, Henry contracted António
Corvelo and his two sons, Francisco and Genero, to establish sugar cane plantations and
to build sugar-processing facilities (Guill 1993; Marques 1991).
The island of Santa Maria was the first of the archipelago being populated. In 1439,
Gonçalo Velho, its first captain-donatary, accompanied by two nephews and a group of
settlers, in their majority from Algarve, settled in the coast of this island (Matos 1989).
101
CHAPTER IV The Azores
Later, João Soares de Albergaria, nephew of Gonçalo Velho, gives a new impulse on
peopling of Santa Maria (Matos 1989). The beginning of settlement of the São Miguel
Island in 1444 is essentially contemporary to Santa Maria. According to Matos (1989),
the group of initial settlers that came to the São Miguel Island was composed of
Portuguese, black slaves and moors. Some authors, based on toponimic data, refer the
influence of native individuals of the French Bretagne in the island of São Miguel
(Matos 1989). The frequent marine relations between the region of Algarve and Azores,
especially with São Miguel, aside from allowing commercial interchanges, fomented a
change of residence and a narrowing of relations between the populations of mainland
and islands. With the death of Gonçalo Velho, the captainship of São Miguel is sold to a
member of the donatary family of Madeira Island, having begun (in 1474) the flow of
Madeiran families to Azores (Matos 1989).
The good political relations between Portugal and Flanders (reinforced by marriage
unions between the Portuguese royal family and the ducat of Burgandy) led to the
Flemish participation in the Azorean settlement. Van der Hagen (with the Portuguese
name Guilherme Silveira) was the first to transport Flemish to the Azores to
supplement the activities of Gonçalo Velho. Van der Hagen was born in Bruges,
grandson of John the Fearless. He took his first Flemish settlers to the third island
Terceira, since Velho concentrated his attention on Santa Maria and São Miguel. He
landed his settlers on the north coast of Terceira, in the area now known as Quatro
Ribeiras. In 1450, when Henry elected another Flemish nobleman, Jácome de Bruges,
who had also been in his service for some time, as captain-donatary of Terceira, van
der Hagen returned to Flanders and brought new settlers. He moved to the island of
Faial, near a location now called Praia do Norte. In addition to the Flemish, the first
settlers of the Terceira Island were native from mainland Portugal and Madeira. Some
of them were “noble” families from both places. However, these settlers, in a low
number, also participated in the peopling of other islands, mainly Flores and Corvo
(Matos 1989).
The first settlers of the Pico Island, that initially was used to shepherd the cattle, came
from Faial, the nearest and most flemish island (Matos 1989). In the middle of 15th
century, the Graciosa Island already had settlers, namely Vasco Gil Sodré, natural of
Montemor-o-Velho (center of mainland Portugal), accompanied by its family and
102
CHAPTER IV The Azores
servants. They were the pioneers in the settlement of the island. The influence of the
Terceira Island seems to have been decisive in the settlement and development of the
Graciosa Island (Ferreira 1987). The first attempt of peopling of the Flores Island, by
Guilherme Silveira, was not successful. The definitive settlement took place at the end
of the first decade of the 16th century, promoted by Antão Vaz, who arrived with a
group of native settlers of Terceira and Madeira (Matos 1989). Later arrived people
from the rest of the islands, essentially São Miguel and mainland Portugal (Matos
1989). The Corvo Island just starts being peopled in 1548. The presence of slaves in the
island is explained by the fact that Gonçalo de Sousa sent slaves of their confidence to
the island, with the mission to cultivate the earth and to take care of cattle (Matos 1989).
Meanwhile, the geographic proximity between the two islands foments exchanges of
individuals from one island towards the other (Matos 1989). There are also reports of
the presence of Jews in all islands. Since people were needed to settle the islands, the
persecutions were left aside, and Jews, often called New Christians, were allowed to
live in the islands (Marques 1991). In the following centuries, the Azores, with a
strategic position, became very important in the commercial trades (India, Africa and
America), as well as, in the production of goods that were sent to mainland Portugal.
This emerging economy attracted people of different nationalities, such as, French,
English and Spanish, among others, contributing to the genetic pool of the Azorean
people.
IV.3. Genetic studies on the Azorean population
Along the years the Azores population has progressively been studied. Nevertheless,
when this PhD thesis started, there was lack of knowledge in the population genetic
structure of the Azoreans. However, during the time between the beginning and the end
of this thesis, further works, namely Service et al. 2006; Santos et al. 2005; Fernando et
al. 2005; Spinola et al. 2005; Santos et al. 2005; Montiel et al. 2005; Santos et al. 2004;
Santos et al. 2003, were published. Therefore, these and other papers will be thoroughly
discussed in the present manuscript.
Some of the research subjects in Azores population vary from heart (Bettencourt et al.
2006; Cymbron et al. 2006; Shneider et al. 1995; de Sa et al. 1994), psychiatric (Pato et
103
CHAPTER IV The Azores
al. 2005; Coutinho et al. 2004; Sklar et al. 2004) and ataxia (Gonzalez et al. 2004; Lima
et al. 2001; St George-Hyslop et al. 1994; Friedman 1988; Romanul et al. 1977)
diseases, to forensic genetics (Corte-Real et al. 1999; Velosa et al. 2002) and genetic
population structure (Bruges-Armas et al. 1999; Smith et al. 1992). In the next
paragraphs, a brief description of some important studies in the Azorean population are
presented (for other publications on this population, please, see Appendix IX.5)
Congenital malformations of the heart and great vessels are among the most frequent of
all clinically significant birth defects, having a major contribution on paediatric
morbidity, mortality, and healthcare costs. Population based epidemiologic studies
indicate a prevalence of congenital heart disease (CHD) ranging from 3.23 to 12.23 per
1000 live births (Macmahon et al. 1953; Robida et al. 1997). This wide variation in the
reported values is mainly due to the difference in the methodologies used, but a number
of other factors, such as, consanguinity (Becker et al. 2001, Nabulsi et al. 2003), ethnic
background (Botto et al. 2001), environmental pollutants (Cedergren et al. 2002, Grech
1999) and access to health care also contribute to this variation (for revision, please see
Weismann and Gelb 2007). Cymbron et al. (2006) carried out the first study performed
in the Azorean population to characterize the prevalence of CHD in children born alive
in São Miguel island from January 1992 to December 2001. Based on the Azorean
Registry of CHD, which includes complete clinical and personal information, 189
patients were diagnosed. The results obtained by Cymbron et al. show that during this
10-year period, the average prevalence of CHD is 9.16 per 1000 live births (range
4.77-12.75). The most frequent cardiac malformations found were: ventricular septal
defect (38.1%), atrial septal defect (12.2%) and patent ductus arteriosus (11.6%). This
study detected four familial clusters, representing a total of 13 patients. Until now,
Cabral et al. (2007) identified 44 familial clusters corresponding to 109 patients. This
study reveals evidence for familial aggregation, which is of great interest for
understanding the genes involved in these complex pathologies.
Schizophrenia is a common psychiatric disorder characterized by psychosis, cognitive
dysfunction and negative symptoms, whose etiology involves interactions between both
genetic and environmental factors (Austin 2005). Its incidence shows prominent
worldwide variation (up to fivefold) and is about 40% greater in men than in women.
Schizophrenia is a common complex disorder. Furthermore, epidemiological studies
104
CHAPTER IV The Azores
have shown that the incidence is higher among those who grow up in urban areas and
among migrants. To understand the genetic basis of this disease in Azores Islands
populations, Sklar et al. (2004) performed a genome-wide scan of 29 families with
schizophrenia, which identified a single region on 5q31-5q35 with strong linkage
(non-parametric linkage, NPL=3.09, p=0.0012 at D5S820). Empirical simulations set a
genome-wide threshold of NPL=3.10 for significant linkage. Additional support for this
locus in schizophrenia comes from higher-density mapping and mapping of 11
additional families. The combined set of 40 families had a peak NPL=3.28 (p=0.00066)
at markers D5S2112-D5S820. These data and previous linkage findings from other
investigators provide strong and consistent evidence for this genomic region as a
susceptibility locus for schizophrenia. Exploratory analyses of a novel phenotype,
psychosis, in families with schizophrenia and bipolar disorder, detected evidence for
linkage to the same markers as found in schizophrenia (peak NPL=3.03, p=0.0012 at
D5S820), suggesting that this locus may be responsible for the psychotic symptoms
observed in both diseases.
Autism Spectrum Disorder (ASD) is a syndrome with a wide clinical phenotype,
characterized by impairments in social interaction and reciprocal communication and by
patterns of stereotyped behaviours. The ASD term is used here to define a broad
concept of autism, manifested as a spectrum of behavioural, cognitive and linguistic
problems that include autistic disorder, Asperger syndrome and a pervasive
developmental disorder not otherwise specified. ASD is a chronic and severe
neurodevelopmental disorder, with a significant social impact. Oliveira et al. (2007)
estimated the prevalence of ASD in a pediatric population from Portugal, its clinical
characterization and the identification of associated medical conditions. For this
purpose, they performed a survey in elementary schools, targeting 332,808 school age
children in the mainland and 10,910 the Azores, asking teachers to identify children in
their classes with an autistic profile. Clinical history was collected and a broad
laboratory investigation for the identification of associated medical conditions was
applied. In parallel, a systematic search of autistic children in educational, social and
health registries was carried out in a restricted geographic region, targeting 56,325
children. The global prevalence of ASD was 9.2 per 10,000 in mainland Portugal, with
intriguing regional differences, and 15.6 per 10,000 in the Azores. A high diversity of
associated medical conditions was documented in 20,0% of the children, with an
105
CHAPTER IV The Azores
unexpectedly high rate of mitochondrial respiratory chain disorder cases opening new
perspectives for the investigation of ASD etiology.
Machado-Joseph disease (MJD) is an autosomal dominant neurodegenerative disorder
characterized by a wide range of clinical features, among which gait ataxia and
limitation of eye movements are generally present (Lima et al. 2001). The name,
Machado-Joseph, comes from two families of Portuguese/ Azorean descent who were
among the first families described with the unique symptoms of the disease in the
1970s. Recently, researchers have identified MJD in several family groups not of
obvious Portuguese descent, including an African-American family from north
Carolina, an Italian-American family, and several Japanese families. On a worldwide
basis, MJD is the most prevalent autosomal dominant inherited form of ataxia (for
review, please, see Paulson 2007). Disease manifestations usually arise during adult
life28. The mean age at onset is 40.2 years, although extremes of 6 years and 70 years
have been reported (Sequeiros and Coutinho 1993). The MJD locus was assigned to the
long arm of chromosome 14 (Takiyama et al.1993) and is associated with the expansion
of a CAG trinucleotide repeat in a gene on 14q32.1 (Kawaguchi et al. 1994). In the
Azores Islands (Portugal), MJD reaches the highest prevalence reported worldwide. It
has been postulated that it is highly represented in the Azorean population as a result of
a founder effect. To test this hypothesis, Lima et al. (1998) reconstructed the ascending
genealogies of 32 Azorean families presently identified as harboring the disease (103
patients), using parish records as the main source of data. These patients were originally
from the islands of São Miguel, Terceira, Graciosa and Flores. The genealogies of the
two main Azorean-American families (Machado and Joseph) were also reconstructed.
To identify the links between the MJD families, these authors calculated the kinship
coefficient between the proponents of these genealogies. The family from Terceira was
linked to three different MJD families from Flores through common ancestors. No
kinship was observed between the MJD families from São Miguel and families from
any other island. Links between the two Azorean-American families and Azorean MJD
families were found. The founders present in more than one ascendance were identified.
28 The types of MJD are distinguished by the age of onset and range of symptoms. Type I is characterized by onset
between 10 and 30 years of age, fast progression, and severe dystonia and rigidity. Type II generally begins between the ages of 20 and 50 years, has an intermediate progression, and causes symptoms that include spasticity, spastic gait, and exaggerated reflex responses. Type III patients have an onset between 40 and 70 years of age, a relatively slow progression, and some muscle twitching, muscle atrophy, and unpleasant sensations such as, numbness, tingling, cramps, and pain in the hands, feet, and limbs.
106
CHAPTER IV The Azores
Their chronological and geographic distribution indicates that more than one MJD
haplotype was introduced in the Azores, probably by settlers coming from the
Portuguese mainland. Two distinct haplotypes have been identifyed, one on the island
of São Miguel and the other on Flores (Gaspar et al. 2001).
107
CHAPTER IV The Azores
IV.4. Objectives of the scientific research
The global knowledge of the neutral variation of a population is an essential part in the
understanding of the disease related variation, since it has also been subject to
evolutionary forces, such as, genetic drift, mutation, selection and migration. Moreover,
the comprehension of our “roots” and genetic signature has several implications in
society’s own knowledge, in the design of future genetic studies, as well as, in the
health care system.
The location of the Azorean population in the middle of the Atlantic, its geography,
namely, nine islands dispersed through three groups, its socio-cultural characteristics
and, finally, the same environmental conditions, make a priori this population a good
model to perform genetic studies of complex diseases, which will probably have a good
reproductivity in other expanded populations.
The present PhD thesis had as main objective the overall characterization of the neutral
variation of the Azorean population, through information retrieved from surnames,
autosomal markers, as well as, Y-chromosome lineages. More generally, it was our
purpose to:
- complement the settlement data and, consequently, validate the genetic origin of
this population;
- understand the genetic diversity patterns of each Azorean island population and
of the whole population;
- identify gene flow patterns between each island, as well as, with other European
and African populations;
- compare the genetic background of the Azoreans with mainland Portugal and
other well described populations;
- assess the population subdivision and, therefore, its genetic structure;
- estimate how inbreeding may play a role in the genetic makeup of this
population;
- determine the extent of linkage disequilibrium and its implications in genetic
mapping of complex diseases in the Azorean population.
108
“…I donʹt want to argue that the isonymy method is one of great accuracy or wide applicability. It has two advantages: One is that it is cheap and easy to use, requiring data that are often readily available in public records. The
second is that it supplies a way of estimating the effects of inbreeding during the early periods before there are pedigree records. A rough and ready answer
may be quite useful for many purposes, and the isonymy method can sometimes supply it with minimum effort…”.
J.F. Crow
CHAPTER V
STRUCTURE OF AZOREAN POPULATION:
VIEW FROM SURNAMES
Population Structure of São Miguel Island, Azores: A surname Study
Published in Hum Biol, 2003
Surnames in Azores: Analysis of the isonymy structure
Published in Hum Biol, 2005
Geography of surnames in Azores: specificity and spatial distribution analysis
Published in Am J Hum Biol, 2005
109
CHAPTER V Surname Analysis: São Miguel Island
V.1. Population Structure of São Miguel Island, Azores: A surname Study
V.1.1. Summary
The knowledge of population structure may constitute a powerful tool for mapping
genes underlying susceptibility to Mendelian and complex diseases. To obtain a better
understanding of the population structure of São Miguel Island (Azorean archipelago,
Portugal), we carried out a surname survey using the surnames listed in the most recent
telephone book (2001). We identified 1315 different surnames in a total of 27,621
subscribers. The frequency of the different surnames was used to calculate the following
parameters: isonymy (I), random component of inbreeding (FST), genetic diversity
according to Fisher (α), migration rate according to Karlin-McGregor (ν), and Nei’s
genetic distance. Eleven localities were selected, due to population size and geographic
distribution, for analysis using the parameters above. Our results show that 51% of
Salga’s population and 52% of Sete Cidades’s population are represented by 6 and 8
surnames, respectively. This demonstrates the effective isolation of these two small
places, which are located in opposite extremes of São Miguel Island. Salga, Achada and
Sete Cidades present the lowest values of Fisher’s α, indicating less genetic diversity. In
contrast, the capital Ponta Delgada presents the highest value of α (78.13), indicating
more genetic diversity. Our data indicate that the clustering of the localities corresponds
to the geographic features of the island, where localities close together tend to share
similar surnames.
V.1.2. Introduction
Surnames are useful, simple and cost effective when used as a tool for examining the
genetic structure of human populations. They are not evenly distributed among ethnic
groups or geographic areas, and, thus, the study of surname frequencies allows the
inference of how gene frequency helped to shape population structure (Lasker 1985).
Here, we describe a study of the population structure of São Miguel Island, using
isonymy parameters based on the surnames present in the 2001 telephone book. São
110
CHAPTER V Surname Analysis: São Miguel Island
Miguel presents a particular orography where the distribution of genes may have been
influenced by geographic barriers. It was our main objective to understand the
distribution of surnames, the effect of the geographical isolation within the island, and
the relations established between the different localities of São Miguel Island.
V.1.3. Material and Methods
V.1.3.1. Localities
In the present study, we chose a group of eleven localities scattered throughout the
island of São Miguel (Figure V.1). The selected group was constituted by one urban
locality – the capital Ponta Delgada – and ten rural localities: Achada, Bretanha, Furnas,
Ginetes, Maia, Nordeste, Rabo-de-Peixe, Povoação, Salga and Sete Cidades. The choice
of these localities was based on population size, demographic characteristics and
geographic isolation. Salga and Sete Cidades were chosen because of their relative
geographical isolation, small population size and opposite location in relation to the
east-west axis (Figure V.1). Bretanha, Rabo-de-Peixe and Maia were selected because
of their location in the northern part of the island, whereas Ginetes, Ponta Delgada and
Povoação by their location in the south. The inclusion of Nordeste and Achada was
based on their difference in population size and their distance from the capital, Ponta
Delgada. Furnas was included in this study because of its attraction as a touristic site.
V.1.3.2. Surnames
In Azores, as in mainland Portugal, each individual inherits two surnames, one from the
mother (mid surname) and one from the father (last surname). The mid surname is the
last surname of the mother’s father. Generally, the last surname of a name (father’s) is
passed to the next generation. Although, we do not exclude the possibility that some
surnames may have been created in the Azores, the majority of surnames arrived with
the Portuguese settlers.
111
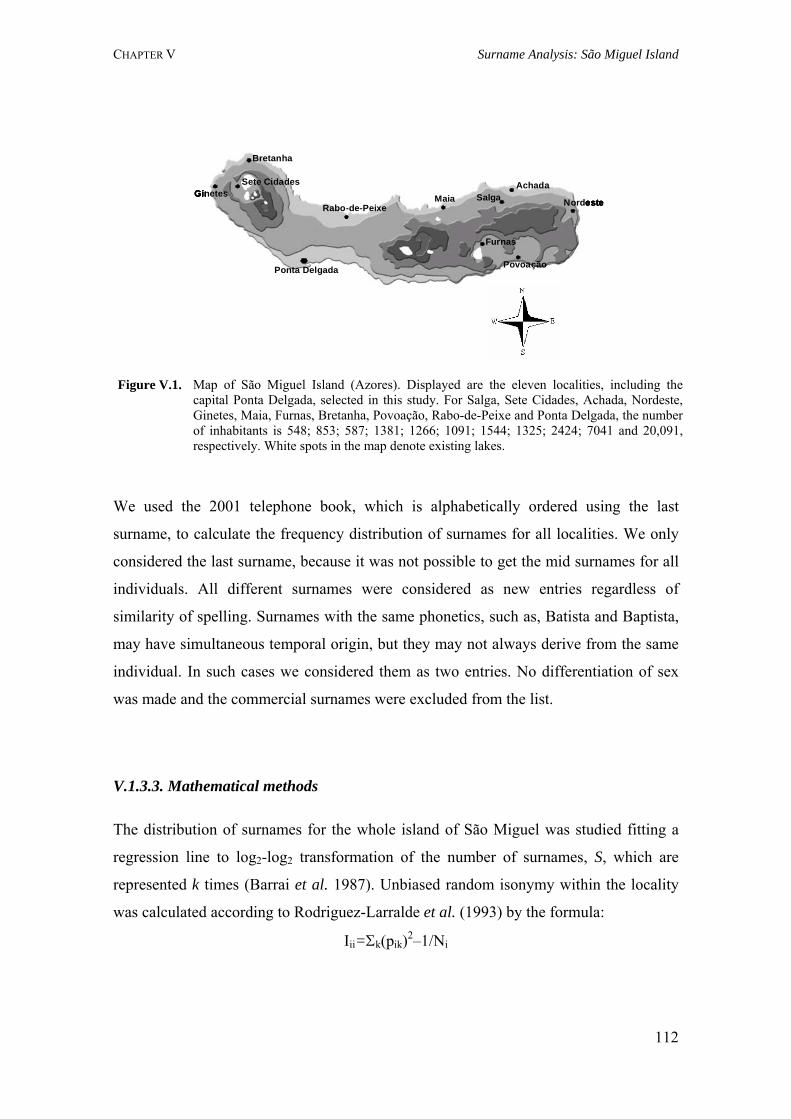
CHAPTER V Surname Analysis: São Miguel Island
Figure V.1. Map of São Miguel Island (Azores). Displayed are the eleven localities, including the capital Ponta Delgada, selected in this study. For Salga, Sete Cidades, Achada, Nordeste, Ginetes, Maia, Furnas, Bretanha, Povoação, Rabo-de-Peixe and Ponta Delgada, the number of inhabitants is 548; 853; 587; 1381; 1266; 1091; 1544; 1325; 2424; 7041 and 20,091, respectively. White spots in the map denote existing lakes.
Bretanha
GinetesSete Cidades
Rabo-de-PeixeMaia Salga
Achada
Nordeste
Povoação
Furnas
Ponta Delgada
Bretanha
GinetesSete Cidades
Rabo-de-PeixeMaia Salga
Achada
Nordeste
Povoação
Furnas
Ponta Delgada
Bretanha
GinetesSete Cidades
Rabo-de-PeixeMaia Salga
Achada
Nordeste
Povoação
Furnas
Ponta Delgada
Bretanha
GinetesSete Cidades
Rabo-de-PeixeMaia Salga
Achada
Nordeste
Povoação
Furnas
Ponta Delgada
We used the 2001 telephone book, which is alphabetically ordered using the last
surname, to calculate the frequency distribution of surnames for all localities. We only
considered the last surname, because it was not possible to get the mid surnames for all
individuals. All different surnames were considered as new entries regardless of
similarity of spelling. Surnames with the same phonetics, such as, Batista and Baptista,
may have simultaneous temporal origin, but they may not always derive from the same
individual. In such cases we considered them as two entries. No differentiation of sex
was made and the commercial surnames were excluded from the list.
V.1.3.3. Mathematical methods
The distribution of surnames for the whole island of São Miguel was studied fitting a
regression line to log2-log2 transformation of the number of surnames, S, which are
represented k times (Barrai et al. 1987). Unbiased random isonymy within the locality
was calculated according to Rodriguez-Larralde et al. (1993) by the formula:
Iii=Σk(pik)2–1/Ni
112
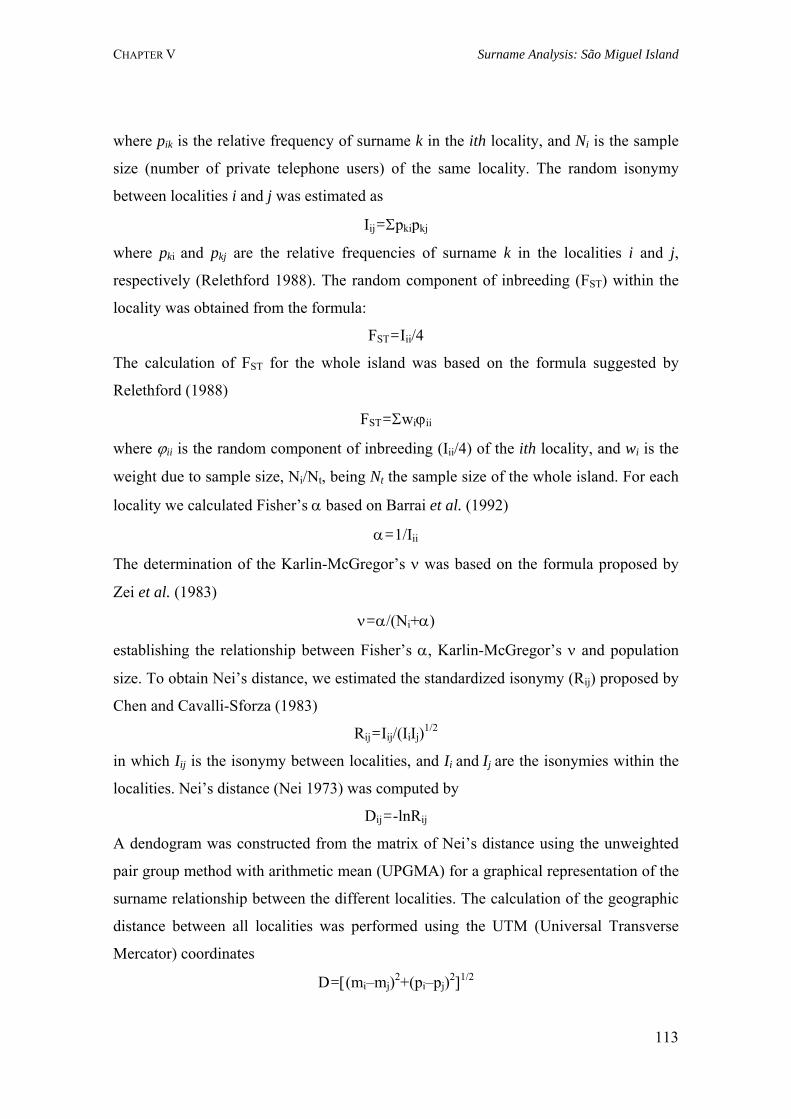
CHAPTER V Surname Analysis: São Miguel Island
where pik is the relative frequency of surname k in the ith locality, and Ni is the sample
size (number of private telephone users) of the same locality. The random isonymy
between localities i and j was estimated as
Iij=Σpkipkj
where pki and pkj are the relative frequencies of surname k in the localities i and j,
respectively (Relethford 1988). The random component of inbreeding (FST) within the
locality was obtained from the formula:
FST=Iii/4
The calculation of FST for the whole island was based on the formula suggested by
Relethford (1988)
FST=Σwiϕii
where ϕii is the random component of inbreeding (Iii/4) of the ith locality, and wi is the
weight due to sample size, Ni/Nt, being Nt the sample size of the whole island. For each
locality we calculated Fisher’s α based on Barrai et al. (1992)
α=1/Iii
The determination of the Karlin-McGregor’s ν was based on the formula proposed by
Zei et al. (1983)
ν=α/(Ni+α)
establishing the relationship between Fisher’s α, Karlin-McGregor’s ν and population
size. To obtain Nei’s distance, we estimated the standardized isonymy (Rij) proposed by
Chen and Cavalli-Sforza (1983)
Rij=Iij/(IiIj)1/2
in which Iij is the isonymy between localities, and Ii and Ij are the isonymies within the
localities. Nei’s distance (Nei 1973) was computed by
Dij=-lnRij
A dendogram was constructed from the matrix of Nei’s distance using the unweighted
pair group method with arithmetic mean (UPGMA) for a graphical representation of the
surname relationship between the different localities. The calculation of the geographic
distance between all localities was performed using the UTM (Universal Transverse
Mercator) coordinates
D=[(mi–mj)2+(pi–pj)2]1/2
113
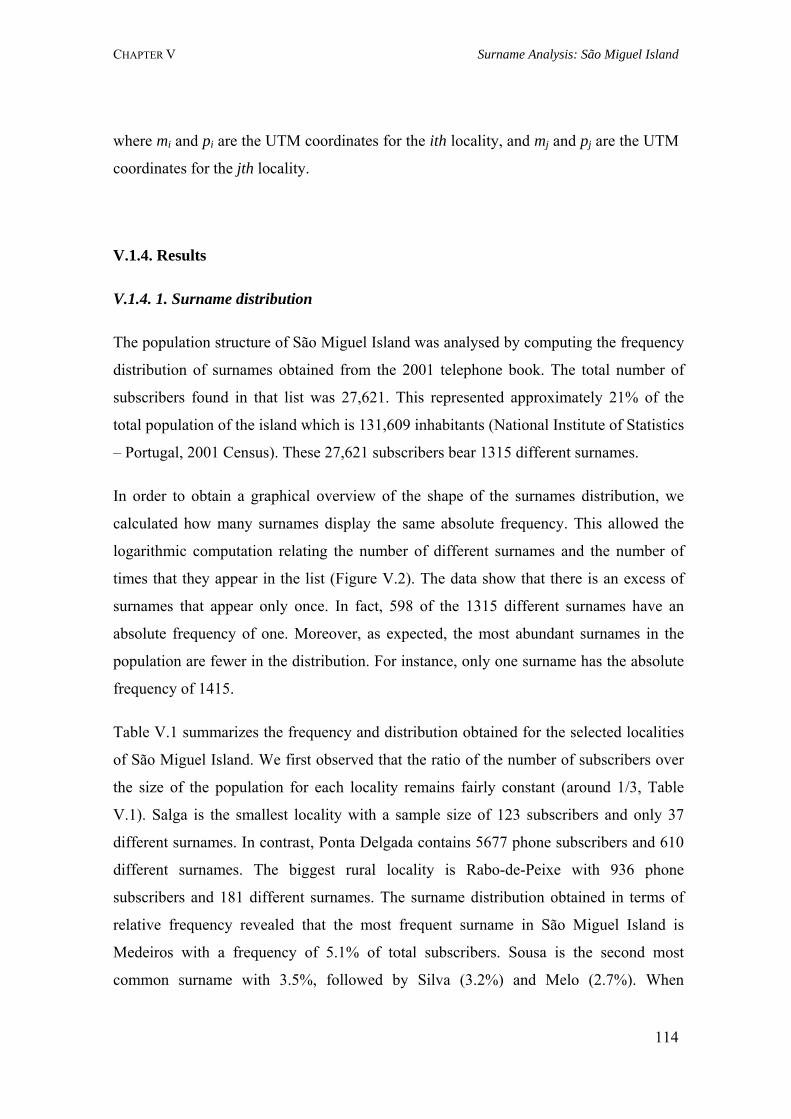
CHAPTER V Surname Analysis: São Miguel Island
where mi and pi are the UTM coordinates for the ith locality, and mj and pj are the UTM
coordinates for the jth locality.
V.1.4. Results
V.1.4. 1. Surname distribution
The population structure of São Miguel Island was analysed by computing the frequency
distribution of surnames obtained from the 2001 telephone book. The total number of
subscribers found in that list was 27,621. This represented approximately 21% of the
total population of the island which is 131,609 inhabitants (National Institute of Statistics
– Portugal, 2001 Census). These 27,621 subscribers bear 1315 different surnames.
In order to obtain a graphical overview of the shape of the surnames distribution, we
calculated how many surnames display the same absolute frequency. This allowed the
logarithmic computation relating the number of different surnames and the number of
times that they appear in the list (Figure V.2). The data show that there is an excess of
surnames that appear only once. In fact, 598 of the 1315 different surnames have an
absolute frequency of one. Moreover, as expected, the most abundant surnames in the
population are fewer in the distribution. For instance, only one surname has the absolute
frequency of 1415.
Table V.1 summarizes the frequency and distribution obtained for the selected localities
of São Miguel Island. We first observed that the ratio of the number of subscribers over
the size of the population for each locality remains fairly constant (around 1/3, Table
V.1). Salga is the smallest locality with a sample size of 123 subscribers and only 37
different surnames. In contrast, Ponta Delgada contains 5677 phone subscribers and 610
different surnames. The biggest rural locality is Rabo-de-Peixe with 936 phone
subscribers and 181 different surnames. The surname distribution obtained in terms of
relative frequency revealed that the most frequent surname in São Miguel Island is
Medeiros with a frequency of 5.1% of total subscribers. Sousa is the second most
common surname with 3.5%, followed by Silva (3.2%) and Melo (2.7%). When
114
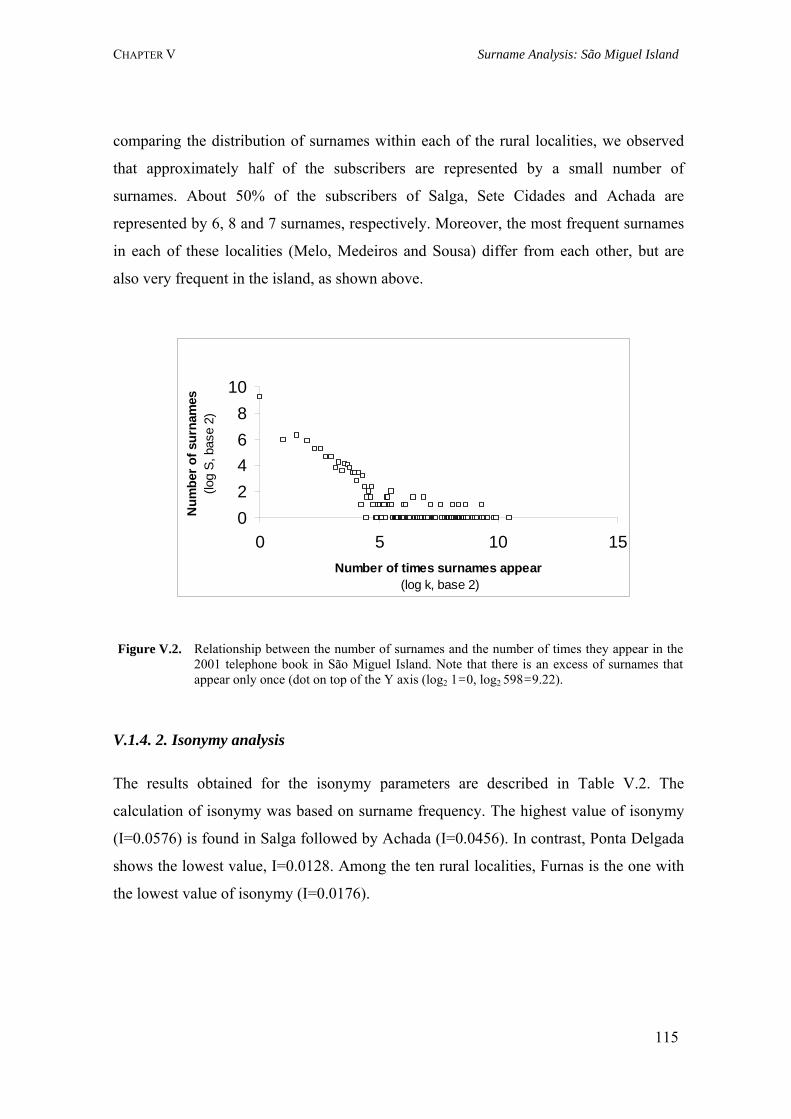
CHAPTER V Surname Analysis: São Miguel Island
comparing the distribution of surnames within each of the rural localities, we observed
that approximately half of the subscribers are represented by a small number of
surnames. About 50% of the subscribers of Salga, Sete Cidades and Achada are
represented by 6, 8 and 7 surnames, respectively. Moreover, the most frequent surnames
in each of these localities (Melo, Medeiros and Sousa) differ from each other, but are
also very frequent in the island, as shown above.
Figure V.2.
02468
10
0 5 10 15Number of times surnames appear
(log k, base 2)
Num
ber o
f sur
nam
es
(log
S, b
ase
2)
Relationship between the number of surnames and the number of times they appear in the 2001 telephone book in São Miguel Island. Note that there is an excess of surnames that appear only once (dot on top of the Y axis (log2 1=0, log2 598=9.22).
V.1.4. 2. Isonymy analysis
The results obtained for the isonymy parameters are described in Table V.2. The
calculation of isonymy was based on surname frequency. The highest value of isonymy
(I=0.0576) is found in Salga followed by Achada (I=0.0456). In contrast, Ponta Delgada
shows the lowest value, I=0.0128. Among the ten rural localities, Furnas is the one with
the lowest value of isonymy (I=0.0176).
115
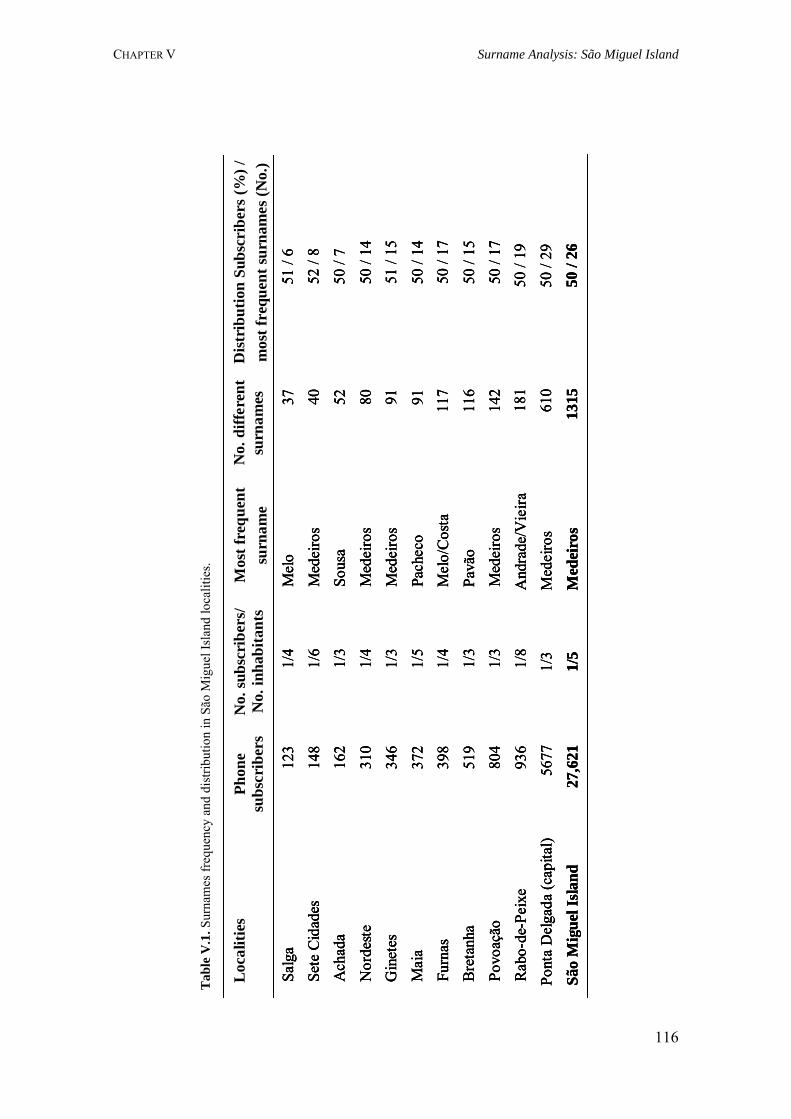
CHAPTER V Surname Analysis: São Miguel Island
Loc
aliti
esPh
one
subs
crib
ers
No.
subs
crib
ers /
N
o. in
habi
tant
sM
ostf
requ
ent
surn
ame
No.
diff
eren
tsu
rnam
esD
istr
ibut
ion
Subs
crib
ers
(%) /
mos
tfre
quen
tsur
nam
es(N
o.)
Salg
a12
31/
4M
elo
3751
/ 6
Sete
Cid
ades
148
1/6
Med
eiro
s40
52 /
8
Ach
ada
162
1/3
Sous
a52
50 /
7
Nor
dest
e31
01/
4M
edei
ros
8050
/ 14
Gin
etes
346
1/3
Med
eiro
s91
51 /
15
Mai
a37
21/
5Pa
chec
o91
50 /
14Fu
rnas
398
1/4
Mel
o/C
osta
117
50 /
17
Bre
tanh
a51
91/
3Pa
vão
116
50 /
15
Povo
ação
804
1/3
Med
eiro
s14
250
/ 17
Rab
o-de
- Pei
xe93
61/
8A
ndra
de/V
ieira
181
50 /
19
Pont
a D
elga
da (c
apita
l)56
771/
3M
edei
ros
610
50 /
29
São
Mig
uel I
slan
d27
,621
1/5
Med
eiro
s13
1550
/ 26
Tab
le V
.1. S
urna
mes
freq
uenc
y an
d di
strib
utio
n in
São
Mig
uel I
slan
d lo
calit
ies.
116
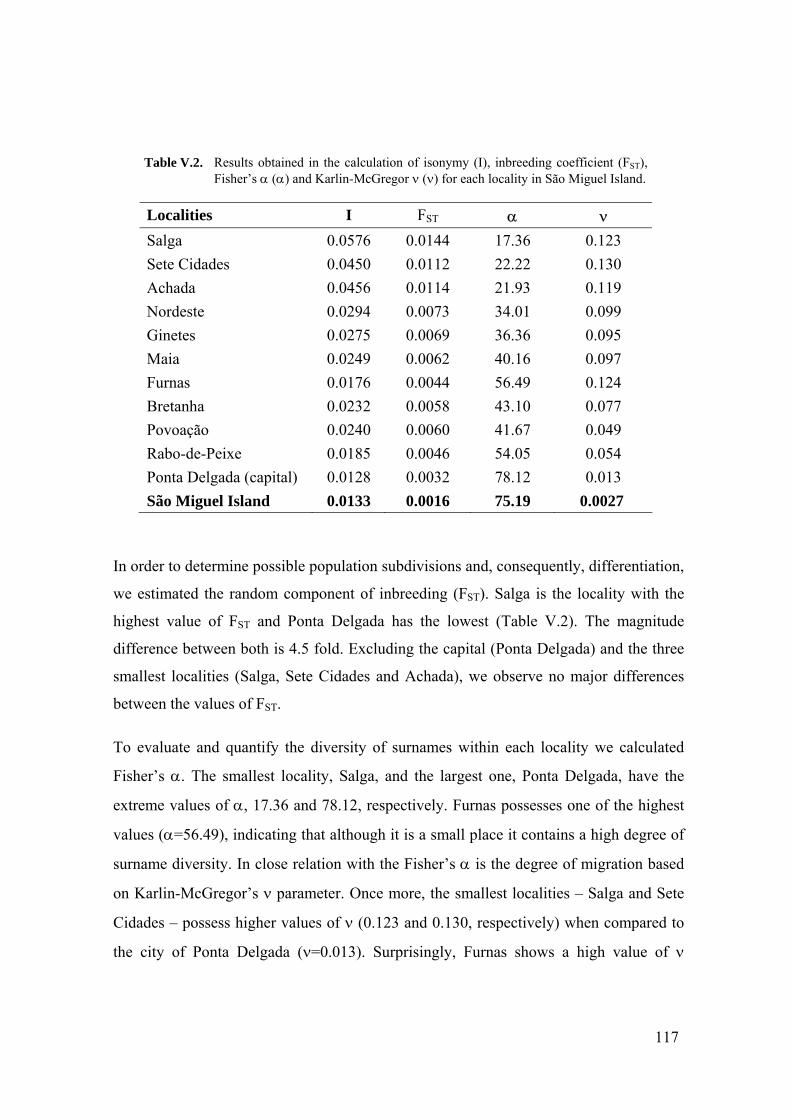
Table V.2. Results obtained in the calculation of isonymy (I), inbreeding coefficient (FST), Fisher’s α (α) and Karlin-McGregor ν (ν) for each locality in São Miguel Island.
Localities I FST α ν Salga 0.0576 0.0144 17.36 0.123 Sete Cidades 0.0450 0.0112 22.22 0.130 Achada 0.0456 0.0114 21.93 0.119 Nordeste 0.0294 0.0073 34.01 0.099 Ginetes 0.0275 0.0069 36.36 0.095 Maia 0.0249 0.0062 40.16 0.097 Furnas 0.0176 0.0044 56.49 0.124 Bretanha 0.0232 0.0058 43.10 0.077 Povoação 0.0240 0.0060 41.67 0.049 Rabo-de-Peixe 0.0185 0.0046 54.05 0.054 Ponta Delgada (capital) 0.0128 0.0032 78.12 0.013 São Miguel Island 0.0133 0.0016 75.19 0.0027
In order to determine possible population subdivisions and, consequently, differentiation,
we estimated the random component of inbreeding (FST). Salga is the locality with the
highest value of FST and Ponta Delgada has the lowest (Table V.2). The magnitude
difference between both is 4.5 fold. Excluding the capital (Ponta Delgada) and the three
smallest localities (Salga, Sete Cidades and Achada), we observe no major differences
between the values of FST.
To evaluate and quantify the diversity of surnames within each locality we calculated
Fisher’s α. The smallest locality, Salga, and the largest one, Ponta Delgada, have the
extreme values of α, 17.36 and 78.12, respectively. Furnas possesses one of the highest
values (α=56.49), indicating that although it is a small place it contains a high degree of
surname diversity. In close relation with the Fisher’s α is the degree of migration based
on Karlin-McGregor’s ν parameter. Once more, the smallest localities – Salga and Sete
Cidades – possess higher values of ν (0.123 and 0.130, respectively) when compared to
the city of Ponta Delgada (ν=0.013). Surprisingly, Furnas shows a high value of ν
117
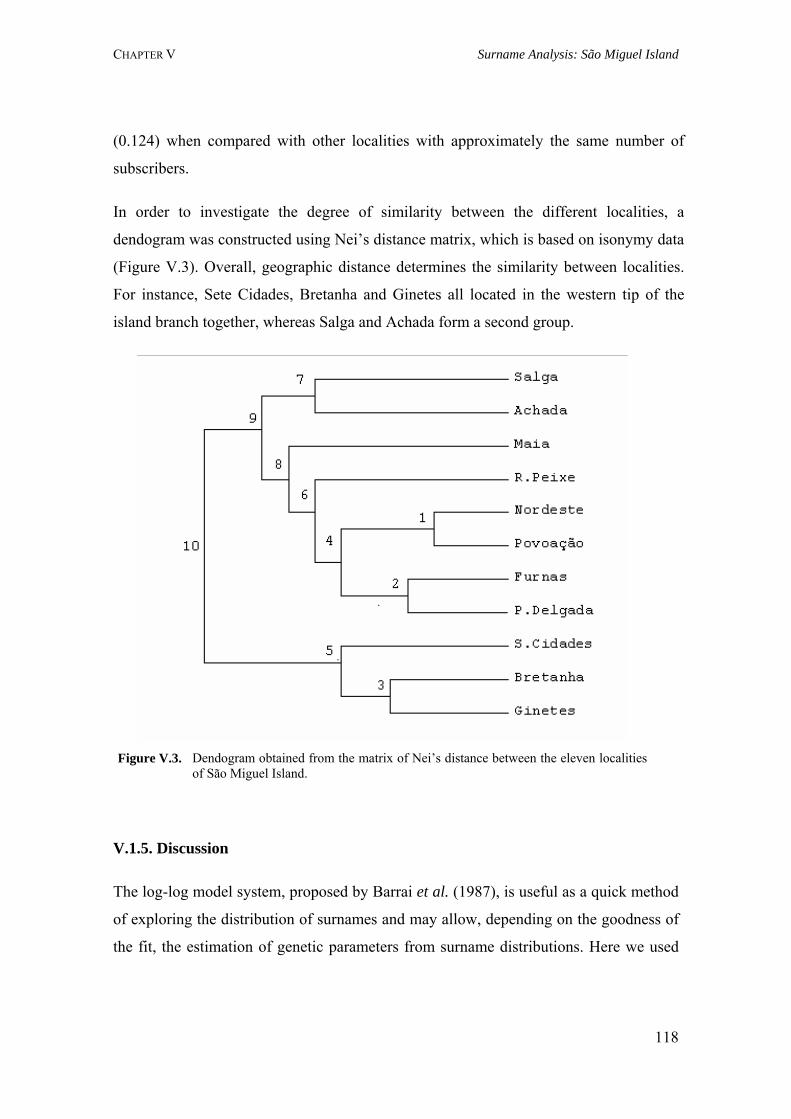
CHAPTER V Surname Analysis: São Miguel Island
(0.124) when compared with other localities with approximately the same number of
subscribers.
In order to investigate the degree of similarity between the different localities, a
dendogram was constructed using Nei’s distance matrix, which is based on isonymy data
(Figure V.3). Overall, geographic distance determines the similarity between localities.
For instance, Sete Cidades, Bretanha and Ginetes all located in the western tip of the
island branch together, whereas Salga and Achada form a second group.
Figure V.3. Dendogram obtained from the matrix of Nei’s distance between the eleven localities
of São Miguel Island.
V.1.5. Discussion
The log-log model system, proposed by Barrai et al. (1987), is useful as a quick method
of exploring the distribution of surnames and may allow, depending on the goodness of
the fit, the estimation of genetic parameters from surname distributions. Here we used
118
CHAPTER V Surname Analysis: São Miguel Island
this method to demonstrate that the population structure of São Miguel Island can be
studied using isonymy data.
The settlement of the Azorean archipelago began in the early 15th century, mainly by
Portuguese people from north and central mainland Portugal. Indeed, the historical
registers suggest that the surnames with the highest frequency in São Miguel population
today – Medeiros, Sousa and Silva – came originally from northern Portugal (Sousa
2001). According to Rodriguez-Larralde et al. (1994) frequent surnames correspond to
the portion of the population which settled in the locality earlier, and, thus, has had the
opportunity to spread surnames through its descendants. A branch of the Medeiros
family settled in São Miguel Island during the early 15th century, suggesting that a large
fraction of the Medeiros today may have a common genetic origin. In contrast, around
45% of the surnames present in the telephone list appear only once, suggesting recent
entries in São Miguel. Indeed, 25% of those are of foreign origin, mainly from northern
Europe.
To gain a further understanding of the population structure of São Miguel, we studied
eleven localities using the following indicators: isonymy (I), Fisher’s α (α) and
Karlin-McGregor’s ν (ν). The data show that the smallest localities of Salga, Achada
and Sete Cidades have the highest values of isonymy and a high concentration of very
few surnames, suggesting sedentarism (Table V.2). On the other hand, the high values
of Karlin-McGregor’s ν may indicate migration of people to other localities, leading to
a diminution of the diversity of surnames. The estimation of Fisher’s α permits the
assessment of the richness of surnames present in each locality – low values of α imply
less genetic variation. Again, Salga, Sete Cidades and Achada, with lower values of α,
display less genetic diversity. As expected, Ponta Delgada has the highest value of
Fisher’s α and the lowest value of migration rate (ν). Some authors (Rodriguez-Larralde
et al. 1994; Barrai et al. 1996) consider that the localities with higher values of
migration rate are genetically more diverse. If that is the case, Ponta Delgada would
have low genetic diversity, which is not confirmed by the values of α obtained in this
study. Possibly, the discrepancy of these values is due to the large variation of the
119
CHAPTER V Surname Analysis: São Miguel Island
number of subscribers observed in the small localities, Salga, Achada and Sete Cidades,
compared to the city, Ponta Delgada (Table V.1).
In order to describe the effect of population structure on the degree of inbreeding at a
given population subdivision, Wright (1921) created the fixation index. From this model
evolved the concept of FST, defined as an indicator of genetic differentiation and random
inbreeding. Our results show that Salga, Sete Cidades and Achada are highly inbred,
thus, confirming the bigger differentiation and effective isolation of these localities
when compared to the others. According to the classification proposed by Wright
(1984), the value of FST for the whole island reveals little genetic differentiation
(FST<0.05). However, small values of FST may still be significant when analysing very
young populations (10-20 generations), such as, the Azorean population (~27
generations).
High correlations between genetic and geographic distances reflect a significant effect
of the latter on the genetic variation between populations (Relethford 1982). In addition,
there is a tendency to observe low correlation between geographic and surname distance
in recently founded populations, while high correlations are detected in well established
groups. This reflects the accumulation of the effect of isolation by distance over time
(Jorde 1989). Although the population of São Miguel is young, the multivariate cluster
analysis may indicate moderate correlation between geographic and genetic distances
(Pearson’s r=0.37, p<0.01), where the closer the distance of localities, the higher is the
chance of clustering. Furnas represents an exception, since it clusters with Ponta
Delgada (Figure V.3). This is explained by the fact that Furnas is a touristic location and
many people, mainly from Ponta Delgada, have summer houses there. In addition, Salga
and Achada, which belong to the political subdivision of Nordeste, form a single cluster,
apart from Nordeste. This may be due to geographic barriers, which hinder
communication between Nordeste and Salga/ Achada, as opposed to Nordeste and
Povoação (Figure V.1). The cluster formed by Ginetes, Bretanha and Sete Cidades
branch off from the rest of the tree, implying a greater isolation. Natural barriers, such
as, mountains, have kept certain areas isolated. We point out that no phylogenetic
relationship between localities is implied from the data.
120
CHAPTER V Surnames Analysis: Azores structure
V. 2. Surnames in Azores: Analysis of the isonymy structure
V.2.1. Summary
Geographic isolation is a significant factor to consider when characterizing human
populations. The knowledge of the genetic structure of isolated populations has been of
great importance to disease locus positioning and gene identification. In order to
investigate the genetic structure of the Azorean population, we conducted a survey
based on the frequencies of surnames listed in the 2001 telephone book. We calculated
the following parameters: Isonymy (I), random component of inbreeding (FST), genetic
diversity according to Fisher (α), Karlin-McGregor’s migration rate (ν) and Nei’s
distance. In a total of 1271 subscribers and 163 different surnames, Graciosa Island
presents the lowest value of abundance of surnames (α=15.75), suggesting great genetic
isolation when compared to the other eight islands. Migration, based on the diversity of
surnames within islands, ranges from 0.2747 (Corvo Island) to 0.0026 (São Miguel
Island), indicating that people migrate preferentially towards the economically more
developed islands. The value of the random component of inbreeding obtained for the
whole population (FST=0.0039) indicates little genetic differentiation (Wright’s
FST<0.05). Moreover, isonymy similarity revealed by UPGMA method shows three
subclusters corresponding to the geographic distribution of the islands.
V.2.2. Introduction
In societies where surnames run through paternal line, surnames may simulate neutral
alleles transmitted only by the Y-chromosome. This aspect of surnames, in addition to
their easy access and manipulation, makes them useful to study population structure
(Pettener et al. 1998). Recently, we used surnames to characterize the population
structure of the biggest island of the Azores, São Miguel (Branco and Mota-Vieira
2003). The value of random component of inbreeding (FST=0.0016) obtained for São
Miguel´s population indicated little genetic differentiation. Here we extended our
analysis of surnames to include the whole archipelago, using data obtained on the 2001
121
CHAPTER V Surnames Analysis: Azores structure
telephone book. We focus our analysis on surname distribution among the islands,
taking into account the geographic feature of the archipelago.
V.2.3. Material and Methods
Azores is composed of nine islands divided into three groups designated according to
their geographical location: (i) Western group, Corvo and Flores; (ii) Central group,
Terceira, Graciosa, Pico, Faial and São Jorge; and (iii) Eastern group, São Miguel and
Santa Maria (see map on Figure V.5). We based our study on surnames listed in the
2001 Azorean telephone book, which is alphabetically ordered by subscriber’s last
surname. This corresponds to the father’s last surname, which is the only surname
considered in this study. We first determined the total number of subscribers to produce
a list of unique surnames for each island. We also computed a list of different surnames
for the whole archipelago. We considered surnames with the same phonetics (e.g.
Ataíde and Athayde) as different, because they may have simultaneous temporal origin,
but may not derivate from the same individual. In addition, we did not consider
commercial surnames.
Surname distribution was studied fitting a regression line to log2-log2 transformation of
the number of surnames, S, which are represented k times (Barrai et al. 1987). The
frequency of surnames was used to calculate the following parameters: Isonymy (I),
random component of inbreeding (FST), Fisher’s α (α), Karlin-McGregor’s ν (ν) and
Nei’s genetic distance, according to methods described in Branco and Mota-Vieira
(2003).
V.2.4. Results and Discussion
V.2.4.1. Surname distribution in Azorean population
The population studied here contains 57,387 subscribers, representing 23.7% of the
population and about 80% of the total number of Azorean families. Overall, we
122
CHAPTER V Surnames Analysis: Azores structure
computed 2451 different surnames. The discrepancy between the numbers of subscribers
among the islands reflects the difference in population size (Table V.4). In addition, the
islands with the highest level of economic development, São Miguel, Terceira and Faial,
have the highest number of different surnames, 1315, 1198 and 480, respectively (Table
V.4). The most common surnames overall are Silva (5.1% of the total subscribers),
Sousa (3.3%) and Medeiros (2.9%), names that come originally from northern Portugal,
(Sousa 2001). Interestingly, the most frequent surnames in Flores and Corvo are not in
the group of 20th most frequent surnames in Azores, although they are common in the
archipelago.
Figure V.4 shows the graph relating the number of times that a surname appears, k, with
the number of surnames that have an equal absolute frequency, S. According to Barrai
et al. (1987) surnames distribution that are almost exactly linearized by a log-log
transformation, fit the Karlin-McGregor model and allow the estimation of genetic
parameters. Our distribution meets the above condition, therefore, we carried on our
surname analysis using several isonymy parameters.
V.2.4.2. Isonymy parameters
The genetic structure of the Azorean population was studied using the following
isonymy parameters: Isonymy (I), Fisher’s α (α) and Karlin-McGregor’s ν (ν). Table
V.4 summarizes the data obtained. The values of isonymy are similar in all islands, with
the exception of Graciosa, which shows the highest value of isonymy (0.0635). This
result, in addition to a low value of migration rate (0.0122), suggests that people in
Graciosa have become sedentary.
A high isonymy in Graciosa reflects diminished genetic diversity, indicated by a very
low value of α (15.75). In contrast, Terceira has the highest value of Fisher’s α, 90.91, a
result of an increase in foreign surnames due to the American air base stationed on that
123
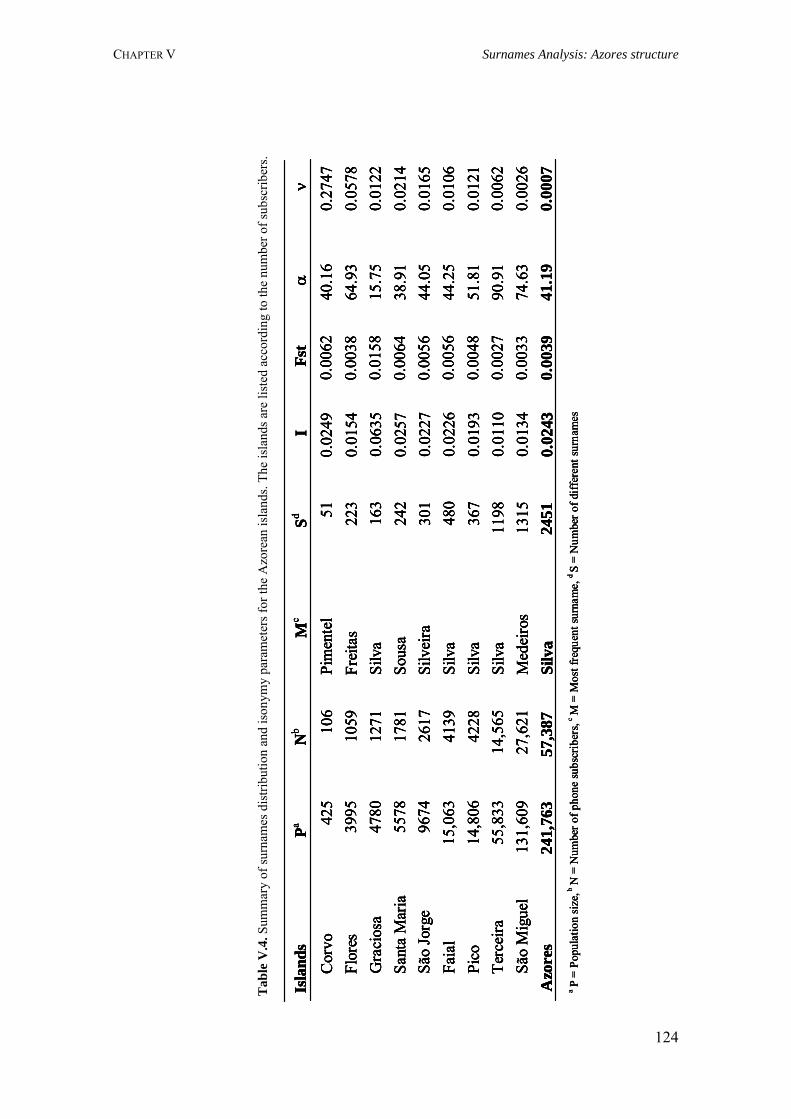
CHAPTER V Surnames Analysis: Azores structure
Tab
le V
.4. S
umm
ary
of su
rnam
es d
istri
butio
n an
d is
onym
y pa
ram
eter
s for
the
Azo
rean
isla
nds.
The
isla
nds a
re li
sted
acc
ordi
ng to
the
num
ber o
f sub
scrib
ers.
Isla
nds
PaN
bM
cSd
IFs
tα
ν
Cor
vo42
510
6Pi
men
tel
510.
0249
0.00
6240
.16
0.27
47Fl
ores
3995
1059
Frei
tas
223
0.01
540.
0038
64.9
30.
0578
Gra
cios
a47
8012
71Si
lva
163
0.06
350.
0158
15.7
50.
0122
Sant
a M
aria
5578
1781
Sous
a24
20.
0257
0.00
6438
.91
0.02
14Sã
o Jo
rge
9674
2617
Silv
eira
301
0.02
270.
0056
44.0
50.
0165
Faia
l15
,063
4139
Silv
a48
00.
0226
0.00
5644
.25
0.01
06Pi
co14
,806
4228
Silv
a36
70.
0193
0.00
4851
.81
0.01
21Te
rcei
ra55
,833
14,5
65Si
lva
1198
0.01
100.
0027
90.9
10.
0062
São
Mig
uel
131,
609
27,6
21M
edei
ros
1315
0.01
340.
0033
74.6
30.
0026
Azo
res
241,
763
57,3
87Si
lva
2451
0.02
430.
0039
41.1
90.
0007
aP
= Po
pula
tion
size
,b N
= N
umbe
rofp
hone
subs
crib
ers,
c M
= M
ostf
requ
ents
urna
me,
d S
= N
umbe
rofd
iffer
ents
urna
mes
Isla
nds
PaN
bM
cSd
IFs
tα
ν
Cor
vo42
510
6Pi
men
tel
510.
0249
0.00
6240
.16
0.27
47Fl
ores
3995
1059
Frei
tas
223
0.01
540.
0038
64.9
30.
0578
Gra
cios
a47
8012
71Si
lva
163
0.06
350.
0158
15.7
50.
0122
Sant
a M
aria
5578
1781
Sous
a24
20.
0257
0.00
6438
.91
0.02
14Sã
o Jo
rge
9674
2617
Silv
eira
301
0.02
270.
0056
44.0
50.
0165
Faia
l15
,063
4139
Silv
a48
00.
0226
0.00
5644
.25
0.01
06Pi
co14
,806
4228
Silv
a36
70.
0193
0.00
4851
.81
0.01
21Te
rcei
ra55
,833
14,5
65Si
lva
1198
0.01
100.
0027
90.9
10.
0062
São
Mig
uel
131,
609
27,6
21M
edei
ros
1315
0.01
340.
0033
74.6
30.
0026
Azo
res
241,
763
57,3
87Si
lva
2451
0.02
43
Isla
nds
PaN
bM
cSd
IFs
tα
ν
Cor
vo42
510
6Pi
men
tel
510.
0249
0.00
6240
.16
0.27
47Fl
ores
3995
1059
Frei
tas
223
0.01
540.
0038
64.9
30.
0578
Gra
cios
a47
8012
71Si
lva
163
0.06
350.
0158
15.7
50.
0122
Sant
a M
aria
5578
1781
Sous
a24
20.
0257
0.00
6438
.91
0.02
14Sã
o Jo
rge
9674
2617
Silv
eira
301
0.02
270.
0056
44.0
50.
0165
Faia
l15
,063
4139
Silv
a48
00.
0226
0.00
5644
.25
0.01
06Pi
co14
,806
4228
Silv
a36
70.
0193
0.00
4851
.81
0.01
21Te
rcei
ra55
,833
14,5
65Si
lva
1198
0.01
100.
0027
90.9
10.
0062
São
Mig
uel
131,
609
27,6
21M
edei
ros
1315
0.01
340.
0033
74.6
30.
0026
Azo
res
241,
763
57,3
87Si
lva
2451
0.02
430.
0039
41.1
90.
0007
aP
= Po
pula
tion
size
,b N
= N
umbe
rofp
hone
subs
crib
ers,
c M
= M
ostf
requ
ents
urna
me,
d S
= N
umbe
rofd
iffer
ents
urna
mes
124
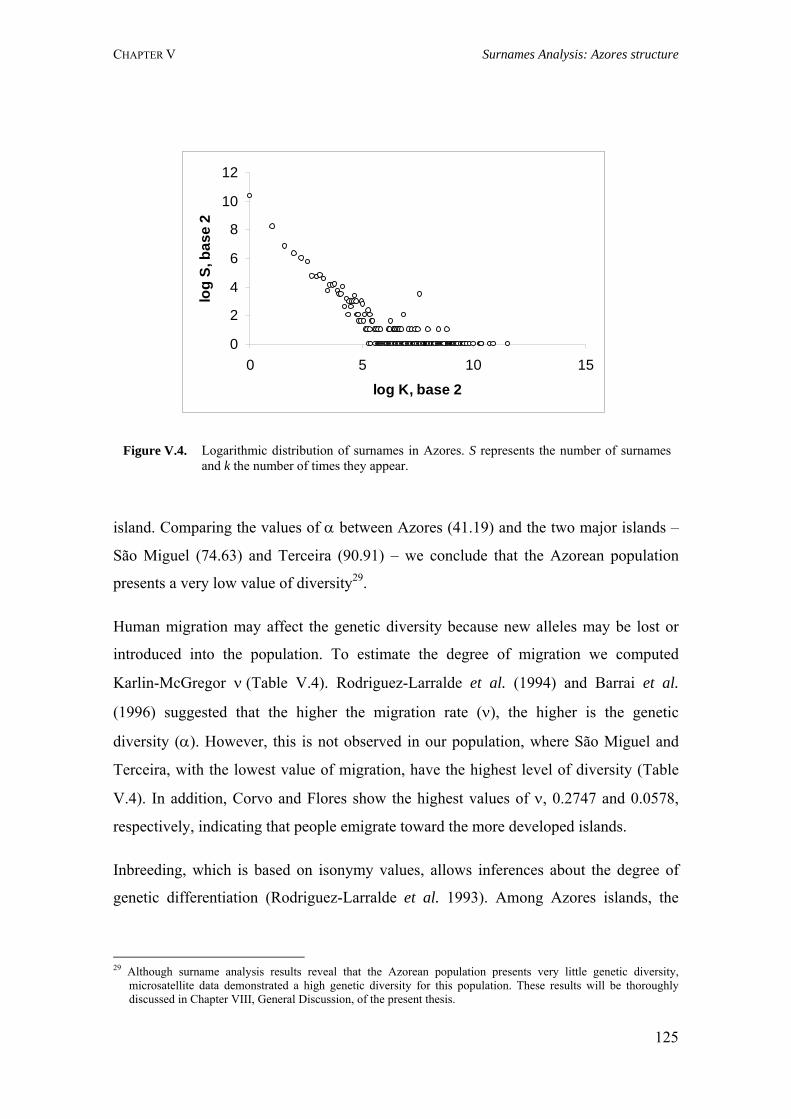
CHAPTER V Surnames Analysis: Azores structure
0
2
4
6
8
10
12
0 5 10 15
log K, base 2
log
S, b
ase
2
Figure V.4. Logarithmic distribution of surnames in Azores. S represents the number of surnames and k the number of times they appear.
island. Comparing the values of α between Azores (41.19) and the two major islands –
São Miguel (74.63) and Terceira (90.91) – we conclude that the Azorean population
presents a very low value of diversity29.
Human migration may affect the genetic diversity because new alleles may be lost or
introduced into the population. To estimate the degree of migration we computed
Karlin-McGregor ν (Table V.4). Rodriguez-Larralde et al. (1994) and Barrai et al.
(1996) suggested that the higher the migration rate (ν), the higher is the genetic
diversity (α). However, this is not observed in our population, where São Miguel and
Terceira, with the lowest value of migration, have the highest level of diversity (Table
V.4). In addition, Corvo and Flores show the highest values of ν, 0.2747 and 0.0578,
respectively, indicating that people emigrate toward the more developed islands.
Inbreeding, which is based on isonymy values, allows inferences about the degree of
genetic differentiation (Rodriguez-Larralde et al. 1993). Among Azores islands, the
29 Although surname analysis results reveal that the Azorean population presents very little genetic diversity,
microsatellite data demonstrated a high genetic diversity for this population. These results will be thoroughly discussed in Chapter VIII, General Discussion, of the present thesis.
125
CHAPTER V Surnames Analysis: Azores structure
values of FST are comparable, indicating a certain degree of population homogeneity.
Interestingly, Graciosa, with the lowest value of surname diversity (α), now displays the
highest value of inbreeding, suggesting higher genetic differentiation and isolation from
other islands. We compared our data with that of two other very young and isolated
populations, Kings County in New York (Christensen 2000), and Bedford County in
Pennsylvania (Christensen 1999), and we observed that Azores presents a higher value
of FST, thus, a higher inbreeding. This supports the results obtained by Pacheco et al.
(2003), showing relatively higher rates of consanguineous marriages in Azores
compared to Madeira archipelago and mainland Portugal. On the other hand, according
to the classification proposed by Wright (1984), the value of FST for the Azores
archipelago (FST=0.0039) reveals little genetic differentiation. This value is in
agreement with previous observation for the island of São Miguel (Branco and
Mota-Vieira 2003), where low value of differentiation is also observed.
To estimate the degree of similarity between the islands we constructed a dendogram
based on a matrix of Nei’s genetic distance (Figure V.5). The data shows two major
clusters separating the Eastern group, São Miguel and Santa Maria, from the other 7
islands. São Miguel and Santa Maria were the first islands to be settled, and lately the
initial population dispersed, contributing to the settlement of the other islands. The
dendogram also shows a second division separating the Central group from Flores and
Corvo (Figure V.5). This is compatible with the geographic feature of the archipelago,
and the ease with which the population migrates within groups of islands. As expected,
Pico and Faial display close surname similarity, because there are regular boat
connections between both islands, facilitating interaction between individuals. In
addition, our data show that geographic distances are correlated with genetic distances
(r=0.726, p<0.0001), and that the closer the distance between the islands, the higher is
the chance of clustering.
V.2.5. Conclusions
Genetically isolated populations offer many advantages for mapping inherited traits.
Indeed, in cases of environmental and population homogeneity the dissection of such
126
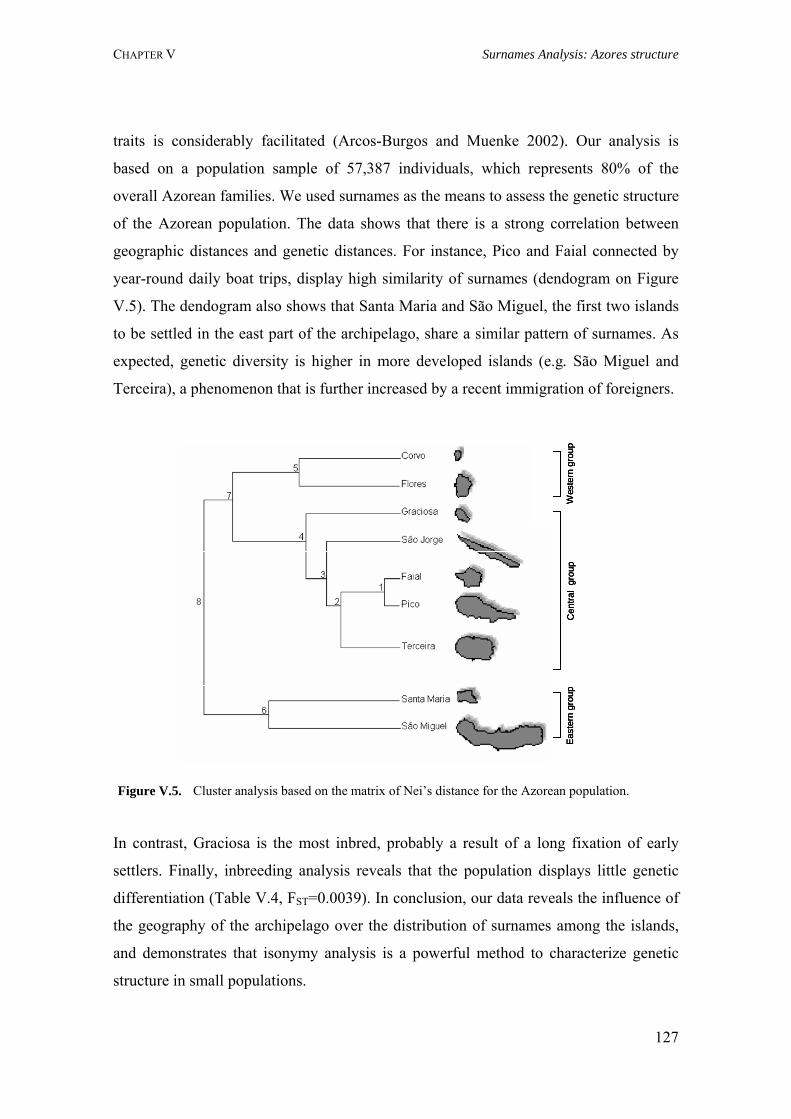
CHAPTER V Surnames Analysis: Azores structure
traits is considerably facilitated (Arcos-Burgos and Muenke 2002). Our analysis is
based on a population sample of 57,387 individuals, which represents 80% of the
overall Azorean families. We used surnames as the means to assess the genetic structure
of the Azorean population. The data shows that there is a strong correlation between
geographic distances and genetic distances. For instance, Pico and Faial connected by
year-round daily boat trips, display high similarity of surnames (dendogram on Figure
V.5). The dendogram also shows that Santa Maria and São Miguel, the first two islands
to be settled in the east part of the archipelago, share a similar pattern of surnames. As
expected, genetic diversity is higher in more developed islands (e.g. São Miguel and
Terceira), a phenomenon that is further increased by a recent immigration of foreigners.
Figure V.5. Cluster analysis based on the matrix of Nei’s distance for the Azorean population.
East
ern
grou
pW
este
rn g
roup
Cen
tral
grou
pEa
ster
n gr
oup
East
ern
grou
pW
este
rn g
roup
Wes
tern
gro
upC
entra
l gr
oup
Cen
tral
grou
p
In contrast, Graciosa is the most inbred, probably a result of a long fixation of early
settlers. Finally, inbreeding analysis reveals that the population displays little genetic
differentiation (Table V.4, FST=0.0039). In conclusion, our data reveals the influence of
the geography of the archipelago over the distribution of surnames among the islands,
and demonstrates that isonymy analysis is a powerful method to characterize genetic
structure in small populations.
127
CHAPTER V Surnames Analysis: Geography Surnames in Azores
V.3. Geography of surnames in Azores: Specificity and spatial distribution
analysis
V.3.1. Summary
In order to obtain a better understanding of the genetic structure of the Azorean
population, a specificity and spatial distribution analysis was performed based on 2454
different surnames present in the Azorean telephone directory (2002). We considered as
specific surnames those with an absolute frequency ratio equal or higher than 50%. The
results revealed 51 specific surnames in the whole archipelago. The smallest island
presents the only surname with 100% of specificity (Pedras). In addition, São Miguel
Island, which contains 54.4% of the Azorean population, has the highest number of
specific surnames (25 specific surnames). The spatial distribution analysis was used to
detect genetic similarity between municipalities through the calculation of spatial
autocorrelation (Moran’s I coefficient). Of the 240 surnames included in the analysis,
113 showed statistically significant patterns. Five different patterns were obtained, of
which the most relevant is isolation by distance and depression (41.6%). However,
43.4% had no defined pattern. The overall correlogram shows a majority of positive
values for distances lower than 49 km and between 269-309 km, indicating high
similarity between closer municipalities and between distant municipalities whose
populations show historic and socio-cultural affinities. In conclusion, our data are in
agreement with the historical background of the Azorean population.
V.3.2. Introduction
Azores (Portugal) constitutes an interesting model for studying internal processes of
differentiation; it has a particular orography, which confers a relative geographic and
cultural isolation (Branco and Mota-Vieira 2003, 2005). In the present work we carried
out further investigation into the genetics of the Azores, through analysis of specificity
and spatial distribution of surnames. Our main goal is to understand the geography of
surnames in the archipelago: mobility between the municipalities and between the
islands; and know the patterns of dispersion of individuals and genes.
128
CHAPTER V Surnames Analysis: Azores structure
V.3.3. Material and Methods
V.3.3.1. Dataset
Dataset includes all surnames transcribed from the 2002 telephone directory. The only
surname considered was the father’s last surname, since it is passed to the next
generation. Surnames with similar spelling or writing, such as, Cimbron and Cymbron,
were considered different. They may have simultaneous temporal origin, but may not
always derive from the same individual. Double subscriber registration, identified by
online service of PT communications30, was eliminated. This dataset excludes headings
of firms, organizations, hotels, etc. In addition, users were not distinguished by sex.
V.3.3.2. Specificity Analysis
Azores is composed of nine islands divided into three groups designated according to
their geographical location: (i) Western group, Corvo (Cor) and Flores (Flo); (ii) Central
group, Terceira (Ter), Graciosa (Gra), Pico (Pic), Faial (Fai) and São Jorge (Jor); and
(iii) Eastern group, São Miguel (Mig) and Santa Maria (Mar; Figure V.6). The
specificity analysis was performed using the 30 most frequent surnames present in each
island, because these surnames probably arrived with the first settlers. Surnames with
higher frequency in an island have, possibly, smaller frequency on the others, so they
will be specific of that island. We used their correspondent absolute frequency in the
island and in the archipelago. We then calculated the ratio island/ Azores for each
surname and ordered them accordingly. We only considered as specific surnames those
with a ratio equal or higher than 50%.
V.3.3.3. Spatial Autocorrelation Analysis
In the present study, we chose the total number (19) of municipalities (administrative
divisions) existing in the Azores archipelago (Figure V.6), because the autocorrelation
30 Online service of Portugal telecommunications - www.118.pt.
129
CHAPTER V Surnames Analysis: Azores structure
analysis needs a minimal number of populations − 15 to 25 (or more). Santa Maria,
Graciosa, Faial and Corvo islands have only one municipality each; Flores, Terceira and
São Jorge have two municipalities each; Pico has three municipalities; and São Miguel
has six.
Spatial autocorrelation summarizes the genetic similarity between populations in
relation to their geographical proximity. In particular, spatial autocorrelation helps to
focus on the similarity of values of a variable, i.e. the frequency of a surname, between
pairs of populations within arbitrary classes of distance (Caravello and Tasso 1999).
This method allows estimation of the spatial distribution of surnames in the considered
territory, in order to emphasize the specific processes of diffusion of the individuals. To
evaluate spatial autocorrelation we used Moran’s I coefficient (Moran 1950) applied to
a database of 240 surnames obtained from the total number of surnames present in the
archipelago. These surnames were chosen according to their absolute frequency in the
archipelago. Therefore, to obtain the maximum dispersion patterns, surnames with a
frequency higher than 23 were selected. The remaining 2214 different surnames show
low relative frequency in the archipelago; thus, not justifying their analysis.
The following formula permits an estimate of this autocorrelation coefficient:
n n n I=nΣΣwij(pi–p)(pj–p)/WΣ(pi–p)2
i=1j=1 i=1
where pi and pj are the relative frequency of surnames at the ith and jth locality, p is the
mean across the n municipalities, wij is equal to 1 for all the pairs of municipalities
falling in the studied distance class and equal to 0 for all the other pairs, and W is the
sum of all wij values in that distance class.
130
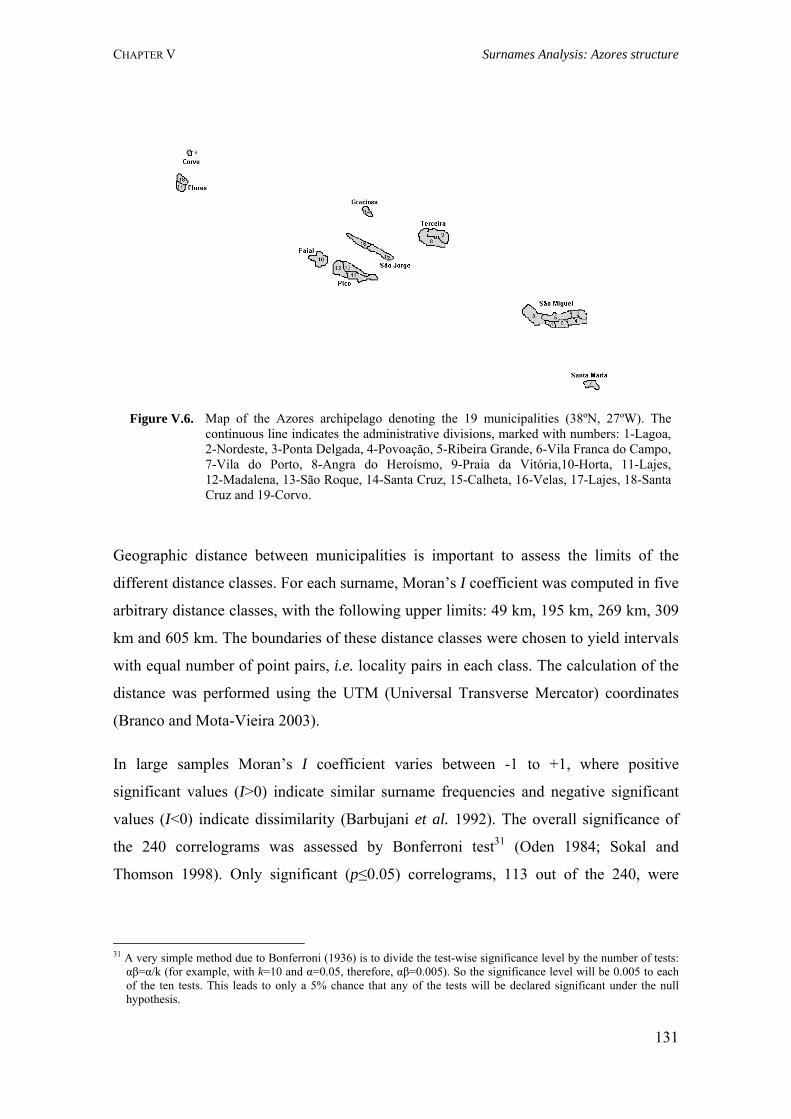
CHAPTER V Surnames Analysis: Azores structure
Figure V.6. Map of the Azores archipelago denoting the 19 municipalities (38ºN, 27ºW). The continuous line indicates the administrative divisions, marked with numbers: 1-Lagoa, 2-Nordeste, 3-Ponta Delgada, 4-Povoação, 5-Ribeira Grande, 6-Vila Franca do Campo, 7-Vila do Porto, 8-Angra do Heroísmo, 9-Praia da Vitória,10-Horta, 11-Lajes, 12-Madalena, 13-São Roque, 14-Santa Cruz, 15-Calheta, 16-Velas, 17-Lajes, 18-Santa Cruz and 19-Corvo.
Geographic distance between municipalities is important to assess the limits of the
different distance classes. For each surname, Moran’s I coefficient was computed in five
arbitrary distance classes, with the following upper limits: 49 km, 195 km, 269 km, 309
km and 605 km. The boundaries of these distance classes were chosen to yield intervals
with equal number of point pairs, i.e. locality pairs in each class. The calculation of the
distance was performed using the UTM (Universal Transverse Mercator) coordinates
(Branco and Mota-Vieira 2003).
In large samples Moran’s I coefficient varies between -1 to +1, where positive
significant values (I>0) indicate similar surname frequencies and negative significant
values (I<0) indicate dissimilarity (Barbujani et al. 1992). The overall significance of
the 240 correlograms was assessed by Bonferroni test31 (Oden 1984; Sokal and
Thomson 1998). Only significant (p≤0.05) correlograms, 113 out of the 240, were
31 A very simple method due to Bonferroni (1936) is to divide the test-wise significance level by the number of tests: αβ=α/k (for example, with k=10 and α=0.05, therefore, αβ=0.005). So the significance level will be 0.005 to each of the ten tests. This leads to only a 5% chance that any of the tests will be declared significant under the null hypothesis.
131
CHAPTER V Surnames Analysis: Azores structure
accepted for analysis. The patterns of autocorrelation coefficients were schematically
classified according to the spatial distributions, into: Isolation by distance and
depression (IBD+D), isolation by distance and double depression (IBD+DDP),
depression (D), intrusion (I) and long-distance differentiation (LDD; Barbujani 2000;
Barbujani and Sokal 1991).
In almost all cases, autocorrelation tends to be significant and positive at short
distances. This is likely the consequence of isolation by distance, when neighbouring
localities share a common gene pool (Barbujani 1987). The isolation by distance
patterns are usually associated with a depression, i.e. a decrease in surname similarity,
generally in long distance classes. However, simple depressions may also characterize
the mobility of a given surname. Long-distance differentiation patterns are described by
a positive autocorrelation in the first two distance classes. This will define regions of
homogenous gene frequencies. Moreover, autocorrelation is negative at large distances;
but the absolute values of Moran’s I are all small. Finally, the intrusion pattern reveals a
maximum similarity at one peak, indicating an entrance of a surname on that distance,
and negative autocorrelation is observed at both shorter and larger distances.
V.3.4. Results
V.3.4.1. Surname distribution
In this study, the population structure of Azores Islands was analyzed through the
computation of the frequency distribution of surnames from the telephone directory. In
Azores the use of the telephone is so widespread that directories include nearly all
resident families. Our dataset includes 55,528 subscribers, representing approximately
23% of the total population (Table V.5). We first calculated the surnames absolute
frequency for all municipalities. Out of the 2454 different surnames, 2038 (83%) have
absolute frequency lower than 10, but these correspond to only 3894 subscribers. The
remaining 51,634 subscribers correspond to 416 surnames that have an absolute
frequency greater than 10. This result demonstrates that a large fraction of the Azorean
population share few surnames.
132
CHAPTER V Surnames Analysis: Azores structure
In Table V.5 we summarize the distribution of the total surnames over the municipalities.
In this table we present some data relevant in the present study, as the number of families
and the number of subscribers with the 240 surnames studied by autocorrelation analysis
for the 19 municipalities. Note that the ratio of the number of subscribers over the
number of families shows the representation of our dataset (77%). Vila Nova do Corvo is
the smallest municipality with a sample size of 105 subscribers distributed by 51
different surnames. In contrast, Ponta Delgada contains 14,436 subscribers and 948
different surnames. The most frequent surname in the archipelago is Silva with a
frequency of 5.1%, Sousa is the second most common surname with 3.3%, followed by
Medeiros (3.0%), Melo (2.3%) and Costa (2.3%).
The absolute frequency of the surnames differs from one municipality to another, and
contiguous municipalities tend to have similar frequencies, a result of a possible past
diffusion effect. For example, in Pico Island, Silva is evenly distributed over the three
municipalities (131 subscribers in Madalena, 123 in Lajes and 81 in São Roque).
V.3.4.2. Specificity analysis
The influence of geographic discontinuity on surname diversity was studied through a
surname specificity analysis. Specific surnames may correspond to the portion of the
population that first settled in or may represent recent entries (Barrai et al. 1996). The
São Miguel Island shows the highest number of specific or autochthonous surnames,
being the most relevants: Cabral (with a ratio equal to 80%), Pacheco (81%), Medeiros
(83%), Cordeiro (87%), Rego (87%), Arruda (88%), Botelho (89%), Ponte (90%),
Raposo (90%) and Carreiro (91%; Table V.6). Islands Pico and São Jorge only have one
specific surname: Jorge and Brasil, respectively, both with a ratio equal to 54%. The
island of Santa Maria showed five specific surnames: Moura (52%), Figueiredo (59%),
Chaves (59%), Bairos (80%) and Leandres (93%). Corvo Island is the only one that has a
surname with 100% of specificity (Pedras), but this includes only two subscribers. On
average there are six specific surnames per island (Table V.6).
133
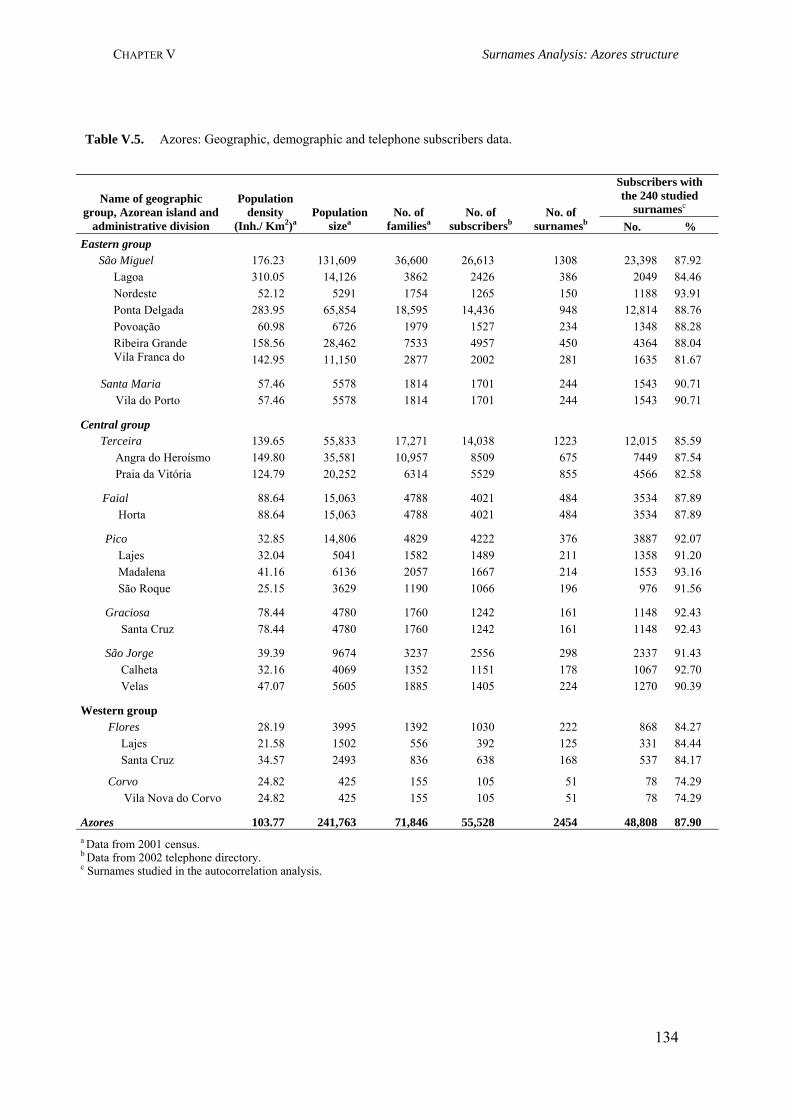
CHAPTER V Surnames Analysis: Azores structure
Table V.5. Azores: Geographic, demographic and telephone subscribers data.
Subscribers with the 240 studied
surnamescName of geographic
group, Azorean island and administrative division
Population density
(Inh./ Km2)aPopulation
sizeaNo. of
familiesaNo. of
subscribersbNo. of
surnamesb No. % Eastern group
São Miguel 176.23 131,609 36,600 26,613 1308 23,398 87.92 Lagoa 310.05 14,126 3862 2426 386 2049 84.46 Nordeste 52.12 5291 1754 1265 150 1188 93.91 Ponta Delgada 283.95 65,854 18,595 14,436 948 12,814 88.76 Povoação 60.98 6726 1979 1527 234 1348 88.28 Ribeira Grande 158.56 28,462 7533 4957 450 4364 88.04 Vila Franca do C
142.95 11,150 2877 2002 281 1635 81.67
Santa Maria 57.46 5578 1814 1701 244 1543 90.71 Vila do Porto 57.46 5578 1814 1701 244 1543 90.71
Central group Terceira 139.65 55,833 17,271 14,038 1223 12,015 85.59
Angra do Heroísmo 149.80 35,581 10,957 8509 675 7449 87.54 Praia da Vitória 124.79 20,252 6314 5529 855 4566 82.58
Faial 88.64 15,063 4788 4021 484 3534 87.89 Horta 88.64 15,063 4788 4021 484 3534 87.89
Pico 32.85 14,806 4829 4222 376 3887 92.07 Lajes 32.04 5041 1582 1489 211 1358 91.20 Madalena 41.16 6136 2057 1667 214 1553 93.16 São Roque 25.15 3629 1190 1066 196 976 91.56
Graciosa 78.44 4780 1760 1242 161 1148 92.43 Santa Cruz 78.44 4780 1760 1242 161 1148 92.43
São Jorge 39.39 9674 3237 2556 298 2337 91.43 Calheta 32.16 4069 1352 1151 178 1067 92.70 Velas 47.07 5605 1885 1405 224 1270 90.39
Western group Flores 28.19 3995 1392 1030 222 868 84.27
Lajes 21.58 1502 556 392 125 331 84.44 Santa Cruz 34.57 2493 836 638 168 537 84.17
Corvo 24.82 425 155 105 51 78 74.29 Vila Nova do Corvo 24.82 425 155 105 51 78 74.29
Azores 103.77 241,763 71,846 55,528 2454 48,808 87.90 a Data from 2001 census. b Data from 2002 telephone directory. c Surnames studied in the autocorrelation analysis.
134
CHAPTER V Surnames Analysis: Azores structure
V.3.4.3. Spatial autocorrelation analysis (Moran’s I coefficient)
Spatial autocorrelation refers to the genetic similarity between populations in relation to
their geographical proximity. In our dataset, this analysis reveals that 113 surnames
have a statistically significant pattern, of which 41.6% show IBD+D pattern, 9.7% have
an intrusion pattern, 2.7% contain a LDD pattern, 1.8% corresponds to a depression
pattern, 0.9% encloses an IBD+DDP pattern, and 43.4% have no defined pattern (Table
V.7). Out of the 565 data points, which correspond to the individual autocorrelation
coefficients, 249 (44%) are significant (Table V.7). The majority of individual
coefficients were smaller than 0.20, revealing low similarity of surnames between the
five different distance classes. The highest Moran’s I coefficient at class 1 (0-49 km) is
0.71 for Pacheco, followed by Alvernaz with 0.63.
The 113 Bonferroni significant correlograms were superimposed according to distinct
classes and plotted (Figure V.7). Positive autocorrelation is higher at distances up to 49
km, but maintains relatively positive until distances up to 142 km, changing to negative
autocorrelation at greater distances. It increases again to positive values in distance class
4 (269-309 km), switching back to negative in the last distance class. The patterns of
autocorrelation indicate that after 50 km surname similarity is sharply reduced (Figure
V.7). Similar correlograms were averaged to provide summary information of each of
the 5 main patterns (Figure V.8).
135
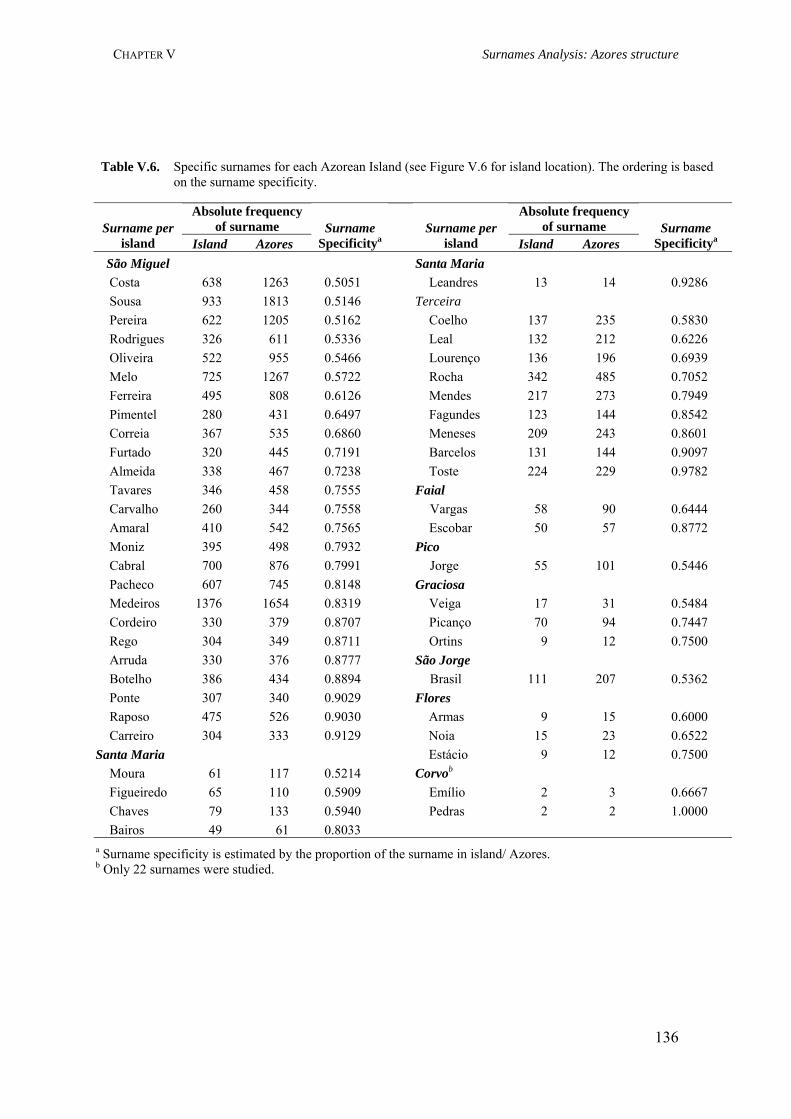
CHAPTER V Surnames Analysis: Azores structure
Table V.6. Specific surnames for each Azorean Island (see Figure V.6 for island location). The ordering is based
on the surname specificity.
Absolute frequency of surname
Absolute frequency of surname Surname per
island Island Azores Surname
Specificitya Surname per
island Island Azores Surname
Specificitya
São Miguel Santa Maria Costa 638 1263 0.5051 Leandres 13 14 0.9286 Sousa 933 1813 0.5146 Terceira Pereira 622 1205 0.5162 Coelho 137 235 0.5830 Rodrigues 326 611 0.5336 Leal 132 212 0.6226 Oliveira 522 955 0.5466 Lourenço 136 196 0.6939 Melo 725 1267 0.5722 Rocha 342 485 0.7052 Ferreira 495 808 0.6126 Mendes 217 273 0.7949 Pimentel 280 431 0.6497 Fagundes 123 144 0.8542 Correia 367 535 0.6860 Meneses 209 243 0.8601 Furtado 320 445 0.7191 Barcelos 131 144 0.9097 Almeida 338 467 0.7238 Toste 224 229 0.9782 Tavares 346 458 0.7555 Faial Carvalho 260 344 0.7558 Vargas 58 90 0.6444 Amaral 410 542 0.7565 Escobar 50 57 0.8772 Moniz 395 498 0.7932 Pico Cabral 700 876 0.7991 Jorge 55 101 0.5446 Pacheco 607 745 0.8148 Graciosa Medeiros 1376 1654 0.8319 Veiga 17 31 0.5484 Cordeiro 330 379 0.8707 Picanço 70 94 0.7447 Rego 304 349 0.8711 Ortins 9 12 0.7500 Arruda 330 376 0.8777 São Jorge Botelho 386 434 0.8894 Brasil 111 207 0.5362 Ponte 307 340 0.9029 Flores Raposo 475 526 0.9030 Armas 9 15 0.6000 Carreiro 304 333 0.9129 Noia 15 23 0.6522
Santa Maria Estácio 9 12 0.7500 Moura 61 117 0.5214 Corvob Figueiredo 65 110 0.5909 Emílio 2 3 0.6667 Chaves 79 133 0.5940 Pedras 2 2 1.0000 Bairos 49 61 0.8033
a Surname specificity is estimated by the proportion of the surname in island/ Azores. b Only 22 surnames were studied.
136
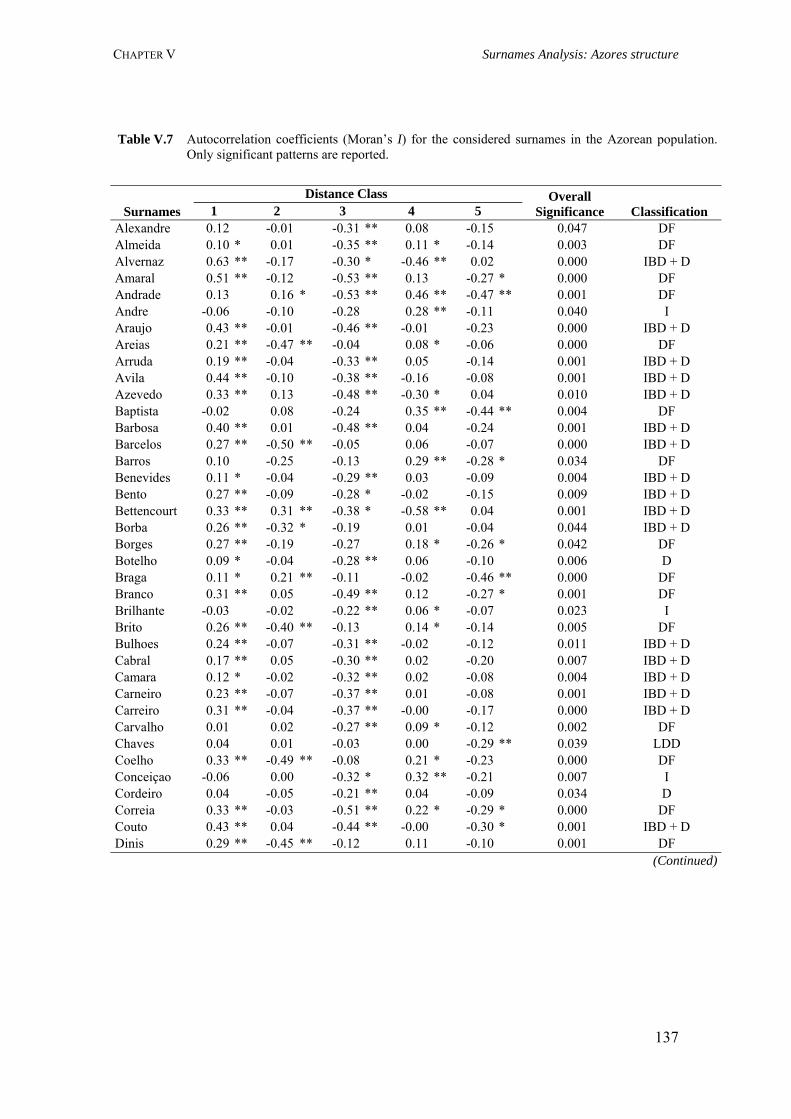
CHAPTER V Surnames Analysis: Azores structure
Table V.7 Autocorrelation coefficients (Moran’s I) for the considered surnames in the Azorean population. Only significant patterns are reported.
Distance Class Surnames 1 2 3 4 5
Overall Significance Classification
Alexandre 0.12 -0.01 -0.31 ** 0.08 -0.15 0.047 DF Almeida 0.10 * 0.01 -0.35 ** 0.11 * -0.14 0.003 DF Alvernaz 0.63 ** -0.17 -0.30 * -0.46 ** 0.02 0.000 IBD + D Amaral 0.51 ** -0.12 -0.53 ** 0.13 -0.27 * 0.000 DF Andrade 0.13 0.16 * -0.53 ** 0.46 ** -0.47 ** 0.001 DF Andre -0.06 -0.10 -0.28 0.28 ** -0.11 0.040 I Araujo 0.43 ** -0.01 -0.46 ** -0.01 -0.23 0.000 IBD + D Areias 0.21 ** -0.47 ** -0.04 0.08 * -0.06 0.000 DF Arruda 0.19 ** -0.04 -0.33 ** 0.05 -0.14 0.001 IBD + D Avila 0.44 ** -0.10 -0.38 ** -0.16 -0.08 0.001 IBD + D Azevedo 0.33 ** 0.13 -0.48 ** -0.30 * 0.04 0.010 IBD + D Baptista -0.02 0.08 -0.24 0.35 ** -0.44 ** 0.004 DF Barbosa 0.40 ** 0.01 -0.48 ** 0.04 -0.24 0.001 IBD + D Barcelos 0.27 ** -0.50 ** -0.05 0.06 -0.07 0.000 IBD + D Barros 0.10 -0.25 -0.13 0.29 ** -0.28 * 0.034 DF Benevides 0.11 * -0.04 -0.29 ** 0.03 -0.09 0.004 IBD + D Bento 0.27 ** -0.09 -0.28 * -0.02 -0.15 0.009 IBD + D Bettencourt 0.33 ** 0.31 ** -0.38 * -0.58 ** 0.04 0.001 IBD + D Borba 0.26 ** -0.32 * -0.19 0.01 -0.04 0.044 IBD + D Borges 0.27 ** -0.19 -0.27 0.18 * -0.26 * 0.042 DF Botelho 0.09 * -0.04 -0.28 ** 0.06 -0.10 0.006 D Braga 0.11 * 0.21 ** -0.11 -0.02 -0.46 ** 0.000 DF Branco 0.31 ** 0.05 -0.49 ** 0.12 -0.27 * 0.001 DF Brilhante -0.03 -0.02 -0.22 ** 0.06 * -0.07 0.023 I Brito 0.26 ** -0.40 ** -0.13 0.14 * -0.14 0.005 DF Bulhoes 0.24 ** -0.07 -0.31 ** -0.02 -0.12 0.011 IBD + D Cabral 0.17 ** 0.05 -0.30 ** 0.02 -0.20 0.007 IBD + D Camara 0.12 * -0.02 -0.32 ** 0.02 -0.08 0.004 IBD + D Carneiro 0.23 ** -0.07 -0.37 ** 0.01 -0.08 0.001 IBD + D Carreiro 0.31 ** -0.04 -0.37 ** -0.00 -0.17 0.000 IBD + D Carvalho 0.01 0.02 -0.27 ** 0.09 * -0.12 0.002 DF Chaves 0.04 0.01 -0.03 0.00 -0.29 ** 0.039 LDD Coelho 0.33 ** -0.49 ** -0.08 0.21 * -0.23 0.000 DF Conceiçao -0.06 0.00 -0.32 * 0.32 ** -0.21 0.007 I Cordeiro 0.04 -0.05 -0.21 ** 0.04 -0.09 0.034 D Correia 0.33 ** -0.03 -0.51 ** 0.22 * -0.29 * 0.000 DF Couto 0.43 ** 0.04 -0.44 ** -0.00 -0.30 * 0.001 IBD + D Dinis 0.29 ** -0.45 ** -0.12 0.11 -0.10 0.001 DF (Continued)
137
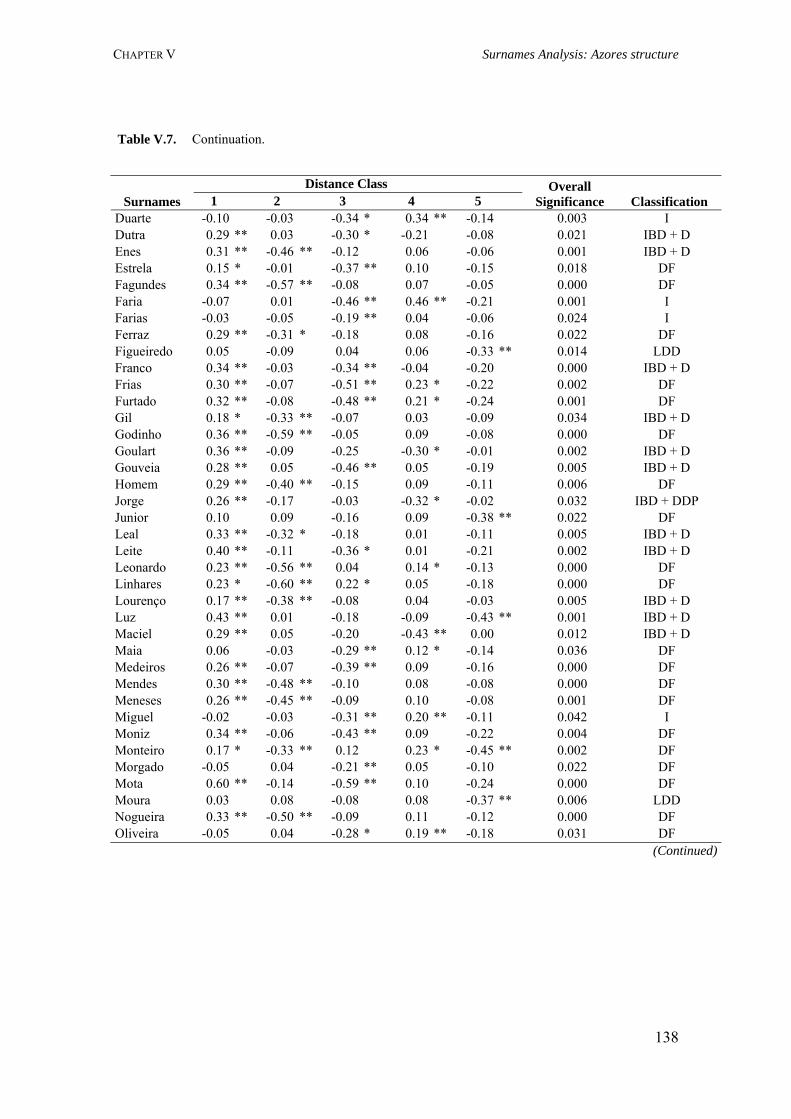
CHAPTER V Surnames Analysis: Azores structure
Table V.7. Continuation.
Distance Class Surnames 1 2 3 4 5
Overall Significance Classification
Duarte -0.10 -0.03 -0.34 * 0.34 ** -0.14 0.003 I Dutra 0.29 ** 0.03 -0.30 * -0.21 -0.08 0.021 IBD + D Enes 0.31 ** -0.46 ** -0.12 0.06 -0.06 0.001 IBD + D Estrela 0.15 * -0.01 -0.37 ** 0.10 -0.15 0.018 DF Fagundes 0.34 ** -0.57 ** -0.08 0.07 -0.05 0.000 DF Faria -0.07 0.01 -0.46 ** 0.46 ** -0.21 0.001 I Farias -0.03 -0.05 -0.19 ** 0.04 -0.06 0.024 I Ferraz 0.29 ** -0.31 * -0.18 0.08 -0.16 0.022 DF Figueiredo 0.05 -0.09 0.04 0.06 -0.33 ** 0.014 LDD Franco 0.34 ** -0.03 -0.34 ** -0.04 -0.20 0.000 IBD + D Frias 0.30 ** -0.07 -0.51 ** 0.23 * -0.22 0.002 DF Furtado 0.32 ** -0.08 -0.48 ** 0.21 * -0.24 0.001 DF Gil 0.18 * -0.33 ** -0.07 0.03 -0.09 0.034 IBD + D Godinho 0.36 ** -0.59 ** -0.05 0.09 -0.08 0.000 DF Goulart 0.36 ** -0.09 -0.25 -0.30 * -0.01 0.002 IBD + D Gouveia 0.28 ** 0.05 -0.46 ** 0.05 -0.19 0.005 IBD + D Homem 0.29 ** -0.40 ** -0.15 0.09 -0.11 0.006 DF Jorge 0.26 ** -0.17 -0.03 -0.32 * -0.02 0.032 IBD + DDP Junior 0.10 0.09 -0.16 0.09 -0.38 ** 0.022 DF Leal 0.33 ** -0.32 * -0.18 0.01 -0.11 0.005 IBD + D Leite 0.40 ** -0.11 -0.36 * 0.01 -0.21 0.002 IBD + D Leonardo 0.23 ** -0.56 ** 0.04 0.14 * -0.13 0.000 DF Linhares 0.23 * -0.60 ** 0.22 * 0.05 -0.18 0.000 DF Lourenço 0.17 ** -0.38 ** -0.08 0.04 -0.03 0.005 IBD + D Luz 0.43 ** 0.01 -0.18 -0.09 -0.43 ** 0.001 IBD + D Maciel 0.29 ** 0.05 -0.20 -0.43 ** 0.00 0.012 IBD + D Maia 0.06 -0.03 -0.29 ** 0.12 * -0.14 0.036 DF Medeiros 0.26 ** -0.07 -0.39 ** 0.09 -0.16 0.000 DF Mendes 0.30 ** -0.48 ** -0.10 0.08 -0.08 0.000 DF Meneses 0.26 ** -0.45 ** -0.09 0.10 -0.08 0.001 DF Miguel -0.02 -0.03 -0.31 ** 0.20 ** -0.11 0.042 I Moniz 0.34 ** -0.06 -0.43 ** 0.09 -0.22 0.004 DF Monteiro 0.17 * -0.33 ** 0.12 0.23 * -0.45 ** 0.002 DF Morgado -0.05 0.04 -0.21 ** 0.05 -0.10 0.022 DF Mota 0.60 ** -0.14 -0.59 ** 0.10 -0.24 0.000 DF Moura 0.03 0.08 -0.08 0.08 -0.37 ** 0.006 LDD Nogueira 0.33 ** -0.50 ** -0.09 0.11 -0.12 0.000 DF Oliveira -0.05 0.04 -0.28 * 0.19 ** -0.18 0.031 DF (Continued)
138
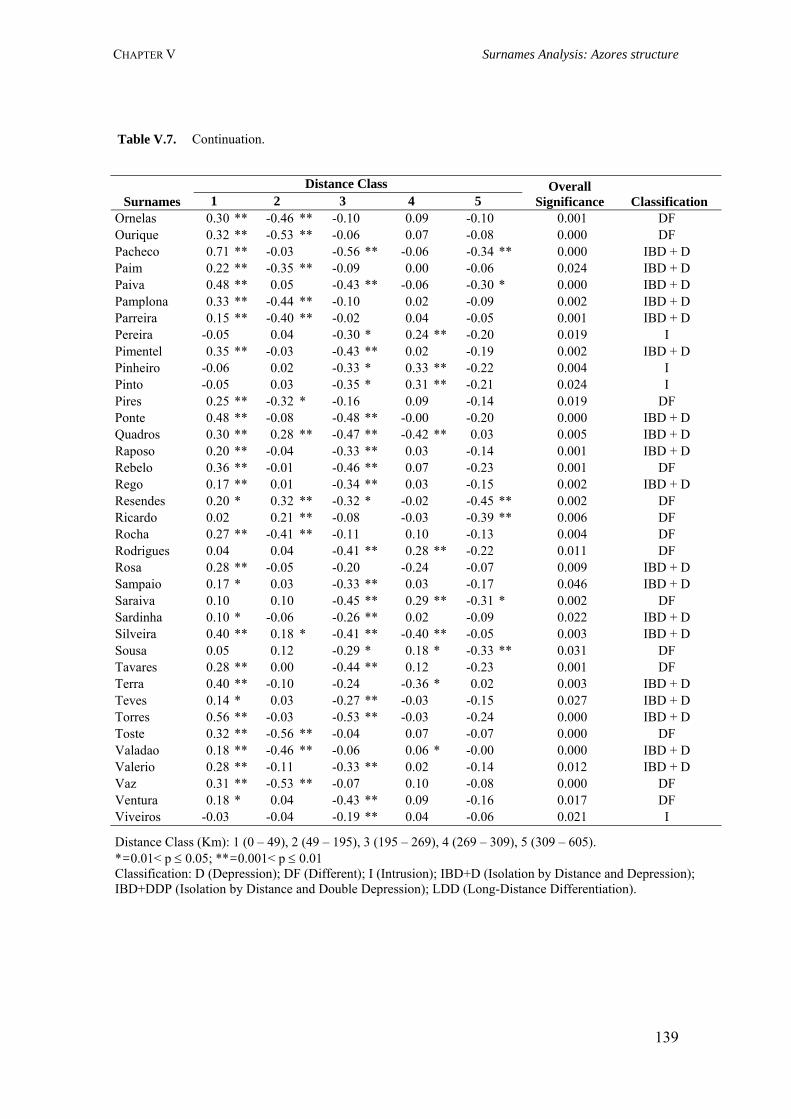
CHAPTER V Surnames Analysis: Azores structure
139
Table V.7. Continuation.
Distance Class Surnames 1 2 3 4 5
Overall Significance Classification
Ornelas 0.30 ** -0.46 ** -0.10 0.09 -0.10 0.001 DF Ourique 0.32 ** -0.53 ** -0.06 0.07 -0.08 0.000 DF Pacheco 0.71 ** -0.03 -0.56 ** -0.06 -0.34 ** 0.000 IBD + D Paim 0.22 ** -0.35 ** -0.09 0.00 -0.06 0.024 IBD + D Paiva 0.48 ** 0.05 -0.43 ** -0.06 -0.30 * 0.000 IBD + D Pamplona 0.33 ** -0.44 ** -0.10 0.02 -0.09 0.002 IBD + D Parreira 0.15 ** -0.40 ** -0.02 0.04 -0.05 0.001 IBD + D Pereira -0.05 0.04 -0.30 * 0.24 ** -0.20 0.019 I Pimentel 0.35 ** -0.03 -0.43 ** 0.02 -0.19 0.002 IBD + D Pinheiro -0.06 0.02 -0.33 * 0.33 ** -0.22 0.004 I Pinto -0.05 0.03 -0.35 * 0.31 ** -0.21 0.024 I Pires 0.25 ** -0.32 * -0.16 0.09 -0.14 0.019 DF Ponte 0.48 ** -0.08 -0.48 ** -0.00 -0.20 0.000 IBD + D Quadros 0.30 ** 0.28 ** -0.47 ** -0.42 ** 0.03 0.005 IBD + D Raposo 0.20 ** -0.04 -0.33 ** 0.03 -0.14 0.001 IBD + D Rebelo 0.36 ** -0.01 -0.46 ** 0.07 -0.23 0.001 DF Rego 0.17 ** 0.01 -0.34 ** 0.03 -0.15 0.002 IBD + D Resendes 0.20 * 0.32 ** -0.32 * -0.02 -0.45 ** 0.002 DF Ricardo 0.02 0.21 ** -0.08 -0.03 -0.39 ** 0.006 DF Rocha 0.27 ** -0.41 ** -0.11 0.10 -0.13 0.004 DF Rodrigues 0.04 0.04 -0.41 ** 0.28 ** -0.22 0.011 DF Rosa 0.28 ** -0.05 -0.20 -0.24 -0.07 0.009 IBD + D Sampaio 0.17 * 0.03 -0.33 ** 0.03 -0.17 0.046 IBD + D Saraiva 0.10 0.10 -0.45 ** 0.29 ** -0.31 * 0.002 DF Sardinha 0.10 * -0.06 -0.26 ** 0.02 -0.09 0.022 IBD + D Silveira 0.40 ** 0.18 * -0.41 ** -0.40 ** -0.05 0.003 IBD + D Sousa 0.05 0.12 -0.29 * 0.18 * -0.33 ** 0.031 DF Tavares 0.28 ** 0.00 -0.44 ** 0.12 -0.23 0.001 DF Terra 0.40 ** -0.10 -0.24 -0.36 * 0.02 0.003 IBD + D Teves 0.14 * 0.03 -0.27 ** -0.03 -0.15 0.027 IBD + D Torres 0.56 ** -0.03 -0.53 ** -0.03 -0.24 0.000 IBD + D Toste 0.32 ** -0.56 ** -0.04 0.07 -0.07 0.000 DF Valadao 0.18 ** -0.46 ** -0.06 0.06 * -0.00 0.000 IBD + D Valerio 0.28 ** -0.11 -0.33 ** 0.02 -0.14 0.012 IBD + D Vaz 0.31 ** -0.53 ** -0.07 0.10 -0.08 0.000 DF Ventura 0.18 * 0.04 -0.43 ** 0.09 -0.16 0.017 DF Viveiros -0.03 -0.04 -0.19 ** 0.04 -0.06 0.021 I
Distance Class (Km): 1 (0 – 49), 2 (49 – 195), 3 (195 – 269), 4 (269 – 309), 5 (309 – 605). *=0.01< p ≤ 0.05; **=0.001< p ≤ 0.01 Classification: D (Depression); DF (Different); I (Intrusion); IBD+D (Isolation by Distance and Depression); IBD+DDP (Isolation by Distance and Double Depression); LDD (Long-Distance Differentiation).
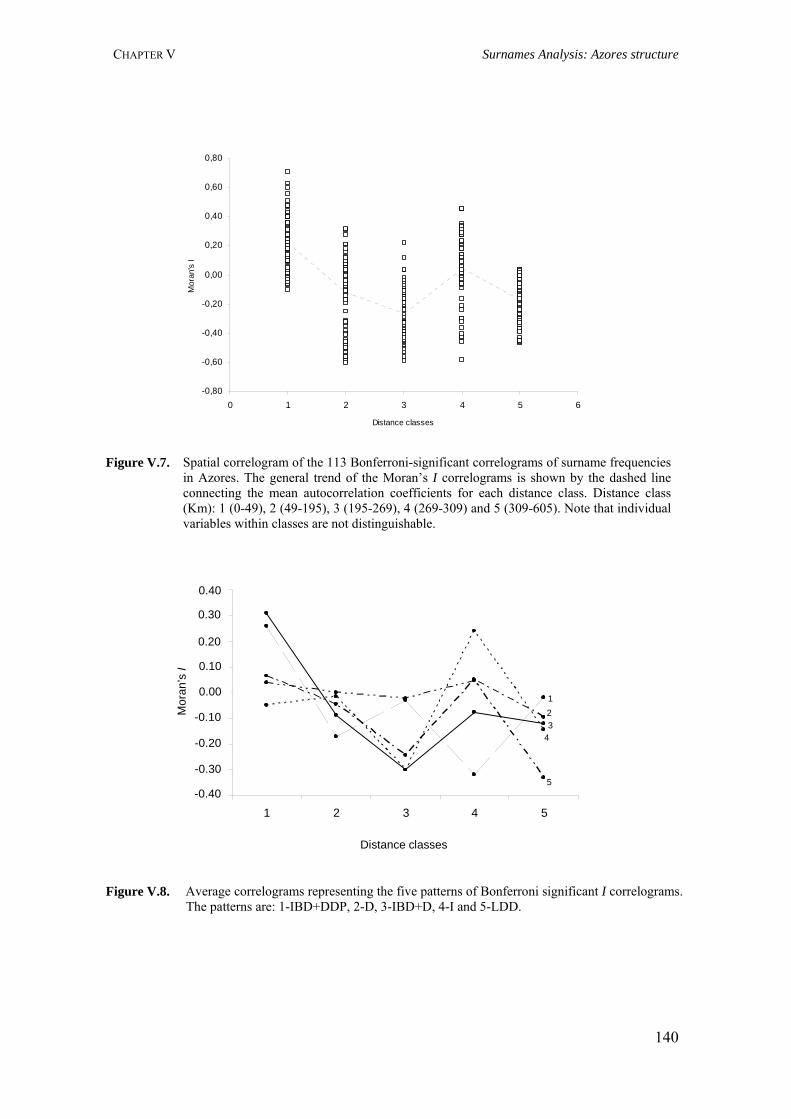
CHAPTER V Surnames Analysis: Azores structure
-0,80
-0,60
-0,40
-0,20
0,00
0,20
0,40
0,60
0,80
0 1 2 3 4 5 6
Distance classes
Mor
an's
I
Figure V.7. Spatial correlogram of the 113 Bonferroni-significant correlograms of surname frequencies in Azores. The general trend of the Moran’s I correlograms is shown by the dashed line connecting the mean autocorrelation coefficients for each distance class. Distance class (Km): 1 (0-49), 2 (49-195), 3 (195-269), 4 (269-309) and 5 (309-605). Note that individual variables within classes are not distinguishable.
Figure V.8. Average correlograms representing the five patterns of Bonferroni significant I correlograms. The patterns are: 1-IBD+DDP, 2-D, 3-IBD+D, 4-I and 5-LDD.
-0,40
-0,30
-0,20
-0,10
0,00
0,10
0,20
0,30
0,40
1 2 3 4 5
Distance Class
Mor
an's
I
43
1
I
2
5
0.40
0.30
0.20
0.10
0.00
-0.10
-0.20
-0.30
-0.40
Distance classes
Mor
an’s
I
140
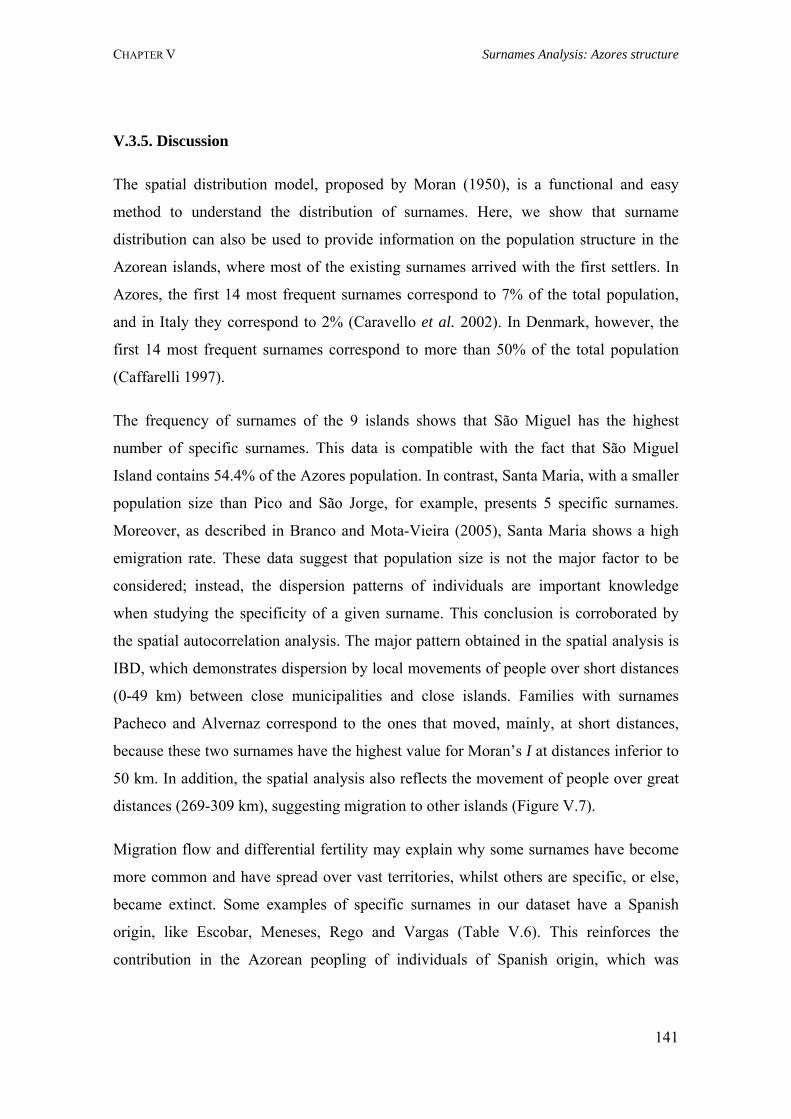
CHAPTER V Surnames Analysis: Azores structure
V.3.5. Discussion
The spatial distribution model, proposed by Moran (1950), is a functional and easy
method to understand the distribution of surnames. Here, we show that surname
distribution can also be used to provide information on the population structure in the
Azorean islands, where most of the existing surnames arrived with the first settlers. In
Azores, the first 14 most frequent surnames correspond to 7% of the total population,
and in Italy they correspond to 2% (Caravello et al. 2002). In Denmark, however, the
first 14 most frequent surnames correspond to more than 50% of the total population
(Caffarelli 1997).
The frequency of surnames of the 9 islands shows that São Miguel has the highest
number of specific surnames. This data is compatible with the fact that São Miguel
Island contains 54.4% of the Azores population. In contrast, Santa Maria, with a smaller
population size than Pico and São Jorge, for example, presents 5 specific surnames.
Moreover, as described in Branco and Mota-Vieira (2005), Santa Maria shows a high
emigration rate. These data suggest that population size is not the major factor to be
considered; instead, the dispersion patterns of individuals are important knowledge
when studying the specificity of a given surname. This conclusion is corroborated by
the spatial autocorrelation analysis. The major pattern obtained in the spatial analysis is
IBD, which demonstrates dispersion by local movements of people over short distances
(0-49 km) between close municipalities and close islands. Families with surnames
Pacheco and Alvernaz correspond to the ones that moved, mainly, at short distances,
because these two surnames have the highest value for Moran’s I at distances inferior to
50 km. In addition, the spatial analysis also reflects the movement of people over great
distances (269-309 km), suggesting migration to other islands (Figure V.7).
Migration flow and differential fertility may explain why some surnames have become
more common and have spread over vast territories, whilst others are specific, or else,
became extinct. Some examples of specific surnames in our dataset have a Spanish
origin, like Escobar, Meneses, Rego and Vargas (Table V.6). This reinforces the
contribution in the Azorean peopling of individuals of Spanish origin, which was
141
CHAPTER V Surnames Analysis: Azores structure
recently demonstrated by the presence of male Spanish lineages in the Azorean
population (Pacheco et al. 2005).
Several spatial correlograms are similar and partitioned into patterns. Patterns
characterized by a decline of autocorrelation in the first distance classes followed by
insignificant values should be generated by the migration of people over short distances
(Barbujani 1987; Sokal et al. 1992). This also may lead to the presence of specific
surnames in the islands, as it is seen in our data. Numerous nearby inhabited centers in
different municipalities (similarity in short distances – class 1) may account for the
migration. The settlement proximity of the Central group with the Western group could
have favored the movement of people carrying autochthonous surnames between these
two groups (similarity at long distances – class 4). According to historical data (Guill
1993), Flores and Corvo were the last two islands discovered, and the first settlers
arrived there were from mainland Portugal, and from the other islands of the
archipelago, mainly Terceira. Moreover, the geographic and, consequently,
socio-cultural features of the archipelago make easier the interaction between
individuals from the Western with the Central group than with the Eastern.
A conflicting result is provided by Santos et al. (2003), who describe higher similarity
between the Central and the Eastern groups based on mtDNA data. Recently, Montiel et
al. (2005) reanalyzed these data in light of the Y-chromosome, and reveal that there are
no differences between the three groups of islands when considered the mtDNA.
However, when analyze the data concerning the Y-chromosome the author detected
important differences, particularly on the Western group, which is the most
differentiated in the PC analysis. These results corroborate with the results here
obtained.
The results of the correlograms were interpreted considering how the actual population
pairs within each distance class. The presence of the short distance positive
autocorrelation may be explained by mating and migration patterns that are observed in
all islands of the archipelago. In general, migration at marriage occurs between
neighbouring village or country, and it is sufficiently strong to maintain family ties
(Connel 1968; Pacheco et al. 2003). This type of migration explains the positive
142
CHAPTER V Surnames Analysis: Azores structure
autocorrelation within the first distance class observed in our dataset. Moreover, the
observation that IBD is the most frequent pattern reinforces historical data, i.e. the
peopling of Azores was a continuous process where people from the other islands
contributed to the peopling of the last two islands (Flores and Corvo). On the other
hand, the autocorrelation is positive in first distance class, validating the presence of
specific surnames in each island. For example, São Miguel Island has the highest
number of specific surnames and also has small distances between municipalities.
As surnames constitute quite a robust indicator of demographic changes, their analysis
could greatly contribute to improve our knowledge of population genetic structure.
Finally, the data described above show that migration and settlement history has been
determinant for the spatial distribution of the present-day Azorean population.
143
“All men by nature desire to know”.
Aristotle
CHAPTER VI
AZOREAN ANCESTRY
The Y-chromosomal heritage of the Azores Islands population
Published in Ann Hum Genet, 2005
Assessment of the Azorean ancestry by Alu insertion polymorphisms
Published in Am J Hum Biol, 2006
144
CHAPTER VI Azorean Ancestry: Y-chromosome lineages
VI.1. The Y-chromosomal heritage of the Azores Islands population
VI.1.1. Summary
The Azores, a Portuguese archipelago located in the north Atlantic Ocean, had no native
population when the Portuguese first arrived in the 15th century. The islands were
populated mainly by Portuguese, but Jews, Moorish prisoners, African slaves, Flemish,
French and Spaniards also contributed to the initial settlement. To understand the
paternal origins and diversity of extant Azorean population, we typed genomic DNA
samples from 172 individuals, using a combination of 10 Y-biallelic markers (YAP,
SRY-1532, SRY-2627, 92R7, M9, sY81, Tat, SRY-8299, 12f2 and LLY22g) and the
following Y-chromosomal STR systems: DYS389I, DYS389II, DYS390, DYS391,
DYS392, DYS393 and DYS385. We identified nine different haplogroups, most of
which are frequent in Europe. Haplogroup J* is the second most frequent in Azores
(13.4%), but it is modestly represented in mainland Portugal (6.8%). The other
non-European haplogroups, N3 and E3a, which are prevalent in Asia and subSahara,
respectively, have been found in Azores (0.6% and 1.2%, respectively) but not in
mainland Portugal. Microsatellite data indicate that mean gene diversity (D) value for
all the loci analysed in our sample set is 0.590, while haplotype diversity is 0.9994.
Taken together, our analysis suggests that the current paternal pool of the Azorean
population is, to a great extent, of Portuguese descent with significant contribution from
people with other genetic backgrounds.
VI.1.2. Introduction
The Y-chromosome is a powerful tool to study human evolutionary pathways and to
infer about major and local male migration movements or patterns (Jobling and
Tyler-Smith 1995). The nonrecombining portion of the Y (NRY) retains a record of the
mutational events that occurred along male lineages throughout evolution. Binary
polymorphisms are particularly useful to identify stable paternal lineages, traced back in
time over thousands of years, because of their low rate of parallel and back mutation
145
CHAPTER VI Azorean Ancestry: Y-chromosome lineages
(Y-Chromosome Consortium 2002). The diversity within these lineages – haplogroups
– can be examinated by polymorphisms that mutate more rapidly, such as,
microsatellites, allowing the construction of very detailed Y-phylogenies that reveals
male-specific aspects of genetic history (Qamar et al. 2002).
Here we report on the diversity of the Y-chromosome of Azorean individuals, using a
combination of slowly evolving biallelic loci and rapidly evolving microsatellite loci.
This allowed for an assessment of the relative diversity and phylogenetic context of the
Azores Islands Y-chromosome pool. We aim to address the following questions: (i) how
does the Y-chromosomal distribution in Azores fits in the context of other European
populations, and (ii) how did geographical isolation affect Y-chromosomal distribution
in Azores compared to mainland Portugal.
VI.1.3. Material and Methods
VI.1.3.1. Terminology and nomenclature
The terminology and nomenclature used here are those proposed by the Y-Chromosome
Consortium (YCC NRY tree 2002). The terms “haplogroup” and “haplotype” are used
according to de Knijff (2000).
VI.1.3.2. Population samples
The sample set comprised 172 unrelated healthy blood donors, from the anonymous
DNA bank of São Miguel population, with signed informed consent (Mota-Vieira et al.
2005). The origin of the individual’s father was used to sort the samples into: São
Miguel (N=149), Faial (N=2), Flores (N=4), Pico (N=6), Santa Maria (N=3), São
Jorge (N=2), Terceira (N=5) and Corvo (N=1), Figure VI.1. Due to disproportionate
number of samples, we combined them all into a single group: Azores. Blood samples
(7.5 ml) were collected by venipuncture into EDTA tubes. DNA was extracted using the
PUREGENE® kit (Gentra Systems Inc.).
146
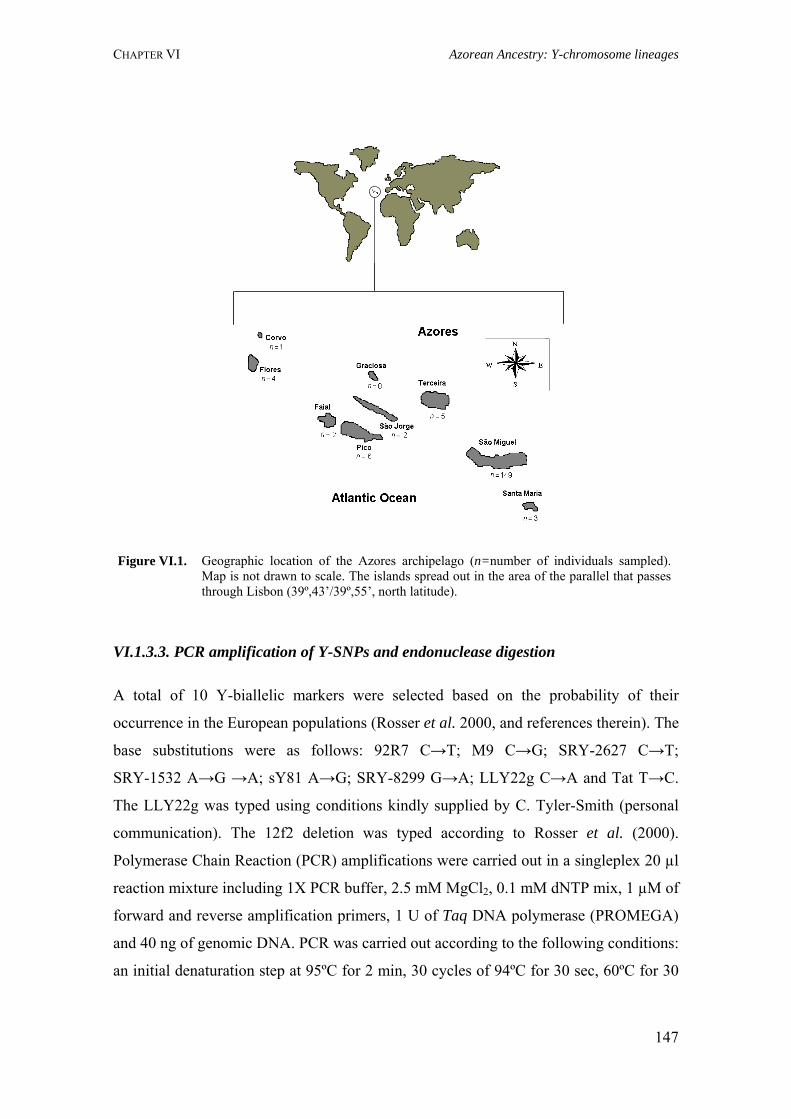
CHAPTER VI Azorean Ancestry: Y-chromosome lineages
Figure VI.1. Geographic location of the Azores archipelago (n=number of individuals sampled). Map is not drawn to scale. The islands spread out in the area of the parallel that passes through Lisbon (39º,43’/39º,55’, north latitude).
VI.1.3.3. PCR amplification of Y-SNPs and endonuclease digestion
A total of 10 Y-biallelic markers were selected based on the probability of their
occurrence in the European populations (Rosser et al. 2000, and references therein). The
base substitutions were as follows: 92R7 C→T; M9 C→G; SRY-2627 C→T;
SRY-1532 A→G →A; sY81 A→G; SRY-8299 G→A; LLY22g C→A and Tat T→C.
The LLY22g was typed using conditions kindly supplied by C. Tyler-Smith (personal
communication). The 12f2 deletion was typed according to Rosser et al. (2000).
Polymerase Chain Reaction (PCR) amplifications were carried out in a singleplex 20 µl
reaction mixture including 1X PCR buffer, 2.5 mM MgCl2, 0.1 mM dNTP mix, 1 µM of
forward and reverse amplification primers, 1 U of Taq DNA polymerase (PROMEGA)
and 40 ng of genomic DNA. PCR was carried out according to the following conditions:
an initial denaturation step at 95ºC for 2 min, 30 cycles of 94ºC for 30 sec, 60ºC for 30
147
CHAPTER VI Azorean Ancestry: Y-chromosome lineages
sec, 72ºC for 1 min, and a final extension step at 72ºC for 5 min For restriction fragment
length polymorphism analysis, 1 U of the appropriate restriction enzyme in 2.5 µl of 1X
digestion buffer was added directly to 25 µl of PCR reaction and incubated at the
appropriate temperature for 2 hours. Digests were analysed by electrophoresis on
polyacrilamide gels (12%) and visualized by ethidium bromide. Analysis of the
Y-chromosomal Alu repeat insertion (YAP) was carried out by PCR and analysed by
agarose gel electrophoresis, as described elsewhere (Hammer and Horai 1995).
VI.1.3.4. PCR amplification of Y-STRs
Seven microsatellite loci were typed using fluorescently labelled primers from five
tetranucleotide markers (DYS389I, DYS389II, DYS390, DYS391 and DYS393), one
trinucleotide repeat locus (DYS392), and one duplicated tetranucleotide repeat marker
(DYS385). Primer sequences were obtained in the Y-STR haplotype database
(www.ystr.org). The PCR protocol used is as follows: an initial denaturation at 95ºC for
15 min to activate HotStarTaq™DNA polymerase (QIAGEN); 30 cycles of 94ºC for 1
min, 51ºC for 1 min, 72ºC for 1 min, and a final 10 min extension step at 72ºC. Each 25
µl reaction contained 2 U of Taq DNA polymerase, 1X PCR buffer, 50 mM KCl, 4 mM
MgCl2, 0.25X Q Solution, 0.2 mM each of the four deoxyribonucleotide triphosphates,
0.4 µM of forward and reverse amplification primers and 50 ng of genomic DNA. An
aliquot of 1 µl of each PCR product was combined with 0.5 µl CEQ™DNA size
standard kit 400, 29 µl formamide deionized (Qbiogene), and run on a CEQ™8000
Genetic Analysis System (Beckman Coulter).
VI.1.3.5. Statistical analysis
Alleles are designated by the number of repeats. Since the DYS389II product contains
the DYS389I, we subtracted the corresponding DYS389I repeat length from that of
DYS389II, to avoid double-counting the variation at the DYS389I (Roewer et al. 1996).
For DYS385, which is a duplicated Y-STR locus, the allele locus assignment was
148
CHAPTER VI Azorean Ancestry: Y-chromosome lineages
performed so that for each individual, the shorter allele was assigned to one locus
(DYS385a) and the longer to another (DYS385b).
Population differentiation between the Azores and other populations was assessed using
haplogroup frequencies included in Arlequin software package (Schneider et al. 2000).
Genetic distances, as pairwise FST, were represented in two-dimensional space using
Multi Dimensional Scaling (MDS) analysis included in the SPSS software package
(version 10.0).
VI.1.4. Results
VI.1.4.1. Y-chromosome biallelic polymorphisms
The biallelic loci used in this study divided Azorean Y-chromosomes into twelve
clades, which are usually referred to as haplogroups (HGs). A Y-chromosomal HG tree
with 10 biallelic markers and HG frequencies is shown in Figure VI.2. We identified 9
different HGs out of 12 possible, which indicates the degree of information of the
markers selected. HG P*(xR1b8, R1a, Q3) is the most frequent, comprising 59.3% of
the total sample. Interestingly, our data shows high frequency of lineage J*, the second
most frequent HG in our population, comprising 13.4% of the Y-chromosomes.
Lineages BR*(xB2b, CE, F1, H, JK), 11.6%, and E*(xE3), 10.5%, are both frequent in
Azores. Lineage R1a has a frequency of 1.2%, four times higher than that described for
the northern and southern Portuguese populations (0.3%; Rosser et al. 2000). In Azores,
R1b8 accounts for 0.6% of the Y-chromosomes. Albeit at low frequency (1.2%), we
have also detected the subSaharan HG E3a (Figure VI.2). In addition, lineage N3, which
is primarily found in Asians, is present in Azores at a frequency of 0.6%.
In order to test the hypothesis of a random distribution of HGs among population
groups, we computed FST values using HG frequencies as implemented by the Arlequin.
HG frequency data for northern and southern Portuguese, Spanish, Basque, east
Anglian, Belgian, French, Dutch, Bavarian, German, Sardinian, Italian, Turkish, Greek,
Algerian, Canarians, Caboverdean and northern African were retrieved from Rosser et
149
CHAPTER VI Azorean Ancestry: Y-chromosome lineages
al. (2000), Flores et al. (2003) and Gonçalves et al. (2003). Population differentiation
between the Azores and those listed above was calculated. No significant difference was
observed between the Azoreans and the northern and southern Portuguese, Belgian,
French or Italian samples (p=0.05), suggesting no population differentiation. In
contrast, comparison with the remaining populations reveals a significant difference
(p<0.05). These data corroborates with the analysis of pairwise genetic distances in the
two-dimensional space analysis (Figure VI.3). Noteworthy, MDS revealed that genetic
relationship among populations corresponds tightly to their relative geographical
distances.
VI.1.4.2. Y-chromosome STR polymorphisms
A Y-chromosomal haplotype was constructed for each individual, using seven loci (see
Material and Methods). Overall, 118 different haplotypes were observed in the 172
sample set (68.6% discriminatory capacity). Haplotype diversity is high (0.9994), due to
high variability of Y-STRs. Allele frequencies and gene diversity values are listed in
Table VI.1. The mean gene diversity (D) value for the loci is 0.590 (values range from
0.4592 to 0.8212, Table VI.1).
150
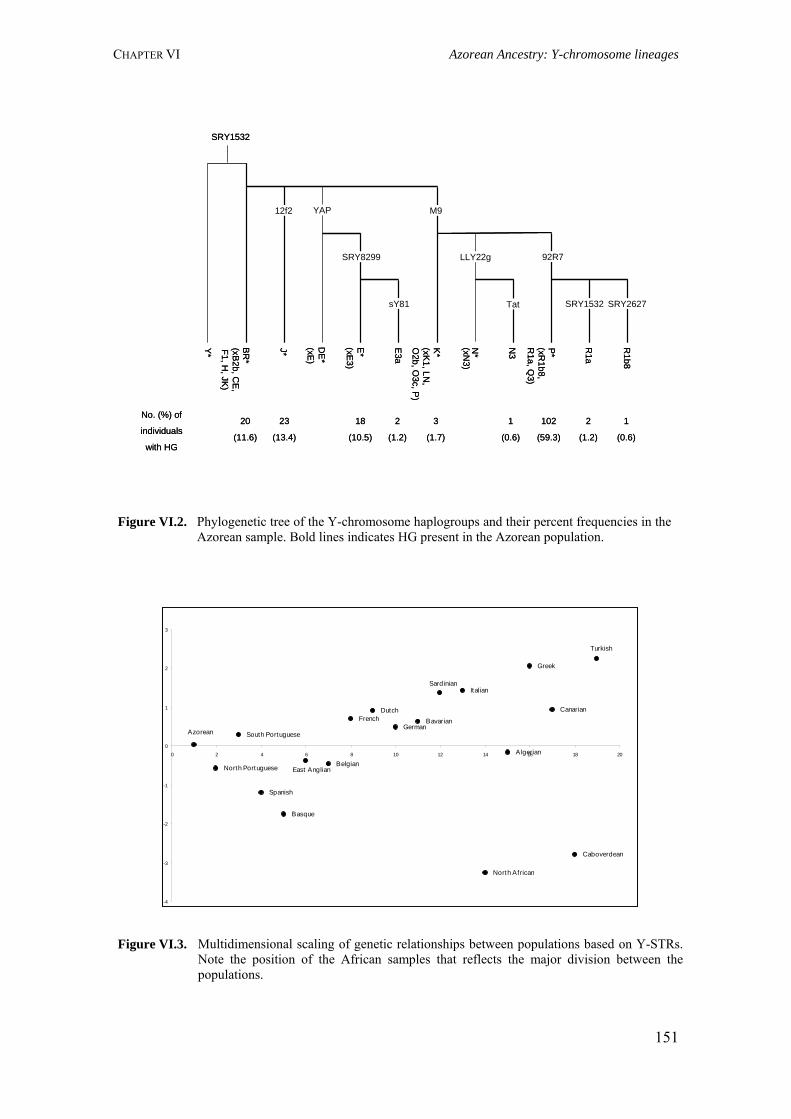
CHAPTER VI Azorean Ancestry: Y-chromosome lineages
SRY1532
Y*
BR
*
J* DE
*
E* E3a
K*
N*
N3
P*
R1a
R1b8
12f2 YAP
SRY8299
sY81
M9
LLY22g
Tat
92R7
SRY1532 SRY2627
(xE)
(xE3 )
(xN3)
(xR1b8,
R1a, Q
3)
(xB2b, C
E,
F1, H, JK
)
(xK1, LN,
O2b, O
3c, P)
No. (%) of
individuals
with HG
20
(11.6)
23
(13.4)
18
(10.5)
2
(1.2)
3
(1.7)
1
(0.6)
102
(59.3)
2
(1.2)
1
(0.6)
Figure VI.2. Phylogenetic tree of the Y-chromosome haplogroups and their percent frequencies in the Azorean sample. Bold lines indicates HG present in the Azorean population.
North Portuguese
South Portuguese
Spanish
Basque
Belgian
FrenchDutch
GermanBavarian
Italian
North African
Algerian
Greek
Canarian
Caboverdean
Turkish
Sardinian
East Anglian
Azorean
-4
-3
-2
-1
0
1
2
3
0 2 4 6 8 10 12 14 16 18 20
Figure VI.3. Multidimensional scaling of genetic relationships between populations based on Y-STRs. Note the position of the African samples that reflects the major division between the populations.
151
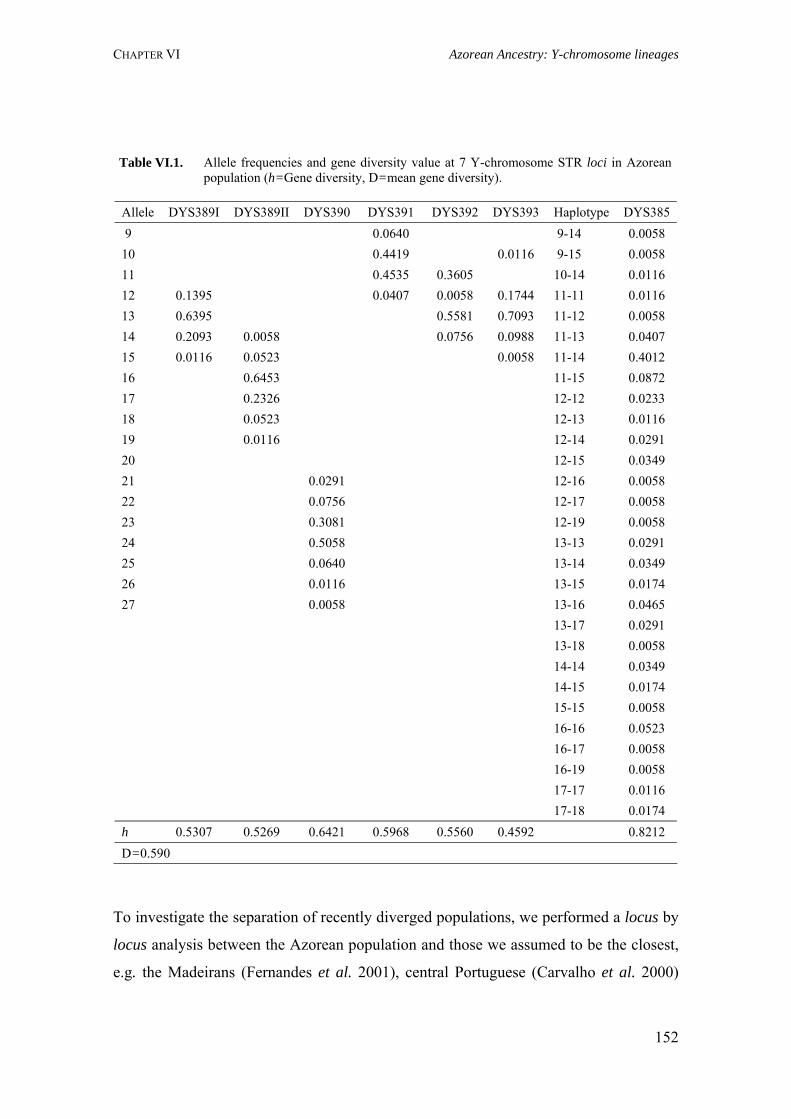
CHAPTER VI Azorean Ancestry: Y-chromosome lineages
Table VI.1. Allele frequencies and gene diversity value at 7 Y-chromosome STR loci in Azorean population (h=Gene diversity, D=mean gene diversity).
Allele DYS389I DYS389II DYS390 DYS391 DYS392 DYS393 Haplotype DYS385 9 0.0640 9-14 0.0058 10 0.4419 0.0116 9-15 0.0058 11 0.4535 0.3605 10-14 0.0116 12 0.1395 0.0407 0.0058 0.1744 11-11 0.0116 13 0.6395 0.5581 0.7093 11-12 0.0058 14 0.2093 0.0058 0.0756 0.0988 11-13 0.0407 15 0.0116 0.0523 0.0058 11-14 0.4012 16 0.6453 11-15 0.0872 17 0.2326 12-12 0.0233 18 0.0523 12-13 0.0116 19 0.0116 12-14 0.0291 20 12-15 0.0349 21 0.0291 12-16 0.0058 22 0.0756 12-17 0.0058 23 0.3081 12-19 0.0058 24 0.5058 13-13 0.0291 25 0.0640 13-14 0.0349 26 0.0116 13-15 0.0174 27 0.0058 13-16 0.0465 13-17 0.0291 13-18 0.0058 14-14 0.0349 14-15 0.0174 15-15 0.0058 16-16 0.0523 16-17 0.0058 16-19 0.0058 17-17 0.0116 17-18 0.0174 h 0.5307 0.5269 0.6421 0.5968 0.5560 0.4592 0.8212 D=0.590
To investigate the separation of recently diverged populations, we performed a locus by
locus analysis between the Azorean population and those we assumed to be the closest,
e.g. the Madeirans (Fernandes et al. 2001), central Portuguese (Carvalho et al. 2000)
152
CHAPTER VI Azorean Ancestry: Y-chromosome lineages
and northern mainland Portuguese (Gonzalez-Neira et al. 2000), using microsatellite
analysis. Pairwise FST showed no statistical differences (p<0.05) to DYS389II, DYS391
and DYS393 loci. However, excepting DYS389II locus, the other loci show statistical
difference (p<0.05) between the Azoreans and the central mainland Portuguese. The
comparison of Azoreans and northern Portuguese show that the difference is found only
at the DYS390 locus. Taken together, the data suggests no genetic differentiation
between northern Portuguese, Madeirans and Azoreans.
VI.1.4.3. Y-chromosome STR polymorphism within haplogroups
When combining the SNPs with the STRs the number of haplotypes increased from 118
(STRs alone) to 123 (SNPs and STRs) and the discriminatory capacity raised from
68.6% to 71.5% (Table VI.2). The most common haplotypes were found on a
P*(xR1b8, R1a, Q3) background. Haplotype H7 (13-16-24-10-13-13-11/14) occurred
10 times (5.8%), H6 (13-16-24-11-13-13-11/14) accounted for 9 individuals (5.2%) and
the third most frequent haplotype, H15 (13-16-23-11-13-13-11/14), was found 6 times
(3.5%). Of the 172 males there were 98 unique haplotypes (56.9%).
The two most common haplotypes in Azores, H7 (5.8%) and H6 (5.2%), are represented
in the YHRD – Y-Chromosome Haplotype Reference Database at 1.49% and 3.42%,
respectively. As of July 2004, this database contains 15,545 haplotypes from 114
different European regions. Haplotype 13-16-24-11-13-13-11/14 is recorded at 3.42% in
the European database, but at only 0.58% (H79) in Azores. In addition, our data show
low frequency (17.4%) of population-specific haplotypes. Of the remaining 82.6%
nonunique haplotypes, the majority are shared with the mainland Portuguese and
Madeirans (51.2%), Germans (64.5%), Spanish (56.3%) and Italians (50%). High
numbers of nonunique haplotypes and consequent haplotype sharing indicate a close
relationship between populations (Kayser et al. 2001). Two haplotypes were shared by
two different HG backgrounds (Table VI.2), one between P*(xR1b8, R1a, Q3) and J*,
and another between BR*(xB2b, CE, F1, H, JK) and E*(xE3). The presence of identical
153
CHAPTER VI Azorean Ancestry: Y-chromosome lineages
Y-chromosome STR haplotypes found on different SNP HGs is evidence of recurrent
mutations, likely to occur at STR loci.
VI.1.5. Discussion
VI.1.5.1. Prevalent Y-chromosome lineages in Azores Islands
The non-random distribution of distinctive stable HGs provides patterns of genetic
affinity and clues concerning past human movements. Here we investigated the genetic
background of the male Azorean population, and discussed the results under the light of
existing historical records.
HG J*, defined by the 12f2 deletion, is largely confined to Caucasoid populations, with
its highest frequencies being found in Middle eastern populations. It is thought to have
originated in the Middle east where its frequency exceeds one-third of the
Y-chromosomes of Jewish, Turkish and Arab populations (Bosh et al. 2001; Nebel et
al. 2001). Our data shows that in Azores this haplogroup is the second most common,
with a frequency of 13.4%, twice as high as in mainland Portugal (6.8%; Rosser et al.
2000). Using a sampling strategy based on the three geographical groups of the Azores
Islands, Montiel and colleagues (2005) found lineage J at a lower frequency (8.6%) for
the whole archipelago, although their study revealed similar frequency (14.5%) for the
islands of the Central group. The high frequency of lineage J raises the question of
whether Jewish early settlers left a significant imprint in the genetic pool of the Azorean
male population. The overall northwest (NW) African contribution to the Iberian
Y-chromosome pool has been calculated as 7%, with the highest level of contribution
(14%) being found in Andalusians, southern Iberia (Bosch et al. 2001), a result that is
consistent with the population movement associated with Islamic rule in Iberia (Pereira
et al. 2000). The frequency of the NW African lineage E*(xE3) in mainland Portugal
and Azores (11.7% and 10.5%, respectively) is similar.
154
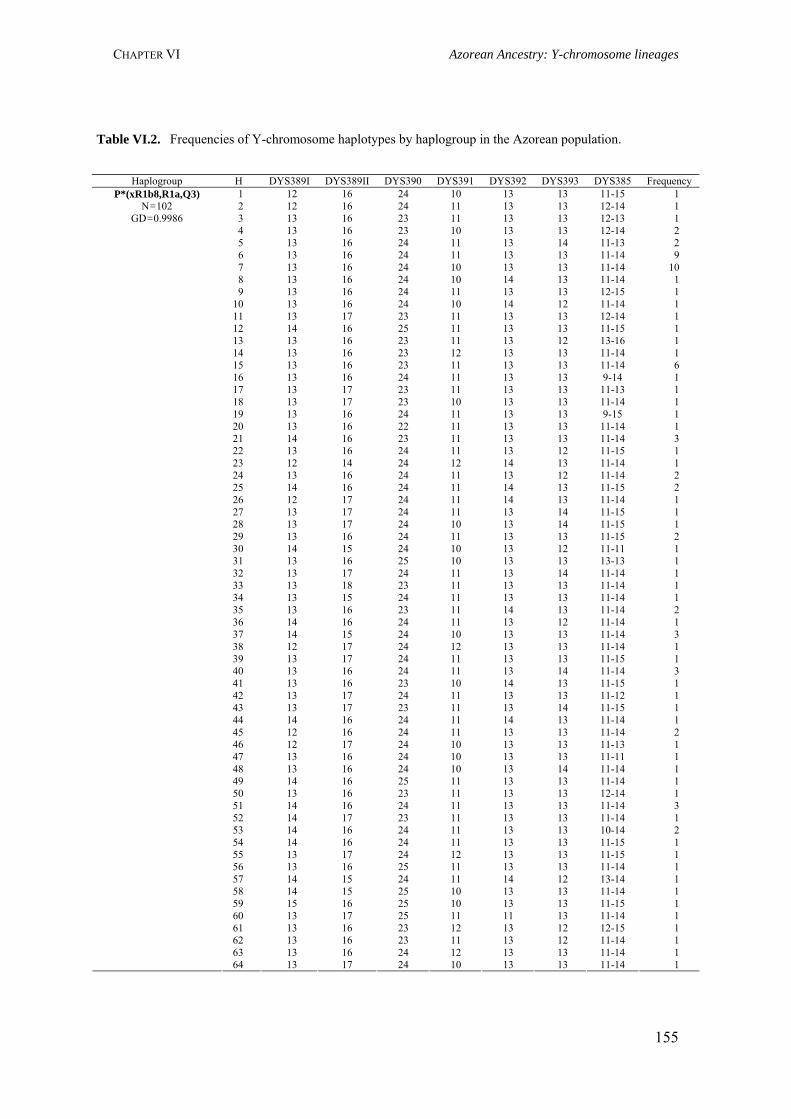
CHAPTER VI Azorean Ancestry: Y-chromosome lineages
Table VI.2. Frequencies of Y-chromosome haplotypes by haplogroup in the Azorean population.
Haplogroup H DYS389I DYS389II DYS390 DYS391 DYS392 DYS393 DYS385 Frequency 1 12 16 24 10 13 13 11-15 1 2 12 16 24 11 13 13 12-14 1 3 13 16 23 11 13 13 12-13 1 4 13 16 23 10 13 13 12-14 2 5 13 16 24 11 13 14 11-13 2 6 13 16 24 11 13 13 11-14 9
13 16 24 11 13 13 12-15 1 10 13 16 24 10 14 12 11-14 1 11 13 17 23 11 13 13 12-14 1 12 14 16 25 11 13 13 11-15 1 13 13 16 23 11 13 12 13-16 1 14 13 16 23 12 13 13 11-14 1 15 13 16 23 11 13 13 11-14 6 16 13 16 24 11 13 13 9-14 1 17 13 17 23 11 13 13 11-13 1 18 13 17 23 10 13 13 11-14 1 19 13 16 24 11 13 13 9-15 1 20 13 16 22 11 13 13 11-14 1 21 14 16 23 11 13 13 11-14 3 22 13 16 24 11 13 12 11-15 1 23 12 14 24 12 14 13 11-14 1 24 13 16 24 11 13 12 11-14 2 25 14 16 24 11 14 13 11-15 2 26 12 17 24 11 14 13 11-14 1 27 13 17 24 11 13 14 11-15 1 28 13 17 24 10 13 14 11-15 1 29 13 16 24 11 13 13 11-15 2 30 14 15 24 10 13 12 11-11 1 31 13 16 25 10 13 13 13-13 1 32 13 17 24 11 13 14 11-14 1 33 13 18 23 11 13 13 11-14 1 34 13 15 24 11 13 13 11-14 1 35 13 16 23 11 14 13 11-14 2 36 14 16 24 11 13 12 11-14 1 37 14 15 24 10 13 13 11-14 3 38 12 17 24 12 13 13 11-14 1 39 13 17 24 11 13 13 11-15 1 40 13 16 24 11 13 14 11-14 3 41 13 16 23 10 14 13 11-15 1 42 13 17 24 11 13 13 11-12 1 43 13 17 23 11 13 14 11-15 1 44 14 16 24 11 14 13 11-14 1 45 12 16 24 11 13 13 11-14 2 46 12 17 24 10 13 13 11-13 1 47 13 16 24 10 13 13 11-11 1 48 13 16 24 10 13 14 11-14 1 49 14 16 25 11 13 13 11-14 1 50 13 16 23 11 13 13 12-14 1 51 14 16 24 11 13 13 11-14 3 52 14 17 23 11 13 13 11-14 1 53 14 16 24 11 13 13 10-14 2 54 14 16 24 11 13 13 11-15 1 55 13 17 24 12 13 13 11-15 1 56 13 16 25 11 13 13 11-14 1 57 14 15 24 11 14 12 13-14 1 58 14 15 25 10 13 13 11-14 1 59 15 16 25 10 13 13 11-15 1 60 13 17 25 11 11 13 11-14 1 61 13 16 23 12 13 12 12-15 1 62 13 16 23 11 13 12 11-14 1 63 13 16 24 12 13 13 11-14 1 64 13 17 24 10 13 13 11-14 1
7 13 16 24 10 13 13 11-14 10 8 13 16 24 10 14 13 11-14 1 9
P*(xR1b8,R1a,Q3) N=102
GD=0.9986
155
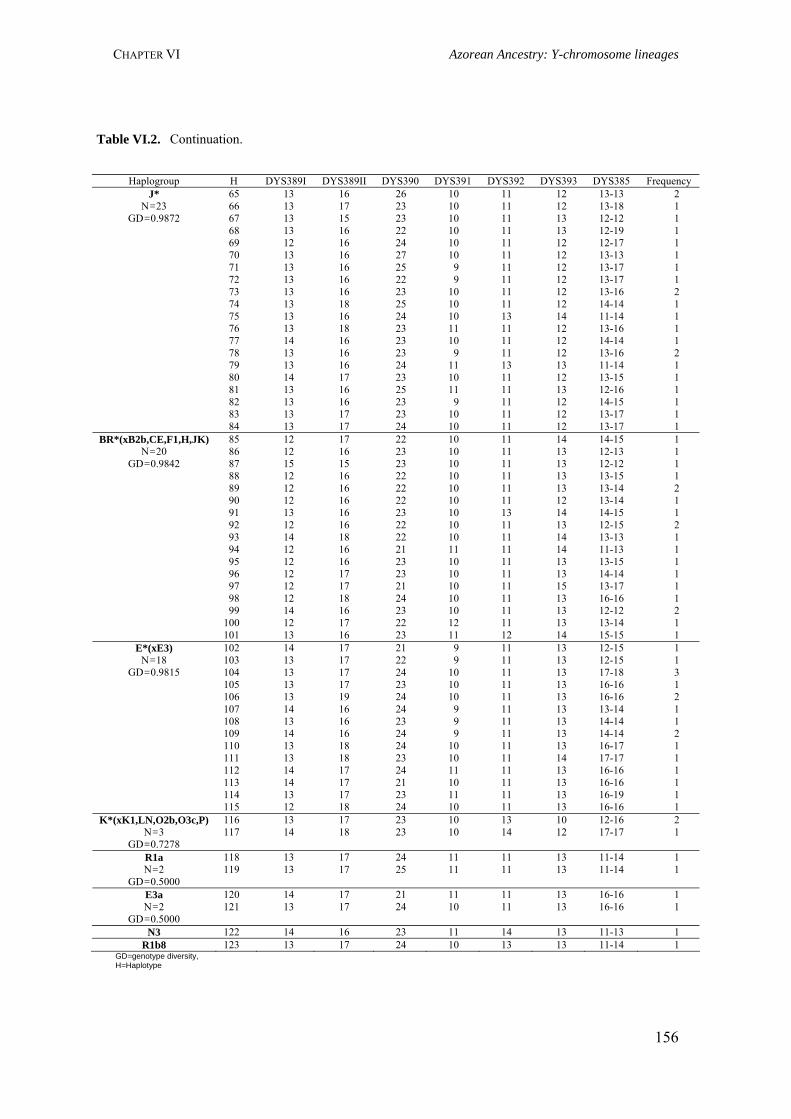
CHAPTER VI Azorean Ancestry: Y-chromosome lineages
Table VI.2. Continuation.
Haplogroup H DYS389I DYS389II DYS390 DYS391 DYS392 DYS393 DYS385 Frequency 65 13 16 26 10 11 12 13-13 2 66 13 17 23 10 11 12 13-18 1 67 13 15 23 10 11 13 12-12 1 68 13 16 22 10 11 13 12-19 1 69 12 16 24 10 11 12 12-17 1 70 13 16 27 10 11 12 13-13 1 71 13 16 25 9 11 12 13-17 1 72 13 16 22 9 11 12 13-17 1 73 13 16 23 10 11 12 13-16 2 74 13 18 25 10 11 12 14-14 1 75 13 16 24 10 13 14 11-14 1 76 13 18 23 11 11 12 13-16 1 77 14 16 23 10 11 12 14-14 1 78 13 16 23 9 11 12 13-16 2 79 13 16 24 11 13 13 11-14 1 80 14 17 23 10 11 12 13-15 1 81 13 16 25 11 11 13 12-16 1 82 13 16 23 9 11 12 14-15 1 83 13 17 23 10 11 12 13-17 1
J* N=23
GD=0.9872
84 13 17 24 10 11 12 13-17 1 85 12 17 22 10 11 14 14-15 1 86 12 16 23 10 11 13 12-13 1 87 15 15 23 10 11 13 12-12 1 88 12 16 22 10 11 13 13-15 1 89 12 16 22 10 11 13 13-14 2 90 12 16 22 10 11 12 13-14 1 91 13 16 23 10 13 14 14-15 1 92 12 16 22 10 11 13 12-15 2 93 14 18 22 10 11 14 13-13 1 94 12 16 21 11 11 14 11-13 1 95 12 16 23 10 11 13 13-15 1 96 12 17 23 10 11 13 14-14 1 97 12 17 21 10 11 15 13-17 1 98 12 18 24 10 11 13 16-16 1 99 14 16 23 10 11 13 12-12 2
100 12 17 22 12 11 13 13-14 1
BR*(xB2b,CE,F1,H,JK) N=20
GD=0.9842
101 13 16 23 11 12 14 15-15 1 102 14 17 21 9 11 13 12-15 1 103 13 17 22 9 11 13 12-15 1 104 13 17 24 10 11 13 17-18 3 105 13 17 23 10 11 13 16-16 1 106 13 19 24 10 11 13 16-16 2 107 14 16 24 9 11 13 13-14 1 108 13 16 23 9 11 13 14-14 1 109 14 16 24 9 11 13 14-14 2 110 13 18 24 10 11 13 16-17 1 111 13 18 23 10 11 14 17-17 1 112 14 17 24 11 11 13 16-16 1 113 14 17 21 10 11 13 16-16 1 114 13 17 23 11 11 13 16-19 1
E*(xE3) N=18
GD=0.9815
115 12 18 24 10 11 13 16-16 1 116 13 17 23 10 13 10 12-16 2 K*(xK1,LN,O2b,O3c,P)
N=3 GD=0.7278
117 14 18 23 10 14 12 17-17 1
118 13 17 24 11 11 13 11-14 1 R1a N=2
GD=0.5000 119 13 17 25 11 11 13 11-14 1
120 14 17 21 11 11 13 16-16 1 E3a N=2
GD=0.5000 121 13 17 24 10 11 13 16-16 1
N3 122 14 16 23 11 14 13 11-13 1 R1b8 123 13 17 24 10 13 13 11-14 1
GD=genotype diversity, H=Haplotype
156
CHAPTER VI Azorean Ancestry: Y-chromosome lineages
Montiel and colleagues (2005) also found comparable values (13.0%) for the
archipelago. The results obtained by us and the other group suggest several hypotheses
for the presence of this lineage in the present-day population of Azores: a direct input of
Moorish prisoners, the influence of early Portuguese settlers, or a contribution of both
Moorish prisoners and Portuguese.
Lineage E3a, defined by mutation sY81, shows a subSaharan distribution pattern. This
HG is the most frequent in west African populations, and their presence can be
interpreted as resulting from subSaharan gene flow. The occurrence of lineage E3a in
Azores is the result of African influence, since it has been detected neither in Europe,
nor in Iberian samples (Semino et al. 2000; Bosh et al. 2001; Rosser et al. 2000). The
presence of subSaharan African slaves in the archipelago since the beginning of the
settlement is well documented (Matos 1989). Therefore, we conclude that the 1.2%
Y-chromosomes with the E3a background represents the male descendants of black
slaves from Guinea, Cape Verde and São Tomé.
Lineage N3, defined by Tat biallelic polymorphism, is specific to Asians and northern
Europeans and has not been found in Iberian Peninsula or in other European countries
(Rosser et al. 2000; Helgason et al. 2000). This mutation probably arose in the
Mongolia/ China area, and the present distribution stretches from Japan to Norway
(Zerjal et al. 1997). The presence of this lineage in Azores (0.6%) is intriguing.
Historical records of the presence of Asians or Mongolians in the archipelago are not
known, but Bruges-Armas and colleagues (1999) have recently described the presence
of Mongolian HLA genes at a high frequency in Terceira Island population (Azores).
Thus, it is possible that the presence of Lineage N3 may have been introduced at the
expansion of the trade navigation between Europe, America and Asia, during the 16th
and 17th centuries, when the Azores had a strategic role due to its geographic position
(Russel-Wood 1998).
Lineage R1b8, defined by a C→T base substitution at the SRY-2627, arose recently in
Iberia. This lineage has its highest frequency in Basques (11%) and Catalans (22%),
whereas in other regions these chromosomes are rare or absent (Hurles et al. 1999). In
Azores, its frequency is marginal (0.6%), probably reflecting the descendants of the
157
CHAPTER VI Azorean Ancestry: Y-chromosome lineages
Spaniards, who came to the islands during the reign of Spain over Portugal, from 1580
to 1640 (Matos 1989).
Lineage R1a is most frequent in central eastern Europe, comprising approximately half
of the chromosomes in the Russian, Polish and Slovakian samples. In contrast,
frequencies in the southeast and southwest Europe are low. In our sample set, R1a is
four times higher then in mainland Portugal (Rosser et al. 2000), which may be
explained by the following reasons: (i) this chromosome arrived with Portuguese
settlers only, and subsequently increased in frequency, (ii) some chromosomes came in
with Portuguese settlers, while others came in directly from central eastern Europeans,
and (iii) they are an exclusive contribution from central eastern Europe. Historical
records and papers exploring historical settlement show that some Europeans (e.g.
Flemish) contributed to the peopling of the Azores, so we believe that all the hypotheses
above are possible.
VI.1.5.2. Variability of Y-chromosome STRs in Azores Islands
Comparisons of allelic frequencies between our sample set and those obtained in central
mainland Portugal (Carvalho et al. 2000) show differences. Indeed, historical records
demonstrate that the first Portuguese settlers were mainly from the north and south
Portugal. The mean gene diversity value across loci in the Azorean sample (D=0.590) is
higher than the value reported for northern Portugal (D=0.517), from which Azoreans
are believed to be partially derived (Guill 1993). It is also higher than that observed for
the Europeans (D=0.503). Likewise, haplotype diversity value in Azores (0.9994) is
higher than in northern Portugal (0.980) and Europe (0.985). Unexpectedly, the
Azoreans share more haplotypes with the Germans than with the Portuguese, but due to
a relative high mutation frequency of Y-STRs, Y-haplotypes can be shared identical by
state that are not identical by descent (de Knijff 2000). However, we conclude that the
diversity found in Azorean Y-chromosome is derived from the admixture of Portuguese
with other populations.
158
CHAPTER VI Azorean Ancestry: Y-chromosome lineages
One advantage of Y-chromosome markers, compared with mtDNA, is that
Y-chromosome polymorphisms seem to show higher degree of population specificity
(Seielstad et al. 1998), making them more informative for tracing population
relationships. The comparison between the paternal Y-chromosome (present study and
Montiel et al. 2005) and the maternal mtDNA (Santos et al. 2003) shows some
evidences of differential sex-specific influences. Here, the paternal Middle east
influence was estimated at 13.4%, which is higher than the 7.5% obtained by Santos and
colleagues (2003). Another difference was the smaller contribution from Africans. We
estimated a clear African Y-chromosome contribution of 1.2%, whereas they identify an
11.3% contribution of African mtDNA. The Y-chromosome and mtDNA results are, in
general, concordant; they both indicate the same history for the peopling of the Azores
and suggest that there was some gender differentiation in the population pathways.
VI.1.6. Concluding remarks
The presence of HGs of widespread distribution in Europe, in combination with others
of clear subSaharan, Asian and Middle east origin reflects the diverse patterns defining
the extant Azorean Y-chromosome pool. We conclude that the current paternal
Y-chromosome pool in the Azores is of Portuguese descent, with a considerable
contribution of individuals from multiple origins.
159
CHAPTER VI Azorean Ancestry: Alu insertions
VI.2. Assessment of the Azorean ancestry by Alu insertion polymorphisms
VI.2.1. Summary
The knowledge of the population ancestry from genetic markers is essential, for
example, to understand the history of human migration and to carry out admixture and
association studies. Here we assess the genome ancestry of the Azorean population
through the analysis of six Alu polymorphic sites (TPA-25, ACE, APO, B65, PV92 and
D1) in 65 Azoreans and 30 mainland Portuguese unrelated blood donors and compare
the data with those obtained by Y-chomosome and mtDNA. Allele frequencies were
calculated by direct counting. Statistical analysis was performed using Arlequin 2.0.
Nei’s genetic distance was calculated with DISPAN software, and trees were
constructed by Neighbor-Joining (NJ) using PHYLIP 3.63. The results show that all Alu
insertions were polymorphic. APO is the closest to fixation. The less frequent insertions
are PV92 and D1 in Azores and mainland Portugal, respectively. ACE and TPA-25
show the highest values of heterozygosity in both populations. Allele frequencies are
very similar to those obtained in European populations. These results are validated by
the Y-chromosome and mtDNA data, where the European represent the majority of the
maternal and paternal lineages. Overall, these data are reflected in the phylogenetic tree,
in which Azores and Portugal branch with Catalans, Andalusians, Morrocans and
Algerians. We conclude that the Azores shows no significant genetic differences from
mainland Portugal and is an outbred population. Moreover, the data validate the use of
Alu insertion polymorphisms to assess the origin and history of human populations.
VI.2.2. Introduction
Y-chromosome and mtDNA have been extensively used to characterize populations in
terms of diversity and origin. However, the full picture of the histories of populations
requires studies of markers in the recombining parts of the nuclear DNA, namely the
autosomes (Kidd et al. 2000). Polymorphic Alu insertions represent an important source
of nuclear genetic variability and their use is advantageous, once, they are: identical by
160
CHAPTER VI Azorean Ancestry: Alu insertions
descent, widely dispersed throughout the human genome, subject to very limited
amounts of gene conversion, rapidly and easily genotyped, and selectively neutral when
located in noncoding regions (Batzer et al. 1996; Comas et al. 2000).
Recently, studies on Y-chromosome lineages (Pacheco et al. 2005; Montiel et al. 2005)
and mtDNA (Santos et al. 2003) in the Azores population demonstrated that the current
paternal pool of the Azoreans is of Portuguese descent with significant contribution
from people with other genetic background. Our main purpose is to compare the results
from Y-chromosome and mtDNA with those obtained here through the study of the
genetic diversity and ancestry of the Azores population using six Alu insertions.
Moreover, we intend to assess the genetic differentiation between Azores and mainland
Portugal.
VI.2.3. Material and Methods
VI.2.3.1. Population samples
The sample set, comprising 65 Azoreans and 30 mainland Portuguese unrelated blood
donors, were obtained from a biobank constructed according to International ethical
guidelines (Mota-Vieira et al. 2005).
VI.2.3.2. Alu genotyping
Six human-specific Alu insertion polymorphisms (B65, ACE, D1, APO, PV92 and
TPA25) were studied, using sets of oligonucleotide primer-pairs described previously
(Batzer et al. 1996). Polymerase Chain Reaction (PCR) amplifications were carried out
in a singleplex 15 µl reaction mixture including 1X PCR buffer, 2.5 mM MgCl2, 0.8
mM dNTP mix (0.2 mM each), 10 µM of forward and reverse primers, 2U of
HotStarTaq DNA polymerase (QIAGEN) and 50 ng of genomic DNA. PCR conditions
for B65, D1, PV92 and APO were as follows: (1X) 95ºC/ 15 min; (30X) 94ºC/ 1 min,
optimal annealing temperature for 2 min, 72ºC/ 1 min; with a final extension step at
161
CHAPTER VI Azorean Ancestry: Alu insertions
72ºC/ 10 min. Annealing time for TPA-25 and ACE markers was only 1 min. PCR
products were visualized by electrophoresis in 4% agarose gel stained with Syber Green
(Molecular Probes).
VI.2.3.3. Statistical analysis
We selected previously published data (Romualdi et al. 2002; Comas et al. 2000) on 17
populations, namely: African American, Armenian, Bantu Speakers, Bretons,
Darginian, European-American, French, German, Greek, Hungarian, Swiss, Syrians,
Turks, Catalans, Andalusians, Moroccans and Algerians to perform population
comparisons. The selection was based on the historical data for the Azorean peopling
and the geographical location of the populations.
Allele frequencies were calculated by direct counting and Hardy-Weinberg equilibrium
was assessed by an exact test provided by the Arlequin program 2.0 (Schneider et al.
1996). The inbreeding coefficient, FIS, was calculated by Genetic Data Analysis (GDA)
software package (Lewis and Zaykin 2000). Statistical significance of genic and genetic
differentiation between loci and populations was estimated by the GENEPOP32 web
version program (Raymond and Rousset 1995).
FST genetic distances were computed between pairs of populations by means of the
DISPAN software (Ota 1993) and the distance matrix was used to construct a
Neighbor-Joining (NJ) tree with PHYLIP 3.63 (Felsenstein 1993). The NJ tree was
rooted by setting the frequency of each insertion to zero (ancestral), as previously
described (Batzer et al. 1996). We used TreeView 1.6.6 (Page 1996) to display tree
phylogenies obtained by Neighbor-Joining.
32 GENEPOP web version, http://genepop.curtin.edu.au.
162
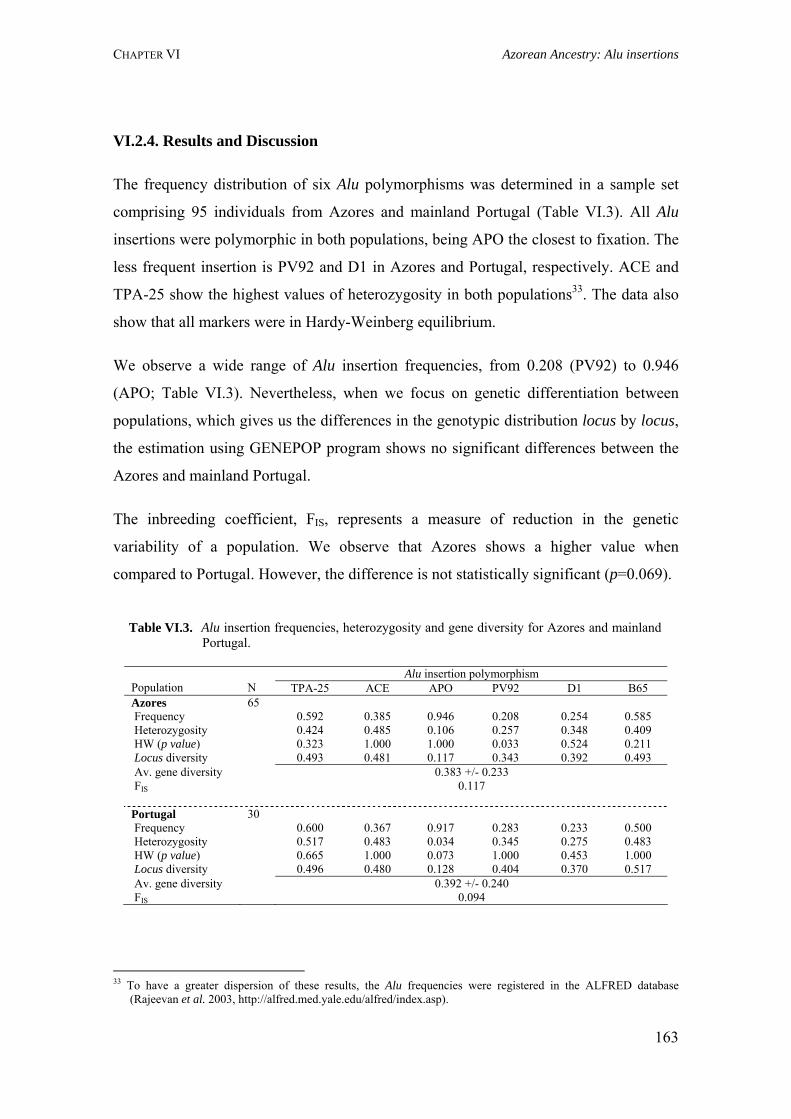
CHAPTER VI Azorean Ancestry: Alu insertions
VI.2.4. Results and Discussion
The frequency distribution of six Alu polymorphisms was determined in a sample set
comprising 95 individuals from Azores and mainland Portugal (Table VI.3). All Alu
insertions were polymorphic in both populations, being APO the closest to fixation. The
less frequent insertion is PV92 and D1 in Azores and Portugal, respectively. ACE and
TPA-25 show the highest values of heterozygosity in both populations33. The data also
show that all markers were in Hardy-Weinberg equilibrium.
We observe a wide range of Alu insertion frequencies, from 0.208 (PV92) to 0.946
(APO; Table VI.3). Nevertheless, when we focus on genetic differentiation between
populations, which gives us the differences in the genotypic distribution locus by locus,
the estimation using GENEPOP program shows no significant differences between the
Azores and mainland Portugal.
The inbreeding coefficient, FIS, represents a measure of reduction in the genetic
variability of a population. We observe that Azores shows a higher value when
compared to Portugal. However, the difference is not statistically significant (p=0.069).
Table VI.3. Alu insertion frequencies, heterozygosity and gene diversity for Azores and mainland
Portugal.
Alu insertion polymorphism Population N TPA-25 ACE APO PV92 D1 B65 Azores 65 Frequency 0.592 0.385 0.946 0.208 0.254 0.585 Heterozygosity 0.424 0.485 0.106 0.257 0.348 0.409 HW (p value) 0.323 1.000 1.000 0.033 0.524 0.211 Locus diversity 0.493 0.481 0.117 0.343 0.392 0.493 Av. gene diversity 0.383 +/- 0.233 FIS 0.117 Portugal 30 Frequency 0.600 0.367 0.917 0.283 0.233 0.500 Heterozygosity 0.517 0.483 0.034 0.345 0.275 0.483 HW (p value) 0.665 1.000 0.073 1.000 0.453 1.000 Locus diversity 0.496 0.480 0.128 0.404 0.370 0.517 Av. gene diversity 0.392 +/- 0.240 FIS 0.094
33 To have a greater dispersion of these results, the Alu frequencies were registered in the ALFRED database
(Rajeevan et al. 2003, http://alfred.med.yale.edu/alfred/index.asp).
163
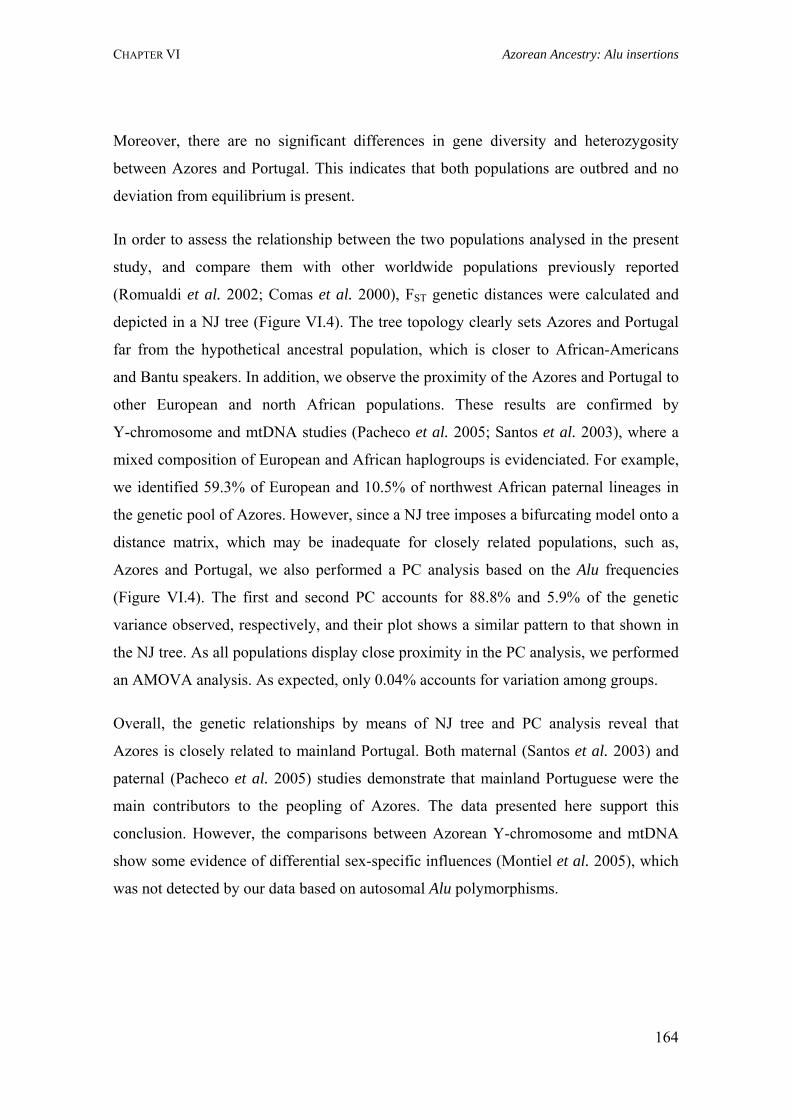
CHAPTER VI Azorean Ancestry: Alu insertions
Moreover, there are no significant differences in gene diversity and heterozygosity
between Azores and Portugal. This indicates that both populations are outbred and no
deviation from equilibrium is present.
In order to assess the relationship between the two populations analysed in the present
study, and compare them with other worldwide populations previously reported
(Romualdi et al. 2002; Comas et al. 2000), FST genetic distances were calculated and
depicted in a NJ tree (Figure VI.4). The tree topology clearly sets Azores and Portugal
far from the hypothetical ancestral population, which is closer to African-Americans
and Bantu speakers. In addition, we observe the proximity of the Azores and Portugal to
other European and north African populations. These results are confirmed by
Y-chromosome and mtDNA studies (Pacheco et al. 2005; Santos et al. 2003), where a
mixed composition of European and African haplogroups is evidenciated. For example,
we identified 59.3% of European and 10.5% of northwest African paternal lineages in
the genetic pool of Azores. However, since a NJ tree imposes a bifurcating model onto a
distance matrix, which may be inadequate for closely related populations, such as,
Azores and Portugal, we also performed a PC analysis based on the Alu frequencies
(Figure VI.4). The first and second PC accounts for 88.8% and 5.9% of the genetic
variance observed, respectively, and their plot shows a similar pattern to that shown in
the NJ tree. As all populations display close proximity in the PC analysis, we performed
an AMOVA analysis. As expected, only 0.04% accounts for variation among groups.
Overall, the genetic relationships by means of NJ tree and PC analysis reveal that
Azores is closely related to mainland Portugal. Both maternal (Santos et al. 2003) and
paternal (Pacheco et al. 2005) studies demonstrate that mainland Portuguese were the
main contributors to the peopling of Azores. The data presented here support this
conclusion. However, the comparisons between Azorean Y-chromosome and mtDNA
show some evidence of differential sex-specific influences (Montiel et al. 2005), which
was not detected by our data based on autosomal Alu polymorphisms.
164
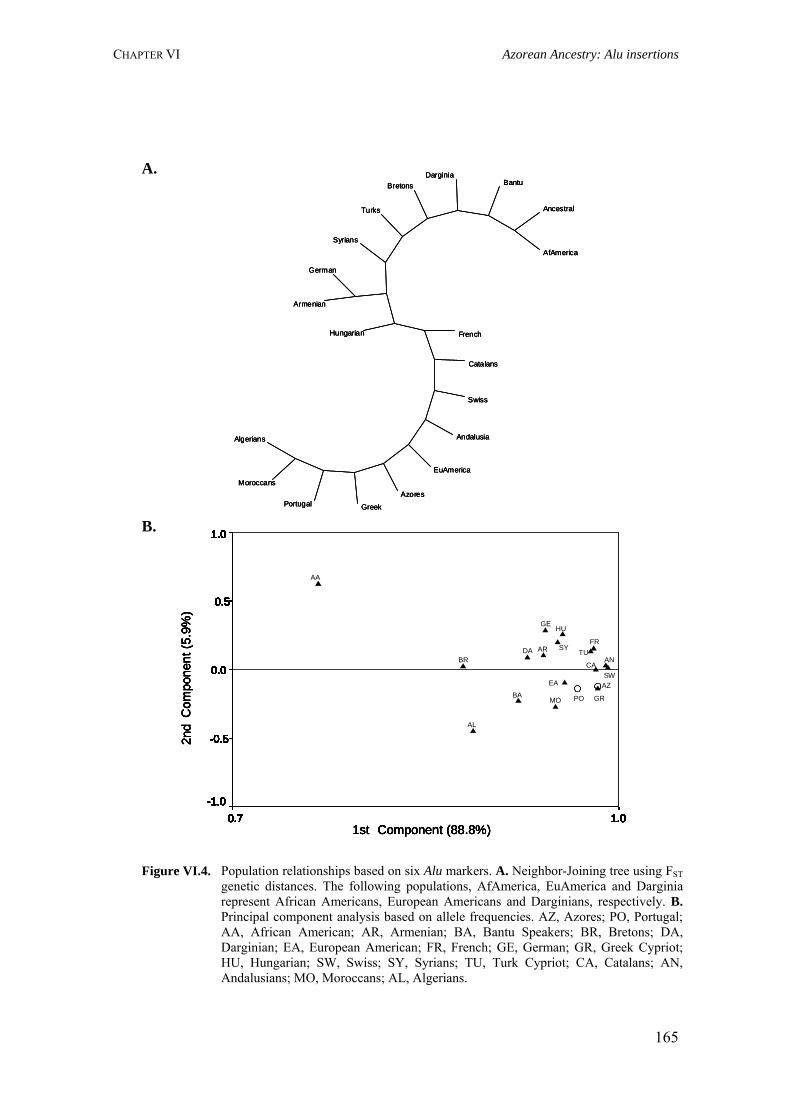
CHAPTER VI Azorean Ancestry: Alu insertions
165
A.
B.
Figure VI.4. Population relationships based on six Alu markers. A. Neighbor-Joining tree using FST genetic distances. The following populations, AfAmerica, EuAmerica and Darginia represent African Americans, European Americans and Darginians, respectively. B. Principal component analysis based on allele frequencies. AZ, Azores; PO, Portugal; AA, African American; AR, Armenian; BA, Bantu Speakers; BR, Bretons; DA, Darginian; EA, European American; FR, French; GE, German; GR, Greek Cypriot; HU, Hungarian; SW, Swiss; SY, Syrians; TU, Turk Cypriot; CA, Catalans; AN, Andalusians; MO, Moroccans; AL, Algerians.
1.00.7
1.0
0.5
0.0
-0.5
-1.0
AL
MO
ANCA
TUSY
SW
HU
GR
GE
FR
EA
DABR
BA
AR
AA
PO
AZ
1.00.7
1.0
0.5
0.0
-0.5
-1.0
AL
MO
ANCA
TUSY
SW
HU
GR
GE
FR
EA
DABR
BA
AR
AA
PO
AZ
1.00.7
1.0
0.5
0.0
-0.5
-1.0
AL
MO
ANCA
TUSY
SW
HU
GR
GE
FR
EA
DABR
BA
AR
AA
PO
AZ
1.00.7
1.0
0.5
0.0
-0.5
-1.0
AL
MO
ANCA
TUSY
SW
HU
GR
GE
FR
EA
DABR
BA
AR
AA
PO
AZ
1.00.7
1.0
0.5
0.0
-0.5
-1.0
AL
MO
ANCA
TUSY
SW
HU
GR
GE
FR
EA
DABR
BA
AR
AA
PO
AZ
1.00.7
1.0
0.5
0.0
-0.5
-1.0
AL
MO
ANCA
TUSY
SW
HU
GR
GE
FR
EA
DABR
BA
AR
AA
PO
AZ
1st Component (88.8%)1.00.7
Com
pone
nt(5
.9%
)2n
d
1.0
0.5
0.0
-0.5
-1.0
AL
MO
ANCA
TUSY
SW
HU
GR
GE
FR
EA
DABR
BA
AR
AA
PO
AZ
1.00.7
1.0
0.5
0.0
-0.5
-1.0
AL
MO
ANCA
TUSY
SW
HU
GR
GE
FR
EA
DABR
BA
AR
AA
PO
AZ
1.00.7
1.0
0.5
0.0
-0.5
-1.0
AL
MO
ANCA
TUSY
SW
HU
GR
GE
FR
EA
DABR
BA
AR
AA
PO
AZ
1.00.7
1.0
0.5
0.0
-0.5
-1.0
AL
MO
ANCA
TUSY
SW
HU
GR
GE
FR
EA
DABR
BA
AR
AA
PO
AZ
1.00.7
1.0
0.5
0.0
-0.5
-1.0
AL
MO
ANCA
TUSY
SW
HU
GR
GE
FR
EA
DABR
BA
AR
AA
PO
AZ
1.00.7
1.0
0.5
0.0
-0.5
-1.0
AL
MO
ANCA
TUSY
SW
HU
GR
GE
FR
EA
DABR
BA
AR
AA
PO
AZ
1.00.7
1.0
0.5
0.0
-0.5
-1.0
AL
MO
ANCA
TUSY
SW
HU
GR
GE
FR
EA
DABR
BA
AR
AA
PO
AZ
1st Component (88.8%)1st Component (88.8%)1.00.7
Com
pone
nt(5
.9%
)2n
d C
ompo
nent
(5.9
%)
2nd
1.0
0.5
0.0
-0.5
-1.0
AL
MO
ANCA
TUSY
SW
HU
GR
GE
FR
EA
DABR
BA
AR
AA
PO
AZ
French
Catalans
Swiss
Andalusia
EuAmerica
Azores
GreekPortugal
Moroccans
Algerians
Hungarian
Armenian
German
Syrians
Turks
BretonsDarginia
Bantu
Ancestral
AfAmerica
French
Catalans
Swiss
Andalusia
EuAmerica
Azores
GreekPortugal
Moroccans
Algerians
Hungarian
Armenian
German
Syrians
Turks
BretonsDarginia
Bantu
Ancestral
AfAmerica
French
Catalans
Swiss
Andalusia
EuAmerica
Azores
GreekPortugal
Moroccans
Algerians
Hungarian
Armenian
German
Syrians
Turks
BretonsDarginia
Bantu
Ancestral
AfAmerica
CHAPTER VI Azorean Ancestry: Alu insertions
VI.2.5. Concluding remarks
Alu insertions are widely distributed throughout the human genome, constituting
convenient markers to assess genetic diversity between human populations. Here we
show that Alu frequencies in Azores and mainland Portugal are very similar to other
European regions. Despite being geographically isolated, the Azores show no genetic
differentiation when compared to mainland Portugal, which may only be explained by
its recent historic settlement (~500 years). Moreover, the results here presented reveal
that Azores is an outbred population with high genetic diversity. In summary, our data
also support the use of Alu insertion polymorphisms to assess the origin and history of
populations.
166
167
“A journey of a thousand miles begins with a single step.”
Confucius
CHAPTER VII
AZOREAN GENETIC DIVERSITY AND STRUCTURE
Genetic signature of the São Miguel Island population (Azores)
assessed by 21 microsatellite loci
Published in Am J Hum Biol, 2007
Azores islands: genetic origin, gene flow and diversity patterns
2007 submitted
Evaluation of linkage disequilibrium on the Xq13.3 region:
comparison between the Azores Islands and mainland Portugal
Published in Am J Hum Biol, 2007
Linkage disequilibrium on Xq13.3, NRY and HLA regions in
São Miguel Island (Azores) population
2007 submitted
CHAPTER VII Azorean Structure: São Miguel Island
VII.1. Genetic signature of the São Miguel Island population (Azores)
assessed by 21 microsatellite loci
VII.1.1. Summary
To study the genetic diversity of São Miguel’s population we compared 21
microsatellite loci in 204 individuals from São Miguel Island and 103 individuals from
mainland Portugal. The results show that São Miguel and mainland Portugal
populations have an average gene diversity of 0.767 and 0.765, respectively. Allele
frequencies of all markers are comparable to other European populations. This result is
corroborated by the genetic relationships analysis based on the NJ tree and principal
component, where São Miguel, and probably, Azores is closely related to mainland
Portugal. Overall, the data suggests that São Miguel population does not show
population structure and is behaving as an outbred population with high genetic
diversity.
VII.1.2. Introduction
The genetic variation of modern human populations, including disease-causing
variation, results of many evolutionary processes, most of which are still unknown
(Tishkoff and Varrelli 2003). Understanding these processes will shed light on how past
demography shaped variation in the human genome. In this study, we characterize the
overall diversity of São Miguel’s population, based on the analysis of 21 autosomal
STRs. Our main purpose is to estimate the genetic heterogeneity of the island
population and infer its genetic structure in order to understand its past history and
genetic evolution.
VII.1.3. Material and Methods
VII.1.3.1. Population samples
The sample population, composed of 204 healthy unrelated individuals, was obtained
from the anonymous Azorean DNA bank located at the main Hospital in São Miguel 168
CHAPTER VII Azorean Structure: São Miguel Island Island (Mota-Vieira et al. 2005). In addition, 103 mainland Portuguese individuals were
analysed. The collection the samples followed the international ethical guidelines for
sample collection, processing and storage.
VII.1.3.2. STR typing
Twenty-one microsatellite loci (TPOX, D3S1358, FGA, CSF1PO, D5S818, D6S265,
TNFα, D7S820, D8S1179, D10S525, TH01, vWA, D13S317, D14S306, FES/FPS,
D16S539, D17S976, D18S51, D19S433, D20S161 and D22S417) were typed using
fluorescently labelled primers described previously in Human Databases (STRBase34
and Human Genome Database35). PCR amplifications were carried out and run on a
CEQ™8000 Genetic Analysis System (Beckman Coulter).
VII.1.3.3. Statistical analysis
Allele frequencies were calculated by direct counting; Hardy-Weinberg equilibrium,
gene diversity and inbreeding coefficient were assessed by the GENEPOP web version
software. FST related genetic distances were computed between pairs of populations by
means of DISPAN and the distance matrix was used to construct a Neighbor-Joining
(NJ) tree using PHYLIP 3.63. We used TreeView 1.6.6 to display tree phylogenies
obtained from NJ. The FST values were calculated using data of allele frequencies,
deposited in the ALFRED database, for 11 STRs (TPOX, D3S1358, FGA, CSF1PO,
D5S818, D7S820, D8S1179, TH01, vWA, D13S317 and D18S51), since the
information for the remaining microsatellites was not available. The following
populations were selected from the same database: north and center Portugal, north
Spain, Madeira, Cape Verde, Andalusia, Belgium, Italy, Morocco, Fang, Arabs, Indian
and Turks.
34 STRBase, http://www.cstl.nist.gov/biotec/strbase. 35 Human Genome Database - GDB, http://www.gdb.org.
169
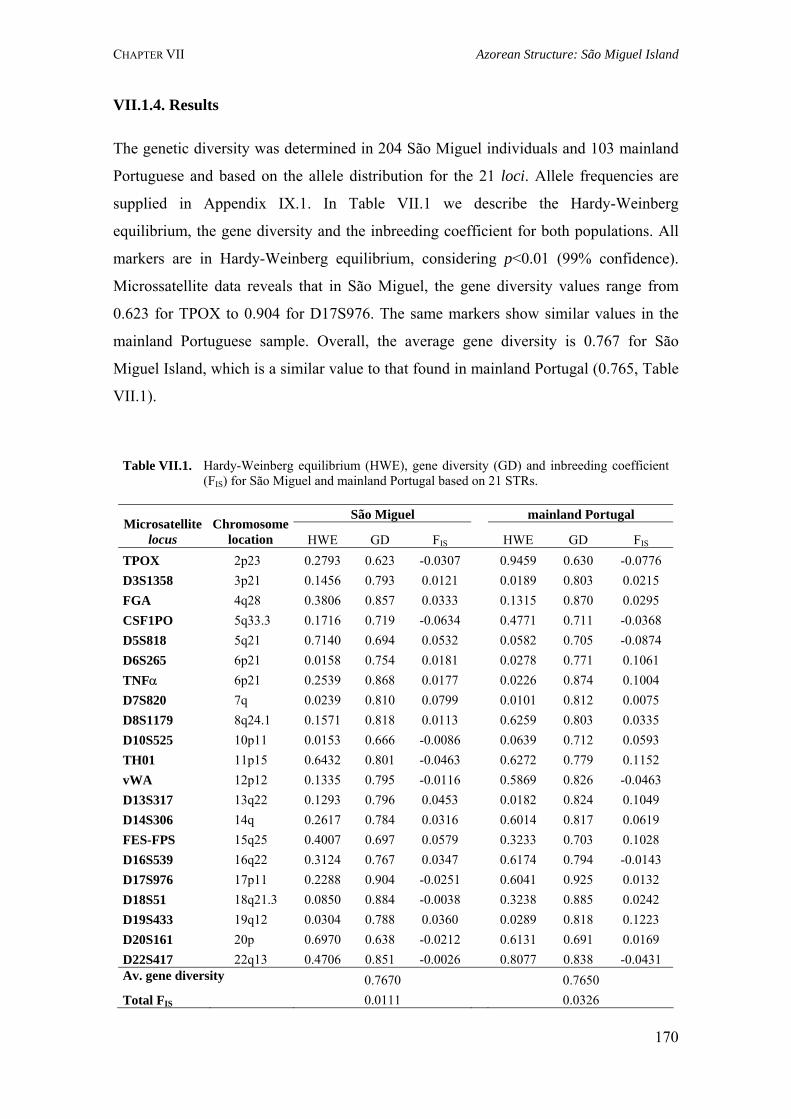
CHAPTER VII Azorean Structure: São Miguel Island VII.1.4. Results
The genetic diversity was determined in 204 São Miguel individuals and 103 mainland
Portuguese and based on the allele distribution for the 21 loci. Allele frequencies are
supplied in Appendix IX.1. In Table VII.1 we describe the Hardy-Weinberg
equilibrium, the gene diversity and the inbreeding coefficient for both populations. All
markers are in Hardy-Weinberg equilibrium, considering p<0.01 (99% confidence).
Microssatellite data reveals that in São Miguel, the gene diversity values range from
0.623 for TPOX to 0.904 for D17S976. The same markers show similar values in the
mainland Portuguese sample. Overall, the average gene diversity is 0.767 for São
Miguel Island, which is a similar value to that found in mainland Portugal (0.765, Table
VII.1).
Table VII.1. Hardy-Weinberg equilibrium (HWE), gene diversity (GD) and inbreeding coefficient
(FIS) for São Miguel and mainland Portugal based on 21 STRs.
São Miguel mainland Portugal Microsatellite
locus Chromosome
location HWE GD FIS HWE GD FIS
TPOX 2p23 0.2793 0.623 -0.0307 0.9459 0.630 -0.0776 D3S1358 3p21 0.1456 0.793 0.0121 0.0189 0.803 0.0215 FGA 4q28 0.3806 0.857 0.0333 0.1315 0.870 0.0295 CSF1PO 5q33.3 0.1716 0.719 -0.0634 0.4771 0.711 -0.0368 D5S818 5q21 0.7140 0.694 0.0532 0.0582 0.705 -0.0874 D6S265 6p21 0.0158 0.754 0.0181 0.0278 0.771 0.1061 TNFα 6p21 0.2539 0.868 0.0177 0.0226 0.874 0.1004 D7S820 7q 0.0239 0.810 0.0799 0.0101 0.812 0.0075 D8S1179 8q24.1 0.1571 0.818 0.0113 0.6259 0.803 0.0335 D10S525 10p11 0.0153 0.666 -0.0086 0.0639 0.712 0.0593 TH01 11p15 0.6432 0.801 -0.0463 0.6272 0.779 0.1152 vWA 12p12 0.1335 0.795 -0.0116 0.5869 0.826 -0.0463 D13S317 13q22 0.1293 0.796 0.0453 0.0182 0.824 0.1049 D14S306 14q 0.2617 0.784 0.0316 0.6014 0.817 0.0619 FES-FPS 15q25 0.4007 0.697 0.0579 0.3233 0.703 0.1028 D16S539 16q22 0.3124 0.767 0.0347 0.6174 0.794 -0.0143 D17S976 17p11 0.2288 0.904 -0.0251 0.6041 0.925 0.0132 D18S51 18q21.3 0.0850 0.884 -0.0038 0.3238 0.885 0.0242 D19S433 19q12 0.0304 0.788 0.0360 0.0289 0.818 0.1223 D20S161 20p 0.6970 0.638 -0.0212 0.6131 0.691 0.0169 D22S417 22q13 0.4706 0.851 -0.0026 0.8077 0.838 -0.0431 Av. gene diversity 0.7670 0.7650 Total FIS 0.0111 0.0326
170
CHAPTER VII Azorean Structure: São Miguel Island The assessment of the inbreeding coefficient was performed by the calculation of FIS.
The level of inbreeding for each marker, for the São Miguel sample, ranges from –
0.0634 to 0.0799 for CSF1PO and D7S820, respectively. In general, the total value of
FIS is 0.0111 for São Miguel and 0.0326 for mainland Portugal (Table VII.1).
To investigate the relationships between São Miguel, mainland Portuguese and other
European and African populations, we used FST genetic distances depicted in a NJ tree
(Figure VII.1). The data shows a close proximity between all European populations,
where São Miguel clusters. Noteworthy, Fang and Arabia are the most divergent and
show genetic proximity with the Morocco and Cape Verde populations. However, since
a NJ tree imposes a bifurcating model onto a distance matrix, which may be inadequate
for closely related populations, such as, São Miguel and Portugal, we also performed a
PC analysis (Figure VII.1). The first and second PC accounts for 73.9% and 11.9% of
the genetic variance observed, respectively, and their plot shows a similar pattern to that
shown in the NJ tree. Overall, the genetic relationships reveal that São Miguel is closely
related to mainland Portugal.
VII.1.5. Discussion
In order to assess the patterns of genetic diversity in São Miguel and in mainland
Portugal, we genotyped 21 microsatellite loci in 204 islanders and 103 mainland
Portuguese subjects. In general, the data suggest high gene diversity for both
populations, with no significant difference between them. The comparison of FIS values
for the mainland (0.0326) and the São Miguel (0.0111) samples suggests higher
inbreeding in the mainland. Although there is a significant difference (χ2, p<0.001) in
FIS values, the observed trend is not in agreement with results obtained in a comparative
study of consanguineous marriages (first cousins, uncle-niece and aunt-nephew)
registered by the National Institute of Statistics for Azores, Madeira and mainland
Portugal from 1931 to 2000 (Pacheco et al. 2003). The small values for this parameter
in both populations suggest that mainland and São Miguel do not show genetic structure
and are behaving as expanded populations with high genetic diversity.
171
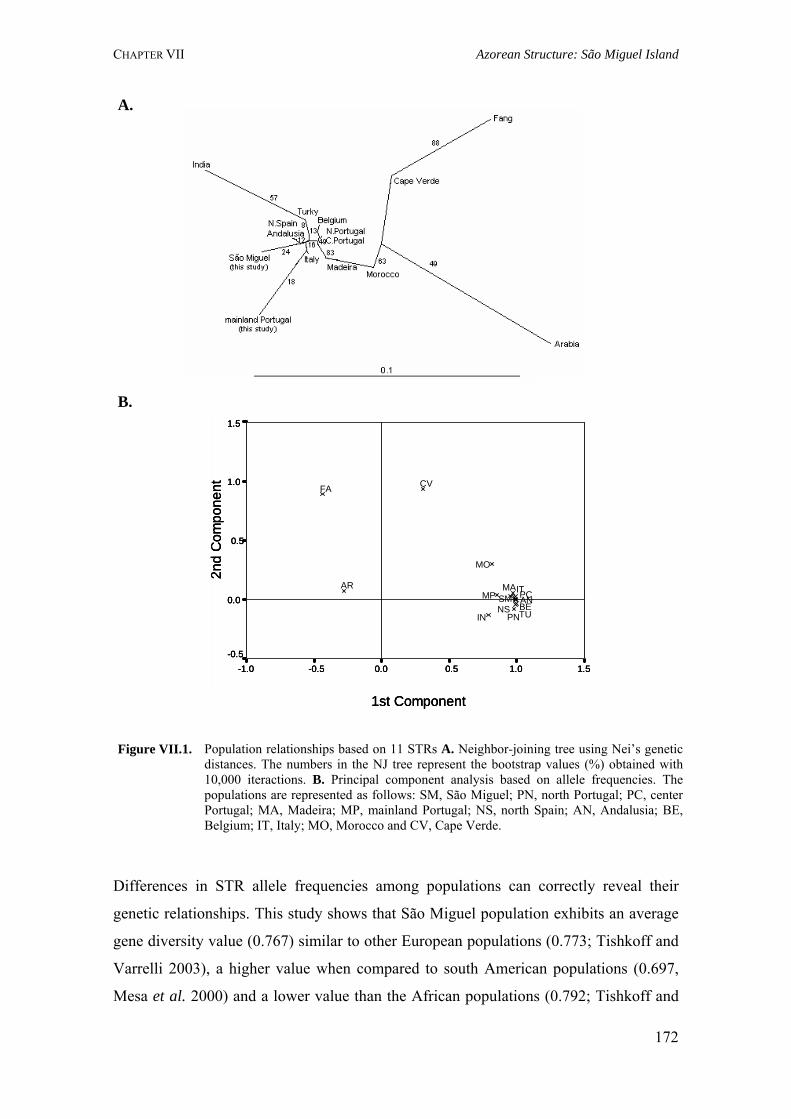
CHAPTER VII Azorean Structure: São Miguel Island
172
A.
B.
Figure VII.1. Population relationships based on 11 STRs A. Neighbor-joining tree using Nei’s genetic distances. The numbers in the NJ tree represent the bootstrap values (%) obtained with 10,000 iteractions. B. Principal component analysis based on allele frequencies. The populations are represented as follows: SM, São Miguel; PN, north Portugal; PC, center Portugal; MA, Madeira; MP, mainland Portugal; NS, north Spain; AN, Andalusia; BE, Belgium; IT, Italy; MO, Morocco and CV, Cape Verde.
Differences in STR allele frequencies among populations can correctly reveal their
genetic relationships. This study shows that São Miguel population exhibits an average
gene diversity value (0.767) similar to other European populations (0.773; Tishkoff and
Varrelli 2003), a higher value when compared to south American populations (0.697,
Mesa et al. 2000) and a lower value than the African populations (0.792; Tishkoff and
1st Component
1.51.00.50.0-0.5-1.0
2nd
Com
pone
nt
1.5
1.0
0.5
0.0
-0.5
TUIN
AR
FA
MP
CV
MO
IT
BENSAN
MAPC
PN
SM
1st Component
1.51.00.50.0-0.5-1.0
2nd
Com
pone
nt
1.5
1.0
0.5
0.0
-0.5
TUIN
AR
FA
MP
CV
MO
IT
BENSAN
MAPC
PN
SM
1st Component
1.51.00.50.0-0.5-1.0
2nd
Com
pone
nt
1.5
1.0
0.5
0.0
-0.5
TUIN
AR
FA
MP
CV
MO
IT
BENSAN
MAPC
PN
SM
CHAPTER VII Azorean Structure: São Miguel Island Varrelli 2003). Furthermore, allele frequencies of all markers are comparable to other
European populations. The NJ tree shows São Miguel clustering with the mainland
Portuguese sample. This last sample does not cluster with north and center Portugal,
probably because it is composed mainly by individuals from the south region. This
observation agrees with other genetic studies (Pacheco et al. 2005, Montiel et al. 2005,
Gonçalves et al. 2005), where the mainland south region is genetically different when
compared with the other two regions, north and center. In addition, we observe a
clustering of these populations with north Spain, Italy, Belgium, Madeira and
Andalusia. In general, the results agree with a previous genetic study of the Azorean and
the mainland Portugal populations, based on Alu insertion polymorphisms (Branco et al.
2006).
The genetic reconstruction of human origins and history requires evidence from
different parts of the genome. Previous studies have reported a high genetic variability
and heterogeneity of the Azorean population based on the maternal (Santos et al. 2003)
and paternal (Pacheco et al. 2005) lineages. The results, based on microsatellites,
support these observations and corroborate historical evidence of the settlement of São
Miguel Island and, consequently, of Azores archipelago. Thus, the data suggests that
São Miguel and probably the Azorean genetic signature results from the major
contribution of Portuguese. Understanding the background of neutral human genetic
variation provides insights about the allelic structure of health-related genetic variation
(Bamshad et al. 2004). Therefore, the knowledge here obtained will be crucial to predict
and explain the genotypes implicated in genetic diseases in the Azorean population.
173
CHAPTER VII Azorean Structure: Origin, diversity and gene flow
VII.2. Azores islands: genetic origin, gene flow and diversity pattern
VII.2.1. Summary
The Azores are an archipelago located in the north Atlantic Ocean (parallel 38)
composed of nine islands, dispersed over three geographical groups: The Eastern Group
(São Miguel and Santa Maria), the Central (Terceira, Graciosa, Pico, São Jorge and
Faial) and the Western (Flores and Corvo). Taking into consideration the geographical
and settlement history differences of the archipelago, we assessed the genetic diversity
pattern and the internal migration of the Azorean population, based on the analysis of 15
STR loci in 592 unrelated individuals. The results of this evaluation reveal that Terceira
displays the highest value of gene diversity (0.7979) and Corvo the lowest (0.7717).
Gene flow analysis indicates that Corvo has the lowest values of migration, 23.35,
whereas São Miguel and Terceira present the highest values of emigration, 108.14 and
87.66, respectively. Taken together, the data demonstrate that, despite settlement
diversity, no genetic difference between the islands population is observable today. This
may be explained by the internal migration. Overall, the Azorean population can be
analysed as a homogeneous genetic group presenting, possibly, the same drug-reaction
profile. In terms of genomic medicine, these results will have a significant impact in the
design of future genetic and pharmacogenomic studies in the Azorean population.
VII.2.2. Introduction
Population-specific genetic variation has been reported to be crucial for the genetic
understanding of human demography and history. Moreover, several studies have
emphasised its use in many fields of biomedical research, such as, the variation of
disease prevalence in different regions and in pharmacogenetics (Cavalli-Sforza and
Feldman 2003; The International HapMap Consortium 2005; Tishkoff and Kidd 2004;
Foster and Sharp 2004; Suarez-Kurtz and Pena 2006). Therefore, a clear knowledge of
the genetic variation of a population is of great interest. Our main objective is to answer
questions such as: What is the genetic relationship between the different islands? Given
the recent origin of the Azorean population, is the historic differential settlement
revealed by the autosomal markers? What are the patterns of gene flow between the
174
CHAPTER VII Azorean Structure: Origin, diversity and gene flow islands’ populations? In addition, we intend to assess the overall genetic heterogeneity
of the Azorean population and compare it with other well described populations.
VII.2.3. Material and Methods
VII.2.3.1. Population samples
The study of the genetic diversity was based on a sample composed of 592 healthy
Azoreans, obtained from the anonymous DNA bank located at the Hospital of Divino
Espirito Santo (Ponta Delgada, São Miguel Island), the central hospital of the Azores.
This bank was built according to the international ethical guidelines for sample
collection, processing and storage (Mota-Vieira et al. 2005). The sample distribution
per geographic group and island was the following: Eastern group, 166 (São Miguel,
114; Santa Maria, 52); Central group, 320 (Terceira, 103; Pico, 66; São Jorge, 51; Faial,
53; Graciosa, 47) and the Western group, 106 (Flores 76; Corvo, 30).
VII.2.3.2. STR genotyping
The PCR co-amplification of the fifteen STR loci (Penta-E, D18S51, D21S11, TH01,
D3S1358, FGA, TPOX, D8S1179, vWA, Penta-D, CSF1PO, D16S539, D7S820,
D13S317 and D5S818) and Amelogenin was performed using the multiplex STR
system PowerPlex® 16 (Promega), according to the manufacturer’s instructions.
Amplification was carried out on a DNA thermocycler GeneAmp® PCR System 2700
(Applied Biosystems) in a 10 µl PCR reaction with 2.5 ng of template DNA. PCR
products were mixed with deionised formamide and internal lane standard ILS-600
(Applied Biosystems), and separated on an ABI 3130 Genetic Analyser. The sizing and
genotyping were analyzed using GeneMapper® ID 3.2 software, and allele designations
were made by comparison with the allelic ladders provided in the kit.
175
CHAPTER VII Azorean Structure: Origin, diversity and gene flow VII.2.3.3. Statistical analysis
Allele frequencies were calculated by direct counting; the Hardy-Weinberg equilibrium
and gene diversity were assessed by the Arlequin software (Schneider et al. 2000).
Slatkins FST genetic distance matrix was computed between pairs of populations by
Arlequin and used to perform Principal components analysis. The FST values were
calculated using data of allele frequencies, deposited in the ALFRED database
(Rajeevan et al. 2003), for 13 STRs (D18S51, D21S11, TH01, D3S1358, FGA, TPOX,
D8S1179, vWA, CSF1PO, D16S539, D7S820, D13S317 and D5S818). The following
populations were chosen from the same database taking into consideration their possible
relation to the Azorean Islands: Fang, Guinea, Mozambique, African American,
Andalusia, Belgium, Italy, Spain, Basque, Ashkenazi Jew, Portugal, Brazil, Morocco,
Han and Arab. Penta-E and Penta-D markers were not considered, since they were not
described for all of these populations.
In order to estimate rates of migration among the islands’ populations, we used the
method implemented in the Migrate 2.1.2 software (Beerli and Felsenstein 1999). This
method uses a maximum likelihood framework based on coalescence theory and
support the one-step mutation model for microsatellites. Moreover, Migrate software
provides by default estimates of M=4Nem, where Ne is the effective population size and
m the actual migration rate. In order to avoid influence of the differences of Ne between
all islands we selected randomly from each sample 30 individuals, which corresponds to
the smaller sample size (Corvo Island).
VII.2.4. Results
The assessment of genetic diversity of all the Azorean Islands’ populations was based
on the allele distribution of 15 STR markers. Table VII.2 shows the Hardy-Weinberg
equilibrium (HWE) p values and the gene diversity (GD) for each marker. All markers
are in HWE, considering a 99% confidence (p<0.01), and are relatively polymorphic.
The average number of alleles per locus is 11, ranging from 6 (TH01) to 20 (FGA).
Comparing the allele composition between our sample and published data (ALFRED
176
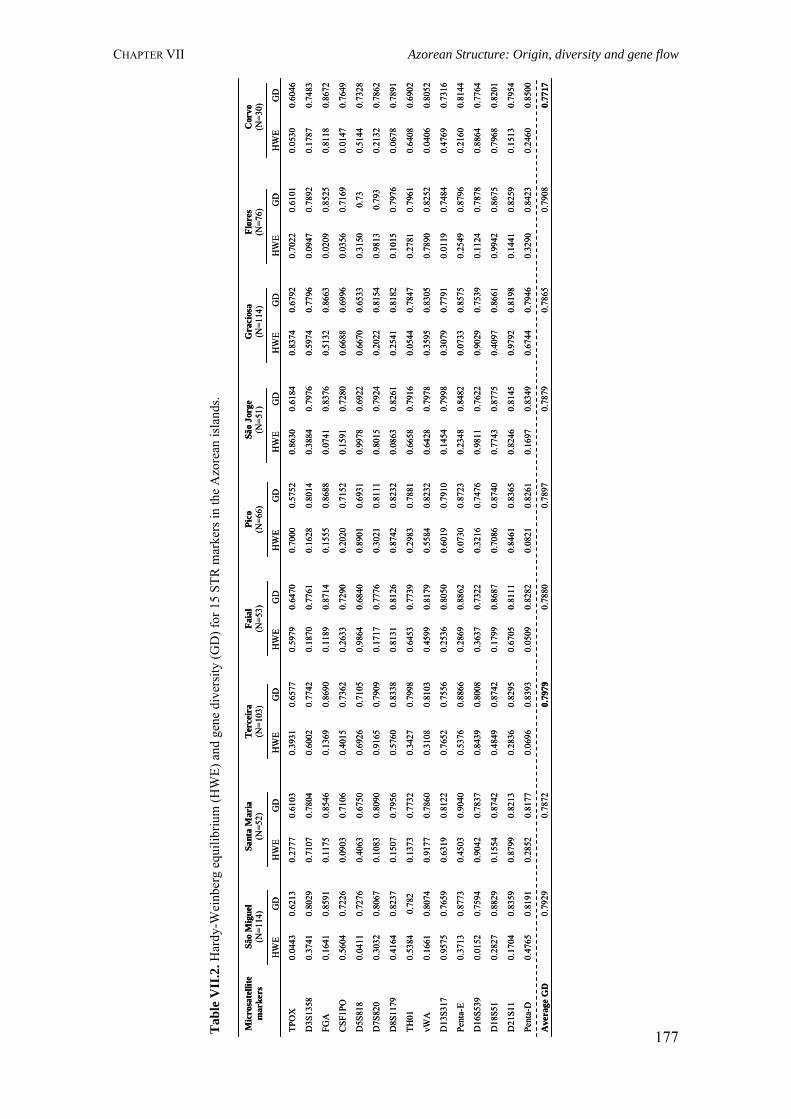
CHAPTER VII Azorean Structure: Origin, diversity and gene flow
177
São
Mig
uel
(N=1
14)
Sa
nta
Mar
ia
(N=5
2)
T
erce
ira
(N=1
03)
Fa
ial
(N=5
3)
Pi
co
(N=6
6)
Sã
o Jo
rge
(N=5
1)
G
raci
osa
(N
=114
)
Flor
es
(N=7
6)
C
orvo
(N
=30)
M
icro
sate
llite
m
arke
rs
HW
E G
D
H
WE
GD
HW
E G
D
H
WE
GD
HW
E G
D
H
WE
GD
HW
E G
D
H
WE
GD
HW
E G
D
TPO
X
0.04
43
0.62
13
0.
2777
0.
6103
0.39
31
0.65
77
0.
5979
0.
6470
0.70
00
0.57
52
0.
8630
0.
6184
0.83
74
0.67
92
0.
7022
0.
6101
0.05
30
0.60
46
D3S
1358
0.
3741
0.
8029
0.71
07
0.78
04
0.
6002
0.
7742
0.18
70
0.77
61
0.
1628
0.
8014
0.38
84
0.79
76
0.
5974
0.
7796
0.09
47
0.78
92
0.
1787
0.
7483
FGA
0.
1641
0.
8591
0.11
75
0.85
46
0.
1369
0.
8690
0.11
89
0.87
14
0.
1555
0.
8688
0.07
41
0.83
76
0.
5132
0.
8663
0.02
09
0.85
25
0.
8118
0.
8672
CSF
1PO
0.
5604
0.
7226
0.09
03
0.71
06
0.
4015
0.
7362
0.26
33
0.72
90
0.
2020
0.
7152
0.15
91
0.72
80
0.
6688
0.
6996
0.03
56
0.71
69
0.
0147
0.
7649
D5S
818
0.04
11
0.72
76
0.
4063
0.
6750
0.69
26
0.71
05
0.
9864
0.
6840
0.89
01
0.69
31
0.
9978
0.
6922
0.66
70
0.65
33
0.
3150
0.
73
0.
5144
0.
7328
D7S
820
0.30
32
0.80
67
0.
1083
0.
8090
0.91
65
0.79
09
0.
1717
0.
7776
0.30
21
0.81
11
0.
8015
0.
7924
0.20
22
0.81
54
0.
9813
0.
793
0.
2132
0.
7862
D8S
1179
0.
4164
0.
8237
0.15
07
0.79
56
0.
5760
0.
8338
0.81
31
0.81
26
0.
8742
0.
8232
0.08
63
0.82
61
0.
2541
0.
8182
0.10
15
0.79
76
0.
0678
0.
7891
TH01
0.
5384
0.
782
0.
1373
0.
7732
0.34
27
0.79
98
0.
6453
0.
7739
0.29
83
0.78
81
0.
6658
0.
7916
0.05
44
0.78
47
0.
2781
0.
7961
0.64
08
0.69
02
vWA
0.
1661
0.
8074
0.91
77
0.78
60
0.
3108
0.
8103
0.45
99
0.81
79
0.
5584
0.
8232
0.64
28
0.79
78
0.
3595
0.
8305
0.78
90
0.82
52
0.
0406
0.
8052
D13
S317
0.
9575
0.
7659
0.63
19
0.81
22
0.
7652
0.
7556
0.25
36
0.80
50
0.
6019
0.
7910
0.14
54
0.79
98
0.
3079
0.
7791
0.01
19
0.74
84
0.
4769
0.
7316
Pent
a-E
0.37
13
0.87
73
0.
4503
0.
9040
0.53
76
0.88
66
0.
2869
0.
8862
0.07
30
0.87
23
0.
2348
0.
8482
0.07
33
0.85
75
0.
2549
0.
8796
0.21
60
0.81
44
D16
S539
0.
0152
0.
7594
0.90
42
0.78
37
0.
8439
0.
8008
0.36
37
0.73
22
0.
3216
0.
7476
0.98
11
0.76
22
0.
9029
0.
7539
0.11
24
0.78
78
0.
8864
0.
7764
D18
S51
0.28
27
0.88
29
0.
1554
0.
8742
0.48
49
0.87
42
0.
1799
0.
8687
0.70
86
0.87
40
0.
7743
0.
8775
0.40
97
0.86
61
0.
9942
0.
8675
0.79
68
0.82
01
D21
S11
0.17
04
0.83
59
0.
8799
0.
8213
0.28
36
0.82
95
0.
6705
0.
8111
0.84
61
0.83
65
0.
8246
0.
8145
0.97
92
0.81
98
0.
1441
0.
8259
0.15
13
0.79
54
Pent
a-D
0.
4765
0.
8191
0.28
52
0.81
77
0.
0696
0.
8393
0.05
09
0.82
82
0.
0821
0.
8261
0.16
97
0.83
49
0.
6744
0.
7946
0.32
90
0.84
23
0.
2460
0.
8500
Ave
rage
GD
0.
7929
0.
7872
0.
7979
0.
7880
0.
7897
0.
7879
0.
7865
0.
7908
0.
7717
Tab
le V
II.2
. Har
dy-W
einb
erg
equi
libriu
m (H
WE)
and
gen
e di
vers
ity (G
D) f
or 1
5 ST
R m
arke
rs in
the
Azo
rean
isla
nds.
CHAPTER VII Azorean Structure: Origin, diversity and gene flow Database; Rajeevan et al. 2003), we observe rare alleles in the Azores, namely
D18S51*24 and FGA*25.2. The most interesting is FGA*25.2, which was found in São
Miguel and Faial Islands, and is particularly frequent in India. In general, Penta-E and
D18S51 show the highest values of gene diversity (around 0.87). The marker with the
lowest gene diversity is TPOX with values varying from 0.575 to 0.679 for Pico and
Graciosa, respectively. The gene diversity values reveal that Terceira shows the highest
value (0.7979) and Corvo presents the lowest (0.7717). However, all values are similar
between islands and do not show a statistically significant difference (χ2, p=0.999). The
average gene diversity for the whole Azorean population is 0.788.
To understand the gene flow patterns between islands, we calculated the migration
(emigration and immigration) rates through the Migrate software (Table VII.3). The
data suggest that Corvo is the island with the lowest values of migration. São Miguel
and Terceira islands present the highest values of emigration, 108.14 and 87.66,
respectively. On the other hand, Santa Maria shows the highest value (79.11) of
immigration followed by Graciosa with 69.04. The Azorean population has an average
migration value of 51.57.
The relationship between all islands was assessed by FST genetic distances and
displayed by Principal Component (PC). The PC results (Figure VII.2) demonstrates
that Corvo is the most genetically different island when compared with the other
islands. Moreover, the data show a closer proximity between the Azorean Central
(Terceira, Pico, Faial, São Jorge and Graciosa) and Eastern (São Miguel and Santa
Maria) groups. These results are supported by the AMOVA analysis, where the Western
group is the most different when compared with the other two groups. Nevertheless,
these differences are not significant, only 1% of variance is observed between all groups
of islands. The first and second PC accounts for 82.6% and 9.6% of the genetic
variance, respectively. Moreover, to assess if genetic distances were correlated with
geographic distances, we performed a Mantel test. The results show a relative
correlation (r=0.457) between both distances with about 21% of the genetic variance
explained by the geographic distance.
178
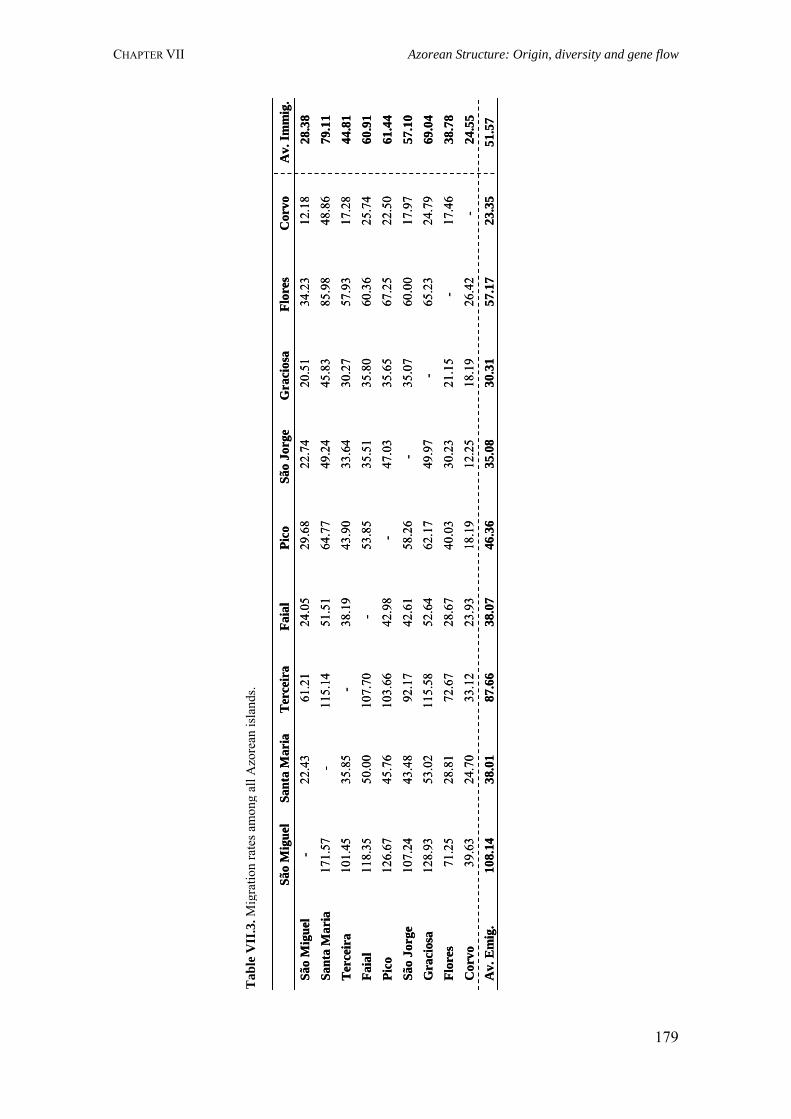
CHAPTER VII Azorean Structure: Origin, diversity and gene flow
179
Tab
le V
II.3
. Mig
ratio
n ra
tes a
mon
g al
l Azo
rean
isla
nds.
Sã
o M
igue
l Sa
nta
Mar
ia
Ter
ceir
a Fa
ial
Pico
Sã
o Jo
rge
Gra
cios
a Fl
ores
C
orvo
A
v. Im
mig
. Sã
o M
igue
l -
22.4
3 61
.21
24.0
5 29
.68
22.7
4 20
.51
34.2
3 12
.18
28.3
8 Sa
nta
Mar
ia
171.
57
- 11
5.14
51
.51
64.7
7 49
.24
45.8
3 85
.98
48.8
6 79
.11
Ter
ceir
a 10
1.45
35
.85
- 38
.19
43.9
0 33
.64
30.2
7 57
.93
17.2
8 44
.81
Faia
l 11
8.35
50
.00
107.
70
- 53
.85
35.5
1 35
.80
60.3
6 25
.74
60.9
1 Pi
co
126.
67
45.7
6 10
3.66
42
.98
- 47
.03
35.6
5 67
.25
22.5
0 61
.44
São
Jorg
e 10
7.24
43
.48
92.1
7 42
.61
58.2
6 -
35.0
7 60
.00
17.9
7 57
.10
Gra
cios
a 12
8.93
53
.02
115.
58
52.6
4 62
.17
49.9
7 -
65.2
3 24
.79
69.0
4 Fl
ores
71
.25
28.8
1 72
.67
28.6
7 40
.03
30.2
3 21
.15
- 17
.46
38.7
8 C
orvo
39
.63
24.7
0 33
.12
23.9
3 18
.19
12.2
5 18
.19
26.4
2 -
24.5
5 A
v. E
mig
. 10
8.14
38
.01
87.6
6 38
.07
46.3
6 35
.08
30.3
1 57
.17
23.3
5 51
.57
Sã
o M
igue
l Sa
nta
Mar
ia
Ter
ceir
a Fa
ial
Pico
Sã
o Jo
rge
Gra
cios
a Fl
ores
C
orvo
A
v. Im
mig
. Sã
o M
igue
l -
22.4
3 61
.21
24.0
5 29
.68
22.7
4 20
.51
34.2
3 12
.18
28.3
8 Sa
nta
Mar
ia
171.
57
- 11
5.14
51
.51
64.7
7 49
.24
45.8
3 85
.98
48.8
6 79
.11
Ter
ceir
a 10
1.45
35
.85
- 38
.19
43.9
0 33
.64
30.2
7 57
.93
17.2
8 44
.81
Faia
l 11
8.35
50
.00
107.
70
- 53
.85
35.5
1 35
.80
60.3
6 25
.74
60.9
1 Pi
co
126.
67
45.7
6 10
3.66
42
.98
- 47
.03
35.6
5 67
.25
22.5
0 61
.44
São
Jorg
e 10
7.24
43
.48
92.1
7 42
.61
58.2
6 -
35.0
7 60
.00
17.9
7 57
.10
Gra
cios
a 12
8.93
53
.02
115.
58
52.6
4 62
.17
49.9
7 -
65.2
3 24
.79
69.0
4 Fl
ores
71
.25
28.8
1 72
.67
28.6
7 40
.03
30.2
3 21
.15
- 17
.46
38.7
8 C
orvo
39
.63
24.7
0 33
.12
23.9
3 18
.19
12.2
5 18
.19
26.4
2 -
24.5
5 A
v. E
mig
. 10
8.14
38
.01
87.6
6 38
.07
46.3
6 35
.08
30.3
1 57
.17
23.3
5 51
.57
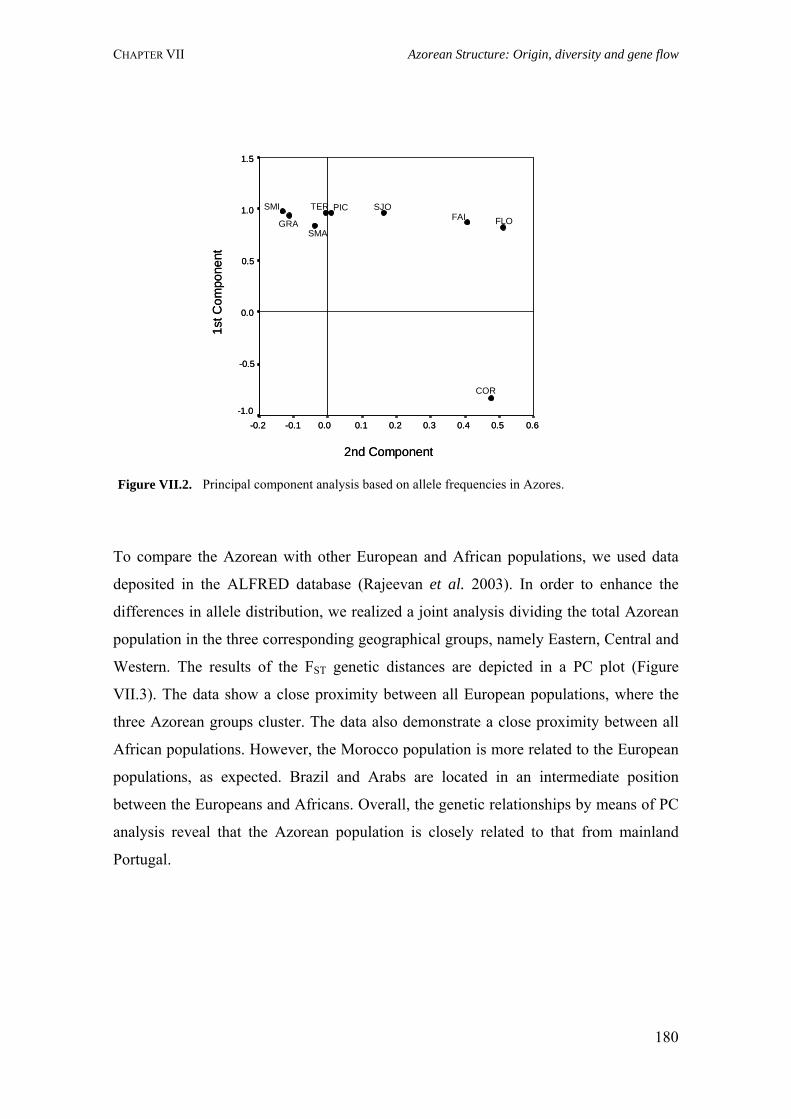
CHAPTER VII Azorean Structure: Origin, diversity and gene flow
180
To compare the Azorean with other European and African populations, we used data
deposited in the ALFRED database (Rajeevan et al. 2003). In order to enhance the
differences in allele distribution, we realized a joint analysis dividing the total Azorean
population in the three corresponding geographical groups, namely Eastern, Central and
Western. The results of the FST genetic distances are depicted in a PC plot (Figure
VII.3). The data show a close proximity between all European populations, where the
three Azorean groups cluster. The data also demonstrate a close proximity between all
African populations. However, the Morocco population is more related to the European
populations, as expected. Brazil and Arabs are located in an intermediate position
between the Europeans and Africans. Overall, the genetic relationships by means of PC
analysis reveal that the Azorean population is closely related to that from mainland
Portugal.
Figure VII.2. Principal component analysis based on allele frequencies in Azores.
TER PICSMI
SMA
SJOFAI
GRA FLO
COR
2nd Component
0.60.50.40.30.20.10.0-0.1-0.2
1st C
ompo
nent
1.5
1.0
0.5
0.0
-0.5
-1.0
TER PICSMI
SMA
SJOFAI
GRA FLO
COR
2nd Component
0.60.50.40.30.20.10.0-0.1-0.2
1st C
ompo
nent
1.5
1.0
0.5
0.0
-0.5
-1.0
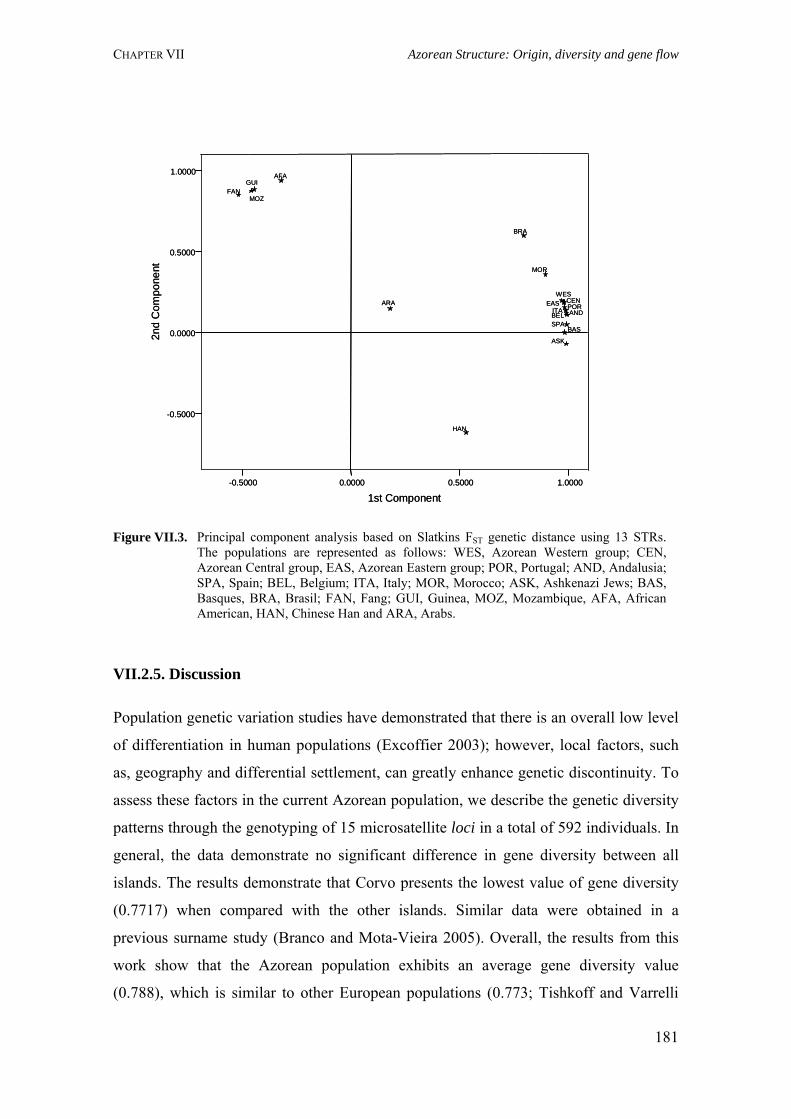
CHAPTER VII Azorean Structure: Origin, diversity and gene flow
181
VII.2.5. Discussion
Population genetic variation studies have demonstrated that there is an overall low level
of differentiation in human populations (Excoffier 2003); however, local factors, such
as, geography and differential settlement, can greatly enhance genetic discontinuity. To
assess these factors in the current Azorean population, we describe the genetic diversity
patterns through the genotyping of 15 microsatellite loci in a total of 592 individuals. In
general, the data demonstrate no significant difference in gene diversity between all
islands. The results demonstrate that Corvo presents the lowest value of gene diversity
(0.7717) when compared with the other islands. Similar data were obtained in a
previous surname study (Branco and Mota-Vieira 2005). Overall, the results from this
work show that the Azorean population exhibits an average gene diversity value
(0.788), which is similar to other European populations (0.773; Tishkoff and Varrelli
Figure VII.3. Principal component analysis based on Slatkins FST genetic distance using 13 STRs. The populations are represented as follows: WES, Azorean Western group; CEN, Azorean Central group, EAS, Azorean Eastern group; POR, Portugal; AND, Andalusia; SPA, Spain; BEL, Belgium; ITA, Italy; MOR, Morocco; ASK, Ashkenazi Jews; BAS, Basques, BRA, Brasil; FAN, Fang; GUI, Guinea, MOZ, Mozambique, AFA, African American, HAN, Chinese Han and ARA, Arabs.
1.00000.50000.0000-0.5000
1st Component
1.0000
0.5000
0.0000
-0.5000
2nd
Com
pone
nt
CENEAS
SPA
POR
MOR
MOZ
ASK
ITA
HAN
GUIFAN
BRA
BEL
BAS
ARAAND
AFA
WES
1.00000.50000.0000-0.5000
1st Component
1.0000
0.5000
0.0000
-0.5000
2nd
Com
pone
nt
CENEAS
SPA
POR
MOR
MOZ
ASK
ITA
HAN
GUIFAN
BRA
BEL
BAS
ARAAND
AFA
WES
CHAPTER VII Azorean Structure: Origin, diversity and gene flow 2003), higher than the South American populations (0.697; Mesa et al. 2003), and lower
than the African populations (0.792; Tishkoff and Varrelli 2003). Altogether, the data
suggest that the Azorean people present high genetic diversity as a result of the
archipelago’s settlement history. On the other hand, it may be argued that, STRs are
highly variable, because they have high mutation rates and, therefore, after a population
bottleneck, these markers would recover their diversity faster than other markers.
Nevertheless, autosomal markers, such as, Alu insertion polymorphisms, studied in the
Azorean population (Branco et al. 2006), show the same pattern of genetic diversity.
Interestingly, we identified in two Azorean islands the presence of a rare allele –
FGA*25.2 – not found in mainland Portugal, but prevalent in Indian populations.
During the 16th century, the commercial trade between Portugal and India (at the time
under Portuguese rule) was very important (Correia 1948). The Azores, because of its
geographic location in the north Atlantic Ocean, played a strategic role during that
period. Thus, these data may suggest the presence of individuals of Indian origin in the
archipelago. Alternatively, it may indicate the possibility of mutation in the FGA allele.
Migration is one of the main forces shaping genetic diversity of human populations. It
can affect genomic variation within a population, for example, by the redistribution of
genes geographically. Thus, understanding the causes, patterns and effects of migrations
is fundamental for interpreting the evolutionary history of a population (Cavalli-Sforza
and Feldman 2003). The data presented here show that Corvo stands out with the lowest
values of migration, suggesting that people have become sedentary. Nevertheless,
Corvo has the lowest population size (Ne). This last parameter affects the population’s
genetic diversity apportionment, as observed in the present study, where Corvo shows
the lowest values of diversity. Therefore, the low values of migration obtained in this
island can be a direct influence of Ne. São Miguel and Terceira, with the highest values
of emigration, have also the highest levels of gene diversity indicating that people of
these islands were the main contributors in the settlement of the other islands.
Nevertheless, the majority of the islands’ populations show low migrant proportions,
but we observe a high genetic similarity between them. Overall, the results indicate that
the islands’ populations did not evolve independently, but rather maintained
connections through the exchange of migrants. Other archipelagos, such as, Cape
Verde, still maintain genetic differences between groups of islands, namely Cape Verde
182
CHAPTER VII Azorean Structure: Origin, diversity and gene flow North and Cape Verde South, as a result of their settlement history (Fernandes et al.
2003). Nevertheless, probably the same result would be obtained if (i) the islands had
been peopled from the same population without a strong bottleneck, and (ii) the original
populations had been different but the differences between islands had been smoothed
out by migration. On the other hand, migration among islands can elucidate why
geography explains only 21% of the genetic variance, indicating that it contributed to a
mixture of the Azorean population as a whole.
In general, scientists agree that the characterization of regional diversity patterns has
several implications in biomedical research, with a strong input in the local health care.
The PC analysis (Figure VII.2) demonstrate a strong genetic similarity between all the
islands’ populations. These data are corroborated by the genetic diversity values, where
no significant differences (χ2, p=0.999) between islands were obtained. Nonetheless,
geography should be considered, since it is possible to observe a higher proximity
among islands of the same Azorean group. This observation is supported by the Mantel
test were ther is a correlation of 0.457 between genetic and geographic distances. The
comparison of the Azorean groups with other European and African populations
demonstrates a strong input of Europeans, the majority of which from mainland
Portugal in the origin of the archipelago’s population. Allelic frequencies change in
populations owing to two factors – natural selection and genetic drift –, both can
ultimately lead to the elimination or fixation of a particular gene (Cavalli-Sforza and
Feldman 2003). Considering the geography of the Azores archipelago, which could
potentiate the action of several genetic processes, like genetic drift, the overall results
do not suggest the influence of genetic drift nor natural selection.
Nuclear genetic variation allows the characterization of the overall genetic similarities
of populations that are the result of all historical phenomena (Kidd et al. 2000). Our
results based on microsatellite data demonstrate that, despite reports of differential
settlement for each island, there is no genetic difference between the islands’ population
today. Genetically structured populations may be composed of two or more
subpopulations with distinct drug-reaction profiles and thus in some contexts it would
be better to consider them separately (Wilson et al. 2001; Schaak et al. 2007;
Suarez-Kurtz and Pena 2006). The data described here show that the Azorean
population is an outbred population with no genetic structure. This suggests that, despite
183
CHAPTER VII Azorean Structure: Origin, diversity and gene flow living in different islands, the Azorean population can be treated as a homogeneous
genetic group, which consequently, would present, possibly, the same drug-response
pattern. Sistonen et al. (2007) studying CYP2D6 worldwide genetic variation observed
that patterns of variation, within and among populations, are similar to those observed
for other autosomal markers (e.g. microsatellites and protein polymorphisms),
suggesting that the diversity observed at the CYP2D6 locus reflects the same factors
affecting variation at random genome markers. In terms of genomic medicine, the
results obtained in the present work play an important role in the design of future
genetic and pharmacogenomic studies in the Azorean population.
184
CHAPTER VII Linkage disequilibrium in Azores
VII.3. Evaluation of linkage disequilibrium on the Xq13.3 region:
comparison between the Azores Islands and mainland Portugal
VII.3.1. Summary
The design of genetic studies of complex diseases is dependent on the extent and
distribution of linkage disequilibrium (LD) across the genome in different populations.
Here, we characterize the extent of LD in the Azores (Western, Central and Eastern
islands groups) and mainland Portugal populations. LD was evaluated in the Xq13.3
region by genotyping eight STR markers spanning 20.9 Mb. Standardized multiallelic
disequilibrium coefficient (D’) analysis indicates that the Western group presents higher
values when compared with the Central and Eastern groups. However, all islands
groups show values of D’ lower than 0.5 and 0.33, suggesting no extensive LD in these
populations. Taken together, the data show that the Azorean population presents a lower
D’ (0.142) than mainland Portugal (0.226). Although, both populations do not show
extensive LD, the easy reconstruction of large pedigrees in the Azorean population is a
valuable resource for the fine mapping of disease genes.
VII.3.2. Introduction
Linkage disequilibrium (LD) is defined as a non-random association of alleles at
different loci on the same chromosome. Studying the extent of LD and population
structure is a good starting point for the investigation of complex traits (Angius et al.
2002). The Azores is a Portuguese archipelago composed of nine islands, located in
north Atlantic Ocean. Its settlement began in 1439 with Portuguese individuals, but a
significant contribution from people with other genetic backgrounds, including Flemish,
Spanish, French, Italian, German, Scotish, Jewish, and also from Moorish prisoners and
black slaves from Guinea, Cape Verde and São Tomé also occurred. Nowadays, the
Azorean population is composed of 241,763 inhabitants (National Institute of Statistics
– Portugal, 2001 Census). Recently, the genetic background of the Azorean population
has been thoroughly analysed using autosomal (Branco et al. 2006, 2007; Spinola et al.
2005), mitochondrial (Santos et al. 2003) and Y-chromosome (Pacheco et al. 2005a;
Montiel et al. 2005) markers. These studies report a high genetic variability and
185
CHAPTER VII Linkage disequilibrium in Azores
heterogeneity of the Azorean population, which can be explained by the settling history
of the islands. Here, we characterize LD at Xq13.3 in the Azorean and mainland
Portugal populations. It was also our purpose to assess the pattern of LD in the different
groups of islands of the archipelago, and compare them with the mainland population
and other well described populations.
VII.3.3. Material and Methods
VII.3.3.1. Population samples
The study of the X-chromosome LD extent was based on a sample composed of 432
healthy Azoreans (408 males and 24 females) and 97 individuals from mainland
Portugal, obtained from the anonymous Azorean DNA bank (Mota-Vieira et al. 2005).
The sample distribution per group and island was the following: Eastern group, 207
(São Miguel, 185; Santa Maria, 22); Central group, 150 (Terceira, 54; Pico, 29; São
Jorge, 23; Faial, 25; Graciosa, 19) and the Western group, 75 (Flores 59; Corvo, 16).
The origin of all females was from Flores Island.
VII.3.3.2. STRs typing
Linkage disequilibrium was evaluated in Xq13.3 This region was analyzed by
genotyping eight microsatellite markers – DXS983, DXS1066, DXS986, DXS8092,
DXS8082, DXS1225, DXS8037 and DXS995 – spanning approximately 6.9
centiMorgans (cM) or 20.9 megabases (Mb). The exact location, in base pairs (bp), on
the Human Genome Map of these microsatellites was reported by Kaessmann et al.
(2002). The markers were genotyped using fluorescently labelled primers described
previously in the Human Genome Database (GDB, www.gdb.org).
Polymerase Chain Reaction (PCR) amplification was carried out in a singleplex 15 µl
reaction mixture. An aliquot of 1 µl of each PCR product was combined with 0.5 µl
CEQ™DNA size standard kit 400, 29 µl formamide deionized (Qbiogene), and run on a
CEQ™8000 Genetic Analysis System (Beckman Coulter).
186
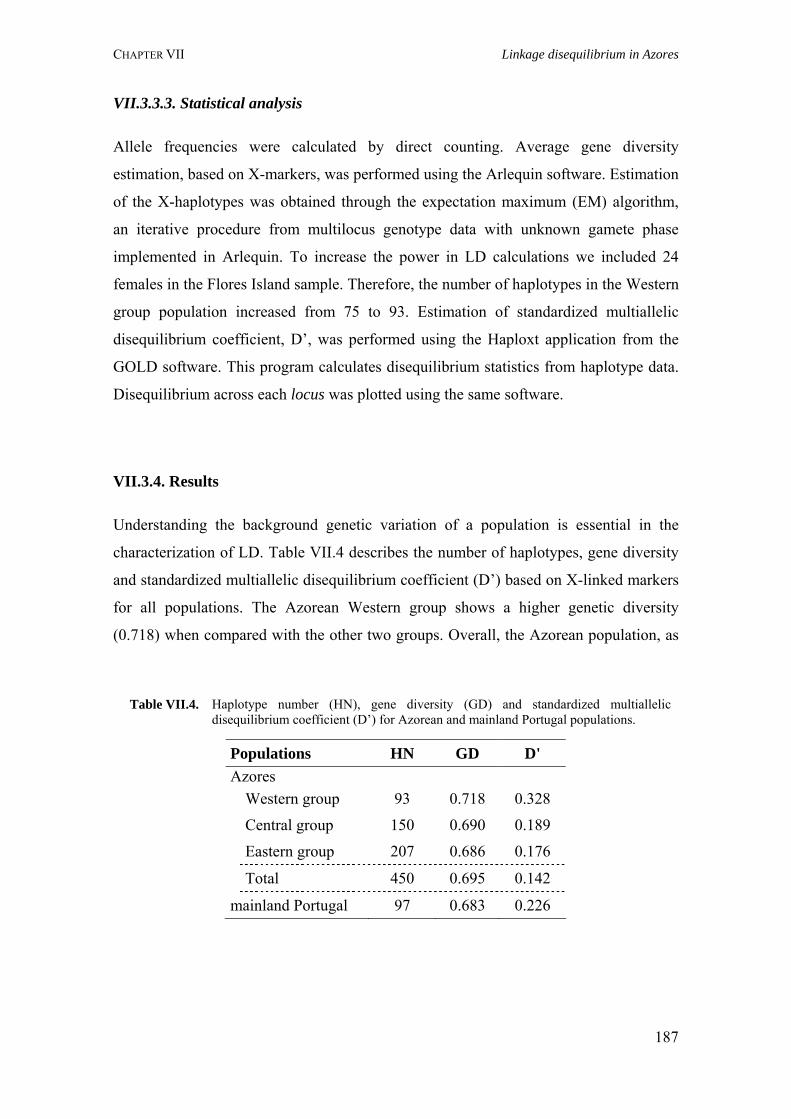
CHAPTER VII Linkage disequilibrium in Azores
VII.3.3.3. Statistical analysis
Allele frequencies were calculated by direct counting. Average gene diversity
estimation, based on X-markers, was performed using the Arlequin software. Estimation
of the X-haplotypes was obtained through the expectation maximum (EM) algorithm,
an iterative procedure from multilocus genotype data with unknown gamete phase
implemented in Arlequin. To increase the power in LD calculations we included 24
females in the Flores Island sample. Therefore, the number of haplotypes in the Western
group population increased from 75 to 93. Estimation of standardized multiallelic
disequilibrium coefficient, D’, was performed using the Haploxt application from the
GOLD software. This program calculates disequilibrium statistics from haplotype data.
Disequilibrium across each locus was plotted using the same software.
VII.3.4. Results
Understanding the background genetic variation of a population is essential in the
characterization of LD. Table VII.4 describes the number of haplotypes, gene diversity
and standardized multiallelic disequilibrium coefficient (D’) based on X-linked markers
for all populations. The Azorean Western group shows a higher genetic diversity
(0.718) when compared with the other two groups. Overall, the Azorean population, as
Table VII.4. Haplotype number (HN), gene diversity (GD) and standardized multiallelic disequilibrium coefficient (D’) for Azorean and mainland Portugal populations.
Populations HN GD D' Azores Western group 93 0.718 0.328
Central group 150 0.690 0.189
Eastern group 207 0.686 0.176
Total 450 0.695 0.142
mainland Portugal 97 0.683 0.226
187
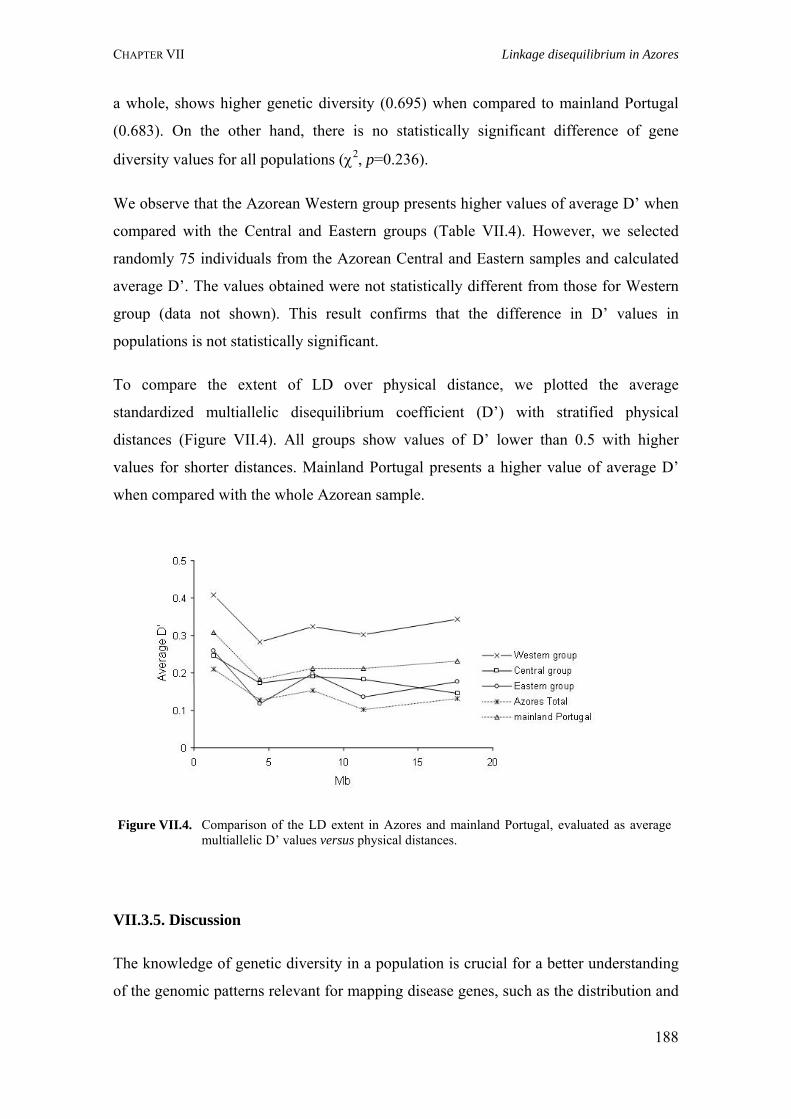
CHAPTER VII Linkage disequilibrium in Azores
188
a whole, shows higher genetic diversity (0.695) when compared to mainland Portugal
(0.683). On the other hand, there is no statistically significant difference of gene
diversity values for all populations (χ2, p=0.236).
We observe that the Azorean Western group presents higher values of average D’ when
compared with the Central and Eastern groups (Table VII.4). However, we selected
randomly 75 individuals from the Azorean Central and Eastern samples and calculated
average D’. The values obtained were not statistically different from those for Western
group (data not shown). This result confirms that the difference in D’ values in
populations is not statistically significant.
To compare the extent of LD over physical distance, we plotted the average
standardized multiallelic disequilibrium coefficient (D’) with stratified physical
distances (Figure VII.4). All groups show values of D’ lower than 0.5 with higher
values for shorter distances. Mainland Portugal presents a higher value of average D’
when compared with the whole Azorean sample.
Figure VII.4. Comparison of the LD extent in Azores and mainland Portugal, evaluated as average multiallelic D’ values versus physical distances.
VII.3.5. Discussion
The knowledge of genetic diversity in a population is crucial for a better understanding
of the genomic patterns relevant for mapping disease genes, such as the distribution and
CHAPTER VII Linkage disequilibrium in Azores
extent of LD. Our results demonstrate that the Azorean population presents a high
genetic diversity comparable to the mainland Portuguese population.
There is some controversy related to the amount of useful LD for mapping studies.
According to Abecasis et al. (2001), the value of D’=0.33, which corresponds to a
10-fold increase in the required sample size, is commonly taken as the minimum usable
amount of LD. On the other hand, Reich et al. (2001) considers that D’>0.5 is useful.
None of the samples analysed in the present study show values higher than 0.5 or 0.33,
suggesting no LD for all populations. In general, the pattern of LD observed is different
when compared to the populations of Niolo, Corte and Bozio in Corsica (Latini et al.
2004), indicating a smaller extent of LD in the Azorean and mainland Portugal
populations. Although, there are limitations concerning the sample size and marker
density of the present study, the results are corroborated by those obtained by Service et
al. (2006), where the Azoreans presented the lowest values of LD when compared with
populations considered genetic isolates.
The existence of high LD over large chromosomal regions is characteristic of
populations with reduced haplotype and allelic diversity (Varilo et al. 2000). Our results
show that both Azores and mainland Portugal present characteristics of expanded
populations. The extent of LD is influenced, among other factors, by genetic drift,
admixture and inbreeding. The LD distribution here described is a consequence of a
high genetic diversity determined by the Azorean settlement history and demography.
Therefore, the data show that admixture is the contributing factor to the present LD
pattern in the Azorean population. The fact that the majority of Azoreans lives in small
rural localities with large families (more than 3 children per generation) and the easy
access to church and city hall records, facilitates the reconstruction of extended family
pedigrees. In addition, according to a comparative study of consanguineous marriages
(first cousins, uncle-niece and aunt-nephew) registered by the National Institute of
Statistics for Azores, Madeira and mainland Portugal from 1931 to 2000, the Azores
present the highest values of consanguinity (Pacheco et al. 2003). These features
associated with the geographical, the demographic and the environmental characteristics
suggest that the Azorean population may be a valuable resource for fine mapping of
disease genes.
189
CHAPTER VII Linkage disequilibrium in São Miguel Island
VII.4. Linkage disequilibrium on Xq13.3, NRY and HLA regions in São
Miguel Island (Azores) population
VII.4.1. Summary
The design of genetic studies of complex diseases is dependent on the extent and
distribution of linkage disequilibrium (LD) across the genome in different populations.
Here, we characterize the extent of LD in the São Miguel Island population. Genetic
diversity and LD were evaluated in Xq13.3, nonrecombining portion of the
Y-chromosome (NRY) and HLA (6q21) regions in healthy blood donors of São Miguel
Island population.
Haplotype analysis revealed 100% discriminatory power for the X- and Y-STRs, and
94.3% for the HLA loci, demonstrating that the São Miguel population is very
genetically diverse. Standardized multiallelic LD, D’, in the three genomic regions
show values lower than 0.33, suggesting no extensive LD in this population. As
expected, the highest D’ values are found for shorter distances. The D’ results also
indicate that there is a higher LD for the NRY region when compared to HLA and
Xq13.3. Taken together, the data demonstrate that the São Miguel Island population
presents a low D’ (0.241). The results suggest that the identification of identical by
descent (IBD) regions surrounding disease susceptibility gene or other complex trait
loci in this population, as well as in the Azoreans, would require a very high density of
markers.
VII.4.2. Introduction
It is well known that LD varies across genomic regions; therefore, for association
studies to be feasible, with an optimal distribution of markers, the level of LD should be
estimated for each region. Here, we examine the extent of LD in three genomic regions
– Xq13.3, nonrecombining portion of the Y-chromosome (NRY) and HLA (6q21) – in
the São Miguel Island population, in order to evaluate the use of LD for future studies
of mapping disease susceptibility genes.
190
CHAPTER VII Linkage disequilibrium in São Miguel Island
VII.4.3. Material and Methods
VII.4.3.1. Population samples and genotyping
Linkage disequilibrium was evaluated in Xq13.3, NRY and HLA (6q21). The sample
set was composed of healthy blood donors living in São Miguel Island obtained from
the anonymous DNA bank located at the Hospital of Divino Espirito Santo of Ponta
Delgada, EPE (Mota Vieira et al. 2005). LD for X- and Y-chromosomes was assessed
only in males (189 and 149, respectively), whereas the analysis of the HLA region
consisted of 106 individuals of both sexes (8 females and 98 males).
The Xq13.3 region was analyzed by genotyping eight microsatellite markers – DXS983,
DXS1066, DXS986, DXS8092, DXS8082, DXS1225, DXS8037 and DXS995 –
spanning approximately 6.9 centiMorgans (cM) or 20.9 megabases (Mb). The exact
location, in base pairs (bp), on the Human Genome Map of these microsatellites was
reported by Kaessmann et al. (2002). The markers were genotyped using fluorescently
labelled primers described previously in the Human Genome Database (GDB,
www.gdb.org). PCR conditions were described in Branco et al. (2007b).
Genotyping of Y STRs and HLA class I (A, B and Cw) and class II (DRB1, DQB1,
DPA1 and DPB1) are described in Pacheco et al. (2005a,b). We also typed two
dinucleotide STRs located in the HLA region, D6S265 and TNFα (Branco et al. 2007a).
VII.4.3.2. Statistical analysis
Allele frequencies were calculated by direct counting. Average gene diversity
estimation was performed using the Arlequin software. Estimation of the HLA
haplotypes was obtained through the expectation maximum (EM) algorithm, an iterative
procedure from multilocus genotype data with unknown gamete phase implemented in
Arlequin. A total of 200 haplotypes were obtained. Estimation of standardized
multiallelic disequilibrium coefficient, D’, was performed using the Haploxt application
from the GOLD software. This program calculates disequilibrium statistics from
haplotype data.
191
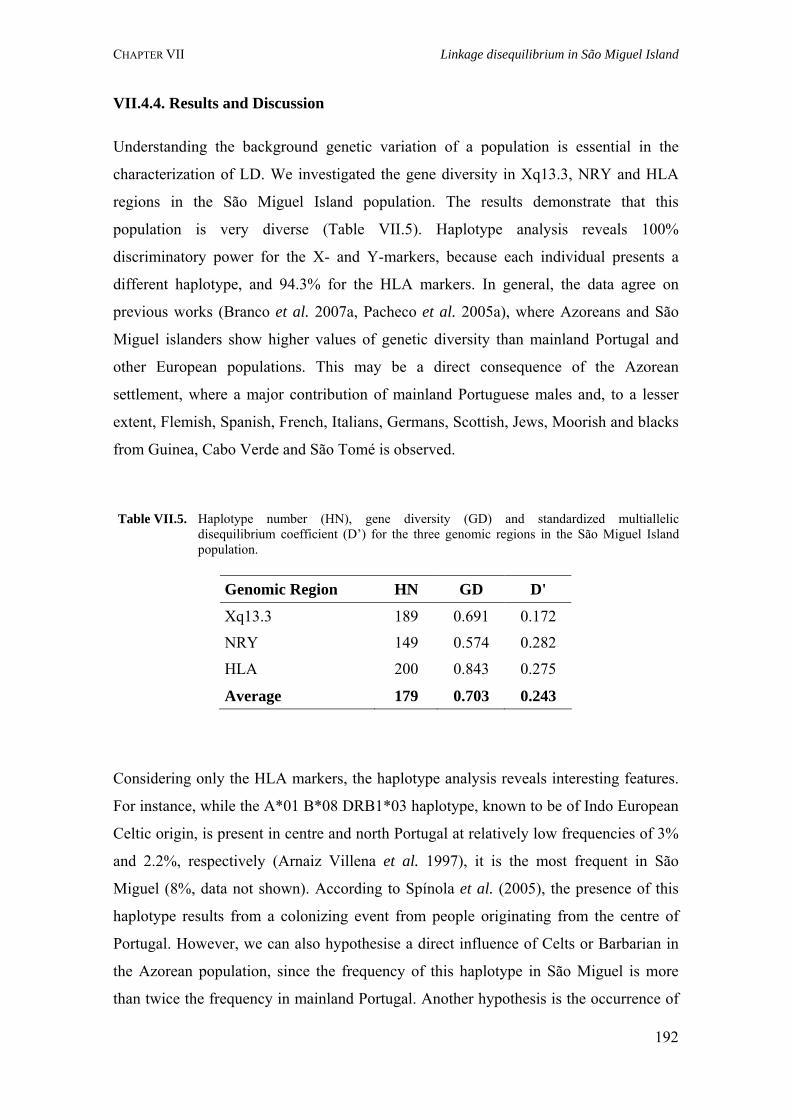
CHAPTER VII Linkage disequilibrium in São Miguel Island
VII.4.4. Results and Discussion
Understanding the background genetic variation of a population is essential in the
characterization of LD. We investigated the gene diversity in Xq13.3, NRY and HLA
regions in the São Miguel Island population. The results demonstrate that this
population is very diverse (Table VII.5). Haplotype analysis reveals 100%
discriminatory power for the X- and Y-markers, because each individual presents a
different haplotype, and 94.3% for the HLA markers. In general, the data agree on
previous works (Branco et al. 2007a, Pacheco et al. 2005a), where Azoreans and São
Miguel islanders show higher values of genetic diversity than mainland Portugal and
other European populations. This may be a direct consequence of the Azorean
settlement, where a major contribution of mainland Portuguese males and, to a lesser
extent, Flemish, Spanish, French, Italians, Germans, Scottish, Jews, Moorish and blacks
from Guinea, Cabo Verde and São Tomé is observed.
Table VII.5. Haplotype number (HN), gene diversity (GD) and standardized multiallelic
disequilibrium coefficient (D’) for the three genomic regions in the São Miguel Island population.
Genomic Region HN GD D'
Xq13.3 189 0.691 0.172
NRY 149 0.574 0.282
HLA 200 0.843 0.275
Average 179 0.703 0.243
Considering only the HLA markers, the haplotype analysis reveals interesting features.
For instance, while the A*01 B*08 DRB1*03 haplotype, known to be of Indo European
Celtic origin, is present in centre and north Portugal at relatively low frequencies of 3%
and 2.2%, respectively (Arnaiz Villena et al. 1997), it is the most frequent in São
Miguel (8%, data not shown). According to Spínola et al. (2005), the presence of this
haplotype results from a colonizing event from people originating from the centre of
Portugal. However, we can also hypothesise a direct influence of Celts or Barbarian in
the Azorean population, since the frequency of this haplotype in São Miguel is more
than twice the frequency in mainland Portugal. Another hypothesis is the occurrence of
192
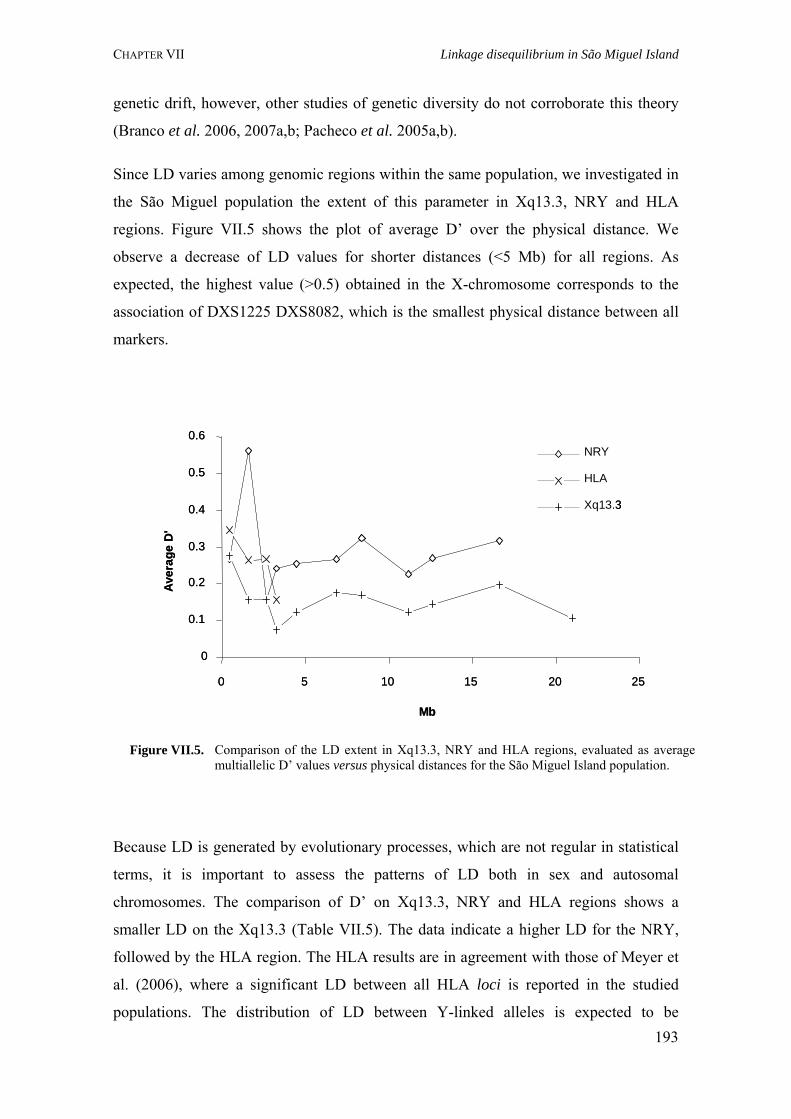
CHAPTER VII Linkage disequilibrium in São Miguel Island
193
genetic drift, however, other studies of genetic diversity do not corroborate this theory
(Branco et al. 2006, 2007a,b; Pacheco et al. 2005a,b).
Since LD varies among genomic regions within the same population, we investigated in
the São Miguel population the extent of this parameter in Xq13.3, NRY and HLA
regions. Figure VII.5 shows the plot of average D’ over the physical distance. We
observe a decrease of LD values for shorter distances (<5 Mb) for all regions. As
expected, the highest value (>0.5) obtained in the X-chromosome corresponds to the
association of DXS1225 DXS8082, which is the smallest physical distance between all
markers.
Figure VII.5. Comparison of the LD extent in Xq13.3, NRY and HLA regions, evaluated as average multiallelic D’ values versus physical distances for the São Miguel Island population.
Because LD is generated by evolutionary processes, which are not regular in statistical
terms, it is important to assess the patterns of LD both in sex and autosomal
chromosomes. The comparison of D’ on Xq13.3, NRY and HLA regions shows a
smaller LD on the Xq13.3 (Table VII.5). The data indicate a higher LD for the NRY,
followed by the HLA region. The HLA results are in agreement with those of Meyer et
al. (2006), where a significant LD between all HLA loci is reported in the studied
populations. The distribution of LD between Y-linked alleles is expected to be
0
0.1
0.2
0.3
0.4
0.5
0.6
0 5 10 15 20 25
Mb
Aver
age
D'
NRY
HLA
Xq13.3
0
0.1
0.2
0.3
0.4
0.5
0.6
0 5 10 15 20 25
Mb
Aver
age
D'
NRY
HLA
Xq13.3
CHAPTER VII Linkage disequilibrium in São Miguel Island
substantially larger than for the X-linked markers, because Y-alleles have only one forth
the effective population size. The data here obtained confirm this expectation.
Nevertheless, the highest peak observed in Figure VII.5 corresponds to the association
between DYS392-DYS385. This was not expected, since this region does not present
recombination; however, it may reflect the influence of stochastic processes, such as
random sampling.
There is some controversy related to the amount of useful LD for mapping studies.
According to Abecasis et al. (2001), the value of D’=0.33, which corresponds to a 10
fold increase in the required sample size, is commonly taken as the minimum usable
amount of LD. On the other hand, Reich et al. (2001) considers that D’>0.5 is useful.
None of the samples analysed in the present study show values higher than 0.5 or 0.33,
indicating no LD for all São Miguel population. These results are corroborated by those
obtained by Service et al. (2006) and Branco et al. (2007b), where the Azoreans
presented the lowest values of LD when compared with isolated and outbred
populations. Taken together, the data suggest that the identification of identical by
descent (IBD) regions surrounding disease susceptibility gene or other complex trait
loci in the São Miguel population, as well as in the Azoreans, would require a very high
density of markers.
194

195
“The important thing is not to stop questioning. Curiosity has its own reason for existing. One cannot help but be in awe when he contemplates the
mysteries of eternity, of life, of the marvelous structure of reality. It is enough if one tries merely to comprehend a little of this mystery every day.”
Albert Einstein
CHAPTER VIII
GENERAL DISCUSSION
CHAPTER VIII General Discussion
VIII. General Discussion36
The study of genetic variation and heritance leads to the comprehension of genetics
in general, with a practical value for human welfare. The knowledge of the
contribution that genes make to the development of diseases – for example, cancer,
heart disease and diabetes –, played an important role in the perception that such
studies can potentially improve human health. Moreover, the characterization of
genetic diversity provides a powerful tool for understanding and describing human
evolution. Here, we show a broader view of the genetic structure of the Azorean
population.
The Azores, the biggest Portuguese archipelago, is located in the north Atlantic
Ocean. It is composed of nine volcanic islands unevenly distributed by three
geographic groups: the Eastern group with two islands – São Miguel and Santa Maria
–, the Central which includes five islands – Terceira, Pico, Faial, São Jorge and
Graciosa –, and the Western group with Flores and Corvo. Although, Azoreans
constitute a young population (<27 generations), there has been reports of increased
frequencies of diseases, among others, congenital heart diseases (Cymbron et al.
2006), schizophrenia and psychosis (Pato et al. 2005; Sklar et al. 2004), autism
(Oliveira et al. 2007), as well as Machado-Joseph disease (Lima et al. 2001). To
understand this genetic panorama in the Azorean population, it revealed necessary
and imperative to study its genetic background. The present thesis aims to contribute
to this objective and two main approaches were followed: the surnames and the
molecular markers analysis. Both approaches have advantages and criticisms.
Surnames constitute a good tool when studying recent movements of individuals
between subpopulations. However, surnames do not take in consideration the
possibility that they may be polyphyletic, this is the same surname presents different
origin and, consequently, different ancestors. Situations such as (i) a surname
acquired because it was beneficial, for instance, in commercial trades; (ii) slaves
from rich and important families usually acquired the surname of his owner and; (iii)
cases of non-paternity, constitute good examples of polyphyletism. The overall
results in this thesis, in addition to the inherent evolution of surnames, corroborate
36 In this section some unpublished data are included, since they contribute to improve the discussion. They also
increase and validate the analysis performed during the present thesis.
196
CHAPTER VIII General Discussion
the polyphyiletic nature of surnames. Considering molecular markers, they also
present discrepancies; for example, molecular markers are subject to evolutionary
forces, which are not accounted in most of the simple methodologies to study
populations, and their diversity is influenced by random fluctutions in sampling.
VIII.1. Genetic origin of the Azorean population
In the present PhD thesis, the understanding of the genetic origins of the Azorean
population was a main concern. To achieve this goal two main studies were
performed, the Y-chromosome lineages (Pacheco et al. 2005) and the Alu insertion
(Branco et al. 2006). The nonrecombining portion of the Y-chromosome retains a
record of the mutational events that occurred along male lineages throughout
evolution (Y-Chromosome Consortium 2002). Overall, the results obtained revealed
nine different haplogroups, most of which are frequent in Europe. Haplogroup J* is
the second most frequent in Azores (13.4%), but it is modestly represented in
mainland Portugal (6.8%). The other non-European haplogroups – N3 and E3a –,
which are prevalent in Asia and subSahara, respectively, have been found in Azores
(0.6% and 1.2%, respectively) but not in mainland Portugal. Two other studies,
Gonçalves et al. (2005) and Montiel et al. (2005), also studied the Y-chromosome
lineages of the Azorean population. In general, all studies evidence the four major
haplogroups: P*(xR1b8,R1a,Q3), J*, BR*(xB2b,CE,F1,H,JK) and E*(xE3) that
account for the majority of the male lineages in the Azores. Nevertheless, slight
differences in frequency of these haplogroups are observed. All studies report that
the main contributors to the genetic origin of the Azores are, as expected, the
mainland Portuguese. Moreover, all studies agree that an important contribution of
Middle eastern (HG J*) and north African (HG E*(xE3)) populations is observed.
Without any doubt, Y-chromosome and mtDNA studies are crucial to address the
origin of the population; however, a population loses mtDNA when a woman has
only sons and Y-chromosome DNA when a man has only daughters. Consequently,
these genetic markers may give less correct information on broad ancestry of most
genes in a population. A full picture of the histories of populations requires studies of
markers in the recombining parts of the nuclear DNA, namely the autosomes.
Albeith several types of markers can be used to achieve this, Alu insertion
197
CHAPTER VIII General Discussion
polymorphisms present some interesting advantages. These markers arose within the
human population as a unique event in human evolutionary history, making Alu
repeats identical by descent from a common ancestor (Batzer and Deininger 2002).
Moreover, the ancestral state, which is absence of the Alu insertion, is always known.
The allele frequencies for each Alu polymorphism in Azoreans are very similar to
those obtained in European populations. Although, Comas et al. (2000) revealed a
clear differentiation between north African and Iberian populations, our results show
a strong proximity between mainland Portuguese and Moroccans. Historical data
may support this proximity. Historians mention that the conquest of Ceuta in 1415 by
the Portuguese was the first step in the “Portuguese expansion”. Ceuta was
considered a strategic market and a start point for the exploration of the African
littoral (Serrão 1978). On the other hand, we also see a close relation with Spanish
populations, namely, Catalans and Andalusians. This is reflected in the phylogenetic
tree where Azores and mainland Portugal branch with Catalans, Andalusians,
Moroccans and Algerians (Figure VI.4). Overall, the data are in concordance with
the ones obtained by Y-chromosome studies (Pacheco et al. 2005; Montiel et al.
2005; Gonçalves et al. 2005) and the historical facts, reinforcing the contribution of
Spanish individuals in the Azorean peopling. Furthermore, the Alu analysis also
suggests the existence of a different demographic history and patterns of population
evolution between European and African populations; for example, the African
groups, with the exception of Algerians and Moroccans, are closer to the ancestral
population in contrast to European populations (Figure VI.4). mtDNA studies in the
Azorean population also corroborate the major presence of mainland female
Portuguese settlers (Santos et al. 2003). However, these authors also report around
35% of unique female lineages. In general, the Alu markers and Y-chromnosome
studies do not corroborate this observation.
Spinola et al. (2005) questions the identification of the lineage N3, specific to Asians
and northern Europeans (Rosser et al. 2000; Helgason et al. 2000), since they did not
found any results supporting this observation based on HLA loci. Historical records
of the presence of Asians or Mongolians in the archipelago are not known. On the
other hand, the HLA data showed the presence of haplotype A*02-B*44-DRB1*04
at a frequency of 1.42%. This haplotype, possibly oriental in its origin, has
previously been described in the Azores (Bruges-Armas et al. 1999). The
198
CHAPTER VIII General Discussion
introduction of this genetic contribution occurred probably during the expansion of
the trade navigation between Europe, America and Asia, in the 16th and 17th
centuries, when the Azores had a strategic role due to its geographic position
(Russel-Wood 1998).
Genetic distance methods describe allele frequency similarities between populations
or groups, indicating the degree of proximity between them. The works based on 21
STRs in São Miguel’s population (Branco et al. 2007, in press) and on 15 STRs in all
Azorean islands (Branco et al. 2007, submitted) indicate a very close proximity with
mainland Portugal and other European and African populations. These results are
also corroborated by studies performed on HLA loci (Spinola et al. 2005; Pacheco et
al. personal communication). In conclusion, all studies point to the main importance
of mainland Portuguese in the genetic origin of the Azorean population. Moreover,
the presence of African and other European populations is not negligible. All data
confirm and complement the gaps in the settlement history of the Azores
archipelago.
VIII.2. Genetic diversity, relationship and linkage disequilibrium in the
Azorean islanders
The evolution of populations is dependent on several mechanisms such as, migration,
genetic drift, selection and mutation, all affecting the patterns of diversity of neutral
and disease variants. Consequently, the measure of diversity of neutral markers
allows the inference of how these processes are shaping the overall signature of a
population and has further implications in the general diseases apportionment. In the
present thesis, the diversity of the Azorean population was addressed considering
different STR markers, located in different chromosomes (autosomal, Y and X), Alu
insertion polymorphisms and surnames. The average diversity obtained in the
different studies show that, in general, the Azorean population is very diverse,
presenting values higher than those found in mainland Portugal. Only the Alu
insertion polymorphisms are the exception, with mainland presenting a higher
diversity. Nonetheless, all differences between values are not statistically significant.
Considering the results obtained for the Y- and X-chromosomes and Alu insertions in
199
CHAPTER VIII General Discussion
the Azorean population, we observe that the diversity value is higher in the
X-chromosome (0.695), followed by the Y- (0.590), and last the Alu insertions
(0.383). These results are explained by the fact that both the X- and Y-chromosomes
have lower effective sizes (3/4 and 1/4, respectively), when compared with
autosomal chromosomes, and also present lower rates of recombination (Schaffner
2004). The Alu insertions are biallelic markers and, consequently, show a smaller
level of diversity regarding microsatellite data (Venter et al. 2001). Variability based
on the STR markers in the autosomal chromosomes indicate as well, that the Azores
is a very diverse population. Similar values of diversity are obtained when comparing
the Azores (0.788) with mainland Portugal (0.782; Bosch et al. 2000; Perez-Lezaun
et al. 2000), Madeira (0.773; Fernandes et al. 2001) and Cape Verde (0.791;
Fernandes et al. 2003). The results from the genetic characterization of São Miguel
Island’s population reveal a smaller value of diversity (0.767) considering 21 STRs
(Branco et al. 2007, in press) compared to the higher value (0.792) analysing 15
STRs (Branco et al. 2007, submitted). The same trend occurs in the mainland
Portugal population where a value of (0.765) is observed. Therefore, the accurate
value of global variability is dependent on the number of markers used.
Interestingly, the study of abundance of surnames and microsatellite in Azores
revealed that the most diverse islands are Terceira and São Miguel. However, a slight
discrepancy is present. In the surname study, the islands with less diversity are
Graciosa and Santa Maria, in contrast to the STR data (Branco et al. 2007,
submitted) where Corvo is the less diverse island followed by Graciosa.
Nevertheless, both studies agree that the smallest islands – Corvo, Graciosa and
Santa Maria –, present, as expected, the lowest values of variability. Curiously, in
both STRs and surnames analysis, Faial and São Jorge show no difference of
diversity and abundance of surnames, this is, both islands are very similar
genetically. These results validate the use of surnames as a tool to understand genetic
diversity patterns of a population.
Studies of HLA markers in mainland Portugal (Spinola et al. 2005a), based on 3 loci
(A, B and DRB1), and in Azores (Spinola et al. 2005b), based in 6 loci (A, B, Cw,
DRB1, DQA1 and DQB1), demonstrate values of average diversity of 0.92. The
results obtained in the present thesis, based in 7 loci (A, B, Cw, DRB1, DQA1,
200
CHAPTER VIII General Discussion
DQB1 and DPA1) presented a smaller value (0.83). Nevertheless, this may be
explained by the difference in number of analysed loci and by the fact that Spinola et
al. (2005) used a high-resolution methodology37 to genotype HLA.
The analysis of relationship between islands was assessed using surnames (Branco
and Mota-Vieira 2005) and 15 STR markers (Branco et al. 2007, submitted). Two
different images appear: surnames show a closer proximity between the Central and
Western groups, and the molecular markers give the Central closer to the Eastern
group. One hypothesis to explain this discrepancy is that surnames are, probably,
revealing more recent movement of individuals. Actually, it is common knowledge
that people in the Western group travel more easily to the Central islands than to the
Eastern group. On the other hand, the microsatellite data is probably demonstrating a
deeper relationship that dates from the time of the settlement. This is corroborated by
the software Migrate, which has a methodology based on the coalescent theory.
Corvo and Flores were the last islands to be settled. Another observation supporting
this information is the fact that in the surname analysis, Faial and Pico, the closest
islands, cluster together. Nowadays, there are daily boat connections between these
islands. However, this clustering does not happen in the microsatellite data, where
São Jorge and Faial are genetically more similar. Historical records mention the
presence of Flemish individuals more intensively in these islands. Therefore, we
conclude that surnames are evidencing a more recent image showing the
socio-economic features of the islands, while the microsatellite data is revealing the
evolution based on the settlement characteristics of the archipelago. Both approaches
complement each other.
The patterns of genetic diversity of a population have a direct influence in the
linkage disequilibrium extent. With the development of technology, analysis of LD
has been found to improve the knowledge of human evolution and origin. Moreover,
it has also been used to identify genes causing disease. The overall results
demonstrate that both the Azoreans and mainland Portugal do not show extensive
LD. This may be a direct consequence of the large genetic diversity of these
populations. Several studies have demonstrated the use of isolated populations in the
characterization of complex diseases (Angius et al. 2001; Varillo et al. 2000). The
37 This methodology, which enables an HLA genotyping with a resolution of ≤6 digits (ex. HLA-B510101) is
mostly used in transplant medicine.
201
CHAPTER VIII General Discussion
geography of the archipelago jointly with the cultural background of the Azoreans
and the surname analysis seemed to indicate, à priori, that the Azoreans were an
isolated population. The misleading conclusion from surnames can be explained by
the fact that surnames represent only one locus. It is common knowledge that for a
full characterization of a population it is necessary several loci. Moreover, the
surnames comparisons were based on countries, some of which with millions of
telephone users (Barrai et al. 2000, 1999; Mourrieras et al. 1995). The overall values
obtained from surname data were smaller in the Azores and this induced the
conclusion of low diversity and isolation of this population (Branco and Mota-Vieira
2005). Nevertheless, the analysis of surnames in mainland Portugal would be
considerably informative in terms of comparison. Despite, the Azores are not an
isolated population and show LD only for short physical distances, there are some
characteristic that make it a possible resource for future genetic studies, namely, the
same environmental conditions and the possibility to construct large pedigrees
through church and other civil records. The same environment allows a better control
on external factors that may be influencing the development of a complex disease.
The large pedigrees permit to develop reliable linkage studies with statistical
significance. In summary, the overall data suggest that the identification of identical
by descent (IBD) regions surrounding disease susceptibility genes or other complex
trait loci in the São Miguel, as well as in the Azoreans, will require a very high
density of markers. On the other hand, in a near future, the HapMap project will
produce data that will considerably increase the power of IBD mapping.
VIII.3. Inbreeding and population structure
The assessment of inbreeding in human populations plays a fundamental role in the
identification of population subdivision, which has significant consequences in the
design of association mapping and pharmacogenomic studies. Moreover, it is well
known that genetic variation is higher within individuals in a population (Tishkoff
and Varrelli 2003); therefore, the spectrum of genetic diseases may be influenced by
the level of molecular similarity of individuals.
202
CHAPTER VIII General Discussion
The inbreeding coefficient calculated using surnames for the São Miguel Island
(0.0016) is almost seven times smaller than those obtained through 21 STR markers
(Branco et al. 2007, in press). The STR values of inbreeding could be inflated by the
fact that its calculation is based on allele identity, this is, microsatellites that are
identical by state may not be from the same ancestor (Rousset 2002). In surname
analysis each surname is considered separately and, therefore, this problem is not
apparent. Nevertheless, both analysis show that the São Miguel population is
outbred. Another study using surnames by Santos et al. (2005) shows a value of FST
of 0.00709 for the Flores Island. This value is higher than that obtained in this thesis
(0.0038). However, in both studies, the total surnames found are similar, 291 for
electoral records (Santos et al. 2005) and 223 for telephone users (Branco et al.
2005). Probably these differences are explained by the different methods to calculate
the same parameter. Both samples do not show microdifferentiation.
The values of inbreeding (FIS) obtained in the Alu study report a much higher value
for the whole Azorean population (0.117). Alu polymorphisms have only two alleles
(presence or absence of the insertion); consequently, this reduces the power to detect
efficiently the inbreeding. The estimated value for the Azorean sample, based in the
analysis of 15 STR markers (Branco et al. 2007, submitted), show a similar value
(0.0196) to that found in the São Miguel population using 21 STRs (Branco et al.
2007, in press), and an higher value when compared with surname analysis (0.0039).
Regarding the results of the 15 STRs and surnames for each island, there are some
inconsistencies in both approaches (Table VIII.1). The STR markers show that
Graciosa is the less inbred followed by Pico. Conversely, Corvo is the more inbred
population followed by Flores. The surname analysis shows Graciosa and Santa
Maria as being the most inbred islands and São Miguel and Terceira the less inbred.
These differences are explained by the nature of the two systems. Once more,
surnames simulte one locus with several alleles. As mentioned above, the inbreeding
estimated through STRs is based on allele identity, and identity by state does not
necessarily imply the same ancestor. Therefore, both estimates have problems and no
accurate value is retrieved; nonetheless, all analyses demonstrate that the Azorean
population is an open population. Additionally, and according to Wright (1984),
values smaller than 0.05, such those obtained for both the Azorean and mainland
Portugal populations, represent little genetic differentiation. On the other hand, to
203
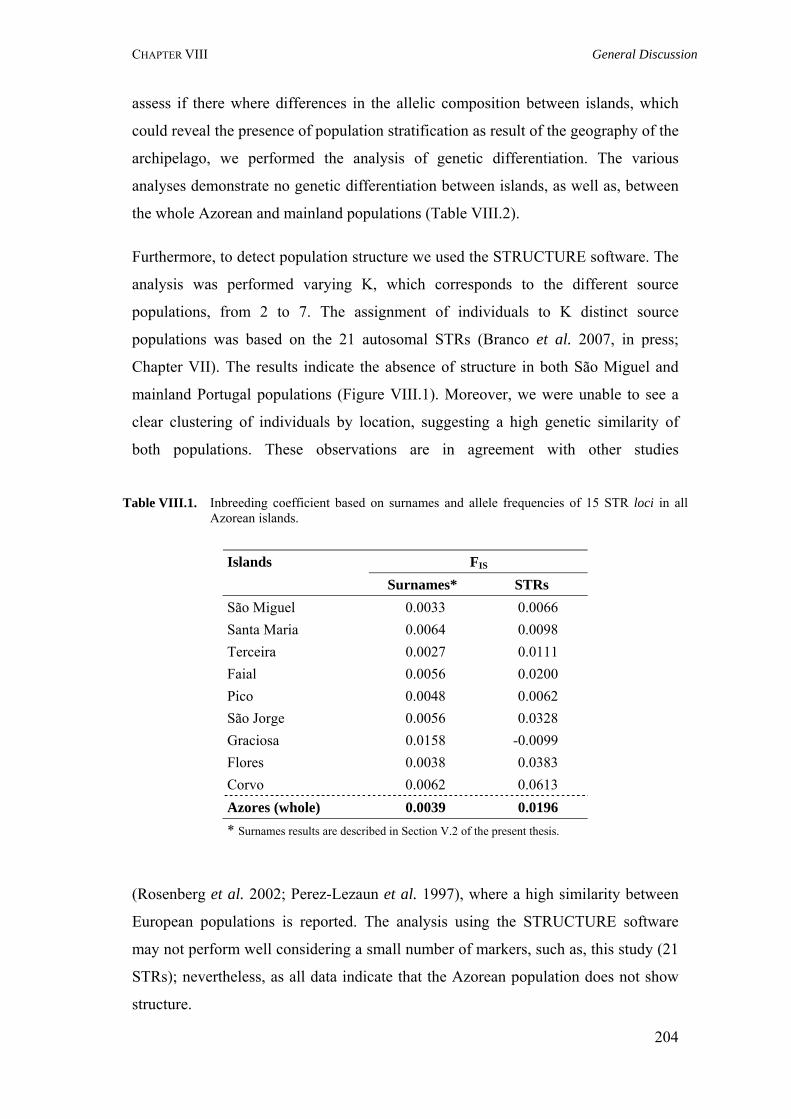
CHAPTER VIII General Discussion
assess if there where differences in the allelic composition between islands, which
could reveal the presence of population stratification as result of the geography of the
archipelago, we performed the analysis of genetic differentiation. The various
analyses demonstrate no genetic differentiation between islands, as well as, between
the whole Azorean and mainland populations (Table VIII.2).
Furthermore, to detect population structure we used the STRUCTURE software. The
analysis was performed varying K, which corresponds to the different source
populations, from 2 to 7. The assignment of individuals to K distinct source
populations was based on the 21 autosomal STRs (Branco et al. 2007, in press;
Chapter VII). The results indicate the absence of structure in both São Miguel and
mainland Portugal populations (Figure VIII.1). Moreover, we were unable to see a
clear clustering of individuals by location, suggesting a high genetic similarity of
both populations. These observations are in agreement with other studies
Table VIII.1. Inbreeding coefficient based on surnames and allele frequencies of 15 STR loci in all
Azorean islands.
FISIslands Surnames* STRs
São Miguel 0.0033 0.0066 Santa Maria 0.0064 0.0098 Terceira 0.0027 0.0111 Faial 0.0056 0.0200 Pico 0.0048 0.0062 São Jorge 0.0056 0.0328 Graciosa 0.0158 -0.0099 Flores 0.0038 0.0383 Corvo 0.0062 0.0613 Azores (whole) 0.0039 0.0196 * Surnames results are described in Section V.2 of the present thesis.
(Rosenberg et al. 2002; Perez-Lezaun et al. 1997), where a high similarity between
European populations is reported. The analysis using the STRUCTURE software
may not perform well considering a small number of markers, such as, this study (21
STRs); nevertheless, as all data indicate that the Azorean population does not show
structure.
204
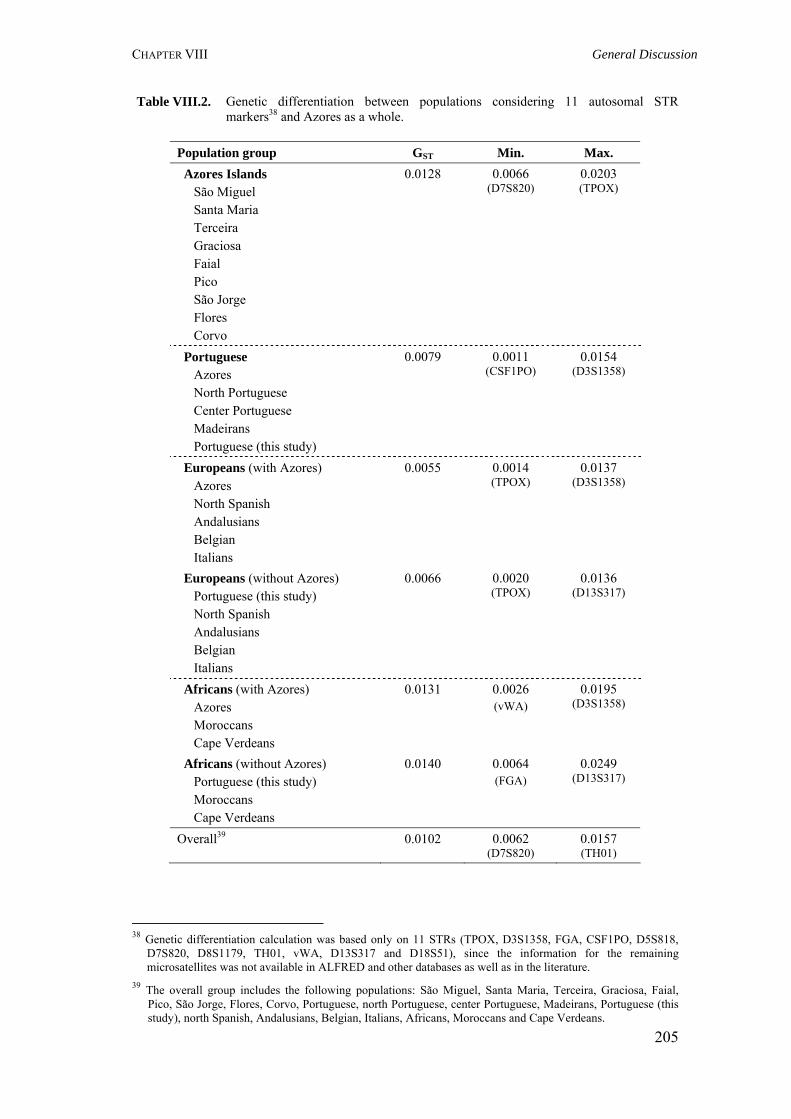
CHAPTER VIII General Discussion
Table VIII.2. Genetic differentiation between populations considering 11 autosomal STR markers38 and Azores as a whole.
Population group GST Min. Max. Azores Islands São Miguel Santa Maria Terceira Graciosa Faial Pico São Jorge Flores Corvo
0.0128 0.0066 (D7S820)
0.0203 (TPOX)
Portuguese Azores North Portuguese Center Portuguese Madeirans Portuguese (this study)
0.0079 0.0011 (CSF1PO)
0.0154 (D3S1358)
Europeans (with Azores) Azores North Spanish Andalusians Belgian Italians
0.0055 0.0014 (TPOX)
0.0137 (D3S1358)
Europeans (without Azores) Portuguese (this study) North Spanish Andalusians Belgian Italians
0.0066 0.0020 (TPOX)
0.0136 (D13S317)
Africans (with Azores) Azores Moroccans Cape Verdeans
0.0131 0.0026 (vWA)
0.0195 (D3S1358)
Africans (without Azores) Portuguese (this study) Moroccans Cape Verdeans
0.0140 0.0064 (FGA)
0.0249 (D13S317)
Overall39 0.0102 0.0062 (D7S820)
0.0157 (TH01)
38 Genetic differentiation calculation was based only on 11 STRs (TPOX, D3S1358, FGA, CSF1PO, D5S818,
D7S820, D8S1179, TH01, vWA, D13S317 and D18S51), since the information for the remaining microsatellites was not available in ALFRED and other databases as well as in the literature.
39 The overall group includes the following populations: São Miguel, Santa Maria, Terceira, Graciosa, Faial, Pico, São Jorge, Flores, Corvo, Portuguese, north Portuguese, center Portuguese, Madeirans, Portuguese (this study), north Spanish, Andalusians, Belgian, Italians, Africans, Moroccans and Cape Verdeans.
205
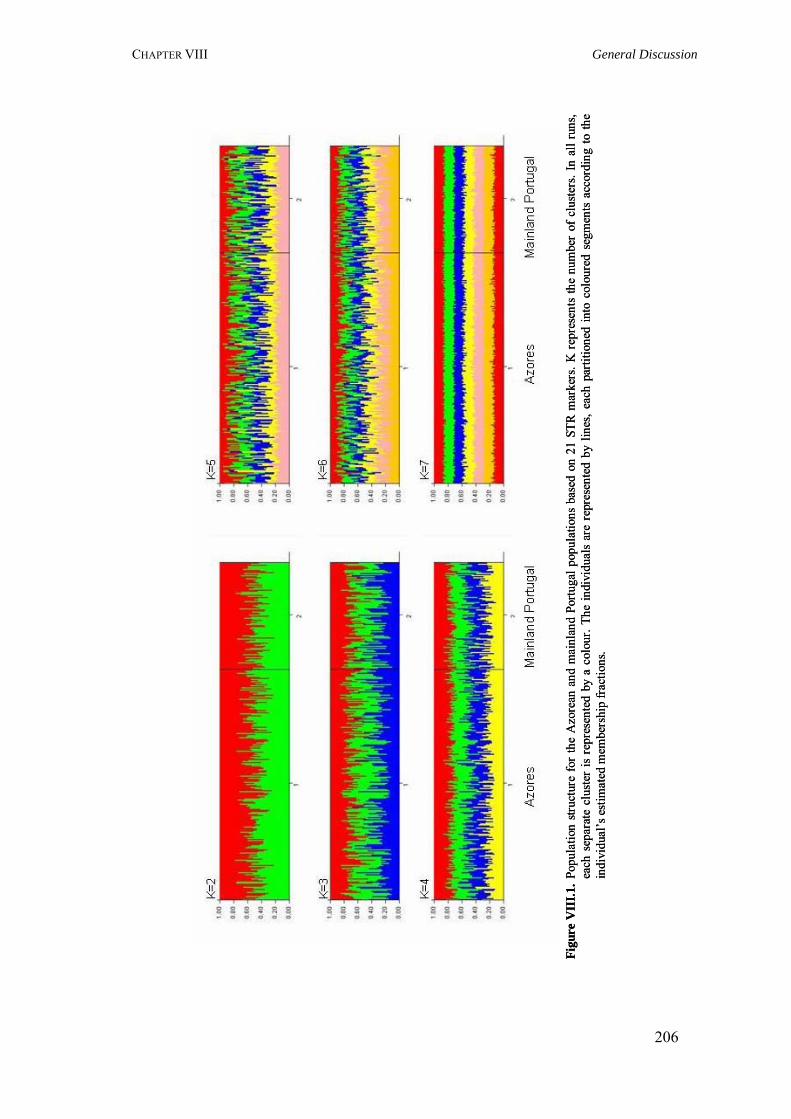
CHAPTER VIII General Discussion
206
Figu
re V
III.1
.Pop
ulat
ion
struc
ture
for
the
Azo
rean
and
mai
nlan
d Po
rtuga
l pop
ulat
ions
bas
ed o
n 21
STR
mar
kers
. K r
epre
sent
s th
e nu
mbe
r of
clu
sters
. In
all r
uns,
each
sep
arat
e cl
uste
r is
rep
rese
nted
by
a co
lour
. The
indi
vidu
als
are
repr
esen
ted
by l
ines
, eac
h pa
rtitio
ned
into
col
oure
d se
gmen
ts ac
cord
ing
to th
e in
divi
dual
’s e
stim
ated
mem
bers
hip
frac
tions
.
CHAPTER VIII General Discussion
VIII.4. Gene flow patterns
Migration or gene flow constitutes one important phenomenon that influences the
diversity patterns and, consequently, the evolution of populations. The understanding
of how individuals disperse within small groups of the same population has
significant impact in the establishment of a reference population and, therefore, in
medical healthcare, as well as, in the design of genetic studies. Migration rates were
estimated initially by surnames and then by microsatellite data. These estimates in
both studies evidence the movement of people towards the biggest islands, namely
São Miguel and Terceira. However, while surnames point Corvo as the island with
the largest migration rate, the microsatellite data show that people in that island have
become sedentary. As stressed before, surnames correspond to one locus. On the
other hand, migration is largely dependent on the abundance of surnames. This
parameter is also directly obtained from the isonymy values; therefore, populations
with smaller number of diversity of surnames would present higher migration rates.
Nevertheless, in general, there is relative gene flow among islanders and this has
contributed to the overall genetic background of the Azorean population.
Another study to characterize the patterns of gene flow was the spatial analysis based
on surnames. Five different patterns were obtained, of which the most relevant is
isolation by distance and depression (41.6%). However, 43.4% of surnames had no
defined pattern. This analysis reports a majority of positive values of Moran’s I for
distances lower than 49 km and between 269 and 309 km, indicating high similarity
between closer municipalities and between distant municipalities whose populations
show historic and socio-cultural affinities, which agrees with the historical
demography of the Azorean population (Cabral et al. 2005).
To test for the effects of gene flow and genetic drift on population relationships, we
performed a centroid analysis, as described by Harpending and Ward (1982), based
on Alu insertion polymorphisms. Briefly, this model assumes a simple linear
relationship between the heterozygosity of a population and the genetic distance of
the population from the centroid (ri). The centroid is defined as the mean allelic
frequency of the populations. Surprisingly, Moroccans, Catalans, Andalusians,
French, Azoreans and mainland Portuguese are located above the theoretical
prediction, indicating that these populations have experienced more gene flow than
207
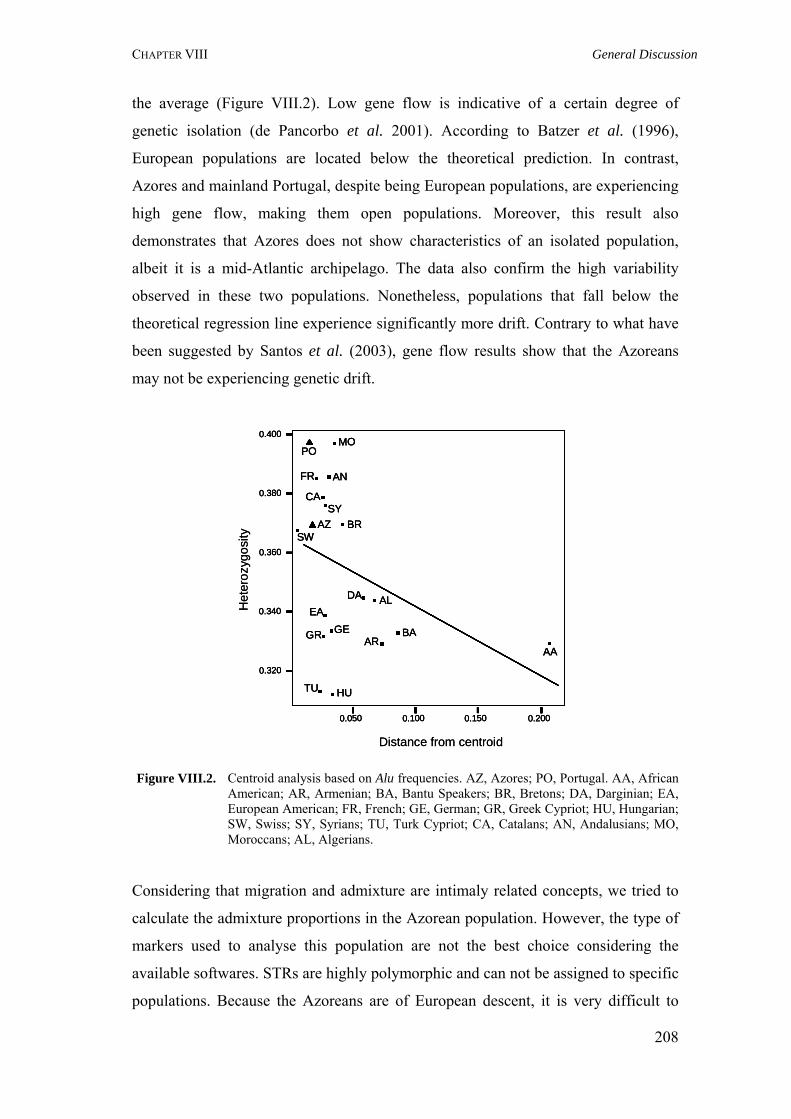
CHAPTER VIII General Discussion
208
the average (Figure VIII.2). Low gene flow is indicative of a certain degree of
genetic isolation (de Pancorbo et al. 2001). According to Batzer et al. (1996),
European populations are located below the theoretical prediction. In contrast,
Azores and mainland Portugal, despite being European populations, are experiencing
high gene flow, making them open populations. Moreover, this result also
demonstrates that Azores does not show characteristics of an isolated population,
albeit it is a mid-Atlantic archipelago. The data also confirm the high variability
observed in these two populations. Nonetheless, populations that fall below the
theoretical regression line experience significantly more drift. Contrary to what have
been suggested by Santos et al. (2003), gene flow results show that the Azoreans
may not be experiencing genetic drift.
Figure VIII.2. Centroid analysis based on Alu frequencies. AZ, Azores; PO, Portugal. AA, African American; AR, Armenian; BA, Bantu Speakers; BR, Bretons; DA, Darginian; EA, European American; FR, French; GE, German; GR, Greek Cypriot; HU, Hungarian; SW, Swiss; SY, Syrians; TU, Turk Cypriot; CA, Catalans; AN, Andalusians; MO, Moroccans; AL, Algerians.
Considering that migration and admixture are intimaly related concepts, we tried to
calculate the admixture proportions in the Azorean population. However, the type of
markers used to analyse this population are not the best choice considering the
available softwares. STRs are highly polymorphic and can not be assigned to specific
populations. Because the Azoreans are of European descent, it is very difficult to
Distance from centroid
Het
eroz
ygos
ity
0.050 0.100 0.150 0.200
0.320
0.340
0.360
0.380
0.400
AZ
PO
AAAR
BR
DAEA
FR
GEGR
HU
SW
SY
TU
CA
AN
MO
BA
AL
Distance from centroid
Het
eroz
ygos
ity
0.050 0.100 0.150 0.200
0.320
0.340
0.360
0.380
0.400
AZ
PO
AAAR
BR
DAEA
FR
GEGR
HU
SW
SY
TU
CA
AN
MO
BA
AL
0.050 0.100 0.150 0.200
0.320
0.340
0.360
0.380
0.400
AZ
PO
AAAR
BR
DAEA
FR
GEGR
HU
SW
SY
TU
CA
AN
MO
BA
AL
CHAPTER VIII General Discussion
define the admixed proportions. Probably, the data produced by the HapMap project
will help to make this characterization, once a map of SNPs characteristic to each
population will be produced.
VIII.5. Concluding remarks and future perspectives
The main objective of the present thesis was to characterize the genetic background
of the Azorean population, through the study of molecular and non-molecular
markers. Both markers have advantages and criticisms, but their analysis are
complementary. In general, the results obtained along this thesis improved the
knowledge of the genetic signature of the Azorean population: the Azoreans are a
young outbred population with high genetic diversity, relative gene flow among its
individuals, and without extensive LD. Moreover, the overall patterns of diversity are
a direct consequence of the archipelago settlement history. In conclusion, the results
here reported complement the past, by connecting genetics and history; improve the
knowledge of the present, since the genetic background is responsible for the current
disease carriage; and will contribute to predict the future in terms of disease
distribution and frequency.
The advance in knowledge and technology lead to pose new scientific thoughts and
questions and, therefore, the present thesis cannot be considered as the final line in
the understanding of the genetic features of the Azorean population. It constitutes a
starting point. Knowing that different peoples contributed to the genetic background
of this population, questions such as, what are the admixture proportions of each
contributor? in which way these proportions are contributing to the neutral genetic
variation, as well as, to the disease carriage? what implications these admixture
proportions play in farmacogenetic drug-response?, can be addressed. In addition, in
a near future, the HapMap project intends to produce a haplotype map showing
which haplotypes are characteristic of each population. This will allow the
development of admixture mapping marker panels that, applied to the Azorean
population, could help to clarify the above questions. Recently, Tang et al. (2007),
by examining the genome-wide distribution of ancestry in Puerto Ricans, report a
strong statistical evidence of recent selection in three chromosomal regions (6p, 8q
209
CHAPTER VIII General Discussion
and 11q). These authors suggest that admixed populations may constitute powerfull
tools in the study of natural selection. This evolutionary force can be responsible by
geographical differences in diversity and disease carriage. Moreover, according to
Guthery et al. (2007), even if the bulk of alleles underlying complex health-related
traits are common SNPs, geographic ancestry might be an important predictor of
whether a person carries a risk allele. Therefore, a correct assignment of admixture in
the Azoreans may help in the understanding of the patterns of selection and in
mapping disease causing genes in this population.
Genetic association studies offer a powerful approach to identify the multiple
variants of small effect that modulate susceptibility to complex diseases. However,
the lack of data replication indicates that there are many factors influencing gene
mapping, namely, natural selection, population admixture, recombination and
consanguinity. Pacheco et al. (2003) based on marriage records for the period 1931
to 2000 (National Institute of Statistics) demonstrated that Azores presents higher
consanguinity than mainland Portugal and Madeira Islands. Because consanguinity
increases homozygosity, the assessment of the extent of homozygosity tracts in
proximate regions of highly informative markers, such as STRs, could contribute to
understand the role of consanguinity in this population. For example, it may be
involved in the increase of complex disease frequencies, such as congenital heart
diseases (Cabral et al. 2007) and autism (Oliveira et al. 2007). Therefore, a full
characterization of the forces acting in the genetic background of Azoreans will
probably play a relevant role in the understanding of the genomic basis of diseases in
this population.
210

211
REFERENCES
REFERENCES Ab-Ba
A Abbeduto L, Brady N, Kover ST. Language development and fragile X syndrome: Profiles, syndrome-specificity, and within-syndrome differences. Ment Retard Dev Disabil Res Rev. 2007; 13: 36-46.
Abbott WG, Winship IM, Gane EJ, Finau SA, Munn SR, Tukuitonga CE. Genetic diversity and linkage disequilibrium in the Polynesian population of Niue Island. Hum Biol. 2006; 78: 131-145.
Abecasis GR, Cookson WO. GOLD graphical overview of linkage disequilibrium. Bioinformatics. 2000; 16: 182-183.
Abecasis GR, Noguchi E, Heinzmann A, Traherne JA, Bhattacharyya S, Leaves NI, Anderson GG, Zhang Y, Lench NJ, Carey A, Cardon LR, Moffatt MF, Cookson WO. Extent and distribution of linkage disequilibrium in three genomic regions. Am J Hum Genet. 2001; 68: 191-197.
Abecasis GR, Ghosh D, Nichols TE. Linkage disequilibrium: Ancient history drives the new genetics. Hum Hered. 2005; 59: 118-124.
Abel K, Reneland R, Kammerer S, Mah S, Hoyal C, Cantor CR, Nelson MR, Braun A. Genome-wide SNP association: Identification of susceptibility alleles for osteoarthritis. Autoimmun Rev. 2006; 5: 258-263.
Aitman TJ, Dong R, Vyse TJ, Norsworthy PJ, Johnson MD, Smith J, Mangion J, Roberton-Lowe C, Marshall AJ, Petretto E, Hodges MD, Bhangal G, Patel SG, Sheehan-Rooney K, Duda M, Cook PR, Evans DJ, Domin J, Flint J, Boyle JJ, Pusey CD, Cook HT. Copy number polymorphism in Fcgr3 predisposes to glomerulonephritis in rats and humans. Nature. 2006; 439: 851-855.
Alegre R, Moscoso J, Martinez-Laso J, Martin-Villa M, Suarez J, Moreno A, Serrano-Vela JI, Vargas-Alarcon G, Pacheco R, Arnaiz-Villena A. HLA genes in Cubans and the detection of Amerindian alleles. Mol Immunol. 2007; 44: 2426-2435.
Ammeziane N, Bogard M, Lamoril J. Principes de biologie moléculaire en biologie clinique. Elsevier: Paris. 2006. 705 pp.
Ammerman AA, Cavalli-Sforza LL. The neolithic transition and the population genetics of Europe. Princeton University Press: Princeton. 1984. 200 pp.
Amarger VI, Gauguier D, Yerle M, Apiou F, Pinton P, Giraudeau F, Monfouilloux S, Lathrop M, Dutrillaux B, Buard J, Vergnaud G. Analysis of distribution in the human, pig, and rat genomes points toward a general subtelomeric origin of minisatellite structures. Genomics. 1998; 52: 62-71.
Angius A, Bebbere D, Petretto E, Falchi M, Forabosco P, Maestrale B, Casu G, Persico I, Melis PM, Pirastu M. Not all isolates are equal: Linkage disequilibrium analysis on Xq13.3 reveals different patterns in Sardinian subpopulations. Hum Genet. 2002; 111: 9-15.
Angius A, Melis PM, Morelli L, Petretto E, Casu G, Maestrale GB, Fraumene C, Bebbere D, Forabosco P, Pirastu M. Archival, demographic and genetic studies define a Sardinian subisolate as a suitable model for mapping complex traits. Hum Genet. 2001; 109: 198-209.
Arcos-Burgos M, Muenke M. Genetics of population isolates. Clin Genet. 2002; 61: 233-247.
Armour JA, Alegre SA, Miles S, Williams LJ, Badge RM. Microsatellites: Evolution and applications Ed. David Goldstein and Christina Schlotterer. Oxford university press. New York. 1999. 352 pp.
Arnaiz-Villena A, Martinez-Laso J, Gomez-Casado E, Diaz-Campos N, Santos P, Martinho A, Breda-Coimbra H. Relatedness among Basques, Portuguese, Spaniards, and Algerians studied by HLA allelic frequencies and haplotypes. Immunogenetics 1997; 47: 37-43.
Arruda MV. Colecção de documentos relativos ao descobrimento e povoamento dos Açores, Ponta Delgada. In Dicionário de História de Portugal Ed. Joel Serrão. 1932. 251 pp.
Aslanidis C, Jansen G, Amemiya C, Shutler G, Mahadevan M, Tsilfidis C, Chen C, Alleman J, Wormskamp NG, Vooijs M. Cloning of the essential myotonic dystrophy region and mapping of the putative defect. Nature. 1992; 355: 548-551.
Austin J. Schizophrenia: An update and review. J Genet Couns. 2005; 14: 329-340.
Ayub Q, Mansoor A, Ismail M, Khaliq S, Mohyuddin A, Hameed A, Mazhar K, Rehman S, Siddiqi S, Papaioannou M, Piazza A, Cavalli-Sforza LL, Mehdi SQ. Reconstruction of human evolutionary tree using polymorphic autosomal microsatellites. Am J Phys Anthropol. 2003; 122: 259-268.
B Bamshad M, Wooding S, Salisbury BA, Stephens JC.Deconstructing the relationship between genetics and race. Nat Rev
Genet. 2004; 5: 598-609.
212
REFERENCES Ba-Ba
Bamshad MJ, Wooding S, Watkins WS, Ostler CT, Batzer MA, Jorde LB. Human population genetic structure and inference of group membership. Am J Hum Genet. 2003; 72: 578-589.
Bansal V, Bashir A, Bafna V. Evidence for large inversion polymorphisms in the human genome from HapMap data. Genome Res. 2007; 17: 219-230.
Barbujani G, Bertorelle G, Capitani G, Scozzari R. Geographical structuring in the mtDNA of Italians. Proc Natl Acad Sci USA. 1995; 92: 9171-9175.
Barbujani G, Bertorelle G, Chikhi L. Evidence for paleolithic and neolithic gene flow in Europe. Am J Hum Genet. 1998; 62: 488-491.
Barbujani G, Bertorelle G. Genetics and the population history of Europe. Proc Natl Acad Sci USA. 2001; 98: 22-25.
Barbujani G, Goldstein DB. Africans and Asians abroad: Genetic diversity in Europe. Annu Rev Genomics Hum Genet. 2004; 5: 119-150.
Barbujani G, Oden NL, Sokal RR. Detecting regions of abrupt change in maps of biological variables. Systematic Zoology. 1989; 38: 376-389.
Barbujani G, Sokal RR. Genetic population structure of Italy. I. Geographic patterns of gene frequencies. Hum Biol. 1991; 63: 253-272.
Barbujani G, Sokal RR. Zones of sharp genetic change in Europe are also linguistic boundaries. Proc Natl Acad Sci USA. 1990; 87: 1816-1819.
Barbujani G, Vian P, Fabbris L. Cultural barriers associated with large gene frequency differences among Italian populations. Hum Biol. 1992; 64: 479-495.
Barbujani G. Autocorrelation of gene frequencies under isolation by distance. Genetics. 1987; 117: 777-782.
Barbujani G. Geographic patterns: How to identify them and why. Hum Biol. 2000; 72: 133-153.
Barrai I, Formica G, Barale R, Scapoli C, Canella R, Beretta M. Isonymy in emigrants from Ferrara in 1981-1988. Ann Hum Biol. 1990; 17: 7-18.
Barrai I, Rodriguez-Larralde A, Mamolini E, Manni F, Scapoli C. Isonymy structure of USA population. Am J Phys Anthropol. 2001; 114: 109-123.
Barrai I, Rodriguez-Larralde A, Mamolini E, Manni F, Scapoli C. Elements of the surname structure of Austria. Ann Hum Biol. 2000; 27: 607-622.
Barrai I, Rodriguez-Larralde A, Mamolini E, Scapoli C. Isonymy and isolation by distance in Italy. Hum Biol. 1999; 71: 947-961.
Barrai I, Rodriguez-Larralde A, Manni F, Scapoli C. Isonymy and isolation by distance in the Netherlands. Hum Biol. 2002; 74: 263-283.
Barrai I, Scapoli C, Beretta M, Nesti C, Mamolini E, Rodriguez-Larralde A. Isolation by distance in Germany. Hum Genet. 1997; 100: 684.
Barrai I, Scapoli C, Beretta M, Nesti C, Mamolini E, Rodriguez-Larralde A. Isonymy and the genetic structure of Switzerland. I. The distributions of surnames. Ann Hum Biol. 1996; 23: 431-455.
Barrai I, Barbujani G, Beretta M, Maestri I, Russo A, Formica G, Pinto-Cisternas J. Surnames in Ferrara: distribution, isonymy and levels of inbreeding. Ann Hum Biol. 1987; 14: 415-423.
Barrai I, Formica G, Scapoli C, Beretta M, Mamolini E, Volinia S, Barale R, Ambrosino P, Fontana F. Microevolution in Ferrara: Isonymy 1890-1990. Ann Hum Biol. 1992; 19: 371-385.
Battilana J, Fagundes NJ, Heller AH, Goldani A, Freitas LB, Tarazona-Santos E, Munkhbat B, Munkhtuvshin N, Krylov M, Benevolenskaia L, Arnett FC, Batzer MA, Deininger PL, Salzano FM, Bonatto SL. Alu insertion polymorphisms in Native Americans and related Asian populations. Ann Hum Biol. 2006; 33: 142-160.
Batzer MA, Arcot SS, Phinney JW, Alegria-Hartman M, Kass DH, Milligan SM, Kimpton C, Gill P, Hochmeister M, Ioannou PA, Herrera RJ, Boudreau DA, Scheer WD, Keats BJ, Deininger PL, Stoneking M. Genetic variation of recent Alu insertions in human populations. J Mol Evol. 1996; 42: 22-29.
Batzer MA, Deininger PL. Alu repeats and human genomic diversity. Nat Rev Genet. 2002; 3: 370-379.
213
REFERENCES Ba-Bu
Batzer MA, Gudi VA, Mena JC, Foltz DW, Herrera RJ, Deininger PL. Amplification dynamics of human-specific (HS) Alu family members. Nucleic Acids Res. 1991; 19: 3619-3623.
Batzer MA, Rubin CM, Hellmann-Blumberg U, Alegria-Hartman M, Leeflang EP, Stern JD, Bazan HA, Shaikh TH, Deininger PL, Schmid CW. Dispersion and insertion polymorphism in two small subfamilies of recently amplified human Alu repeats. J Mol Biol. 1995; 247: 418-427.
Batzer MA, Arcot SS, Phinney JW, Alegria-Hartman M, Kass DH, Milligan SM, Kimpton C, Gill P, Hochmeister M, Ioannou PA, Herrera RJ, Boudreau DA, Scheer WD, Keats BJ, Deininger PL, Stoneking M. Genetic variation of recent Alu insertions in human populations. J Mol Evol. 1996; 42: 22-29.
Batzer MA, Kilroy GE, Richard PE, Shaikh TH, Desselle TD, Hoppens CL, Deininger PL. Structure and variability of recently inserted Alu family members. Nucleic Acids Res. 1990; 18: 6793-6798.
Becker SM, Al Halees Z, Molina C, Paterson RM. Consanguinity and congenital heart disease in Saudi Arabia. Am J Med Genet. 2001; 99: 8-13.
Beerli P, Felsenstein J. Maximum likelihood estimation of migration rates and population numbers of two populations using a coalescent approach. Genetics. 1999; 152: 763-773.
Behar DM, Hammer MF, Garrigan D, Villems R, Bonne-Tamir B, Richards M, Gurwitz D, Rosengarten D, Kaplan M, Della Pergola S, Quintana-Murci L, Skorecki K. mtDNA evidence for a genetic bottleneck in the early history of the Ashkenazi Jewish population. Eur J Hum Genet. 2004; 12: 355-364.
Bell GI, Selby MJ, Rutter WJ. The highly polymorphic region near the human insulin gene is composed of simple tandemly repeating sequences. Nature. 1982; 295: 31-35.
Bettencourt C, Montiel R, Santos C, Pavao ML, Viegas-Crespo AM, Lopes PA, Lima M. Polymorphism of the APOE locus in the Azores Islands (Portugal). Hum Biol. 2006; 78: 509-512.
Biondi G, Rickards O, Guglielmino CR, De Stefano GF. Marriage distances among the Afroamericans of Bluefields, Nicaragua. J Biosoc Sci. 1993; 25: 523-530.
Boattini A, Calboli FC, Blanco Villegas MJ, Gueresi P, Franceschi MG, Paoli G, Cavicchi S, Pettener D. Migration matrices and surnames in populations with different isolation patterns: Val di Lima (Italian Apennines), Val di Sole (Italian Alps), and La Cabrera (Spain). Am J Hum Biol. 2006; 18: 676-690.
Boissinot S, Chevret P, Furano AV. L1 (LINE-1) retrotransposon evolution and amplification in recent human history. Mol Biol Evol. 2000; 17: 915-928.
Bosch E, Calafell F, Comas D, Oefner PJ, Underhill PA, Bertranpetit J. High-resolution analysis of human Y-chromosome variation shows a sharp discontinuity and limited gene flow between northwestern Africa and the Iberian Peninsula. Am J Hum Genet. 2001; 68: 1019-1029.
Botto LD, Correa A, Erickson JD. Racial and temporal variations in the prevalence of heart defects. Pediatrics. 2001; 107: 1-8.
Branco CC, Mota-Vieira L. Population structure of São Miguel Island, Azores: A surname study. Hum Biol. 2003; 75: 929-939.
Branco CC, Mota-Vieira L. Surnames in the Azores: Analysis of the isonymy structure. Hum Biol. 2005; 77: 37-44.
Branco CC, Palla R, Lino S, Pacheco PR, Cabral R, de Fez L, Peixoto BR, Mota-Vieira L. Assessment of the Azorean ancestry by Alu insertion polymorphisms. Am J Hum Biol. 2006; 18: 223-226.
Brouha B, Schustak J, Badge RM, Lutz-Prigge S, Farley AH, Moran JV, Kazazian HH Jr. Hot L1s account for the bulk of retrotransposition in the human population. Proc Natl Acad Sci USA. 2003; 100: 5280-5285.
Brown WM. Polymorphism in mitochondrial DNA of humans as revealed by restriction endonuclease analysis. Proc Natl Acad Sci USA. 1980; 77: 3605-3609.
Bruges-Armas J, Martinez-Laso J, Martins B, Allende L, Gomez-Casado E, Longas J, Varela P, Castro MJ, Arnaiz-Villena A. HLA in the Azores Archipelago: Possible presence of Mongoloid genes. Tissue Antigens. 1999; 54: 349-359.
Burchard EG, Ziv E, Coyle N, Gomez SL, Tang H, Karter AJ, Mountain JL, Perez-Stable EJ, Sheppard D, Risch N. The importance of race and ethnic background in biomedical research and clinical practice. N Engl J Med. 2003; 348: 1170-1175.
214
REFERENCES Ca-Ch
C Cabral R, Anjos R, de Fez L, Pacheco PR, São-Bento M, Gomes CT, Branco CC, Duarte CP, Mota-Vieira L. Congenital
heart disease: A genealogical and genetic study in São Miguel Island, Azores. Annual Meeting of the European Society of Human Genetics Nice, France. Eur J Hum Genet. 2007; 15, Suppl 1: P0690.
Cabral R, Branco CC, Costa S, Caravello G, Tasso M, Peixoto BR, Mota-Vieira L. Geography of surnames in the Azores: Specificity and spatial distribution analysis. Am J Hum Biol. 2005; 17: 634-645.
Caffarelli E. I cognomi più frequenti in Italia. Rivista Italiana di Onomastica 1997; 1: 293-314.
Calafell F, Grigorenko EL, Chikanian AA, Kidd KK. Haplotype evolution and linkage disequilibrium: A simulation study. Hum Hered. 2001; 51: 85-96.
Calderon R, Perez-Miranda AM, Fuciarelli M, Scano G, Carrion M, Alfonso-Sanchez MA, Pena JA, Ambrosio B, De Stefano G. Genetic polymorphisms in autochthonous Basques from northern Navarre. Anthropol Anz. 2006; 64: 173-187.
Cann RL, Stoneking M, Wilson AC. Mitochondrial DNA and human evolution. Nature. 1987; 325: 31-36.
Capelli C, Wilson JF, Richards M, Stumpf MP, Gratrix F, Oppenheimer S, Underhill P, Pascali VL, Ko TM, Goldstein DB. A predominantly indigenous paternal heritage for the Austronesian-speaking peoples of insular south east Asia and Oceania. Am J Hum Genet. 2001; 68: 432-443.
Caravello GU, Tasso M, Lucchetti E. Distribution of surnames and identities in the Cimbro Mòcheno communities of Italy. Anthropol Anz. 2002; 60: 241-253.
Caravello GU, Tasso M. An analysis of the spatial distribution of surnames in the Lecco area (Lombardy, Italy). Am J Hum Biol. 1999; 11: 305-315.
Carroll ML, Roy-Engel AM, Nguyen SV, Salem AH, Vogel E, Vincent B, Myers J, Ahmad Z, Nguyen L, Sammarco M, Watkins WS, Henke J, Makalowski W, Jorde LB, Deininger PL, Batzer MA. Large-scale analysis of the Alu Ya5 and Yb8 subfamilies and their contribution to human genomic diversity. J Mol Biol. 2001; 311: 17-40.
Carvalho M, Anjos MJ, Andrade L, Lopes VI, Santos MV, Gamero JJ, Corte Real F, Vide MC. Y-chromosome STR haplotypes in two population samples: Azores Islands and Central Portugal. Forensic Sci Int. 2003; 134: 29-35.
Carvalho M, Anjos MJ, Andrade L, Coxinho C, Corte-Real F, Gamero JJ, Vieira DN, Vide MC. Y-chromosome polymorphisms: A comparison between Azores and Continental Portuguese sample. In: Progress in Forensic Genetics. (eds. Sensabaugh GF, Lincoln PJ, Olaisen B) Elsevier Science. 2000; 8: 302-303.
Cavalli-Sforza LL, Feldman MW. Cultural transmission and evolution: A quantitative approach. Monogr Popul Biol. 1981; 16: 1-388.
Cavalli-Sforza LL, Menozzi P, Piazza A. The history and geography of human genes. Princeton University Press, Princeton, NJ, 1994. 428 pp.
Cavalli-Sforza LL, Minch E. Paleolithic and neolithic lineages in the European mitochondrial gene pool. Am J Hum Genet. 1997; 61: 247-254.
Cavalli-Sforza LL, Piazza A, Menozzi P, Mountain J. Reconstruction of human evolution: Bringing together genetic, archaeological, and linguistic data. Proc Natl Acad Sci USA. 1988; 85: 6002-6006.
Cavalli-Sforza LL, Feldman MW. The application of molecular genetic approaches to the study of human evolution. Nat Genet. 2003; 33: 266-275.
Cavalli-Sforza LL. Genes, peoples, and languages. Proc Natl Acad Sci USA. 1997; 94: 7719-7724.
Chapman NH, Thompson EA. Linkage disequilibrium mapping: The role of population history, size, and structure. Adv Genet. 2001; 42: 413-437.
Charlesworth B.There is no new evidence that undermines evolution. Nature. 2006; 444: 680.
Cedergren MI, Selbing AJ, Löfman O, Källen BA. Chlorination by products and nitrate in drinking water and risk for congenital cardiac defects. Environ Res. 2002; 89: 124-130.
Chen Kuang HO, Cavalli-Sforza LL. Sumames in Taiwan: Interpretation based on geography and history. Hum Biol. 1983; 55: 367-374.
215
REFERENCES Ch-Cy
Chen YS, Olckers A, Schurr TG, Kogelnik AM, Huoponen K, Wallace DC. mtDNA variation in the south African Kung and Khwe and their genetic relationships to other African populations. Am J Hum Genet. 2000; 66: 1362-1383.
Chen C, Gentles AJ, Jurka J, Karlin S. Genes, pseudogenes, and Alu sequence organization across human chromosomes 21 and 22. Proc Natl Acad Sci USA. 2002; 99: 2930-2935.
Chen KH, Cavalli-Sforza LL. Surnames in Taiwan: Interpretations based on geography and history. Hum Biol. 1983; 55: 367-374.
Christensen AF. Population relationships by isonymy in frontier Pennsylvania. Hum Biol. 1999; 71: 859-873.
Christensen AF. An isonymic study of the population structure of early Kings County, NY. Hum Biol. 2000; 72: 1017-1037.
Cliff D, Ord JK. Spatial Autocorrelation. London: Pion Press. 1973. 178 pp.
Coco R, Penchaszadeh VB. Cytogenetic findings in 200 children with mental retardation and multiple congenital anomalies of unknown cause. Am J Med Genet. 1982; 12: 155-173.
Colantonio SE, Fuster VI, Marcellino AJ. Class endogamy, inbreeding and migration during the Argentinean colonial period: Analysis based on individuals of European ancestry. Anthropol Anz. 2006; 64: 311-319.
Colantonio SE, Fuster VI, Marcellino AJ. Interpopulation relationship by isonymy: Application to ethnosocial groups and illegitimacy. Hum Biol. 2002; 74: 871-878.
Colantonio SE, Lasker GW, Kaplan BA, Fuster VI. Use of surname models in human population biology: A review of recent developments. Hum Biol. 2003; 75: 785-807.
Comas D, Calafell F, Benchemsi N, Helal A, Lefranc G, Stoneking M, Batzer MA, Bertranpetit J, Sajantila A. Alu insertion polymorphisms in NW Africa and the Iberian Peninsula: Evidence for a strong genetic boundary through the Gibraltar Straits. Hum Genet. 2000; 107: 312-319.
Comas D,Calafell F, Mateu E, Perez-Lezaun A, Bosch E, Martinez-Arias R, Clarimon J, Facchini F, Fiori G, Luiselli D, Pettener D, Bertranpetit J. Trading genes along the silk road: mtDNA sequences and the origin of central Asian populations. Am J Hum Genet. 1998; 63: 1824-1838.
Connel KH. Irish peasant society: Four historical essays. Oxford, England: Clarendon Press. 1968. 167 pp.
Conrad DF, Jakobsson M, Coop G, Wen X, Wall JD, Rosenberg NA, Pritchard JK. A worldwide survey of haplotype variation and linkage disequilibrium in the human genome. Nat Genet. 2006; 38: 1251-1260.
Coop G, Przeworski M. An evolutionary view of human recombination. Nat Rev Genet. 2007; 8: 23-34.
Cooper A, Poinar HN. Ancient DNA: Do it right or not at all. Science. 2000; 289: 1139.
Correia A. História da colonização portuguesa na Índia. Agência Geral das Colónias, vol. 5, Lisboa. 1948. 699 pp.
Corte-Real F, Souto L, Anjos MJ, Carvalho M, Vieira DN, Carracedo A, Vide MC. Population study of HUMTH01, HUMVWA31/A, HUMF13A1, and HUMFES/FPS systems in Azores. J Forensic Sci. 1999; 44: 1261-1264.
Coutinho AM, Oliveira G, Morgadinho T, Fesel C, Macedo TR, Bento C, Marques C, Ataide A, Miguel T, Borges L, Vicente AM. Variants of the serotonin transporter gene (SLC6A4) significantly contribute to hyperserotonemia in autism. Mol Psychiatry. 2004; 9: 264-271.
Couto AR, Peixoto MJ, Garrett F, Laranjeira F, Cipriano T, Armas JB. Linkage disequilibrium between S65C HFE mutation and HLA A29-B44 haplotype in Terceira Island, Azores. Hum Immunol. 2003; 64: 625-628.
Couser WG. Pathogenesis of glomerular damage in glomerulonephritis. Nephrol Dial Transplant. 1998; 13 Suppl 1: 10-15.
Cox DG, Kraft P. Quantification of the power of Hardy-Weinberg equilibrium testing to detect genotyping error. Hum Hered. 2006; 61: 10-14.
Crawford DC, Akey DT, Nickerson DA. The patterns of natural variation in human genes. Annu Rev Genomics Hum Genet. 2005; 6: 287-312.
Crow JF, Kimura MA. An introduction to population genetics theory. London: Harper Row, 1970. 591 pp.
Crow JF, Mange AP. Measurement of inbreeding from the frequency of marriages between persons of the same surname. Eugen Q. 1965; 12: 199-203.
Cymbron T, Anjos R, Cabral R, Macedo C, Pereira Duarte C, Mota-Vieira L. Epidemiological characterization of congenital heart disease in São Miguel Island, Azores, Portugal. Community Genet. 2006; 9: 107-112.
216
REFERENCES Da-Ex
D Dargaud Y, Negrier C. Haemophilia therapies. Expert Opin Biol Ther. 2007; 7: 651-663.
Dawson DM. Ataxia in families from the Azores. N Engl J Med. 1977; 296: 1529-1530.
de Knijff P. Y-chromosomes shared by descent or by state. In: Archaeogenetics: DNA and the population prehistory of Europe. (eds. Renfrew C, Boyle K), Cambridge: The McDonald Institute. 2000; pp 301-304.
de Pancorbo MM, Lopez-Martinez M, Martinez-Bouzas C, Castro A, Fernandez-Fernandez I, de Mayolo GA, de Mayolo AA, de Mayolo PA, Rowold DJ, Herrera RJ. The Basques according to polymorphic Alu insertions. Hum Genet. 2001; 109: 224-233.
de Sa P, Dias JA, Miguel JM. The evolution of mortality from ischemic heart disease and cerebrovascular diseases in Portugal in the decade of the 80s. Acta Med Port. 1994; 7: 71-81.
de Vries BB, Pfundt R, Leisink M, Koolen DA, Vissers LE, Janssen IM, Reijmersdal S, Nillesen WM, Huys EH, Leeuw N, Smeets D, Sistermans EA, Feuth T, van Ravenswaaij-Arts CM, van Kessel AG, Schoenmakers EF, Brunner HG, Veltman JA. Diagnostic genome profiling in mental retardation. Am J Hum Genet. 2005; 77: 606-616.
Deka R, Chakroborty R, Ferrell RE. A population genetic study of six VNTR loci in three ethnically defined populations. Genomics. 1991; 11: 83-92.
Demarchi DA, Mitchell RJ. Genetic structure and gene flow in Gran Chaco populations of Argentina: Evidence from Y-chromosome markers. Hum Biol. 2004; 76: 413-429.
Denoeud F, Vergnaud G, Benson G. Predicting human minisatellite polymorphism. Genome Res. 2003; 13: 856-867.
Devlin B, Roeder K, Otto C, Tiobech S, Byerley W. Genome-wide distribution of linkage disequilibrium in the population of Palau and its implications for gene flow in Remote Oceania. Hum Genet. 2001; 108: 521-528.
Dewannieux M, Esnault C, Heidmann T. LINE-mediated retrotransposition of marked Alu sequences. Nat Genet. 2003; 35: 41-48.
Di Rienzo A, Peterson AC, Garza JC, Valdes AM, Slatkin M, Freimer NB. Mutational processes of simple-sequence repeat loci in human populations. Proc Natl Acad Sci USA. 1994; 91: 3166-3170.
Domingues PM, Gusmão L, da Silva DA, Amorim A, Pereira RW, de Carvalho EF. SubSaharan Africa descendents in Rio de Janeiro (Brazil): Population and mutational data for 12 Y-STR loci. Int J Legal Med. 2007; 121: 238-241.
Driscoll CA, Menotti-Raymond M, Nelson G, Goldstein D, O'Brien SJ. Genomic microsatellites as evolutionary chronometers: A test in wild cats. Genome Res. 2002; 12: 414-423.
Dupre N, Howard HC, Mathieu J, Karpati G, Vanasse M, Bouchard JP, Carpenter S, Rouleau GA. Hereditary motor and sensory neuropathy with agenesis of the corpus callosum. Ann Neurol. 2003; 54: 9-18.
E Edwards A, Civitello A, Hammond HA, Caskey CT. DNA typing and genetic mapping with trimeric and tetrameric tandem
repeats. Am J Hum Genet. 1991; 49: 746-756.
Edwards MC, Gibbs RA. A human dimorphism resulting from loss of an Alu. Genomics. 1992; 14: 590-597.
Ejima Y, Yang L. Trans mobilization of genomic DNA as a mechanism for retrotransposon-mediated exon shuffling. Hum Mol Genet. 2003; 12: 1321-1328.
Ellegren H. Heterogeneous mutation processes in human microsatellite DNA sequences. Nat Genet. 2000; 24: 400-402.
Epperson BK, Clegg MT. Spatial-autocorrelation analysis of flower colour polymorphisms within substructured populations of morning glory (Ipomoea purpurea). Am Nat. 1986; 128: 840-858.
Epperson BK. Spatial structure of genetic variation within populations of forest trees. New Forests. 1992; 6: 257-278.
Esparza M, Garcia-Moro C, Hernandez M. Inbreeding from isonymy and repeated pairs of surnames in the Ebro Delta region (Tarragona, Spain). Am J Hum Biol. 2006; 18: 849-852.
Excoffier L. Human diversity: Our genes tell where we live. Curr Biol. 2004; 13: 134-136.
217
REFERENCES Fe-Gi
F Felsenstein J. PHYLIP. Phylogeny inference package. version 35c Distributed by the author Department of Genetics,
University of Washington, Seattle, WA. 1993.
Fernandes AT, Brehm A, Gusmão L, Amorim A. Y-chromosome STR haplotypes in the Madeira archipelago population. Forensic Sci Int. 2001; 122: 178-180.
Fernando O, Mota P, Lima M, Silva C, Montiel R, Amorim A, Prata MJ. Peopling of the Azores Islands (Portugal): Data from the Y-chromosome. Hum Biol. 2005; 77: 189-199.
Ferreira A. A ilha graciosa. Livros Horizonte, Lisboa, Portugal. 1987.
Feuk L, Carson AR, Scherer SW. Structural variation in the human genome. Nat Rev Genet. 2006b; 7: 85-97.
Feuk L, Marshall CR, Wintle RF, Scherer SW. Structural variants: Changing the landscape of chromosomes and design of disease studies. Hum Mol Genet. 2006a; 15: R57-66.
Field M, Shanley S, Kirk J. Inherited cancer susceptibility syndromes in paediatric practice. J Paediatr Child Health. 2007; 43: 219-229.
Fisher RA. The relation between the number of species and the number of individuals in a random sample of animal population. J Anim Ecol. 1943; 12: 42-58.
Flores C, Maca-Meyer N, Perez JA, Gonzalez AM, Larruga JM. Cabrera, VIM. A predominant European ancestry of paternal lineages from Canary Islanders. Ann Hum Genet. 2003; 67: 138-152.
Foster MW, Sharp RR. Beyond race: Towards a whole-genome perspective on human populations and genetic variation. Nat Rev Genet. 2004; 5: 790-796.
Fredman D, White SJ, Potter S, Eichler EE, Den Dunnen JT, Brookes AJ. Complex SNP-related sequence variation in segmental genome duplications. Nat Genet. 2004; 36: 861-866.
Freeman JL, Perry GH, Feuk L, Redon R, McCarroll SA, Altshuler DM, Aburatani H, Jones KW, Tyler-Smith C, Hurles ME, Carter NP, Scherer SW, Lee C. Copy number variation: New insights in genome diversity. Genome Res. 2006; 16: 949-961.
Friedman JH. Azorean (Machado-Joseph) disease. R I Med J. 1988; 71: 149-153.
Fu YH, Kuhl DP, Pizzuti A, Pieretti M, Sutcliffe JS, Richards S, Verkerk AJ, Holden JJ, Fenwick RG Jr, Warren ST. Variation of the CGG repeat at the fragile X site results in genetic instability: Resolution of the Sherman paradox. Cell. 1991; 67: 1047-1058.
G Gagnon A, Toupance B. Testing isonymy with paternal and maternal lineages in the early Quebec population: The impact of
polyphyletism and demographic differentials. Am J Phys Anthropol. 2002; 117: 334-341.
Gagnon A, Heyer E. Fragmentation of the Quebec population genetic pool (Canada): Evidence from the genetic contribution of founders per region in the 17th and 18th centuries. Am J Phys Anthropol. 2001; 114: 30-41.
Ganguly A, Dunbar T, Chen P, Godmilow L, Ganguly T. Exon skipping caused by an intronic insertion of a young Alu Yb9 element leads to severe hemophilia A. Hum Genet. 2003; 113: 348-352.
Gaspar C, Lopes-Cendes I, Hayes S, Goto J, Arvidsson K, Dias A, Silveira I, Maciel P, Coutinho P, Lima M, Zhou YX, Soong BW, Watanabe M, Giunti P, Stevanin G, Riess O, Sasaki H, Hsieh M, Nicholson GA, Brunt E, Higgins JJ, Lauritzen M, Tranebjaerg L, Volpini V, Wood N, Ranum L, Tsuji S, Brice A, Sequeiros J, Rouleau GA. Ancestral origins of the Machado-Joseph disease mutation: A worldwide haplotype study. Am J Hum Genet. 2001; 68: 523-528.
Ghanem N, Uring-Lambert B, Abbal M, Hauptmann G, Lefranc MP, Lefranc G. Polymorphism of MHC class IV genes: Definition of restriction fragment linkage groups and evidence for frequent deletions and duplications. Hum Genet. 1988; 79: 209-218.
Gherman A, Chen PE, Teslovich TM, Stankiewicz P, Withers M, Kashuk CS, Chakravarti A, Lupski JR, Cutler DJ, Katsanis N. Population bottlenecks as a potential major shaping force of human genome architecture. PLoS Genet. 2007; 3: e119.
Giannelli F, Anagnostopoulos T, Green PM. Mutation rates in humans. II. Sporadic mutation-specific rates and rate of detrimental human mutations inferred from hemophilia B. Am J Hum Genet. 1999; 65: 1580-1587.
218
REFERENCES Gi-Ha
Giglio S, Broman KW, Matsumoto N, Calvari VI, Gimelli G, Neumann T, Ohashi H, Voullaire L, Larizza D, Giorda R, Weber JL, Ledbetter DH, Zuffardi O. Olfactory receptor-gene clusters, genomic-inversion polymorphisms, and common chromosome rearrangements. Am J Hum Genet. 2001; 68: 874-883.
Gilad Y, Oshlack A, Rifkin SA. Natural selection on gene expression. Trends Genet. 2006; 22: 456-461.
Gilbert N, Lutz-Prigge S, Moran JV. Genomic deletions created upon LINE-1 retrotransposition. Cell. 2002; 110: 315-325.
Giles RE, Blanc H, Cann HM, Wallace DC. Maternal inheritance of human mitochondrial DNA. Proc Natl Acad Sci USA. 1980; 77: 6715-6719.
Glemin S, Ronfort J, Bataillon T. Patterns of inbreeding depression and architecture of the load in subdivided populations. Genetics. 2003; 165: 2193-2212.
Goldberg JI, Borgen PI. Breast cancer susceptibility testing: Past, present and future. Expert Rev Anticancer Ther. 2006; 6: 1205-1214.
Gonçalves R, Freitas A, Branco M, Rosa A, Fernandes AT, Zhivotovsky LA, Underhill PA, Kivisild T, Brehm A. Y-chromosome lineages from Portugal, Madeira and Açores record elements of sephardim and berber ancestry. Ann Hum Genet. 2005; 69: 443-454.
Gonçalves R, Rosa A, Freitas A, Fernandes A, Kivisild T, Villems R, Brehm A. Y-chromosome lineages in Cabo Verde Islands witness the diverse geographic origin of its first male settlers. Hum Genet. 2003; 113: 467-472.
Gonzalez C, Lima M, Kay T, Silva C, Santos C, Santos J. Short-term psychological impact of predictive testing for Machado-Joseph disease: Depression and anxiety levels in individuals at risk from the Azores (Portugal). Community Genet. 2004; 7: 196-201.
Gonzalez R, Jacobus J, Martin EM. Investigating neurocognitive features of hepatitis C virus infection in drug users: Potential challenges and lessons learned from the HIV literature. Clin Infect Dis. 2005; 41: S45-49.
Gonzalez-Neira A, Gusmão L, Brion M, Lareu MVI, Amorim A, Carracedo A. Distribution of Y-chromosome STR defined haplotypes in Iberia. Forensic Sci Int. 2000; 110: 117-126.
Gray IC, Campbell DA, Spurr NK. Single nucleotide polymorphisms as tools in human Genetics. Hum Mol Genet. 2000; 9: 2403-2408.
Grech V. Seasonality in live births with congenital heart disease in Malta. Cardiol Young. 1999; 9: 396-401.
Gu S, Pakstis AJ, Li H, Speed WC, Kidd JR, Kidd KK. Significant variation in haplotype block structure but conservation in tagSNP patterns among global populations. Eur J Hum Genet. 2007; 15: 302-312.
Gueresi P, Pettener D, Veronesi FM. Marriage behaviour in the Alpine Non Valley from 1825 to 1923. Ann Hum Biol. 2001; 28: 157-171.
Guill JH. A history of the Azores Islands, Vol 5 California: Division of Golden Shield International Publications Cooperation. 1993. 662 pp.
Guthery SL, Salisbury BA, Pungliya MS, Stephens JC, Bamshad M. The structure of common genetic variation in U.S. populations. Am J Hum Genet. 2007 in press.
H Hamet P, Merlo E, Seda O, Broeckel U, Tremblay J, Kaldunski M, Gaudet D, Bouchard G, Deslauriers B, Gagnon F,
Antoniol G, Pausova Z, Labuda M, Jomphe M, Gossard F, Tremblay G, Kirova R, Tonellato P, Orlov SN, Pintos J, Platko J, Hudson TJ, Rioux JD, Kotchen TA, Cowley AW Jr. Quantitative founder-effect analysis of French Canadian families identifies specific loci contributing to metabolic phenotypes of hypertension. Am J Hum Genet. 2005; 76: 815-832.
Hammer MF, Karafet TM, Redd AJ, Jarjanazi H, Santachiara-Benerecetti S, Soodyall H, Zegura SL. Hierarchical patterns of global human Y-chromosome diversity. Mol Biol Evol. 2001; 18: 1189-1203.
Hammer MF. A recent insertion of an Alu element on the Y-chromosome is a useful marker for human population studies. Mol Biol Evol. 1994; 11: 749-761.
Hammer MF, Horai S. Y-chromosomal DNA variation and the peopling of Japan. Am J Hum Genet. 1995; 56: 951-962.
Hardy GH. Mendelian proportions in a mixed population. Science. 1908; 28: 49-50.
219
REFERENCES Ha-Je
Harpending HC, Ward RH. Chemical systematics and human populations In: Biochemical aspects of evolutionary biology (ed M. Nitecki), University of Chicago Press, Chicago, IL. 1982; pp 213-256.
Hartl DL, Clark AG. Principles of population genetics, 3rd edition, Sinauer Associates, Inc. 1997. 542 pp.
Hasanoğlu A, Biberoğlu G, Tümer L. Gyrate atrophy of the choroid and retina. Turk J Pediatr. 1996; 38: 253-256.
Hasegawa M, Thorne JL, Kishino H. Time scale of eutherian evolution estimated without assuming a constant rate of molecular evolution. Genes Genet Syst. 2003; 78: 267-283.
Heatwole CR, Moxley RT 3rd. The nondystrophic myotonias. Neurotherapeutics. 2007; 4: 238-251.
Hebsgaard MB, Wiuf C, Gilbert MT, Glenner H, Willerslev E. Evaluating Neanderthal genetics and phylogeny. J Mol Evol. 2007; 64: 50-60.
Hedges DJ, Batzer MA. From the margins of the genome: Mobile elements shape primate evolution. Bioessays. 2005; 27: 785-794.
Hellenthal G, Stephens M. Insights into recombination from population genetic variation. Curr Opin Genet Dev. 2006; 16: 565-572.
Helgason A, Siguroardóttir S, Nicholson J, Sykes B, Hill EW, Bradley DG, Bosnes VI, Gulcher JR, Ward R, Stefansson K. Estimating Scandinavian and Gaelic ancestry in the male settlers of Iceland. Am J Hum Genet. 2000; 67: 697-717.
Hill WG, Robertson A. The effect of linkage on limits to artificial selection. Genet Res. 1966; 8: 269-294.
Hosking L, Lumsden S, Lewis K, Yeo A, McCarthy L, Bansal A, Riley J, Purvis I, Xu CF. Detection of genotyping errors by Hardy-Weinberg equilibrium testing. Eur J Hum Genet. 2004; 12: 395-399.
Houck CM, Rinehart FP, Schmid CW. A ubiquitous family of repeated DNA sequences in the human genome. J Mol Biol. 1979; 132: 289-306.
Howell N, Smejkal CB, Mackey DA, Chinnery PF, Turnbull DM, Herrnstadt C. The pedigree rate of sequence divergence in the human mitochondrial genome: There is a difference between phylogenetic and pedigree rates. Am J Hum Genet. 2003; 72: 659-670.
Hurles ME, Veitia R, Arroyo E, Armenteros M, Bertranpetit J, Perez-Lezaun A, Bosch E, Shlumukova M, Cambon-Thomsen A, McElreavey K, Lopez De Munain A, Rohl A, Wilson IJ, Singh L, Pandya A, Santos FR, Tyler-Smith C, Jobling MA. Recent male-mediated gene flow over a linguistic barrier in Iberia, suggested by analysis of a Y-chromosomal DNA polymorphism. Am J Hum Genet. 1999; 65: 1437-1448.
I Iafrate AJ, Feuk L, Rivera MN, Listewnik ML, Donahoe PK, Qi Y, Scherer SW, Lee C. Detection of large-scale variation in
the human genome. Nat Genet. 2004; 36: 949-951.
Ingman M, Gyllensten U. Mitochondrial genome variation and evolutionary history of Australian and New Guinean aborigines. Genome Res. 2003; 13: 1600-1606.
Ingman M, Kaessmann H, Paabo S, Gyllensten U. Mitochondrial genome variation and the origin of modern humans. Nature. 2000; 408: 708-713.
Inoue K, Lupski JR. Molecular mechanisms for genomic disorders. Annu Rev Genomics Hum Genet. 2002; 3: 199-242.
International Human Genome Sequencing Consortium. Initial sequencing and analysis of the human genome. Nature. 2001;409: 860-921.
International SNP Map Working Group. A map of human genome sequence variation containing 1.42 million single nucleotide polymorphisms. Nature. 2001; 409: 928-933.
Iriondo M, Barbero MC, Manzano C. DNA polymorphisms detect ancient barriers to gene flow in Basques. Am J Phys Anthropol. 2003; 122: 73-84.
J Jaffé A, Bush A. Cystic fibrosis: Review of the decade. Monaldi Arch Chest Dis. 2001; 56: 240-247.
Jarman AP, Wells RA. Hypervariable minisatellites: Recombinators or innocent bystanders? Trends Genet. 1989; 5: 367-371.
Jeffreys AJ, Wilson VI, Thein SL. Hypervariable minisatellite regions in human DNA. Nature. 1985; 314: 67-73.
220
REFERENCES Jo-Ko
Jobling MA, Hurles ME, Tyler-Smith C. Human evolutionary genetics: Origins, peoples, and disease. Garland Science, New York. 2004. 523 pp.
Jobling MA, Tyler-Smith C. Fathers and sons: The Y-chromosome and human evolution. Trends Genet. 1995; 11, 449-456.
Jorde LB, Watkins WS, Bamshad MJ, Dixon ME, Ricker CE, Seielstad MT, Batzer MA. The distribution of human genetic diversity: A comparison of mitochondrial, autosomal, and Y-chromosome data. Am J Hum Genet. 2000; 66: 979-988.
Jorde LB. Inbreeding in the Utah Mormons: An evaluation of estimates based on pedigrees, isonymy, and migration matrices. Ann Hum Genet. 1989; 53: 339-355.
K Kaessmann H, Zöllner S, Wiebe VI, Gustafsson A, Laan M, Uhlén M, Pääbo S. Extensive linkage disequilibrium in small
human populations in Eurasia. Am J Hum Genet. 2002; 70: 673-685.
Kalaydjieva L, Morar B, Chaix R, Tang H. A newly discovered founder population: The Roma/Gypsies. Bioessays. 2005; 27: 1084-1094.
Karafet T, Xu L, Du R, Wang W, Feng S, Wells RS, Redd AJ, Zegura SL, Hammer MF. Paternal population history of east Asia: Sources, patterns, and microevolutionary processes. Am J Hum Genet. 2001; 69: 615-628.
Karlin S, McGregor J. The number of mutant forms maintained in a population. Proceedings of the Fifth Berkeley Symposium on Mathematics, Statistics and Probability. 1967; 4: 415-438.
Kasperaviciute D, Kucinskas VI, Stoneking M. Y-chromosome and mitochondrial DNA variation in Lithuanians. Ann Hum Genet. 2004; 68: 438-452.
Kayser M, Krawczak M, Excoffier L, Dieltjes P, Corach D, Pascali VI, Gehrig C, Bernini LF, Jespersen J, Bakker E, Roewer L, de Knijff P. An extensive analysis of Y-chromosomal microsatellite haplotypes in globally dispersed human populations. Am J Hum Genet. 2001; 68: 990-1018.
Kazazian HH Jr. Mobile elements: Drivers of genome evolution. Science. 2004; 303: 1626-1632.
Ke Y, Su B, Song X, Lu D, Chen L, Li H, Qi C, Marzuki S, Deka R, Underhill P, Xiao C, Shriver M, Lell J, Wallace D, Wells RS, Seielstad M, Oefner P, Zhu D, Jin J, Huang W, Chakraborty R, Chen Z, Jin L. African origin of modern humans in east Asia: A tale of 12,000 Y-chromosomes. Science. 2001; 292: 1151-1153.
Keyser-Tracqui C, Crubezy E, Pamzsav H, Varga T, Ludes B. Population origins in Mongolia: Genetic structure analysis of ancient and modern DNA. Am J Phys Anthropol. 2006; 131: 272-281.
Khaitovich P, Paabo S, Weiss G. Toward a neutral evolutionary model of gene expression. Genetics. 2005; 170: 929-939.
Khan F, Pandey AK, Tripathi M, Talwar S, Bisen PS, Borkar M, Agrawal S. Genetic affinities between endogamous and inbreeding populations of Uttar Pradesh. BMC Genet. 2007; 8: 12.
Kidd KK, Kidd JR, Pakstis AJ, Bonné-Tamir B, Grigorenko E: Nuclear genetic variation of European populations in a global context. in Colin Renfrew, Katie Boyle (eds): Archaeogeneics: DNA and the population prehistory of Europe. Cambridge, 2000; pp 109-117.
Kimura M, Crow J F. The number of alleles that can be maintained in a finite population. Genetics. 1964; 49: 725-738.
Kimura M, Ohta T. Stepwise mutation model and distribution of allelic frequencies in a finite population. Proc Nat Acad Sci USA. 1978, 75: 2868-2872.
Kimura M, Weiss GH. The stepping stone model of population structure and the decrease of genetic correlation with distance. Genetics. 1964; 49: 461-576.
Kittles RA, Weiss KM. Race, ancestry, and genes: Implications for defining disease risk. Annu Rev Genomics Hum Genet. 2003; 4: 33-67.
Kivisild T, Rootsi S, Metspalu M, Mastana S, Kaldma K, Parik J, Metspalu E, Adojaan M, Tolk HV, Stepanov VI, Golge M, Usanga E, Papiha SS, Cinnioglu C, King R, Cavalli-Sforza L, Underhill PA, Villems R. The genetic heritage of the earliest settlers persists both in Indian tribal and caste populations. Am J Hum Genet. 2003; 72: 313-332.
Kolman CJ, Sambuugiin N, Bermingham E. Mitochondrial DNA analysis of Mongolian populations and implications for the origin of New World founders. Genetics. 1996; 142: 1321-1334.
Korenberg JR, Rykowski MC. Human genome organization: Alu, lines, and the molecular structure of metaphase chromosome bands. Cell. 1988; 53: 391-400.
221
REFERENCES Kr-Lu
Krawczak M, Zschocke J. A role for overdominant selection in phenylketonuria? Evidence from molecular data. Hum Mutat. 2003; 21: 394-397.
Kumar VI, Reddy AN, Babu JP, Rao TN, Langstieh BT, Thangaraj K, Reddy AG, Singh L, Reddy BM. Y-chromosome evidence suggests a common paternal heritage of Austro-Asiatic populations. BMC Evol Biol. 2007; 7: 47.
L Laberge AM, Michaud J, Richter A, Lemyre E, Lambert M, Brais B, Mitchell GA. Population history and its impact on
medical Genetics in Quebec. Clin Genet. 2005; 68: 287-301.
Lao O, van Duijn K, Kersbergen P, de Knijff P, Kayser M. Proportioning whole-genome single nucleotide polymorphism diversity for the identification of geographic population structure and genetic ancestry. Am J Hum Genet. 2006; 78: 680-690.
Lasker GW, Mascie-Taylor CG. Surnames in five English villages: Relationship to each other, to surrounding areas, and to England and Wales. J Biosoc Sci. 1983; 15: 25-34.
Lasker G. Surnames and genetic structure. Cambridge: Cambridge University Press. 1985. 148 pp.
Lasker GW. A coefficient of relationship by isonymy: A method for estimating the genetic relationship between populations. Hum Biol. 1977; 49: 489-493.
Lasker GW, Kaplan BA. Surnames and genetic structure: Repetition of the same Pairs of names of married couples, a measure of subdivision of the population. Hum Biol. 1985; 57: 431-440.
Lautenberger JA, Stephens JC, O’Brien SJ, Smith MW. Significant admixture linkage disequilibrium across the FY locus in African Americans. Am J Hum Genet. 2000; 66: 969-978.
Latini VI, Sole G, Doratiotto S, Poddie D, Memmi M, Varesi L, Vona G, Cao A, Ristaldi MS. Genetic isolates in Corsica (France): Linkage disequilibrium extension analysis on the Xq13 region. Eur J Hum Genet. 2004; 12: 613-619.
Leal SM. Detection of genotyping errors and pseudo-SNPs via deviations from Hardy-Weinberg equilibrium. Genet Epidemiol. 2005; 29: 204-214.
Lee KA, Kim JW. Heterozygosities of 735 microsatellite markers and background linkage disequilibrium in the Korean population. Exp Mol Med. 2006; 38: 662-667.
Lefevre-Witier P, Aireche H, Benabadji M, Darlu P, Melvin K, Sevin A, Crawford MH. Genetic structure of Algerian populations. Am J Hum Biol. 2006; 18: 492-501.
Legay JM, Vernay M. The distribution and geographical origin of some French surnames. Ann Hum Biol. 2000; 27: 587-605.
Lell JT, Wallace DC. The peopling of Europe from the maternal and paternal perspectives. Am J Hum Genet. 2000; 67: 1376-1381.
Lewis PO, Zaykin D. Genetic data analysis: Computer program for the analysis of allelic data. Distributed by the author, Department of Ecology and Evolution, University of Connecticut, Storrs, CT. 2000.
Lewontin RC, Kojima K. The evolutionary dynamics of complex polymorphisms. Evolution. 1960; 14: 458-472.
Lewontin RC.Testing the theory of natural selection. Nature. 1972; 236: 181-182.
Li WH, Sadler LA. Low nucleotide diversity in man. Genetics. 1991; 129: 513-523.
Lima M, Smith MT, Silva C, Abade A, Mayer FM, Coutinho P. Natural selection at the MJD locus: Phenotypic diversity, survival and fertility among Machado-Joseph Disease patients from the Azores. J Biosoc Sci. 2001; 33: 361-373.
Liu H, Prugnolle F, Manica A, Balloux F. A geographically explicit genetic model of worldwide human-settlement history. Am J Hum Genet. 2006; 79: 230-237.
Litt M, Luty JA. A hypervariable microsatellite revealed by in vitro amplification of a dinucleotide repeat within the cardiac muscle actin gene. Am J Hum Genet. 1989; 44: 397-401.
Lucchetti E, Soliani L. Similarità tra popolazioni esaminate mediante i cognomi. Riv Antropol. 1989; 67: 181-198.
Lum JK, Cann RL. mtDNA lineage analyses: Origins and migrations of Micronesians and Polynesians. Am J Phys Anthropol. 2000; 113: 151-168.
222
REFERENCES Ma-Mo
M MacDonald IM, Sereda C, McTaggart K, Mah D. Choroideremia gene testing. Expert Rev Mol Diagn. 2004; 4: 478-484.
Macmahon B, Mckeown T, Record RG: The incidence and life expectations of children with congenital heart disease. Br Heart J. 1953;15: 121-129.
Madrigal L, Ware B, Miller R, Saenz G, Chavez M, Dykes D. Ethnicity, gene flow, and population subdivision in Limon, Costa Rica. Am J Phys Anthropol. 2001; 114: 99-108.
Maj MC, Cameron JM, Robinson BH. Pyruvate dehydrogenase phosphatase deficiency: Orphan disease or an under-diagnosed condition? Mol Cell Endocrinol. 2006; 249: 1-9.
Malécot G. Quelques schémas probabilistes sur la variabilité des populations naturelles. Ann Univ Lyon Sci Sec A. 1950; 13: 37-60.
Manni F, Toupance B, Sabbagh A, Heyer E. New method for surname studies of ancient patrilineal population structures, and possible application to improvement of Y-chromosome sampling. Am J Phys Anthropol. 2005; 126: 214-228.
Manrubia SC, Zanette DH. At the boundary between biological and cultural evolution: The origin of surname distributions. J Theor Biol. 2002; 216: 461-477.
Marques AP. A historiografia dos descobrimentos e expansão portuguesa. Coimbra. 1991. 59 pp.
Matera AG, Hellmann U, Schmid CW. A transpositionally and transcriptionally competent Alu subfamily. Mol Cell Biol. 1990; 10: 5424-5432.
Mather FJ, Chen VW, Morgan LH, Correa CN, Shaffer JG, Srivastav SK, Rice JC, Blount G, Swalm CM, Wu X, Scribner RA. Hierarchical modeling and other spatial analyses in prostate cancer incidence data. Am J Prev Med. 2006; 30: S88-100.
Matos A. Povoamento e colonização dos Açores. In: Portugal no Mundo. (eds. Albuquerque, L.). Lisboa: Publicações Alfa. 1989. pp 176-188.
McCarroll SA, Hadnott TN, Perry GH, Sabeti PC, Zody MC, Barrett JC, Dallaire S, Gabriel SB, Lee C, Daly MJ, Altshuler DM, International HapMap Consortium. Common deletion polymorphisms in the human genome. Nat Genet. 2006; 38: 86-92.
McDonlald JD. www.scs.uiuc.edu/~mcdonald/WorldHaplogroupsMaps.pdf. 2005.
McEvoy B, Brady C, Moore LT, Bradley DG. The scale and nature of Viking settlement in Ireland from Y-chromosome admixture analysis. Eur J Hum Genet. 2006; 14: 1288-1294.
Mendonça L. História dos Açores - Visão geral (sécs. XV-XIX). Centro de Apoio Tecnológico à Educação, Ponta Delgada, Azores. 1996. 196 pp.
Mesa NR, Mondragon MC, Soto ID, Parra MV, Duque C, Ortiz-Barrientos D, Garcia LF, Velez ID, Bravo ML, Munera JG, Bedoya G, Bortolini MC, Ruiz-Linares A. Autosomal, mtDNA, and Y-chromosome diversity in Amerinds: pre- and post-Columbian patterns of gene flow in south America. Am J Hum Genet. 2000; 67: 1277-1286.
Mills KA, Buetow KH, Xu Y, Weber JL, Altherr MR, Wasmuth JJ, Murray JC. Genetic and physical maps of human chromosome 4 based on dinucleotide repeats. Genomics. 1992; 14: 209-219.
Mine M, Chen JM, Brivet M, Desguerre I, Marchant D, de Lonlay P, Bernard A, Ferec C, Abitbol M, Ricquier D, Marsac C. A large genomic deletion in the PDHX gene caused by the retrotranspositional insertion of a full-length LINE-1 element. Hum Mutat. 2007; 28: 137-42.
Mohlke KL, Lange EM, Valle TT, Ghosh S, Magnuson VL, Silander K, Watanabe RM, Chines PS, Bergman RN, Tuomilehto J, Collins FS, Boehnke M. Linkage disequilibrium between microsatellite markers extends beyond 1 cM on chromosome 20 in Finns. Genome Res. 2001; 11: 1221-1226.
Montiel R, Bettencourt C, Silva C, Santos C, Prata MJ, Lima M. Analysis of Y-chromosome variability and its comparison with mtDNA variability reveals different demographic histories between islands in the Azores Archipelago (Portugal). Ann Hum Genet. 2005; 69: 135-144.
Montpetit A, Nelis M, Laflamme P, Magi R, Ke X, Remm M, Cardon L, Hudson TJ, Metspalu A. An evaluation of the performance of tag SNPs derived from HapMap in a Caucasian population. PLoS Genet. 2006; 2: e27.
Moran PAP. Notes on continuous stochastic phenomena. Biometrika. 1950; 37: 17-23.
223
REFERENCES Mo-No
Morton NE. Estimation of demographic parameters from isolation by distance. Hum Hered. 1982; 32: 37-41.
Morton NE, Yasuda N. Transition matrices with mutation. Am J Hum Genet. 1980; 32: 202-211.
Mota-Vieira L, Pacheco PR, Almeida ML, Cabral R, Carvalho J, Branco CC, de Fez L, Peixoto BR, Araújo AL, Mendonça P. Human DNA bank in São Miguel Island (Azores): A resource for genetic diversity studies. In Progress in Forensic Genetics, Proceedings of the 21st International Congress of Forensic Genetics: 13-17 September Ponta Delgada. Edited by Amorim A, Côrte-Real F, Morling N, 2005; 1288: 388-390.
Mourrieras B, Darlu P, Hochez J, Hazout S. Surname distribution in France: A distance analysis by a distorted geographical map. Ann Hum Biol. 1995; 22: 183-198.
Muller-Hilke B, Mitchison NA. The role of HLA promoters in autoimmunity. Curr Pharm Des. 2006; 12: 3743-3752.
Murray-McIntosh RP, Scrimshaw BJ, Hatfield PJ, Penny D. Testing migration patterns and estimating founding population size in Polynesia by using human mtDNA sequences. Proc Natl Acad Sci USA. 1998; 95: 9047-9052.
Myers JS, Vincent BJ, Udall H, Watkins WS, Morrish TA, Kilroy GE, Swergold GD, Henke J, Henke L, Moran JV, Jorde LB, Batzer MA. A comprehensive analysis of recently integrated human Ta L1 elements. Am J Hum Genet. 2002; 71: 312-326.
N Nabulsi MM, Tamim H, Sabbagh M, Obeid MY, Yunis KA, Bitar FF. Parental consanguinity and congenital heart
malformation in a developing country. Am J Med Genet. 2003;116: 342-347.
Nakamura Y, Julier C, Wolff R, Holm T, O'Connell P, Leppert M, White R. Characterization of a human 'midisatellite' sequence. Nucleic Acids Res. 1987; 15: 2537-2547.
Nasidze I, Ling EY, Quinque D, Dupanloup I, Cordaux R, Rychkov S, Naumova O, Zhukova O, Sarraf-Zadegan N, Naderi GA, Asgary S, Sardas S, Farhud DD, Sarkisian T, Asadov C, Kerimov A, Stoneking M. Mitochondrial DNA and Y-chromosome variation in the Caucasus. Ann Hum Genet. 2004; 68: 205-221.
Nasidze I, Risch GM, Robichaux M, Sherry ST, Batzer MA, Stoneking M. Alu insertion polymorphisms and the genetic structure of human populations from the Caucasus. Eur J Hum Genet. 2001; 9: 267-272.
Naslund K, Saetre P, von Salome J, Bergstrom TF, Jareborg N, Jazin E. Genome-wide prediction of human VNTRs. Genomics. 2005; 85: 24-35.
Nebel A, Filon D, Faerman M, Soodyall H, Oppenheim A. Y-chromosome evidence for a founder effect in Ashkenazi Jews. Eur J Hum Genet. 2005; 13: 388-391.
Nebel A, Filon D, Brinkmann B, Majumder PP, Faerman M, Oppenheim A. The Y-chromosome pool of Jews as part of the genetic landscape of the Middle east. Am J Hum Genet. 2001; 69, 1095-1112.
Nei M. The theory and estimation of genetic distance. In Genetic Structure of Populations, ed. by N.E. Morton,. Honolulu: Hawaii University Press. 1973; pp 45-54.
Newman DL, Hoffjan S, Bourgain C, Abney M, Nicolae RI, Profits ET, Grow MA, Walker K, Steiner L, Parry R, Reynolds R, McPeek MS, Cheng S, Ober C. Are common disease susceptibility alleles the same in outbred and founder populations? Eur J Hum Genet. 2004; 12: 584-590.
NIH/CEPH Collaborative Mapping Group. A comprehensive genetic linkage map of the human genome. Science. 1992; 258: 67-86.
Nielsen R. Molecular signatures of natural selection. Annu Rev Genet. 2005; 39: 197-218.
Nonakal I, Minaguchi1 K, Takezaki N. Y-chromosomal binary haplogroups in the Japanese population and their relationship to 16 Y-STR polymorphisms. Ann Hum Genet. 2007; 71: 480-495.
224
REFERENCES Oa-Pe
O Oakey R, Tyler-Smith C. Y-chromosome DNA haplotyping suggests that most European and Asian men are descended from
one of two males. Genomics. 1990; 7: 325-330.
Oden NL. Assessing the significance of a spatial correlograms. Geogr Anal. 1984; 16: 1-16.
Ohta T, Kimura M. A model of mutation appropriate to estimate the number of electrophoretically detectable alleles in a finite population. Genet Res. 1973; 22: 201-204.
Oliveira G, Ataíde A, Marques C, Miguel TS, Coutinho AM, Mota-Vieira L, Diogo L, Domingues C, Gonçalves E, Lopes NM, Nogueira P, Borges L, Rodrigues V, Mota HC, Vicente AM. Epidemiology of Autism Spectrum Disorder (ASD) in Portugal: Prevalence, clinical characterization and associated medical conditions in a pediatric population. Dev Med Child Neurol. 2007; 49: 726-733.
Olivieri A, Achilli A, Pala M, Battaglia VI, Fornarino S, Al-Zahery N, Scozzari R, Cruciani F, Behar DM, Dugoujon JM, Coudray C, Santachiara-Benerecetti AS, Semino O, Bandelt HJ, Torroni A. The mtDNA legacy of the Levantine early upper palaeolithic in Africa. Science. 2006; 314: 1767-1770.
Ostertag EM, Kazazian HH Jr. Biology of mammalian L1 retrotransposons. Annu Rev Genet. 2001; 35: 501-538.
Ota T. DISPAN: Genetic distance and phylogenetic analysis. Institute of Molecular Evolutionary Genetics, The Pennsylvania State University, USA. 1993.
P Pacheco PR, Branco CC, Cabral R, Costa S, Araujo AL, Peixoto BR, Mendonca P, Mota-Vieira L. The Y-chromosomal
heritage of the Azores Islands population. Ann Hum Genet. 2005; 69: 145-156.
Pacheco PR, Branco CC, Peixoto BR, Mota-Vieira L. Consanguinity in the Azores Islands (Portugal): a retrospective study from 1931 to 2000. Eur J Hum Genet. 2003; [Suppl] 11: P856.
Page RDM. TREEVIEW: An application to display phylogenetic trees on personal computers. Computer Applications in the BioSciences. 1996; 12: 357-358.
Pajukanta P, Nuotio I, Terwilliger JD, Porkka KV, Ylitalo K, Pihlajamaki J, Suomalainen AJ, Syvanen AC, Lehtimaki T, Viikari JS, Laakso M, Taskinen MR, Ehnholm C, Peltonen L. Linkage of familial combined hyperlipidaemia to chromosome 1q21-q23. Nat Genet. 1998; 18: 369-373.
Pajukanta P, Allayee H, Krass KL Kuraishy A, Soro A, Lilja HE, Mar R, Taskinen MR, Nuotio I, Laakso M, Rotter JI, de Bruin TW, Cantor RM, Lusis AJ, Peltonen L. Combined analysis of genome scans of dutch and finnish families reveals a susceptibility locus for high density lipoprotein cholesterol on chromosome 16q. Am J Hum Genet. 2003; 72: 903-917.
Pardo LM, MacKay I, Oostra B, van Duijn CM, Aulchenko YS. The effect of genetic drift in a young genetically isolated population. Ann Hum Genet. 2005; 69: 288-295.
Patil N, Berno AJ, Hinds DA, Barrett WA, Doshi JM, Hacker CR, Kautzer CR, Lee DH, Marjoribanks C, McDonough DP, Nguyen BT, Norris MC, Sheehan JB, Shen N, Stern D, Stokowski RP, Thomas DJ, Trulson MO, Vyas KR, Frazer KA, Fodor SP, Cox DR. Blocks of limited haplotype diversity revealed by high-resolution scanning of human chromosome 21. Science. 2001; 294: 1719-1723.
Pato CN, Middleton FA, Gentile KL, Morley CP, Medeiros H, Macedo A, Azevedo MH, Pato MT. Genetic linkage of bipolar disorder to chromosome 6q22 is a consistent finding in Portuguese subpopulations and generalize to broader populations. Am J Med Genet B Neuropsychiatr Genet. 2005; 134: 119-121.
Pearson JV, Huentelman MJ, Halperin RF, Tembe WD, Melquist S, Homer N, Brun M, Szelinger S, Coon KD, Zismann VL, Webster JA, Beach T, Sando SB, Aasly JO, Heun R, Jessen F, Kolsch H, Tsolaki M, Daniilidou M, Reiman EM, Papassotiropoulos A, Hutton ML, Stephan DA, Craig DW. Identification of the genetic basis for complex disorders by use of pooling-based genomewide single nucleotide polymorphism association studies. Am J Hum Genet. 2007; 80: 126-139.
Peltonen L, Palotie A, Lange K. Use of population isolates for mapping complex traits. Nat Rev Genet. 2000; 1: 182-190.
Pereira L, Prata MJ, Jobling MA, Carracedo A, Amorim A. Clinal variation of YAP+ Y-chromosome frequencies in western Iberia. Hum Biol. 2000; 72: 937-944.
Perez-Lezaun A, Calafell F, Clarimon J, Bosch E, Mateu E, Gusmão L, Amorim A, Benchemsi N, Bertranpetit J. Allele frequencies of 13 short tandem repeats in population samples from the Iberian Peninsula and northern Africa. Int J Legal Med. 2000; 113: 208-214.
Perna NT, Batzer MA, Deininger PL, Stoneking M. Alu insertion polymorphism: A new type of marker for human population studies. Hum Biol. 1992; 64: 641-648.
225
REFERENCES Pe-Ri
Pettener D, Pastor S, Tarazona-Santos E. Surnames and genetic structure of a high-altitude Quechua community from the Ichu River Valley, Peruvian Central Andes, 1825-1914. Hum Biol. 1998; 70: 865-887.
Pickeral OK, Makalowski W, Boguski MS, Boeke JD. Frequent human genomic DNA transduction driven by LINE-1 retrotransposition. Genome Res. 2000; 10: 411-415.
Pinto-Cisternas J, Zimmer E, Barrai I. Comparisons of Lasker's coefficient of relationship in a Venezuelan town in two different periods. Ann Hum Biol. 1990; 17: 305-314.
Pinto-Cisternas J, Pineda L, Barrai I. Estimation of inbreeding by isonymy in Ibero-American populations: An extension of the method of Crow and Mange. Am J Hum Genet. 1985; 37: 373-385.
Pires J. Ensaio histórico: Povoamento do Faial. In Rosa J (Ed.) Em louvor do VI Centenário do Povoamento do Faial 1468-69-1968-69. Horta, Açores. 1983.
Polley SD, Tetteh KK, Lloyd JM, Akpogheneta OJ, Greenwood BM, Bojang KA, Conway DJ. Plasmodium falciparum merozoite surface protein 3 is a target of allele-specific immunity and alleles are maintained by natural selection. J Infect Dis. 2007; 195: 279-287.
Pritchard JK, Przeworski M. Linkage disequilibrium in humans: Models and data. Am J Hum Genet. 2001; 69: 1-14.
Przeworski M, Hudson RR, Di Rienzo A. Adjusting the focus on human variation. Trends Genet. 2000; 16: 296-302.
Q Qamar R, Ayub Q, Mohyuddin A, Helgason A, Mazhar K, Mansoor A, Zerjal T, Tyler-Smith C, Mehdi SQ. Y-chromosomal
DNA variation in Pakistan. Am J Hum Genet. 2002; 70: 1107-1124.
Quintana-Murci L, Semino O, Bandelt HJ, Passarino G, McElreavey K, Santachiara-Benerecetti AS. Genetic evidence of an early exit of Homo sapiens sapiens from Africa through eastern Africa. Nat Genet. 1999; 23: 437-441.
R Raymond M, Rousset F. GENEPOP, population genetics software for exact test and ecumenicism. J Heredity. 1995; 86:
248-249.
Redd AJ, Roberts-Thomson J, Karafet T, Bamshad M, Jorde LB, Naidu JM, Walsh B, Hammer MF. Gene flow from the Indian subcontinent to Australia: Evidence from the Y-chromosome.Curr Biol. 2002; 12: 673-677.
Redon R, Ishikawa S, Fitch KR, Feuk L, Perry GH, Andrews TD, Fiegler H, Shapero MH, Carson AR, Chen W, Cho EK, Dallaire S, Freeman JL, Gonzalez JR, Gratacos M, Huang J, Kalaitzopoulos D, Komura D, MacDonald JR, Marshall CR, Mei R, Montgomery L, Nishimura K, Okamura K, Shen F, Somerville MJ, Tchinda J, Valsesia A, Woodwark C, Yang F, Zhang J, Zerjal T, Zhang J, Armengol L, Conrad DF, Estivill X, Tyler-Smith C, Carter NP, Aburatani H, Lee C, Jones KW, Scherer SW, Hurles ME. Global variation in copy number in the human genome. Nature. 2006; 444: 444-454.
Reich DE, Cargill M, Bolk S Ireland J, Sabeti PC, Richter DJ, Lavery T, Kouyoumjian R, Farhadian SF, Ward R, Lander ES. Linkage disequilibrium in the human genome. Nature. 2001; 411: 199-204.
Relethford JH. Estimation of kinship and genetic distances from surnames. Hum Biol. 1988; 60: 475-492.
Relethford JH. Isonymy and population structure of Irish isolates during the 1890s. J Biosoc Sci. 1982; 14: 241-247.
Repping S, van Daalen SK, Brown LG, Korver CM, Lange J, Marszalek JD, Pyntikova T, van der Veen F, Skaletsky H, Page DC, Rozen S. High mutation rates have driven extensive structural polymorphism among human Y-chromosomes. Nat Genet. 2006; 38: 463-467.
Richards M, Corte-Real H, Forster P, Macaulay VI, Wilkinson-Herbots H, Demaine A, Papiha S, Hedges R, Bandelt HJ, Sykes B. Paleolithic and neolithic lineages in the European mitochondrial gene pool. Am J Hum Genet. 1996; 59: 185-203.
Richter A, Rioux JD, Bouchard JP, Mercier J, Mathieu J, Ge B, Poirier J, Julien D, Gyapay G, Weissenbach J, Hudson TJ, Melancon SB, Morgan K. Location score and haplotype analyses of the locus for autosomal recessive spastic ataxia of Charlevoix-Saguenay, in chromosome region 13q11. Am J Hum Genet. 1999; 64: 768-775.
Ripley B. Spatial statistics. Wiley, New York. 1981. 252 pp.
Risch N, Burchard E, Ziv E, Tang H. Categorization of humans in biomedical research: Genes, race and disease. Genome Biol. 2002; 1.
Risch N, Tang H, Katzenstein H, Ekstein J. Geographic distribution of disease mutations in the Ashkenazi Jewish population supports genetic drift over selection. Am J Hum Genet. 2003; 72: 812-822.
226
REFERENCES Ro-Ru
Robida A, Folger GM, Hajar HA. Incidence of congenital heart disease in Qatari children. Int J Cardiol. 1997; 60: 19-22.
Rodriguez-Larralde A, Alfonzo JC, Barrai I. Surname frequency and the isonymy structure of Venezuela. Am J Hum Biol. 2000; 123: 352-362.
Rodriguez-Larralde A, Gonzales-Martin A, Scapoli C, Barrai I. The names of Spain: A study of the isonymy structure of Spain. Am J Phys Anthropol. 2003; 121: 280-292.
Rodriguez-Larralde A, Pavesi A, Scapoli C, Conterio F, Siri G, Barrai I.. Isonymy and the genetic structure of Sicily. J Biosoc Sci. 1994; 26: 9-24.
Rodriguez-Larralde A, Barrai I, Alfonso JC. Isonymy structure of four Venezuelan states. Ann Hum Biol. 1993; 20: 131-145.
Roewer L, Kayser M, Dieltjes P, Nagy M, Bakker E, Krawczak M Knijff P. Analysis of molecular variance (AMOVA) of Y-chromosome-specific microsatellites in two closely related human populations. Hum Mol Genet. 1996; 5: 1029-1033.
Rogers AR. Doubts about isonymy. Hum Biol. 1991; 63: 663-668.
Romanul FC, Fowler HL, Radvany J, Feldman RG, Feingold M. Azorean disease of the nervous system. N Engl J Med. 1977; 296: 1505-1508.
Romualdi C, Balding D, Nasidze IS, Risch G, Robichaux M, Sherry ST, Stoneking M, Batzer MA, Barbujani G. Patterns of human diversity, within and among continents, inferred from biallelic DNA polymorphisms. Genome Res. 2002; 12: 602-612.
Rootsi S, Magri C, Kivisild T, Benuzzi G, Help H, Bermisheva M, Kutuev I, Barac L, Pericic M, Balanovsky O, Pshenichnov A, Dion D, Grobei M, Zhivotovsky LA, Battaglia VI, Achilli A, Al-Zahery N, Parik J, King R, Cinnioglu C, Khusnutdinova E, Rudan P, Balanovska E, Scheffrahn W, Simonescu M, Brehm A, Goncalves R, Rosa A, Moisan JP, Chaventre A, Ferak VI, Furedi S, Oefner PJ, Shen P, Beckman L, Mikerezi I, Terzic R, Primorac D, Cambon-Thomsen A, Krumina A, Torroni A, Underhill PA, Santachiara-Benerecetti AS, Villems R, Semino O. Phylogeography of Y-chromosome haplogroup I reveals distinct domains of prehistoric gene flow in europe. Am J Hum Genet. 2004; 75: 128-137.
Rosenberg MS, Sokal RR, Oden NL, DiGiovanni D. Spatial autocorrelation of cancer in western Europe. Eur J Epidemiol. 1999; 15: 15-22.
Rosenberg NA, Pritchard JK, Weber JL, Cann HM, Kidd KK, Zhivotovsky LA, Feldman MW. Genetic structure of human populations. Science. 2002; 298: 2381-2385.
Rosser ZH, Zerjal T, Hurles ME, Adojaan M, Alavantic D, Amorim A, Amos W, Armenteros M, Arroyo E, Barbujani G, Beckman G, Beckman L, Bertranpetit J, Bosch E, Bradley DG, Brede G, Cooper G, Corte-Real HB, de Knijff P, Decorte R, Dubrova YE, Evgrafov O, Gilissen A, Glisic S, Golge M, Hill EW, Jeziorowska A, Kalaydjieva L, Kayser M, Kivisild T, Kravchenko SA, Krumina A, Kucinskas VI, Lavinha J, Livshits LA, Malaspina P, Maria S, McElreavey K, Meitinger TA, Mikelsaar AV, Mitchell RJ, Nafa K, Nicholson J, Norby S, Pandya A, Parik J, Patsalis PC, Pereira L, Peterlin B, Pielberg G, Prata MJ, Previdere C, Roewer L, Rootsi S, Rubinsztein DC, Saillard J, Santos FR, Stefanescu G, Sykes BC, Tolun A, Villems R, Tyler-Smith C, Jobling MA. Y-chromosomal diversity in Europe is clinal and influenced primarily by geography, rather than by language. Am J Hum Genet. 2000; 67: 1526-1543.
Roux AF. Molecular updates on Usher syndrome. J Fr Ophtalmol. 2005; 28: 93-97.
Royle NJ, Clarkson RE, Wong Z, Jeffreys AJ. Clustering of hypervariable minisatellites in the proterminal regions of human autosomes. Genomics. 1988; 3: 352-360.
Rubin CM, Houck CM, Deininger PL, Friedmann T, Schmid CW. Partial nucleotide sequence of the 300- nucleotide interspersed repeated human DNA sequences. Nature. 1980; 284, 372-374.
Rubinsztein DC, Amos B, Cooper G. Microsatellite and trinucleotide-repeat evolution: Evidence for mutational bias and different rates of evolution in different lineages. Philos Trans R Soc Lond B Biol Sci. 1999; 354: 1095-1099.
Rudan I, Biloglav Z, Vorko-Jovic A, Kujundzic-Tiljak M, Stevanovic R, Ropac D, Puntaric D, Cucevic B, Salzer B, Campbell H. Effects of inbreeding, endogamy, genetic admixture, and outbreeding on human health: A (1001 Dalmatians) study. Croat Med J. 2006; 47: 601-610.
Russel-Wood AJR. A disseminação das gentes. In: História da expansão portuguesa: a formação do Império. Vol. 1. (eds. Bettencourt F, Chaudhuri K) Navarra: Circulo de Leitores. 1998. 539 pp.
227
REFERENCES Sa-Sh
S Santos C, Abade A, Cantons J, Mayer FM, Aluja MP, Lima M. Genetic structure of Flores Island (Azores, Portugal) in the
19th century and in the present-day: Evidence from surname analysis. Hum Biol. 2005; 77: 317-341.
Santos C, Lima M, Montiel R, Angles N, Pires L, Abade A, Aluja MP. Genetic structure and origin of peopling in the Azores Islands (Portugal): The view from mtDNA. Ann Hum Genet. 2003; 67: 433-456.
Santos C, Montiel R, Angles N, Lima M, Francalacci P, Malgosa A, Abade A, Aluja MP Determination of human caucasian mitochondrial DNA haplogroups by means of a hierarchical approach. Hum Biol. 2004; 76: 431-453.
Santos C, Montiel R, Sierra B, Bettencourt C, Fernandez E, Alvarez L, Lima M, Abade A, Aluja MP. Understanding differences between phylogenetic and pedigree-derived mtDNA mutation rate: A model using families from the Azores Islands (Portugal). Mol Biol Evol. 2005; 22: 1490-1505.
Santos JM. Os Açores nos séculos XV e XVI. Açores: Serafim Silva artes gráficas. 1989. 422 pp.
Sassaman DM, Dombroski BA, Moran JV, Kimberland ML, Naas TP, DeBerardinis RJ, Gabriel A, Swergold GD, Kazazian HH Jr. Many human L1 elements are capable of retrotransposition. Nat Genet. 1997; 16: 37-43.
Schaak S, Mialet-Perez J, Flordellis C, Paris H. Genetic variation of human adrenergic receptors: From molecular and functional properties to clinical and pharmacogenetic implications. Curr Top Med Chem. 2007; 7: 217-231.
Schneider S, Roessli D, Excoffier L. Arlequin: A software for population Genetics data analysis. Geneva: University of Geneva, Genetics and Biometry Laboratory. 2000.
Schneider VI, Cruz J, Lopes D, Bruges G, Paisana J, Gomes F, Gil C. The prevalence of the principal cardiovascular risk factors in the population of the Azores. Rev Port Cardiol. 1995; 14: 1019-1027.
Schwartz M, Vissing J. Paternal inheritance of mitochondrial DNA. N Engl J Med. 2002; 347: 576-80.
Sebat J, Lakshmi B, Troge J, Alexander J, Young J, Lundin P, Maner S, Massa H, Walker M, Chi M, Navin N, Lucito R, Healy J, Hicks J, Ye K, Reiner A, Gilliam TC, Trask B, Patterson N, Zetterberg A, Wigler M. Large-scale copy number polymorphism in the human genome. Science. 2004; 305: 525-528.
Seielstad MT, Minch E, Cavalli-Sforza LL. Genetic evidence for a higher female migration rate in humans. Nature. 1998; 20, 278-280.
Semino O, Santachiara-Benerecetti AS, Falaschi F, Cavalli-Sforza LL, Underhill PA. Ethiopians and Khoisan share the deepest clades of the human Y-chromosome phylogeny. Am J Hum Genet. 2002; 70: 265-268.
Semino O, Passarino G, Oefner PJ, Lin AA, Arbuzova S, Beckman LE, De Benedictis G, Francalacci P, Kouvatsi A, Limborska, Marcikiae M, Mika A, Mika B, Primorac D, Santachiara-Benerecetti AS, Cavalli-Sforza LL, Underhill PA. The genetic legacy of Paleolithic Homo sapiens sapiens in extant Europeans: A Y-chromosome perspective. Science. 2000; 290: 1155-1159.
Serre D, Paabo S. Evidence for gradients of human genetic diversity within and among continents. Genome Res. 2004; 14: 1679-1685.
Service S, DeYoung J, Karayiorgou M Roos, JL, Pretorious H, Bedoya G, Ospina J, Ruiz-Linares A, Macedo A, Palha JA, Heutink P, Aulchenko Y, Oostra B, van Duijn C, Jarvelin MR, Varilo T, Peddle L, Rahman P, Piras G, Monne M, Murray S, Galver L, Peltonen L, Sabatti C, Collins A, Freimer N. Magnitude and distribution of linkage disequilibrium in population isolates and implications for genome-wide association studies. Nat Genet. 2006; 38: 556-560.
Setzer RW. Spatio-temporal patterns of mortality in Pemphigus populicaulis and P.populitransversus on cot-tonwoods. Oecologia. 1985; 67: 310-321.
Sharp AJ, Locke DP, McGrath SD, Cheng Z, Bailey JA, Vallente RU, Pertz LM, Clark RA, Schwartz S, Segraves R, Oseroff VV, Albertson DG, Pinkel D, Eichler EE. Segmental duplications and copy-number variation in the human genome. Am J Hum Genet. 2005; 77: 78-88.
Shaw-Smith C, Redon R, Rickman L, Rio M, Willatt L, Fiegler H, Firth H, Sanlaville D, Winter R, Colleaux L, Bobrow M, Carter NP. Microarray based comparative genomic hybridisation (array-CGH) detects submicroscopic chromosomal deletions and duplications in patients with learning disability/ mental retardation and dysmorphic features. J Med Genet. 2004; 41: 241-248.
Shen P, Lavi T, Kivisild T, Chou VI, Sengun D, Gefel D, Shpirer I, Woolf E, Hillel J, Feldman MW, Oefner PJ. Reconstruction of patrilineages and matrilineages of Samaritans and other Israeli populations from Y-chromosome and mitochondrial DNA sequence variation. Hum Mutat. 2004; 24: 248-260.
228
REFERENCES Sh-St
Shifman S, Kuypers J, Kokoris M, Yakir B, Darvasi A. Linkage disequilibrium patterns of the human genome across populations. Hum Mol Genet. 2003; 12: 771-776.
Sibley E. Genetic variation and lactose intolerance: Detection methods and clinical implications. Am J Pharmacogenomics. 2004; 4: 239-245.
Sikkink SK, Biswas S, Parry NR, Stanga PE, Trump D. X-linked retinoschisis: An update. J Med Genet. 2007; 44: 225-232.
Silva WA Jr, Bonatto SL, Holanda AJ, Ribeiro-Dos-Santos AK, Paixao BM, Goldman GH, Abe-Sandes K, Rodriguez-Delfin L, Barbosa M, Paco-Larson ML, Petzl-Erler ML, Valente VI, Santos SE, Zago MA. Mitochondrial genome diversity of Native Americans supports a single early entry of founder populations into America. Am J Hum Genet. 2002; 71: 187-192.
Simoni L, Calafell F, Pettener D, Bertranpetit J, Barbujani G. Geographic pattems of mtDNA diversity in Europe Am J Hum Genet. 2000; 66: 262-278.
Sklar P, Pato MT, Kirby A, Petryshen TL, Medeiros H, Carvalho C, Macedo A, Dourado A, Coelho I, Valente J, Soares MJ, Ferreira CP, Lei M, Verner A, Hudson TJ, Morley CP, Kennedy JL, Azevedo MH, Lander E, Daly MJ, Pato CN. Genome-wide scan in Portuguese Island families identifies 5q31-5q35 as a susceptibility locus for schizophrenia and psychosis. Mol Psychiatry. 2004; 9: 213-218.
Skowronski J, Fanning TG, Singer MF. Unit-length line-1 transcripts in human teratocarcinoma cells. Mol Cell Biol. 1988; 8: 1385-1397.
Smit AF. The origin of interspersed repeats in the human genome. Curr Opin Genet Dev. 1996; 6: 743-748.
Smith MT, Abade A, Cunha EM. Genetic structure of the Azores: Marriage and inbreeding in Flores. Ann Hum Biol. 1992; 19: 595-601.
Sokal RR, Harding RM, Lasker GW, Mascie Taylor CGN. A spatial analysis of 100 surnames in England and Wales. Ann Hum Biol. 1992; 19: 445-476.
Sokal RR, Smouse PE, Neel JV. The genetic structure of a tribal population, the Yanomama Indians XV. Patterns inferred by autocorrelation analysis. Genetics. 1986; 114: 259-287.
Sokal RR, Thomson BA. Spatial genetic structure of human populations in Japan. Hum Biol. 1998; 70: 1-22.
Sokal RR, Uytterschaut H. Cranial variation in European populations: A spatial autocorrelation study at three time periods. Am J Phys Anthrol. 1987; 74: 21-38.
Sokal RR, Oden NL. Spatial autocorrelation in biology. 1. Methodology. Biol J Linn Soc. 1978a; 10: 199-228.
Sokal RR, Oden NL. Spatial autocorrelation in biology. 2. Some biological implications and four applications of evolutionary and ecological interest. Biol J Linn Soc. 1978b; 10: 229-249.
Soodyall H, Jenkins T, Mukherjee A, du Toit E, Roberts DF, Stoneking M. The founding mitochondrial DNA lineages of Tristan da Cunha Islanders. Am J Phys Anthropol. 1997; 104: 157-166.
Sousa M. As origens dos apelidos das famílias portuguesas. Lisboa: Sporpress. 2001. 81 pp.
Spencer CC, Deloukas P, Hunt S, Mullikin J, Myers S, Silverman B, Donnelly P, Bentley D, McVean G. The influence of recombination on human genetic diversity. PLoS Genet. 2006; 2: e148.
Spinola H, Brehm A, Bettencourt B, Middleton D, Bruges-Armas J. HLA class I and II polymorphisms in Azores show different settlements in Oriental and Central islands. Tissue Antigens. 2005; 66: 217-230.
Spinola H, Middleton D, Brehm A. HLA genes in Portugal inferred from sequence-based typing. In the crossroad between Europe and Africa. Tissue Antigens. 2005; 66: 26-36.
SPSS: Statistical Package for Social Sciences. http://www.spss.com.
Suarez-Kurtz G, Pena SD. PharmacoGenomics in the Americas: The impact of genetic admixture. Curr Drug Targets. 2006; 712: 1649-1658.
St George-Hyslop P, Rogaeva E, Huterer J, Tsuda T, Santos J, Haines JL, Schlumpf K, Rogaev EI, Liang Y, McLachlan DR, Kennedy J, Weissenbach J, Billingsley GD, Cox DW, Lang AE, Wherrett JR. Machado-Joseph disease in pedigrees of Azorean descent is linked to chromosome 14. Am J Hum Genet. 1994; 55: 120-125.
Stoneking M, Fontius JJ, Clifford SL, Soodyall H, Arcot SS, Saha N, Jenkins T, Tahir MA, Deininger PL, Batzer MA. Alu insertion polymorphisms and human evolution: Evidence for a larger population size in Africa. Genome Res. 1997; 7: 1061-1071.
229
REFERENCES St-Va
Stumpf MP, Goldstein DB. Demography, recombination hotspot intensity, and the block structure of linkage disequilibrium. Curr Biol. 2003; 13: 1-8.
Sykes B, Irven C. Surnames and the Y-chromosome. Am J Hum Genet. 2000; 66: 1417-1419.
T Teo YY, Fry AE, Clark TG, Tai ES, Seielstad M. On the usage of HWE for identifying genotyping errors. Ann Hum
Genetics. 2007; 71: 701-703.
Teugels E, De Brakeleer S, Goelen G, Lissens W, Sermijn E, De Greve J. De novo Alu element insertions targeted to a sequence common to the BRCA1 and BRCA2 genes. Hum Mutat. 2005; 26: 284.
Thangaraj K, Singh L, Reddy AG, Rao VR, Sehgal SC, Underhill PA, Pierson M, Frame IG, Hagelberg E. Genetic affinities of the Andaman Islanders, a vanishing human population.Curr Biol. 2003; 13: 86-93.
The International HapMap Consortium. A haplotype map of the human genome. Nature. 2005; 437: 1299-1320.
The International HapMap Consortium. The International HapMap project. Nature. 2003; 426: 789-796.
The International SNP Map Working Group. A map of human genome sequence variation containing 1.42 million single nucleotide polymorphisms. Nature. 2001, 409; 928-933.
Thornton K. Recombination and the properties of Tajima's D in the context of approximate-likelihood calculation. Genetics. 2005; 171: 2143-2148.
Tishkoff SA, Verrelli BC. Patterns of human genetic diversity: Implications for human evolutionary history and disease. Annu Rev Genomics Hum Genet. 2003; 4: 293-340.
Tishkoff SA, Kidd KK. Implications of biogeography of human populations for 'race' and medicine. Nat Genet. 2004; 36: 21-27.
Tishkoff SA, Reed FA, Ranciaro A, Voight BF, Babbitt CC, Silverman JS, Powell K, Mortensen HM, Hirbo JB, Osman M, Ibrahim M, Omar SA, Lema G, Nyambo TB, Ghori J, Bumpstead S, Pritchard JK, Wray GA, Deloukas P. Convergent adaptation of human lactase persistence in Africa and Europe. Nat Genet. 2007; 39: 31-40.
Torroni A, Bandelt HJ, D'Urbano L, Lahermo P, Moral P, Sellitto D, Rengo C, Forster P, Savontaus ML, Bonne-Tamir B, Scozzari R. mtDNA analysis reveals a major late paleolithic population expansion from southwestern to northeastern Europe. Am J Hum Genet. 1998; 62: 1137-1152.
Torroni A, Bandelt HJ, Macaulay VI, Richards M, Cruciani F, Rengo C, Martinez-Cabrera VI, Villems R, Kivisild T, Metspalu E, Parik J, Tolk HV, Tambets K, Forster P, Karger B, Francalacci P, Rudan P, Janicijevic B, Rickards O, Savontaus ML, Huoponen K, Laitinen VI, Koivumaki S, Sykes B, Hickey E, Novelletto A, Moral P, Sellitto D, Coppa A, Al-Zaheri N, Santachiara-Benerecetti AS, Semino O, Scozzari R. A signal, from human mtDNA, of postglacial recolonization in Europe. Am J Hum Genet. 2001; 69: 844-852.
Torroni A, Schurr TG, Cabell MF, Brown MD, Neel JV, Larsen M, Smith DG, Vullo CM, Wallace DC. Asian affinities and continental radiation of the four founding Native American mtDNAs. Am J Hum Genet. 1993; 53: 563-590.
Tuzun E, Sharp AJ, Bailey JA, Kaul R, Morrison VA, Pertz LM, Haugen E, Hayden H, Albertson D, Pinkel D, Olson MV, Eichler EE. Fine-scale structural variation of the human genome. Nat Genet. 2005; 37: 727-732.
U Ullu E, Tschudi C. Alu sequences are processed 7SL RNA genes. Nature. 1984; 312: 171-172.
Underhill PA. Inferring human history: Clues from Y-chromosome haplotypes. Cold Spring Harb Symp Quant Biol. 2003; 68: 487-493.
V van den Hurk JA, Meij IC, Del Carmen Seleme M, Kano H, Nikopoulos K, Hoefsloot LH, Sistermans EA, de Wijs IJ,
Mukhopadhyay A, Plomp AS, de Jong PT, Kazazian HH, Cremers FP. L1 retrotransposition can occur early in human embryonic development. Hum Mol Genet. 2007; 16: 1587-1592.
van Holst Pellekaan S, Frommer M, Sved J, Boettcher B. Mitochondrial control region sequence variation in aboriginal Australians. Am J Hum Genet. 1998; 62: 435-449.
Varilo T, Laan M, Hovatta I, Wiebe VI, Terwilliger JD, Peltonen L. Linkage disequilibrium in isolated populations: Finland and a young subpopulation of Kuusamo. Eur J Hum Genet. 2000; 8: 604-612.
230
REFERENCES Va-We
Varilo T, Paunio T, Parker A, Perola M, Meyer J, Terwilliger JD, Peltonen L. The interval of linkage disequilibrium (LD) detected with microsatellite and SNP markers in chromosomes of Finnish populations with different histories. Hum Mol Genet. 2003; 12: 51-59.
Velosa RG, Fernandes AT, Brehm A.Genetic profile of the Açores Archipelago population using the new PowerPlex 16 system kit. Forensic Sci Int. 2002; 129: 68-71.
Venter JC, Adams MD, Myers EW, Li PW, Mural RJ, Sutton GG, Smith HO, Yandell M, Evans CA, Holt RA, Gocayne JD, Amanatides P, Ballew RM, Huson DH, Wortman JR, Zhang Q, Kodira CD, Zheng XH, Chen L, Skupski M, Subramanian G, Thomas PD, Zhang J, Gabor Miklos GL, Nelson C, Broder S, Clark AG, Nadeau J, McKusick VA, Zinder N, Levine AJ, Roberts RJ, Simon M, Slayman C, Hunkapiller M, Bolanos R, Delcher A, Dew I, Fasulo D, Flanigan M, Florea L, Halpern A, Hannenhalli S, Kravitz S, Levy S, Mobarry C, Reinert K, Remington K, Abu-Threideh J, Beasley E, Biddick K, Bonazzi VI, Brandon R, Cargill M, Chandramouliswaran I, Charlab R, Chaturvedi K, Deng Z, Di Francesco VI, Dunn P, Eilbeck K, Evangelista C, Gabrielian AE, Gan W, Ge W, Gong F, Gu Z, Guan P, Heiman TJ, Higgins ME, Ji RR, Ke Z, Ketchum KA, Lai Z, Lei Y, Li Z, Li J, Liang Y, Lin X, Lu F, Merkulov GV, Milshina N, Moore HM, Naik AK, Narayan VA, Neelam B, Nusskern D, Rusch DB, Salzberg S, Shao W, Shue B, Sun J, Wang Z, Wang A, Wang X, Wang J, Wei M, Wides R, Xiao C, Yan C, Yao A, Ye J, Zhan M, Zhang W, Zhang H, Zhao Q, Zheng L, Zhong F, Zhong W, Zhu S, Zhao S, Gilbert D, Baumhueter S, Spier G, Carter C, Cravchik A, Woodage T, Ali F, An H, Awe A, Baldwin D, Baden H, Barnstead M, Barrow I, Beeson K, Busam D, Carver A, Center A, Cheng ML, Curry L, Danaher S, Davenport L, Desilets R, Dietz S, Dodson K, Doup L, Ferriera S, Garg N, Gluecksmann A, Hart B, Haynes J, Haynes C, Heiner C, Hladun S, Hostin D, Houck J, Howland T, Ibegwam C, Johnson J, Kalush F, Kline L, Koduru S, Love A, Mann F, D, McCawley S, McIntosh T, McMullen I, Moy M, Moy L, Murphy B, Nelson K, Pfannkoch C, Pratts E, Puri VI, Qureshi H, Reardon M, Rodriguez R, Rogers YH, Romblad D, Ruhfel B, Scott R, Sitter C, Smallwood M, Stewart E, Strong R, Suh E, Thomas R, Tint NN, Tse S, Vech C, Wang G, Wetter J, Williams S, Williams M, Windsor S, Winn-Deen E, Wolfe K, Zaveri J, Zaveri K, Abril JF, Guigo R, Campbell MJ, Sjolander KV, Karlak B, Kejariwal A, Mi H, Lazareva B, Hatton T, Narechania A, Diemer K, Muruganujan A, Guo N, Sato S, Bafna VI, Istrail S, Lippert R, Schwartz R, Walenz B, Yooseph S, Allen D, Basu A, Baxendale J, Blick L, Caminha M, Carnes-Stine J, Caulk P, Chiang YH, Coyne M, Dahlke C, Mays A, Dombroski M, Donnelly M, Ely D, Esparham S, Fosler C, Gire H, Glanowski S, Glasser K, Glodek A, Gorokhov M, Graham K, Gropman B, Harris M, Heil J, Henderson S, Hoover J, Jennings D, Jordan C, Jordan J, Kasha J, Kagan L, Kraft C, Levitsky A, Lewis M, Liu X, Lopez J, Ma D, Majoros W, McDaniel J, Murphy S, Newman M, Nguyen T, Nguyen N, Nodell M, Pan S, Peck J, Peterson M, Rowe W, Sanders R, Scott J, Simpson M, Smith T, Sprague A, Stockwell T,.Turner R, Venter E, Wang M, Wen M, Wu D, Wu M, Xia A, Zandieh A, Zhu X. The sequence of the human genome. Science. 2001; 291: 1304-1351.
Verra F, Chokejindachai W, Weedall GD, Polley SD, Mwangi TW, Marsh K, Conway DJ. Contrasting sigNatures of selection on the Plasmodium falciparum erythrocyte binding antigen gene family. Mol Biochem Parasitol. 2006; 149: 182-190.
Vitart VI, Biloglav Z, Hayward C, Janicijevic B, Smolej-Narancic N, Barac L, Pericic M, Klaric IM, Skaric-Juric T, Barbalic M, Polasek O, Kolcic I, Carothers A, Rudan P, Hastie N, Wright A, Campbell H, Rudan I. 3000 years of solitude: Extreme differentiation in the island isolates of Dalmatia, Croatia. Eur J Hum Genet. 2006; 14: 478-487.
Vitart VI, Carothers AD, Hayward C, Teague P, Hastie ND, Campbell H, Wright AF. Increased level of linkage disequilibrium in rural compared with urban communities: A factor to consider in association-study design. Am J Hum Genet. 2005; 76: 763-772.
Voight BF, Kudaravalli S, Wen X, Pritchard JK. A map of recent positive selection in the human genome. PLoS Biol. 2006; 4: e72.
von Haeseler A, Sajantila A, Paabo S. The genetical archaeology of the human genome. Nat Genet. 1996; 14: 135-140.
W Wallace MR, Andersen LB, Saulino AM, Gregory PE, Glover TW, Collins FS. A de novo Alu insertion results in
neurofibromatosis type 1. Nature. 1991; 353: 864-866.
Walsh B, Redd AJ, Hammer MF. Joint match probabilities for Y-chromosomal and autosomal markers. Forensic Sci Int. 2007; in Wang H, Lin CH, Service S, Chen Y, Freimer N, Sabatti C; International Collaborative Group on Isolated Populations. Linkage disequilibrium and haplotype homozygosity in population samples genotyped at a high marker density. Hum Hered. 2006; 62: 175-189.
Warburton PE, Waye JS, Willard HF. Nonrandom localization of recombination events in human alpha satellite repeat unit variants: Implications for higher-order structural characteristics within centromeric heterochromatin. Mol Cell Biol. 1993; 13: 6520-6529.
Weinberg W. Über den Nachweis der Vererbung beim Menschen. Jahreshefte des Vereins für vaterländische Naturkunde in Württemberg 1908; 64: 368-382.
Weir BS. Genetic Data Analysis II: Methods for Discrete Population Genetic Data. Sinaur Associates. 1996. 376 pp.
Weir BS, Cockerham CC. Estimating F-statistics for the analysis of population structure. Evolution 1984; 38: 1358-1370.
231
REFERENCES We-Zs
Weiss KM, Smith FH. Out of the veil of death rode the one million! Neandertals and their genes. Bioessays. 2007; 29: 105-110.
Weiss KM. Genetic variation and human disease: Principles and evolutionary approaches. Cambridge University Press, Cambridge, NY (United States) 1993; 354 pp.
Weiss VI. Inbreeding and genetic distance between hierarchically structured populations measured by surname frequencies. Mankind Q. 1980; 21: 135-149.
Weissenbach J, Gyapay G, Dib C, Vignal A, Morissette J, Millasseau P, Vaysseix G, Lathrop M. A second-generation linkage map of the human genome. Nature. 1992; 359: 794-801.
Weismann CG, Gelb BD. The genetics of congenital heart disease: A review of recent developments.Curr Opin Cardiol. 2007; 22: 200-206.
White TD, Asfaw B, DeGusta D, Gilbert H, Richards GD, Suwa G, Howell FC. Pleistocene Homo sapiens from Middle Awash, Ethiopia. Nature. 2003; 423: 742.
Willi Y, Van Buskirk J, Schmid B, Fischer M. Genetic isolation of fragmented populations is exacerbated by drift and selection. J Evol Biol. 2007; 20: 534-542.
Wilson JF, Weale ME, Smith AC, Gratrix F, Fletcher B, Thomas MG, Bradman N, Goldstein DB. Population genetic structure of variable drug response. Nat Genet. 2001; 29: 265-269.
Wittke-Thompson JK, Pluzhnikov A, Cox NJ. Rational inferences about departures from Hardy-Weinberg equilibrium. Am J Hum Genet. 2005; 76: 967-986.
Wright S. Systems of matting. Genetics. 1921; 6: 111-178.
Wright S. Isolation by distance. Genetics. 1943; 28: 114-138.
Wright S. Evolution and the genetics of populations: Variability within and among natural populations. Chicago: Chicago University Press. 1984. 480 pp.
Y Y-Chromosome Consortium. A nomenclature system for the tree of human Y-chromosomal binary haplogroups. Genome
Res. 2002; 12: 339-348.
Yotova V, Labuda D, Zietkiewicz E, Gehl D, Lovell A, Lefebvre JF, Bourgeois S, Lemieux-Blanchard E, Labuda M, Vézina H, Houde L, Tremblay M, Toupance B, Heyer E, Hudson TJ, Laberge C. Anatomy of a founder effect: Myotonic dystrophy in northeastern Quebec. Hum Genet. 2005;117: 177-187.
Z Zei G, Guglielmino Matessi R, Siri E, Moroni A, Cavalli-Sforza LL. Surnames in Sardinia I. Fit of frequency distributions
for neutral alleles and genetic population structure. Ann Hum Genet. 1983; 47: 329-352.
Zerjal T, Dashnyam B, Pandya A, Kayser M, Roewer L, Santos FR, Schiefenhovel W, Fretwell N, Jobling MA, Harihara S, Shimizu K, Semjidmaa D, Sajantila A, Salo P, Crawford MH, Ginter EK, Evgrafov OV, Tyler-Smith C. Genetic relationships of Asians and northern Europeans, revealed by Y-chromosomal DNA analysis. Am J Hum Genet. 1997; 60: 1174-1183.
Zlotogora J. Multiple mutations responsible for frequent genetic diseases in isolated populations. Eur J Hum Genet. 2007; 15: 272-278.
Zschocke J. Phenylketonuria mutations in Europe. Hum Mutat. 2003; 21: 345-356.
Zsurka G, Hampel KG, Kudina T, Kornblum C, Kraytsberg Y, Elger CE, Khrapko K, Kunz WS. Inheritance of mitochondrial DNA recombinants in double-heteroplasmic families: Potential implications for phylogenetic analysis. Am J Hum Genet. 2007; 80: 298-305.
232
233
APPENDIXES
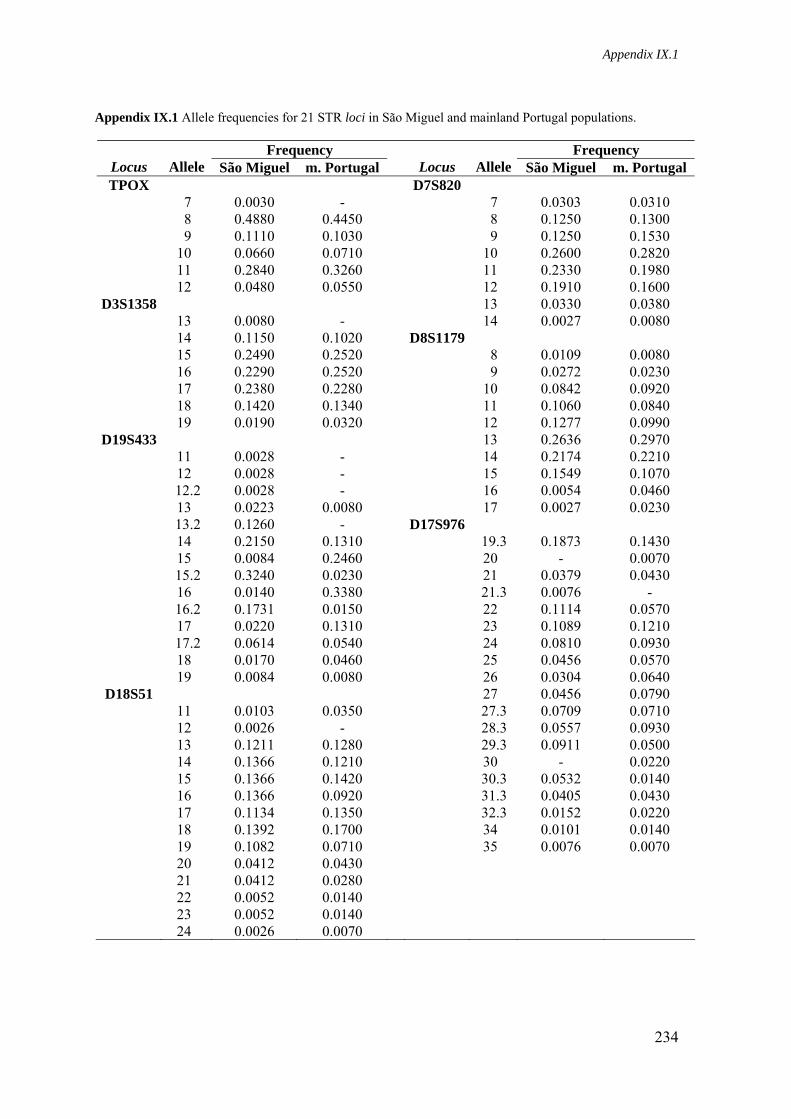
Appendix IX.1
Appendix IX.1 Allele frequencies for 21 STR loci in São Miguel and mainland Portugal populations.
Frequency Frequency Locus Allele São Miguel m. Portugal Locus Allele São Miguel m. Portugal TPOX D7S820
7 0.0030 - 7 0.0303 0.0310 8 0.4880 0.4450 8 0.1250 0.1300 9 0.1110 0.1030 9 0.1250 0.1530 10 0.0660 0.0710 10 0.2600 0.2820 11 0.2840 0.3260 11 0.2330 0.1980 12 0.0480 0.0550 12 0.1910 0.1600
D3S1358 13 0.0330 0.0380 13 0.0080 - 14 0.0027 0.0080 14 0.1150 0.1020 D8S1179 15 0.2490 0.2520 8 0.0109 0.0080 16 0.2290 0.2520 9 0.0272 0.0230 17 0.2380 0.2280 10 0.0842 0.0920 18 0.1420 0.1340 11 0.1060 0.0840 19 0.0190 0.0320 12 0.1277 0.0990
D19S433 13 0.2636 0.2970 11 0.0028 - 14 0.2174 0.2210 12 0.0028 - 15 0.1549 0.1070 12.2 0.0028 - 16 0.0054 0.0460 13 0.0223 0.0080 17 0.0027 0.0230 13.2 0.1260 - D17S976 14 0.2150 0.1310 19.3 0.1873 0.1430 15 0.0084 0.2460 20 - 0.0070 15.2 0.3240 0.0230 21 0.0379 0.0430 16 0.0140 0.3380 21.3 0.0076 - 16.2 0.1731 0.0150 22 0.1114 0.0570 17 0.0220 0.1310 23 0.1089 0.1210 17.2 0.0614 0.0540 24 0.0810 0.0930 18 0.0170 0.0460 25 0.0456 0.0570 19 0.0084 0.0080 26 0.0304 0.0640
D18S51 27 0.0456 0.0790 11 0.0103 0.0350 27.3 0.0709 0.0710 12 0.0026 - 28.3 0.0557 0.0930 13 0.1211 0.1280 29.3 0.0911 0.0500 14 0.1366 0.1210 30 - 0.0220 15 0.1366 0.1420 30.3 0.0532 0.0140 16 0.1366 0.0920 31.3 0.0405 0.0430 17 0.1134 0.1350 32.3 0.0152 0.0220 18 0.1392 0.1700 34 0.0101 0.0140 19 0.1082 0.0710 35 0.0076 0.0070 20 0.0412 0.0430 21 0.0412 0.0280 22 0.0052 0.0140 23 0.0052 0.0140 24 0.0026 0.0070
234
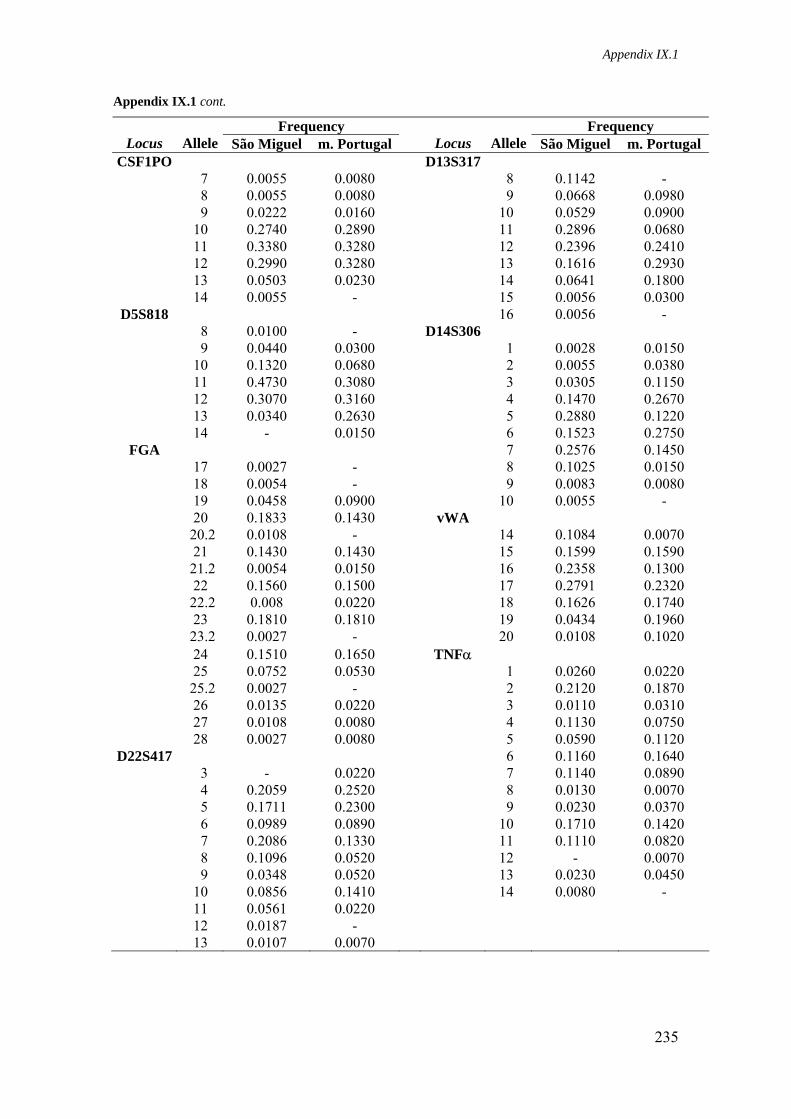
Appendix IX.1
Appendix IX.1 cont.
Frequency Frequency Locus Allele São Miguel m. Portugal Locus Allele São Miguel m. Portugal
CSF1PO D13S317 7 0.0055 0.0080 8 0.1142 - 8 0.0055 0.0080 9 0.0668 0.0980 9 0.0222 0.0160 10 0.0529 0.0900 10 0.2740 0.2890 11 0.2896 0.0680 11 0.3380 0.3280 12 0.2396 0.2410 12 0.2990 0.3280 13 0.1616 0.2930 13 0.0503 0.0230 14 0.0641 0.1800 14 0.0055 - 15 0.0056 0.0300
D5S818 16 0.0056 - 8 0.0100 - D14S306 9 0.0440 0.0300 1 0.0028 0.0150 10 0.1320 0.0680 2 0.0055 0.0380 11 0.4730 0.3080 3 0.0305 0.1150 12 0.3070 0.3160 4 0.1470 0.2670 13 0.0340 0.2630 5 0.2880 0.1220 14 - 0.0150 6 0.1523 0.2750
FGA 7 0.2576 0.1450 17 0.0027 - 8 0.1025 0.0150 18 0.0054 - 9 0.0083 0.0080 19 0.0458 0.0900 10 0.0055 - 20 0.1833 0.1430 vWA 20.2 0.0108 - 14 0.1084 0.0070 21 0.1430 0.1430 15 0.1599 0.1590 21.2 0.0054 0.0150 16 0.2358 0.1300 22 0.1560 0.1500 17 0.2791 0.2320 22.2 0.008 0.0220 18 0.1626 0.1740 23 0.1810 0.1810 19 0.0434 0.1960 23.2 0.0027 - 20 0.0108 0.1020 24 0.1510 0.1650 TNFα 25 0.0752 0.0530 1 0.0260 0.0220 25.2 0.0027 - 2 0.2120 0.1870 26 0.0135 0.0220 3 0.0110 0.0310 27 0.0108 0.0080 4 0.1130 0.0750 28 0.0027 0.0080 5 0.0590 0.1120
D22S417 6 0.1160 0.1640 3 - 0.0220 7 0.1140 0.0890 4 0.2059 0.2520 8 0.0130 0.0070 5 0.1711 0.2300 9 0.0230 0.0370 6 0.0989 0.0890 10 0.1710 0.1420 7 0.2086 0.1330 11 0.1110 0.0820 8 0.1096 0.0520 12 - 0.0070 9 0.0348 0.0520 13 0.0230 0.0450 10 0.0856 0.1410 14 0.0080 - 11 0.0561 0.0220 12 0.0187 - 13 0.0107 0.0070
235
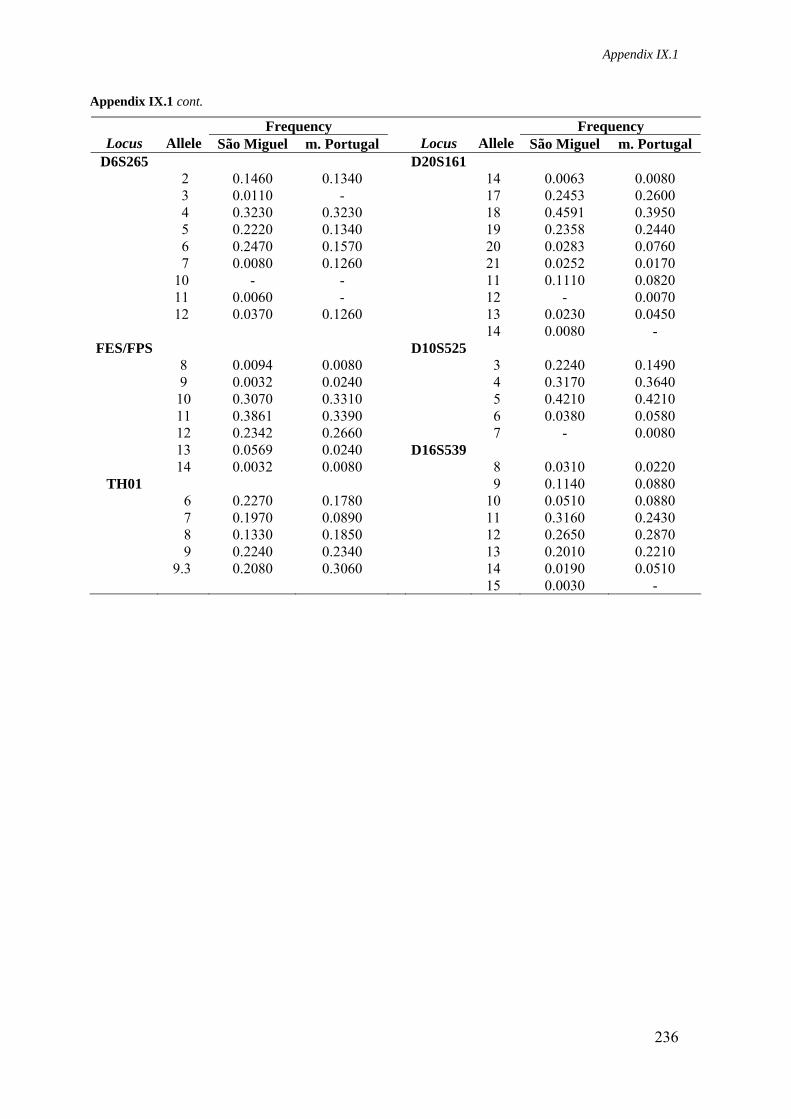
Appendix IX.1
Appendix IX.1 cont.
Frequency Frequency Locus Allele São Miguel m. Portugal Locus Allele São Miguel m. Portugal
D6S265 D20S161 2 0.1460 0.1340 14 0.0063 0.0080 3 0.0110 - 17 0.2453 0.2600 4 0.3230 0.3230 18 0.4591 0.3950 5 0.2220 0.1340 19 0.2358 0.2440 6 0.2470 0.1570 20 0.0283 0.0760 7 0.0080 0.1260 21 0.0252 0.0170 10 - - 11 0.1110 0.0820 11 0.0060 - 12 - 0.0070 12 0.0370 0.1260 13 0.0230 0.0450 14 0.0080 -
FES/FPS D10S525 8 0.0094 0.0080 3 0.2240 0.1490 9 0.0032 0.0240 4 0.3170 0.3640 10 0.3070 0.3310 5 0.4210 0.4210 11 0.3861 0.3390 6 0.0380 0.0580 12 0.2342 0.2660 7 - 0.0080 13 0.0569 0.0240 D16S539 14 0.0032 0.0080 8 0.0310 0.0220
TH01 9 0.1140 0.0880 6 0.2270 0.1780 10 0.0510 0.0880 7 0.1970 0.0890 11 0.3160 0.2430 8 0.1330 0.1850 12 0.2650 0.2870 9 0.2240 0.2340 13 0.2010 0.2210 9.3 0.2080 0.3060 14 0.0190 0.0510 15 0.0030 -
236
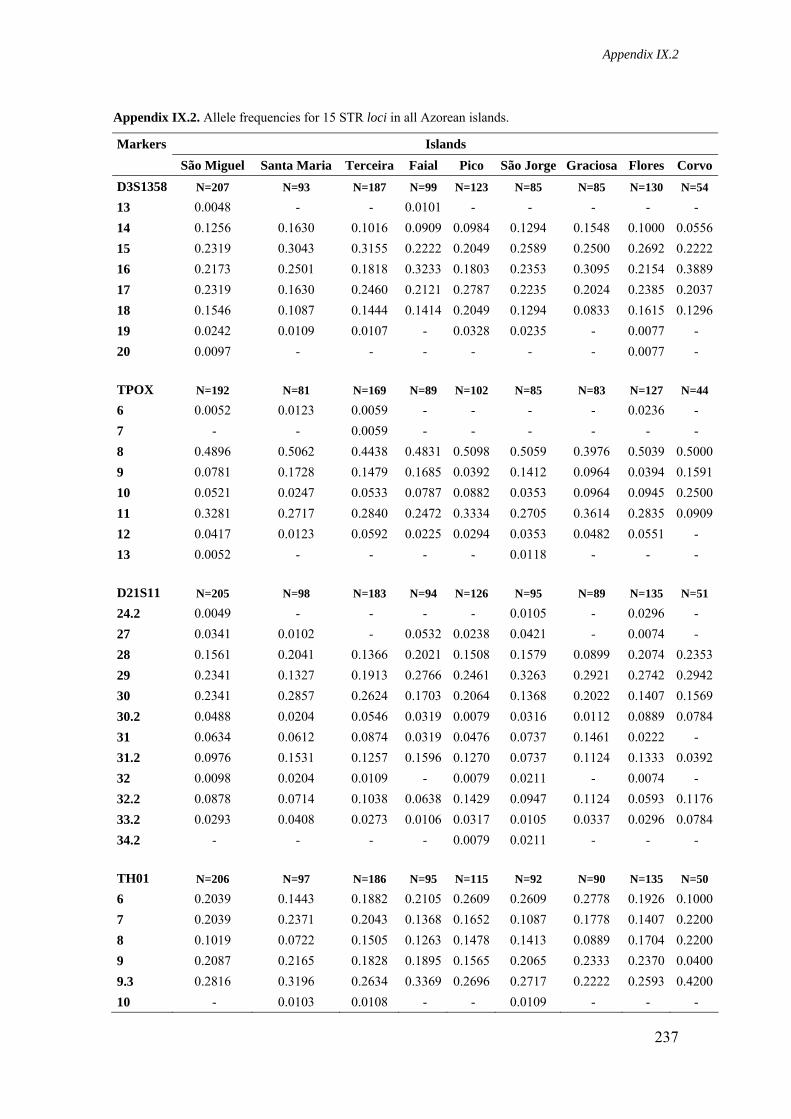
Appendix IX.2
Appendix IX.2. Allele frequencies for 15 STR loci in all Azorean islands.
Markers Islands São Miguel Santa Maria Terceira Faial Pico São Jorge Graciosa Flores CorvoD3S1358 N=207 N=93 N=187 N=99 N=123 N=85 N=85 N=130 N=54
13 0.0048 - - 0.0101 - - - - - 14 0.1256 0.1630 0.1016 0.0909 0.0984 0.1294 0.1548 0.1000 0.055615 0.2319 0.3043 0.3155 0.2222 0.2049 0.2589 0.2500 0.2692 0.222216 0.2173 0.2501 0.1818 0.3233 0.1803 0.2353 0.3095 0.2154 0.388917 0.2319 0.1630 0.2460 0.2121 0.2787 0.2235 0.2024 0.2385 0.203718 0.1546 0.1087 0.1444 0.1414 0.2049 0.1294 0.0833 0.1615 0.129619 0.0242 0.0109 0.0107 - 0.0328 0.0235 - 0.0077 - 20 0.0097 - - - - - - 0.0077 -
TPOX N=192 N=81 N=169 N=89 N=102 N=85 N=83 N=127 N=44
6 0.0052 0.0123 0.0059 - - - - 0.0236 - 7 - - 0.0059 - - - - - - 8 0.4896 0.5062 0.4438 0.4831 0.5098 0.5059 0.3976 0.5039 0.50009 0.0781 0.1728 0.1479 0.1685 0.0392 0.1412 0.0964 0.0394 0.159110 0.0521 0.0247 0.0533 0.0787 0.0882 0.0353 0.0964 0.0945 0.250011 0.3281 0.2717 0.2840 0.2472 0.3334 0.2705 0.3614 0.2835 0.090912 0.0417 0.0123 0.0592 0.0225 0.0294 0.0353 0.0482 0.0551 - 13 0.0052 - - - - 0.0118 - - -
D21S11 N=205 N=98 N=183 N=94 N=126 N=95 N=89 N=135 N=51
24.2 0.0049 - - - - 0.0105 - 0.0296 - 27 0.0341 0.0102 - 0.0532 0.0238 0.0421 - 0.0074 - 28 0.1561 0.2041 0.1366 0.2021 0.1508 0.1579 0.0899 0.2074 0.235329 0.2341 0.1327 0.1913 0.2766 0.2461 0.3263 0.2921 0.2742 0.294230 0.2341 0.2857 0.2624 0.1703 0.2064 0.1368 0.2022 0.1407 0.156930.2 0.0488 0.0204 0.0546 0.0319 0.0079 0.0316 0.0112 0.0889 0.078431 0.0634 0.0612 0.0874 0.0319 0.0476 0.0737 0.1461 0.0222 - 31.2 0.0976 0.1531 0.1257 0.1596 0.1270 0.0737 0.1124 0.1333 0.039232 0.0098 0.0204 0.0109 - 0.0079 0.0211 - 0.0074 - 32.2 0.0878 0.0714 0.1038 0.0638 0.1429 0.0947 0.1124 0.0593 0.117633.2 0.0293 0.0408 0.0273 0.0106 0.0317 0.0105 0.0337 0.0296 0.078434.2 - - - - 0.0079 0.0211 - - -
TH01 N=206 N=97 N=186 N=95 N=115 N=92 N=90 N=135 N=50
6 0.2039 0.1443 0.1882 0.2105 0.2609 0.2609 0.2778 0.1926 0.10007 0.2039 0.2371 0.2043 0.1368 0.1652 0.1087 0.1778 0.1407 0.22008 0.1019 0.0722 0.1505 0.1263 0.1478 0.1413 0.0889 0.1704 0.22009 0.2087 0.2165 0.1828 0.1895 0.1565 0.2065 0.2333 0.2370 0.04009.3 0.2816 0.3196 0.2634 0.3369 0.2696 0.2717 0.2222 0.2593 0.420010 - 0.0103 0.0108 - - 0.0109 - - -
237
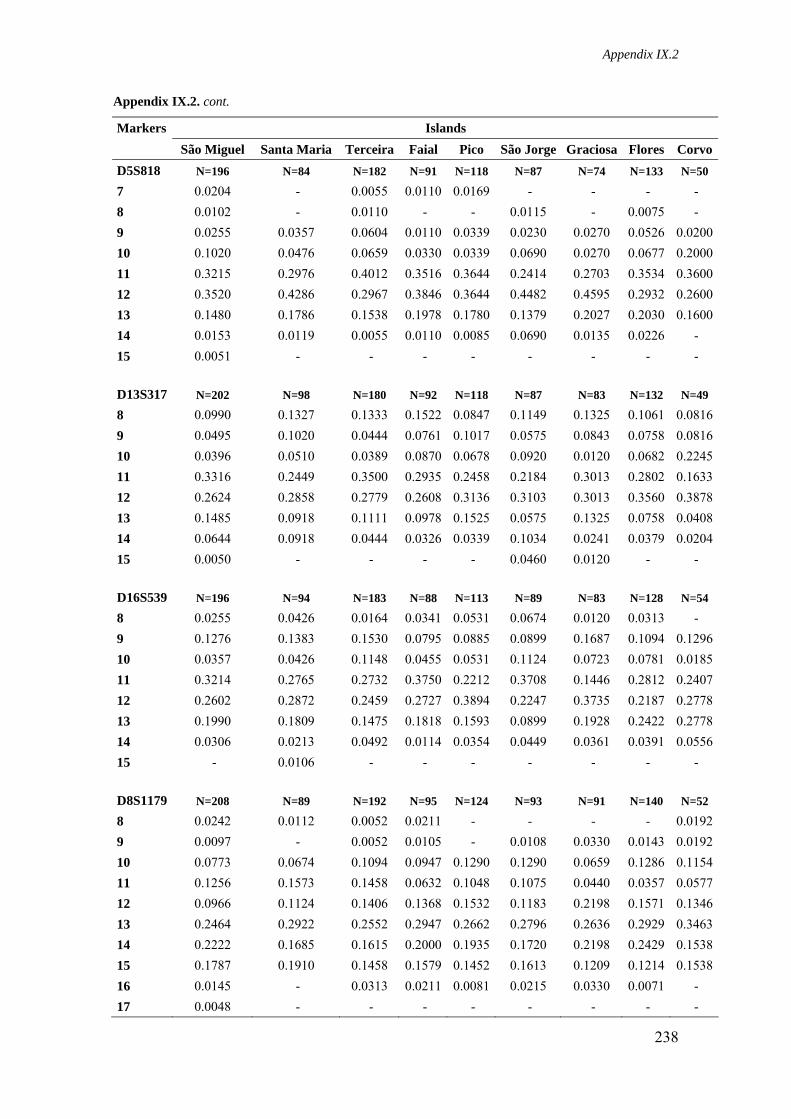
Appendix IX.2
Appendix IX.2. cont.
Markers Islands São Miguel Santa Maria Terceira Faial Pico São Jorge Graciosa Flores CorvoD5S818 N=196 N=84 N=182 N=91 N=118 N=87 N=74 N=133 N=50
7 0.0204 - 0.0055 0.0110 0.0169 - - - - 8 0.0102 - 0.0110 - - 0.0115 - 0.0075 - 9 0.0255 0.0357 0.0604 0.0110 0.0339 0.0230 0.0270 0.0526 0.020010 0.1020 0.0476 0.0659 0.0330 0.0339 0.0690 0.0270 0.0677 0.200011 0.3215 0.2976 0.4012 0.3516 0.3644 0.2414 0.2703 0.3534 0.360012 0.3520 0.4286 0.2967 0.3846 0.3644 0.4482 0.4595 0.2932 0.260013 0.1480 0.1786 0.1538 0.1978 0.1780 0.1379 0.2027 0.2030 0.160014 0.0153 0.0119 0.0055 0.0110 0.0085 0.0690 0.0135 0.0226 - 15 0.0051 - - - - - - - -
D13S317 N=202 N=98 N=180 N=92 N=118 N=87 N=83 N=132 N=49
8 0.0990 0.1327 0.1333 0.1522 0.0847 0.1149 0.1325 0.1061 0.08169 0.0495 0.1020 0.0444 0.0761 0.1017 0.0575 0.0843 0.0758 0.081610 0.0396 0.0510 0.0389 0.0870 0.0678 0.0920 0.0120 0.0682 0.224511 0.3316 0.2449 0.3500 0.2935 0.2458 0.2184 0.3013 0.2802 0.163312 0.2624 0.2858 0.2779 0.2608 0.3136 0.3103 0.3013 0.3560 0.387813 0.1485 0.0918 0.1111 0.0978 0.1525 0.0575 0.1325 0.0758 0.040814 0.0644 0.0918 0.0444 0.0326 0.0339 0.1034 0.0241 0.0379 0.020415 0.0050 - - - - 0.0460 0.0120 - -
D16S539 N=196 N=94 N=183 N=88 N=113 N=89 N=83 N=128 N=54
8 0.0255 0.0426 0.0164 0.0341 0.0531 0.0674 0.0120 0.0313 - 9 0.1276 0.1383 0.1530 0.0795 0.0885 0.0899 0.1687 0.1094 0.129610 0.0357 0.0426 0.1148 0.0455 0.0531 0.1124 0.0723 0.0781 0.018511 0.3214 0.2765 0.2732 0.3750 0.2212 0.3708 0.1446 0.2812 0.240712 0.2602 0.2872 0.2459 0.2727 0.3894 0.2247 0.3735 0.2187 0.277813 0.1990 0.1809 0.1475 0.1818 0.1593 0.0899 0.1928 0.2422 0.277814 0.0306 0.0213 0.0492 0.0114 0.0354 0.0449 0.0361 0.0391 0.055615 - 0.0106 - - - - - - -
D8S1179 N=208 N=89 N=192 N=95 N=124 N=93 N=91 N=140 N=52
8 0.0242 0.0112 0.0052 0.0211 - - - - 0.01929 0.0097 - 0.0052 0.0105 - 0.0108 0.0330 0.0143 0.019210 0.0773 0.0674 0.1094 0.0947 0.1290 0.1290 0.0659 0.1286 0.115411 0.1256 0.1573 0.1458 0.0632 0.1048 0.1075 0.0440 0.0357 0.057712 0.0966 0.1124 0.1406 0.1368 0.1532 0.1183 0.2198 0.1571 0.134613 0.2464 0.2922 0.2552 0.2947 0.2662 0.2796 0.2636 0.2929 0.346314 0.2222 0.1685 0.1615 0.2000 0.1935 0.1720 0.2198 0.2429 0.153815 0.1787 0.1910 0.1458 0.1579 0.1452 0.1613 0.1209 0.1214 0.153816 0.0145 - 0.0313 0.0211 0.0081 0.0215 0.0330 0.0071 - 17 0.0048 - - - - - - - -
238
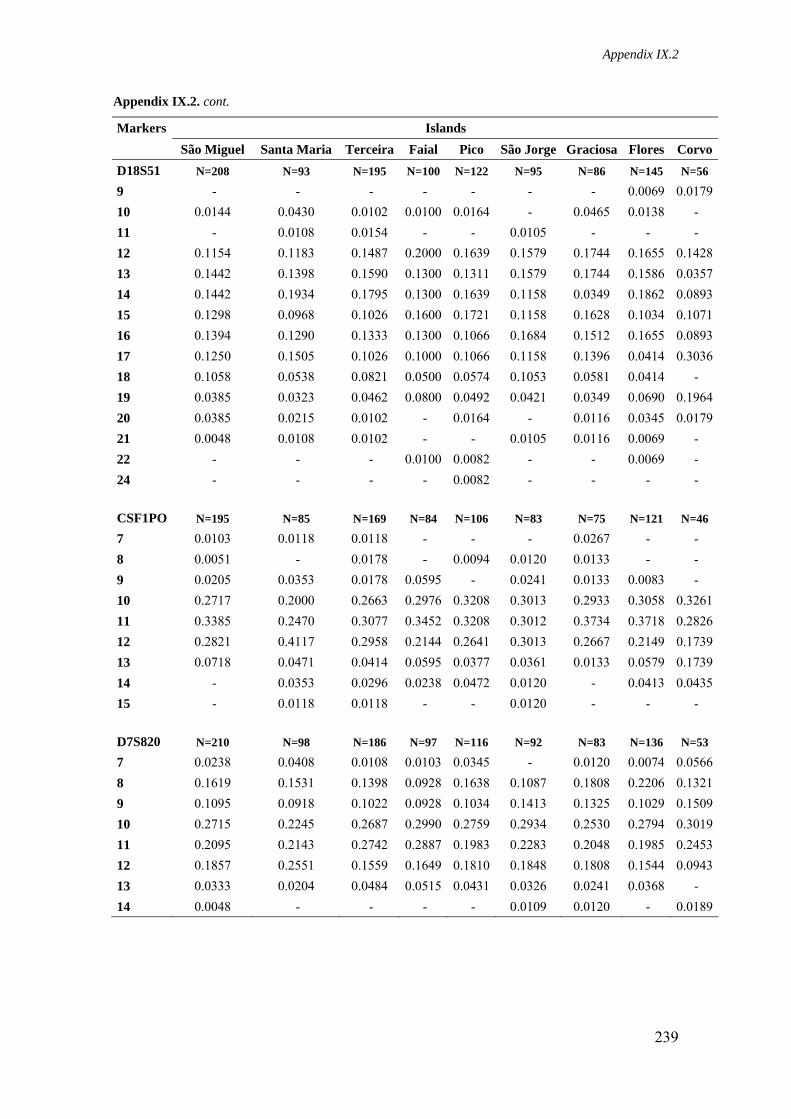
Appendix IX.2
Appendix IX.2. cont.
Markers Islands São Miguel Santa Maria Terceira Faial Pico São Jorge Graciosa Flores CorvoD18S51 N=208 N=93 N=195 N=100 N=122 N=95 N=86 N=145 N=56
9 - - - - - - - 0.0069 0.017910 0.0144 0.0430 0.0102 0.0100 0.0164 - 0.0465 0.0138 - 11 - 0.0108 0.0154 - - 0.0105 - - - 12 0.1154 0.1183 0.1487 0.2000 0.1639 0.1579 0.1744 0.1655 0.142813 0.1442 0.1398 0.1590 0.1300 0.1311 0.1579 0.1744 0.1586 0.035714 0.1442 0.1934 0.1795 0.1300 0.1639 0.1158 0.0349 0.1862 0.089315 0.1298 0.0968 0.1026 0.1600 0.1721 0.1158 0.1628 0.1034 0.107116 0.1394 0.1290 0.1333 0.1300 0.1066 0.1684 0.1512 0.1655 0.089317 0.1250 0.1505 0.1026 0.1000 0.1066 0.1158 0.1396 0.0414 0.303618 0.1058 0.0538 0.0821 0.0500 0.0574 0.1053 0.0581 0.0414 - 19 0.0385 0.0323 0.0462 0.0800 0.0492 0.0421 0.0349 0.0690 0.196420 0.0385 0.0215 0.0102 - 0.0164 - 0.0116 0.0345 0.017921 0.0048 0.0108 0.0102 - - 0.0105 0.0116 0.0069 - 22 - - - 0.0100 0.0082 - - 0.0069 - 24 - - - - 0.0082 - - - -
CSF1PO N=195 N=85 N=169 N=84 N=106 N=83 N=75 N=121 N=46
7 0.0103 0.0118 0.0118 - - - 0.0267 - - 8 0.0051 - 0.0178 - 0.0094 0.0120 0.0133 - - 9 0.0205 0.0353 0.0178 0.0595 - 0.0241 0.0133 0.0083 - 10 0.2717 0.2000 0.2663 0.2976 0.3208 0.3013 0.2933 0.3058 0.326111 0.3385 0.2470 0.3077 0.3452 0.3208 0.3012 0.3734 0.3718 0.282612 0.2821 0.4117 0.2958 0.2144 0.2641 0.3013 0.2667 0.2149 0.173913 0.0718 0.0471 0.0414 0.0595 0.0377 0.0361 0.0133 0.0579 0.173914 - 0.0353 0.0296 0.0238 0.0472 0.0120 - 0.0413 0.043515 - 0.0118 0.0118 - - 0.0120 - - -
D7S820 N=210 N=98 N=186 N=97 N=116 N=92 N=83 N=136 N=53
7 0.0238 0.0408 0.0108 0.0103 0.0345 - 0.0120 0.0074 0.05668 0.1619 0.1531 0.1398 0.0928 0.1638 0.1087 0.1808 0.2206 0.13219 0.1095 0.0918 0.1022 0.0928 0.1034 0.1413 0.1325 0.1029 0.150910 0.2715 0.2245 0.2687 0.2990 0.2759 0.2934 0.2530 0.2794 0.301911 0.2095 0.2143 0.2742 0.2887 0.1983 0.2283 0.2048 0.1985 0.245312 0.1857 0.2551 0.1559 0.1649 0.1810 0.1848 0.1808 0.1544 0.094313 0.0333 0.0204 0.0484 0.0515 0.0431 0.0326 0.0241 0.0368 - 14 0.0048 - - - - 0.0109 0.0120 - 0.0189
239
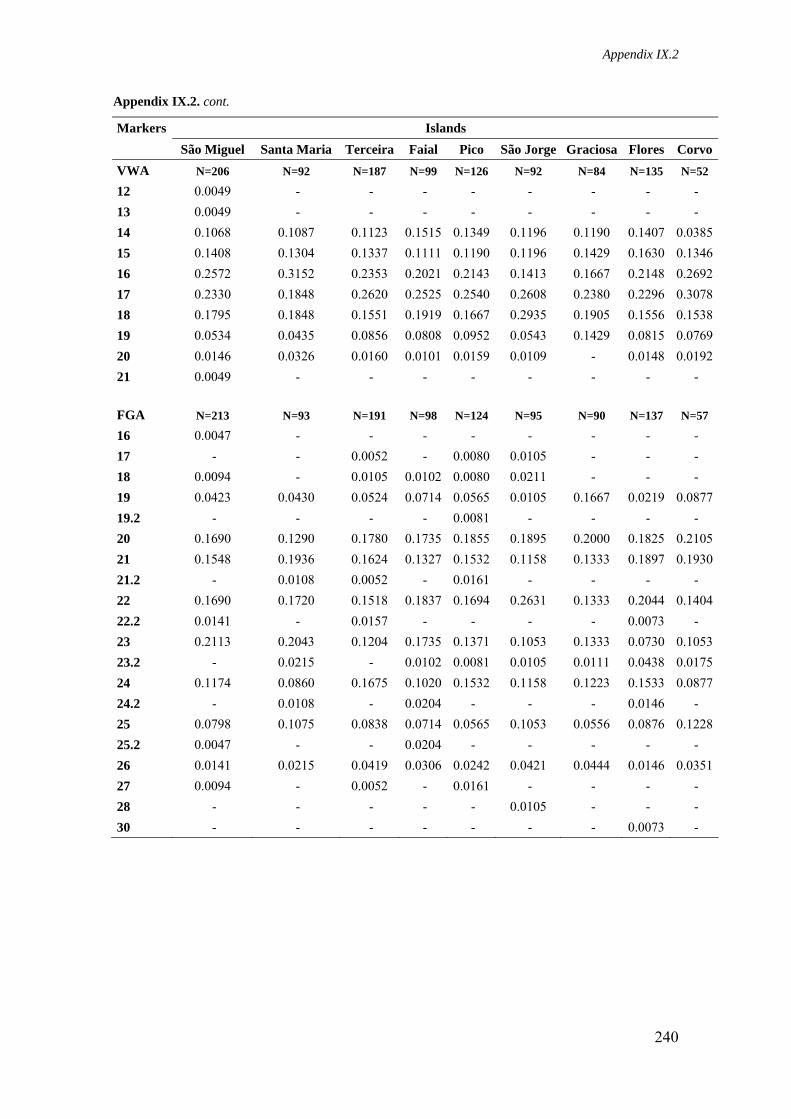
Appendix IX.2
Appendix IX.2. cont.
Markers Islands São Miguel Santa Maria Terceira Faial Pico São Jorge Graciosa Flores CorvoVWA N=206 N=92 N=187 N=99 N=126 N=92 N=84 N=135 N=52
12 0.0049 - - - - - - - - 13 0.0049 - - - - - - - - 14 0.1068 0.1087 0.1123 0.1515 0.1349 0.1196 0.1190 0.1407 0.038515 0.1408 0.1304 0.1337 0.1111 0.1190 0.1196 0.1429 0.1630 0.134616 0.2572 0.3152 0.2353 0.2021 0.2143 0.1413 0.1667 0.2148 0.269217 0.2330 0.1848 0.2620 0.2525 0.2540 0.2608 0.2380 0.2296 0.307818 0.1795 0.1848 0.1551 0.1919 0.1667 0.2935 0.1905 0.1556 0.153819 0.0534 0.0435 0.0856 0.0808 0.0952 0.0543 0.1429 0.0815 0.076920 0.0146 0.0326 0.0160 0.0101 0.0159 0.0109 - 0.0148 0.019221 0.0049 - - - - - - - -
FGA N=213 N=93 N=191 N=98 N=124 N=95 N=90 N=137 N=57
16 0.0047 - - - - - - - - 17 - - 0.0052 - 0.0080 0.0105 - - - 18 0.0094 - 0.0105 0.0102 0.0080 0.0211 - - - 19 0.0423 0.0430 0.0524 0.0714 0.0565 0.0105 0.1667 0.0219 0.087719.2 - - - - 0.0081 - - - - 20 0.1690 0.1290 0.1780 0.1735 0.1855 0.1895 0.2000 0.1825 0.210521 0.1548 0.1936 0.1624 0.1327 0.1532 0.1158 0.1333 0.1897 0.193021.2 - 0.0108 0.0052 - 0.0161 - - - - 22 0.1690 0.1720 0.1518 0.1837 0.1694 0.2631 0.1333 0.2044 0.140422.2 0.0141 - 0.0157 - - - - 0.0073 - 23 0.2113 0.2043 0.1204 0.1735 0.1371 0.1053 0.1333 0.0730 0.105323.2 - 0.0215 - 0.0102 0.0081 0.0105 0.0111 0.0438 0.017524 0.1174 0.0860 0.1675 0.1020 0.1532 0.1158 0.1223 0.1533 0.087724.2 - 0.0108 - 0.0204 - - - 0.0146 - 25 0.0798 0.1075 0.0838 0.0714 0.0565 0.1053 0.0556 0.0876 0.122825.2 0.0047 - - 0.0204 - - - - - 26 0.0141 0.0215 0.0419 0.0306 0.0242 0.0421 0.0444 0.0146 0.035127 0.0094 - 0.0052 - 0.0161 - - - - 28 - - - - - 0.0105 - - - 30 - - - - - - - 0.0073 -
240
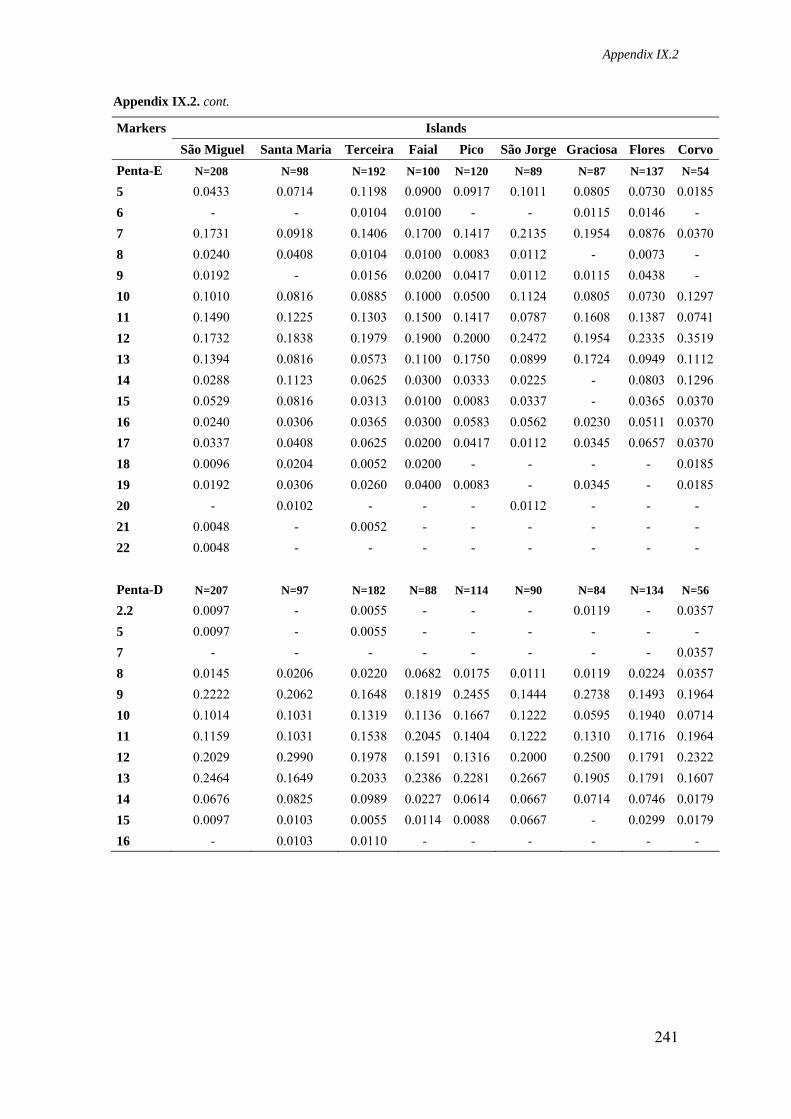
Appendix IX.2
Appendix IX.2. cont.
Markers Islands São Miguel Santa Maria Terceira Faial Pico São Jorge Graciosa Flores CorvoPenta-E N=208 N=98 N=192 N=100 N=120 N=89 N=87 N=137 N=54
5 0.0433 0.0714 0.1198 0.0900 0.0917 0.1011 0.0805 0.0730 0.01856 - - 0.0104 0.0100 - - 0.0115 0.0146 - 7 0.1731 0.0918 0.1406 0.1700 0.1417 0.2135 0.1954 0.0876 0.03708 0.0240 0.0408 0.0104 0.0100 0.0083 0.0112 - 0.0073 - 9 0.0192 - 0.0156 0.0200 0.0417 0.0112 0.0115 0.0438 - 10 0.1010 0.0816 0.0885 0.1000 0.0500 0.1124 0.0805 0.0730 0.129711 0.1490 0.1225 0.1303 0.1500 0.1417 0.0787 0.1608 0.1387 0.074112 0.1732 0.1838 0.1979 0.1900 0.2000 0.2472 0.1954 0.2335 0.351913 0.1394 0.0816 0.0573 0.1100 0.1750 0.0899 0.1724 0.0949 0.111214 0.0288 0.1123 0.0625 0.0300 0.0333 0.0225 - 0.0803 0.129615 0.0529 0.0816 0.0313 0.0100 0.0083 0.0337 - 0.0365 0.037016 0.0240 0.0306 0.0365 0.0300 0.0583 0.0562 0.0230 0.0511 0.037017 0.0337 0.0408 0.0625 0.0200 0.0417 0.0112 0.0345 0.0657 0.037018 0.0096 0.0204 0.0052 0.0200 - - - - 0.018519 0.0192 0.0306 0.0260 0.0400 0.0083 - 0.0345 - 0.018520 - 0.0102 - - - 0.0112 - - - 21 0.0048 - 0.0052 - - - - - - 22 0.0048 - - - - - - - -
Penta-D N=207 N=97 N=182 N=88 N=114 N=90 N=84 N=134 N=56
2.2 0.0097 - 0.0055 - - - 0.0119 - 0.03575 0.0097 - 0.0055 - - - - - - 7 - - - - - - - - 0.03578 0.0145 0.0206 0.0220 0.0682 0.0175 0.0111 0.0119 0.0224 0.03579 0.2222 0.2062 0.1648 0.1819 0.2455 0.1444 0.2738 0.1493 0.196410 0.1014 0.1031 0.1319 0.1136 0.1667 0.1222 0.0595 0.1940 0.071411 0.1159 0.1031 0.1538 0.2045 0.1404 0.1222 0.1310 0.1716 0.196412 0.2029 0.2990 0.1978 0.1591 0.1316 0.2000 0.2500 0.1791 0.232213 0.2464 0.1649 0.2033 0.2386 0.2281 0.2667 0.1905 0.1791 0.160714 0.0676 0.0825 0.0989 0.0227 0.0614 0.0667 0.0714 0.0746 0.017915 0.0097 0.0103 0.0055 0.0114 0.0088 0.0667 - 0.0299 0.017916 - 0.0103 0.0110 - - - - - -
241
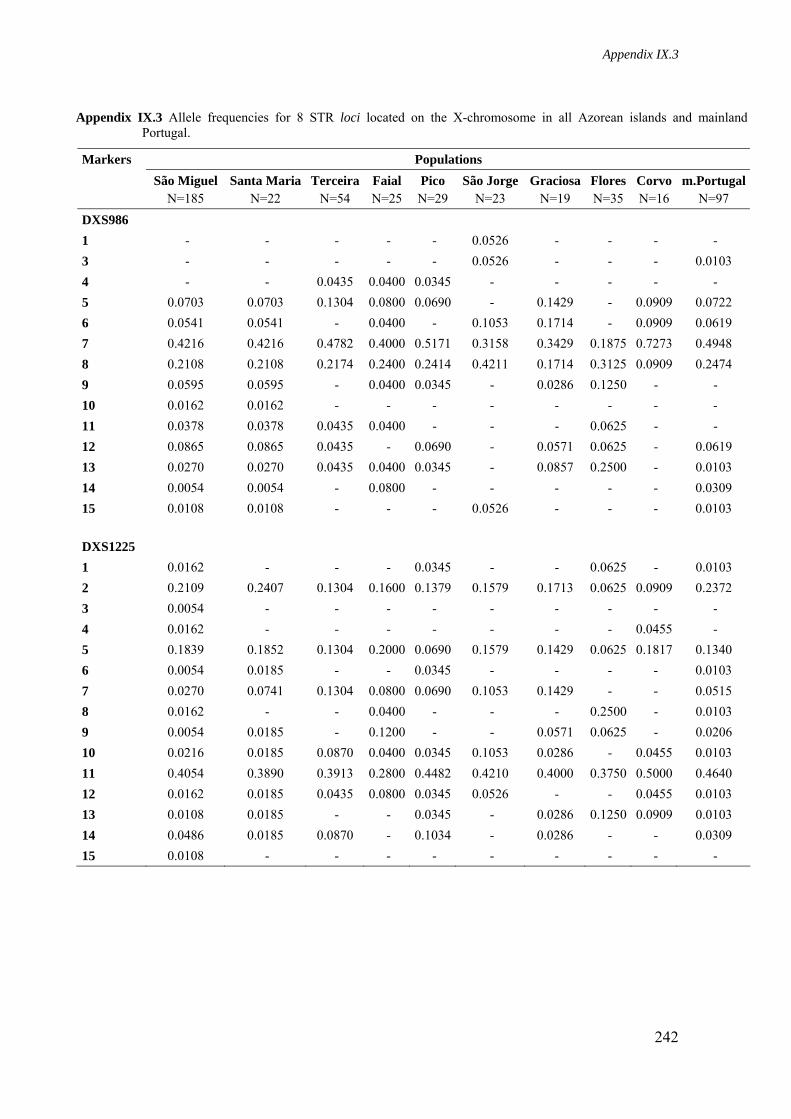
Appendix IX.3
Appendix IX.3 Allele frequencies for 8 STR loci located on the X-chromosome in all Azorean islands and mainland Portugal.
Markers Populations
São Miguel
N=185 Santa Maria
N=22 Terceira
N=54 Faial N=25
Pico N=29
São JorgeN=23
Graciosa N=19
Flores N=35
CorvoN=16
m.PortugalN=97
DXS986 1 - - - - - 0.0526 - - - - 3 - - - - - 0.0526 - - - 0.0103 4 - - 0.0435 0.0400 0.0345 - - - - - 5 0.0703 0.0703 0.1304 0.0800 0.0690 - 0.1429 - 0.0909 0.0722 6 0.0541 0.0541 - 0.0400 - 0.1053 0.1714 - 0.0909 0.0619 7 0.4216 0.4216 0.4782 0.4000 0.5171 0.3158 0.3429 0.1875 0.7273 0.4948 8 0.2108 0.2108 0.2174 0.2400 0.2414 0.4211 0.1714 0.3125 0.0909 0.2474 9 0.0595 0.0595 - 0.0400 0.0345 - 0.0286 0.1250 - - 10 0.0162 0.0162 - - - - - - - - 11 0.0378 0.0378 0.0435 0.0400 - - - 0.0625 - - 12 0.0865 0.0865 0.0435 - 0.0690 - 0.0571 0.0625 - 0.0619 13 0.0270 0.0270 0.0435 0.0400 0.0345 - 0.0857 0.2500 - 0.0103 14 0.0054 0.0054 - 0.0800 - - - - - 0.0309 15 0.0108 0.0108 - - - 0.0526 - - - 0.0103
DXS1225 1 0.0162 - - - 0.0345 - - 0.0625 - 0.0103 2 0.2109 0.2407 0.1304 0.1600 0.1379 0.1579 0.1713 0.0625 0.0909 0.2372 3 0.0054 - - - - - - - - - 4 0.0162 - - - - - - - 0.0455 - 5 0.1839 0.1852 0.1304 0.2000 0.0690 0.1579 0.1429 0.0625 0.1817 0.1340 6 0.0054 0.0185 - - 0.0345 - - - - 0.0103 7 0.0270 0.0741 0.1304 0.0800 0.0690 0.1053 0.1429 - - 0.0515 8 0.0162 - - 0.0400 - - - 0.2500 - 0.0103 9 0.0054 0.0185 - 0.1200 - - 0.0571 0.0625 - 0.0206 10 0.0216 0.0185 0.0870 0.0400 0.0345 0.1053 0.0286 - 0.0455 0.0103 11 0.4054 0.3890 0.3913 0.2800 0.4482 0.4210 0.4000 0.3750 0.5000 0.4640 12 0.0162 0.0185 0.0435 0.0800 0.0345 0.0526 - - 0.0455 0.0103 13 0.0108 0.0185 - - 0.0345 - 0.0286 0.1250 0.0909 0.0103 14 0.0486 0.0185 0.0870 - 0.1034 - 0.0286 - - 0.0309 15 0.0108 - - - - - - - - -
242
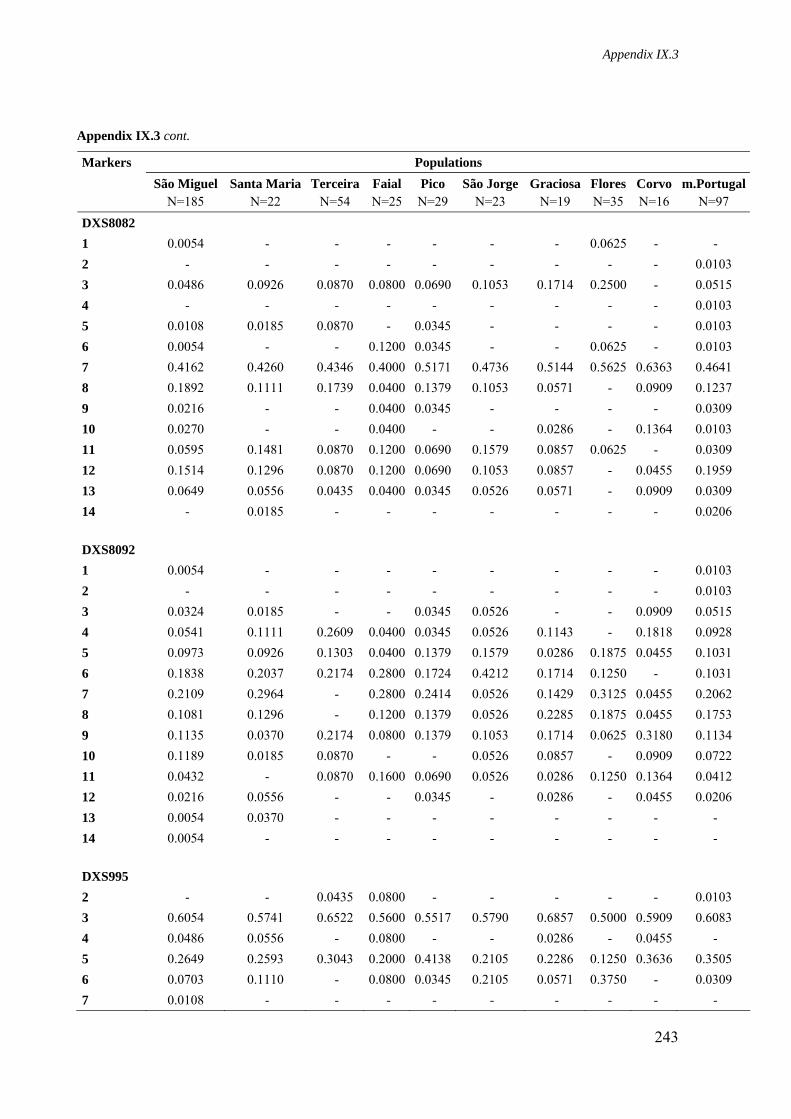
Appendix IX.3
Appendix IX.3 cont.
Markers Populations
São Miguel
N=185 Santa Maria
N=22 Terceira
N=54 Faial N=25
Pico N=29
São JorgeN=23
Graciosa N=19
Flores N=35
CorvoN=16
m.PortugalN=97
DXS8082 1 0.0054 - - - - - - 0.0625 - - 2 - - - - - - - - - 0.0103 3 0.0486 0.0926 0.0870 0.0800 0.0690 0.1053 0.1714 0.2500 - 0.0515 4 - - - - - - - - - 0.0103 5 0.0108 0.0185 0.0870 - 0.0345 - - - - 0.0103 6 0.0054 - - 0.1200 0.0345 - - 0.0625 - 0.0103 7 0.4162 0.4260 0.4346 0.4000 0.5171 0.4736 0.5144 0.5625 0.6363 0.4641 8 0.1892 0.1111 0.1739 0.0400 0.1379 0.1053 0.0571 - 0.0909 0.1237 9 0.0216 - - 0.0400 0.0345 - - - - 0.0309 10 0.0270 - - 0.0400 - - 0.0286 - 0.1364 0.0103 11 0.0595 0.1481 0.0870 0.1200 0.0690 0.1579 0.0857 0.0625 - 0.0309 12 0.1514 0.1296 0.0870 0.1200 0.0690 0.1053 0.0857 - 0.0455 0.1959 13 0.0649 0.0556 0.0435 0.0400 0.0345 0.0526 0.0571 - 0.0909 0.0309 14 - 0.0185 - - - - - - - 0.0206
DXS8092 1 0.0054 - - - - - - - - 0.0103 2 - - - - - - - - - 0.0103 3 0.0324 0.0185 - - 0.0345 0.0526 - - 0.0909 0.0515 4 0.0541 0.1111 0.2609 0.0400 0.0345 0.0526 0.1143 - 0.1818 0.0928 5 0.0973 0.0926 0.1303 0.0400 0.1379 0.1579 0.0286 0.1875 0.0455 0.1031 6 0.1838 0.2037 0.2174 0.2800 0.1724 0.4212 0.1714 0.1250 - 0.1031 7 0.2109 0.2964 - 0.2800 0.2414 0.0526 0.1429 0.3125 0.0455 0.2062 8 0.1081 0.1296 - 0.1200 0.1379 0.0526 0.2285 0.1875 0.0455 0.1753 9 0.1135 0.0370 0.2174 0.0800 0.1379 0.1053 0.1714 0.0625 0.3180 0.1134 10 0.1189 0.0185 0.0870 - - 0.0526 0.0857 - 0.0909 0.0722 11 0.0432 - 0.0870 0.1600 0.0690 0.0526 0.0286 0.1250 0.1364 0.0412 12 0.0216 0.0556 - - 0.0345 - 0.0286 - 0.0455 0.0206 13 0.0054 0.0370 - - - - - - - - 14 0.0054 - - - - - - - - -
DXS995 2 - - 0.0435 0.0800 - - - - - 0.0103 3 0.6054 0.5741 0.6522 0.5600 0.5517 0.5790 0.6857 0.5000 0.5909 0.6083 4 0.0486 0.0556 - 0.0800 - - 0.0286 - 0.0455 - 5 0.2649 0.2593 0.3043 0.2000 0.4138 0.2105 0.2286 0.1250 0.3636 0.3505 6 0.0703 0.1110 - 0.0800 0.0345 0.2105 0.0571 0.3750 - 0.0309 7 0.0108 - - - - - - - - -
243
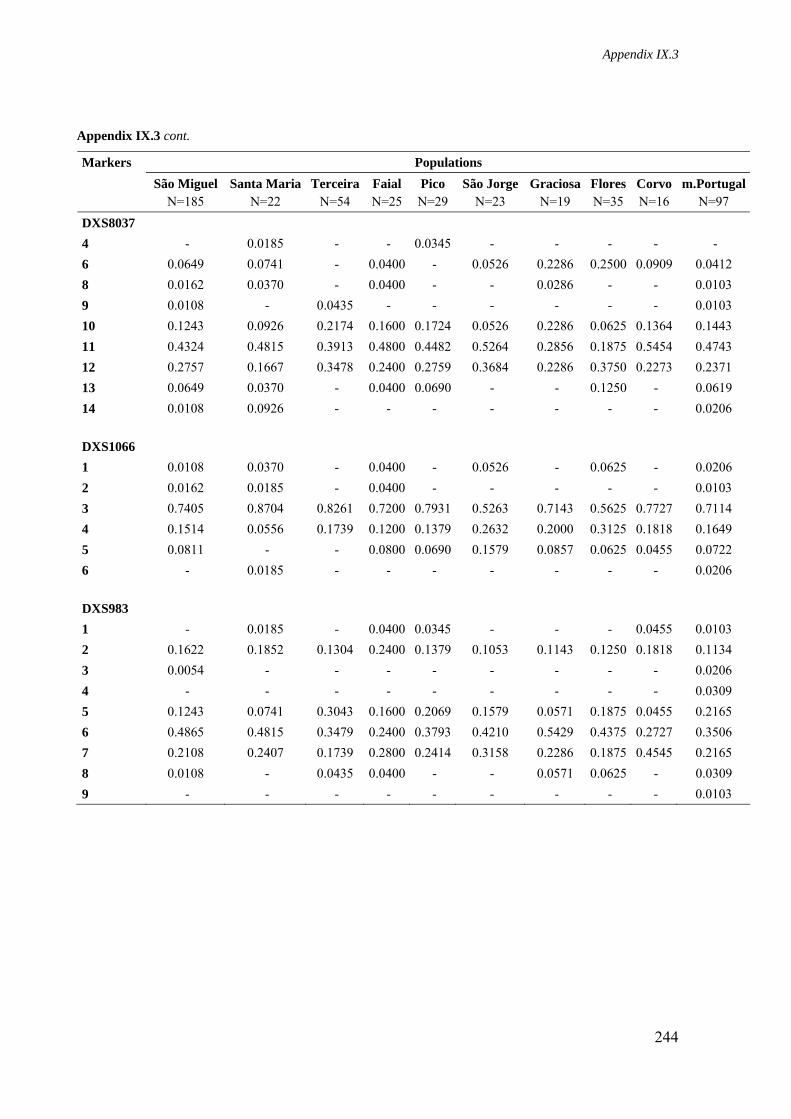
Appendix IX.3
Appendix IX.3 cont.
Markers Populations
São Miguel
N=185 Santa Maria
N=22 Terceira
N=54 Faial N=25
Pico N=29
São JorgeN=23
Graciosa N=19
Flores N=35
CorvoN=16
m.PortugalN=97
DXS8037 4 - 0.0185 - - 0.0345 - - - - - 6 0.0649 0.0741 - 0.0400 - 0.0526 0.2286 0.2500 0.0909 0.0412 8 0.0162 0.0370 - 0.0400 - - 0.0286 - - 0.0103 9 0.0108 - 0.0435 - - - - - - 0.0103 10 0.1243 0.0926 0.2174 0.1600 0.1724 0.0526 0.2286 0.0625 0.1364 0.1443 11 0.4324 0.4815 0.3913 0.4800 0.4482 0.5264 0.2856 0.1875 0.5454 0.4743 12 0.2757 0.1667 0.3478 0.2400 0.2759 0.3684 0.2286 0.3750 0.2273 0.2371 13 0.0649 0.0370 - 0.0400 0.0690 - - 0.1250 - 0.0619 14 0.0108 0.0926 - - - - - - - 0.0206
DXS1066 1 0.0108 0.0370 - 0.0400 - 0.0526 - 0.0625 - 0.0206 2 0.0162 0.0185 - 0.0400 - - - - - 0.0103 3 0.7405 0.8704 0.8261 0.7200 0.7931 0.5263 0.7143 0.5625 0.7727 0.7114 4 0.1514 0.0556 0.1739 0.1200 0.1379 0.2632 0.2000 0.3125 0.1818 0.1649 5 0.0811 - - 0.0800 0.0690 0.1579 0.0857 0.0625 0.0455 0.0722 6 - 0.0185 - - - - - - - 0.0206
DXS983 1 - 0.0185 - 0.0400 0.0345 - - - 0.0455 0.0103 2 0.1622 0.1852 0.1304 0.2400 0.1379 0.1053 0.1143 0.1250 0.1818 0.1134 3 0.0054 - - - - - - - - 0.0206 4 - - - - - - - - - 0.0309 5 0.1243 0.0741 0.3043 0.1600 0.2069 0.1579 0.0571 0.1875 0.0455 0.2165 6 0.4865 0.4815 0.3479 0.2400 0.3793 0.4210 0.5429 0.4375 0.2727 0.3506 7 0.2108 0.2407 0.1739 0.2800 0.2414 0.3158 0.2286 0.1875 0.4545 0.2165 8 0.0108 - 0.0435 0.0400 - - 0.0571 0.0625 - 0.0309 9 - - - - - - - - - 0.0103
244
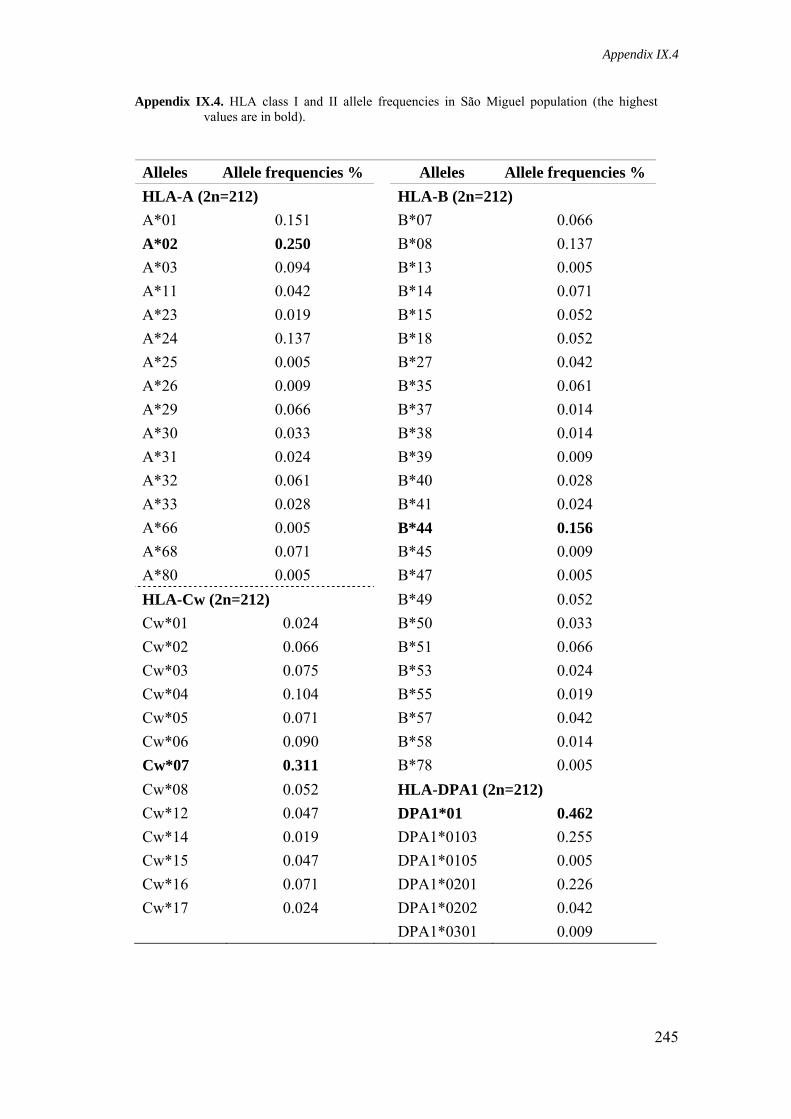
Appendix IX.4
Appendix IX.4. HLA class I and II allele frequencies in São Miguel population (the highest values are in bold).
Alleles Allele frequencies % Alleles Allele frequencies % HLA-A (2n=212) HLA-B (2n=212) A*01 0.151 B*07 0.066 A*02 0.250 B*08 0.137 A*03 0.094 B*13 0.005 A*11 0.042 B*14 0.071 A*23 0.019 B*15 0.052 A*24 0.137 B*18 0.052 A*25 0.005 B*27 0.042 A*26 0.009 B*35 0.061 A*29 0.066 B*37 0.014 A*30 0.033 B*38 0.014 A*31 0.024 B*39 0.009 A*32 0.061 B*40 0.028 A*33 0.028 B*41 0.024 A*66 0.005 B*44 0.156 A*68 0.071 B*45 0.009 A*80 0.005 B*47 0.005 HLA-Cw (2n=212) B*49 0.052 Cw*01 0.024 B*50 0.033 Cw*02 0.066 B*51 0.066 Cw*03 0.075 B*53 0.024 Cw*04 0.104 B*55 0.019 Cw*05 0.071 B*57 0.042 Cw*06 0.090 B*58 0.014 Cw*07 0.311 B*78 0.005 Cw*08 0.052 HLA-DPA1 (2n=212) Cw*12 0.047 DPA1*01 0.462 Cw*14 0.019 DPA1*0103 0.255 Cw*15 0.047 DPA1*0105 0.005 Cw*16 0.071 DPA1*0201 0.226 Cw*17 0.024 DPA1*0202 0.042 DPA1*0301 0.009
245
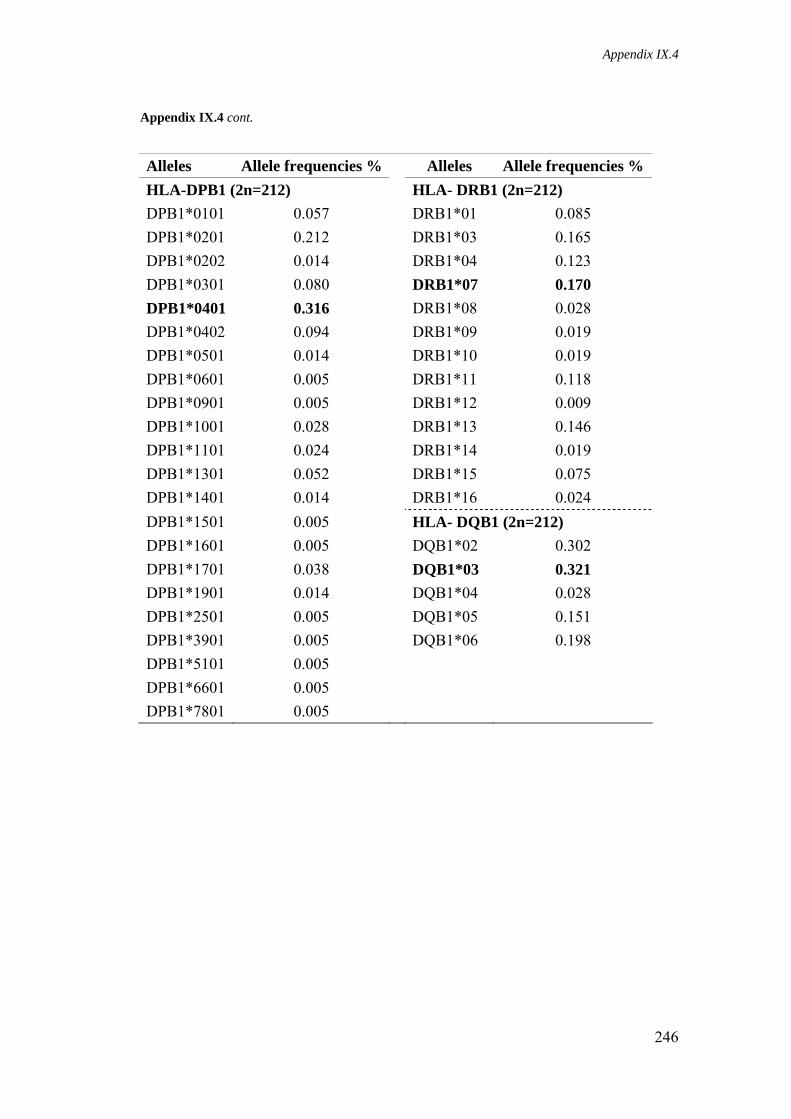
Appendix IX.4
Appendix IX.4 cont.
Alleles Allele frequencies % Alleles Allele frequencies % HLA-DPB1 (2n=212) HLA- DRB1 (2n=212) DPB1*0101 0.057 DRB1*01 0.085 DPB1*0201 0.212 DRB1*03 0.165 DPB1*0202 0.014 DRB1*04 0.123 DPB1*0301 0.080 DRB1*07 0.170 DPB1*0401 0.316 DRB1*08 0.028 DPB1*0402 0.094 DRB1*09 0.019 DPB1*0501 0.014 DRB1*10 0.019 DPB1*0601 0.005 DRB1*11 0.118 DPB1*0901 0.005 DRB1*12 0.009 DPB1*1001 0.028 DRB1*13 0.146 DPB1*1101 0.024 DRB1*14 0.019 DPB1*1301 0.052 DRB1*15 0.075 DPB1*1401 0.014 DRB1*16 0.024 DPB1*1501 0.005 HLA- DQB1 (2n=212) DPB1*1601 0.005 DQB1*02 0.302 DPB1*1701 0.038 DQB1*03 0.321 DPB1*1901 0.014 DQB1*04 0.028 DPB1*2501 0.005 DQB1*05 0.151 DPB1*3901 0.005 DQB1*06 0.198 DPB1*5101 0.005 DPB1*6601 0.005 DPB1*7801 0.005
246
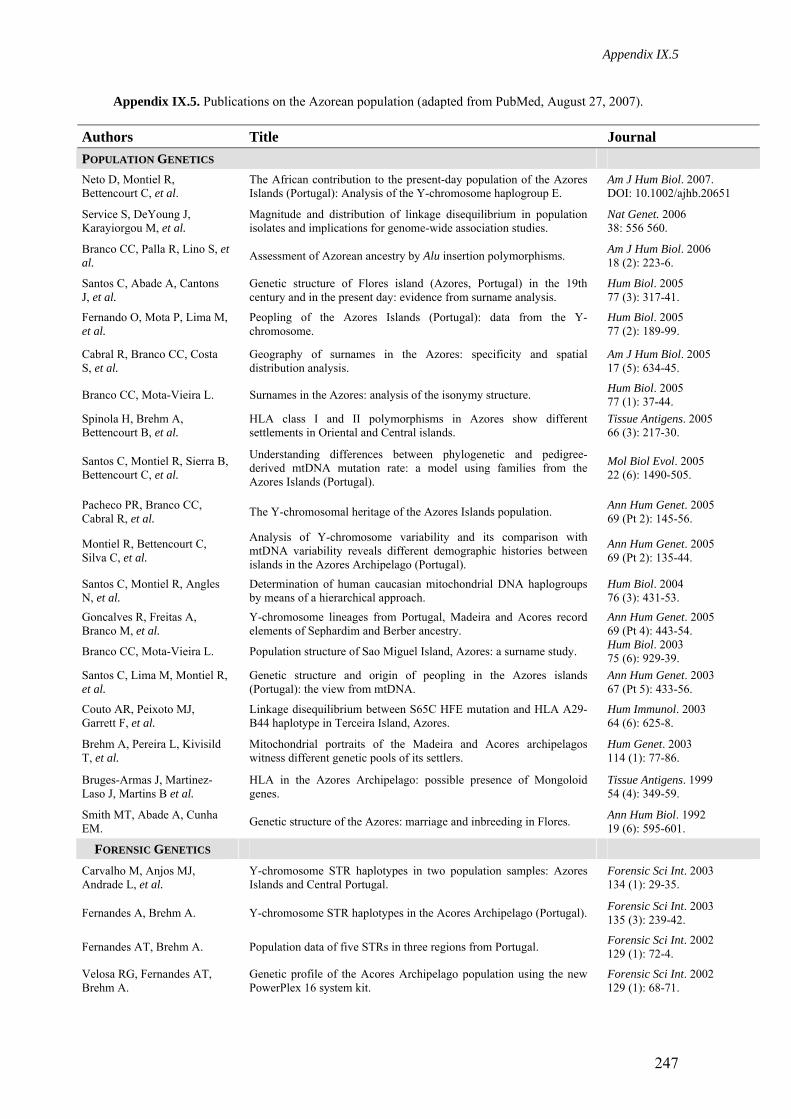
Appendix IX.5
Appendix IX.5. Publications on the Azorean population (adapted from PubMed, August 27, 2007).
Authors Title Journal POPULATION GENETICS Neto D, Montiel R, Bettencourt C, et al. The African contribution to the present-day population of the Azores
Islands (Portugal): Analysis of the Y-chromosome haplogroup E. Am J Hum Biol. 2007. DOI: 10.1002/ajhb.20651
Service S, DeYoung J, Karayiorgou M, et al. Magnitude and distribution of linkage disequilibrium in population
isolates and implications for genome-wide association studies. Nat Genet. 2006 38: 556 560.
Branco CC, Palla R, Lino S, et al. Assessment of Azorean ancestry by Alu insertion polymorphisms. Am J Hum Biol. 2006
18 (2): 223-6.
Santos C, Abade A, Cantons J, et al. Genetic structure of Flores island (Azores, Portugal) in the 19th
century and in the present day: evidence from surname analysis. Hum Biol. 2005 77 (3): 317-41.
Fernando O, Mota P, Lima M, et al. Peopling of the Azores Islands (Portugal): data from the Y-
chromosome. Hum Biol. 2005 77 (2): 189-99.
Cabral R, Branco CC, Costa S, et al. Geography of surnames in the Azores: specificity and spatial
distribution analysis. Am J Hum Biol. 2005 17 (5): 634-45.
Branco CC, Mota-Vieira L. Surnames in the Azores: analysis of the isonymy structure. Hum Biol. 2005 77 (1): 37-44.
Spinola H, Brehm A, Bettencourt B, et al. HLA class I and II polymorphisms in Azores show different
settlements in Oriental and Central islands. Tissue Antigens. 2005 66 (3): 217-30.
Santos C, Montiel R, Sierra B, Bettencourt C, et al.
Understanding differences between phylogenetic and pedigree-derived mtDNA mutation rate: a model using families from the Azores Islands (Portugal).
Mol Biol Evol. 2005 22 (6): 1490-505.
Pacheco PR, Branco CC, Cabral R, et al. The Y-chromosomal heritage of the Azores Islands population. Ann Hum Genet. 2005
69 (Pt 2): 145-56.
Montiel R, Bettencourt C, Silva C, et al.
Analysis of Y-chromosome variability and its comparison with mtDNA variability reveals different demographic histories between islands in the Azores Archipelago (Portugal).
Ann Hum Genet. 2005 69 (Pt 2): 135-44.
Santos C, Montiel R, Angles N, et al. Determination of human caucasian mitochondrial DNA haplogroups
by means of a hierarchical approach. Hum Biol. 2004 76 (3): 431-53.
Goncalves R, Freitas A, Branco M, et al. Y-chromosome lineages from Portugal, Madeira and Acores record
elements of Sephardim and Berber ancestry. Ann Hum Genet. 2005 69 (Pt 4): 443-54.
Branco CC, Mota-Vieira L. Population structure of Sao Miguel Island, Azores: a surname study. Hum Biol. 2003 75 (6): 929-39.
Santos C, Lima M, Montiel R, et al. Genetic structure and origin of peopling in the Azores islands
(Portugal): the view from mtDNA. Ann Hum Genet. 2003 67 (Pt 5): 433-56.
Couto AR, Peixoto MJ, Garrett F, et al. Linkage disequilibrium between S65C HFE mutation and HLA A29-
B44 haplotype in Terceira Island, Azores. Hum Immunol. 2003 64 (6): 625-8.
Brehm A, Pereira L, Kivisild T, et al. Mitochondrial portraits of the Madeira and Acores archipelagos
witness different genetic pools of its settlers. Hum Genet. 2003 114 (1): 77-86.
Bruges-Armas J, Martinez-Laso J, Martins B et al. HLA in the Azores Archipelago: possible presence of Mongoloid
genes. Tissue Antigens. 1999 54 (4): 349-59.
Smith MT, Abade A, Cunha EM. Genetic structure of the Azores: marriage and inbreeding in Flores. Ann Hum Biol. 1992
19 (6): 595-601.
FORENSIC GENETICS Carvalho M, Anjos MJ, Andrade L, et al. Y-chromosome STR haplotypes in two population samples: Azores
Islands and Central Portugal. Forensic Sci Int. 2003 134 (1): 29-35.
Fernandes A, Brehm A. Y-chromosome STR haplotypes in the Acores Archipelago (Portugal). Forensic Sci Int. 2003 135 (3): 239-42.
Fernandes AT, Brehm A. Population data of five STRs in three regions from Portugal. Forensic Sci Int. 2002 129 (1): 72-4.
Velosa RG, Fernandes AT, Brehm A. Genetic profile of the Acores Archipelago population using the new
PowerPlex 16 system kit. Forensic Sci Int. 2002 129 (1): 68-71.
247
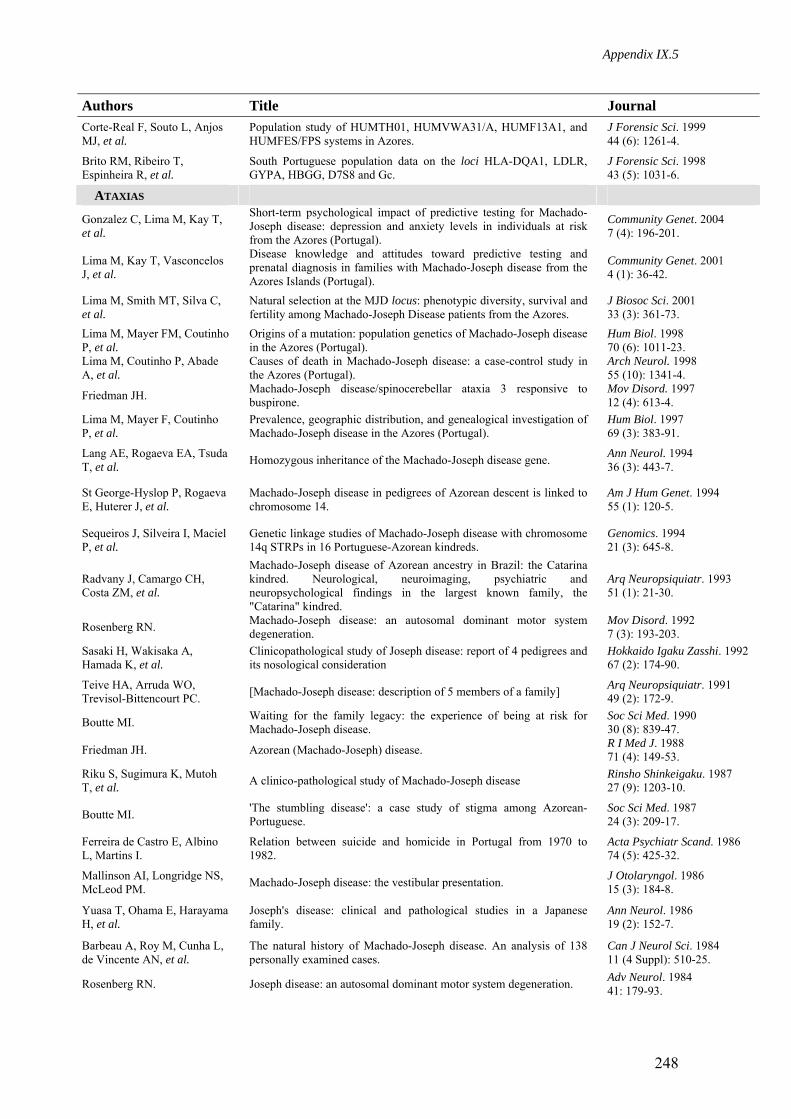
Appendix IX.5
Authors Title Journal Corte-Real F, Souto L, Anjos MJ, et al. Population study of HUMTH01, HUMVWA31/A, HUMF13A1, and
HUMFES/FPS systems in Azores. J Forensic Sci. 1999 44 (6): 1261-4.
Brito RM, Ribeiro T, Espinheira R, et al. South Portuguese population data on the loci HLA-DQA1, LDLR,
GYPA, HBGG, D7S8 and Gc. J Forensic Sci. 1998 43 (5): 1031-6.
ATAXIAS
Gonzalez C, Lima M, Kay T, et al.
Short-term psychological impact of predictive testing for Machado-Joseph disease: depression and anxiety levels in individuals at risk from the Azores (Portugal).
Community Genet. 2004 7 (4): 196-201.
Lima M, Kay T, Vasconcelos J, et al.
Disease knowledge and attitudes toward predictive testing and prenatal diagnosis in families with Machado-Joseph disease from the Azores Islands (Portugal).
Community Genet. 2001 4 (1): 36-42.
Lima M, Smith MT, Silva C, et al. Natural selection at the MJD locus: phenotypic diversity, survival and
fertility among Machado-Joseph Disease patients from the Azores. J Biosoc Sci. 2001 33 (3): 361-73.
Lima M, Mayer FM, Coutinho P, et al. Origins of a mutation: population genetics of Machado-Joseph disease
in the Azores (Portugal). Hum Biol. 1998 70 (6): 1011-23.
Lima M, Coutinho P, Abade A, et al. Causes of death in Machado-Joseph disease: a case-control study in
the Azores (Portugal). Arch Neurol. 1998 55 (10): 1341-4.
Friedman JH. Machado-Joseph disease/spinocerebellar ataxia 3 responsive to buspirone. Mov Disord. 1997
12 (4): 613-4. Lima M, Mayer F, Coutinho P, et al. Prevalence, geographic distribution, and genealogical investigation of
Machado-Joseph disease in the Azores (Portugal). Hum Biol. 1997 69 (3): 383-91.
Lang AE, Rogaeva EA, Tsuda T, et al. Homozygous inheritance of the Machado-Joseph disease gene. Ann Neurol. 1994
36 (3): 443-7.
St George-Hyslop P, Rogaeva E, Huterer J, et al. Machado-Joseph disease in pedigrees of Azorean descent is linked to
chromosome 14. Am J Hum Genet. 1994 55 (1): 120-5.
Sequeiros J, Silveira I, Maciel P, et al. Genetic linkage studies of Machado-Joseph disease with chromosome
14q STRPs in 16 Portuguese-Azorean kindreds. Genomics. 1994 21 (3): 645-8.
Radvany J, Camargo CH, Costa ZM, et al.
Machado-Joseph disease of Azorean ancestry in Brazil: the Catarina kindred. Neurological, neuroimaging, psychiatric and neuropsychological findings in the largest known family, the "Catarina" kindred.
Arq Neuropsiquiatr. 1993 51 (1): 21-30.
Rosenberg RN. Machado-Joseph disease: an autosomal dominant motor system degeneration. Mov Disord. 1992
7 (3): 193-203. Sasaki H, Wakisaka A, Hamada K, et al. Clinicopathological study of Joseph disease: report of 4 pedigrees and
its nosological consideration Hokkaido Igaku Zasshi. 1992 67 (2): 174-90.
Teive HA, Arruda WO, Trevisol-Bittencourt PC. [Machado-Joseph disease: description of 5 members of a family] Arq Neuropsiquiatr. 1991
49 (2): 172-9.
Boutte MI. Waiting for the family legacy: the experience of being at risk for Machado-Joseph disease. Soc Sci Med. 1990
30 (8): 839-47.
Friedman JH. Azorean (Machado-Joseph) disease. R I Med J. 1988 71 (4): 149-53.
Riku S, Sugimura K, Mutoh T, et al. A clinico-pathological study of Machado-Joseph disease Rinsho Shinkeigaku. 1987
27 (9): 1203-10.
Boutte MI. 'The stumbling disease': a case study of stigma among Azorean-Portuguese. Soc Sci Med. 1987
24 (3): 209-17.
Ferreira de Castro E, Albino L, Martins I. Relation between suicide and homicide in Portugal from 1970 to
1982. Acta Psychiatr Scand. 1986 74 (5): 425-32.
Mallinson AI, Longridge NS, McLeod PM. Machado-Joseph disease: the vestibular presentation. J Otolaryngol. 1986
15 (3): 184-8.
Yuasa T, Ohama E, Harayama H, et al. Joseph's disease: clinical and pathological studies in a Japanese
family. Ann Neurol. 1986 19 (2): 152-7.
Barbeau A, Roy M, Cunha L, de Vincente AN, et al. The natural history of Machado-Joseph disease. An analysis of 138
personally examined cases. Can J Neurol Sci. 1984 11 (4 Suppl): 510-25.
Rosenberg RN. Joseph disease: an autosomal dominant motor system degeneration. Adv Neurol. 1984 41: 179-93.
248
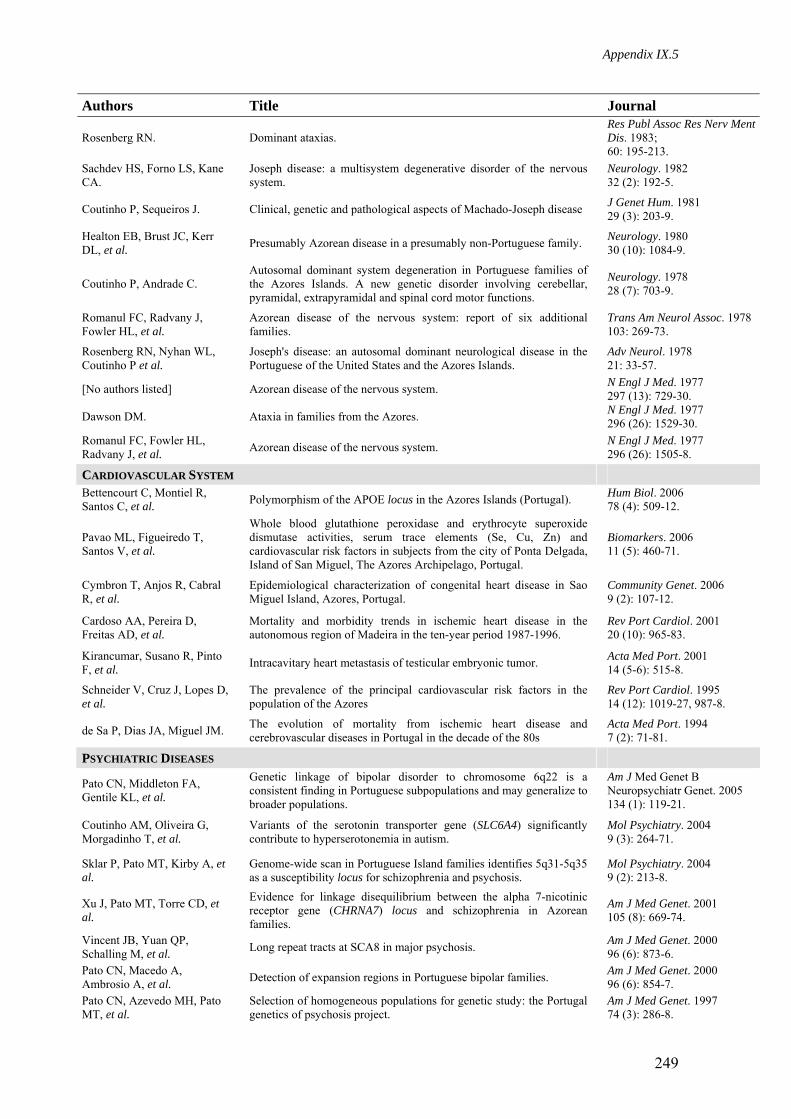
Appendix IX.5
Authors Title Journal
Rosenberg RN. Dominant ataxias. Res Publ Assoc Res Nerv Ment Dis. 1983; 60: 195-213.
Sachdev HS, Forno LS, Kane CA. Joseph disease: a multisystem degenerative disorder of the nervous
system. Neurology. 1982 32 (2): 192-5.
Coutinho P, Sequeiros J. Clinical, genetic and pathological aspects of Machado-Joseph disease J Genet Hum. 1981 29 (3): 203-9.
Healton EB, Brust JC, Kerr DL, et al. Presumably Azorean disease in a presumably non-Portuguese family. Neurology. 1980
30 (10): 1084-9.
Coutinho P, Andrade C. Autosomal dominant system degeneration in Portuguese families of the Azores Islands. A new genetic disorder involving cerebellar, pyramidal, extrapyramidal and spinal cord motor functions.
Neurology. 1978 28 (7): 703-9.
Romanul FC, Radvany J, Fowler HL, et al. Azorean disease of the nervous system: report of six additional
families. Trans Am Neurol Assoc. 1978103: 269-73.
Rosenberg RN, Nyhan WL, Coutinho P et al. Joseph's disease: an autosomal dominant neurological disease in the
Portuguese of the United States and the Azores Islands. Adv Neurol. 1978 21: 33-57.
[No authors listed] Azorean disease of the nervous system. N Engl J Med. 1977 297 (13): 729-30.
Dawson DM. Ataxia in families from the Azores. N Engl J Med. 1977 296 (26): 1529-30.
Romanul FC, Fowler HL, Radvany J, et al. Azorean disease of the nervous system. N Engl J Med. 1977
296 (26): 1505-8.
CARDIOVASCULAR SYSTEM Bettencourt C, Montiel R, Santos C, et al. Polymorphism of the APOE locus in the Azores Islands (Portugal). Hum Biol. 2006
78 (4): 509-12.
Pavao ML, Figueiredo T, Santos V, et al.
Whole blood glutathione peroxidase and erythrocyte superoxide dismutase activities, serum trace elements (Se, Cu, Zn) and cardiovascular risk factors in subjects from the city of Ponta Delgada, Island of San Miguel, The Azores Archipelago, Portugal.
Biomarkers. 2006 11 (5): 460-71.
Cymbron T, Anjos R, Cabral R, et al. Epidemiological characterization of congenital heart disease in Sao
Miguel Island, Azores, Portugal. Community Genet. 2006 9 (2): 107-12.
Cardoso AA, Pereira D, Freitas AD, et al. Mortality and morbidity trends in ischemic heart disease in the
autonomous region of Madeira in the ten-year period 1987-1996. Rev Port Cardiol. 2001 20 (10): 965-83.
Kirancumar, Susano R, Pinto F, et al. Intracavitary heart metastasis of testicular embryonic tumor. Acta Med Port. 2001
14 (5-6): 515-8.
Schneider V, Cruz J, Lopes D, et al. The prevalence of the principal cardiovascular risk factors in the
population of the Azores Rev Port Cardiol. 1995 14 (12): 1019-27, 987-8.
de Sa P, Dias JA, Miguel JM. The evolution of mortality from ischemic heart disease and cerebrovascular diseases in Portugal in the decade of the 80s Acta Med Port. 1994
7 (2): 71-81.
PSYCHIATRIC DISEASES
Pato CN, Middleton FA, Gentile KL, et al.
Genetic linkage of bipolar disorder to chromosome 6q22 is a consistent finding in Portuguese subpopulations and may generalize to broader populations.
Am J Med Genet B Neuropsychiatr Genet. 2005 134 (1): 119-21.
Coutinho AM, Oliveira G, Morgadinho T, et al. Variants of the serotonin transporter gene (SLC6A4) significantly
contribute to hyperserotonemia in autism. Mol Psychiatry. 2004 9 (3): 264-71.
Sklar P, Pato MT, Kirby A, et al. Genome-wide scan in Portuguese Island families identifies 5q31-5q35
as a susceptibility locus for schizophrenia and psychosis. Mol Psychiatry. 2004 9 (2): 213-8.
Xu J, Pato MT, Torre CD, et al.
Evidence for linkage disequilibrium between the alpha 7-nicotinic receptor gene (CHRNA7) locus and schizophrenia in Azorean families.
Am J Med Genet. 2001 105 (8): 669-74.
Vincent JB, Yuan QP, Schalling M, et al. Long repeat tracts at SCA8 in major psychosis. Am J Med Genet. 2000
96 (6): 873-6. Pato CN, Macedo A, Ambrosio A, et al. Detection of expansion regions in Portuguese bipolar families. Am J Med Genet. 2000
96 (6): 854-7. Pato CN, Azevedo MH, Pato MT, et al. Selection of homogeneous populations for genetic study: the Portugal
genetics of psychosis project. Am J Med Genet. 1997 74 (3): 286-8.
249
Appendix IX.5
Authors Title Journal
de Azevedo MH, Ferreira CP. Anorexia nervosa and bulimia: a prevalence study. Acta Psychiatr Scand. 1992 86 (6): 432-6.
LEPTOSPIROSIS Vieira ML, Gama-Simoes MJ, Collares-Pereira M. Human leptospirosis in Portugal: A retrospective study of eighteen
years. Int J Infect Dis. 2006 10 (5): 378-86.
[No authors listed] Fatal leptospirosis, Azores islands. Wkly Epidemiol Rec. 2001 76 (15): 109-11.
Collares-Pereira M, Mathias ML, Santos-Reis M, et al. Rodents and Leptospira transmission risk in Terceira island (Azores). Eur J Epidemiol. 2000
16 (12): 1151-7. Collares-Pereira M, Korver H, Cao Thi BV, et al. Analysis of Leptospira isolates from mainland Portugal and the
Azores islands. FEMS Microbiol Lett. 2000 185(2):181-7.
Collares-Pereira M, Korver H, Terpstra WJ, et al. First epidemiological data on pathogenic Leptospires isolated on the
Azorean islands. Eur J Epidemiol. 1997 13(4):435-41.
OTHER STUDIES
Amaral AF, Rodrigues AS. Chronic exposure to volcanic environments and chronic bronchitis incidence in the Azores, Portugal. Environ Res. 2007
103 (3): 419-23. Lopez-Larrea C, Blanco-Gelaz MA, Torre-Alonso JC, et al.
Contribution of KIR3DL1/3DS1 to ankylosing spondylitis in human leukocyte antigen-B27 Caucasian populations. Arthritis Res Ther. 2006
8 (4): R101.
Bruges-Armas J, Couto AR, Timms A et al.
Ectopic calcification among families in the Azores: clinical and radiologic manifestations in families with diffuse idiopathic skeletal hyperostosis and chondrocalcinosis.
Arthritis Rheum. 2006 54 (4): 1340-9.
Amaral A, Rodrigues V, Oliveira J, et al. Chronic exposure to volcanic environments and cancer incidence in
the Azores, Portugal. Sci Total Environ. 2006 367 (1): 123-8.
Peixoto BR, Vencio RZ, Egidio CM, et al. Evaluation of reference-based two-color methods for measurement of
gene expression ratios using spotted cDNA microarrays. BMC Genomics. 2006 7: 35.
Peixoto MJ, Gonzales T, Spinola H, et al. HLA-B27 polymorphism and spondyloarthropathies. Acta Med Port. 2005
18 (4): 283-93. Anselmo J, Cao D, Karrison T, et al. Fetal loss associated with excess thyroid hormone exposure. JAMA. 2004
292 (6): 691-5.
Singh D. Mating strategies of young women: role of physical attractiveness. J Sex Res. 2004 41 (1): 43-54.
Pavao M, Cordeiro C, Costa A, et al.
Comparison of whole-blood glutathione peroxidase activity, levels of serum selenium, and lipid peroxidation in subjects from the fishing and rural communities of "Rabo de Peixe" village, San Miguel Island, the Azores' Archipelago, Portugal.
Biol Trace Elem Res. 2003 92 (1): 27-40.
Silveira H, Soares JS, Lima HA. Tonsillectomy: cold dissection versus bipolar electrodissection.
Int J Pediatr Otorhinolaryngol. 2003 67 (4): 345-51.
James S. Agonias: the social and sacred suffering of Azorean immigrants. Cult Med Psychiatry. 2002 26 (1): 87-110.
Bruges-Armas J, Lima C, Peixoto MJ, et al.. Prevalence of spondyloarthritis in Terceira, Azores: a population
based study. Ann Rheum Dis. 2002 61 (6): 551-3.
Armas JB, Pimentel F, Guyer PB, et al. Evidence of geographic variation in the occurrence of Paget's disease. Bone. 2002
30 (4): 649-50. De Castro JJ, Baptista F, Dias JA, et al. Relationship between obesity and educational level in Portuguese
young males in 1990 Acta Med Port. 2000 13 (1-2): 1-6.
Viegas-Crespo AM, Pavao ML, et al. Trace element status (Se, Cu, Zn) and serum lipid profile in
Portuguese subjects of San Miguel Island from Azores'archipelago. J Trace Elem Med Biol. 2000 14 (1): 1-5.
Armas JB, Gonzalez S, Martinez-Borra J, et al. Susceptibility to ankylosing spondylitis is independent of the Bw4
and Bw6 epitopes of HLA-B27 alleles. Tissue Antigens. 1999 53 (3): 237-43.
Falcao JM, Valente P. Cerebrovascular diseases in Portugal: some epidemiological aspects Acta Med Port. 1997 10 (8-9): 537-42.
Alves J, Almeida J, Marques JA. An epidemiological study of bronchial asthma in a population of
schoolchildren in the Azores (Faial) Acta Med Port. 1995 8 (5): 328-30.
Susano R, Ponte T, Maia J, et al. The epidemiology of proximal femur fracture at the Hospital da Horta
(Azores) Acta Med Port. 1995 8 (4): 217-23.
Goncalves L, Cunha C. Telemedicine project in the Azores Islands. Arch Anat Cytol Pathol. 199543 (4): 285-7.
250
Appendix IX.5
Authors Title Journal Susano R, Ponte T, Maia J, et al. The epidemiology of proximal femur fracture at the Hospital da Horta
(Azores). Acta Med Port. 1995 8 (4): 217-23.
Prata C, Marto J, Mouzinho I, et al. Epidemiologic study of bronchial asthma in schoolchildren from the
Azores (Faial). Acta Med Port. 1994 7 (10): 541-4.
Prata C, Marto J, Mouzinho I, et al. Epidemiologic study of bronchial asthma in schoolchildren from the
Azores (Faial) Acta Med Port. 1994 7 (10): 541-4.
Patricio ZM, Borenstein MS, Elsen I. Understanding the questions on health and disease from adolescents in
Azorean families--sexuality and reproduction Rev Gaucha Enferm. 1991 12 (2): 11-8.
Tanaka A, Ohno K, Sandhoff K, et al. GM2-gangliosidosis B1 variant: analysis of beta-hexosaminidase
alpha gene abnormalities in seven patients. Am J Hum Genet. 1990 46 (2): 329-39.
Romao L, Olim G, Martins MC, et al. Unusual molecular basis of Hb H disease in the Azores Islands,
Portugal. Hemoglobin. 1990 14 (6): 607-16.
de Oliveria AL, Goncalves MJ, Sobrinho LG. Endemic goitre in the island of S. Miguel (the Azores). Acta Endocrinol. 1986
111 (2): 200-3.
251
Related Documents