This article was published in an Elsevier journal. The attached copy is furnished to the author for non-commercial research and education use, including for instruction at the author’s institution, sharing with colleagues and providing to institution administration. Other uses, including reproduction and distribution, or selling or licensing copies, or posting to personal, institutional or third party websites are prohibited. In most cases authors are permitted to post their version of the article (e.g. in Word or Tex form) to their personal website or institutional repository. Authors requiring further information regarding Elsevier’s archiving and manuscript policies are encouraged to visit: http://www.elsevier.com/copyright

Welcome message from author
This document is posted to help you gain knowledge. Please leave a comment to let me know what you think about it! Share it to your friends and learn new things together.
Transcript
This article was published in an Elsevier journal. The attached copyis furnished to the author for non-commercial research and
education use, including for instruction at the author’s institution,sharing with colleagues and providing to institution administration.
Other uses, including reproduction and distribution, or selling orlicensing copies, or posting to personal, institutional or third party
websites are prohibited.
In most cases authors are permitted to post their version of thearticle (e.g. in Word or Tex form) to their personal website orinstitutional repository. Authors requiring further information
regarding Elsevier’s archiving and manuscript policies areencouraged to visit:
http://www.elsevier.com/copyright
Author's personal copy
Characterization of strike-slip faultesplay relationships in sandstone
Ghislain de Joussineau*, Ovunc Mutlu, Atilla Aydin, David D. Pollard
Rock Fracture Project, Department of Geological and Environmental Sciences, 450 Serra Mall,
Building 320, Stanford University, Stanford, CA 94305, USA
Received 12 September 2006; received in revised form 9 August 2007; accepted 14 August 2007
Available online 1 September 2007
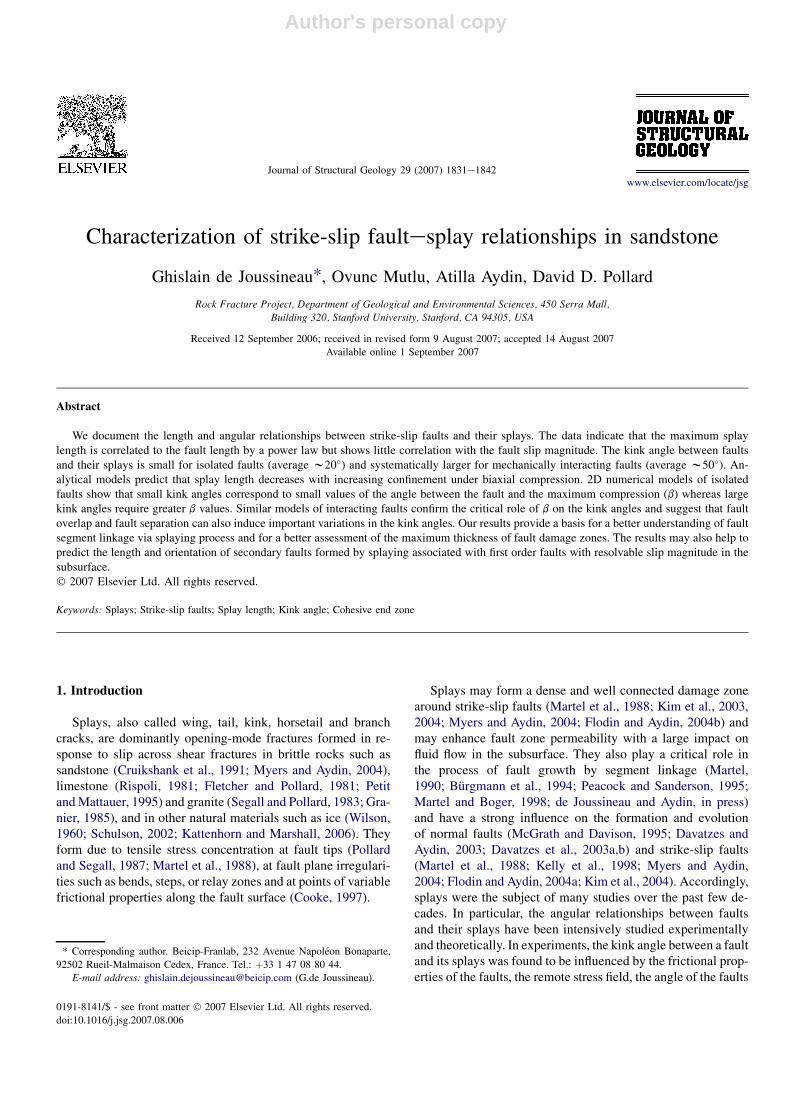
Abstract
We document the length and angular relationships between strike-slip faults and their splays. The data indicate that the maximum splaylength is correlated to the fault length by a power law but shows little correlation with the fault slip magnitude. The kink angle between faultsand their splays is small for isolated faults (average w20�) and systematically larger for mechanically interacting faults (average w50�). An-alytical models predict that splay length decreases with increasing confinement under biaxial compression. 2D numerical models of isolatedfaults show that small kink angles correspond to small values of the angle between the fault and the maximum compression (b) whereas largekink angles require greater b values. Similar models of interacting faults confirm the critical role of b on the kink angles and suggest that faultoverlap and fault separation can also induce important variations in the kink angles. Our results provide a basis for a better understanding of faultsegment linkage via splaying process and for a better assessment of the maximum thickness of fault damage zones. The results may also help topredict the length and orientation of secondary faults formed by splaying associated with first order faults with resolvable slip magnitude in thesubsurface.� 2007 Elsevier Ltd. All rights reserved.
Keywords: Splays; Strike-slip faults; Splay length; Kink angle; Cohesive end zone
1. Introduction
Splays, also called wing, tail, kink, horsetail and branchcracks, are dominantly opening-mode fractures formed in re-sponse to slip across shear fractures in brittle rocks such assandstone (Cruikshank et al., 1991; Myers and Aydin, 2004),limestone (Rispoli, 1981; Fletcher and Pollard, 1981; Petitand Mattauer, 1995) and granite (Segall and Pollard, 1983; Gra-nier, 1985), and in other natural materials such as ice (Wilson,1960; Schulson, 2002; Kattenhorn and Marshall, 2006). Theyform due to tensile stress concentration at fault tips (Pollardand Segall, 1987; Martel et al., 1988), at fault plane irregulari-ties such as bends, steps, or relay zones and at points of variablefrictional properties along the fault surface (Cooke, 1997).
Splays may form a dense and well connected damage zonearound strike-slip faults (Martel et al., 1988; Kim et al., 2003,2004; Myers and Aydin, 2004; Flodin and Aydin, 2004b) andmay enhance fault zone permeability with a large impact onfluid flow in the subsurface. They also play a critical role inthe process of fault growth by segment linkage (Martel,1990; Burgmann et al., 1994; Peacock and Sanderson, 1995;Martel and Boger, 1998; de Joussineau and Aydin, in press)and have a strong influence on the formation and evolutionof normal faults (McGrath and Davison, 1995; Davatzes andAydin, 2003; Davatzes et al., 2003a,b) and strike-slip faults(Martel et al., 1988; Kelly et al., 1998; Myers and Aydin,2004; Flodin and Aydin, 2004a; Kim et al., 2004). Accordingly,splays were the subject of many studies over the past few de-cades. In particular, the angular relationships between faultsand their splays have been intensively studied experimentallyand theoretically. In experiments, the kink angle between a faultand its splays was found to be influenced by the frictional prop-erties of the faults, the remote stress field, the angle of the faults
* Corresponding author. Beicip-Franlab, 232 Avenue Napoleon Bonaparte,
92502 Rueil-Malmaison Cedex, France. Tel.: þ33 1 47 08 80 44.
E-mail address: [email protected] (G.de Joussineau).
0191-8141/$ - see front matter � 2007 Elsevier Ltd. All rights reserved.
doi:10.1016/j.jsg.2007.08.006
Journal of Structural Geology 29 (2007) 1831e1842www.elsevier.com/locate/jsg
Author's personal copy
to the maximum compressive stress or the stress perturbationsinduced by fault interaction (Brace and Bombolakis, 1963;Bombolakis, 1973; Nemat-Nasser and Horii, 1982; Horii andNemat-Nasser, 1985; Barquins et al., 1991; Barquins and Petit,1992; Du and Aydin, 1995; Chaker and Barquins, 1996). Froma theoretical point of view, Linear Elastic Fracture Mechanics(LEFM) theory predicts a kink angle equal to 70.5� betweena pure mode II (shearing) crack and its splays based on themaximum circumferential stress criterion (Erdogan and Sih,1963; Ingraffea, 1987). However, kink angles much smallerthan 70.5� are reported along natural faults with a shear offsetand no evidence of opening perpendicular to the faults (Rispoli,1981; Liu, 1983; Petit and Barquins, 1988; Martel, 1997). Thisdiscrepancy between theory and nature has been attributed tothe fact that the LEFM theory implies a point of infinite stressconcentration and infinite displacement gradient at the faulttips, which is unrealistic because natural materials cannotbear infinite stress. To overcome this stress singularity at faulttips, some authors introduced a zone of higher friction or cohe-sion near the tips of the fault models, named the cohesive endzone (Dugdale, 1960; Barenblatt, 1962). This modeling proce-dure reproduced the kink angles observed in nature (Martel,1997; Willemse and Pollard, 1998; Davatzes and Aydin,2003) and helped to explain the formation of a set of splays be-hind the fault tip which are often observed in outcrop (Cooke,1997).
Even though the angular relationships between faults andsplays have been widely studied, few investigations havedealt with the length relationships between shear fracturesand their splays (Nemat-Nasser and Horii, 1982, 1984; Horiiand Nemat-Nasser, 1985, 1986). These studies showed thatthe propagation and length of splays were influenced bythe loading conditions (uniaxial/biaxial compression or ten-sionecompression) and the magnitude of the maximum com-pressive stress. In particular, they demonstrated that splayscould have a greater length that their parent shear fracturesunder favorable stress conditions. They also suggested a pos-sible relationship between shear fracture length and splaylength such that the longest shear fracture produced the lon-gest splays in samples tested under the same loading condi-tions (Horii and Nemat-Nasser, 1986). However, to the bestof our knowledge, no geological field data concerning thelength relationships between faults and splays are availableto compare with these results.
In this paper, we document the fault slip and length and theangular relationships between small faults (length < 100 m)and their splays in strike-slip fault networks exposed in theValley of Fire State Park (SE Nevada, USA). We establishthat the length of the longest splay produced by a fault is cor-related to the fault length by a power law, but shows very littlecorrelation to the fault slip magnitude. Also, we use analyticalmodels to investigate the impact of boundary conditions on fi-nite splay length. We identify two distinct fault configurationsleading to different kink angle distributions, and use mechan-ical models of faults with a cohesive end zone to constrain therange of variation in the kink angles. The results obtained pro-vide a means of estimating the maximum thickness of fault
damage zones and the orientation and length of splay fracturesaround subsurface faults with detectable slip magnitude.
2. Geologic setting
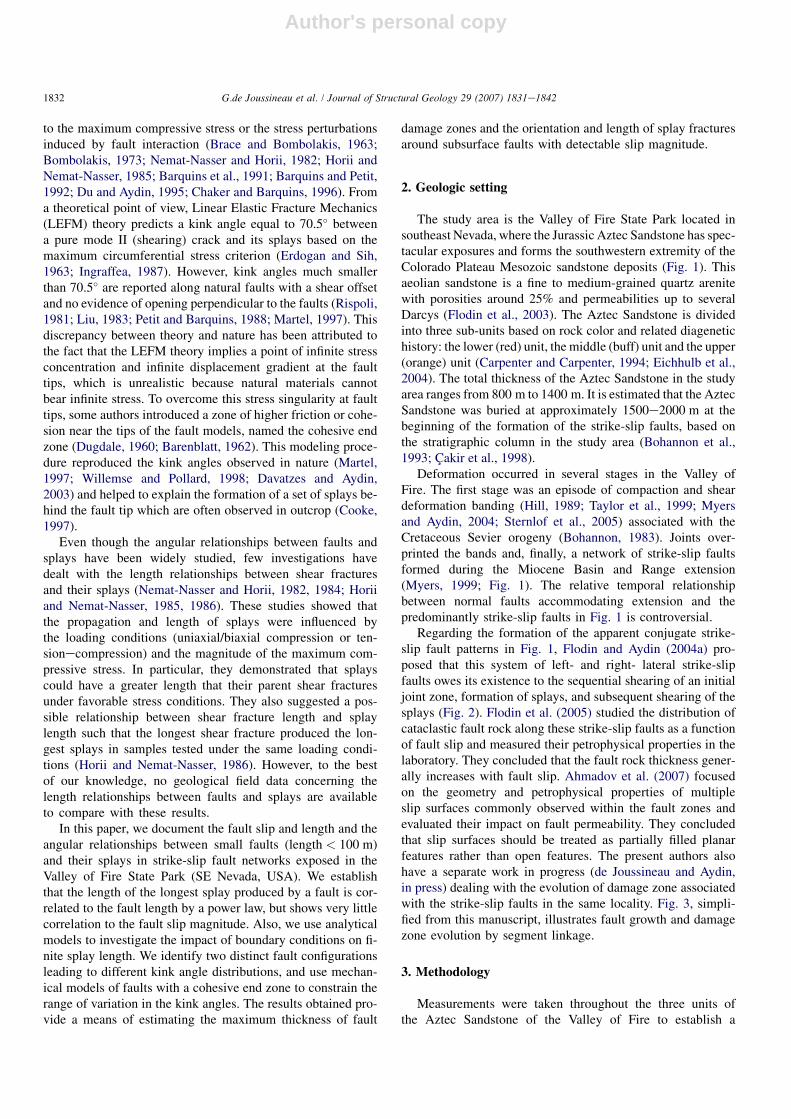
The study area is the Valley of Fire State Park located insoutheast Nevada, where the Jurassic Aztec Sandstone has spec-tacular exposures and forms the southwestern extremity of theColorado Plateau Mesozoic sandstone deposits (Fig. 1). Thisaeolian sandstone is a fine to medium-grained quartz arenitewith porosities around 25% and permeabilities up to severalDarcys (Flodin et al., 2003). The Aztec Sandstone is dividedinto three sub-units based on rock color and related diagenetichistory: the lower (red) unit, the middle (buff) unit and the upper(orange) unit (Carpenter and Carpenter, 1994; Eichhulb et al.,2004). The total thickness of the Aztec Sandstone in the studyarea ranges from 800 m to 1400 m. It is estimated that the AztecSandstone was buried at approximately 1500e2000 m at thebeginning of the formation of the strike-slip faults, based onthe stratigraphic column in the study area (Bohannon et al.,1993; Cakir et al., 1998).
Deformation occurred in several stages in the Valley ofFire. The first stage was an episode of compaction and sheardeformation banding (Hill, 1989; Taylor et al., 1999; Myersand Aydin, 2004; Sternlof et al., 2005) associated with theCretaceous Sevier orogeny (Bohannon, 1983). Joints over-printed the bands and, finally, a network of strike-slip faultsformed during the Miocene Basin and Range extension(Myers, 1999; Fig. 1). The relative temporal relationshipbetween normal faults accommodating extension and thepredominantly strike-slip faults in Fig. 1 is controversial.
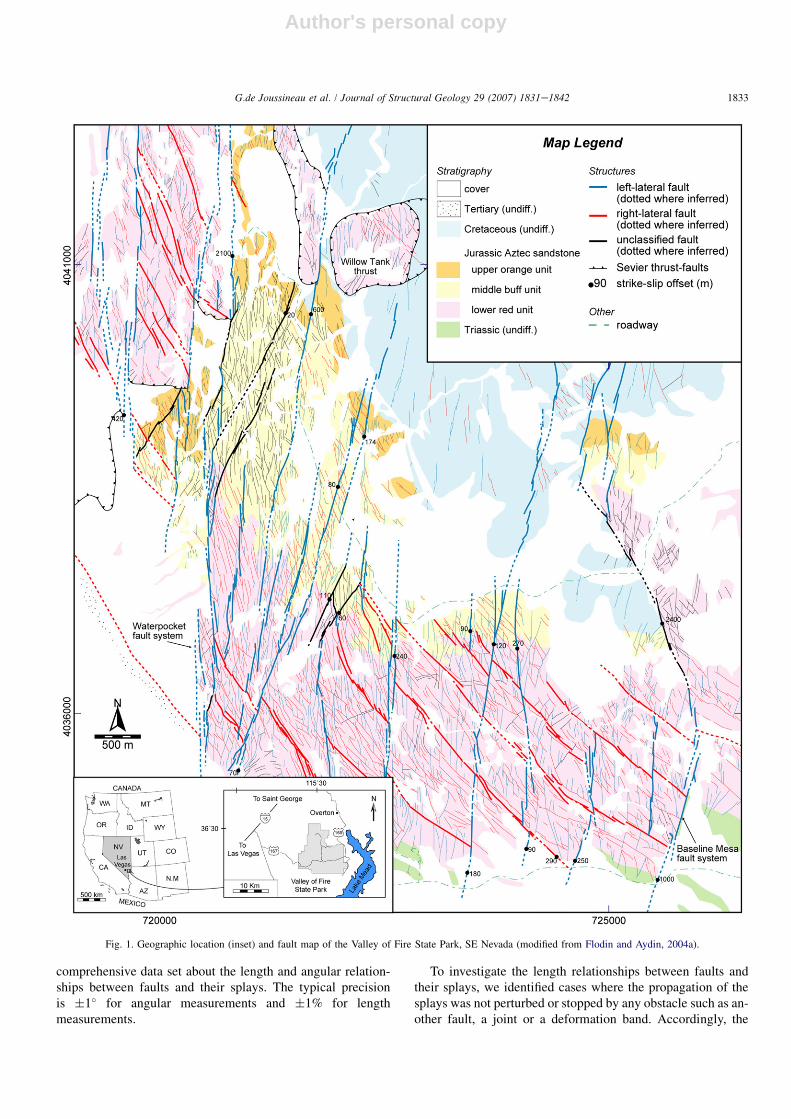
Regarding the formation of the apparent conjugate strike-slip fault patterns in Fig. 1, Flodin and Aydin (2004a) pro-posed that this system of left- and right- lateral strike-slipfaults owes its existence to the sequential shearing of an initialjoint zone, formation of splays, and subsequent shearing of thesplays (Fig. 2). Flodin et al. (2005) studied the distribution ofcataclastic fault rock along these strike-slip faults as a functionof fault slip and measured their petrophysical properties in thelaboratory. They concluded that the fault rock thickness gener-ally increases with fault slip. Ahmadov et al. (2007) focusedon the geometry and petrophysical properties of multipleslip surfaces commonly observed within the fault zones andevaluated their impact on fault permeability. They concludedthat slip surfaces should be treated as partially filled planarfeatures rather than open features. The present authors alsohave a separate work in progress (de Joussineau and Aydin,in press) dealing with the evolution of damage zone associatedwith the strike-slip faults in the same locality. Fig. 3, simpli-fied from this manuscript, illustrates fault growth and damagezone evolution by segment linkage.
3. Methodology
Measurements were taken throughout the three units ofthe Aztec Sandstone of the Valley of Fire to establish a
1832 G.de Joussineau et al. / Journal of Structural Geology 29 (2007) 1831e1842
Author's personal copy
comprehensive data set about the length and angular relation-ships between faults and their splays. The typical precisionis �1� for angular measurements and �1% for lengthmeasurements.
To investigate the length relationships between faults andtheir splays, we identified cases where the propagation of thesplays was not perturbed or stopped by any obstacle such as an-other fault, a joint or a deformation band. Accordingly, the
Fig. 1. Geographic location (inset) and fault map of the Valley of Fire State Park, SE Nevada (modified from Flodin and Aydin, 2004a).
1833G.de Joussineau et al. / Journal of Structural Geology 29 (2007) 1831e1842
Author's personal copy
splays measured are the longest splays produced by the faults.Most traces of splays change orientation by less than 10�, andwe measured their length along a straight line joining their baseand tip. In the very few cases where the curvature of the splayswas large enough to impact the length measurement, we di-vided the splays into several straight segments with differentorientations and summed up the lengths of the segments to ob-tain the total length. In this case, the segment adjacent to thefault was used for the splay angle.
Many faults in the study area have striations that makea small angle to the strike of the fault indicating a dominantstrike-slip component of the slip (Flodin and Aydin, 2004a).Accordingly, we considered the fault slip to be the separationdetermined based on the offsetting of markers such as defor-mation bands, dune boundaries or color bands. We measuredthe slip wherever possible, and when several measurementswere made, the maximum separation was considered to bethe maximum apparent slip along the faults.
4. Relationships between faults and their splays
4.1. Length relationships
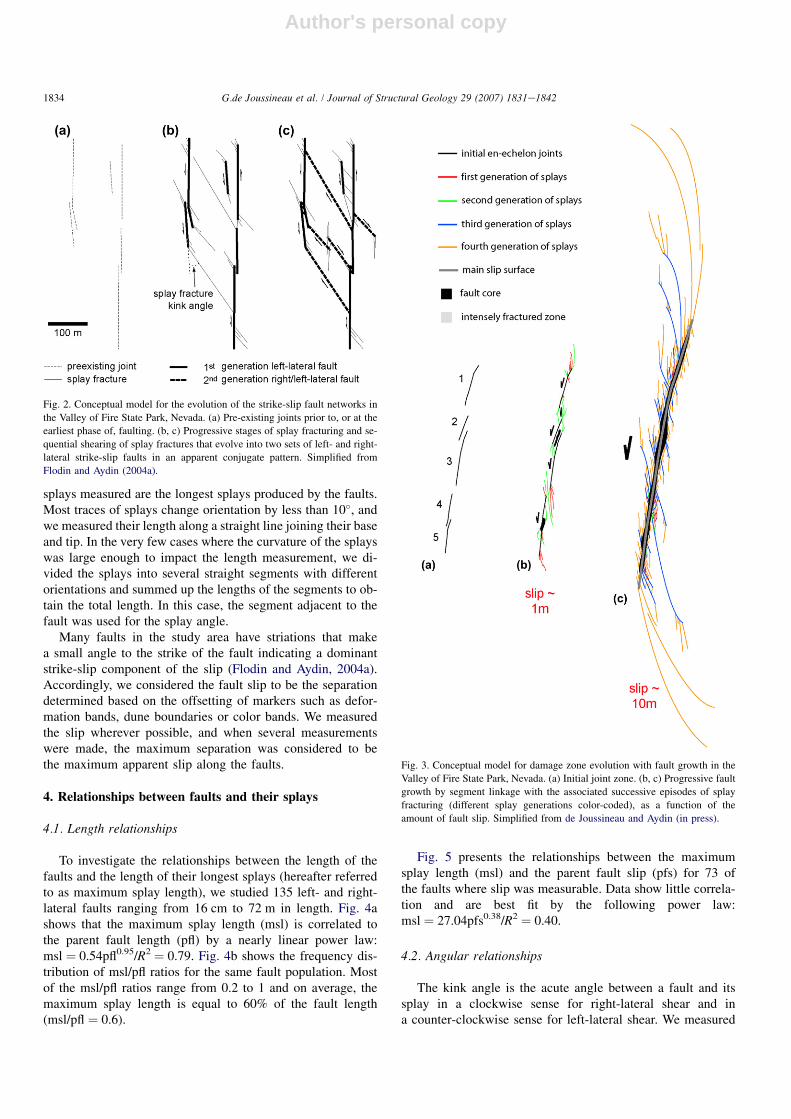
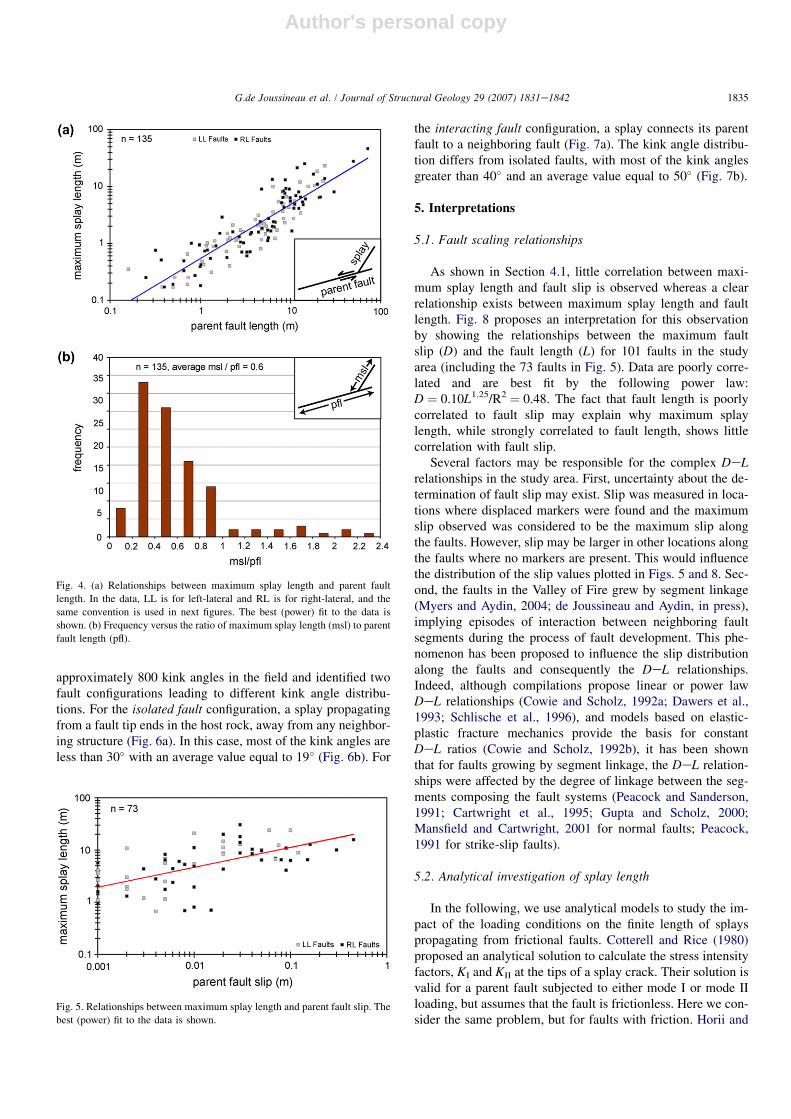
To investigate the relationships between the length of thefaults and the length of their longest splays (hereafter referredto as maximum splay length), we studied 135 left- and right-lateral faults ranging from 16 cm to 72 m in length. Fig. 4ashows that the maximum splay length (msl) is correlated tothe parent fault length (pfl) by a nearly linear power law:msl ¼ 0.54pfl0.95/R2 ¼ 0.79. Fig. 4b shows the frequency dis-tribution of msl/pfl ratios for the same fault population. Mostof the msl/pfl ratios range from 0.2 to 1 and on average, themaximum splay length is equal to 60% of the fault length(msl/pfl ¼ 0.6).
Fig. 5 presents the relationships between the maximumsplay length (msl) and the parent fault slip (pfs) for 73 ofthe faults where slip was measurable. Data show little correla-tion and are best fit by the following power law:msl ¼ 27.04pfs0.38/R2 ¼ 0.40.
4.2. Angular relationships
The kink angle is the acute angle between a fault and itssplay in a clockwise sense for right-lateral shear and ina counter-clockwise sense for left-lateral shear. We measured
Fig. 2. Conceptual model for the evolution of the strike-slip fault networks in
the Valley of Fire State Park, Nevada. (a) Pre-existing joints prior to, or at the
earliest phase of, faulting. (b, c) Progressive stages of splay fracturing and se-
quential shearing of splay fractures that evolve into two sets of left- and right-
lateral strike-slip faults in an apparent conjugate pattern. Simplified from
Flodin and Aydin (2004a).
Fig. 3. Conceptual model for damage zone evolution with fault growth in the
Valley of Fire State Park, Nevada. (a) Initial joint zone. (b, c) Progressive fault
growth by segment linkage with the associated successive episodes of splay
fracturing (different splay generations color-coded), as a function of the
amount of fault slip. Simplified from de Joussineau and Aydin (in press).
1834 G.de Joussineau et al. / Journal of Structural Geology 29 (2007) 1831e1842
Author's personal copy
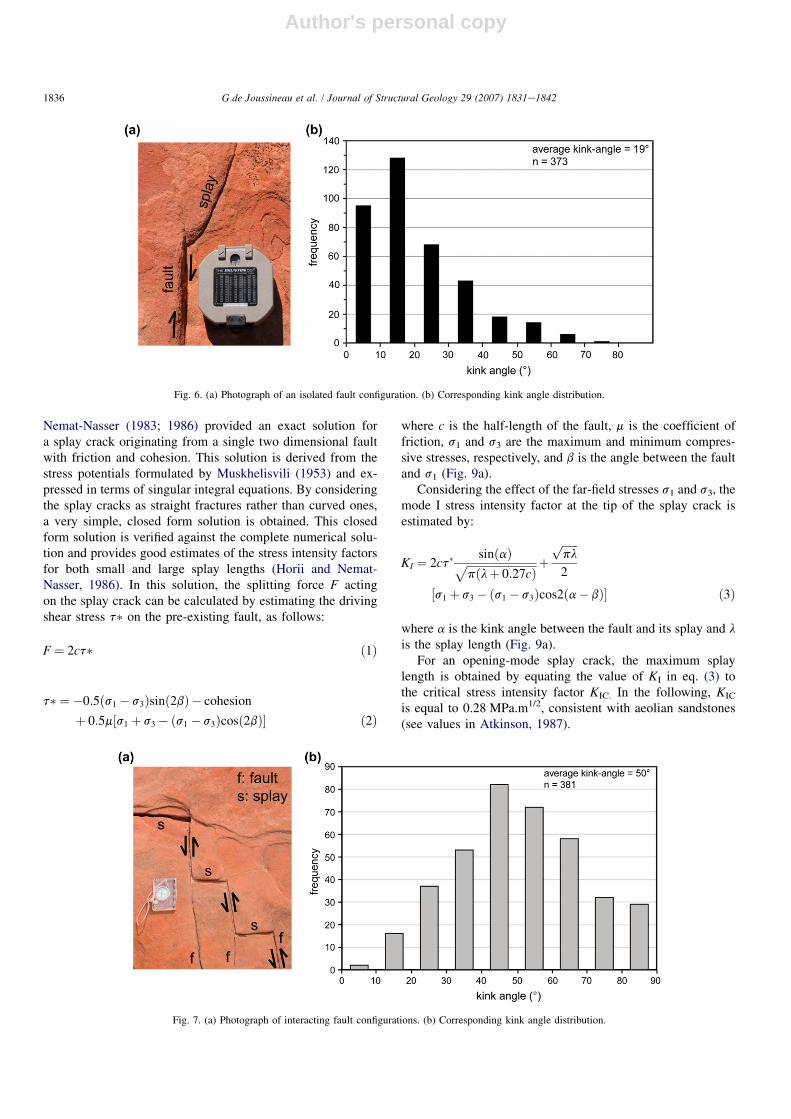
approximately 800 kink angles in the field and identified twofault configurations leading to different kink angle distribu-tions. For the isolated fault configuration, a splay propagatingfrom a fault tip ends in the host rock, away from any neighbor-ing structure (Fig. 6a). In this case, most of the kink angles areless than 30� with an average value equal to 19� (Fig. 6b). For
the interacting fault configuration, a splay connects its parentfault to a neighboring fault (Fig. 7a). The kink angle distribu-tion differs from isolated faults, with most of the kink anglesgreater than 40� and an average value equal to 50� (Fig. 7b).
5. Interpretations
5.1. Fault scaling relationships
As shown in Section 4.1, little correlation between maxi-mum splay length and fault slip is observed whereas a clearrelationship exists between maximum splay length and faultlength. Fig. 8 proposes an interpretation for this observationby showing the relationships between the maximum faultslip (D) and the fault length (L) for 101 faults in the studyarea (including the 73 faults in Fig. 5). Data are poorly corre-lated and are best fit by the following power law:D ¼ 0.10L1.25/R2 ¼ 0.48. The fact that fault length is poorlycorrelated to fault slip may explain why maximum splaylength, while strongly correlated to fault length, shows littlecorrelation with fault slip.
Several factors may be responsible for the complex DeLrelationships in the study area. First, uncertainty about the de-termination of fault slip may exist. Slip was measured in loca-tions where displaced markers were found and the maximumslip observed was considered to be the maximum slip alongthe faults. However, slip may be larger in other locations alongthe faults where no markers are present. This would influencethe distribution of the slip values plotted in Figs. 5 and 8. Sec-ond, the faults in the Valley of Fire grew by segment linkage(Myers and Aydin, 2004; de Joussineau and Aydin, in press),implying episodes of interaction between neighboring faultsegments during the process of fault development. This phe-nomenon has been proposed to influence the slip distributionalong the faults and consequently the DeL relationships.Indeed, although compilations propose linear or power lawDeL relationships (Cowie and Scholz, 1992a; Dawers et al.,1993; Schlische et al., 1996), and models based on elastic-plastic fracture mechanics provide the basis for constantDeL ratios (Cowie and Scholz, 1992b), it has been shownthat for faults growing by segment linkage, the DeL relation-ships were affected by the degree of linkage between the seg-ments composing the fault systems (Peacock and Sanderson,1991; Cartwright et al., 1995; Gupta and Scholz, 2000;Mansfield and Cartwright, 2001 for normal faults; Peacock,1991 for strike-slip faults).
5.2. Analytical investigation of splay length
In the following, we use analytical models to study the im-pact of the loading conditions on the finite length of splayspropagating from frictional faults. Cotterell and Rice (1980)proposed an analytical solution to calculate the stress intensityfactors, KI and KII at the tips of a splay crack. Their solution isvalid for a parent fault subjected to either mode I or mode IIloading, but assumes that the fault is frictionless. Here we con-sider the same problem, but for faults with friction. Horii and
Fig. 4. (a) Relationships between maximum splay length and parent fault
length. In the data, LL is for left-lateral and RL is for right-lateral, and the
same convention is used in next figures. The best (power) fit to the data is
shown. (b) Frequency versus the ratio of maximum splay length (msl) to parent
fault length (pfl).
Fig. 5. Relationships between maximum splay length and parent fault slip. The
best (power) fit to the data is shown.
1835G.de Joussineau et al. / Journal of Structural Geology 29 (2007) 1831e1842
Author's personal copy
Nemat-Nasser (1983; 1986) provided an exact solution fora splay crack originating from a single two dimensional faultwith friction and cohesion. This solution is derived from thestress potentials formulated by Muskhelisvili (1953) and ex-pressed in terms of singular integral equations. By consideringthe splay cracks as straight fractures rather than curved ones,a very simple, closed form solution is obtained. This closedform solution is verified against the complete numerical solu-tion and provides good estimates of the stress intensity factorsfor both small and large splay lengths (Horii and Nemat-Nasser, 1986). In this solution, the splitting force F actingon the splay crack can be calculated by estimating the drivingshear stress t� on the pre-existing fault, as follows:
F¼ 2ct� ð1Þ
t� ¼ �0:5ðs1 � s3Þsinð2bÞ � cohesion
þ 0:5m½s1þ s3� ðs1 � s3Þcosð2bÞ� ð2Þ
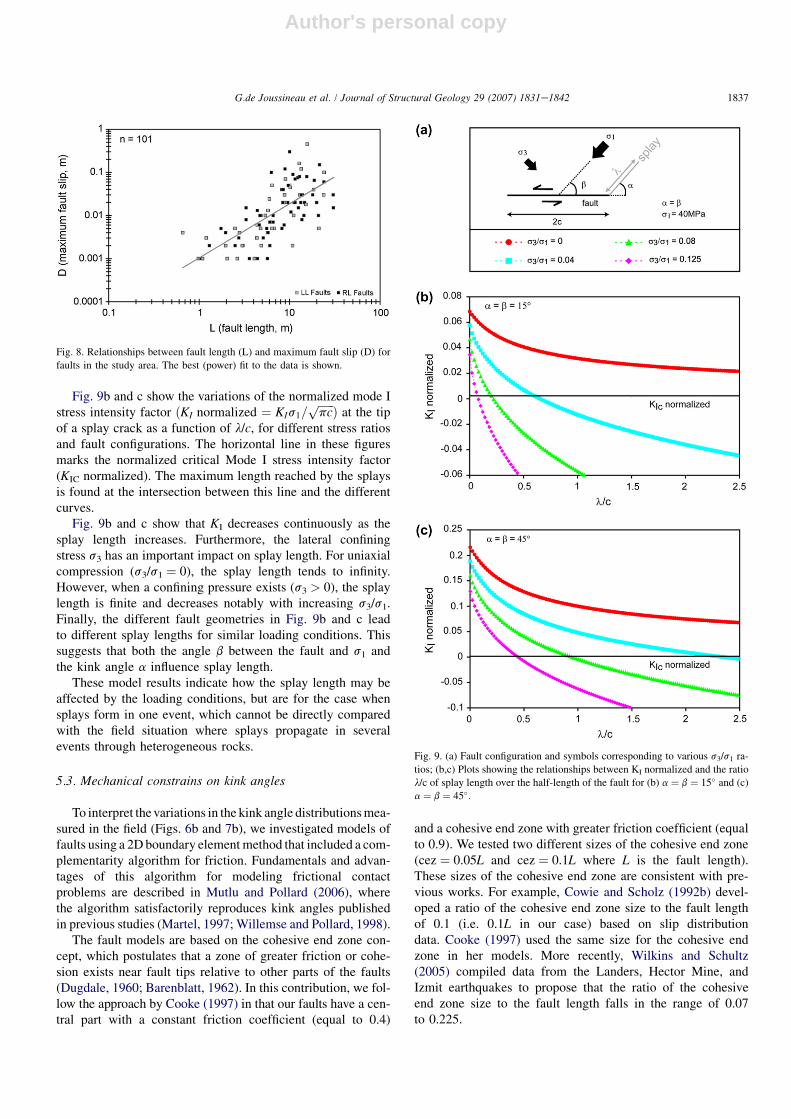
where c is the half-length of the fault, m is the coefficient offriction, s1 and s3 are the maximum and minimum compres-sive stresses, respectively, and b is the angle between the faultand s1 (Fig. 9a).
Considering the effect of the far-field stresses s1 and s3, themode I stress intensity factor at the tip of the splay crack isestimated by:
KI ¼ 2ct�sinðaÞ
ffiffiffiffiffiffiffiffiffiffiffiffiffiffiffiffiffiffiffiffiffiffiffiffiffipðlþ 0:27cÞ
p þffiffiffiffiffiffiplp
2
½s1þ s3� ðs1 � s3Þcos2ða� bÞ� ð3Þ
where a is the kink angle between the fault and its splay and l
is the splay length (Fig. 9a).For an opening-mode splay crack, the maximum splay
length is obtained by equating the value of KI in eq. (3) tothe critical stress intensity factor KIC. In the following, KIC
is equal to 0.28 MPa.m1/2, consistent with aeolian sandstones(see values in Atkinson, 1987).
Fig. 7. (a) Photograph of interacting fault configurations. (b) Corresponding kink angle distribution.
Fig. 6. (a) Photograph of an isolated fault configuration. (b) Corresponding kink angle distribution.
1836 G.de Joussineau et al. / Journal of Structural Geology 29 (2007) 1831e1842
Author's personal copy
Fig. 9b and c show the variations of the normalized mode Istress intensity factor ðKI normalized ¼ KIs1=
ffiffiffiffiffiffipcpÞ at the tip
of a splay crack as a function of l/c, for different stress ratiosand fault configurations. The horizontal line in these figuresmarks the normalized critical Mode I stress intensity factor(KIC normalized). The maximum length reached by the splaysis found at the intersection between this line and the differentcurves.
Fig. 9b and c show that KI decreases continuously as thesplay length increases. Furthermore, the lateral confiningstress s3 has an important impact on splay length. For uniaxialcompression (s3/s1 ¼ 0), the splay length tends to infinity.However, when a confining pressure exists (s3 > 0), the splaylength is finite and decreases notably with increasing s3/s1.Finally, the different fault geometries in Fig. 9b and c leadto different splay lengths for similar loading conditions. Thissuggests that both the angle b between the fault and s1 andthe kink angle a influence splay length.
These model results indicate how the splay length may beaffected by the loading conditions, but are for the case whensplays form in one event, which cannot be directly comparedwith the field situation where splays propagate in severalevents through heterogeneous rocks.
5.3. Mechanical constrains on kink angles
To interpret the variations in the kink angle distributions mea-sured in the field (Figs. 6b and 7b), we investigated models offaults using a 2D boundary element method that included a com-plementarity algorithm for friction. Fundamentals and advan-tages of this algorithm for modeling frictional contactproblems are described in Mutlu and Pollard (2006), wherethe algorithm satisfactorily reproduces kink angles publishedin previous studies (Martel, 1997; Willemse and Pollard, 1998).
The fault models are based on the cohesive end zone con-cept, which postulates that a zone of greater friction or cohe-sion exists near fault tips relative to other parts of the faults(Dugdale, 1960; Barenblatt, 1962). In this contribution, we fol-low the approach by Cooke (1997) in that our faults have a cen-tral part with a constant friction coefficient (equal to 0.4)
and a cohesive end zone with greater friction coefficient (equalto 0.9). We tested two different sizes of the cohesive end zone(cez ¼ 0.05L and cez ¼ 0.1L where L is the fault length).These sizes of the cohesive end zone are consistent with pre-vious works. For example, Cowie and Scholz (1992b) devel-oped a ratio of the cohesive end zone size to the fault lengthof 0.1 (i.e. 0.1L in our case) based on slip distributiondata. Cooke (1997) used the same size for the cohesive endzone in her models. More recently, Wilkins and Schultz(2005) compiled data from the Landers, Hector Mine, andIzmit earthquakes to propose that the ratio of the cohesiveend zone size to the fault length falls in the range of 0.07to 0.225.
Fig. 8. Relationships between fault length (L) and maximum fault slip (D) for
faults in the study area. The best (power) fit to the data is shown.
Fig. 9. (a) Fault configuration and symbols corresponding to various s3/s1 ra-
tios; (b,c) Plots showing the relationships between KI normalized and the ratio
l/c of splay length over the half-length of the fault for (b) a ¼ b ¼ 15� and (c)
a ¼ b ¼ 45�.
1837G.de Joussineau et al. / Journal of Structural Geology 29 (2007) 1831e1842
Author's personal copy
The maximum circumferential stress (sqq) criterion is usedto calculate the kink angles. This criterion assumes that thelocation of the maximum circumferential stress at a fault tipdetermines the initial kink angle (Erdogan and Sih, 1963;Cotterell and Rice, 1980). We computed sqq around the pointwhere the central zone meets the cohesive end zone, at a radialdistance r ¼ 0.0075L.
In the modeling experiments, Young’s modulus ¼ 20 GPaand Poisson’s ratio ¼ 0.2, consistent with properties of sand-stone (Atkinson, 1987). We tested the faults under biaxialcompression in plane strain by setting the maximum compres-sive stress s1 ¼ 40 MPa, consistent with sH values at 1500e2000 m depth in strike-slip environments (Engelder, 1993).We varied the minimum compressive stress, s3, from 0 to25 MPa in models of isolated faults, again consistent withstrike-slip environments, and set it to 5 MPa in models ofinteracting faults.
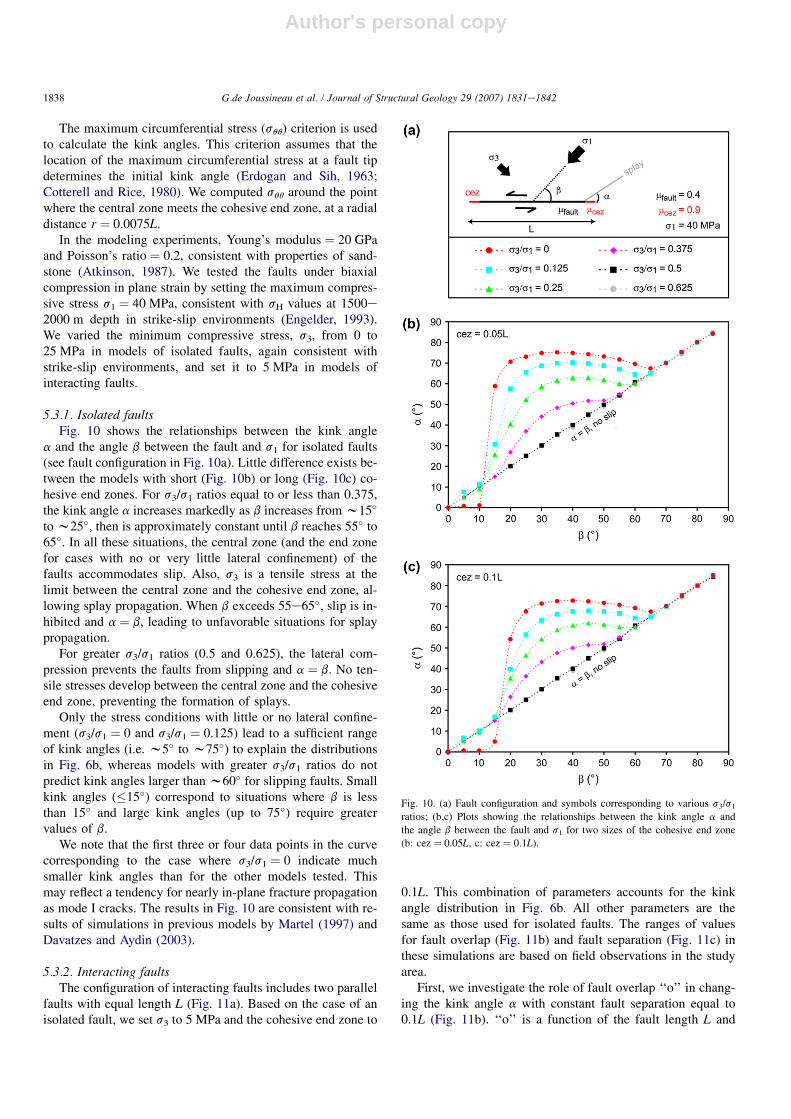
5.3.1. Isolated faultsFig. 10 shows the relationships between the kink angle
a and the angle b between the fault and s1 for isolated faults(see fault configuration in Fig. 10a). Little difference exists be-tween the models with short (Fig. 10b) or long (Fig. 10c) co-hesive end zones. For s3/s1 ratios equal to or less than 0.375,the kink angle a increases markedly as b increases from w15�
to w25�, then is approximately constant until b reaches 55� to65�. In all these situations, the central zone (and the end zonefor cases with no or very little lateral confinement) of thefaults accommodates slip. Also, s3 is a tensile stress at thelimit between the central zone and the cohesive end zone, al-lowing splay propagation. When b exceeds 55e65�, slip is in-hibited and a ¼ b, leading to unfavorable situations for splaypropagation.
For greater s3/s1 ratios (0.5 and 0.625), the lateral com-pression prevents the faults from slipping and a ¼ b. No ten-sile stresses develop between the central zone and the cohesiveend zone, preventing the formation of splays.
Only the stress conditions with little or no lateral confine-ment (s3/s1 ¼ 0 and s3/s1 ¼ 0.125) lead to a sufficient rangeof kink angles (i.e. w5� to w75�) to explain the distributionsin Fig. 6b, whereas models with greater s3/s1 ratios do notpredict kink angles larger than w60� for slipping faults. Smallkink angles (�15�) correspond to situations where b is lessthan 15� and large kink angles (up to 75�) require greatervalues of b.
We note that the first three or four data points in the curvecorresponding to the case where s3/s1 ¼ 0 indicate muchsmaller kink angles than for the other models tested. Thismay reflect a tendency for nearly in-plane fracture propagationas mode I cracks. The results in Fig. 10 are consistent with re-sults of simulations in previous models by Martel (1997) andDavatzes and Aydin (2003).
5.3.2. Interacting faultsThe configuration of interacting faults includes two parallel
faults with equal length L (Fig. 11a). Based on the case of anisolated fault, we set s3 to 5 MPa and the cohesive end zone to
0.1L. This combination of parameters accounts for the kinkangle distribution in Fig. 6b. All other parameters are thesame as those used for isolated faults. The ranges of valuesfor fault overlap (Fig. 11b) and fault separation (Fig. 11c) inthese simulations are based on field observations in the studyarea.
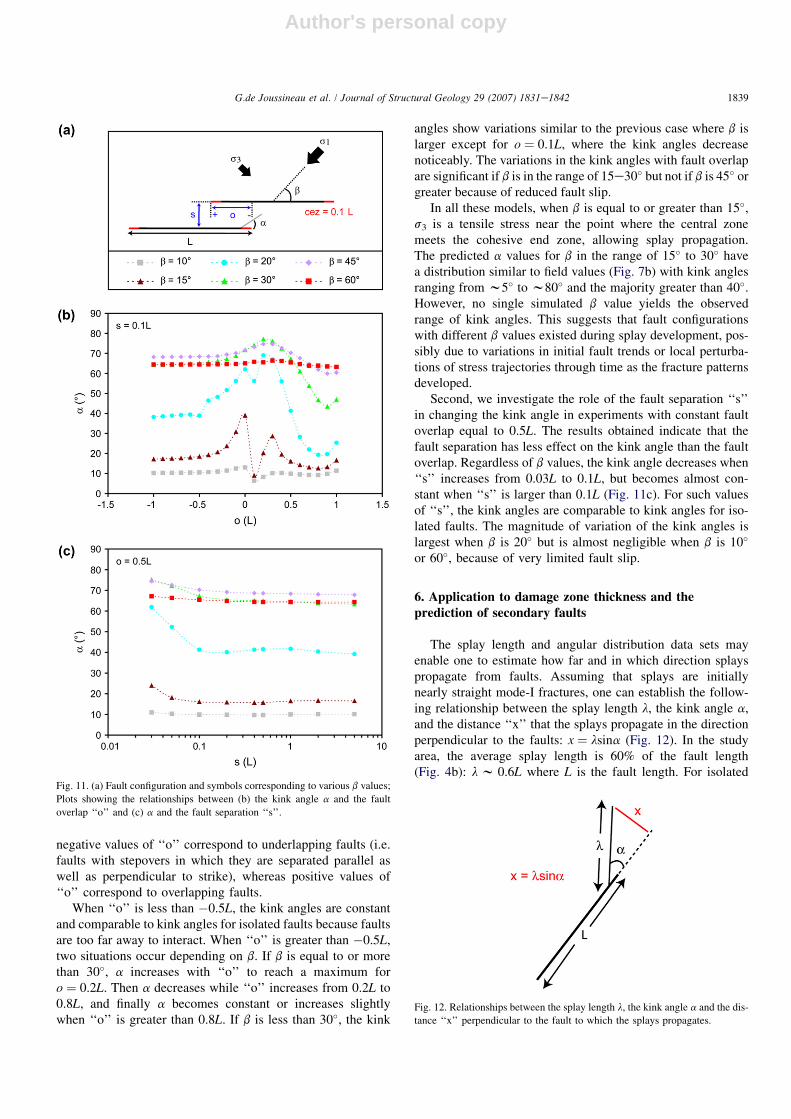
First, we investigate the role of fault overlap ‘‘o’’ in chang-ing the kink angle a with constant fault separation equal to0.1L (Fig. 11b). ‘‘o’’ is a function of the fault length L and
Fig. 10. (a) Fault configuration and symbols corresponding to various s3/s1
ratios; (b,c) Plots showing the relationships between the kink angle a and
the angle b between the fault and s1 for two sizes of the cohesive end zone
(b: cez ¼ 0.05L, c: cez ¼ 0.1L).
1838 G.de Joussineau et al. / Journal of Structural Geology 29 (2007) 1831e1842
Author's personal copy
negative values of ‘‘o’’ correspond to underlapping faults (i.e.faults with stepovers in which they are separated parallel aswell as perpendicular to strike), whereas positive values of‘‘o’’ correspond to overlapping faults.
When ‘‘o’’ is less than �0.5L, the kink angles are constantand comparable to kink angles for isolated faults because faultsare too far away to interact. When ‘‘o’’ is greater than �0.5L,two situations occur depending on b. If b is equal to or morethan 30�, a increases with ‘‘o’’ to reach a maximum foro ¼ 0.2L. Then a decreases while ‘‘o’’ increases from 0.2L to0.8L, and finally a becomes constant or increases slightlywhen ‘‘o’’ is greater than 0.8L. If b is less than 30�, the kink
angles show variations similar to the previous case where b islarger except for o ¼ 0.1L, where the kink angles decreasenoticeably. The variations in the kink angles with fault overlapare significant if b is in the range of 15e30� but not if b is 45� orgreater because of reduced fault slip.
In all these models, when b is equal to or greater than 15�,s3 is a tensile stress near the point where the central zonemeets the cohesive end zone, allowing splay propagation.The predicted a values for b in the range of 15� to 30� havea distribution similar to field values (Fig. 7b) with kink anglesranging from w5� to w80� and the majority greater than 40�.However, no single simulated b value yields the observedrange of kink angles. This suggests that fault configurationswith different b values existed during splay development, pos-sibly due to variations in initial fault trends or local perturba-tions of stress trajectories through time as the fracture patternsdeveloped.
Second, we investigate the role of the fault separation ‘‘s’’in changing the kink angle in experiments with constant faultoverlap equal to 0.5L. The results obtained indicate that thefault separation has less effect on the kink angle than the faultoverlap. Regardless of b values, the kink angle decreases when‘‘s’’ increases from 0.03L to 0.1L, but becomes almost con-stant when ‘‘s’’ is larger than 0.1L (Fig. 11c). For such valuesof ‘‘s’’, the kink angles are comparable to kink angles for iso-lated faults. The magnitude of variation of the kink angles islargest when b is 20� but is almost negligible when b is 10�
or 60�, because of very limited fault slip.
6. Application to damage zone thickness and theprediction of secondary faults
The splay length and angular distribution data sets mayenable one to estimate how far and in which direction splayspropagate from faults. Assuming that splays are initiallynearly straight mode-I fractures, one can establish the follow-ing relationship between the splay length l, the kink angle a,and the distance ‘‘x’’ that the splays propagate in the directionperpendicular to the faults: x ¼ lsina (Fig. 12). In the studyarea, the average splay length is 60% of the fault length(Fig. 4b): l w 0.6L where L is the fault length. For isolated
Fig. 11. (a) Fault configuration and symbols corresponding to various b values;
Plots showing the relationships between (b) the kink angle a and the fault
overlap ‘‘o’’ and (c) a and the fault separation ‘‘s’’.
Fig. 12. Relationships between the splay length l, the kink angle a and the dis-
tance ‘‘x’’ perpendicular to the fault to which the splays propagates.
1839G.de Joussineau et al. / Journal of Structural Geology 29 (2007) 1831e1842
Author's personal copy
faults, the average kink angle a is 19� (Fig. 6b), so x w 0.2L.This result indicates that on average, a splay propagating froman isolated fault reaches a distance ‘‘x’’ equal to 20% of thefault length. This may help in predicting the maximum thick-ness of fault damage zones in the case of faults developed bysequential shearing as in the study area (Myers and Aydin,2004). For such faults, the damage zones may be constructedfrom splays (de Joussineau and Aydin, in press), implying thattheir maximum width is defined by the length and orientationproperties of the longest splays emanating from the faults.Also, by proposing a means of estimating the length and ori-entation of splays in the tip region of fault segments, we pro-vide a basis for a better understanding of the phenomenon offault segment linkage by the way of splays.
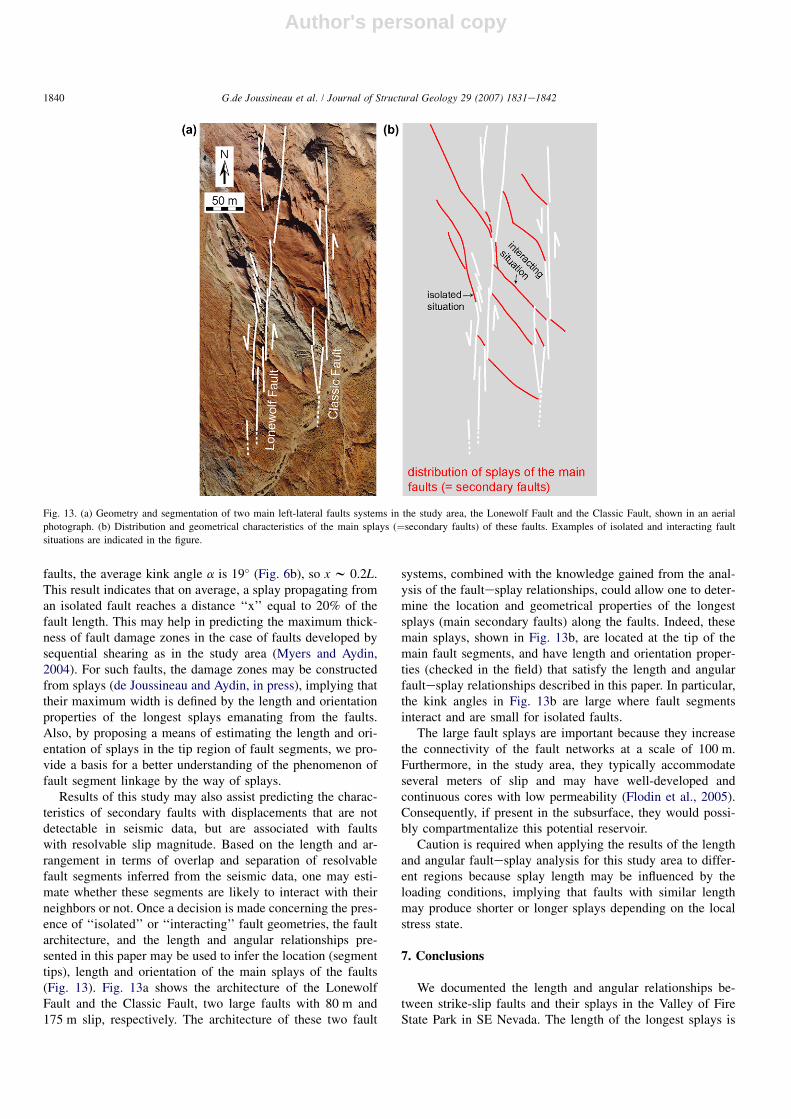
Results of this study may also assist predicting the charac-teristics of secondary faults with displacements that are notdetectable in seismic data, but are associated with faultswith resolvable slip magnitude. Based on the length and ar-rangement in terms of overlap and separation of resolvablefault segments inferred from the seismic data, one may esti-mate whether these segments are likely to interact with theirneighbors or not. Once a decision is made concerning the pres-ence of ‘‘isolated’’ or ‘‘interacting’’ fault geometries, the faultarchitecture, and the length and angular relationships pre-sented in this paper may be used to infer the location (segmenttips), length and orientation of the main splays of the faults(Fig. 13). Fig. 13a shows the architecture of the LonewolfFault and the Classic Fault, two large faults with 80 m and175 m slip, respectively. The architecture of these two fault
systems, combined with the knowledge gained from the anal-ysis of the faultesplay relationships, could allow one to deter-mine the location and geometrical properties of the longestsplays (main secondary faults) along the faults. Indeed, thesemain splays, shown in Fig. 13b, are located at the tip of themain fault segments, and have length and orientation proper-ties (checked in the field) that satisfy the length and angularfaultesplay relationships described in this paper. In particular,the kink angles in Fig. 13b are large where fault segmentsinteract and are small for isolated faults.
The large fault splays are important because they increasethe connectivity of the fault networks at a scale of 100 m.Furthermore, in the study area, they typically accommodateseveral meters of slip and may have well-developed andcontinuous cores with low permeability (Flodin et al., 2005).Consequently, if present in the subsurface, they would possi-bly compartmentalize this potential reservoir.
Caution is required when applying the results of the lengthand angular faultesplay analysis for this study area to differ-ent regions because splay length may be influenced by theloading conditions, implying that faults with similar lengthmay produce shorter or longer splays depending on the localstress state.
7. Conclusions
We documented the length and angular relationships be-tween strike-slip faults and their splays in the Valley of FireState Park in SE Nevada. The length of the longest splays is
Fig. 13. (a) Geometry and segmentation of two main left-lateral faults systems in the study area, the Lonewolf Fault and the Classic Fault, shown in an aerial
photograph. (b) Distribution and geometrical characteristics of the main splays (¼secondary faults) of these faults. Examples of isolated and interacting fault
situations are indicated in the figure.
1840 G.de Joussineau et al. / Journal of Structural Geology 29 (2007) 1831e1842
Author's personal copy
correlated to the fault length by a power law and, on average,is 60% of the fault length. Little correlation is found betweensplay length and fault slip magnitude, possibly because faultgrowth by segment linkage affects the slip distribution alongthe faults. Two distinct angular relationships between faultsand splays exist depending on the fault configuration. In theisolated fault configuration, where splays propagating froma fault do not interfere with a neighboring fault, most kink an-gles are less than 30� with an average of 19�. In the interactingfault configuration, where splays propagating from a fault con-nect to a neighboring fault, most kink angles are more than 40�
with an average value of 50�.We used analytical models to test the influence of the load-
ing conditions on splay length. Under uniaxial compression,the splay length tends to infinity. Under biaxial compression,the splay length is finite and depends on the stress ratios3/s1. When this ratio increases, splay length decreases. Fur-thermore, different fault geometries yield different splaylengths for similar loading conditions, suggesting that boththe angle b between the fault and s1 and the kink angle a in-fluence the splay length.
We also used a 2D mechanical model to investigate theangular relationships between faults and splays establishedin the field. Models of isolated faults under plane strainconditions show that small kink angles correspond to a situ-ation where faults make a small angle (b) with the remotemaximum compressive stress, whereas large kink anglescorrespond to greater b values. Models of interacting faultsshow that, in addition to the important role of b, fault over-lap and fault separation can induce important variations inthe kink angle, which could explain the variety of kink an-gles measured in the field.
The knowledge acquired in terms of length and angular re-lationships between faults and their splays allows one to envi-sion how far and in which direction splays may propagatefrom their parent faults. This may help to estimate the maxi-mum thickness of fault damage zones, and provides a basisfor a better understanding of fault segment linkage. Finally,it may permit the prediction of the length and orientation ofunresolvable secondary faults associated with large faultsthat have resolvable slip magnitude in the subsurface.
Acknowledgments
We acknowledge support from the Department of Energy,Basic Energy Sciences, Geosciences Research Program (Grant#DE-FG03-94ER14462 to Atilla Aydin and David D. Pollard),and assistance in the field by Ann-Laure Moreau and Christo-pher Wilson. Reviews by Laurel Goodwin and an anonymousreviewer and help by Editor William Dunne were muchappreciated.
References
Ahmadov, R., Aydin, A., Karimi-Fard, M., Durlofsky, L.J., 2007. Permeability
upscaling of fault zones in the Aztec Sandstone, Valley of Fire State Park,
Nevada with a focus on slip surfaces and slip bands. Hydrogeology Journal
(Online First), doi:10.1007/s10040-007-0180-2.
Atkinson, B.K., 1987. Fracture Mechanics of Rocks. Academic Press, London.
Barenblatt, G.I., 1962. The mathematical theory of equilibrium cracks in brit-
tle fracture. Advances in Applied Mechanics 7, 55e129.
Barquins, M., Petit, J.P., 1992. Kinetic instabilities during the propagation of
a branch crack: effects of loading conditions and internal pressure. Journal
of Structural Geology 14, 893e903.
Barquins, M., Petit, J.P., Maugis, D., Ghalayini, K., 1991. Path and kinetics of
branching from defects under uniaxial and biaxial compressive loading.
International Journal of Fracture 54, 139e163.
Bohannon, R.G., 1983. Mesozoic and Cenozoic tectonic development of the
Muddy, North Muddy, and northern Black Mountains, Clark County,
Nevada. In: Miller, D.M., Todd, V.R., Howard, K.A. (Eds.), Tectonic
and Stratigraphic Studies in the Eastern Great Basin. Geological Society
of America Memoir, 157, pp. 125e148.
Bohannon, R.G., Grow, J.A., Miller, J.J., Blank, R.H., 1993. Seismic stratigra-
phy and tectonic development of Virgin River depression and associated
basins, southeastern Nevada and northwestern Arizona. Geological Society
of America Bulletin 105, 501e520.
Bombolakis, E.G., 1973. Study of the brittle fracture process under uniaxial
compression. Tectonophysics 18, 231e248.
Brace, W.F., Bombolakis, E.G., 1963. A note on brittle crack growth in com-
pression. Journal of Geophysical Research 68, 3709e3713.
Burgmann, R., Pollard, D.D., Martel, S.J., 1994. Slip distributions on faults: ef-
fects of stress gradients, inelastic deformation, heterogeneous host-rock stiff-
ness, and fault interaction. Journal of Structural Geology 16, 1675e1690.
Cakir, M., Aydin, A., Campagna, D.J., 1998. Deformation pattern around the
conjoining strike-slip fault systems in the Basin and Range, southeast
Nevada: the role of strike-slip faulting in basin formation and inversion.
Tectonics 17, 344e359.
Carpenter, D.G., Carpenter, J.A., 1994. Fold-thrust structure, synorogenic
rocks and structural analysis of the North Muddy and Muddy Mountains,
Clark County, Nevada. In: Dobbs, S.W., Taylor, W.J. (Eds.), Structural and
Stratigraphic Investigations and Petroleum Potential of Nevada, with
Special Emphasis South of the Railroad Valley Producing Trend. Nevada
Petroleum Society Conference II, pp. 65e94.
Cartwright, J.A., Trudgill, B.D., Mansfield, C.S., 1995. Fault growth by seg-
ment linkage: an explanation for scatter in maximum displacement and
trace length data from the Canyonlands Grabens of SE Utah. Journal of
Structural Geology 17, 1319e1326.
Chaker, C., Barquins, M., 1996. Sliding effect on branch crack. Physics and
Chemistry of the Earth 21, 319e323.
Cooke, M., 1997. Fracture localization along faults with spatially varying fric-
tion. Journal of Geophysical Research 102, 22425e22434.
Cotterell, B., Rice, J.R., 1980. Slightly curved or kinked cracks. International
Journal of Fracture 16, 155e169.
Cowie, P.A., Scholz, C.H., 1992a. Displacement-length scaling relationship for
faults: data synthesis and discussion. Journal of Structural Geology 14,
1149e1156.
Cowie, P.A., Scholz, C.H., 1992b. Physical explanation for the displacement-
length relationship of faults using a post-yield fracture mechanics model.
Journal of Structural Geology 14, 1133e1148.
Cruikshank, K.M., Zhao, G., Johnson, A.M., 1991. Analysis of minor fractures
associated with joints and faulted joints. Journal of Structural Geology 13,
865e886.
Davatzes, N.C., Aydin, A., 2003. The formation of conjugate normal fault sys-
tems in folded sandstone by sequential jointing and shearing, Waterpocket
monocline, Utah. Journal of Geophysical Research 108, 2478,
doi:10.1029/2002JB002289.
Davatzes, N.C., Aydin, A., Eichhubl, P., 2003a. Overprinting faulting mecha-
nisms during the development of multiple sets in sandstone, Chimney
Rock fault array, Utah, USA. Tectonophysics 363, 1e18.
Davatzes, N.C., Aydin, A., Eichhubl, P., 2003b. Overprinting faulting mecha-
nisms in high porosity sandstones of SW Utah. Journal of Structural
Geology 25, 1795e1813.
Dawers, N.H., Anders, M.H., Scholz, C.H., 1993. Growth of normal faults:
Displacement-length scaling. Geology 21, 1107e1110.
1841G.de Joussineau et al. / Journal of Structural Geology 29 (2007) 1831e1842
Author's personal copy
de Joussineau, G., Aydin, A., in press. The evolution of the damage zone with
fault growth in sandstone and its multiscale characteristics. Journal of
Geophysical Research (In Press).
Du, Y., Aydin, A., 1995. Shear fracture patterns and connectivity at geometric
complexities along strike-slip faults. Journal of Geophysical Research 100,
18093e18102.
Dugdale, D.S., 1960. Yielding of steel sheets containing slits. Journal of the
Mechanics and Physics of Solids 8, 100e104.
Eichhulb, P., Taylor, W.L., Pollard, D.D., Aydin, A., 2004. Paleo-fluid flow and
deformation in the Aztec Sandstone at the Valley of Fire, NevadadEvi-
dence for the coupling of hydrogeologic, diagenetic and tectonic processes.
Geological Society of America Bulletin 116, 1120e1136.
Engelder, T., 1993. Stress Regimes in the Lithosphere. Princeton University
Press, NJ, USA.
Erdogan, F., Sih, G.C., 1963. On the crack extension in plates under plane
loading and transverse shear. Journal of Basic Engineering 85, 519e527.
Fletcher, R.C., Pollard, D.D., 1981. Anticrack model for pressure solution sur-
faces. Geology 9, 419e424.
Flodin, E., Aydin, A., 2004a. Evolution of a strike-slip fault network, Valley of
Fire State Park, southern Nevada. Geological Society of America Bulletin
116, 42e59.
Flodin, E., Aydin, A., 2004b. Faults with asymmetric damage zones in sand-
stone, Valley of Fire State Park, southern Nevada. Journal of Structural
Geology 26, 983e988.
Flodin, E., Prasad, M., Aydin, A., 2003. Petrophysical constraints on deformation
styles in Aztec Sandstone. Pure and Applied Geophysics 160, 1589e1610.
Flodin, E.A., Gerdes, M., Aydin, A., Wiggins, W.D., 2005. Petrophysical prop-
erties of cataclastic fault rock in sandstone. In: Sorkhabi, R., Tsuji, Y.
(Eds.), Faults, fluid Flow, and Petroleum Traps. American Association of
Petroleum Geologists Memoir, 85, pp. 197e227.
Granier, T., 1985. Origin, damping and pattern of development of faults in
granite. Tectonics 4, 721e737.
Gupta, A., Scholz, C.H., 2000. A model of normal fault interaction based on
observations and theory. Journal of Structural Geology 22, 865e879.
Hill, R., 1989. Analysisof deformation bands in the Aztec Sandstone, Valley of Fire
State Park, Nevada. MS Thesis, Las Vegas University, University of Nevada.
Horii, H., Nemat-Nasser, S., 1983. Estimate of stress intensity factors for in-
teracting cracks, in: Yuceoglu, U., Sierakowski, R.L., Glasgow, D.A.
(Eds), Advances in Aerospace Structures, Materials and Dynamics. Pro-
ceedings of the ASME Symposium, pp. 111e117.
Horii, H., Nemat-Nasser, S., 1985. Compression induced microcrack growth in
brittle solids: axial splitting and shear failure. Journal of Geophysical
Research 90, 3105e3125.
Horii, H., Nemat-Nasser, S., 1986. Brittle failure in compression: splitting,
faulting and brittle-ductile transition. Philosophical transactions of the
Royal Society of London Series A. Mathematical and Physical Sciences
319, 337e374.
Ingraffea, A.R., 1987. Theory of crack initiation and propagation in rock. In:
Atkinson, A.K. (Ed.), Fracture Mechanics of Rock. Academic Press,
London, pp. 71e110.
Kattenhorn, S.A., Marshall, S.T., 2006. Fault-induced perturbed stress fields
and associated tensile and compressive deformation at fault tips in the
ice shell of Europa: implications for fault mechanics. Journal of Stuctural
Geology 28, 2204e2221.
Kelly, P.G., Sanderson, D.J., Peacock, D.C.P., 1998. Linkage and evolution of
conjugate strike-slip fault zones in limestones of Somerset and Northum-
bria. Journal of Structural Geology 20, 1477e1493.
Kim, Y., Peacock, D.C.P., Sanderson, D.J., 2003. Mesoscale strike-slip faults
and damage zones at Marsalforn, Gozo Island, Malta. Journal of Structural
Geology 25, 793e812.
Kim, Y., Peacock, D.C.P., Sanderson, D.J., 2004. Fault damage zones. Journal
of Structural Geology 26, 503e517.
Liu, X., 1983. Perturbations de contraintes liees aux structures cassantes dans
les calcaires fins du Languedoc: Observations et simulations mathema-
tiques. 3rd Cycle Thesis, Universite Montpellier II.
Mansfield, C., Cartwright, J., 2001. Fault growth by linkage: observations and im-
plications from analogue models. Journal of Structural Geology 23, 745e763.
Martel, S.J., 1990. Formation of compound strike-slip fault zones, Mount
Abbot quadrangle, California. Journal of Structural Geology 12, 869e877.
Martel, S.J., 1997. Effects of cohesive zones on small faults and implications
for secondary fracturing and fault trace geometry. Journal of Structural
Geology 19, 835e847.
Martel, S.J., Boger, W.A., 1998. Geometry and mechanics of secondary frac-
turing around small three-dimensional faults in granitic rocks. Journal of
Geophysical Research 103, 21299e21314.
Martel, S.J., Pollard, D.D., Segall, P., 1988. Development of simple strike-slip
fault zones, Mount Abbot quadrangle, Sierra Nevada, California. Geolog-
ical Society of America Bulletin 100, 1451e1465.
McGrath, A.G., Davison, I., 1995. Damage zone geometry around fault tips.
Journal of Structural Geology 17, 1011e1024.
Muskhelisvili, N.I., 1953. Some Basic Problems of the Mathematical Theory
of Elasticity. Noordhoff Ltd, Groningen, The Netherlands.
Mutlu, O., Pollard, D.D., 2006. A complementarity approach for modeling
fractures. The 41st U.S. Symposium on Rock Mechanics (USRMS): ‘50
Years of Rock MechanicsdLandmarks and Future Challenges’, Golden
Rocks, Colorado, June 17e21.
Myers, R., 1999. Structure and hydraulics of brittle faults in sandstone. PhD
thesis, Stanford University.
Myers, R., Aydin, A., 2004. The evolution of faults formed by shearing across
joint zones in sandstone. Journal of Structural Geology 26, 947e966.
Nemat-Nasser, S., Horii, H., 1982. Compression induced non planar crack
extension with application to splitting, exfoliation and rock-burst. Journal
of Geophysical Research 87, 6805e6821.
Nemat-Nasser, S., Horii, H., 1984. Rock failure in compression. International
Journal of Engineering Sciences 22, 999e1011.
Peacock, D.C.P., 1991. Displacement and segment linkage in strike-slip fault
zones. Journal of Structural Geology 13, 1025e1035.
Peacock, D.C.P., Sanderson, D.J., 1991. Displacement, segment linkage and re-
lay ramps in normal fault zones. Journal of Structural Geology 13, 721e733.
Peacock, D.C.P., Sanderson, D.J., 1995. Pull-aparts, shear fractures and pres-
sure solution. Tectonophysics 241, 1e13.
Petit, J.P., Barquins, M., 1988. Can natural faults propagate under mode II
conditions? Tectonics 7, 1243e1256.
Petit, J.P., Mattauer, M., 1995. Paleostress superimposition deduced from
mesoscale structures in limestone: The Matelles exposure, Languedoc,
France. Journal of Structural Geology 17, 245e256.
Pollard, D.D., Segall, P., 1987. Theoretical displacements and stresses near
fractures in rock: with applications to faults, joints, veins, dikes, and solu-
tion surfaces. In: Atkinson, B.K. (Ed.), Fracture Mechanics of Rocks.
Academic Press, London, pp. 277e349.
Rispoli, R., 1981. Stress fields about strike-slip faults inferred from stylolites
and tension gashes. Tectonophysics 75, 29e36.
Schlische, R.W., Young, S.S., Ackermann, R.V., Gupta, A., 1996. Geometry
and scaling relations of a population of very small rift-related normal
faults. Geology 24, 683e686.
Segall, P., Pollard, D.D., 1983. Nucleation and growth of strike-slip faults in
granite. Journal of Geophysical Research 88, 555e568.
Schulson, E.M., 2002. On the origin of a wedge crack within the icy crust of
Europa. Journal of Geophysical Research Planets 107, 5107e5116.
Sternlof, K.R., Rudnicki, J.W., Pollard, D.D., 2005. Anticrack inclusion model
for compaction bands in sandstone. Journal of Geophysical Research 110,
B11403, doi:10.1029/2005JB003764.
Taylor, W.L., Pollard, D.D., Aydin, A., 1999. Fluid flow in discrete joint sets:
Field observations and numerical simulations. Journal of Geophysical
Research 104, 28983e29006.
Willemse, E.J.M., Pollard, D.D., 1998. On the orientation and patterns of wing
cracks and solution surfaces at the tips of a sliding flaw or fault. Journal of
Geophysical Research 103, 2427e2438.
Wilson, G., 1960. The tectonics of the ‘Great ice Chasm’, Filchner Ice Shelf,
Antarctica. Proceedings of the Geological Association of London 71,
130e138.
Wilkins, S.J., Schultz, R.A., 2005. 3-D cohesive end zone model for source
scaling of strike-slip interplate earthquakes. Bulletin of the Seismological
Society of America 95, 2232e2258.
1842 G.de Joussineau et al. / Journal of Structural Geology 29 (2007) 1831e1842
Related Documents