Characterization of Saharan dust layers over Naples (Italy) during 2000–2003 EARLINET project Gianluca Pisani a , Antonella Boselli a, b, ⁎, Nicola Spinelli a , Xuan Wang a, c a CNISM and Dipartimento di Scienze Fisiche, Università di Napoli Federico II, Italy b Istituto di Metodologie per l'Analisi Ambientale IMAA-CNR, Potenza, Italy c SPIN-CNR, Napoli, Italy article info abstract Article history: Received 25 March 2011 Received in revised form 15 July 2011 Accepted 19 July 2011 Vertically resolved observations of dust optical properties were carried out at the EARLINET station of Naples (southern Italy, 40.838 ° N, 14.183 ° E, 118 m above sea level) from May 2000 to August 2003. 45 outbreaks with a mean temporal length of about 4 days were observed, 40% of which were characterized by dust plume intrusion into the Planetary Boundary Layer. The mean values of the altitude of base, top and of the thickness of the dust plume were derived. Dust optical properties were studied along the vertical profile in terms of statistical and climatological analysis of aerosol backscatter, extinction and lidar ratio measured inside the dust layer. Mean values of backscattering and extinction coefficients of (1.2 ± 0.1) 10 -6 m -1 sr -1 and (0.61 ± 0.06) 10 -4 m -1 , respectively, were obtained in the whole observation period, while the mean value of LR at 351 nm resulted to be 47 ± 3 sr. Mean values of dust concentration and dust fluxes were also estimated. The highest values of concentration have been observed on spring and summer months resulting of (150 ± 60) μg·m -3 and (80 ± 30) μg·m -3 , and mean dust fluxes were (0.8 ± 0.4)·10 -3 gm -2 s -1 and (1.6 ± 0.7)·10 -3 gm -2 s -1 , respectively. Finally, aerosol optical properties retrieved from lidar vertical profiles and sun-photometer measurement, in-situ sampling and models outcomes were used to fully examine the most intense dust outbreak observed during the whole study period. © 2011 Elsevier B.V. All rights reserved. Keywords: Lidar Saharan dust Aerosol Troposphere Vertical variability 1. Introduction Tropospheric aerosols play a relevant role, in the Earth's radiative budget (Haywood et al., 2003). Nevertheless, the actual knowledge of the aerosol spatial and temporal distribu- tion is still inadequate to carefully estimate the aerosol role on climate change, both on regional and on local scale (IPCC, Climate Change, 2007). Large uncertainties affect the current estimates of the aerosol properties arising from the lack of a systematic statistical survey during a long time period and in a large spatial scale, and from the large variability of aerosols sources, properties and distribution (Masmoudi et al. 2003). In order to overtake this uncertainty, several efforts have been made to improve measurements and data sets. In particular, the establishment in the last decade of networks performing systematic observation of optical, microphysical and radiative aerosol properties represented accordingly a substantial ac- complishment. Within each network, local studies based on long data-sets were also performed with the aim to develop a long-term global climatology of the aerosol properties (Bösenberg et al., 2003; Holben et al., 1998; Kim et al. 2008). The Mediterranean area is a unique case of study in terms of both climatic sensitivity and direct radiative forcing values (Hatzianastassiou et al., 2007) due to a large aerosol presence that is fostered by both meteorological conditions and long exposure to solar radiation. In particular, wide amount of dust (about 120 Tg yr –1 ) is transported over large distances from North African region towards the Mediterranean (Escudero Atmospheric Research 102 (2011) 286–299 ⁎ Corresponding author at: CNISM and Dipartimento di Scienze Fisiche, Università di Napoli Federico II, Italy. E-mail address: [email protected] (A. Boselli). 0169-8095/$ – see front matter © 2011 Elsevier B.V. All rights reserved. doi:10.1016/j.atmosres.2011.07.012 Contents lists available at ScienceDirect Atmospheric Research journal homepage: www.elsevier.com/locate/atmos

Welcome message from author
This document is posted to help you gain knowledge. Please leave a comment to let me know what you think about it! Share it to your friends and learn new things together.
Transcript

Atmospheric Research 102 (2011) 286–299
Contents lists available at ScienceDirect
Atmospheric Research
j ourna l homepage: www.e lsev ie r.com/ locate /atmos
Characterization of Saharan dust layers over Naples (Italy) during2000–2003 EARLINET project
Gianluca Pisani a, Antonella Boselli a,b,⁎, Nicola Spinelli a, Xuan Wang a,c
a CNISM and Dipartimento di Scienze Fisiche, Università di Napoli Federico II, Italyb Istituto di Metodologie per l'Analisi Ambientale IMAA-CNR, Potenza, Italyc SPIN-CNR, Napoli, Italy
a r t i c l e i n f o
⁎ Corresponding author at: CNISM and DipartimenUniversità di Napoli Federico II, Italy.
E-mail address: [email protected] (A. Boselli).
0169-8095/$ – see front matter © 2011 Elsevier B.V.doi:10.1016/j.atmosres.2011.07.012
a b s t r a c t
Article history:Received 25 March 2011Received in revised form 15 July 2011Accepted 19 July 2011
Vertically resolved observations of dust optical properties were carried out at the EARLINETstation of Naples (southern Italy, 40.838° N, 14.183° E, 118 m above sea level) fromMay 2000 toAugust 2003. 45 outbreaks with a mean temporal length of about 4 days were observed, 40% ofwhich were characterized by dust plume intrusion into the Planetary Boundary Layer.The mean values of the altitude of base, top and of the thickness of the dust plume werederived. Dust optical properties were studied along the vertical profile in terms of statisticaland climatological analysis of aerosol backscatter, extinction and lidar ratio measured insidethe dust layer. Mean values of backscattering and extinction coefficients of (1.2±0.1)10−6 m−1 sr−1 and (0.61±0.06)10−4 m−1, respectively, were obtained in the wholeobservation period, while the mean value of LR at 351 nm resulted to be 47±3 sr. Meanvalues of dust concentration and dust fluxes were also estimated. The highest values ofconcentration have been observed on spring and summer months resulting of (150±60)μg·m−3 and (80±30)μg·m-3, and mean dust fluxes were (0.8±0.4)·10−3 g m−2 s−1 and(1.6±0.7)·10−3 g m−2 s−1, respectively.Finally, aerosol optical properties retrieved from lidar vertical profiles and sun-photometermeasurement, in-situ sampling and models outcomes were used to fully examine the mostintense dust outbreak observed during the whole study period.
© 2011 Elsevier B.V. All rights reserved.
Keywords:LidarSaharan dustAerosolTroposphereVertical variability
1. Introduction
Tropospheric aerosols play a relevant role, in the Earth'sradiative budget (Haywood et al., 2003). Nevertheless, theactual knowledge of the aerosol spatial and temporal distribu-tion is still inadequate to carefully estimate the aerosol role onclimate change, both on regional and on local scale (IPCC,Climate Change, 2007). Large uncertainties affect the currentestimates of the aerosol properties arising from the lack of asystematic statistical survey during a long time period and in alarge spatial scale, and from the large variability of aerosolssources, properties and distribution (Masmoudi et al. 2003). In
to di Scienze Fisiche
All rights reserved.
,
order to overtake this uncertainty, several efforts have beenmade to improvemeasurements anddata sets. Inparticular, theestablishment in the last decade of networks performingsystematic observation of optical, microphysical and radiativeaerosol properties represented accordingly a substantial ac-complishment. Within each network, local studies based onlong data-sets were also performed with the aim to developa long-term global climatology of the aerosol properties(Bösenberg et al., 2003; Holben et al., 1998; Kim et al. 2008).
TheMediterranean area is a unique case of study in terms ofboth climatic sensitivity and direct radiative forcing values(Hatzianastassiou et al., 2007) due to a large aerosol presencethat is fostered by both meteorological conditions and longexposure to solar radiation. In particular, wide amount of dust(about 120 Tg yr–1) is transported over large distances fromNorth African region towards the Mediterranean (Escudero

287G. Pisani et al. / Atmospheric Research 102 (2011) 286–299
et al., 2006; Gerasopoulos et al. 2009; Muller et al. 2009;Papayannis et al. 2005, 2008, 2009; Pérez et al., 2006a,b)mainlybecause of low pressure systems, called Sharav cyclones,coming from Nord West direction (Barkan et al., 2004;Engelstaedter et al., 2006; Moulin et al., 1998). Northwardstransport of dust follows a seasonal pattern with largeramounts of dust moved across the Mediterranean area duringspring and summer months.
Nevertheless, according to the last IPCC report (IPCC,Climate Change, 2007) currently uncertainties in the radiativeforcing effect of dust are still very high. These uncertaintiesdepend on our incomplete understanding of dust relatedprocesses (as production, transport, entrainment, depositionand removal) andare largelydeterminedby insufficient data onvertical distribution of desert dust aerosols and on their opticaland microphysical properties (Papayannis et al., 2009; Pérezet al., 2006a,b). Moreover, also the coarse spatial resolution ofsoil data and meteorological fields in global models createslarge uncertainty (Zender et al., 2003).
In particular, the radiative impact of the dust over theMediterranean is still poorly known because the aerosoldistribution is strongly influenced by complex synoptic meteo-rological conditions (di Sarra et al., 2001). In addition, currentlyused models are considered not still suitable to rightly describephysical and chemical processes involving dust along thetransport path in the Mediterranean region (Kallos et al., 2007).For these reasons, in the last years the effort of the scientificcommunity has been devoted to investigate and model regionaland global transport of dust. In this respect, Israelevich et al.(2002) highlighted the importance to know the dust transportdynamics and the aerosol properties as well as their spatial andtemporal correlationwithhigh spatial and temporal resolution inorder to study Mediterranean weather and climate.
Actually, several efforts have beenmade to understand thedifferent phases of the dust cycle over Mediterranean andEuropean area and to characterize vertical profiles, opticaland microphysical properties, and chemical composition ofaerosols during dust outbreaks. To this aim different in-struments based on passive and active remote sensingtechniques, in situ observations, satellite and radiosondemeasurements and air mass trajectories were recently used(Bellantone et al., 2008; Di Iorio et al., 2009).
Moreover, several field campaigns have been carried out inAfrica to investigate the role of dust aerosol on the regionalclimate. For instance, during Saharan Mineral Dust Experiment(SAMUM), vertically resolved observations of dust weresimultaneously performed close to a source of desert dust andin remote areas (Ansmann et al., 2008; Muller et al., 2009;Tesche et al., 2009) with the aim to characterize dust particlesclose to dust sources and to quantify dust-related radiativeeffects. Nevertheless, the most of recent papers refer to a singleevents or to short-term campaigns (Guerrero-Rascado et al.,2009; Karam et al., 2010; Papayannis et al., 2005; Pavese et al.,2009; Tafuro et al., 2006;Wagner et al., 2009)whilst fewof themconcern the study on a systematic base of the dust opticalproperties measured in the Mediterranean area with highvertical and temporal resolution (Balis et al., 2004; Di Iorio et al.,2009; Gobbi et al., 2004; Kishcha et al., 2005;Mattis et al., 2008;Mona et al., 2006; Papayannis et al. 2008, 2009). Verticallyresolved measurements with high spatial and temporal resolu-tion provide the basis for a long-term global climatology of the
dust properties and are also very important to validate satelliteobservations andevaluate global and regional aerosol dispersionmodels. In this respect, in order to improve the dust transportnumericalmodels it is considered of fundamental importance todefine the variability of the dust plume vertical extension and ofits optical properties (as suggested by the Sand and Dust StormWarning Advisory and Assessment System http://www.wmo.int/pages/prog/arep/wwrp/new/Sand_and_Dust_Storm.html).
This work is based on 3 years of systematic observations oftropospheric aerosol optical properties and spatial distribu-tion performed over Naples under Saharan dust outbreaksconditions. Measurements here reported were carried out bymeans of a lidar system operating in the framework of theEARLINET (European Aerosol Research Lidar Network) net-work (Bösenberg et al., 2001). Data reported in this workwere in part previously analyzed by Papayannis et al. (2008)in their study about Saharan dust intrusions over Europe. Thispaper intends to give a detailed study of Naples area wherethe observed aerosol layering is related to the sea-breezecirculation that influences both the planetary boundary-layerevolution and the observed aerosol vertical distribution (seeBoselli et al., 2009). In particular, the mean optical propertiesof the aerosol observed over the city were studies throughstatistical and climatological analysis and their variabilitywith the height were also evaluated to better characterize thedust plume vertical distribution. Seasonal dependence of theoptical parameters measured in the dust plume was alsoanalyzed.
The optical depth of dust plumewas determined by takinginto account the mean anthropic contribution to total opticaldepth as obtained on the base of 3 years of climatological dataresults (Boselli et al., 2009). The dust load so determinedallowed us to estimate the concentration and the fluxes of thedust transported over the measurement area.
The study area is described in Section 2, instrumentationsand methods are discussed in Section 3. Results of thestatistical analysis of the dust optical properties are showed inSection 4. Finally, the strongest dust event occurred over thestudy area was analyzed as a case study.
2. Study area
The CNISM Lidar station is located on North Westdirection with respect to the Naples city, at 118 m a.s.l. Themeasurement area is characterized by very high aerosolcontent, mainly located below the Planetary Boundary Layer(PBL), arising from both human activities and natural sources.The main sources of anthropogenic aerosols are combustion,industrial activities, vehicular traffic and domestic heating.The city is located on the coast of the Tyrrhenian Sea. As aconsequence of its central location in the Mediterraneanbasin, the city of Naples is affected by long-range transport ofaerosols both of anthropogenic origin arising from industri-alized areas of Europe and of natural origin, as volcanic ashes,desert's dust and sea salt. Being relatively close to the Africancontinent, the Naples area represents an ideal site to studythe transport of dust particles across the MediterraneanSea toward the European continent. In fact, most of the airmass trajectories coming from North Africa pass over Naplesdirectly.

288 G. Pisani et al. / Atmospheric Research 102 (2011) 286–299
3. Methodology and data analysis
Measurements here discussed were carried out using aRaman lidar system operating at a wavelength of 351 nm, asdescribed in Boselli et al. (2003). From Lidar measurementsaerosol backscattering βaer(z) and extinctionαaer(z) coefficientsprofileswere retrievedwith afinal temporal resolutionof 30 minand a vertical resolution of 60 m and 180m, respectively.
The αaer(z) coefficient at laser wavelength was retrievedby means of the method introduced by Ansmann et al. (1990)from Nitrogen Raman lidar signal measured at 382 nm duringnight-time.
The retrieval of theβaer(z) coefficient at 351 nm fromnight-time measurements was performed by using the Ramanmethod (Ansmann et al., 1992). This method is based onsimultaneous detection of both elastic and Nitrogen Ramanlidar echoes. In a different way, the retrieval of the βaer(z)coefficient at 351 nm from daytime measurements wasobtained by using the Klett–Fernald algorithm (Klett, 1981;Fernald, 1984). This method requires a hypothesis on theextinction-to-backscattering ratio (LR) value, which choiceshould be carefully evaluated to prevent large uncertainty onthe retrieved value of the backscattering coefficient. Fordaytime measurements we fixed the LR values taking intoaccount the source regions of the air masses reaching the studyarea and having as references the values of LR determined bythe nearest Raman measurements.
During the EARLINET project several intercomparisonexperiments were carried out to test the performance of theinstrumentation involved in the project (Matthias et al.,2004) and the algorithms used to retrieve aerosol backscat-tering (Böckmann et al., 2004) and extinction coefficients(Pappalardo et al., 2004).
According to the EARLINET protocol, lidar measurementswere systematically carried out three times a week (Mondayat noon time and evening, Thursday in the evening) in clearsky conditions. Additional observations were performedduring Saharan dust outbreaks and other special events (forinstance forest fires and volcanic eruptions). Moreover, longtime series of continuous measurements lasting for morethan 24 h were also carried out to study the evolution of theaerosol layers during complete diurnal cycles.
Dust measurements were taken on alerts of the Atmo-spheric Modeling Weather Forecasting Group of the Univer-sity of Athens (Greece), and online forecast of Euro-Mediterranean Centre on Insular Coastal Dynamics (ICoD-Malta). Forecasts are based on DREAM (Dust RegionalAtmospheric Module) model (Nickovic et al., 2001).
Analytical back-trajectories fromGermanWeather Servicewere used (Kottmeier and Fay, 1998) to identify the sourcesof the aerosol reaching the area under study. Dust outbreakswere identified by crossing the forecasts with 96 hours back-trajectories.
The results here presented include cases corresponding tointrusions of the mineral dust in the PBL.
In our measurements, the PBL top height was defined as theheight corresponding to the absoluteminimumvalue of thefirstorder derivative of the logarithm of the range corrected signal(RCS) (Menut et al., 1999).Moreover, thegradientbehaviorwasanalyzed in order to evaluate the top and the bottom of theaerosol layers.
For layers located above the PBL, the base was fixed at thefirst point corresponding to a strong increase in thebackscatter profile (Matthias et al., 2004). The top of thedust layer was defined as the altitude at which both theaerosol backscatter and its first derivative become null withinthe experimental errors (Papayannis et al., 2008).
It is worth to point out that seeping of mineral dust layerinto the PBL could yield wrong information from the derivativemethod. In these cases analytical back-trajectorieswere used toverify the African origin of the air masses arriving over themeasured area at lower altitude levels (900 and 850 hPapressure levels). These levels are the most representative forthe upper part of the planetary boundary layer (PBL)whose topheight is on average located at 1500 m a.s.l. over the measure-ment area (Boselli et al., 2009). Therefore, when both back-trajectories andDREAMdust concentration profiles highlightedthe presence of dust in the PBL, the base height of the dust layerwas assumed at the minimum altitude level sampled in thebackscatter profile.
A statistical approach was followed in order to study themean optical properties of the aerosol observed over the cityand to evaluate its variability with the height. In particular, astatistical analysis of mean optical properties of the dustplume was performed in terms of α, β and LR as measuredinside the identified dust plumes. Moreover, seasonaldependence of the optical parameters was also analyzed.
In order to analyze the dust vertical distribution, the opticalparameters were integrated over five different atmosphericlayers of a thickness of 1000 m starting from the ground level.The integration over the lowest altitude range was doneconsidering constant down to the ground the value ofbackscattering and extinction coefficient obtained at theminimum height level sampled by the lidar (typically 500 mfor extinction and250 m for backscattering). This assumption isbased on the fact that after the sunset the atmosphere mixedwell in thefirst 500 m. Such aprocedure introduces anerror notlarger than 10% (Bösenberg et al., 2003).
The evaluation of the dust plume optical depth (ODs)allowed us to estimate dust concentrations and fluxes. In fact,the dust load M (gm−2) can be related to ODs through theequation:
M = ODs = σλ:
In the above reported equation, σλ is the specificextinction cross section (m2g-1) that depends on the chemicalcomposition of the particles and on the distance from thesource. A constant specific extinction cross section valueof 0.60±0.04 m2g−1 was assumed at 351 nm. This valuewas obtained by extrapolating data reported for dust byGerasopoulos et al. (2009), according to the wavelengthdependence and assuming a value of −0.15±0.02 for theAngstrom coefficient.
The urban area of Naples is characterized by local andanthropogenic aerosol sources that could largely contributeto the measured total OD, especially when dust seeps into thePBL. Moreover, as reported in ours previous study (Boselli etal., 2009) the sea-breeze circulation can influence theobserved aerosol vertical distribution promoting the devel-opment of layer structures above the PBL. In order to correctlyestimate the dust loading of the observed events, the OD

ab
58%
42%
289G. Pisani et al. / Atmospheric Research 102 (2011) 286–299
contribution of aerosol not related to dust (ODA) at differentaltitude levels should be evaluated. To this aim a meanvertical profile of dust free extinction coefficient was obtainedfrom the results of 220 days of regular lidar measurements(Boselli et al., 2009). From this profile, the values of ODA in therange of each detected dust plume were retrieved. Thesevalues were subtracted to the measured OD to evaluate theODS due to pure dust.
From the corrected dust load and taking into account themeasured dust plume thickness T, we estimated the meanseasonal value of dust concentration inside the plume asC=M/T.
Inorder to estimate dustfluxesweused a synergic approachcombining model outcomes with lidar results. In particular,from the back-trajectories we evaluated the horizontal windspeed (vx) by considering themeandistance covered in the last24 hbefore reachingNaples. Then the dustfluxFwas calculatedas: F=C vx and assuming the dust concentration as constantwith the altitude in the dust plume layer.
Fig. 1. Cluster analysis of back-trajectories of air masses ending over Naplesat 700 hPa pressure level ( about 3000 m) for the period 2000–2003. Maindirections were showed together with the percentage of the measurementdays corresponding to each pathway.
4. Results and discussion
Regular lidar observations of Saharan dust transportevents in the troposphere started in Naples in the frameworkof the Earlinet project in 2000. From May 2000 to August2003 about 290 days of measurements corresponding to 860lidar profiles of atmospheric aerosols optical parameters werecarried out in Naples. 466 of the measured profiles,corresponding to 97 days of measurement, were related toSaharan dust outbreaks.
The total number of Saharan dust outbreaks observed inNaples in the study period was 45 and for 36 of these alertswere received. 9 further dust events were identified bymeansof a comparative analysis between lidar profiles and airmasses back-trajectories supported by the outcomes of theDREAM model and the Navy Aerosol Analysis and PredictionSystem (NAAPS) model provided by the Naval ResearchLaboratory.
As shown by Frontoso et al. (2007) the majority of theSaharan Dust events (more than 80%) occurred in presence oftwo main patterns: the first pattern is related to a combina-tion of a depression system located in the Atlantic ocean andan anti-cyclonic system located in North Africa, whereas thesecond one corresponds to a depression system locatedmainly in western or central Mediterranean. This last patternis often associatedwith strong Saharan dust episodes over themeasurement area.
In Fig. 1 the trajectories of air mass reaching Naples at thealtitude corresponding to 700 hPa during all the observedSaharan dust outbreaks are reported. The back-trajectoriesanalysis revealed that desert dust follows twomain directionsfrom the source to Southern Italy (Pisani, 2005). The twomain directions of dust are showed in Fig. 1 together with thepercentage of the air masses following each direction.
In agreement with lidar observations performed overEurope (Papayannis et al., 2008), the seasonal distribution ofthe Saharan dust outbreaks observed in Naples shows apredominance (above 70%) of sand transport events duringspring and summer. This seasonal distribution is probably dueto a low-pressure system coming from Nord West direction
(Prospero et al., 1981) that is more frequent in warm than incold seasons.
The mean length of registered events was 4.5±0.5 days.This means that every year we measured in about 20% of thedays a dust intrusion that increases the atmospheric aerosolload over the study area.
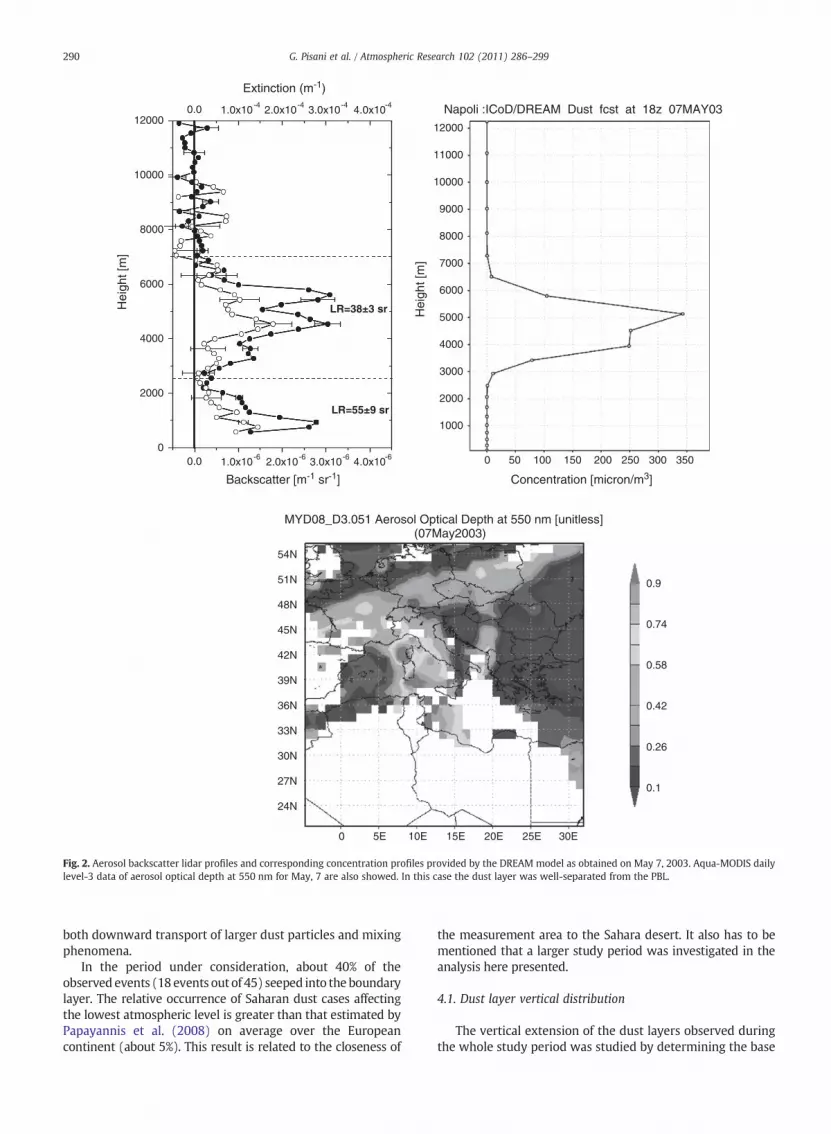
Data corresponding to dust intrusion into the boundarylayer were selected by a cross-comparative analysis of lidarresults andmodels outcomes as detailed in themethodology. InFigs. 2 and 3 the vertical profiles of aerosol backscatter andextinction coefficients, the measured LR and the concentrationprofile provided by the DREAM model for two differentsituationsare showed.Aqua-MODISdaily level-3data of aerosoloptical depth at 550 nm are also reported. Fig. 2 shows theresults of lidar observations performed on May 7, 2003 aroundsunset (18:48–19:18 UT) together with the DREAM modeloutcome. Both show a Saharan dust layer between 3000 and6500mof altitude. At lower height the differences between themeasured data and the model results can be ascribed to thelocal anthropogenic aerosol that is not considered in themodel.The back-trajectories show that air masses coming from Saharadesert reach the Naples lidar station above 700 hPa, corre-sponding to about 3000 m of altitude.
In this case the LR value measured in the Saharan dustlayer was typical of desert aerosol (38±3 sr) while a LR valueof (55±9 sr) is found at lower altitude, according to thepresence of smaller particles in the PBL.
A different situation is reported in Fig. 3, showing theresults of measurements performed on August 21, 2003around the sunset (18:38–19:08 UT). According to the back-trajectories analysis, in this day the Saharan dust affects lowerlayers inside the PBL, which top height was estimated at1050 m.
Unlike the previous case, on August 21, 2003 we didn'tobserve a considerable change of LR below (44±5 sr) andabove (42±1 sr) the estimated PBL top height as a result of
11000
10000
9000
8000
7000
6000
5000
4000
3000
2000
0 50 100 150 200 250 300 350
LR=38±3 sr Hei
ght [
m]
12000
1000
Concentration [micron/m3]
0 5E 10E 15E 20E 25E 30E
54N
51N
48N
45N
42N
39N
36N
33N
30N
27N
24N
0.9
0.74
0.58
0.42
0.26
0.1
MYD08_D3.051 Aerosol Optical Depth at 550 nm [unitless] (07May2003)
0.0 1.0x10⁻⁶ 2.0x10⁻⁶ 3.0x10⁻⁶ 4.0x10-60
2000
4000
6000
8000
10000
120000.0 1.0x10⁻⁴ 2.0x10⁻⁴ 3.0x10⁻⁴ 4.0x10⁻⁴
Hei
ght [
m]
Backscatter [m-1 sr-1]
LR=55±9 sr
Extinction (m-1)
Napoli :ICoD/DREAM Dust fcst at 18z 07MAY03
Fig. 2. Aerosol backscatter lidar profiles and corresponding concentration profiles provided by the DREAM model as obtained on May 7, 2003. Aqua-MODIS dailylevel-3 data of aerosol optical depth at 550 nm for May, 7 are also showed. In this case the dust layer was well-separated from the PBL.
290 G. Pisani et al. / Atmospheric Research 102 (2011) 286–299
both downward transport of larger dust particles and mixingphenomena.
In the period under consideration, about 40% of theobserved events (18 events out of 45) seeped into the boundarylayer. The relative occurrence of Saharan dust cases affectingthe lowest atmospheric level is greater than that estimated byPapayannis et al. (2008) on average over the Europeancontinent (about 5%). This result is related to the closeness of
the measurement area to the Sahara desert. It also has to bementioned that a larger study period was investigated in theanalysis here presented.
4.1. Dust layer vertical distribution
The vertical extension of the dust layers observed duringthe whole study period was studied by determining the base

0
2000
4000
6000
8000
10000
120000.0 1.0x10⁻⁴ 2.0x10⁻⁴ 3.0x10⁻⁴ 4.0x10⁻⁴
0.0 1.0x10⁻⁶ 2.0x10⁻⁶ 3.0x10⁻⁶ 4.0x10⁻⁶
Backscatter [m-1 sr-1]
Extinction (m-1)
LR=44±9 sr
LR=42±1 sr
Hei
ght [
m]
0 2 4 6 8 10 12 14
Concentration [micron/m3]
Hei
ght [
m]
12000
Napoli :ICoD/DREAM Dust fcst at 18z 21AUG03
11000
10000
9000
8000
7000
6000
5000
4000
3000
2000
1000
MYD08_D3.051 Aerosol Optical Depth at 550 nm [unitless](21Aug2003)
54N
51N
48N
45N
42N
39N
36N
33N
30N
27N
24N
0.9
0.74
0.58
0.42
0.26
0.1
0 5E 10E 15E 20E 25E 30E
Fig. 3. Aerosol backscatter lidar profiles and corresponding concentration profiles provided by the DREAM model as obtained on August 21, 2003. Aqua-MODISdaily level-3 data of aerosol optical depth at 550 nm for August 21 are also showed. This case is related to a Saharan dust intrusion in the PBL.
291G. Pisani et al. / Atmospheric Research 102 (2011) 286–299
and top height, and the thickness of the plume. Fig. 4 showsthe count distributions of the base, top and thicknessobtained for each of the observed events, while mean valuesand standard errors are reported in Table 1. The obtainedresults fit with those reported by Papayannis et al. (2008)corresponding to a shorter period.
The analysis of the observed events showed a largevariability of the Saharan dust clouds vertical extension. Inparticular, dust has been observed up to 8700 m. Neverthe-
less, it was confined below 5000 m of height in about 60% ofthe observed events. On the other hand, 85% of the dustplumes had a base height lower than 2000 m.
A correlation analysis of the thickness with the base of thedust layer highlights that higher bases correspond to thinnerlayers. Moreover, as showed in Fig. 5, a larger variability of thethickness is observed for lower bases.
Seasonal dependence of these parameters shows that thehighest extent of the dust plume was measured on summer

0 1 2 3 4 50
4
8
12
16
20
Tickness (m)Top (m)
Cou
nts
Base (km)0 2 4 6 8 10
0
4
8
12
16
20
0 2 4 6 8 100
4
8
12
16
20
Fig. 4. Count distributions of the dust plume thickness, top height and base height. The reported values correspond to lidar measurements performed in the periodMay 2000–August 2003.
4000
5000
6000
7000
8000
knes
s (m
)
292 G. Pisani et al. / Atmospheric Research 102 (2011) 286–299
(thickness 3700±480 m), when the highest values of thedust layer top were measured. On the other hand, low andthin dust layers were observed on winter (thickness 2400±300 m, top height 3800±220 m). Both these results could berelated to the larger intensity of the Saharan dust transportevents and to the higher convective activity observed onwarm season. In fact, in these seasons, near the source strongconvection can lift a large amount of dust particles into theatmosphere (Ansmann et al., 2009) in high and thick layersbecause of the large amount of energy involved in theirelevation mechanism. Moreover, during long range transportdust particles can move downward because of gravitationalsettling, subsidence phenomena and sedimentation process-es. In particular, on summer, due to the high convectiveactivity, the local PBL top height can reach elevated altitudes(above 2000 m), making possible the dust injection from highto lower levels during the PBL evolution and further loweringthe base of the observed layer.
4.2. Dust layer optical properties
4.2.1. Mean optical propertiesThe mean optical properties of the dust plume were
studied by means of a statistical analysis of βaer, αaer and LRvalues measured inside the dust layers. Fig. 6 shows thefrequency distributions of these parameters. Data distribu-tions show large standard deviations related to modificationsof particles shape and dimension and of dust compositionduring the transport processes. As reported in Table 2, mean
Table 1Mean values and standard errors of base, top and thickness of the Saharandust layers.
Mean value
Base (m) 1500±90Top (m) 4600±170Thickness (m) 3100±160
0 1000 2000 3000 4000 5000 60000
1000
2000
3000
Thi
c
Base (m)
Fig. 5. Scatter-plot of the thickness versus the base of the plume correspondingto measurements performed from May 2000 to August 2003.
values of backscattering and extinction coefficients of (1.2±0.1)10−6 m−1 sr−1 and (0.61±0.06)10−4 m−1 respective-ly, were obtained in the whole observation period. Moreover,mean value of LR resulted to be 47±3 sr, in agreement withtheoretical and experimental values reported in the literaturefor Saharan dust (Ackermann, 1998; Mona et al., 2006; Mülleret al., 2007; Muller et al., 2009; Papayannis et al., 2008).
The study of the seasonal variability of mean opticalproperties measured in the dust layer (Table 2) highlights thatlarger values of themeanaerosol extinction are observedduringwarm seasons. In fact, the estimated dust concentration resultshigher on spring and summermonthswithmeanvalues around(150±60)μg m−3 and (80±30)μg·m−3, respectively. Lowermean dust concentrations were measured on winter andautumn resulting less than (50±20)μg m−3 on average. Theobserved seasonal variability of estimated mean dust concen-trations is in agreement with the modeled seasonal meanconcentrationprofiles in the centralMediterranean. reportedbyPapayannis et al. (2008). Moreover, mean dust fluxes resulted(0.8±0.4)·10−3 g m−2 s−1 and (1.6±0.7)·10−3 g m−2 s−1

0 1 2 3 40
4
8
12
16
LR (sr)Extinction (10-4m-1)
Cou
nts
Backscatter (10-6m-1sr-1)
0.0 0.5 1.0 1.5 2.00
3
6
9
12
0 20 40 60 80 100 1200
2
4
6
8
10
12
Fig. 6. Count distributions of aerosol backscatter (βaer), extinction (αaer ) and lidar ratio (LR)mean valueswithin the desert dust layer for thewhole observation period.
293G. Pisani et al. / Atmospheric Research 102 (2011) 286–299
on summer and spring, respectively, whereas fluxes lower than(0.4±0.1)·10−3 g m−2 s−1 were obtained on autumn andwinter months.
The obtained results could be related to seasonal variabil-ity of low pressure systems that in warm season favors thenorthward motions of air masses from North African coasttoward the Mediterranean Basin (Moulin et al., 1998).
The LR dependence on the dust plume altitude shows thatlarger LR values correspond to lower base heights (Fig. 7) ofthe dust plume. In particular, LR values larger than 60 sr werefoundwhen the base of the plumewas located below 1000 m,due to the mixing of the dust particles with local aerosols.Moreover, the LR did not show a clear dependence with thethickness of the dust layer.
Changes in the LR could be also related to changes in bothsources and transport path (Engelstaedter et al., 2006). Withthe aim to detect possible correlations, a detailed study of theLR variability with air mass origin and path was performed.Results show that larger LR values (mean LR of 49±3 sr)correspond to back-trajectories coming from South (pattern“a” of Fig. 1) whereas lower LR values (mean LR of 41±3 sr)were measured when air masses came from south-westdirection, with a longer path over the Mediterranean Sea(pattern “b” of Fig. 1). The obtained results could be ascribedto the presence of stronger dust events in the first case and tomaritime aerosol contamination in the second case. More-over, gravitational settling could also contribute to the
Table 2Mean values of aerosol extinction (αaer), backscattering (βaer) and lidar ratio(LR) measured in the dust layers and corresponding to different seasons. Themean values in the whole study period are showed in bold.
αx10−4 (m−1) βx10−6 (m−1 sr−1) LR (sr)
Spring 0.65±0.11 1.4±0.1 40±4Summer 0.79±0.11 1.3±0.2 57±6Autumn 0.24±0.03 0.6±0.1 36±5Winter 0.57±0.13 1.5±0.8 46±8
0.61±0.06 1.2±0.1 47±3
observed results according to a difference of about 1000 kmin the path followed by the air masses coming from Africancontinent along the two above-mentioned patterns.
4.2.2. Vertical variability of mean optical propertiesThevertical variability ofmeanoptical properties of the dust
layer was also studied by means of a statistical analysis of βaer,αaer and LR values measured inside five different atmosphericlayers (i.e. 0–1 km, 1–2 km, 2–3 km , 3–4 km, 4–5 km). Thisstudy gives an insight on dust injection fromhigh to lower levelduring long range transport phenomena. The results aresummarized in Table 3. As shown in Table 3, the lowestatmospheric layer is characterized by the largestmeanvalues ofαaer and βaer ((2.5±0.4) 10−4 m−1 and (4.5±0.6)10−6 m−1 sr−1, respectively) as result of the mixing betweensand particles and local aerosol. Moreover, mean values of αaer
and βaer result unchanged from 1 to 4 km (about 10-4 m-1 and2.5 10-6 m-1 sr-1, respectively)while in the range 4–5 km lowerαaer and βaer mean values of (0.8±0.1)10−4 m−1 and (1.6±0.2)10−6 m−1 sr−1, respectively were measured. Therefore,the presence of homogeneous and well mixed layers charac-terizes the range from 1 to 4 km, while gravitational settling oflarger sand particles could explain the values obtained above4 km of altitude.
As to the LR vertical variability, the obtained mean valuesand data distributions are reported in Table 3 and Fig. 8,respectively. In particular, in Fig. 8 the frequency hystogramsof LR are shown together with the normal distributions thatfit the data. As Fig. 8 shows, in the range 0–1 km data arefitted by a bi-modal distribution (modal values: m1=34±1,m2=83±2) that reflects the contributions of dust and localaerosols. The highest modal value in this altitude range isrelated to fine particles of local anthropogenic origin. Above1 km of altitude a single mode normal distributions fit thedata. Moreover, the LR mean value decreases from 1 to 5 km,according to a higher content of larger sand particles at higheraltitude.
The altitude dependence of the aerosol extinction andbackscatter peak values, αmax and βmax, was also studied as

20 40 60 80 1000
500
1000
1500
2000
2500
3000
Bas
e (m
)
LR (sr)
Fig. 7. Scatter plot of lidar ratio versus the dust plume base height for nighttime measurements. The result of the linear regression applied to the data is also showed.
0-1km
1-2km
2-5km
0 20 40 60 80 100 120
0 20 40 60 80 100 120
Cou
nts
0
4
8
12
16
20
Cou
nts
0
4
8
12
16
20
8
10
294 G. Pisani et al. / Atmospheric Research 102 (2011) 286–299
further parameter to consider for an in deep investigation ofthe dust plume vertical distribution. The distributions of thecorresponding altitudes z(αmax) and z(βmax) are shown inFig. 9. For both mean values of about 2500 m were found.Measurements show a large variability of αmax and βmax peakvalues that range from 10−5 to 10−3 m−1 and from 310−7 to1.210−5 m−1 sr−1, respectively. Nevertheless, more than 70%of data correspond toαmax values lower than 210−3 m−1 andto βmax values lower than 410−6 m−1 sr−1.
4.2.3. The 29th August 2003 dust eventThe strongest dust outbreak observed in the study period
occurred on 29th August 2003. Its characterization representsa step to better understanding of atmospheric aerosolproperties during severe dust outbreak and to highlight theimpact of dust on the PMmass concentrations at ground. Thesynoptic situation was characterized by a high-pressuresystem extending from Northern Africa to the WesternMediterranean. The effect of the anticyclone of African origincontributes to the advection of warm and dry air fromNorthern Africa to the Italian peninsula; therefore, dustparticles were transported away from the source toward Italyas the AOD data from Aqua-MODIS show (Fig. 10).
Vertical profiles of the aerosol backscatter coefficient mea-sured at 13:30UT and 17:30UT are reported in Fig. 11a, whileaerosol extinction and LR profiles simultaneously measured at17:30UT are reported in Fig. 11b. Both figures show a Saharandust layer between 1000 and 6000 m of altitude, according toDREAM model outcome. Back-trajectories for the 19:00 UTarrival time show air masses coming from Sahara desert over
Table 3Mean values of aerosol extinction (αaer), backscattering (βaer) and lidar ratio(LR)measured in five different atmospheric layers (0–1 km, 1–2 km, 2–3 km3–4 km,4–5 km).
α x10−4 (m−1) βx10−6 (m−1 sr−1) LR (sr−1)
0–1 km 2.5±0.4 4.5±0.6 65±51–2 km 1.3±0.2 2.5±0.4 50±32–3 km 1.1±0.2 2.5±0.5 44±23–4 km 1.0±0.1 2.5±0.7 41±34–5 km 0.8±0.1 1.6±0.2 46±4
LR (sr)0 20 40 60 80 100 120
Cou
nts
0
2
4
6
Fig. 8.Count distributions of lidar ratiomeasured in threedifferent atmosphericlayers (0–1 km, 1–2 km, 2–5 km). Measurements refer to the observationperiod May 2000–August 2003.
,
Naples lidar station between 850 and 500 hPa pressure levels,corresponding to 1500–5500 m of altitude.
Vertical profiles of the aerosol backscattering coefficientshow that different ranges of altitude were interested by thedust layer, with a progressive intrusion into lower altitudes.

0 3 6 9 120
10
20
30
z(αmax)(103m)
αmax(10-4m-1)
βmax(10-6m-1sr-1)
Cou
nts
0 1 2 3 4 5 6 7 8 90
10
20
30
Cou
nts
0 3 6 9 120
10
20
30
Cou
nts
z(βmax)(103m)
Cou
nts
0 1 2 3 4 5 6 7 8 90
10
20
30
Fig. 9. Count distributions of aerosol extinction and backscatter peak values(αmax and βmax)measured in the Saharan dust plume and of the correspondingaltitudes (z(αmax) and z(βmax)).
295G. Pisani et al. / Atmospheric Research 102 (2011) 286–299
Measured values of optical depth (OD) and integratedbackscatter (IB) in the dust layer at 17:30 UT are 0.92±0.04and (1.59±0.04)10−2 sr−1, respectively, which are the highestvaluesmeasured in thewhole studyperiod.AnODvalue from0.4to 0.8was provided from theNAAPSmodel on 29thAugust 2003.
The LR mean value we measured is 65±3 sr, in agreementwith large values detected in the dust plume during extremeevents in Europe (Guerrero-Rascado et al., 2009; Mattis et al.,2002;Monaet al., 2006). This large value of the LR couldbepartlyascribed to the non-sphericity of the particles (Ansmann et al.,2003; Mattis et al., 2002) that increases the LR for the sameaerosol type. Moreover, during this event, the mineral aerosolconcentration grows up inside the PBL and the mixing withpollution related smaller particles, could also explain an increaseof the LR value (Müller et al., 2000).
For this event, a mean dust concentration of about (250±20)μg m−3 in the plume (1000–5500 m) was found and amean flux of (3.5±1)10-3 gm2s−1 was estimated.
Moreover, in this day NAAPSmodel provided a dust surfaceconcentration between 40 and 80 μg m−3 in the measurementarea.
In order to study a possible correlation between the aerosolsobserved in the lower troposphere and ground measurements
of PM10 concentrations, the data of the Campania Air QualityRegional Network (AQRN) were analyzed (http://www.arpacampania.it).
Generally, an increase of the PM10 concentration at groundcould be due to gravitational settling, subsidence phenomenaand sedimentation processes of the aerosol coming from longrange transport phenomena.
As Fig. 12 shows, the time dependence of the PM10 dailyconcentration was the same in all the five provinces of theregion, even if there is a distance between 30 and 70 kmamong them. This behavior allows asserting that the increasein the PM10 concentrations was mainly related to the impactof Saharan dust at ground rather than to anomalousemissions from local sources. In particular, the maximumvalues of PM10 daily concentration were observed on 29August in all the measurements stations of the AQRN, whenlidar measurements showed in Naples a considerable amountof dust particles in the lower troposphere.
In order to provide information on the relative influence ofcoarse-versus-fine mode aerosols along the atmosphericcolumn and to confirm the impact of Saharan dust on PM10measured at ground, the AERONET measurements performedin Rome, about 200 km fromour lidar site, were analyzed. Level2.0 (cloud screened and quality assured) daily data of columnaraerosol ODat 440 nm(ODC) andAngstromexponent at 870 nmand 440 nm (αC) measured at Rome highlight a large amount(ODC=1.01) of large particles (αC=0.12) along the atmo-spheric column on 29th August 2003. The daily mean values ofODC andαC valuesmeasured inRomewith the sun-photometerare reported in Fig. 12 for the 26th August-1st Septemberperiod. As Fig. 12 shows, the maximum values of ODC and theminimumvalue ofαCweremeasured on 29th August. In Fig. 13the size distributions retrieved from the sun-photometer atdifferentmeasurement times are reported.As thisfigure shows,the values ofODC andαC correspond to particles in coarsemode(1 μmbrb10 μm).
5. Conclusions
Systematic lidar observations of aerosol optical propertiesduring Saharandust intrusionswere performed fromMay2000to August 2003 over Naples in the frame of EARLINET project.
We followed 45 Saharan dust outbreaks with a meantemporal length of about 4 days. We observed a predominance(above 70%) of sand transport events during spring and summer.Moreover, about 40% of the observed events (18 events on 45)were characterized by intrusion of the sand plume in the PBL.
From a statistical analysis the mean values of the altitude ofbase, top and of the thickness of the dust plume resulted 1500±90m, 4600±170m and 3100±160m, respectively. The studyof the seasonal variability of these properties highlights that thelowest base position and the highest extent of the dust plumetake place on summer.
The mean optical properties of the sand plume weredetermined from the analysis of aerosol backscatter, extinctionand LR at 351 nmmeasured inside the dust layers.Mean valuesof backscattering and extinction coefficients of (1.2±0.1)10−6 m−1 sr−1 and (0.61±0.06)10−4 m−1, respectively,were obtained in the whole observation period, while themean value of LR resulted to be 47±3 sr.

22E20E18E16E14E12E10E8E6E4E2E0
50N
48N
46N
44N
42N
40N
38N
36N
34N
32N
30N
28N
0.9
0.74
0.58
0.42
0.26
0.1
MYD08_D3.051 Aerosol Optical Depth at 550nm [unitless](29 Aug 2003)
Fig. 10. Aqua-MODIS daily level-3 data of aerosol optical depth at 550 nm for August 29 2003.
296 G. Pisani et al. / Atmospheric Research 102 (2011) 286–299
Dust concentration in the plume resulted highest onspring and summer months with mean values around(150±60)μg·m-3 and (80±30)μg·m-3, respectively. Valueslower than (50±20)μg·m-3 were obtained on winter andautumn.
LRvariabilitywith airmass origin and pathwas also studied.Results showed a mean LR of 49±3 sr at 351 nm during dustevent, corresponding to back-trajectories coming from South
0
1000
2000
3000
4000
5000
6000
0 4 8 12
ba
13:30 19:30
Backscattering (10-6 m-1sr-1)
Hei
ght (
m)
1
2
3
4
5
6
Fig. 11. 29 August, 2003. Vertical profiles of the aerosol backscatter coefficients measLR measured at 19:30UT (10b). Data reported in the figure correspond to a time in
whereas a LR mean value of 41±3 sr was measured when airmasses came from south-west direction crossing the Mediter-ranean Sea.
LR vertical variability study highlighted larger LR meanvalues (LR=65±5 sr) below 1 km according to a largercontribution of fine particles of local anthropogenic origin.Moreover, a decrease of the LR with height was observedaccording to the presence of large sand particles in the plume.
LR (sr)
Extinction (10-4 m-1)
0
000
000
000
000
000
000
0 2 4 6 8 10
0 20 40 60 80 100 120
ured at 13:30UT and 19:30UT (10a); vertical profiles of aerosol extinction andtegration of 30 min.

a
b
c
27/08/2003 29/08/2003 31/08/20030
1
2
α RO
DR
Date (dd/mm/yyyy)
0.0
0.5
1.0
1.5
0
20
40
60
80
PM
10 C
on
cen
trat
ion
( μg
m-3
) NA AV BN CE SA Average
Fig. 12. PM10 daily concentrations (mg m–3) at ground level measured atNaples(NA), Avellino (AV), Benevento (BN), Caserta (CE) and Salerno (SA)from 26 August to 1 September 2003 (Fig. 12a); daily values of aerosol ODR at440 nm (Fig. 12b) and αR (440 nm/870 nm) (fig. 12c) derived from sun-photometer observations carried out at Rome in the same period.
0.01 0.1 1 10 1000.0
0.1
0.2
0.3
0.4
0.5
0.6August 29, 2003
dV(r
)/dl
n(r)
[μm
3 /μm
2 ]
Radius(r) [μm]
06:23:42 07:15:42 07:49:35 15:11:21
Fig. 13. Aerosol volume size distribution derived from sun-photometermeasurements carried out in Rome on 29 August 2003.
297G. Pisani et al. / Atmospheric Research 102 (2011) 286–299
Acknowledgments
The financial support for EARLINET by the EuropeanCommission under grant RICA-025991 is gratefully acknowl-edged. The authors also thank the German Weather Service(DWD) for the air mass back-trajectory analysis and the Navy
Research Laboratory-USA for the contribution given by theNAAPS aerosol maps.
The authors would like to thank Prof. Gian Paolo Gobbi forits effort in establishing andmaintaining the AERONET stationof ISAC — Rome Tor Vergata.
This work has been carried out in the framework of theresearch agreement between CNISM Consortium and Con-siglio Nazionale delle Ricerche.
The authors are thankful to ARPAC (Agenzia Regionale perla Protezione Ambientale della Campania)) for providingPM10 data collected at ground.
References
Ackermann, J., 1998. The extinction-to-backscatter ratio of troposphericaerosol: a numerical study. J. Atmos. Ocean. Technol. 15, 1043–1050.
Ansmann, A., Riebesell, M., Weitkamp, C., 1990. Measurement of atmosphericaerosol extinction profiles with a Raman lidar. Opt. Lett. 15, 746–748.
Ansmann, A., Wandinger, U., Riebesell, M., Weitkamp, C., Michaelis, W., 1992.Independent measurements of extinction and backscatter profiles incirrus clouds using a combined Raman elastic-backscatter lidar. Appl.Opt. 31, 7113–7131.
Ansmann, A., Bösenberg, J., Chaikovsky, A.P., Comerón, A., Eixmann, R.,Freudenthaler, V., Ginoux, P., Komguem, L., Linné, H., Lopez Marquez,M.A., Matthias, V., Mattis, I., Mitev, V., Muller, D., Music, S., Nickovic, S.,Pelon, J., Sauvage, L., Sobolewsky, P., Srivastava, M.K., Stohl, A., Torres,O., Vaughan, G., Wandinger, U., Wiegner, M., 2003. Long-rangetransport of Saharan dust to northern Europe: the 11–16 October2001 outbreak observed with EARLINET. J. Geophys. Res. 108, 4783.doi:10.1029/2003JD003757.
Ansmann, A., Tesche, M., Althausen, D., Müller, D., Seifert, P., Freudenthaler,V., Heese, B., Wiegner, M., Pisani, G., Knippertz, P., Dubovik, O., 2008.Influence of Saharan dust on cloud glaciation in Southern Moroccoduring the Saharan mineral dust experiment. J. Geophys. Res. 113,D04210. doi:10.1029/2007JD008785.
Ansmann, A., Tesche, M., Knippertz, P., Bierwirth, E., Althausen, D., Müller, D.,Schulz, O., 2009. Vertical profiling of convective dust plumes in southernMorocco during SAMUM. Tellus 61B, 340–353.
Balis, D.S., Amiridis, V., Nickovic, S., Papayannis, A., Zerefos, C., Giannakaki, E.,2004. Optical properties of Saharan dust layers as detected by a ramanlidar at Thessaloniki, Greece. Geophys. Res. Lett. 31, L13104. doi:10.1029/2004GL019881.
Barkan, J., Kutiel, H., Alpert, P., Kishcha, P., 2004. The synoptics of dustintrusion days from the African continent into the Atlantic Ocean.J. Geophys. Res. 109, D08201. doi:10.1029/2003JD004416.
Bellantone, V., Carofalo, I., De Tomasi, F., Perrone,M.R., Santese,M., Tafuro, A.M.,Turnone, A., 2008. In situ samplings and remote sensing measurements tocharacterize aerosol properties over Southeast Italy. J. Atmos. OceanicTechnol. 25, 1341–1356. doi:10.1175/2007JTECHA958.1.
Böckmann, C., Wandinger, U., Ansmann, A., Bösenberg, J., Amiridis, V., Boselli,A., Delaval, A., De Tomasi, F., Frioud, M., Grigorov, I.V., Hågård, A., Horvat,M., Iarlori, M., Komguem, L., Kreipl, S., Larchevêque, G., Matthias, V.,Papayannis, A., Pappalardo, G., Rocadenbosch, F., Rodrigues, J.A.,Schneider, J., Shcherbakov, V., Wiegner, M., 2004. Aerosol lidar inter-comparison in the framework of the EARLINET project. 2. Aerosolbackscatter algorithms. Appl. Opt. 43, 977–989.
Boselli, A., Armenante, M., D'Avino, L., Pisani, G., Spinelli, N., Wang, X., 2003.Characterization of atmospheric aerosol in the urban area of Napoli inthe framework of EARLINET Project. 10th International SymposiumRemote Sensing 2003— Proc. SPIE, p. 5235.
Boselli, A., Armenante,M., D'Avino, L., D'Isidoro,M., Pisani, G., Spinelli, N.,Wang,X., 2009. Atmospheric aerosol characterization over Naples during 2000–2003 EARLINET project: planetary boundary layer evolution and layering.Bound. Layer Meteorol.. doi:10.1007/s10546-009-9382-6.
Bösenberg, J., Ansmann, A., Baldasano, J.M., Balis, D., Böckmann, C., Calpini, B.,Chaikovsky, A., Flamant, P., Agard, A., Mitev, V., Papayannis, A., Pelon, J.,Resendes, D., Schneider, J., Spinelli, N., Trickl, T., Vaughan, G., Visconti, G.,Wiegner, M., 2001. In: Dabas, A., Loth, C., Pelon, J. (Eds.), EARLINET: aEuropean Aerosol Research Lidar Network in Advanced in Laser RemoteSensing, pp. 155–158.
Bösenberg, J., Mattias, V., Amodeo, A., Amoiridis, V., Ansmann, A., Baldasano,J.M., Balin, I., Balis, D., Böckmann, C., Boselli, A., Carlsson, G., Chaikovsky,A., Chourdakis, G., Comerón, A., De Tomasi, F., Eixmann, R., Freudenthaler,V., Giehl, H., Grigorov, I., Hågård, A., Iarlori, M., Kirsche, A., Kolarov, G.,Komguem, L., Kreipl, S., Kumpf, W., Larcheveque, G., Linné, H., Matthey, R.,

298 G. Pisani et al. / Atmospheric Research 102 (2011) 286–299
Mattis, I., Mekler, A., Mironova, I., Mitev, V., Mona, L., Müller, D., Music, S.,Nickovic, S., Pandolfi, M., Papayannis, A., Pappalardo, G., Pelon, J., Pérez, C.,Perrone, R.M., Persson, R., Resendes, D.P., Rizi, V., Rocadenbosch, F.,Rodrigues, A., Sauvage, L., Schneidenbach, L., Schumacher, R., Shcherbakov,V., Simeonov, V., Sobolewski, P., Spinelli, N., Stachlewska, I., Stoyanov, D.,Trickl, T., Tsaknakis, G., Vaughan, G., Wandinger, U., Wang, X., Wiegner, M.,Zavrtanik, M., Zerefos, C., 2003. A European aerosol research lidar networkto establish an aerosol climatology. Max Planck Institut für Meteorologie—Technical Report, 348, pp. 135–137.
Di Iorio, T., di Sarra, A., Sferlazzo, D.M., Cacciani, M., Meloni, D., Monteleone,F., Fua, D., Fiocco, G., 2009. Seasonal evolution of the tropospheric aerosolvertical profile in the central Mediterranean and role of desert dust.J. Geophis. Res. 114 (D02201), 9. doi:10.1029/2008JD010593.
Di Sarra, A., Di Iorio, T., Cacciani, M., 2001. Saharan dust profiles measured bylidar at Lampedusa. J. Geophis. Res. Atmos. 106 (D10), 10335–10347.
Escudero, M., Stein, A., Draxler, R.R., Querol, X., Alastuey, A., Castillo, S., Avila,A., 2006. Determination of the contribution of northern Africa dustsource areas to PM10 concentrations over the central Iberian Peninsulausing the hybrid single-particle Lagrangian integrated trajectorymodel (HYSPLIT) model. J Geophys. Res. 111, D06210. doi:10.1029/2005JD006395.
Engelstaedter, S., Washington, R., Tegen, I., 2006. North African dustemissions and transport. Earth Sci. Rev. 79 (1–2), 73–100.
Fernald, F.G., 1984. Analysis of atmospheric lidar observations: somecomments. Appl. Opt. 23, 652–653.
Frontoso, M.G., Spinelli, N., Pérez, C., Sicard, M., Comeron, A., Baldasano, J.M.,2007. The vertical distribution of Saharan dust over the western andcentral Mediterranean through dust modelling and lidar observations.International Geoscience and Remote Sensing symposium (IGARSS),Barcelona, Spain, 23–27 July, pp. 1059–1062. doi:10.1109/IGARSS.2007.4422983.
Gerasopoulos, E., Kokkalis, P., Amiridis, V., Liakakou, E., Perez, C., Haustein, K.,Eleftheratos, K., Andreae, M.O., Andreae, T.W., Zerefos, C.S., 2009. Dustspecific extinction cross-sections over the Eastern Mediterranean usingthe BSC-DREAM model and sun photometer data: the case of urbanenvironments. Ann. Geophys. 27, 2903–2912.
Gobbi, G.P., Barnaba, F., Ammannato, L., 2004. The vertical distribution ofaerosol, Saharan dust and cirrus cloud in Rome (Italy) in the year 2001.Atmos. Chem. Phys. 4, 351–359.
Guerrero-Rascado, L., Olmo, F.J., Avilés-Rodríguez, I., Navas-Guzmán, F.,Pérez-Ramírez, D., Lyamani, H., Alados Arboledas, L., 2009. ExtremeSaharan dust event over the southern Iberian Peninsula in september2007: active and passive remote sensing from surface and satellite.Atmos. Chem. Phys. 9, 8453–8469.
Hatzianastassiou, N., Matsoukas, C., Drakakis, E., Stackhouse Jr., P.W., Koepke,P., Fotiadi, A., Pavlakis, K.G., Vardavas, I., 2007. The direct effect ofaerosols on solar radiation based on satellite observations, reanalysisdatasets, and spectral aerosol optical properties from Global AerosolData Set (GADS). Atmos. Chem. Phys. 7, 2585–2599. doi:10.5194/acp-7-2585-2007.
Haywood, J., Francis, P., Osborn, S., Glew, M., Loeb, N., Highwood, E., Tanré, D.,Myhre, G., Formenti, P., Hirst, E., 2003. Radiative properties and directradiative effect of Saharan dust measured by the C-130 aircraft duringSHADE. J. Geophys. Res. 108, D18. doi:10.1029/2002JD002687.
Holben, B.N., Eck, T.F., Slutsker, I., Tanré, D., Buis, J.P., Setzer, A., Vermote, E.,Reagan, J.A., Kaufman, Y.J., Nakajima, T., Lavenu, F., Jankowiak, I.,Smirnov, A., 1998. AERONET—a federated instrument network anddata archive for aerosol characterization. Remote Sens. Environ. 66,1–16.
IPCC, Climate Change, 2007. The physical science basis. In: Solomon, S., Qin,D., Manning, M., Chen, Z., Marquis, M., Averyt, K.B., Tignor, M., Miller, H.L.(Eds.), Contribution ofWorking Group I to the Fourth Assessment Reportof the Intergovernmental Panel on Climate Change. Cambridge Univer-sity Press, Cambridge, United Kingdom, p. 996.
Israelevich, P.L., Levin, Z., Joseph, J.H., Ganor, E., 2002. Desert aerosoltransport in the Mediterranean region as inferred from the TOMS aerosolindex. J. Geophys. Res. 107 (D21), 4572. doi:10.1029/2001JD002011.
Kallos, G., Astitha, M., Katsafados, P., Spyrou, C., 2007. Long-range transport ofanthropogenically and naturally produced particulate atter in theMediterranean and North Atlantic: current state of knowledge. J. Appl.Meteor. Clim. 46, 1230–1251.
Karam, D.B., Flamant, C., Cuesta, J., Pelon, J., Williams, E., 2010. Dust emissionand transport associated with a Saharan depression: February 2007 case.J. Geophys. Res. 115, D00H27. doi:10.1029/2009JD012390.
Kim, S.-W., Yoon, S.-C., Dutton, E.G., Kim, J., Wehrli, C., Holben, B.N., 2008.Global surface-based sun photometer network for long-term observa-tions of column aerosol optical properties: intercomparison of aerosoloptical depth. Aerosol Sci. Technol. 42, 1–9.
Kishcha, P., Barnaba, F., Gobbi, G.P., Alpert, P., Shtivelman, A., Krichak, S.O.,Joseph, J.H., 2005. Vertical distribution of Saharan dust over Rome
(Italy): comparison between 3-year model predictions and lidarsoundings. J. Geophys. Res. 110, D06208. doi:10.1029/2004JD005480.
Klett, J., 1981. Stable analytic inversion solution for processing lidar returns.App. Opt. 20, 211–220.
Kottmeier, C., Fay, B., 1998. Trajectories in the Antarctic lower troposphere.J. Geophys. Res. 103, 10947–10959.
Masmoudi, M., Chaabane, M., Tanrè, D., Gouloup, P., Blarel, L., Elleuch, F.,2003. Spatial and temporal variability of aerosol: size distribution andoptical properties. Atmos. Res. 66, 1–19.
Matthias, V., Bösenberg, J., Freudenthaler, V., Amodeo, A., Balin, I., Balis,Bosenberg, J., Chaikovsky, A., Chourdakis, G., Comeron, A., Delaval, A., DeTomasi, F., Eixmann, R., Hågård, A., Komguem, L., Kreipl, S., Matthey, R.,Rizi, V., Rodrigues, J.A., Wandinger, U., Wang, X., 2004. Aerosol lidarintercomparison in the framework of the EARLINET project. 1. In-struments. Appl. Opt. 43, 961–976.
Mattis, I., Ansmann, A., Muller, D., Wandinger, U., Althausen, D., 2002. Dual-wavelength Raman lidar observation of the extinction-to-backscatteringratio of Saharan dust. Geophys. Res. Lett. 29, 9. doi:10.1029/2002GL014721.
Mattis, I., Mueller, D., Ansmann, A., Wandinger, U., Preissler, J., Seifert, P.,Tesche, M., 2008. Ten years of multiwavelength Raman lidar observa-tions of free-tropospheric aerosol layers over central Europe: geomet-rical properties and annual cycle. J. Geophys. Res. 113, D20202.doi:10.1029/2007JD009636.
Menut, L., Flamant, C., Pelon, J., Flamant, P.H., 1999. Urban boundary-layerheight determination from lidar measurements over the Paris area. Appl.Opt. 38 (6), 945–954.
Mona, L., Amodeo, A., Pandolfi, M., Pappalardo, G., 2006. Saharandust intrusion in the Mediterranean area: three years of Ramanlidar measurements. J. Geophys. Res. 111, D16203. doi:10.1029/2005JD006569.
Moulin, C., Lambert, C.E., Dayan, U., Masson, V., Ramonet, M., Bousquet, P.,Legrand, M., Balkanski, Y.J., Guelle, W., Marticorena, B., Bergametti, G.,Dulac, F., 1998. Satellite climatology of African dust transport in theMediterranean atmosphere. J. Geophis. Res. 103 (D11), 13,137–13,144.
Müller, D., Wagner, F., Althausen, D., Wandinger, U., Ansmann, A., Heintzen-berg, J., 2000. Physical particle properties of the Indian aerosol plumederived from six-wavelength lidarobservations on 25 March 1999 of theIndian Ocean Experiment. Geophys. Res. Lett. 27, 1403–1406.
Müller, D., Ansmann, A., Mattis, I., Tesche, M., Wandinger, U., Althausen, D.,Pisani, G., 2007. Aerosol-type-dependent lidar ratios observed withRaman lidar. J. Geophis. Res. 112, D16202. doi:10.1029/2006JD008292.
Muller, D., Heinold, B., Tesche, M., Tegen, I., Althausen, D., Alados Arboledas,L., Amiridis, V., Amodeo, A., Ansmann, A., Balis, D., Comeron, A., D'Amico,G., Gerasopoulos, E., Gurrero-Rascado, J.L., Freudenthaler, V., Giannakaki,E., Heese, B., Iarlori, M., Knippertz, P., Mamouri, R.E., Mona, L.,Papayannis, A., Pappalardo, G., Perrone, M.R., Pisani, G., Rizi, V., Sicard,M., Spinelli, N., Tafuro, A., Wiegner, M., 2009. EARLINET observations ofthe 14–22 May long range transport event during SAMUM 2006:validation of results from dust transport modeling. Tellus 61B, 325–339.doi:10.1111/j.1600-0889.2008.00400.x.
Nickovic, S., Papadopoulos, A., Kakaliagou, O., Kallos, G., 2001. Model forprediction of desert dust cycle in the atmosphere. J. Geophys. Res. 106,18,113–18,129.
Papayannis, A., Balis, D., Amiridis, V., Chourdakis, G., Tsaknakis, G., Zerefos, C.,Castanho, A.D.A., Nickovic, S., Kazadzis, S., Grabowski, J., 2005. Measure-ments of Saharan dust aerosol over the eastern Mediterranean usingelastic backscatter-Raman lidar, spectrophotometric and satellite obser-vations in the frame of EARLINET project. Atmos. Chem. Phys. 5,2065–2076.
Papayannis, A., Amiridis, V., Mona, L., Tsaknakis, G., Balis, D., Bösenberg, J.,Chaikovski, A., De Tomasi, F., Grigorov, I., Mattis, I., Mitev, V., Muller, D.,Nickovic, S., Pérez, C., Pietruczuk, A., Pisani, G., Ravetta, F., Rizi, V., Sicard,M., Trickl, T., Wiegner, M., Gerding, M., Mamouri, R.E., D'Amico, G.,Pappalardo, G., 2008. Systematic lidar observations of Saharan dust overEurope in the frame of EARLINET (2000–2002). J. Geophys. Res. 113,D10204. doi:10.1029/2007JD009028.
Papayannis, A., Mamouri, R.E., Amiridis, V., Kazadzis, S., Perez, C., Tsaknakis,G., Kokkalisl, P., Baldasano, J.M., 2009. Systematic lidar observations ofSaharan dust layers over Athens, Greece in the frame of EARLINET project(2004–2006). Ann. Geophys. 27, 3611–3620.
Pappalardo, G., Amodeo, A., Pandolfi, M., Wandinger, U., Ansmann, A.,Bösenberg, J., Matthias, V., Amiridis, V., De Tomasi, F., Frioud, M., Iarlori,M., Komguem, L., Papayannis, A., Rocadenbosch, F., Wang, X., 2004.Aerosol lidar intercomparison in the framework of the EARLINET project.3. Raman lidar algorithms for aerosol extinction, backscatter and lidarratio. Appl. Opt. 43 (28), 5370–5385.
Pavese, G., De Tomasi, F., Calvello, M., Esposito, F., Perrone, M.R., 2009.Detection of Sahara dust intrusions during mixed advection patternsover south-east Italy: a case study. Atmos. Res. 92 (4), 489–504.

299G. Pisani et al. / Atmospheric Research 102 (2011) 286–299
Pérez, C., Nickovic, S., Baldasano, J.M., Sicard, M., Rocadenbosch, F., Cachorro,V.E., 2006a. A long Saharan dust event over the western Mediterranean:Lidar, Sun photometer observations, and regional dust modeling.J. Geophys. Res. 111, D15214. doi:10.1029/2005JD006579.
Pérez, C., Nickovic, S., Pejanovic, G., Baldasano, J.M., Özsoy, E., 2006b.Interactive dust-radiation modeling: A step to improve weather fore-casts. J. Geophys. Res. 111, D16206. doi:10.1029/2005JD006717.
Pisani, G., 2005. Optical characterization of tropospheric aerosols in the urbanarea of Naples. PhD dissertation Università “Federico II”, Napoli Italy.
Prospero, J.M., Glaccum, R.A., Nees, R.T., 1981. Atmospheric transport of soildust from Africa to South America. Nature 289, 570–572.
Tafuro, A.M., Barnaba, F., De Tomasi, F., Perrone, M.R., Gobbi, G.P., 2006.Saharan dust particle properties over the central Mediterranean. Atmos.Res. 81, 67–93.
Tesche, M., Ansmann, A., Muller, D., Althausen, D., Mattis, I., Heese, B.,Freudenthaler, V., Wiegner, M., Esselborn, M., Pisani, G., Knippertz, P.,2009. Vertical profiling of Saharan dust with Raman lidars and airborneHSRL in southern Morocco during SAMUM. Tellus 61B, 144–164.doi:10.1111/j.1600-0889.2008.00390.
Wagner, F., Bortoli, D., Pereira, S., Costa, M.J., Silva, A.M., Weinzierl, B.,Esselborn, M., Petzold, A., Rasp, K., Heinold, B., Tegen, I., 2009. Propertiesof dust aerosol particles transported to Portugal from the Sahara desert.Tellus 61B, 297–306.
Zender, C.S., Bian, H., Newman, D., 2003. Mineral dust entrainment anddeposition (DEAD) model: description and 1990s dust climatotlogy.J. Geophys. Res. 108 (D14), 4416. doi:10.1029/2002JD002775.
Related Documents