International Journal of Biological Macromolecules 72 (2015) 1406–1418 Contents lists available at ScienceDirect International Journal of Biological Macromolecules j ourna l ho me pa g e: www.elsevier.com/locate/ijbiomac Characterization of pre-molten globule state of yeast iso-1-cytochrome c and its deletants at pH 6.0 and 25 ◦ C Md. Anzarul Haque a,1 , Shah Ubaid-ullah a,b,1 , Sobia Zaidi a,1 , Md. Imtaiyaz Hassan a , Asimul Islam a , Janendra K. Batra b , Faizan Ahmad a,∗ a Centre for Interdisciplinary Research in Basic Sciences, Jamia Millia Islamia, New Delhi, 110025, India b Immunochemistry Lab, National Institute of Immunology, Aruna Asaf Ali Marg, New Delhi, 110067, India a r t i c l e i n f o Article history: Received 18 September 2014 Received in revised form 21 October 2014 Accepted 29 October 2014 Available online 4 November 2014 Keywords: Yeast iso-1-cytochrome c Protein stability Protein folding Molten globule Pre-molten globule a b s t r a c t To understand the role of five extra N-terminal residues, we prepared wild type (WT) yeast iso-1- cytochrome c (y-cyt-c) and its deletants by subsequently deleting these residues. Denaturation of all these proteins induced by LiCl was followed by observing changes in molar absorption coefficient at 405 nm (ε 405 ), the mean residue ellipticity at 222 nm ([] 222 ), and the difference mean residue ellip- ticity at 409 nm ([] 409 ) near physiological pH and temperature (pH 6.0 and 25 ◦ C). It was observed that in each case LiCl induces biphasic transition, N (native) state ↔ X (intermediate) state ↔ D (dena- tured) state. The intermediate (X) was characterized by the far-UV, near-UV and Soret circular dichroism, ANS (8-anilino-1-naphthalenesulfonic acid) binding and dynamic light scattering measurements. These measurements led us to conclude that X state of each protein has structural characteristics of PMG (pre- molten globule) state. Thermodynamic stability of all proteins was also determined. It was observed that the N-terminal extension stabilizes the native WT protein but it has no effect on the stability of PMG state. Another state was observed for each protein, in the presence of 0.33 M Na 2 SO 4 at pH 2.1, which when characterized showed all structural characteristics of MG (molten globule) state. © 2014 Elsevier B.V. All rights reserved. 1. Introduction Anfinsen’s principle established that all the information needed for a protein to attain its unique three-dimensional structure is coded by its sequence [1]. The kinetics and the path through which an unordered polypeptide chain attains this unique ordered con- formation still remains one of the tempting problems in the field of protein chemistry. Levinthal [2] pointed out that achieving this native conformation by a random selection from an astronomical number of available conformations would take ages for a protein to fold. However; the physiological time-scale observed for a pro- tein to fold ranges from few milliseconds to seconds. This paradox Abbreviations: Y-cyt-c, yeast iso-1-cytochrome c; LiCl, lithium chloride; ANS, 8-anilino-1-naphthalenesulfonic acid; PMG, pre-molten globule; MG, molten glob- ule; WT, wild-type; CD, circular dichroism; UV, ultra-violet; DLS, dynamic light scattering. ∗ Corresponding author. Tel.: +91 11 26321733; fax: +91 11 26983409. E-mail address: [email protected] (F. Ahmad). 1 These authors contributed equally to this work. provided the first indication that attaining the native conformation cannot be a random-search process; instead it must be guided by defined intermediate(s) which will speed up the process and steer the protein to its unique stable confirmation. Thus, to understand how a protein attains its unique native conformation, the study of intermediates is essentially important. Study of intermediates provides an insight to the mechanism of protein folding, different domains of a protein (if present) and their order of stabilities [3]. Since these intermediates have fluctuating or flexible structure, they are important for biological functions of a protein such as post-translational modifications, membrane translocation or proteasomal degradation [4–7]. These intermedi- ates can also provide new valuable information about the enzyme mechanism and catalysis [8,9]. On the other hand, these transiently formed intermediates can lead to aggregation and amyloid fiber formation because of exposed aggregation prone sticky-surfaces which are otherwise buried in the native conformation [10,11]. Thus, there is an equal tendency for partly folded intermediates to form native structure or to form aggregates [12,13]. All these find- ings suggest that the study of intermediates is a key to understand protein folding process. Further, the structural characterization of http://dx.doi.org/10.1016/j.ijbiomac.2014.10.053 0141-8130/© 2014 Elsevier B.V. All rights reserved.

Welcome message from author
This document is posted to help you gain knowledge. Please leave a comment to let me know what you think about it! Share it to your friends and learn new things together.
Transcript

Ci
MAa
b
a
ARRAA
KYPPMP
1
fcafonntt
8us
h0
International Journal of Biological Macromolecules 72 (2015) 1406–1418
Contents lists available at ScienceDirect
International Journal of Biological Macromolecules
j ourna l ho me pa g e: www.elsev ier .com/ locate / i jb iomac
haracterization of pre-molten globule state of yeastso-1-cytochrome c and its deletants at pH 6.0 and 25 ◦C
d. Anzarul Haquea,1, Shah Ubaid-ullaha,b,1, Sobia Zaidia,1, Md. Imtaiyaz Hassana,simul Islama, Janendra K. Batrab, Faizan Ahmada,∗
Centre for Interdisciplinary Research in Basic Sciences, Jamia Millia Islamia, New Delhi, 110025, IndiaImmunochemistry Lab, National Institute of Immunology, Aruna Asaf Ali Marg, New Delhi, 110067, India
r t i c l e i n f o
rticle history:eceived 18 September 2014eceived in revised form 21 October 2014ccepted 29 October 2014vailable online 4 November 2014
eywords:east iso-1-cytochrome crotein stability
a b s t r a c t
To understand the role of five extra N-terminal residues, we prepared wild type (WT) yeast iso-1-cytochrome c (y-cyt-c) and its deletants by subsequently deleting these residues. Denaturation of allthese proteins induced by LiCl was followed by observing changes in molar absorption coefficient at405 nm (�ε405), the mean residue ellipticity at 222 nm ([�]222), and the difference mean residue ellip-ticity at 409 nm (�[�]409) near physiological pH and temperature (pH 6.0 and 25 ◦C). It was observedthat in each case LiCl induces biphasic transition, N (native) state ↔ X (intermediate) state ↔ D (dena-tured) state. The intermediate (X) was characterized by the far-UV, near-UV and Soret circular dichroism,ANS (8-anilino-1-naphthalenesulfonic acid) binding and dynamic light scattering measurements. These
rotein foldingolten globule
re-molten globule
measurements led us to conclude that X state of each protein has structural characteristics of PMG (pre-molten globule) state. Thermodynamic stability of all proteins was also determined. It was observed thatthe N-terminal extension stabilizes the native WT protein but it has no effect on the stability of PMGstate. Another state was observed for each protein, in the presence of 0.33 M Na2SO4 at pH 2.1, whichwhen characterized showed all structural characteristics of MG (molten globule) state.
© 2014 Elsevier B.V. All rights reserved.
. Introduction
Anfinsen’s principle established that all the information neededor a protein to attain its unique three-dimensional structure isoded by its sequence [1]. The kinetics and the path through whichn unordered polypeptide chain attains this unique ordered con-ormation still remains one of the tempting problems in the fieldf protein chemistry. Levinthal [2] pointed out that achieving thisative conformation by a random selection from an astronomical
umber of available conformations would take ages for a proteino fold. However; the physiological time-scale observed for a pro-ein to fold ranges from few milliseconds to seconds. This paradoxAbbreviations: Y-cyt-c, yeast iso-1-cytochrome c; LiCl, lithium chloride; ANS,-anilino-1-naphthalenesulfonic acid; PMG, pre-molten globule; MG, molten glob-le; WT, wild-type; CD, circular dichroism; UV, ultra-violet; DLS, dynamic lightcattering.∗ Corresponding author. Tel.: +91 11 26321733; fax: +91 11 26983409.
E-mail address: [email protected] (F. Ahmad).1 These authors contributed equally to this work.
ttp://dx.doi.org/10.1016/j.ijbiomac.2014.10.053141-8130/© 2014 Elsevier B.V. All rights reserved.
provided the first indication that attaining the native conformationcannot be a random-search process; instead it must be guided bydefined intermediate(s) which will speed up the process and steerthe protein to its unique stable confirmation.
Thus, to understand how a protein attains its unique nativeconformation, the study of intermediates is essentially important.Study of intermediates provides an insight to the mechanism ofprotein folding, different domains of a protein (if present) and theirorder of stabilities [3]. Since these intermediates have fluctuatingor flexible structure, they are important for biological functionsof a protein such as post-translational modifications, membranetranslocation or proteasomal degradation [4–7]. These intermedi-ates can also provide new valuable information about the enzymemechanism and catalysis [8,9]. On the other hand, these transientlyformed intermediates can lead to aggregation and amyloid fiberformation because of exposed aggregation prone sticky-surfaceswhich are otherwise buried in the native conformation [10,11].
Thus, there is an equal tendency for partly folded intermediates toform native structure or to form aggregates [12,13]. All these find-ings suggest that the study of intermediates is a key to understandprotein folding process. Further, the structural characterization of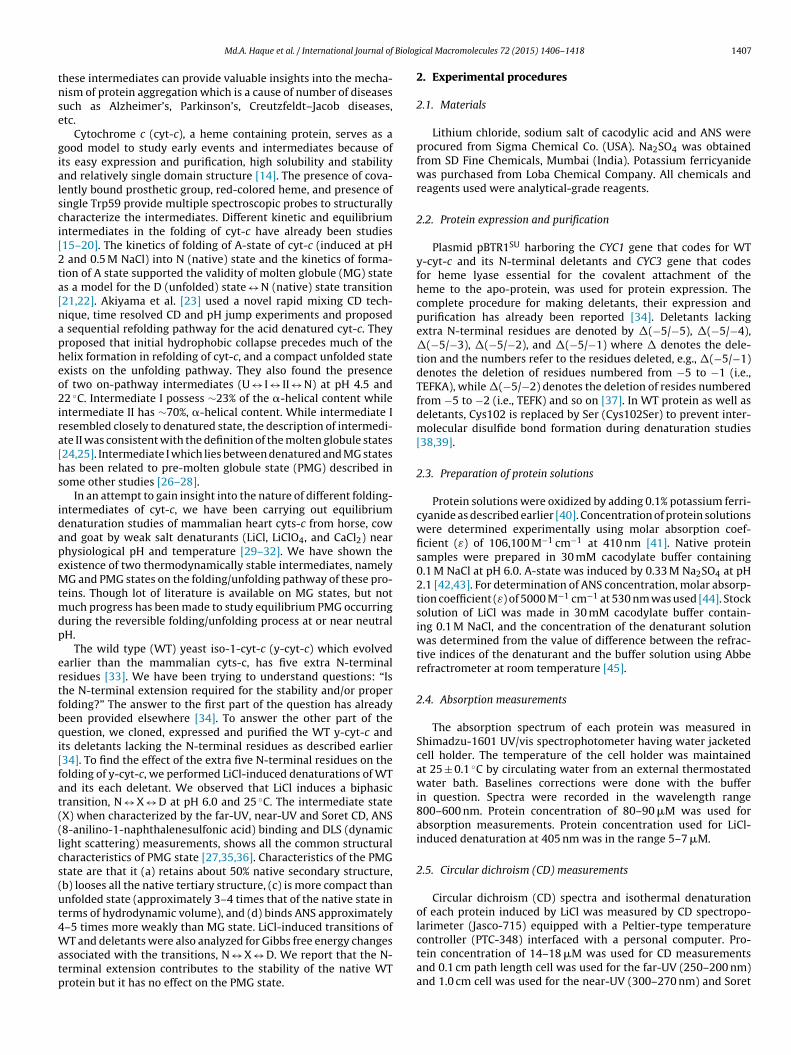
Biolog
tnse
gialsci[2ta[napheo2ira[hs
idapeMtmdp
ertfbqi[fat((lcs(ut4Watp
controller (PTC-348) interfaced with a personal computer. Pro-tein concentration of 14–18 �M was used for CD measurements
Md.A. Haque et al. / International Journal of
hese intermediates can provide valuable insights into the mecha-ism of protein aggregation which is a cause of number of diseasesuch as Alzheimer’s, Parkinson’s, Creutzfeldt–Jacob diseases,tc.
Cytochrome c (cyt-c), a heme containing protein, serves as aood model to study early events and intermediates because ofts easy expression and purification, high solubility and stabilitynd relatively single domain structure [14]. The presence of cova-ently bound prosthetic group, red-colored heme, and presence ofingle Trp59 provide multiple spectroscopic probes to structurallyharacterize the intermediates. Different kinetic and equilibriumntermediates in the folding of cyt-c have already been studies15–20]. The kinetics of folding of A-state of cyt-c (induced at pH
and 0.5 M NaCl) into N (native) state and the kinetics of forma-ion of A state supported the validity of molten globule (MG) states a model for the D (unfolded) state ↔ N (native) state transition21,22]. Akiyama et al. [23] used a novel rapid mixing CD tech-ique, time resolved CD and pH jump experiments and proposed
sequential refolding pathway for the acid denatured cyt-c. Theyroposed that initial hydrophobic collapse precedes much of theelix formation in refolding of cyt-c, and a compact unfolded statexists on the unfolding pathway. They also found the presencef two on-pathway intermediates (U ↔ I ↔ II ↔ N) at pH 4.5 and2 ◦C. Intermediate I possess ∼23% of the �-helical content while
ntermediate II has ∼70%, �-helical content. While intermediate Iesembled closely to denatured state, the description of intermedi-te II was consistent with the definition of the molten globule states24,25]. Intermediate I which lies between denatured and MG statesas been related to pre-molten globule state (PMG) described inome other studies [26–28].
In an attempt to gain insight into the nature of different folding-ntermediates of cyt-c, we have been carrying out equilibriumenaturation studies of mammalian heart cyts-c from horse, cownd goat by weak salt denaturants (LiCl, LiClO4, and CaCl2) nearhysiological pH and temperature [29–32]. We have shown thexistence of two thermodynamically stable intermediates, namelyG and PMG states on the folding/unfolding pathway of these pro-
eins. Though lot of literature is available on MG states, but notuch progress has been made to study equilibrium PMG occurring
uring the reversible folding/unfolding process at or near neutralH.
The wild type (WT) yeast iso-1-cyt-c (y-cyt-c) which evolvedarlier than the mammalian cyts-c, has five extra N-terminalesidues [33]. We have been trying to understand questions: “Ishe N-terminal extension required for the stability and/or properolding?” The answer to the first part of the question has alreadyeen provided elsewhere [34]. To answer the other part of theuestion, we cloned, expressed and purified the WT y-cyt-c and
ts deletants lacking the N-terminal residues as described earlier34]. To find the effect of the extra five N-terminal residues on theolding of y-cyt-c, we performed LiCl-induced denaturations of WTnd its each deletant. We observed that LiCl induces a biphasicransition, N ↔ X ↔ D at pH 6.0 and 25 ◦C. The intermediate stateX) when characterized by the far-UV, near-UV and Soret CD, ANS8-anilino-1-naphthalenesulfonic acid) binding and DLS (dynamicight scattering) measurements, shows all the common structuralharacteristics of PMG state [27,35,36]. Characteristics of the PMGtate are that it (a) retains about 50% native secondary structure,b) looses all the native tertiary structure, (c) is more compact thannfolded state (approximately 3–4 times that of the native state inerms of hydrodynamic volume), and (d) binds ANS approximately–5 times more weakly than MG state. LiCl-induced transitions ofT and deletants were also analyzed for Gibbs free energy changes
ssociated with the transitions, N ↔ X ↔ D. We report that the N-
erminal extension contributes to the stability of the native WTrotein but it has no effect on the PMG state.ical Macromolecules 72 (2015) 1406–1418 1407
2. Experimental procedures
2.1. Materials
Lithium chloride, sodium salt of cacodylic acid and ANS wereprocured from Sigma Chemical Co. (USA). Na2SO4 was obtainedfrom SD Fine Chemicals, Mumbai (India). Potassium ferricyanidewas purchased from Loba Chemical Company. All chemicals andreagents used were analytical-grade reagents.
2.2. Protein expression and purification
Plasmid pBTR1SU harboring the CYC1 gene that codes for WTy-cyt-c and its N-terminal deletants and CYC3 gene that codesfor heme lyase essential for the covalent attachment of theheme to the apo-protein, was used for protein expression. Thecomplete procedure for making deletants, their expression andpurification has already been reported [34]. Deletants lackingextra N-terminal residues are denoted by �(−5/−5), �(−5/−4),�(−5/−3), �(−5/−2), and �(−5/−1) where � denotes the dele-tion and the numbers refer to the residues deleted, e.g., �(−5/−1)denotes the deletion of residues numbered from −5 to −1 (i.e.,TEFKA), while �(−5/−2) denotes the deletion of resides numberedfrom −5 to −2 (i.e., TEFK) and so on [37]. In WT protein as well asdeletants, Cys102 is replaced by Ser (Cys102Ser) to prevent inter-molecular disulfide bond formation during denaturation studies[38,39].
2.3. Preparation of protein solutions
Protein solutions were oxidized by adding 0.1% potassium ferri-cyanide as described earlier [40]. Concentration of protein solutionswere determined experimentally using molar absorption coef-ficient (ε) of 106,100 M−1 cm−1 at 410 nm [41]. Native proteinsamples were prepared in 30 mM cacodylate buffer containing0.1 M NaCl at pH 6.0. A-state was induced by 0.33 M Na2SO4 at pH2.1 [42,43]. For determination of ANS concentration, molar absorp-tion coefficient (ε) of 5000 M−1 cm−1 at 530 nm was used [44]. Stocksolution of LiCl was made in 30 mM cacodylate buffer contain-ing 0.1 M NaCl, and the concentration of the denaturant solutionwas determined from the value of difference between the refrac-tive indices of the denaturant and the buffer solution using Abberefractrometer at room temperature [45].
2.4. Absorption measurements
The absorption spectrum of each protein was measured inShimadzu-1601 UV/vis spectrophotometer having water jacketedcell holder. The temperature of the cell holder was maintainedat 25 ± 0.1 ◦C by circulating water from an external thermostatedwater bath. Baselines corrections were done with the bufferin question. Spectra were recorded in the wavelength range800–600 nm. Protein concentration of 80–90 �M was used forabsorption measurements. Protein concentration used for LiCl-induced denaturation at 405 nm was in the range 5–7 �M.
2.5. Circular dichroism (CD) measurements
Circular dichroism (CD) spectra and isothermal denaturationof each protein induced by LiCl was measured by CD spectropo-larimeter (Jasco-715) equipped with a Peltier-type temperature
and 0.1 cm path length cell was used for the far-UV (250–200 nm)and 1.0 cm cell was used for the near-UV (300–270 nm) and Soret

1408 Md.A. Haque et al. / International Journal of Biolog
Fig. 1. LiCl-induced denaturation curves of WT y-cyt-c at pH 6.0 and 25 ◦C monitoredby change in (A) �ε405, (B) �[�]409 and (C) [�]222. The insets show the dependenceof yX, the optical properties of the thermodynamically stable intermediate on[LiCl]. The observed dependencies of �ε405 (M−1 cm−1) of N, X and D states of theprotein on [LiCl] are described by the relations: yN = 916(±73)[LiCl] + 437(±35);yX = 412(±41)[LiCl] + 15,172(±283); yD = −177(±56)[LiCl] + 15,636(±246). Theobserved dependencies of �[�]409 (deg cm2 dmol−1) of N, X and D states of theprotein on [LiCl] are described by the relations: yN = 15(±2)[LiCl] − 3.7(±0.3);yX = 84(±17)[LiCl] − 317(±32); yD = 17(±2)[LiCl] − 1127(±81). The observeddependencies of [�]222 (deg cm2 dmol−1) of N, X and D states of the pro-tein on [LiCl] are described by the relations: yN = 47(±11)[LiCl] − 12475(±161);
ical Macromolecules 72 (2015) 1406–1418
(450–370 nm) CD spectral measurements. Each spectrum was cor-rected for contribution of the blank solution. CD instrument wasroutinely calibrated with D-10-camphorsulfonic acid. To improvethe signal-to-noise ratio, at least five accumulations were made foreach scan. CD data were converted to concentration-independentparameter, the mean residue ellipticity [�] (deg cm2 dmol−1), usingthe relation,
[�]� = Mo��
10lc(1)
where �� is the observed ellipticity in millidegrees at wavelength�, Mo is the mean residue weight of the protein, c is the proteinconcentration in mg ml−1, and l is the path length of the cell incentimeters.
2.6. Fluorescence measurements
Measurements of fluorescence spectra were carried out inJasco spectroflourimeter (Model FP-6200) in a 3 mm quartz cell at25 ± 0.1 ◦C with both excitation and emission slits set at 5 nm bandwidth. The temperature of the cell was maintained by circulatingwater from an external thermostated water bath. For ANS bindingstudies, protein samples were incubated with 16-fold molar excessof ANS for 2 h at 25 ◦C in dark. For these studies, excitation wave-length was set at 360 nm and emission spectra were recorded in therange, 400–600 nm. The protein concentration used was 7–9 �M.
2.7. Dynamic light scattering measurements
To determine hydrodynamic radii of proteins in different solventconditions, dynamic light scattering (DLS) measurements were car-ried out in RiNA Laser Spectroscatter (Model-201) at 25 ± 0.1 ◦C.Samples were filtered through 0.22 �M Millipore syringe filters.Protein concentration of 2.5 mg ml−1 was used for the measure-ments. All measurements were carried out at a fixed angle of 90◦
using an incident beam of 689 nm. The data were analyzed usingPMgr version 3.01 software provided by the manufacturer. For eachsample, 10 measurements were made with an acquisition time of20 s.
3. Results
3.1. LiCl-induced denaturation
LiCl-induced denaturations of WT and its deletants were fol-lowed by monitoring the change in �ε405 (difference in ε valuesin the presence and absence of the denaturant at 405 nm), [�]222(mean residue ellipticity at 222 nm), and �[�]409 (difference in [�]values in the presence and absence of the denaturant at 409 nm).It was observed that LiCl induces biphasic transition, N (native)state ↔ X (intermediate) state ↔ D (denatured) state. It should benoted that the WT protein and all its deletants in the native buffer(30 mM cacodylate/cacodylic acid containing 0.1 M NaCl, pH 6.0)will be referred as the native protein. Figs. 1, 2 and S1–S4 show LiCl-induced biphasic denaturation curves of WT, �(−5/−4), �(−5/−1),�(−5/−2), �(−5/−3) and �(−5/−5) proteins, respectively. It isseen in these figures that the pretransition (yN) and posttransition
(yD) baselines are well-defined, and the intermediate X, exists ina narrow [LiCl], the molar LiCl concentration, range. To determinethe dependence of the optical property of X state (yX) accurately,we measured it at small concentration intervals of LiCl (see insetsyX = 204(±25)[LiCl] − 6587(±127); yD = 56(±7)[LiCl] − 2376(±107). Values in paren-theses represent uncertainties from the mean of three or more independentmeasurements.
Md.A. Haque et al. / International Journal of Biolog
Fig. 2. LiCl-induced denaturation curves of �(−5/−4) y-cyt-c at pH 6.0 and25 ◦C monitored by change in (A) �ε405, (B) �[�]409 and (C) [�]222. Theinsets show the dependence of yX, the optical properties of the thermody-namically stable intermediate on [LiCl]. The observed dependencies of �ε405
(M−1 cm−1) of N, X and D states of the protein on [LiCl] are described by therelations: yN = 851(±89)[LiCl] + 1876(±142); yX = 159(±30)[LiCl] + 18,487(±217);yD = −39(±85)[LiCl] + 18,560(±191). The observed dependencies of �[�]409
(deg cm2 dmol−1) of N, X and D states of the protein on [LiCl] are describedby the relations: yN = 13(±2)[LiCl] − 3.6(±0.4); yX = 26(±4)[LiCl] − 733(±41);yD = 67(±7)[LiCl] − 791(±53). The observed dependencies of [�]222 (deg cm2 dmol−1)of N, X and D states of the protein on [LiCl] are described by the rela-tions: yN = 117(±21)[LiCl] − 11,313(±185); yX = 356(±40)[LiCl] − 5540(±121);yD = 148(±18)[LiCl] − 2462(±135). Values in parentheses have the same meaningas in Fig. 1.
ical Macromolecules 72 (2015) 1406–1418 1409
in Figs. 1, 2 and S1–S4). It should be noted that LiCl-induced dena-turation was found to be reversible.
Panel A of Figs. 1, 2 and S1–S4 shows LiCl-induced denaturationcurves of WT protein and its deletants monitored by observingchanges in �ε405 (a sensitive probe to monitor oxidation state ofFe, heme ligand coordination and heme environment [46,47]) asa function of [LiCl]. For WT protein and each deletant the lineardependencies of yN, yX and yD on [LiCl] were determined and rela-tions describing these dependencies are given in legends of thesefigures.
Assuming that the process N ↔ X, designated as transition I,follows a two-state mechanism, results shown in panel A ofFigs. 1, 2 and S1–S4, were used to calculate fI (fraction of themolecules in X state) and �GI (Gibbs free energy change associatedwith transition I) using relations,
fI = (y − yN)(yX − yN)
(2)
�GI = −RT ln[
(y − yN)(yX − y)
](3)
where R is the universal gas constant, T is temperature in Kelvin,y is the observed optical property of the protein, and yN and yXrespectively are optical properties of protein molecules in N and Xstates at the same [LiCl] at which y has been measured. All values offI and values of �GI (−1.30 ≤ �GI (kcal mol−1) ≤ 1.30) are plotted asa function of [LiCl] in Figs. 3, S5 and S6. It is seen in these figures thatthe plot of �GI versus [LiCl] is linear. A linear least-squares analysiswas used to obtain values for �G0
I (value of �GI at 0 M LiCl) andmI, the slope (ı�GI/ı[LiCl]), according to the relation [48],
�GI = �G0I − mI[LiCl] (4)
Values of �G0I , mI and CmI, the mid-point of transition I (CmI =
�G0I /mI) for all proteins are given in Table S1.Assuming that the process X ↔ D, designated as transition II, also
follows a two-state mechanism, we determined values of fII (frac-tion of molecules in the D state) and �GII (Gibbs free energy changeassociated with transition II) using relations,
fII = (y − yX)(yD − yX)
(5)
�GII = −RT ln[
(y − yX)(yD − y)
](6)
where y is the observed optical property of the protein, and yX andyD respectively are optical properties of protein molecules in X andD states at the same [LiCl] at which y has been measured. All val-ues of fII and values of �GII (−1.30 ≤ �GI (kcal mol−1) ≤ 1.30) areplotted as a function of [LiCl] in Figs. 3, S5 and S6. It is seen in thesefigures that the plot of �GII versus [LiCl] is linear. A linear least-squares analysis was used to obtain values of �G0
II (value of �GIIat 0 M LiCl), and mII, the slope (ı�GII/ı[LiCl]), with the help of therelation,
�GII = �G0II − mII[LiCl] (7)
For each protein value of CmII, the mid-point of transition II, wasdetermined from the measured values of �G0
II and mII (i.e., CmII =�G0
II/mII). Table S1 shows values of �GXII , CmII and mII of all proteins.
It should be noted that �GXII is the value of �GII in the presence of
LiCl at which X state of a protein exists.LiCl-induced transition curves were also measured by monitor-
ing changes in �[�]409 (a probe to monitor heme pocket integrity[49–51]). These curves are shown in panel B of Figs. 1, 2 and S1–S4.
Relations describing the dependencies of yN, yX and yD of all pro-teins on [LiCl] are given in legends of these figures.Assuming that each transition follows a two-state mechanism,we determined values of fI, �G0
I , CmI, mI, fII, �GXII , CmII, mII using

1410 Md.A. Haque et al. / International Journal of Biological Macromolecules 72 (2015) 1406–1418
tion o
Ep
ciayF
wEp
3
aIip
pX
sVcg
Fig. 3. Plots of fI and fII of (A) WT y-cyt-c and (B) �(−5/−4) deletant as a func
quations ((2)–(7)). Values of �G0I , CmI, mI, �GX
II , CmII, mII of WTrotein and all deletants are given in Table S1.
Panel C in Figs. 1, 2 and S1–S4 shows LiCl-induced transitionurves obtained by monitoring changes in [�]222 (probe to mon-tor changes in secondary structure [52,53]) for the WT proteinnd its deletants. Relations describing the linear dependencies ofN, yX and yD of all proteins on [LiCl] are given in legends ofigs. 1, 2 and S1–S4.
Assuming that each transition follows a two-state mechanism,e determined values of fI, �G0
I , CmI, mI, fII, �GXII , CmII, mII using
quations ((2)–(7)). Values of �G0I , CmI, mI, �GX
II , CmII, mII of WTrotein and deletants are given in Table S1.
.2. Structural characterization of X state
Figs. 4–7 show the far-UV, near-UV and Soret CD spectra andbsorption spectra of WT protein and its deletants, respectively.n each figure, curves 1 and 3–5 represent the native state, LiCl-nduced X state, LiCl-induced D state and urea-induced D state atH 6.0 and 25 ◦C, respectively.
Fig. 8 shows the ANS fluorescence spectra in the presence of WTrotein and its deletants in the native state (curve 1), LiCl-induced
state (curve 3), LiCl-induced D state (curve 4) at pH 6.0 and 25 ◦C.Hydrodynamic radii of WT protein and its deletants in different
olvent conditions were determined by DLS measurements at 25 ◦C.alues of Rh, the hydrodynamic radius, thus obtained were used toalculate the values of hydrodynamic volume (4�R3
h/3) which areiven in Table 1.
f [LiCl] and �GI and �GII versus [LiCl] for (C) WT and (D) �(−5/−4) deletant.
3.3. Structural characteristics of A state
It has been shown earlier that addition of 0.33 M Na2SO4 to theacid denatured WT y-cyt-c (pH 2.1) gives a compact intermedi-ate state, termed as A state which resembles MG [42,43]. To seewhether deletants of WT y-cyt-c are also transformed into MG stateunder identical solvent conditions, we denatured these proteins bybringing the pH to 2.1, and to it we added 0.33 M Na2SO4. The resul-tant state of each deletant was characterized by the far-UV, near-UVand Soret CD, ANS binding fluorescence and DLS measurements atpH 2.1 and 25 ◦C. All the structural characteristics of A state aregiven in Table 1 (see curve 2 in Figs. 4–8).
4. Discussion
The preceding section presents results on the characterizationof the thermodynamically stable intermediate, X, occurring on theLiCl-induced reversible denaturation of WT y-cyt-c and its deletantsat pH 6.0 and 25 ◦C. Results on the characterization of A state of eachprotein, induced by 0.33 M Na2SO4 at pH 2.1, are also presented inthe previous section. Now these observations are discussed to showthat intermediate X and A state have all structural characteristicsof PMG and MG, respectively.
4.1. Pre-molten globule state
Intermediate state, X, obtained during LiCl-induced denatur-ation at pH 6.0 and 25 ◦C, was structurally characterized withvarious spectroscopic techniques. We measured the far-UV CDspectra of all proteins in the native state (curve 1), X state (curve 3)

Md.A. Haque et al. / International Journal of Biological Macromolecules 72 (2015) 1406–1418 1411
F 6.0 aL ers ha2
aatrsacinoa
ig. 4. The far-UV CD spectra of various states of WT y-cyt-c and its deletants at pHiCl-induced D state (curve 4); and urea-induced D state (curve 5). The curve numb.1 and 0.33 M Na2SO4 (see text).
nd D states induced by LiCl (curve 4) and urea (curve 5) at pH 6.0nd 25 ◦C (see Fig. 4). The far-UV CD spectrum that we obtained forhe WT native protein is in good agreement with the one previouslyeported earlier [54]. It is seen in Fig. 4 that for each protein, thepectrum of X state (curve 3) lies between spectra of N (curve 1)nd D (curves 4 and 5) states. If we take [�]222 as a probe to measurehange in secondary structure, then secondary structure retained
n X state of all six proteins lies in the range 40–45% of that of theative state. This observation implies that X state possesses onef the structural characteristics of PMG state, namely, retention ofbout 50% of secondary structure of the native protein [35,36].nd 25 ◦C. Native protein (curve 1); A state (curve 2); LiCl-induced X state (curve 3);ve the same meaning in all panels. Acid denatured, A state (MG) was induced at pH
To ascertain whether X state has other PMG like characteristics,we measured the near-UV CD spectra (300–270 nm) of the WT pro-tein and its deletants in the native state (curve 1), X state (curve 3)and D states induced by LiCl (curve 4) and urea (curve 5) at pH 6.0and 25 ◦C (see Fig. 5). The near-UV CD arises due to tight packing ofside chains of aromatic amino acid residues (one Trp, four Phe andfive Tyr residues) and two thioether bonds present in the native
cyt-c [55]. The presence of two characteristic negative peaks inthe region 282–289 nm, arising from interaction of Trp59 with oneheme propionate, is a signature of the natively folded cyts-c [33,55].The near-UV CD spectrum obtained for the native WT protein is in
1412 Md.A. Haque et al. / International Journal of Biological Macromolecules 72 (2015) 1406–1418
Fig. 5. The near-UV CD spectra of various states of WT y-cyt-c and its deletants at pH 6.0 and 25 ◦C. Native protein (curve 1); A state (curve 2); LiCl-induced X state (curve3 mber
aseeutp(o
); LiCl-induced D state (curve 4); and urea-induced D state (curve 5). The curve nu
greement with the one reported elsewhere [56]. The near-UV CDpectra of all deletants in the native state are, within experimentalrrors, comparable with that of the native WT protein as reportedarlier [34]. Absence of dichroic bands in the near-UV region inrea/GdmCl denatured WT y-cyt-c (D state) has been attributed to
he absence of tertiary interactions in the protein [56,57]. A com-arison of the near-UV CD spectrum of the LiCl-induced X statecurve 3) and D state (curve 4) of the WT protein (Fig. 5A) with thatf the urea-induced D state (curve 5) shows that the characteristics have the same meaning in all panels.
CD peaks are completely lost in the LiCl-induced X and D states,suggesting loss of tertiary structure in these states. Like X state ofthe WT protein, X state of all deletants has lost the characteris-tic bands in the near-UV region (Fig. 5B–F). Thus, examination ofthe near-UV CD suggests that X state observed during LiCl-induced
denaturation at pH 6.0 and 25 ◦C fulfills another characteristic ofPMG, namely, loss all the native tertiary structure [35,36].To confirm further that X state of all proteins are indeed devoidof tertiary structure, we looked at the nature of the Met80–Fe

Md.A. Haque et al. / International Journal of Biological Macromolecules 72 (2015) 1406–1418 1413
F 0 andL ers ha
lTn[odCan
ig. 6. Soret CD spectra of various states of WT y-cyt-c and its deletants at pH 6.iCl-induced D state (curve 4); and urea-induced D state (curve 5). The curve numb
igation in different states of the WT protein and its deletants.his interaction can be monitored by two independent probes,amely, CD band at 416 nm [58,59] and absorption band at 695 nm47,60,61]. Fig. 6(A–F) shows the Soret CD spectra (450–370 nm)f the native protein (curve 1), LiCl-induced X state (curve 3) and
enatured states induced by LiCl (curve 4) and urea (curve 5). TheD band at 416 nm is sensitive to the strength of heme-Met80nd Phe82-heme interaction [58,59]. It is seen in Fig. 6 that theative CD band at 416 nm is lost in X and D states of the protein.25 ◦C. Native protein (curve 1); A state (curve 2); LiCl-induced X state (curve 3);ve the same meaning in all panels.
Disappearance of this band suggests disruption of Met80-hemecoordination and disturbance in immediate environment of theheme [59,62,63]. Fig. 7(A–F) shows the absorption spectrum in therange 800–600 nm of the native proteins (curve 1), LiCl-inducedX state (curve 3) and LiCl-induced D state (curve 4). It is seen in
this figure that the 695 nm absorption band which is a signatureof the presence of Met80–Fe interaction is lost in X and D states[60,61]. Thus, characterization of X state by the near-UV CD (Fig. 5),Soret CD (Fig. 6), and absorbance spectra (Fig. 7) led us to conclude
1414 Md.A. Haque et al. / International Journal of Biological Macromolecules 72 (2015) 1406–1418
F ve pros
tarM
rW((wi
ig. 7. Absorption spectra of WT y-cyt-c and its deletants at pH 6.0 and 25 ◦C. Natitate (curve 4). The curve numbers have the same meaning in all panels.
hat the intermediate state X is, indeed, devoid of tertiary inter-ctions present in the native protein [27,28,36]. It is interesting toecall earlier studies [64–67] showing the disruption of the nativeet-80-Fe ligation.To provide further evidence that X state is PMG state, we car-
ied out fluorescence measurements of ANS in the presence ofT protein and its deletants in the native state (curve1), X state
curve 3) and LiCl-induced D states (curve 4) at pH 6.0 and 25 ◦Csee Fig. 8). Fig. 8 also shows spectra of A state (curve 2) whichill later be shown to have all characteristics of MG state. ANS
n polar solvents has negligible emission spectrum. However, its
tein (curve 1); A state (curve 2); LiCl-induced X state (curve 3) and LiCl-induced D
binding with solvent exposed hydrophobic patches causes con-siderable increase in fluorescence intensity with a blue shift inits spectrum [68–70]. Generally, native state of a globular proteinpossess tightly packed, solvent inaccessible hydrophobic core thatprevents ANS to bind to it. D state also does not bind ANS due tohigh polypeptide chain flexibility and complete loss of hydropho-bic clusters [71]. It is seen in Fig. 8 that fluorescence spectra of
ANS in the absence (curve 0) and presence of each protein in thenative state (curve 1) and denatured state (curve 4) are indistin-guishable, suggesting no ANS binding to N and D states of theseproteins.
Md.A. Haque et al. / International Journal of Biological Macromolecules 72 (2015) 1406–1418 1415
F deletaL rs hav
rssbpifliAapt
ig. 8. ANS fluorescence spectra in the absence and presence of WT y-cyt-c and its
iCl-induced X state (curve 3), and LiCl-induced D state (curve 4). The curve numbe
MG is an intermediate state between N and D states, whichetains secondary structure and is compact enough to maintainolvent exposed hydrophobic clusters together, thus providingtronger affinity for ANS to bind [71–74]. PMG state that lies inetween the MG state and the D state retains few hydrophobicatches [35,36,71,75]. It has been reported that ANS binding capac-
ty of PMG state is approximately five times weaker in terms ofuorescence intensity than that of the MG state [35,36,71,75]. It
s seen in Fig. 8 that there is a blue shift in spectra of both X and
states suggesting ANS binding in these states. Fig. 8 and Table 1lso show that fluorescence intensity of X state (curve 3) of eachrotein (WT and its deletants) is approximately five times less thanhe fluorescence intensity of its respective A state (curve 2). Thesents at pH 6.0 and 25 ◦C. Free ANS (curve 0), native state (curve 1), A-state (curve 2),e the same meaning in all panels.
measurements thus suggest that X state is PMG state, for it ful-fills another criterion of PMG state, namely (d) mentioned above[35,36].
To further characterize LiCl-induced X state, we estimatedhydrodynamic volumes of proteins from their observed hydro-dynamic radii obtained from DLS measurements in various solventconditions. It is evident from results given in Table 1 that thehydrodynamic volume of LiCl-induced X state of each protein isapproximately three times more than that of its native state – a
condition for PMG, i.e., the compactness (in terms of hydrodynamicvolume) is approximately three times more than that of the nativeprotein. It has also been reported that the hydrodynamic volumeof the denatured state is 12 times more than that of the native
1416 Md.A. Haque et al. / International Journal of Biological Macromolecules 72 (2015) 1406–1418
Table 1Averaged thermodynamic parameters associated with LiCl-induced denaturation of WT and its deletants monitored by change in [�]222, �[�]409 and �ε405 at pH 6.0 and25 ◦C.
Protein Transition �G0I or �GX
II or �G0D (kcal mol−1) mI or mII (kcal mol−1 M−1) CmI or CmII (M)
WT N ↔ X 5.05 ± 0.38 1.25 ± 0.14 4.05 ± 0.30X ↔ D 1.80 ± 0.13 1.85 ± 0.13 6.37 ± 0.38N ↔ D (6.04 ± 0.44)a
�(−5/−5) N ↔ X 4.17 ± 0.26 1.01 ± 0.04 4.14 ± 0.29X ↔ D 1.99 ± 0.19 2.03 ± 0.12 6.40 ± 0.24N ↔ D (5.48 ± 0.32)
�(−5/−4) N ↔ X 5.36 ± 0.44 1.20 ± 0.04 4.43 ± 0.32X ↔ D 2.18 ± 0.21 2.42 ± 0.06 6.49 ± 0.26N ↔ D (6.90 ± 0.36)
�(−5/−3) N ↔ X 4.24 ± 0.35 1.02 ± 0.07 4.06 ± 0.24X ↔ D 1.93 ± 0.14 1.98 ± 0.09 6.37 ± 0.36N ↔ D (5.68 ± 0.23)
�(−5/−2) N ↔ X 4.14 ± 0.24 1.01 ± 0.09 3.99 ± 0.29X ↔ D 2.00 ± 0.19 2.01 ± 0.09 6.45 ± 0.36N ↔ D (5.53 ± 0.27)
�(−5/−1) N ↔ X 4.27 ± 0.34 1.10 ± 0.11 3.90 ± 0.30
d by u
pva(
6a
4
[WdaomotanysslwUtpb(Fta(TpfioAofi
X ↔ D 1.89 ± 0.21
N ↔ D (5.20 ± 0.35)
a Values in parentheses represent �G0D associated with N ↔ D transitions induce
rotein [35,36]. It is interesting to note that the hydrodynamicolumes obtained for D states of WT y-cyt-c and its deletantsre also 12 times more than that of their respective native statesTable 1).
All structural measurements of the LiCl-induced X state at pH.0 and 25 ◦C suggest that the X state shows all the common char-cteristics of the PMG state.
.2. Molten globule state
A state of WT y-cyt-c has been shown to resemble MG state42,43]. To confirm whether A state of N-terminal deletants of
T y-cyt-c also resembles MG state under identical solvent con-itions, we carried out structural characterization of A state ofll deletants. The characteristics of MG state are: (a) the presencef pronounced amount of secondary structure, (b) the absence ofost of the specific tertiary structure produced by tight packing
f side chains, (c) presence of loosely packed hydrophobic corehat increases the hydrophobic surface accessible to the solvent,nd (d) hydrodynamic volume is 1.5 times more than that of theative protein [35,36,75]. The far-UV CD spectra of A state of WT-cyt-c and its deletants (curve 2, Fig. 4) show no change in theecondary structure content as compared to that present in the Ntate (curve 1) of respective proteins (see Table 1). It suggests abso-ute retention of the secondary structure, which is in accordance
ith the first criterion of MG state mentioned above. The near-V CD spectra of A state of all proteins (curve 2, Fig. 5) show that
he peaks, in the region 282–289 nm, characteristics of the nativeroteins (curve 1) are diminished. The spectrum of A state lies inetween the spectra of completely folded (curve1) and unfoldedcurves 3–5) proteins. The near-UV CD spectra of A state (curve 2,ig. 5) of all proteins suggest partial loss of tertiary structure. Par-ial loss of CD band at 416 nm in the Soret CD spectrum (Fig. 6)nd complete loss of absorption band at 695 nm (Fig. 7) in A statecurve 2) imply disruption of Met80–Fe interaction in all proteins.hese near-UV and Soret CD and absorption measurements showartial perturbation in the tertiary structure of proteins, and ful-ll the above mentioned second criterion, (b). ANS fluorescence
f A state (Fig. 8) shows 5–7 fold increment in the intensity ofNS as compared to that of N state implying increased exposuref hydrophobic patches that binds to ANS. This observation ful-ls another criterion of MG state, namely, criterion (c) mentioned1.91 ± 0.09 6.38 ± 0.37
rea at pH 6.0 and 25 ◦C (unpublished results)
above. Lastly, the hydrodynamic volume of A state determined byDLS measurements (Table 1) is approximately 1.5 times larger thanthat of the N state of respective proteins, fulfilling the last crite-rion of being a MG, namely, criterion (d) mentioned above [75].Thus all pieces of structural evidence imply that A state of eachdeletant of WT y-cyt-c is a MG state as observed for other cyts-c[42,43,56,76–90].
Equilibrium denaturation curves induced by the weak saltdenaturant, LiCl monitored by �ε405, �[�]409 and [�]222, arebiphasic (N ↔ X ↔ D) transitions (Figs. 1, 2 and S1–S4). This obser-vation provides evidence that there exists a thermodynamicallystable intermediate at pH 6.0 and 25 ◦C, which gets accumulatedin a very narrow range of LiCl concentration. We analyzed thetransitions N ↔ X (transition I) and X ↔ D (transition II) for ther-modynamic parameters, �G, m and Cm of the WT protein and itsdeletants. The averaged values of these parameters, estimated fromdifferent optical probes are given in Table 2. It is important to notethat for the analysis of these transitions, following assumptionswere made. First, each transition (i.e., N ↔ X and X ↔ D) follows atwo-state mechanism. A test of this assumption is to see whetherone gets comparable thermodynamic parameters associated withthe transition curves monitored by different structural probes. Itis clear from Figs. 3, S5 and S6 that, for each transition, f and �Gvalues from different optical probes fall on the same f versus [LiCl]and �G versus [LiCl] curves, respectively. This is taken as evidencefor transitions N ↔ X and X ↔ D to be two-state processes [91]. Amore reliable test for the authenticity of two-state assumption is tocompare the total Gibbs free energy change of each protein asso-ciated with N ↔ X ↔ D observed here with that obtained for N ↔ Dtransition induced.
Values for �G0D associated with two-state N ↔ D transition of
the WT protein and its deletants are not reported in the literature.We have measured urea-induced denaturation curves of all pro-teins followed by monitoring changes in [�]222, [�]405 and �ε405 atpH 6.0 and 25 ◦C (unpublished results). It has been observed thatthe normalized denaturation curves of all these optical propertiescoincide with each other, suggesting that urea induces a two-statedenaturation. Each denaturation curve was analyzed to determine
values of �G0D associated with N ↔ D transition, and the values areshown for comparison in Table 2. It is seen in this table that the sumof �G0
I and �GXII for each protein is, within experimental errors,
identical to �G0D associated with N ↔ D process.

Md.A. Haque et al. / International Journal of Biological Macromolecules 72 (2015) 1406–1418 1417
Table 2Comparison of the different structural properties of different states of y-cyt-c and its deletants at pH 6.0 and 25 ◦C.
Protein State Property
[�]222 (deg cm2 dmol−1) ANS fluorescence at �max Hydrodynamic volume (Å3)
WT N −12,232 ± 187 6.7 ± 0.5 14,427 ± 577A −11,969 ± 172 34.0 ± 1.9 23,633 ± 976X −6738 ± 151 9.3 ± 1.1 41,646 ± 1190D −2198 ± 158 7.1 ± 0.3 166,160 ± 4312
�(−5/−1) N −11,144 ± 182 6.5 ± 0.6 15,508 ± 623A −10,761 ± 188 37.0 ± 2.0 24,438 ± 848X −5657 ± 162 8.8 ± 1.3 39,927 ± 1253D 2136 ± 154 7.8 ± 0.4 163,253 ± 4415
�(−5/−2) N −10,882 ± 192 4.06 ± 0.5 13,573 ± 529A −10,656 ± 169 26.8 ± 2.0 22,057 ± 908X −5867 ± 142 5.2 ± 0.5 45,193 ± 1246D −1875 ± 139 4.4 ± 0.6 156,006 ± 4284
�(−5/−3) N −10,908 ± 189 3.2 ± 0.4 13,299 ± 597A −10,635 ± 171 21.5 ± 1.6 20,570 ± 734X −5716 ± 153 4.9 ± 0.5 43,977 ± 1279D −1961 ± 144 3.6 ± 0.5 163,118 ± 4402
�(−5/−4) N −11,244 ± 170 6.9 ± 0.5 13,588 ± 369A −10,944 ± 162 35.0 ± 2.0 24,469 ± 774X −5723 ± 155 9.6 ± 1.3 36,124 ± 1418D −1878 ± 130 7.8 ± 0.5 145,191 ± 2680
�(−5/−5) N −11,689 ± 180 6.8 ± 0.5 16,227 ± 624
Lvt
oWi�T[aatssoo
seuaotspfsr
A
(oI
[
[
[[[[[[
[[
A −11,389 ± 135
X −6018 ± 160
D −1986 ± 126
Second, it was assumed that �GI and �GII vary linearly withiCl concentration. It has been shown earlier [30] that the plot �Gersus [LiCl] is linear in cases of horse and bovine cyts-c. We believehat it is also true in cases of proteins studied here.
In our earlier study, we have shown the effect of deletionf N-terminal extension on the thermodynamic stability ofT y-cyt-c [34]. The order of stability obtained from heat-
nduced denaturation of the WT protein and its deletants is:(−5/−4) > WT > �(−5/−3) > �(−5/−5) > �(−5/−2) ∼ �(−5/−1).
his order of stability has been explained using in silico analysis34]. As evident from Table 2, the stability (�G = �G0
I + �GXII ) of
ll proteins associated with the LiCl-induced biphasic denatur-tion, N ↔ X ↔ D, follows the similar order as was observed forhe heat-induced denaturation of these proteins. This observationuggests that deletion of N-terminal extension does affect thetability of the N state of WT protein. Furthermore, it also validatesur previous conclusion that deletion contributes to the stabilityf N state [34].
It is also evident from the values of �GXII given in Table 2 that the
tability of X state of each protein with respect to D state is, with inxperimental errors, comparable with each other. This finding leds to conclude that deletion of extra N-terminal residues does notffect the stability of the pre-molten globule (X state) state in termsf Gibbs free energy change. On the basis of the results obtained inhis study it is possible to conclude that (a) the thermodynamicallytable intermediate state exists on the reversible folding/unfoldingathway of y-cyt-c and its deletants at pH 6.0 and 25 ◦C, (b) thisolding intermediate has all the common characteristics of PMGtate, and (c) the deletion of one or more of the extra five N-terminalesidues has no effect on the stability of PMG state.
cknowledgments
MAH, SU and SZ are thankful to University Grants CommissionGovernment of India), Department of Biotechnology (Governmentf India) and Indian Council of Medical Research (Government ofndia), respectively for their fellowships. FA and MIH gratefully
[[
[
34.9 ± 1.7 22,856 ± 7839.6 ± 1.3 41,080 ± 11577.5 ± 0.5 167,652 ± 3963
acknowledge the financial support from the Department of Scienceand Technology, Ministry of Science and Technology (SB/SO/BB-71/2010(G)).
Appendix A. Supplementary data
Supplementary data associated with this article can be found,in the online version, at http://dx.doi.org/10.1016/j.ijbiomac.2014.10.053.
References
[1] C.B. Anfinsen, Science 181 (1973) 223–230.[2] C. Levinthal, J. Chim. Phys. 65 (1968) 44.[3] M. Tsytlonok, L.S. Itzhaki, Arch. Biochem. Biophys. 531 (2013) 14–23.[4] O. Miyashita, J.N. Onuchic, P.G. Wolynes, Proc. Natl. Acad. Sci. U.S.A. 100 (2003)
12570–12575.[5] C. Hyeon, P.A. Jennings, J.A. Adams, J.N. Onuchic, Proc. Natl. Acad. Sci. U.S.A. 106
(2009) 3023–3028.[6] S.M. Truhlar, E. Mathes, C.F. Cervantes, G. Ghosh, E.A. Komives, J. Mol. Biol. 380
(2008) 67–82.[7] K.L. Thoren, E.J. Worden, J.M. Yassif, B.A. Krantz, Proc. Natl. Acad. Sci. U.S.A. 106
(2009) 21555–21560.[8] M.T. Honaker, M. Acchione, W. Zhang, B. Mannervik, W.M. Atkins, J. Biol. Chem.
288 (2013) 18599–18611.[9] K. Pervushin, K. Vamvaca, B. Vogeli, D. Hilvert, Nat. Struct. Mol. Biol. 14 (2007)
1202–1206.10] T. Eichner, A.P. Kalverda, G.S. Thompson, S.W. Homans, S.E. Radford, Mol. Cell
41 (2011) 161–172.11] T.R. Jahn, M.J. Parker, S.W. Homans, S.E. Radford, Nat. Struct. Mol. Biol. 13 (2006)
195–201.12] R. Herbst, K. Gast, R. Seckler, Biochemistry 37 (1998) 6586–6597.13] L. Acosta-Sampson, J. King, J. Mol. Biol. 401 (2010) 134–152.14] S. Zaidi, M.I. Hassan, A. Islam, F. Ahmad, Cell. Mol. Life Sci. 71 (2014) 229–255.15] R.A. Goldbeck, E. Chen, D.S. Kliger, Int. J. Mol. Sci. 10 (2009) 1476–1499.16] A.P. Capaldi, C. Kleanthous, S.E. Radford, Nat. Struct. Biol. 9 (2002) 209–216.17] F.A. Tezcan, W.M. Findley, B.R. Crane, S.A. Ross, J.G. Lyubovitsky, H.B. Gray, J.R.
Winkler, Proc. Natl. Acad. Sci. U.S.A. 99 (2002) 8626–8630.18] R. Grandori, Protein Sci. 11 (2002) 453–458.19] S.R. Yeh, D.L. Rousseau, Nat. Struct. Biol. 5 (1998) 222–228.
20] H. Roder, G.A. Elove, S.W. Englander, Nature 335 (1988) 700–704.21] T.R. Sosnick, L. Mayne, R. Hiller, S.W. Englander, Nat. Struct. Biol. 1 (1994)149–156.22] W. Colon, G.A. Elove, L.P. Wakem, F. Sherman, H. Roder, Biochemistry 35 (1996)
5538–5549.
1 Biolog
[
[[[
[[[
[
[
[
[
[
[[[
[[
[[[[[[
[[[[[[[[[[
[
[
[
[[[[[[
[[[
[[[
[
[
[[[[[[[
[[
[[[[[
[
418 Md.A. Haque et al. / International Journal of
23] S. Akiyama, S. Takahashi, K. Ishimori, I. Morishima, Nat. Struct. Biol. 7 (2000)514–520.
24] A.F. Chaffotte, Y. Guillou, M.E. Goldberg, Biochemistry 31 (1992) 9694–9702.25] O.B. Ptitsyn, Adv. Protein Chem. 47 (1995) 83–229.26] A.L. Fink, L.J. Calciano, Y. Goto, T. Kurotsu, D.R. Palleros, Biochemistry 33 (1994)
12504–12511.27] V.N. Uversky, O.B. Ptitsyn, Biochemistry 33 (1994) 2782–2791.28] V.N. Uversky, O.B. Ptitsyn, J. Mol. Biol. 255 (1996) 215–228.29] B. Moza, S.H. Qureshi, A. Islam, R. Singh, F. Anjum, A.A. Moosavi-Movahedi, F.
Ahmad, Biochemistry 45 (2006) 4695–4702.30] S.H. Qureshi, B. Moza, S. Yadav, F. Ahmad, Biochemistry 42 (2003) 1684–
1695.31] M.K. Alam Khan, M.H. Rahaman, M.I. Hassan, T.P. Singh, A.A. Moosavi-
Movahedi, F. Ahmad, J. Biol. Inorg. Chem. 15 (2010) 1319–1329.32] M.K. Alam Khan, U. Das, M.H. Rahaman, M.I. Hassan, A. Srinivasan, T.P. Singh,
F. Ahmad, J. Biol. Inorg. Chem. 14 (2009) 751–760.33] G.R. Moore, G.W. Pettigrew, Cytochrome c: Evolutionary, structural and phys-
icochemical aspects, Springer-Verlag, Berlin, 1990, pp. 831–833.34] S. Ubaid-Ullah, M.A. Haque, S. Zaidi, M.I. Hassan, A. Islam, J.K. Batra, T.P. Singh,
F. Ahmad, J. Biomol. Struct. Dyn. 32 (2014) 2005–2016.35] V.N. Uversky, Protein Pept. Lett. 4 (1997) 355–367.36] V.N. Uversky, Protein Sci. 11 (2002) 739–756.37] C.M. Lett, M.D. Rosu-Myles, H.E. Frey, J.G. Guillemette, Biochim. Biophys. Acta
1432 (1999) 40–48.38] D.S. Cohen, G.J. Pielak, Protein Sci. 3 (1994) 1253–1260.39] R.L. Cutler, G.J. Pielak, A.G. Mauk, M. Smith, Protein Eng. 1 (1987)
95–99.40] Y. Goto, N. Takahashi, A.L. Fink, Biochemistry 29 (1990) 3480–3488.41] E. Margoliash, N. Frohwirt, Biochem J. 71 (1959) 570–572.42] J.L. Marmorino, M. Lehti, G.J. Pielak, J. Mol. Biol. 275 (1998) 379–388.43] J.L. Marmorino, G.J. Pielak, Biochemistry 34 (1995) 3140–3143.44] P.M. Mulqueen, M.J. Kronman, Arch. Biochem. Biophys. 215 (1982) 28–39.45] R.C. Weast, Handbook of Chemistry and Physics, 53rd ed., CRC Press, Cleveland,
OH, 1972.46] A. Schejter, W.A. Eaton, Biochemistry 23 (1984) 1081–1084.47] E. Margoliash, A. Schejter, Adv. Protein Chem. 21 (1966) 113–286.48] C.N. Pace, CRC Crit. Rev. Biochem. 3 (1975) 1–43.49] G. Blauer, N. Sreerama, R.W. Woody, Biochemistry 32 (1993) 6674–6679.50] Y.P. Myer, J. Biol. Chem. 243 (1968) 2115–2122.51] Y.P. Myer, Methods Enzymol. 54 (1978) 249–284.52] N. Greenfield, G.D. Fasman, Biochemistry 8 (1969) 4108–4116.53] N.J. Greenfield, Nat. Protoc. 1 (2006) 2876–2890.
54] L.M. Herrmann, B.E. Bowler, Protein Sci. 6 (1997) 657–665.55] A.M. Davies, J.G. Guillemette, M. Smith, C. Greenwood, A.G. Thurgood, A.G.Mauk, G.R. Moore, Biochemistry 32 (1993) 5431–5435.56] F. Sinibaldi, B.D. Howes, M.C. Piro, P. Caroppi, G. Mei, F. Ascoli, G. Smulevich, R.
Santucci, J. Biol. Inorg. Chem. 11 (2006) 52–62.
[[[[
ical Macromolecules 72 (2015) 1406–1418
57] Y.P. Myer, L.H. MacDonald, B.C. Verma, A. Pande, Biochemistry 19 (1980)199–207.
58] G.J. Pielak, K. Oikawa, A.G. Mauk, M. Smith, C.M. Kay, J. Am. Chem. Soc. 108(1986) 2724–2727.
59] R. Santucci, F. Ascoli, J. Inorg. Biochem. 68 (1997) 211–214.60] A. Schejter, P. George, Biochemistry 3 (1964) 1045–1049.61] E. Stellwagen, R. Cass, Biochem. Biophys. Res. Commun. 60 (1974) 371–375.62] M.C. Hsu, R.W. Woody, J. Am. Chem. Soc. 93 (1971) 3515–3525.63] Y.P. Myer, H.A. Harbury, J. Biol. Chem. 241 (1966) 4299–4303.64] W. Colon, L.P. Wakem, F. Sherman, H. Roder, Biochemistry 36 (1997)
12535–12541.65] K. Muthukrishnan, B.T. Nall, Biochemistry 30 (1991) 4706–4710.66] J. Babul, E. Stellwagen, Biochemistry 11 (1972) 1195–1200.67] E. Chen, C.J. Abel, R.A. Goldbeck, D.S. Kliger, Biochemistry 46 (2007)
12463–12472.68] O.B. Ptitsyn, Curr. Opin. Struct. Biol. 5 (1995) 74–78.69] O.B. Ptitsyn, Trends Biochem. Sci. 20 (1995) 376–379.70] O.B. Ptitsyn, R.H. Pain, G.V. Semisotnov, E. Zerovnik, O.I. Razgulyaev, FEBS Lett.
262 (1990) 20–24.71] G.V. Semisotnov, N.A. Rodionova, O.I. Razgulyaev, V.N. Uversky, A.F. Gripas, R.I.
Gilmanshin, Biopolymers 31 (1991) 119–128.72] D.A. Dolgikh, L.V. Abaturov, I.A. Bolotina, E.V. Brazhnikov, V.E. Bychkova, R.I.
Gilmanshin, O. Lebedev Yu, G.V. Semisotnov, E.I. Tiktopulo, O.B. Ptitsyn, et al.,Eur. Biophys. J. 13 (1985) 109–121.
73] K.P. Wong, L.M. Hamlin, Biochemistry 13 (1974) 2678–2683.74] K.P. Wong, C. Tanford, J. Biol. Chem. 248 (1973) 8518–8523.75] M. Arai, K. Kuwajima, Adv. Protein Chem. 53 (2000) 209–282.76] T.V. Chalikian, V.S. Gindikin, K.J. Breslauer, J. Mol. Biol. 250 (1995) 291–306.77] W. Colon, H. Roder, Nat. Struct. Biol. 3 (1996) 1019–1025.78] Y. Goto, L.J. Calciano, A.L. Fink, Proc. Natl. Acad. Sci. U.S.A. 87 (1990) 573–577.79] Y. Goto, Y. Hagihara, D. Hamada, M. Hoshino, I. Nishii, Biochemistry 32 (1993)
11878–11885.80] Y. Hagihara, Y. Tan, Y. Goto, J. Mol. Biol. 237 (1994) 336–348.81] M.F. Jeng, S.W. Englander, G.A. Elove, A.J. Wand, H. Roder, Biochemistry 29
(1990) 10433–10437.82] M. Kataoka, Y. Hagihara, K. Mihara, Y. Goto, J. Mol. Biol. 229 (1993) 591–596.83] T. Konno, Protein Sci. 7 (1998) 975–982.84] Y. Kuroda, S. Endo, K. Nagayama, A. Wada, J. Mol. Biol. 247 (1995) 682–688.85] S. Nakamura, Y. Seki, E. Katoh, S. Kidokoro, Biochemistry 50 (2011) 3116–3126.86] R. Santucci, C. Bongiovanni, G. Mei, T. Ferri, F. Polizio, A. Desideri, Biochemistry
39 (2000) 12632–12638.87] F. Sinibaldi, B.D. Howes, G. Smulevich, C. Ciaccio, M. Coletta, R. Santucci, J. Biol.
Inorg. Chem. 8 (2003) 663–670.88] F. Sinibaldi, M.C. Piro, M. Coletta, R. Santucci, FEBS J. 273 (2006) 5347–5357.89] K.S. Vassilenko, V.N. Uversky, Biochim. Biophys. Acta 1594 (2002) 168–177.90] Q. Xu, T.A. Keiderling, Biopolymers 73 (2004) 716–726.91] K.A. Dill, Biochemistry 29 (1990) 7133–7155.
Related Documents