This article was published in an Elsevier journal. The attached copy is furnished to the author for non-commercial research and education use, including for instruction at the author’s institution, sharing with colleagues and providing to institution administration. Other uses, including reproduction and distribution, or selling or licensing copies, or posting to personal, institutional or third party websites are prohibited. In most cases authors are permitted to post their version of the article (e.g. in Word or Tex form) to their personal website or institutional repository. Authors requiring further information regarding Elsevier’s archiving and manuscript policies are encouraged to visit: http://www.elsevier.com/copyright

Welcome message from author
This document is posted to help you gain knowledge. Please leave a comment to let me know what you think about it! Share it to your friends and learn new things together.
Transcript
This article was published in an Elsevier journal. The attached copyis furnished to the author for non-commercial research and
education use, including for instruction at the author’s institution,sharing with colleagues and providing to institution administration.
Other uses, including reproduction and distribution, or selling orlicensing copies, or posting to personal, institutional or third party
websites are prohibited.
In most cases authors are permitted to post their version of thearticle (e.g. in Word or Tex form) to their personal website orinstitutional repository. Authors requiring further information
regarding Elsevier’s archiving and manuscript policies areencouraged to visit:
http://www.elsevier.com/copyright

Available online at www.sciencedirect.com
Synthetic Metals 157 (2007) 974–983
Characterization of poly(N-alkylanilines) by Raman spectroscopy
Maija Blomquist a,b, Tom Lindfors a,∗, Ari Ivaska a
a Process Chemistry Centre, c/o Laboratory of Analytical Chemistry, Abo Akademi University, Biskopsgatan 8, 20500 Turku/Abo, Finlandb The Finnish National Graduate School in Nanoscience (NGS-NANO), Nanoscience Center, P.O. Box 35, 40014 University of Jyvaskyla, Finland
Received 26 January 2007; received in revised form 9 August 2007; accepted 3 October 2007Available online 19 November 2007
Abstract
Thin films of poly(N-alkylaniline) were synthesized in acidic aqueous solution and in mixtures of aqueous and organic solvents. The polymerfilms (alkyl = methyl, ethyl, propyl and butyl) were characterized by Raman spectroscopy with the excitation wavelengths of 514.5, 632.8 and780 nm. The main Raman bands have been characterized for the leucoemeraldine, emeraldine and pernigraniline oxidation states between −0.2and 0.8 V (vs. Ag|AgCl). This fundamental study shows that the structure of the half-oxidized emeraldine form contains quinoid units, whichsupports the commonly accepted oxidation and reduction scheme of poly(N-alkylanilines).© 2007 Elsevier B.V. All rights reserved.
Keywords: Poly(N-alkylanilines); Electropolymerization; Raman and UV–vis spectroscopy; Cyclic voltammetry
1. Introduction
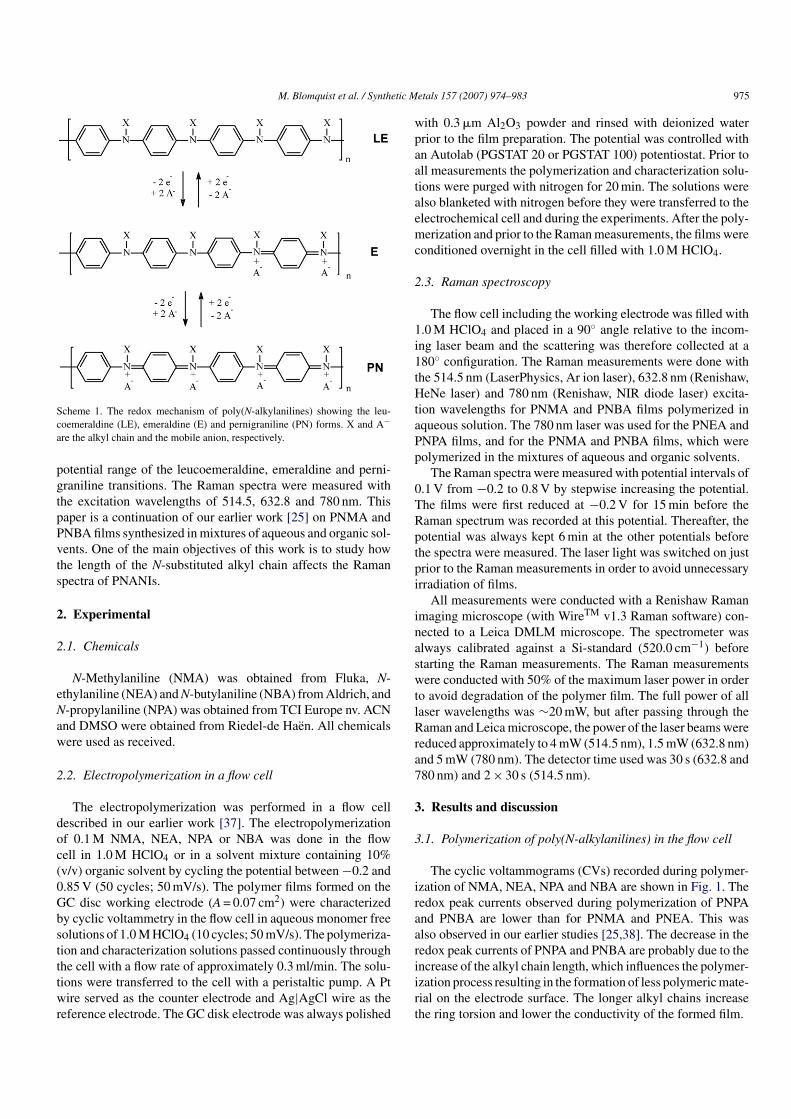
Poly(N-alkylanilines) (PNANIs) are interesting materialsbecause the addition of side groups to polyaniline (PANI)backbone results in improved solubility and processabil-ity [1,2]. PNANIs have despite of this been studied muchless than PANI. Poly(N-methylaniline) (PNMA) has so fargained most attention among PNANIs. In earlier works,both electrochemically and chemically synthesized PNMA,poly(N-ethylaniline) (PNEA), poly(N-propylaniline) (PNPA)and poly(N-butylaniline) (PNBA) have been reported [1,3–32].The electrochemistry of PNANIs is generally agreed to followScheme 1, which shows the leucoemeraldine (LE), emeraldine(E) and pernigraniline (PN) oxidation states of PNANIs [12,15].The emeraldine form is the only electrically conducting form ofthe PNANIs.
In the literature, PNANIs has not been systematically char-acterized with Raman spectroscopy. Only handful of papers,to the best of our knowledge, deals with Raman spectroscopyof substituted polyanilines. Quillard et al. compared Ramanspectra of PANI and poly(o-toluidine) [33]. Also photoin-duced spectra of poly(o-ethylaniline) and PANI were compared
∗ Corresponding author. Tel.: +358 2 2154422; fax: +358 2 2154479.E-mail address: [email protected] (T. Lindfors).
in their work. The substituted polymers have a change insymmetry compared with PANI, which leads to new peaksin the spectra in comparison to the PANI spectrum. Malin-auskas et al. have characterized PNMA and a copolymer ofN-methylaniline and N(3-sulphopropyl)-aniline by Raman spec-troscopy [34]. Kilmartin and Wright reported a Raman study offour substituted polyanilines: PNMA, poly(m-methylaniline),poly(o-methoxyaniline) and poly(o-ethoxyaniline) [15]. Thespectra showed a recognizable PANI pattern. Raman spec-tra of the conducting form of ring-sulphonated polyaniline(SPAN) and PANI were compared by Niaura et al. [35].Some of the Raman bands shifted to higher frequencies in theRaman spectra of SPAN compared to PANI, which indicatestructural differences between these two polymers. Structuraland electronic characteristics of sulphonated polyanilines andpoly(o-methoxyanilines) were compared with Raman spec-troscopy by Bernard et al. [36]. They concluded that thesubstituent could modify the polaronic nature to become morerandom. Furthermore, Wei et al. have studied the Raman spectraof PNMA electropolymerized in an organic solvent [8].
In this paper, PNMA, PNEA, PNPA and PNBA films werepolymerized in acidic aqueous solutions and characterized byRaman spectroscopy. The PNMA and PNBA were for com-parison also polymerized in presence of 10% (v/v) acetonitrile(ACN) or dimethyl sulfoxide (DMSO). After the polymer-ization, the polymer films were systematically studied in the
0379-6779/$ – see front matter © 2007 Elsevier B.V. All rights reserved.doi:10.1016/j.synthmet.2007.10.001
M. Blomquist et al. / Synthetic Metals 157 (2007) 974–983 975
Scheme 1. The redox mechanism of poly(N-alkylanilines) showing the leu-coemeraldine (LE), emeraldine (E) and pernigraniline (PN) forms. X and A−are the alkyl chain and the mobile anion, respectively.
potential range of the leucoemeraldine, emeraldine and perni-graniline transitions. The Raman spectra were measured withthe excitation wavelengths of 514.5, 632.8 and 780 nm. Thispaper is a continuation of our earlier work [25] on PNMA andPNBA films synthesized in mixtures of aqueous and organic sol-vents. One of the main objectives of this work is to study howthe length of the N-substituted alkyl chain affects the Ramanspectra of PNANIs.
2. Experimental
2.1. Chemicals
N-Methylaniline (NMA) was obtained from Fluka, N-ethylaniline (NEA) and N-butylaniline (NBA) from Aldrich, andN-propylaniline (NPA) was obtained from TCI Europe nv. ACNand DMSO were obtained from Riedel-de Haen. All chemicalswere used as received.
2.2. Electropolymerization in a flow cell
The electropolymerization was performed in a flow celldescribed in our earlier work [37]. The electropolymerizationof 0.1 M NMA, NEA, NPA or NBA was done in the flowcell in 1.0 M HClO4 or in a solvent mixture containing 10%(v/v) organic solvent by cycling the potential between −0.2 and0.85 V (50 cycles; 50 mV/s). The polymer films formed on theGC disc working electrode (A = 0.07 cm2) were characterizedby cyclic voltammetry in the flow cell in aqueous monomer freesolutions of 1.0 M HClO4 (10 cycles; 50 mV/s). The polymeriza-tion and characterization solutions passed continuously throughthe cell with a flow rate of approximately 0.3 ml/min. The solu-tions were transferred to the cell with a peristaltic pump. A Ptwire served as the counter electrode and Ag|AgCl wire as thereference electrode. The GC disk electrode was always polished
with 0.3 �m Al2O3 powder and rinsed with deionized waterprior to the film preparation. The potential was controlled withan Autolab (PGSTAT 20 or PGSTAT 100) potentiostat. Prior toall measurements the polymerization and characterization solu-tions were purged with nitrogen for 20 min. The solutions werealso blanketed with nitrogen before they were transferred to theelectrochemical cell and during the experiments. After the poly-merization and prior to the Raman measurements, the films wereconditioned overnight in the cell filled with 1.0 M HClO4.
2.3. Raman spectroscopy
The flow cell including the working electrode was filled with1.0 M HClO4 and placed in a 90◦ angle relative to the incom-ing laser beam and the scattering was therefore collected at a180◦ configuration. The Raman measurements were done withthe 514.5 nm (LaserPhysics, Ar ion laser), 632.8 nm (Renishaw,HeNe laser) and 780 nm (Renishaw, NIR diode laser) excita-tion wavelengths for PNMA and PNBA films polymerized inaqueous solution. The 780 nm laser was used for the PNEA andPNPA films, and for the PNMA and PNBA films, which werepolymerized in the mixtures of aqueous and organic solvents.
The Raman spectra were measured with potential intervals of0.1 V from −0.2 to 0.8 V by stepwise increasing the potential.The films were first reduced at −0.2 V for 15 min before theRaman spectrum was recorded at this potential. Thereafter, thepotential was always kept 6 min at the other potentials beforethe spectra were measured. The laser light was switched on justprior to the Raman measurements in order to avoid unnecessaryirradiation of films.
All measurements were conducted with a Renishaw Ramanimaging microscope (with WireTM v1.3 Raman software) con-nected to a Leica DMLM microscope. The spectrometer wasalways calibrated against a Si-standard (520.0 cm−1) beforestarting the Raman measurements. The Raman measurementswere conducted with 50% of the maximum laser power in orderto avoid degradation of the polymer film. The full power of alllaser wavelengths was ∼20 mW, but after passing through theRaman and Leica microscope, the power of the laser beams werereduced approximately to 4 mW (514.5 nm), 1.5 mW (632.8 nm)and 5 mW (780 nm). The detector time used was 30 s (632.8 and780 nm) and 2 × 30 s (514.5 nm).
3. Results and discussion
3.1. Polymerization of poly(N-alkylanilines) in the flow cell
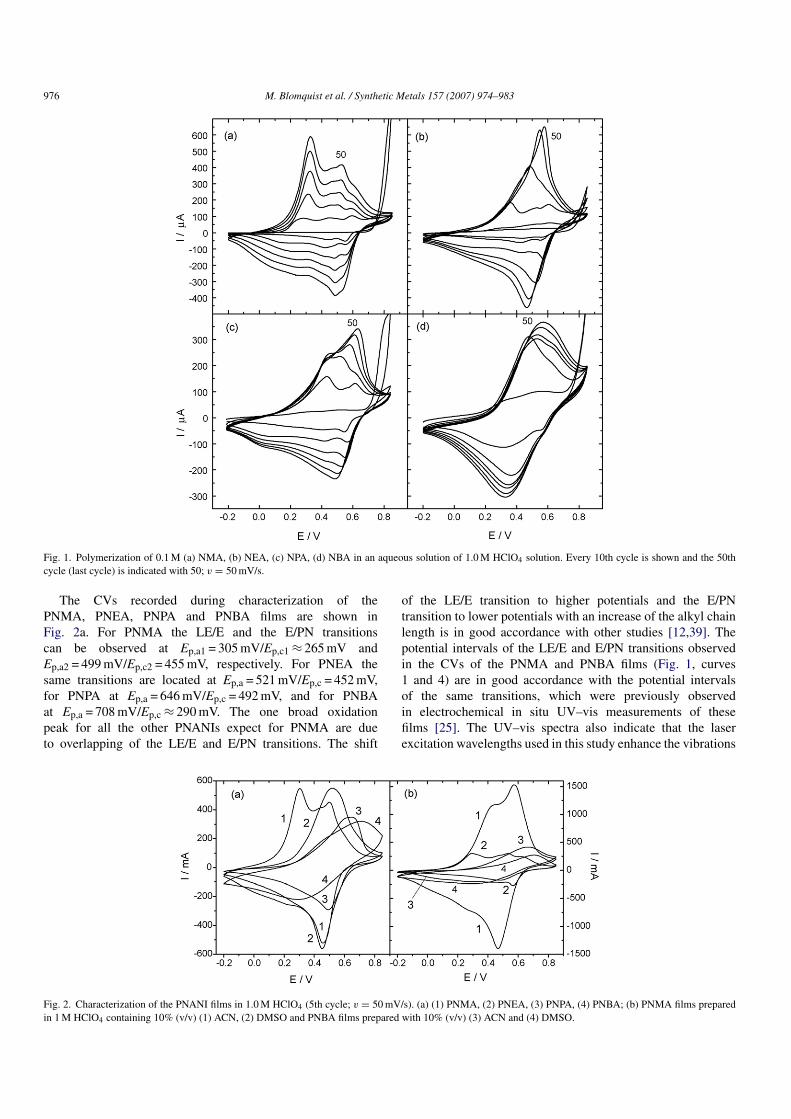
The cyclic voltammograms (CVs) recorded during polymer-ization of NMA, NEA, NPA and NBA are shown in Fig. 1. Theredox peak currents observed during polymerization of PNPAand PNBA are lower than for PNMA and PNEA. This wasalso observed in our earlier studies [25,38]. The decrease in theredox peak currents of PNPA and PNBA are probably due to theincrease of the alkyl chain length, which influences the polymer-ization process resulting in the formation of less polymeric mate-rial on the electrode surface. The longer alkyl chains increasethe ring torsion and lower the conductivity of the formed film.
976 M. Blomquist et al. / Synthetic Metals 157 (2007) 974–983
Fig. 1. Polymerization of 0.1 M (a) NMA, (b) NEA, (c) NPA, (d) NBA in an aqueous solution of 1.0 M HClO4 solution. Every 10th cycle is shown and the 50thcycle (last cycle) is indicated with 50; v = 50 mV/s.
The CVs recorded during characterization of thePNMA, PNEA, PNPA and PNBA films are shown inFig. 2a. For PNMA the LE/E and the E/PN transitionscan be observed at Ep,a1 = 305 mV/Ep,c1 ≈ 265 mV andEp,a2 = 499 mV/Ep,c2 = 455 mV, respectively. For PNEA thesame transitions are located at Ep,a = 521 mV/Ep,c = 452 mV,for PNPA at Ep,a = 646 mV/Ep,c = 492 mV, and for PNBAat Ep,a = 708 mV/Ep,c ≈ 290 mV. The one broad oxidationpeak for all the other PNANIs expect for PNMA are dueto overlapping of the LE/E and E/PN transitions. The shift
of the LE/E transition to higher potentials and the E/PNtransition to lower potentials with an increase of the alkyl chainlength is in good accordance with other studies [12,39]. Thepotential intervals of the LE/E and E/PN transitions observedin the CVs of the PNMA and PNBA films (Fig. 1, curves1 and 4) are in good accordance with the potential intervalsof the same transitions, which were previously observedin electrochemical in situ UV–vis measurements of thesefilms [25]. The UV–vis spectra also indicate that the laserexcitation wavelengths used in this study enhance the vibrations
Fig. 2. Characterization of the PNANI films in 1.0 M HClO4 (5th cycle; v = 50 mV/s). (a) (1) PNMA, (2) PNEA, (3) PNPA, (4) PNBA; (b) PNMA films preparedin 1 M HClO4 containing 10% (v/v) (1) ACN, (2) DMSO and PNBA films prepared with 10% (v/v) (3) ACN and (4) DMSO.

M. Blomquist et al. / Synthetic Metals 157 (2007) 974–983 977
Fig. 3. Raman spectra of (A) PNMA and (B) PNBA film. Excitation wavelength: 514.5 nm. The potentials applied are indicated with (a) −0.2 V, (b) 0 V, (c) 0.2 V,(d) 0.4 V, (e) 0.6 V and (f) 0.8 V. The spectra were measured with 0.1 V intervals.
originating from the quinoid structures in the following order:780 nm > 632.8 nm > 514.5 nm.
The CVs of PNMA and PNBA polymerized in aqueous1.0 M HClO4 in presence of 10% ACN or 10% DMSO areshown in Fig. 2b. For PNMA prepared in a mixed solventcontaining 10% ACN, the LE/E and the E/PN transitionscan be observed at Ep,a1 ≈ 440 mV/Ep,c1 ≈ 270 mV and Ep,a2= 573 mV/Ep,c2 = 466 mV, respectively. For PNMA prepared in asolution containing 10% DMSO, the anodic LE/E and the E/PNtransitions can be observed at Ep,a1 = 294 mV/Ep,c1 ≈ 250 mVand Ep,a2 = 536 mV/Ep,c = 565 mV. A third oxidation peak isobserved at ∼540 mV, which is probably due to degradationproducts of PNMA.
PNBA films polymerized in presence of 10% (v/v) ACN orDMSO have only one broad oxidation and reduction peak. Theoverlapping LE/E and E/PN transitions can be observed for thePNBA (10% ACN) film at Ep,a = 668 mV/Ep,c ≈ 375 mV and forthe PNBA (10% DMSO) film at Ep,a = 705 mV/Ep,c = 477 mV,respectively.
The organic solvents, ACN and DMSO, were chosen for thisstudy on basis of the results from our previous work [25]. It wasfound that the addition of ACN into the polymerization solutionincreased the oxidation and reduction currents of PNMA. Onthe other hand, the addition of DMSO decreased the redox cur-rents. The films polymerized in mixtures of aqueous and organicsolvents are hereafter referred to as PNMA (10% ACN), PNMA(10% DMSO), PNBA (10% ACN) and PNBA (10% DMSO).Films polymerized in acidic aqueous solutions are notified asPNMA, PNEA, PNPA and PNBA.
3.2. Raman measurement
The Raman spectra were measured from −0.2 to 0.8 V byincreasing the potential stepwise with 0.1 V. The UV–vis spec-tra, which were reported earlier by us [25], show that the 632.8and 780 nm laser excitation wavelengths mostly enhance vibra-tional modes of the quinoid units. The vibrations related to thenitrogen atoms are expected to be mainly affected by the N-substitution compared to unsubstituted PANI [15]. Accordingto our earlier reported UV–vis spectra of PNMA [25], the vibra-tional modes of the quinoid units are only slightly enhancedby the 514.5 nm laser compared to the benzenoid units. In thecase of PNBA, the 514.5 nm laser is expected to enhance ratherequally vibrations originating from both quinoid and benzenoidunits [33]. In this study, the main vibrational bands in the Ramanspectra of poly(N-alkylanilines) are interpreted.
3.2.1. Excitation wavelength of 514.5 nm3.2.1.1. Poly(N-methylaniline). The Raman spectra of PNMAand PNBA measured with the 514.5 nm laser excitation wave-length are shown in Fig. 3. The spectra have been separated fromeach other for the sake of clarity. The assignments of the mainvibrational bands of the Raman spectra are given in Table 1 forPNMA and in Table 2 for PNBA. The Raman band indicatedwith an asterisk in Figs. 4–6 originates from HClO4. All refer-ences to the Raman bands, which were interpreted in this study,are given in Table 1.
The PNMA spectrum measured at −0.2 V (Fig. 3A, spectraa) shows strong vibrational bands at 1618, 1358 and 1185 cm−1.
978 M. Blomquist et al. / Synthetic Metals 157 (2007) 974–983
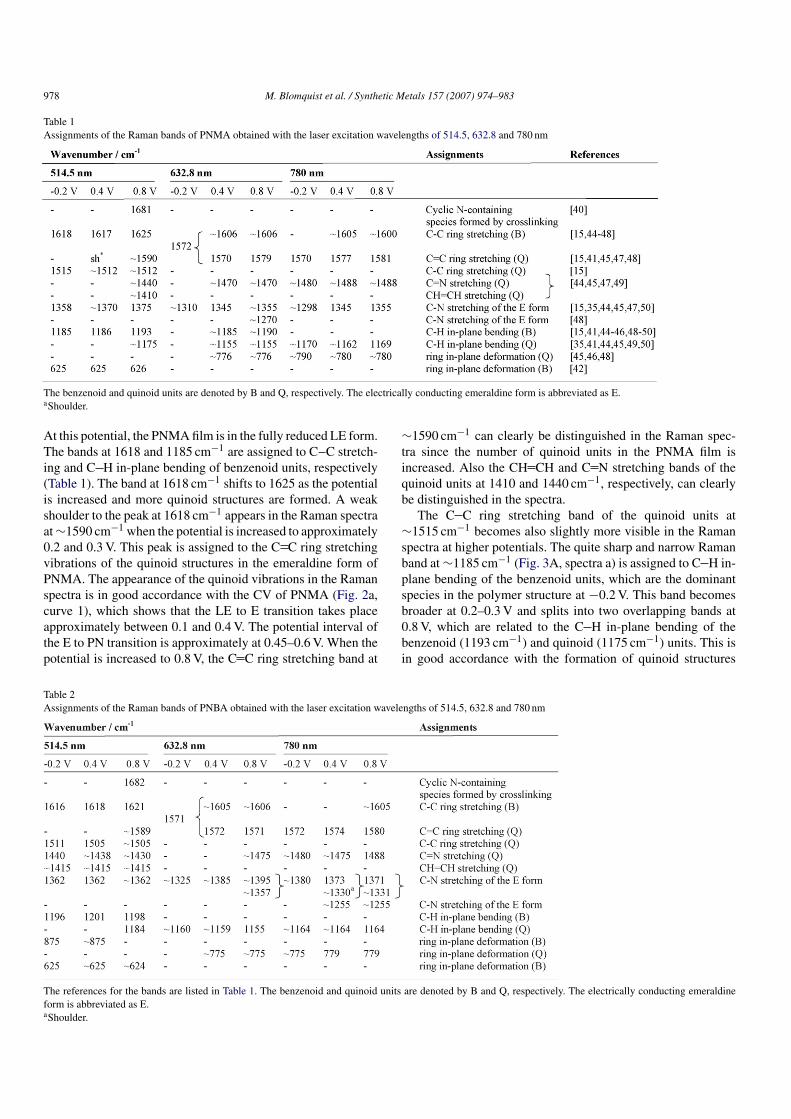
Table 1Assignments of the Raman bands of PNMA obtained with the laser excitation wavelengths of 514.5, 632.8 and 780 nm
The benzenoid and quinoid units are denoted by B and Q, respectively. The electrically conducting emeraldine form is abbreviated as E.aShoulder.
At this potential, the PNMA film is in the fully reduced LE form.The bands at 1618 and 1185 cm−1 are assigned to C C stretch-ing and C H in-plane bending of benzenoid units, respectively(Table 1). The band at 1618 cm−1 shifts to 1625 as the potentialis increased and more quinoid structures are formed. A weakshoulder to the peak at 1618 cm−1 appears in the Raman spectraat ∼1590 cm−1 when the potential is increased to approximately0.2 and 0.3 V. This peak is assigned to the C C ring stretchingvibrations of the quinoid structures in the emeraldine form ofPNMA. The appearance of the quinoid vibrations in the Ramanspectra is in good accordance with the CV of PNMA (Fig. 2a,curve 1), which shows that the LE to E transition takes placeapproximately between 0.1 and 0.4 V. The potential interval ofthe E to PN transition is approximately at 0.45–0.6 V. When thepotential is increased to 0.8 V, the C C ring stretching band at
∼1590 cm−1 can clearly be distinguished in the Raman spec-tra since the number of quinoid units in the PNMA film isincreased. Also the CH CH and C N stretching bands of thequinoid units at 1410 and 1440 cm−1, respectively, can clearlybe distinguished in the spectra.
The C C ring stretching band of the quinoid units at∼1515 cm−1 becomes also slightly more visible in the Ramanspectra at higher potentials. The quite sharp and narrow Ramanband at ∼1185 cm−1 (Fig. 3A, spectra a) is assigned to C H in-plane bending of the benzenoid units, which are the dominantspecies in the polymer structure at −0.2 V. This band becomesbroader at 0.2–0.3 V and splits into two overlapping bands at0.8 V, which are related to the C H in-plane bending of thebenzenoid (1193 cm−1) and quinoid (1175 cm−1) units. This isin good accordance with the formation of quinoid structures
Table 2Assignments of the Raman bands of PNBA obtained with the laser excitation wavelengths of 514.5, 632.8 and 780 nm
The references for the bands are listed in Table 1. The benzenoid and quinoid units are denoted by B and Q, respectively. The electrically conducting emeraldineform is abbreviated as E.aShoulder.

M. Blomquist et al. / Synthetic Metals 157 (2007) 974–983 979
Fig. 4. Raman spectra of (A) PNMA and (B) PNBA film. Excitation wavelength: 632.8 nm. The peak originating from HClO4 is marked with an asterisk. Thepotentials applied are indicated with (a) −0.2 V, (b) 0 V, (c) 0.2 V, (d) 0.4 V, (e) 0.6 V and (f) 0.8 V. The spectra were measured with 0.1 V intervals.
Fig. 5. Raman spectra of (A) PNMA and (B) PNBA film. Excitation wavelength: 780 nm. The peak originating from HClO4 is marked with an asterisk. The potentialsapplied are indicated with (a) −0.2 V, (b) 0 V, (c) 0.2 V, (d) 0.4 V, (e) 0.6 V and (f) 0.8 V. The spectra were measured with 0.1 V intervals.
980 M. Blomquist et al. / Synthetic Metals 157 (2007) 974–983
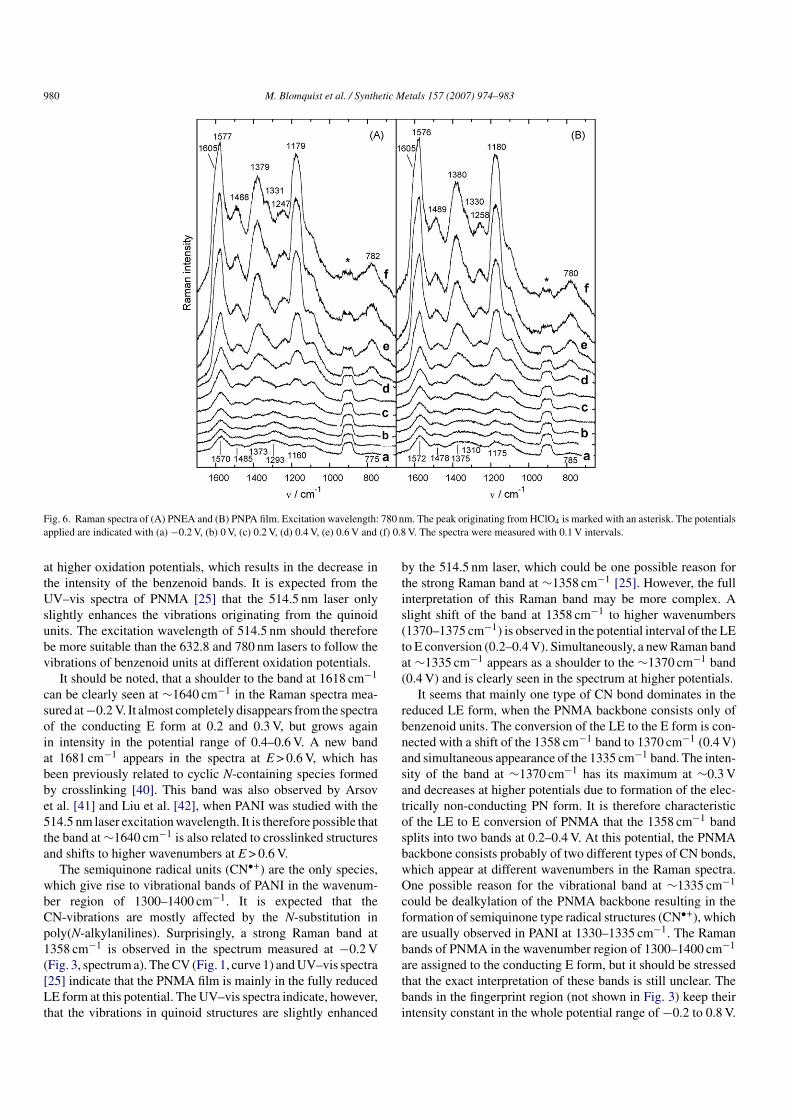
Fig. 6. Raman spectra of (A) PNEA and (B) PNPA film. Excitation wavelength: 780 nm. The peak originating from HClO4 is marked with an asterisk. The potentialsapplied are indicated with (a) −0.2 V, (b) 0 V, (c) 0.2 V, (d) 0.4 V, (e) 0.6 V and (f) 0.8 V. The spectra were measured with 0.1 V intervals.
at higher oxidation potentials, which results in the decrease inthe intensity of the benzenoid bands. It is expected from theUV–vis spectra of PNMA [25] that the 514.5 nm laser onlyslightly enhances the vibrations originating from the quinoidunits. The excitation wavelength of 514.5 nm should thereforebe more suitable than the 632.8 and 780 nm lasers to follow thevibrations of benzenoid units at different oxidation potentials.
It should be noted, that a shoulder to the band at 1618 cm−1
can be clearly seen at ∼1640 cm−1 in the Raman spectra mea-sured at −0.2 V. It almost completely disappears from the spectraof the conducting E form at 0.2 and 0.3 V, but grows againin intensity in the potential range of 0.4–0.6 V. A new bandat 1681 cm−1 appears in the spectra at E > 0.6 V, which hasbeen previously related to cyclic N-containing species formedby crosslinking [40]. This band was also observed by Arsovet al. [41] and Liu et al. [42], when PANI was studied with the514.5 nm laser excitation wavelength. It is therefore possible thatthe band at ∼1640 cm−1 is also related to crosslinked structuresand shifts to higher wavenumbers at E > 0.6 V.
The semiquinone radical units (CN•+) are the only species,which give rise to vibrational bands of PANI in the wavenum-ber region of 1300–1400 cm−1. It is expected that theCN-vibrations are mostly affected by the N-substitution inpoly(N-alkylanilines). Surprisingly, a strong Raman band at1358 cm−1 is observed in the spectrum measured at −0.2 V(Fig. 3, spectrum a). The CV (Fig. 1, curve 1) and UV–vis spectra[25] indicate that the PNMA film is mainly in the fully reducedLE form at this potential. The UV–vis spectra indicate, however,that the vibrations in quinoid structures are slightly enhanced
by the 514.5 nm laser, which could be one possible reason forthe strong Raman band at ∼1358 cm−1 [25]. However, the fullinterpretation of this Raman band may be more complex. Aslight shift of the band at 1358 cm−1 to higher wavenumbers(1370–1375 cm−1) is observed in the potential interval of the LEto E conversion (0.2–0.4 V). Simultaneously, a new Raman bandat ∼1335 cm−1 appears as a shoulder to the ∼1370 cm−1 band(0.4 V) and is clearly seen in the spectrum at higher potentials.
It seems that mainly one type of CN bond dominates in thereduced LE form, when the PNMA backbone consists only ofbenzenoid units. The conversion of the LE to the E form is con-nected with a shift of the 1358 cm−1 band to 1370 cm−1 (0.4 V)and simultaneous appearance of the 1335 cm−1 band. The inten-sity of the band at ∼1370 cm−1 has its maximum at ∼0.3 Vand decreases at higher potentials due to formation of the elec-trically non-conducting PN form. It is therefore characteristicof the LE to E conversion of PNMA that the 1358 cm−1 bandsplits into two bands at 0.2–0.4 V. At this potential, the PNMAbackbone consists probably of two different types of CN bonds,which appear at different wavenumbers in the Raman spectra.One possible reason for the vibrational band at ∼1335 cm−1
could be dealkylation of the PNMA backbone resulting in theformation of semiquinone type radical structures (CN•+), whichare usually observed in PANI at 1330–1335 cm−1. The Ramanbands of PNMA in the wavenumber region of 1300–1400 cm−1
are assigned to the conducting E form, but it should be stressedthat the exact interpretation of these bands is still unclear. Thebands in the fingerprint region (not shown in Fig. 3) keep theirintensity constant in the whole potential range of −0.2 to 0.8 V.

M. Blomquist et al. / Synthetic Metals 157 (2007) 974–983 981
3.2.1.2. Poly(N-butylaniline). The Raman spectra of thereduced LE form of the PNBA film show principally the samevibrational features as the PNMA film (Fig. 3B, spectra a). How-ever, CH CH and C N stretching vibrational bands at 1415and 1440 cm−1, respectively, indicate that quinoid structures arepresent in the polymer structure at −0.2 V. The CN vibrationalbands at ∼1335 and 1362 cm−1, which are assigned to the con-ducting E form, also confirm the presence of small fractions ofquinoid structures in the PNBA film at −0.2 V.
Two new quinoid bands at ∼1184 and 1589 cm−1 appear inthe Raman spectra as the PNBA film is transformed from theLE to E form at approximately 0.4–0.5 V. The potential inter-val of the LE to E transition is in good accordance with theCV (Fig. 2a, curve 4) and UV–vis spectra [25] of PNBA. ForPANI, the Raman band at ∼1250 cm−1 is usually assigned tosemiquinone radical cations. The presence of this band togetherwith the band at ∼1290 cm−1 may possibly indicate a partialdealkylation of the butyl groups from the polymer backbone.This results in PANI type segments included in the PNBA film.
The N-substituted alkyl groups (aliphatic primary amines)should give rise to vibrational bands at 760–795 and810–850 cm−1 [43]. The intensities of all vibrational bands inthese wavenumber regions are, however, very weak. No specificvibrational bands can therefore be assigned to primary aliphaticamines. It should be noted, that the Raman bands of the N-substituted alkyl groups should not be influenced to any greaterextent by the oxidation state of the polymer films (Scheme 1).
For both PNMA and PNBA, the transition from the LE toE form is accompanied by the formation of quinoid structures,which supports the validity of the commonly accepted oxidationand reduction mechanism of poly(N-alkylanilines) (Scheme 1).
3.2.2. Excitation wavelength of 632.8 and 780 nm3.2.2.1. Poly(N-methylaniline). The Raman spectra of PNMAmeasured with the 632.8 and 780 nm laser excitation wave-length are shown in Figs. 4A and 5A. The vibrational bandsof the Raman spectra are listed in Table 1. Previously reportedUV–vis spectra of PNMA show, that both laser excitation wave-lengths enhance vibrations originating from quinoid units [25].The PNMA spectrum at −0.2 V has a broad band at 1572 cm−1
(632.8 nm) and 1570 cm−1 (780 nm), which is mainly due toC C ring stretching of quinoid units. The intensity of thisband increases significantly at higher potentials and shifts to1579 cm−1 (632.8 nm) and 1581 cm−1 (780 nm) at 0.8 V. Atlower potentials, the C C stretching band is probably overlap-ping with the C C ring stretching band of the benzenoid units.A clear shoulder at ∼1606 cm−1 (632.8 nm) and ∼1600 cm−1
(780 nm), which belongs to the C C stretching band, becomesvisible in the Raman spectra at ∼0.3 V.
At low potentials (<0.2 V), only a very weak band dueto the C H in-plane bending of quinoid units is observed at∼1170 cm−1 (−0.2 V) for the 780 nm laser. On the other hand,for the 632.8 nm laser, this band becomes visible in the Ramanspectra and starts to grow in intensity in the potential inter-val of 0.1–0.4 V, where the LE to E transition takes place. Abroad band is observed at 0.8 V, consisting of both C H in-planebending vibrations of both quinoid (1155 cm−1) and benzenoid
units (1190 cm−1). The 780 nm laser shows only one rather nar-row band at ∼1169 cm−1, which shows that the vibrations ofthe quinoid units are mostly enhanced with this laser excita-tion wavelength. Simultaneously with the growth of the C Hin-plane bending vibrations, a vibrational band of the C Nstretching at ∼1470 cm−1 (632.8 nm) appears in the Ramanspectra in the potential interval of the LE to E transition. Thisband is already present at −0.2 V (∼1480 cm−1) in the Ramanspectra measured with the 780 nm laser excitation wavelength(Fig. 5A, spectrum a).
In the potential interval of 0.1–0.4 V, the Raman bands at1310 cm−1 (632.8 nm) and 1298 cm−1 (780 nm) are shifted to1345 cm−1. This shift is associated with the LE to E transition.At higher potentials this band is shifted further to 1355 cm−1.A very weak Raman band at 1250 cm−1 is also observed atE ≥ 0.4 V (Fig. 5A). In PANI, this band is associated with theconducting semiquinone radical cation structure. A Raman bandat ∼780 cm−1, which is assigned to the ring in-plane deforma-tion of quinoid units, grows also in intensity at E ≥ 0.3 V.
3.2.2.2. Poly(N-butylaniline). The Raman spectra of PNBAmeasured with the 632.8 and 780 nm laser show basicallythe same features as the PNMA spectra (Figs. 4B and 5B).The LE to E transition takes place approximately between0.3 and 0.5 V. In this potential interval, the Raman bands at∼1325 cm−1 (632.8 nm) and ∼1380 cm−1 (780 nm) are shiftedto ∼1385 cm−1 (632.8 nm) and ∼1373 cm−1 (780 nm), respec-tively. Simultaneously, a weak shoulder to these bands appearsin the spectra at ∼1335 cm−1 and becomes more pronounced athigher potentials. As with the 514.5 nm laser excitation wave-length, the vibrational band at ∼1335 cm−1 may possibly beassigned to CN vibrations of dealkylated polyaniline type seg-ments in the PNBA backbone. The C N stretching vibrationat ∼1480 cm−1 (Fig. 5B) indicate that quinoid structures arepresent in the PNBA film at −0.2 V.
3.2.2.3. Poly(N-ethylaniline) and poly(N-propylaniline). TheRaman spectra of PNEA and PNPA were studied only with the780 nm laser excitation wavelength (Fig. 6 and Table 3). Thespectra of PNEA and PNPA are very similar to the Raman spectraof PNBA (Fig. 5B). It seems that an alkyl group longer than ethylhas no bigger influence on the Raman spectra. All substitutedpoly(N-alkylanilines) with ethyl, propyl and butyl substituentsare expected to be more easily dealkylated than PNMA. This isreflected in the CN vibrational band at ∼1335 cm−1. Accordingto the Raman spectra of PNEA and PNPA, the LE to E transi-tion takes place approximately between 0.1 and 0.4 V, which isin a quite good accordance with the CVs of PNEA and PNPA(Fig. 2a). At 0.7 V (PNEA) and 0.8 V (PNPA), the PN formshould be the dominant oxidation state within the PNEA andPNPA films.
3.2.2.4. PNMA and PNBA polymerized in mixed solvents. TheRaman bands of PNMA and PNBA films, which were poly-merized in mixed aqueous solvents containing 10% ACN or10% DMSO, were studied with the 780 nm laser excitation

982 M. Blomquist et al. / Synthetic Metals 157 (2007) 974–983
Table 3Assignments of the Raman bands of PNEA and PNPA
Wavenumber (cm−1) Assignments
PNEA PNPA
−0.2 V 0.4 V 0.8 V −0.2 V 0.4 V 0.8 V
∼1605 ∼1605 ∼1605 – – ∼1605 C C ring stretching (B)1570 1570 1577 1572 1570 1576 C C ring stretching (Q)∼1485 ∼1475 1488 ∼1478 ∼1480 1489 C N stretching (Q)∼1373 1377 1379 ∼1375 ∼1374 ∼1380 C N stretching of the E form∼1293 ∼1325 ∼1331 ∼1310 – ∼1330– ∼1229 ∼1247 – ∼1250 1258 C N stretching of the E form∼1160 ∼1170 1179 ∼1175 1170 1180 C H in-plane bending (Q)∼775 ∼780 ∼782 ∼785 ∼780 780 Ring in-plane deformation (Q)
The Raman measurements were conducted with the 780 nm laser excitation wavelength. The references for the bands are listed in Table 1. The benzenoid and quinoidunits are denoted by B and Q, respectively. The electrically conducting emeraldine form is abbreviated as E.
wavelength. The Raman spectra of the PNMA (10% ACN) andPNMA (10% DMSO) films show the same characteristic fea-tures as the PNMA film (Fig. 5A) and are therefore not shownhere. Compared to the PNMA spectrum, an additional CN vibra-tional band was observed at ∼1252 cm−1 for both PNMA (10%ACN) and PNMA (10% DMSO) films. The Raman spectra ofPNMA (10% DMSO) show a broad band at ∼1284 cm−1 in thepotential interval of −0.2 to 0.1 V. As for PNMA, this band shiftsto ∼1355 cm−1 in the potential interval of the LE to E transition.A similar behavior was observed for PMNA (10% ACN). Theclose similarity of the Raman spectra of PNMA, PNMA (10%ACN) and PNMA (10% DMSO) indicate only small differencesin the chemical structure of the polymer backbone of these mate-rials. The same conclusion was made for the PNBA films in thisstudy due to the great similarity of the Raman spectra of PNBA,PNBA (10% ACN) and PNBA (10% DMSO).
4. Conclusions
A fundamental Raman characterization of four differentpoly(N-alkylanilines) was conducted with the laser excitationwavelengths of 514.5, 632.8 and 780 nm.
In contrast to the conducting emeraldine salt form of PANI,the results obtained in this study show that the half-oxidized con-ducting emeraldine form of PNMA, PNEA, PNPA and PNBAconsists of both benzenoid and quinoid structures. This sup-ports the validity of the commonly used oxidation and reductionscheme of PNANIs (Scheme 1).
In their reduced state at −0.2 V, all PNANIs studied showedusually one CN vibrational band in the Raman spectra in thewavenumber region of 1300–1400 cm−1. A shift of this Ramanband was observed in the potential interval of the transitionfrom the fully reduced non-conducting leucoemeraldine formto the electrically conducting emeraldine form. This transitionis often, especially in PNBA, accompanied with the appearanceof a CN vibrational band at ∼1335 cm−1, which may indicatethe presence of polyaniline type segments in the polymer struc-ture. The formation of these segments may possibly be due topartial dealkylation of the N-substituted alkyl groups.
The Raman spectra of PNEA and PNPA films are very sim-ilar to PNBA indicating that the alkyl substituents longer thanethyl have only a minor influence on the Raman spectra of thesematerials. The spectra of PNMA films polymerized in a mixtureof aqueous and organic solvent indicate also that the chemicalstructure of these films are quite similar in comparison to thePNMA film, which was polymerized in pure aqueous solutionof HClO4.
Acknowledgements
This work is part of the activities of the Abo Akademi Pro-cess Chemistry Centre within the Finnish centre of ExcellenceProgram (2000–2011) sponsored by the Academy of Finland.Maija Blomquist gratefully acknowledges the financial sup-port of Svenska Tekniska Vetenskapsakademien and the FinnishNational Graduate School of Nanoscience.
References
[1] J.W. Chevalier, J.Y. Bergeron, L.H. Dao, Macromolecules 25 (1992) 3325.[2] R. Holze, in: H.S. Nalwa (Ed.), Advanced Functional Molecules and Poly-
mers, vol. 2, Gordon and Breach Science Publishers, 2001, pp. 171–221(Chapter 7).
[3] N. Comisso, S. Dahlio, G. Mengoli, R. Salmaso, S. Zecchin, G. Zotti, J.Electroanal. Chem. 255 (1988) 97.
[4] T. Lindfors, A. Ivaska, J. Electroanal. Chem. 535 (2002) 65.[5] A. Malinauskas, R. Holze, Ber. Bunsenges. Phys. Chem. 101 (1997) 1859.[6] A. Malinauskas, R. Holze, Electrochim. Acta 44 (1999) 2613.[7] C. Sivakumar, A. Gopalan, T. Vasuvedan, T.-C. Wen, Synth. Met. 126
(2002) 123.[8] D. Wei, T. Lindfors, C. Kvarnstrom, L. Kronberg, R. Sjoholm, A. Ivaska,
J. Electroanal. Chem. 575 (2005) 19.[9] A. Watanabe, K. Mori, A. Iwabuchi, Y. Iwasaki, Y. Nakamura, Macro-
molecules 22 (1989) 3521.[10] J. Langer, Synth. Met. 35 (1990) 295.[11] L.H. Dao, J.Y. Bergeron, J.W. Chevalier, M.T. Nguyen, R. Paynter, Synth.
Met. 41–43 (1991) 655.[12] C. Barbero, M.C. Miras, O. Haas, R. Kotz, J. Electroanal. Chem. 310 (1991)
437.[13] J. Yano, M. Kokura, K. Ogura, J. Appl. Electrochem. 24 (1994) 1164.[14] A. Lian, S. Besner, L.H. Dao, Synth. Met. 74 (1995) 21.[15] P.A. Kilmartin, G.A. Wright, Synth. Met. 104 (1999) 145.

M. Blomquist et al. / Synthetic Metals 157 (2007) 974–983 983
[16] A.A. Athawale, B. Deore, M. Vedpathak, S.K. Kulkarni, J. Appl. Polym.Sci. 74 (1999) 1286.
[17] G.A. Planes, M.C. Miras, C. Barbero, Polym. Int. 51 (2002) 429.[18] R. Siwakumar, R. Saraswathi, J. Power Sources 104 (2002) 226.[19] R. Siwakumar, R. Saraswathi, Synth. Met. 138 (2003) 381.[20] J. Yano, Y. Ota, A. Kitani, Mater. Lett. 58 (2004) 1934.[21] A. Falcou, A. Duchene, P. Hourquebie, D. Marsacq, A. Balland-Longeau,
Synth. Met. 149 (2005) 115.[22] A. Lian, S. Besner, N.E. Cherid, J.Y. Bergeron, L.H. Dao, Proc. Polym.
Mater.: Sci. Eng. 70 (1994) 445.[23] G.-E. Hwang, K.-Y. Wu, M.-Y. Hua, H.-T. Lee, S.-A. Chen, Synth. Met.
92 (1998) 39.[24] P. Syed Abthagir, R. Saraswathi, S. Sivakolunthu, Thermochim. Acta 411
(2004) 109.[25] M. Blomquist, T. Lindfors, L. Vahasalo, A. Pivrikas, A. Ivaska, Synth. Met.
156 (2006) 549.[26] K. Chiba, T. Ohsaka, N. Oyama, J. Electroan. Chem. Int. Electrochem. 217
(1987) 239.[27] K. Singh, U. Mishra, Ind. J. Chem. 37A (1998) 613.[28] A.D. Borkar, M.C. Gupta, S.S. Umare, Polym. Plast. Technol. Eng. 40
(2001) 225.[29] G.-L. Yuan, N. Kuramoto, Macromolecules 36 (2003) 7939.[30] X.-G. Li, H.-J. Zhou, M.-R. Huang, J. Pol. Sci. 42 (2004) 6109.[31] M.R. Nabid, A.A. Entezami, Polym. Adv. Technol. 16 (2005) 305.[32] X.-G. Li, H.-J. Zhou, M.-R. Huang, Polymer 46 (2005) 1523.[33] S. Quillard, G. Louarn, K. Berrada, S. Lefrant, K.A. Coplin, S.W. Jessen,
A.J. Epstein, Nonlinear Opt. 10 (1995) 253.
[34] A. Malinauskas, R. Holze, Electrochim. Acta 43 (1998) 521.[35] G. Niaura, R. Mazeikiene, A. Malinauskas, Synth. Met. 145 (2004) 105.[36] M.C. Bernard, A. Hugot-Le Goff, S. Joiret, H. Arkoub, B. Saıdani, Elec-
trochim. Acta 50 (2005) 1615.[37] T. Lindfors, A. Ivaska, J. Electroanal. Chem. 580 (2005) 320.[38] T. Lindfors, C. Kvarnstrom, A. Ivaska, J. Eletroanal. Chem. 518 (2002)
131.[39] Y. Wei, W.W. Focke, G.E. Wneck, A. Ray, A.G. MacDiarmid, J. Phys.
Chem. 93 (1989) 495.[40] J.E. Pereira da Silva, D.L.A. de Faria, S.I. Corboda de Torresi, M.L.A.
Temperini, Macromolecules 33 (2000) 3077–3083.[41] Lj.D. Arsov, W. Plieth, G. Koßmehl, J. Solid State Electrochem. 2 (1998)
355.[42] C. Liu, J. Zhang, G. Shi, F. Chen, J. Appl. Polym. Sci. 92 (2004) 171.[43] G. Socrates, Infrared and Raman characteristic group frequencies, in:
Tables and Charts, third ed., John Wiley & Sons, 2001, p. 109.[44] K. Berrada, S. Quillard, G. Louarn, S. Lefrant, Synth. Met. 69 (1995)
201.[45] M. Bartonek, N.S. Sariciftci, H. Kuzmany, Synth. Met. 36 (1990) 83.[46] Y. Furukawa, F. Ueda, Y. Hyodo, I. Harada, T. Nakajima, T. Kawagoe,
Macromolecules 21 (1988) 1297.[47] A. Hugot-Le Goff, M.C. Bernard, Synth. Met. 60 (1993) 115.[48] S. Quillard, G. Louarn, J.P. Buisson, S. Lefrant, J. Masters, A.G. MacDi-
armid, Synth. Met. 49–50 (1992) 525.[49] J. Laska, Synth. Met. 129 (2002) 229.[50] S. Quillard, K. Berrada, G. Louarn, S. Lefrant, M. Lapkowski, A. Pron,
New J. Chem. 19 (1995) 365.
Related Documents