Characterization of Particle Properties David Julian McClements Biopolymers and Colloids Laboratory Department of Food Science University of Massachusetts

Welcome message from author
This document is posted to help you gain knowledge. Please leave a comment to let me know what you think about it! Share it to your friends and learn new things together.
Transcript

Characterization of Particle
Properties
David Julian McClements
Biopolymers and Colloids Laboratory
Department of Food Science
University of Massachusetts

Particle Characteristics: Effect on Food Emulsion Properties
Particle
Properties• Particle concentration
• Particle size distribution
• Particle charge
• Interfacial properties
• Physical state
Product
Properties• Optical properties
• Rheology
• Stability
• Molecular distribution
Product
Performance• Appearance
• Texture
• Shelf Life
• Flavor
• Nutrition

Quality Assurance
• To assure product meets specifications– Predict shelf life stability
Research and Development
• To understand relationship between product composition, processing conditions and quality
Particle Characterization:Importance to Food Scientists
www.emulsifiers.org

Particle Characterization:Techniques & Protocols
Instrumental Techniques – actual instruments used to
carry out measurements
• Microscopy
• Particle Sizing
• Particle Concentration Profiles
Experimental Protocols – methodologies used in
laboratory to assess emulsion properties
• Storage Tests
• Accelerated Storage Tests
• Environmental Stress Tests

Microstructure & Particle Size
Microscopy Methods
• Optical
• Electron
• Atomic Force
• Particle Sizing Methods
• Light Scattering
• Electrical Pulse Counting
• Sedimentation
• Ultrasound, NMR0
2
4
6
8
10
12
0.01 0.1 1 10
Particle Diameter (µµµµm)
Vo
lum
e%
PSD

Optical Microscopy
• Conventional Techniques
– General Microstructure
– Particle size
• Specialized Techniques (Dyes,
Fluorescence, Polarization)
– Ingredient location
– Crystallization
– Chemical reactions
Coarse Emulsion
Fine Emulsion
Lower Size Limit: d > 0.5 µµµµm

Optical Microscopy:Establishing Aggregation Mechanism
Flocculated Coalesced
pH 7 pH 6
+ Pectin
Casein Stabilized
Emulsion

Optical Microscopy:Localization of Ingredients
Salad dressing: ANS-
fluorescent stain for protein
Courtesy of Kraft Foods
Salad dressing: Nile Red-
fluorescent stain for fat
Salad dressing: DIC Phase
Contrast

11Camera scanning 2 Image extraction
3 Segmentation4 Result generationLogarithmic
graticule
Linear
graticule
Optical Microscopy:
Automated Image Analysis
PSDNeed large number of
particles

Optical Microscopy:
Automated Image Analysis
• Particle Size, Shape & Aggrn
• 0.5 to 1000 µm
• Automated, Rapid
• Emulsions, Powders
Takes multiple images and provides rapid analysis of
particle characteristics
02468
1012
0.01 0.1 1 10Particle Diameter (µµµµm)
Vo
lum
e%
Malvern Instruments

Electron Microscopy
• Obtain structural details on a very small scale (< 5 nm)
• Better for observing general structural features than for particle sizing
• Sample preparation is time-consuming & may alter structure
• Mainly used for research, rather than quality control
SEM of Microencapsulated fat(CSIRO, Australia)
SEMTEM
TEM of Vesicles(www.steve.gb.com )

Electron Microscopy
SEM of Ice Cream(Doug Goff, University of Guelph)
Air bubble
Partially coalesced
Fat droplets around
air bubble
Partially coalesced fat
droplets in continuous
phase
SEM of Spray dried
fat (CSIRO, Australia)
SEM of Emulsion
Royal Micro Soc.TEM of Vesicles(www.steve.gb.com )

Atomic Force Microscopy
• Obtain structural details on
a very small scale (< 1 nm)
• Difficult to use for routine
analysis
Protein
Surfactant
Nanoemulsion

Particle Sizing Instruments
Advantages
• Automatic instrumental methods that can rapidly and precisely
determine the full PSD of an
emulsion
Disadvantages
• Do not directly observe emulsion
microstructure
• Relatively expensive
• Sample preparation can be problematic
0
5
10
15
20
25
30
35
0.1 1 10 100
Diameter (µµµµm)
φφ φφ (%
) 0 hours
24 hours

Static Light Scattering
• Principle: Measure angular dependence of scattered light
• Particle Size Range: 50 nm – 1000 µm
• Concentration Range: < 0.1%
Light
Detectorsϕ
I
ϕϕϕϕ
L
S
0
2
4
6
8
10
12
0.01 0.1 1 10
Particle Diameter (µµµµm)
Vo
lum
e%
Laser
Theory
Scattering PatternPSD
Particle Size Distribution
0.01 0.1 1 10 100
Particle Size (µm)
0
2
4
6
8
Volu
me (
%)
GWCL 2689-25-1, Monday, November 11, 2002 10:31:00 AM
Data for Food EmulsionsPSD of Different Products
Particle Size Distribution
0.01 0.1 1 10 100
Particle Size (µm)
0
2
4
6
8
Volu
me (
%)
3. Mayo in Isoton + Triton X, Tuesday, November 16, 1999 3:42:47 PM
Mayonnaisedm= 6 µm
Cream Liqueurdm= 0.120 µm

Static Light ScatteringImportance of Sample Preparation
Factors Influencing Measurement:
• Buffer properties (pH, I, T)
• Dilution
• Stirring
• Time
Dilute, Stir
Ensure Preparation Procedure is Appropriate!
Sample Measurement
Cell

Emulsion Drawn
Through Tube
Light Obscuration SensorOptical Particle Counting
• Principle: Measures light obscuration as single
particles passes through a small tube
• Particle Size Range: 0.5 – 5000 µm
Accusizer: Sci-Tec
Light Obscuration Sensor

Dynamic Light Scattering
• Principle: Measures rate of diffusion of
particles via intensity fluctuations
• Particle Size Range: 1 nm – 6 µm
• Concentration Range: < 0.01 to >10%
Detector/Correlator
Laser
Malvern
Brownian
Motion

Dynamic Light Scattering:Principles
Laser
Constructive Interference:
Bright Spot
Interference pattern depends on relative location of droplets
Incident wave
Scattered waves
Detector

Dynamic Light Scattering:Principles
Laser
Intensity vs. TimeDestructive Interference:
Dark Spot
Interference pattern depends on relative location of droplets
Incident wave
Scattered waves
Detector
New Spatial
Arrangement
Later time
Brownian
Motion

Dynamic Light Scattering
0
2
4
6
8
10
12
0 10 20 30
Time
Inte
nsi
ty
0
2
4
6
8
10
12
0 10 20 30
Time
Inte
nsi
ty
Small Particles
Large Particles
Analysis
PSD
D ∝ 1/ rη

Dynamic Light Scattering
0
2
4
6
8
10
12
0 10 20 30
Time
Inte
nsi
ty
Small Particles
Large Particles
Analysis
PSD
D ∝ 1/ rη
0
2
4
6
8
10
12
0 10 20 30
Time
Inte
nsi
ty

Data for Food EmulsionsEffect of Homogenization on Ice Cream
5 10 50 100 500 1000
Diameter (nm)
5
10
% in
cla
ss
Increasing homogenization pressure

Dynamic Light ScatteringFormation of Nanoemulsions
50
70
90
110
130
150
170
190
0 1 2 3 4 5 6
Surfactant (wt%)
Dia
met
er (
nm
)
Alkane
Low ηηηη
TAG
High ηηηη

Diffusion MicroscopyParticle Movement Tracker
Darkfield microscopy image of
particles: Video tracking of
particles moving through Brownian
motion gives particle size
distribution
D = 10 – 1000 nm

Electrodes
Electrolyte
solution
Emulsion Drawn
Through Hole
Current
Measurement
Electric Pulse Counting(Coulter Counter)
Elzone:
Micromeritics
• Principle: Measure change in electrical
current as droplet passes through a small hole
• Particle Size Range: 0.4 – 100 µm
• Concentration Range: < 0.1% Coulter-Counter: Beckman-Coulter

Droplet position vs.
height & time is detected
Sedimentation/CreamingGravitational or Centrifugation
φ
h
0
2
4
6
8
10
12
0.01 0.1 1 10
Particle Diameter (µµµµm)
Vo
lum
e%
Stokes’Law
• Principle: Measure change in droplet
concentration with sample height and time
Particle Size Range: 40 nm – 1000 µm
• Concentration Range: Depends on method
Lumisizer: LUM
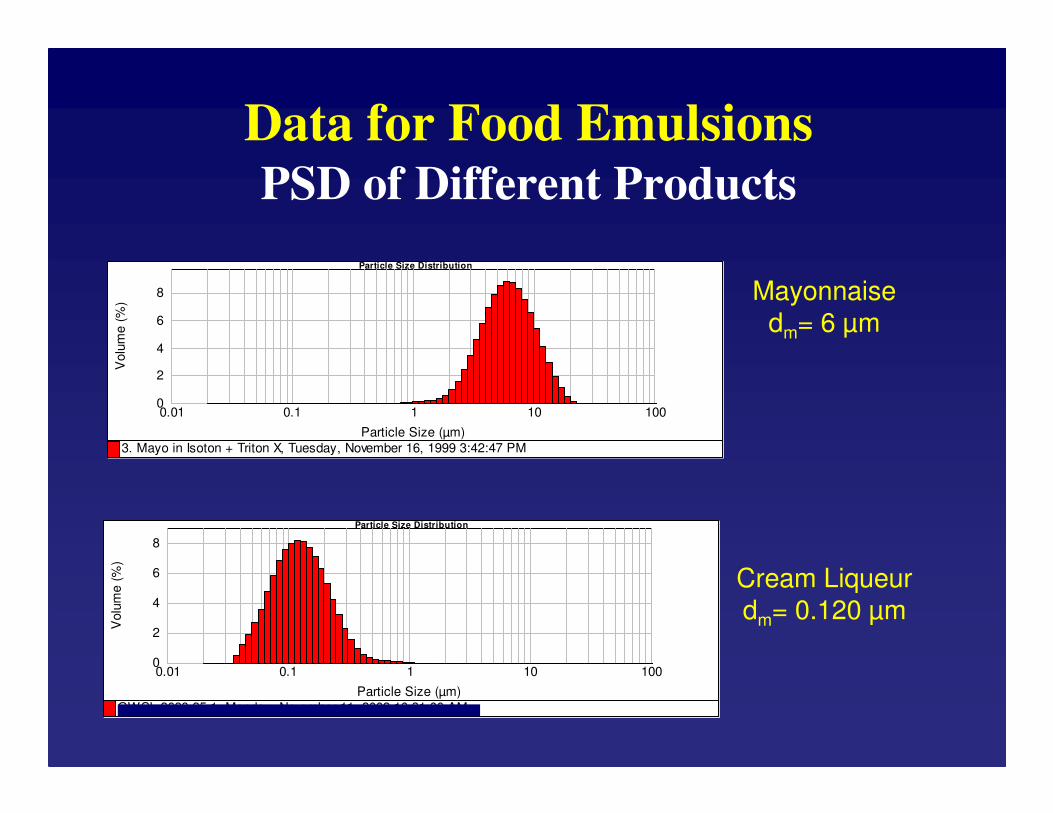
Ultrasonic Spectrometry
Signal Generator
Measurement
Cell
Oscilloscope
1
10
100
1000
10000
0 1 10 100
Frequency (MHz)
(N
p/m
)
φφφφ%
d (µµµµm)
PSD, φ
Spectrum
• Principle: Measure change in ultrasonic
attenuation coefficient with frequency
• Particle Size Range: 0.1 – 1000 µm
• Concentration Range: Up to 50%
Theory

NMR - Restricted Diffusion
NMR
Restricted
Diffusion
Non-Restricted
Diffusion
Magnetic
Field Gradient
• Principle: Measure distance moved by dispersed
phase molecules in specified time
• Particle Size Range: 0.5 – 1000 µm
• Concentration Range: Up to 80%
Trapped
Movement
Bruker

Factors to Consider when
Purchasing PSD EquipmentParticle Characteristics• Size Range: nm to µm• Concentration Range: Dilute – Concentrated
• Organization: Droplets or Flocs
Sample Characteristics• Physical State: Solid, Liquid, Powder
• Optical: Transparent or Opaque
Destructive/Non-destructive• In-Line or Bench-Top
Cost• $5K to $150K
Ease of Use• Manual or Automatic
• Measurement Speed

Selecting a Particle Size Analzyer
Is the sample
solid or liquid?
Is the sample
opaque or
transparent?
Are the particles
small (< 0.4 µm) or
large (> 0.4 µm)?
Microscopy
Optical (OM)
Electron (EM)
Particle Analyzers
SLS
DLS
Pulse Counting (EPC)
Sedimentation (S)
NMR
Ultrasound (US)
Liquid
Optically
Transparent-Dilute/Dilutable
Optically
Opaque- Concentrated
Small
Large
DLS, EM
SLS, EPC, S, OM
Small
Large
DLS, US, EM
US, NMR, OM
Solid
Optically
Transparent-Dilute
Optically
Opaque- Concentrated
Small
Large
EM
SLS, OM
Small
Large
US, EM
US, NMR, OM

Comparison of Commercial
Particle Size Analyzers
$50 – 90 kND, NSP, Fast1 – 50%10 nm - 1000 µmUltrasound
$80 – 150 kND, NSP, Fast1 – 60%500 nm - 100 µmNMR
$30 – 50 kD, SP, FastDepends100 nm - 100 µmSedimentation
$30 – 50 kD, SP, Fast< 0.1%400 nm - 100 µmPulse Counting
$30 – 60 kD, SP, Fast0.1 – 30%3 nm - 5 µmDLS
$30 – 60 kD, SP, Fast< 0.1%50 nm – 1000 µmSLS
Particle Analyzers
>$100 kD, SP, Slow 0.1 – 50%> 5 nmElectron
$5 – 25 kND, SP, Slow0.1 – 50%> 0.5 µmOptical
Microscopy
CostCommentsφ Ranger RangeTechnique
ND/D = Non-Destructive/Destructive
NSP/SP = No Sample Preparation/Sample Preparation

Other FactorsReporting Particle Sizes Correctly
0
5
10
15
20
25
30
35
0.1 1 10 100
Diameter (µµµµm)V
olu
me
Fre
qu
ency
(%
)
Mono-Modal
Bi-Modal
Size: Diameter or Radius?
Concentration: Number or Volume?
Representation: Mean Size or Full Distribution?
Type: Droplets or Flocs?
Dmean = 0.94 µm
Dmean = 19.0 µm
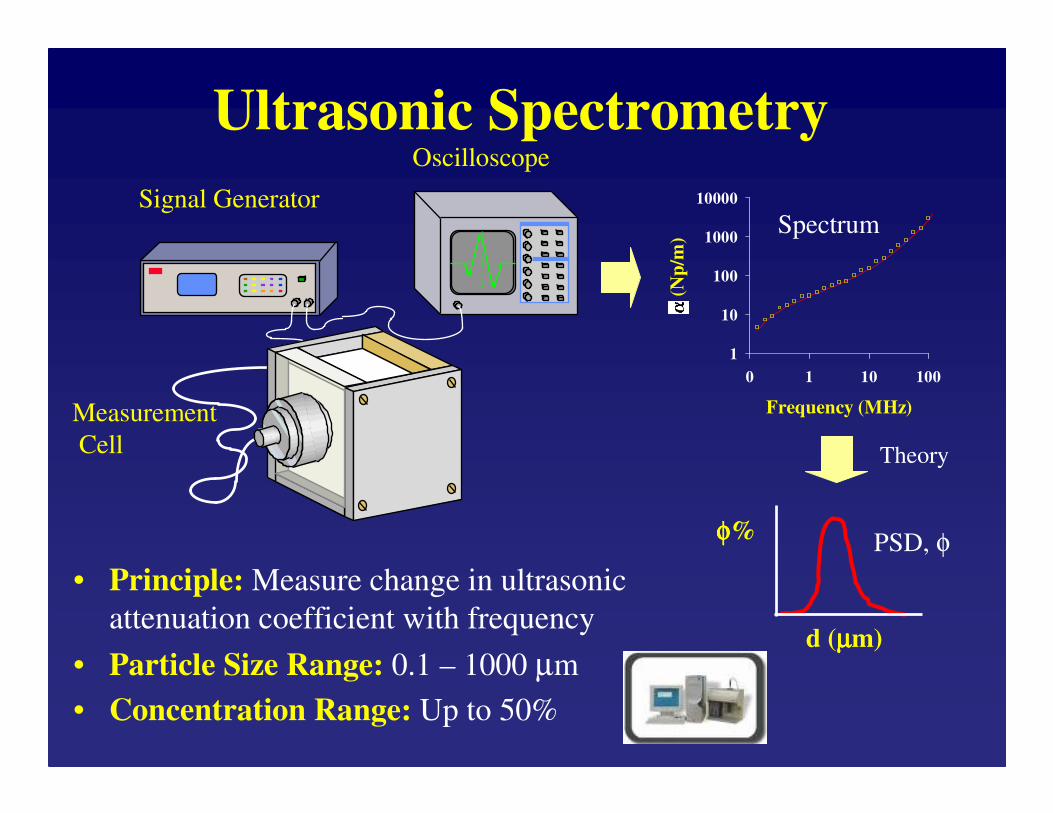
• Storage Tests: Mimic normal product storage
conditions
• Accelerated Storage Tests: Predict long-term
stability by speeding up breakdown (e.g.,
centrifugation, heating, shaking)
• Environmental Stress Tests: Establish ability of
emulsions to resist specific stresses
Experimental Protocols:Testing Emulsion Stability
Does accelerated stress test mimic long-term storage test?

Minerals and pH
• pH 2 to 8
• NaCl 0 – 1 M, CaCl2 0 – 100 mM
Thermal Processing
• 30-90 ºC for 30 minutes
Freeze Thaw Cycling
-20ºC / +20ºC
Dehydration
• Spray drying or Freeze drying
Mechanical Agitation
• Shaking, Stirring
Experimental Protocols:
Stability to Environmental Stress
Stable Unstable
Measure:• Microscopy
• PSD
• Creaming
• Rheology

Experimental ProtocolsTesting Emulsion Stability
Flocculation
Stable
Emulsion
Gravitational
Separation
Phase
Separation
Coalescence
or OROff12 3
4
Identify
Mechanism!

Experimental Protocols:Establishing Aggregation Mechanism
Flocculation
• Direct observation of microstructure by microscopy
• Particle size decreases after adding deflocculant
Coalescence• Direct observation of microstructure by microscopy
• Measure evolution of PSD with time
• Bimodal distribution formed
• Particle size unchanged after adding deflocculant
Ostwald Ripening• Observe microstructure by microscopy
• Measure evolution of PSD with time
• Remains as monomodal distribution
• Droplet growth rate proportional to r3
• Particle size unchanged after adding deflocculant0
2
4
6
8
10
12
0.01 0.1 1 10 100
Particle Diameter (µµµµm)
Vo
lum
e%
0 mM NaCl
150 mM NaCl

Conclusions
• A wide variety of analytical instruments are
now available for emulsion characterization
• The choice of a particular instrument depends
on the food material being tested and the
information required
• A robust testing protocol should be
developed to identify instability mechanisms
and/or to monitor product quality
• Clear product particle size distribution
specifications should be established
Related Documents