Lakehal Abdelhak*, Bouaza Amar, Benrabah Bedhiaf, Dalache Cherifa and Benhebal Hadj Characterization of Mn-Doped Co 3 O 4 Thin Films Prepared by Sol Gel-Based Dip-Coating Process https://doi.org/10.1515/htmp-2017-0185 Received December 15, 2017; accepted June 18, 2018 Abstract: In this article, manganese-doped cobalt oxide (Mn-doped Co 3 O 4 ) thin films have been prepared on glass substrates using sol gel-based dip-coating technique in order to investigate their optical, structural and electrical properties. The Mn concentration was changed from 0 % to 9 %. The synthesized samples were characterized by ultra- violet-visible spectroscopy (UV-visible), X-ray diffraction (XRD), Fourier transform infrared spectroscopy (FTIR) and complex impedance spectroscopy to elucidate the optical, structural, vibrational and electrical properties. Our optical results show that the transmittance of Mn-doped Co 3 O 4 films decreases with increasing doping levels. The optical band gaps were found to be ðE g1 = 1.51 eV , E g2 = 2.12eVÞ and ðE g1 = 1.23 eV , E g2 = 1.72eVÞ for the case of undoped Co 3 O 4 and 9 % Mn-doped Co 3 O 4 , respectively. This shift means that the impurities would create energy levels. The structural analysis provides evidence that obtained powders were crystallized in cubic spinel structure. The complemen- tary phase information is provided by FTIR spectroscopy. The FTIR study depicted the presence of four distinct bands characterizing Mn-doped Co 3 O 4 cubic spinel-type structure. The Nyquist plots suggest that the equivalent circuit of Mn- doped Co 3 O 4 films is an RpCp parallel circuit. It was found that the effective resistance Rp decreases, whereas the effective capacitance Cp increases with doping. Keywords: Cobalt oxide, Mn doping, sol gel dip-coating, thin films Introduction Transparent conducting oxides (TCOs) are promising materials in various potential applications due to their dual property; they combine electrical conductivity and optical transparency in the visible range. These proper- ties have attracted the attention for using them in optoe- lectronic devices such as photovoltaic solar cells and electrochromic windows [1, 2]. Among the TCOs, cobalt oxide (Co 3 O 4 ) is considered as one of the broadly studied compounds due to its impor- tance in various scientific fields such as solar selective absorber [1], energy storage [2], supercapacitors [3] and electrochromic sensor [4]. Co 3 O 4 exhibits p-type semicon- ducting property and behaves like an antiferromagnet (AF) with the Néel temperature T N 290 K [5], Optical absorp- tion studies have shown that Co 3 O 4 exhibits multiple band gap energies ðE g1 = 1.57eV, E g2 = 2.28eVÞ [6]. Cobalt oxide exists in three different crystalline forms: the cobaltous oxide (CoO), the cobaltic oxide (Co 2 O 3 ) and tricobalt tetra- oxide (Co 3 O 4 ). The most stable phase in the cobalt oxide system is a mixed valence compound [Co 2+ Co 3+ 2 O 4 ] with a normal spinel structure [3]. In recent years, great efforts have been devoted to fabricating nanostructured systems of cobalt oxide with tunable physical–chemical properties for a broad range of applications, among which transition metal doping is a promising and efficient route to improve the optical absorp- tion and the electrical behavior of Co 3 O 4 . In this regard, this study fabricates Mn-doped Co 3 O 4 thin films in an effort to understand their enhanced optical and electrical properties. We will introduce a Mn metal impurity into the Co 3 O 4 matrix by the sol gel technique in order to produce opti- mized semiconductor thin films of Co 3 O 4 with good optical and electrical properties, and we controlled the doping levels so that the Co 3 O 4 phase did not change. We choose doping by manganese Mn 2+ because its atomic radius (0.80 Å) is almost equal to that of cobalt Co 2+ (0.72 Å). It can substitute the Co 2+ ion. A small change in dopant concentration is significant for changing the band gaps, and the energy band gaps are expected to vary in a wide and very attractive energies intervals ranging from ðE g1 = 1.51eV, E g2 = 2.12eVÞ in undoped Co 3 O 4 and down to ðE g1 = 1.23eV, E g2 = 1.72eVÞ in 9 % Mn-doped Co 3 O 4 . *Corresponding author: Lakehal Abdelhak, Département de chimie, Université Ibn-Khaldoun, Zaaroura, Tiaret 14000, Algeria; Laboratoire de Génie Physique, Université Ibn-Khaldoun, Zaaroura, Tiaret 14000, Algeria, E-mail: [email protected] Bouaza Amar, Benrabah Bedhiaf, Laboratoire de Génie Physique, Université Ibn-Khaldoun, Zaaroura, Tiaret 14000, Algeria Dalache Cherifa, Laboratoire de synthèse et catalyse, Université Ibn- Khaldoun, Zaaroura, Tiaret 14000, Algeria Benhebal Hadj High Temp. Mater. Proc. 2019; 38: 237–247 Open Access. © 2019 Walter de Gruyter GmbH, Berlin/Boston. This work is licensed under the Creative Commons Attribution 4.0 Public License.

Welcome message from author
This document is posted to help you gain knowledge. Please leave a comment to let me know what you think about it! Share it to your friends and learn new things together.
Transcript
Lakehal Abdelhak*, Bouaza Amar, Benrabah Bedhiaf, Dalache Cherifa and Benhebal Hadj
Characterization of Mn-Doped Co3O4 Thin FilmsPrepared by Sol Gel-Based Dip-Coating Process
https://doi.org/10.1515/htmp-2017-0185Received December 15, 2017; accepted June 18, 2018
Abstract: In this article, manganese-doped cobalt oxide(Mn-doped Co3O4) thin films have been prepared on glasssubstrates using sol gel-based dip-coating technique inorder to investigate their optical, structural and electricalproperties. The Mn concentration was changed from 0% to9%. The synthesized samples were characterized by ultra-violet-visible spectroscopy (UV-visible), X-ray diffraction(XRD), Fourier transform infrared spectroscopy (FTIR) andcomplex impedance spectroscopy to elucidate the optical,structural, vibrational and electrical properties. Our opticalresults show that the transmittance of Mn-doped Co3O4
films decreases with increasing doping levels. The opticalband gaps were found to be ðEg1 = 1.51 eV, Eg2 = 2.12eVÞand ðEg1 = 1.23 eV,Eg2 = 1.72eVÞ for the case of undopedCo3O4 and 9% Mn-doped Co3O4, respectively. This shiftmeans that the impurities would create energy levels. Thestructural analysis provides evidence that obtained powderswere crystallized in cubic spinel structure. The complemen-tary phase information is provided by FTIR spectroscopy.The FTIR study depicted the presence of four distinct bandscharacterizing Mn-doped Co3O4 cubic spinel-type structure.The Nyquist plots suggest that the equivalent circuit of Mn-doped Co3O4 films is an RpCp parallel circuit. It was foundthat the effective resistance Rp decreases, whereas theeffective capacitance Cp increases with doping.
Keywords: Cobalt oxide, Mn doping, sol gel dip-coating,thin films
Introduction
Transparent conducting oxides (TCOs) are promisingmaterials in various potential applications due to theirdual property; they combine electrical conductivity andoptical transparency in the visible range. These proper-ties have attracted the attention for using them in optoe-lectronic devices such as photovoltaic solar cells andelectrochromic windows [1, 2].
Among the TCOs, cobalt oxide (Co3O4) is considered asone of the broadly studied compounds due to its impor-tance in various scientific fields such as solar selectiveabsorber [1], energy storage [2], supercapacitors [3] andelectrochromic sensor [4]. Co3O4 exhibits p-type semicon-ducting property and behaves like an antiferromagnet (AF)with the Néel temperature TN � 290 K [5], Optical absorp-tion studies have shown that Co3O4 exhibits multiple bandgap energies ðEg1 = 1.57eV, Eg2 = 2.28eVÞ [6]. Cobalt oxideexists in three different crystalline forms: the cobaltousoxide (CoO), the cobaltic oxide (Co2O3) and tricobalt tetra-oxide (Co3O4). The most stable phase in the cobalt oxidesystem is a mixed valence compound [Co2+Co3+ 2O4] with anormal spinel structure [3].
In recent years, great efforts have been devoted tofabricating nanostructured systems of cobalt oxide withtunable physical–chemical properties for a broad range ofapplications, among which transition metal doping is apromising and efficient route to improve the optical absorp-tion and the electrical behavior of Co3O4. In this regard, thisstudy fabricates Mn-doped Co3O4 thin films in an effort tounderstand their enhanced optical and electrical properties.We will introduce a Mn metal impurity into the Co3O4
matrix by the sol gel technique in order to produce opti-mized semiconductor thin films of Co3O4 with good opticaland electrical properties, and we controlled the dopinglevels so that the Co3O4 phase did not change. We choosedoping by manganese Mn2+ because its atomic radius(0.80Å) is almost equal to that of cobalt Co2+ (0.72Å). Itcan substitute the Co2+ ion. A small change in dopantconcentration is significant for changing the band gaps,and the energy band gaps are expected to vary in a wideand very attractive energies intervals ranging fromðEg1 = 1.51eV,Eg2 = 2.12eVÞ in undoped Co3O4 and down toðEg1 = 1.23eV,Eg2 = 1.72eVÞ in 9% Mn-doped Co3O4.
*Corresponding author: Lakehal Abdelhak, Département de chimie,Université Ibn-Khaldoun, Zaaroura, Tiaret 14000, Algeria; Laboratoirede Génie Physique, Université Ibn-Khaldoun, Zaaroura, Tiaret 14000,Algeria, E-mail: [email protected] Amar, Benrabah Bedhiaf, Laboratoire de Génie Physique,Université Ibn-Khaldoun, Zaaroura, Tiaret 14000, AlgeriaDalache Cherifa, Laboratoire de synthèse et catalyse, Université Ibn-Khaldoun, Zaaroura, Tiaret 14000, AlgeriaBenhebal Hadj
High Temp. Mater. Proc. 2019; 38: 237–247
Open Access. © 2019 Walter de Gruyter GmbH, Berlin/Boston.This work is licensed under the Creative Commons Attribution 4.0 Public License.
Various methods have been reported for the synthesis ofCo3O4 thin films such as chemical vapor deposition (CVD) [7],spraypyrolysis [8] andprecipitationmethod [6]. In this paper,we have adopted a simple sol gel dip-coating method toobtain Mn-doped Co3O4 thin films. This method of preparingthin films has several advantages: its low cost, flexibility inthe deposition process and convenience for a large area.It has been used successfully in our laboratory to fab-ricate a variety of porous materials such as SnO2 [9]and TiO2 [10]. The synthesized samples were subjectedto characterizations such as ultraviolet-visible spectro-scopy (UV-visible), X-ray diffraction (XRD), Fourier-transform infrared spectroscopy (FTIR), scanning elec-tron microscopy (SEM) and impedance measurements.
Experimental procedure
Materials and methods
The principle of the dip-coating method is to dip thesubstrate in a viscous solution and to withdraw at con-stant speed under controlled and stable conditions toobtain a homogeneous film of regular thickness. Thedeposition of the thin films by the dip-coating techniqueis carried out in three steps:– preparation of substrates (cleaning).– the deposit of the film by the dip-coating technique– drying and heat treatment
There are several parameters that influence the thick-ness of the thin films such as sol viscosity, pressure,pulling force, gravitational force, surface tension andsurface tension gradient. It is possible, in principle, toadjust some parameters to obtain the desired thickness.
In the present venture, a sol gel dip-coating setup oper-ating at atmospheric pressure was used to deposit cobaltoxide thin films. In a typical experiment, cobalt nitrate hex-ahydrate (Co(NO3)2.6H2O) was dissolved in an aqueous solu-tion (100ml) of sucrose (C12H22O11) and stirred vigorously at100 °C for about 2h to form a burgundy homogeneous solu-
tion. To achieve Mn doping Mn½ �Co½ �
n o, manganese nitrate hexa-
hydrate (Mn(NO3)2.6H2O) was added to the precursorsolution with different concentrations (3wt%, 5wt%, 7wt%and 9wt%) for all doped samples. The final solution(undoped Co3O4 and Mn-doped Co3O4) will be used eitherfor film deposition or to obtain powder after calcination inmuffle furnace at 400 °C for 3h.
The procedure of cleaning glass substrates is veryimportant to get well-adherent, smooth films. The
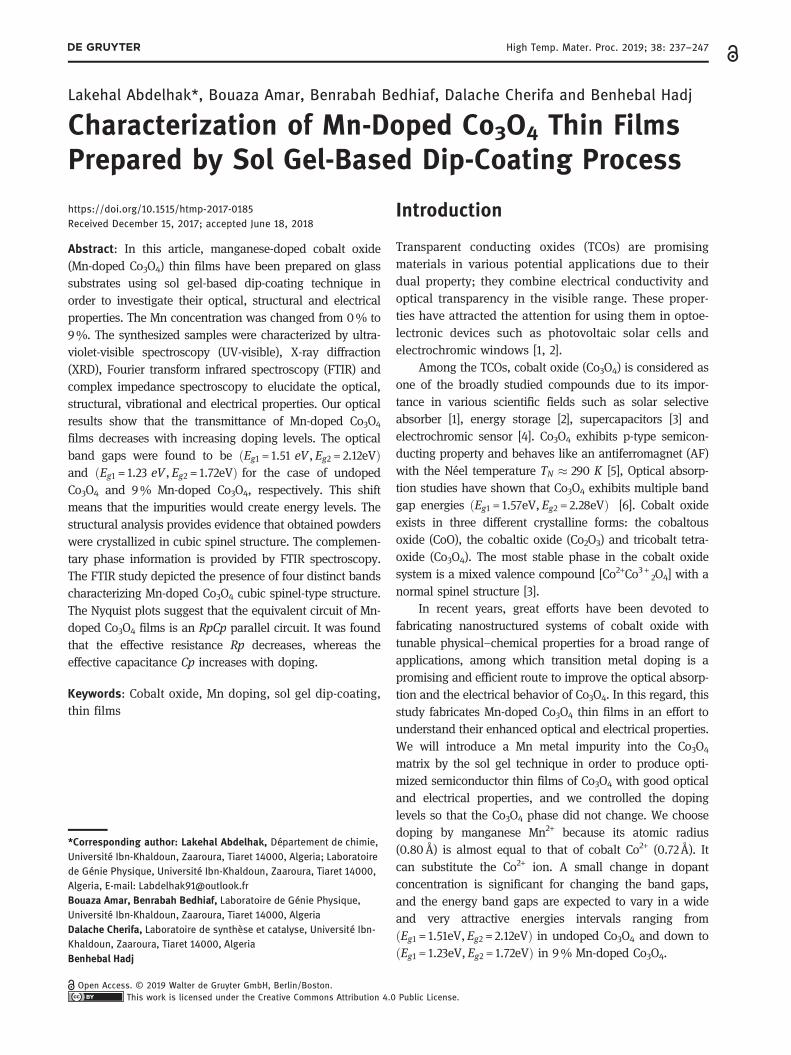
substrates Pyrex pieces (75 × 25 × 1mm3) were cleanedthrough dipping them in ultrasonic bath containing tri-chloroethylene, ethanol and aciton for 5min, respec-tively, and finally rinsed by distilled water. Thewithdrawal speed of the substrates from the solutionwas 50mm/min. The formed films pass through the dry-ing step to evaporate the solvent. After that, the obtainedfilms were calcined in muffle furnace at 400°C for 45min.A schematic representation of the sol gel synthesis isgiven in Figure 1.
Characterizations
The as-prepared samples were characterized by usingdifferent physical techniques. The optical transmittancespectra and band gap energies of Mn-doped Co3O4 thinfilms were measured using Shimadzu-1650 spectrophot-ometer in the wavelength range from 300 to 900 nm. Thephase and crystal structure of all samples were studiedby XRD (Rigaku miniflex 600) with CuKα radiation(λ = 1.5406 Å). The vibrational behavior of the sampleswas investigated by FTIR (Alpha Bruker
Cobalt Nitrate
(Co(NO3)2.6H2O)
Sucrose (C12H22O11)+
Distilled water
Constant Stirring for 10 min
Manganese Nitrate
Mn(NO3)2 · 6H2O
Heat-treatment (T=100 ºC) for 2 h
Co3O4 :Mn Sol
Dip-Coating on glass substrates
Drying (T=100 ºC)for 15 Min
Heat-treatment (T=400 ºC) for 45 min
Co3O4 :Mn Thin films
Figure 1: Schematic diagram of sol gel process of Mn-doped Co3O4
preparation.
238 L. Abdelhak et al.: Characterization of Mn-Doped Co3O4 Thin Films
spectrophotometer) in the wavenumber range from 400to 4,000 cm−1. Impedance measurements were carriedout using Agilent4284A LCR-meter operating in the fre-quency range 75 KHz to 20MHz with an oscillationamplitude of 1 V.
Results and discussion
Optical properties
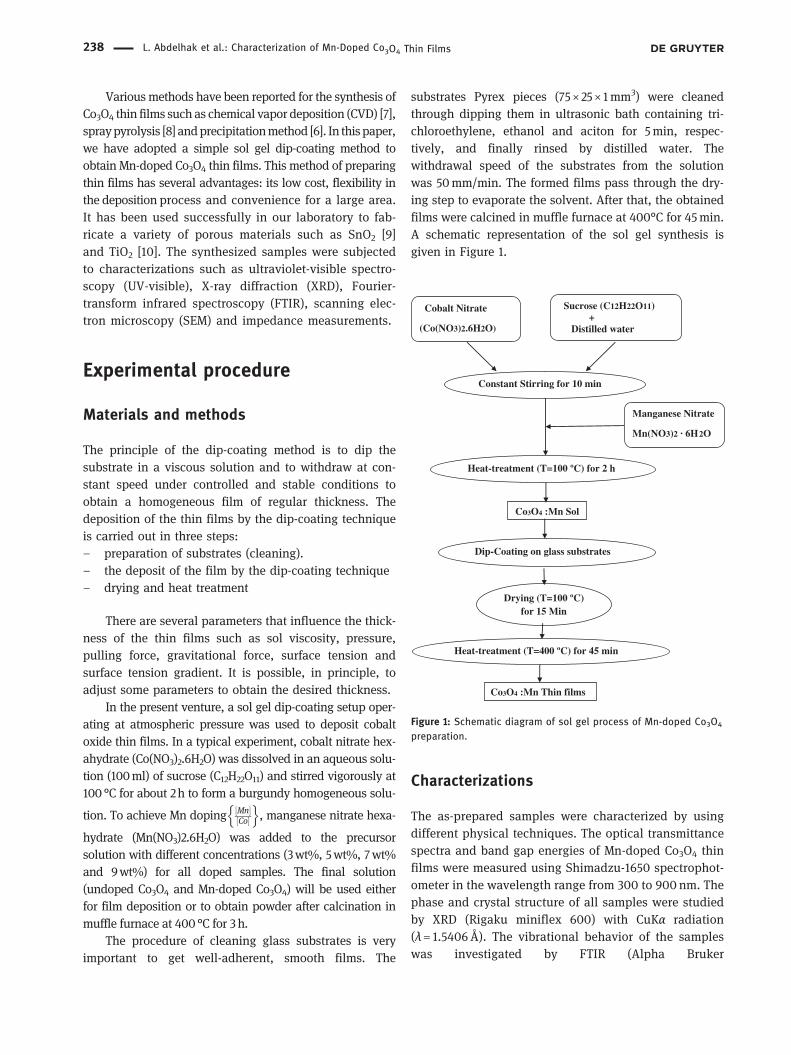
In this part, the UV-Vis spectra of Mn-doped Co3O4 filmswere recorded in the wavelength range from 300 to900 nm. Figure 2 shows the optical transmission spectraof Mn-doped Co3O4 thin films. All the obtained spectramanifest the presence of two sharp absorption edges inthe visible region. The first one as reported in manyresearches is associated to the O2– and Co2+ chargetransfer process, while the other observed at 500–600 nm wavelength range is due to the O2– and Co3+
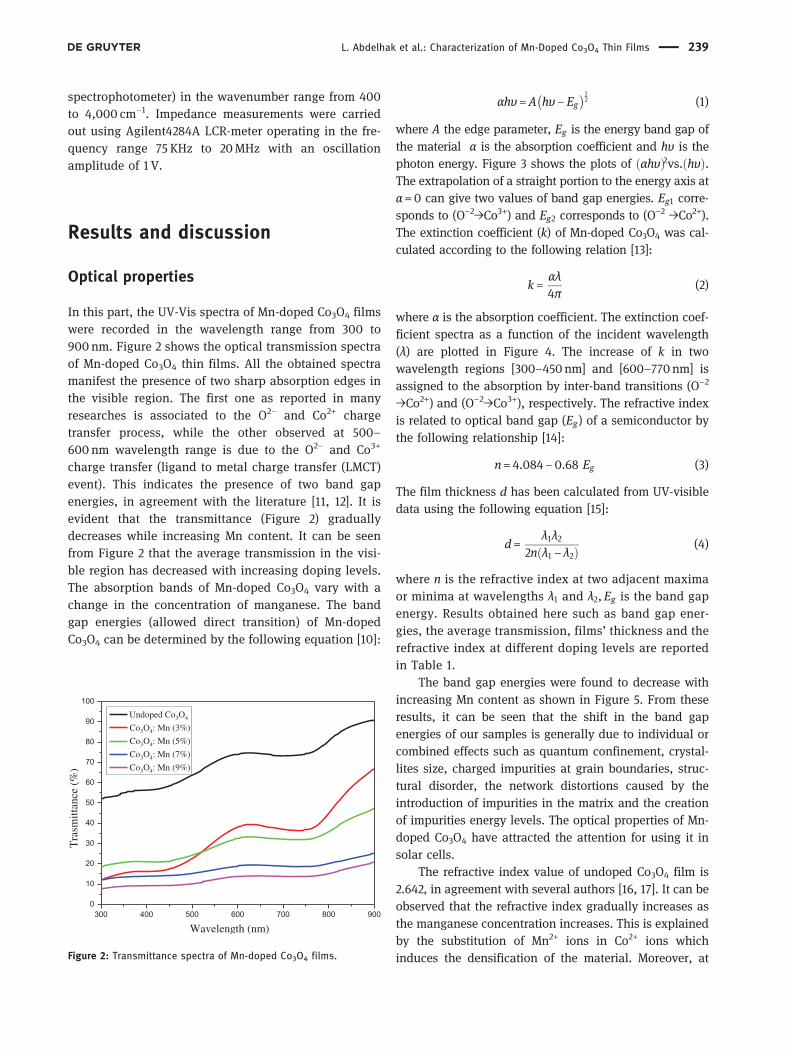
charge transfer (ligand to metal charge transfer (LMCT)event). This indicates the presence of two band gapenergies, in agreement with the literature [11, 12]. It isevident that the transmittance (Figure 2) graduallydecreases while increasing Mn content. It can be seenfrom Figure 2 that the average transmission in the visi-ble region has decreased with increasing doping levels.The absorption bands of Mn-doped Co3O4 vary with achange in the concentration of manganese. The bandgap energies (allowed direct transition) of Mn-dopedCo3O4 can be determined by the following equation [10]:
αhυ=A hυ−Eg� �1
2 (1)
where A the edge parameter, Eg is the energy band gap ofthe material α is the absorption coefficient and hυ is thephoton energy. Figure 3 shows the plots of αhυð Þ2vs. hυð Þ.The extrapolation of a straight portion to the energy axis atα=0 can give two values of band gap energies. Eg1 corre-sponds to (O−2→Co3+) and Eg2 corresponds to (O−2 →Co2+).The extinction coefficient (k) of Mn-doped Co3O4 was cal-culated according to the following relation [13]:
k =αλ4π
(2)
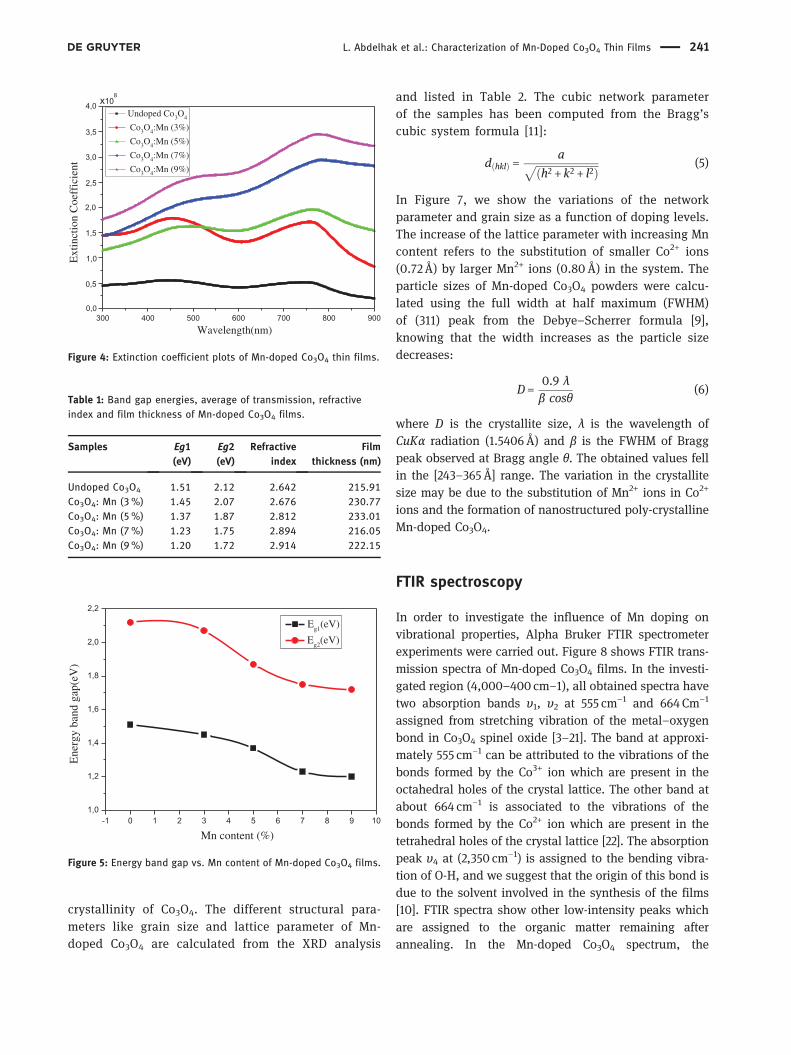
where α is the absorption coefficient. The extinction coef-ficient spectra as a function of the incident wavelength(λ) are plotted in Figure 4. The increase of k in twowavelength regions [300–450nm] and [600–770nm] isassigned to the absorption by inter-band transitions (O−2
→Co2+) and (O−2→Co3+), respectively. The refractive indexis related to optical band gap (Eg) of a semiconductor bythe following relationship [14]:
n= 4.084−0.68 Eg (3)
The film thickness d has been calculated from UV-visibledata using the following equation [15]:
d=λ1λ2
2n λ1 − λ2ð Þ (4)
where n is the refractive index at two adjacent maximaor minima at wavelengths λ1 and λ2,Eg is the band gapenergy. Results obtained here such as band gap ener-gies, the average transmission, films’ thickness and therefractive index at different doping levels are reportedin Table 1.
The band gap energies were found to decrease withincreasing Mn content as shown in Figure 5. From theseresults, it can be seen that the shift in the band gapenergies of our samples is generally due to individual orcombined effects such as quantum confinement, crystal-lites size, charged impurities at grain boundaries, struc-tural disorder, the network distortions caused by theintroduction of impurities in the matrix and the creationof impurities energy levels. The optical properties of Mn-doped Co3O4 have attracted the attention for using it insolar cells.
The refractive index value of undoped Co3O4 film is2.642, in agreement with several authors [16, 17]. It can beobserved that the refractive index gradually increases asthe manganese concentration increases. This is explainedby the substitution of Mn2+ ions in Co2+ ions whichinduces the densification of the material. Moreover, at
300 400 500 600 700 800 9000
10
20
30
40
50
60
70
80
90
100
Tra
smitt
ance
(%
)
Wavelength (nm)
Undoped Co3O4
Co3O4: Mn (3%)
Co3O4: Mn (5%)
Co3O4: Mn (7%)
Co3O4: Mn (9%)
Figure 2: Transmittance spectra of Mn-doped Co3O4 films.
L. Abdelhak et al.: Characterization of Mn-Doped Co3O4 Thin Films 239
the microscopic level, the increase of n refers to themodification of the polarizability of the ions and thelocal field in the material [18].
Structural analysis
Figure 6 shows the XRD pattern of Mn-doped Co3O4
powders at different concentrations of manganese(3%, 5%, 7% and 9%). All obtained powders of Mn-doped Co3O4 show that multiple diffraction peaks
coincided well with the cubic spinel type structure(Fd3m space group), implying the complete solubilityof the Mn ions into the Co3O4 cubic crystal. The mainpeak is h311i and the lattice parameter of undopedCo3O4 is a= 8.069 n. These results have been pre-viously confirmed by several authors [19, 20]. Noother parasitic phase of manganese clusters aredetected in all doped samples, which indicates ahigh purity of the samples. It is clear that the intensityof the diffraction peak decreases with increasing dop-ing levels. Therefore, Mn doping decreases the
Figure 3: Tauc plots of Mn-doped Co3O4 films.
240 L. Abdelhak et al.: Characterization of Mn-Doped Co3O4 Thin Films
crystallinity of Co3O4. The different structural para-meters like grain size and lattice parameter of Mn-doped Co3O4 are calculated from the XRD analysis
and listed in Table 2. The cubic network parameterof the samples has been computed from the Bragg’scubic system formula [11]:
d hklð Þ =affiffiffiffiffiffiffiffiffiffiffiffiffiffiffiffiffiffiffiffiffiffiffiffi
h2 + k2 + l2ð Þp (5)
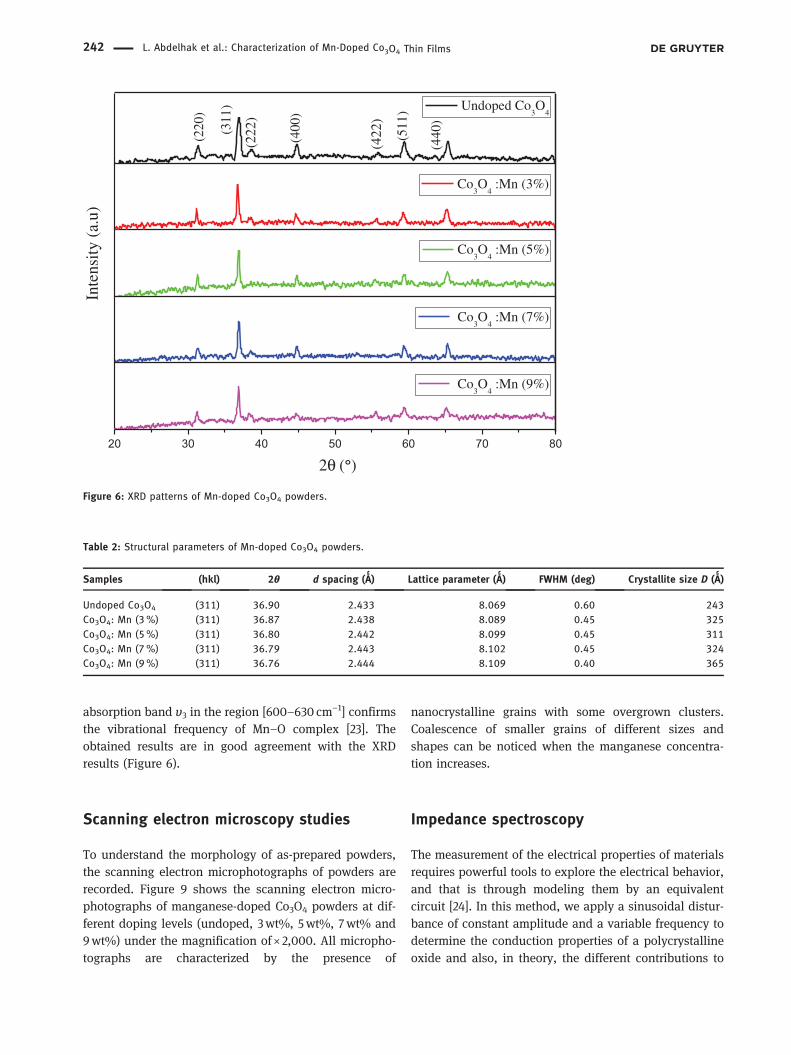
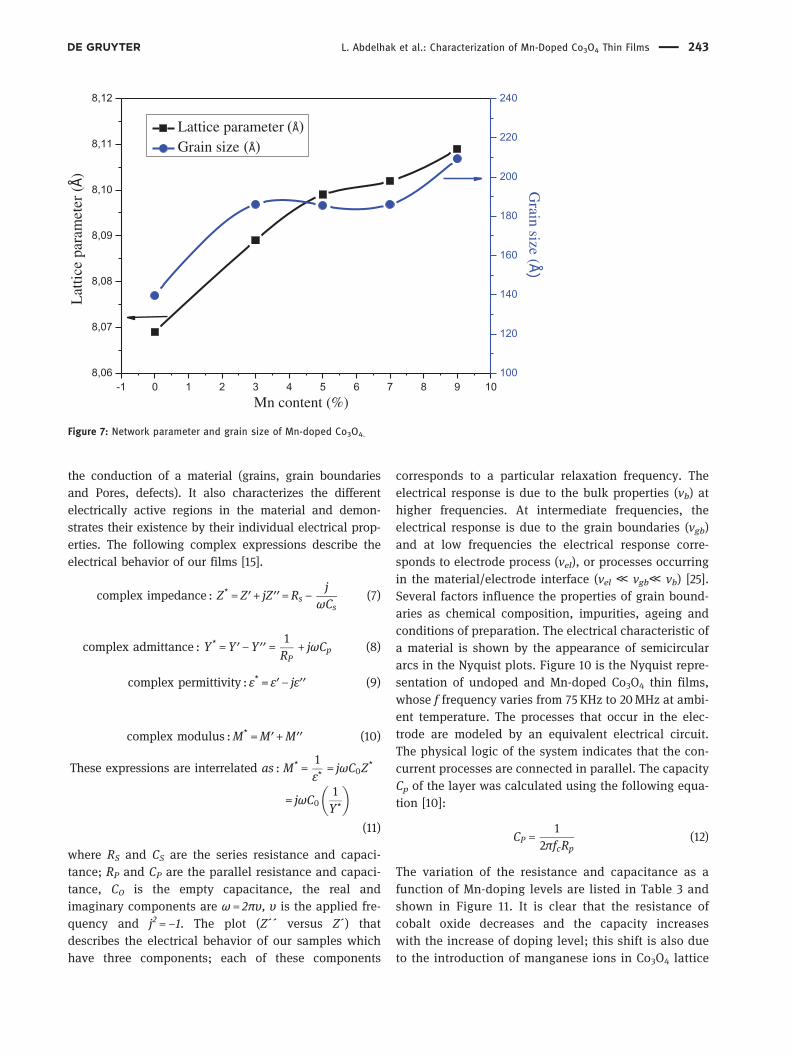
In Figure 7, we show the variations of the networkparameter and grain size as a function of doping levels.The increase of the lattice parameter with increasing Mncontent refers to the substitution of smaller Co2+ ions(0.72 Å) by larger Mn2+ ions (0.80 Å) in the system. Theparticle sizes of Mn-doped Co3O4 powders were calcu-lated using the full width at half maximum (FWHM)of (311) peak from the Debye–Scherrer formula [9],knowing that the width increases as the particle sizedecreases:
D=0.9 λβ cosθ
(6)
where D is the crystallite size, λ is the wavelength ofCuKα radiation (1.5406Å) and β is the FWHM of Braggpeak observed at Bragg angle θ. The obtained values fellin the [243–365Å] range. The variation in the crystallitesize may be due to the substitution of Mn2+ ions in Co2+
ions and the formation of nanostructured poly-crystallineMn-doped Co3O4.
FTIR spectroscopy
In order to investigate the influence of Mn doping onvibrational properties, Alpha Bruker FTIR spectrometerexperiments were carried out. Figure 8 shows FTIR trans-mission spectra of Mn-doped Co3O4 films. In the investi-gated region (4,000–400 cm−1), all obtained spectra havetwo absorption bands ʋ1, ʋ2 at 555 cm−1 and 664 Cm−1
assigned from stretching vibration of the metal–oxygenbond in Co3O4 spinel oxide [3–21]. The band at approxi-mately 555 cm−1 can be attributed to the vibrations of thebonds formed by the Co3+ ion which are present in theoctahedral holes of the crystal lattice. The other band atabout 664 cm−1 is associated to the vibrations of thebonds formed by the Co2+ ion which are present in thetetrahedral holes of the crystal lattice [22]. The absorptionpeak ʋ4 at (2,350 cm−1) is assigned to the bending vibra-tion of O-H, and we suggest that the origin of this bond isdue to the solvent involved in the synthesis of the films[10]. FTIR spectra show other low-intensity peaks whichare assigned to the organic matter remaining afterannealing. In the Mn-doped Co3O4 spectrum, the
Table 1: Band gap energies, average of transmission, refractiveindex and film thickness of Mn-doped Co3O4 films.
Samples Eg(eV)
Eg(eV)
Refractiveindex
Filmthickness (nm)
Undoped CoO . . . .CoO: Mn (%) . . . .CoO: Mn (%) . . . .CoO: Mn (%) . . . .CoO: Mn (%) . . . .
-1 0 1 2 3 4 5 6 7 8 9 101,0
1,2
1,4
1,6
1,8
2,0
2,2
Ene
rgy
band
gap
(eV
)
Mn content (%)
Eg1(eV)
Eg2(eV)
Figure 5: Energy band gap vs. Mn content of Mn-doped Co3O4 films.
300 400 500 600 700 800 900
x108
4,0
3,0
3,5
2,0
2,5
1,0
1,5
0,5
Ext
inct
ion
Coe
ffic
ient
Wavelength(nm)
Undoped Co3O4
Co3O4:Mn (3%)
Co3O4:Mn (5%)
Co3O4:Mn (7%)
Co3O4:Mn (9%)
0,0
Figure 4: Extinction coefficient plots of Mn-doped Co3O4 thin films.
L. Abdelhak et al.: Characterization of Mn-Doped Co3O4 Thin Films 241
absorption band ʋ3 in the region [600–630 cm−1] confirmsthe vibrational frequency of Mn–O complex [23]. Theobtained results are in good agreement with the XRDresults (Figure 6).
Scanning electron microscopy studies
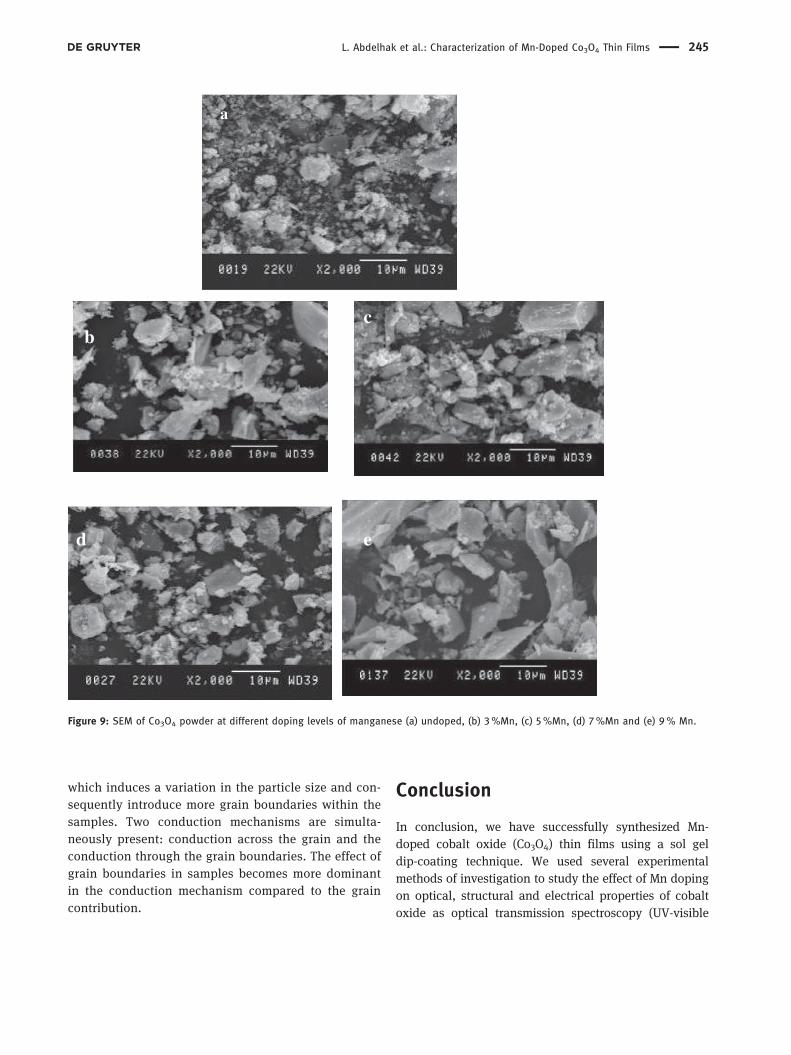
To understand the morphology of as-prepared powders,the scanning electron microphotographs of powders arerecorded. Figure 9 shows the scanning electron micro-photographs of manganese-doped Co3O4 powders at dif-ferent doping levels (undoped, 3wt%, 5wt%, 7wt% and9wt%) under the magnification of × 2,000. All micropho-tographs are characterized by the presence of
nanocrystalline grains with some overgrown clusters.Coalescence of smaller grains of different sizes andshapes can be noticed when the manganese concentra-tion increases.
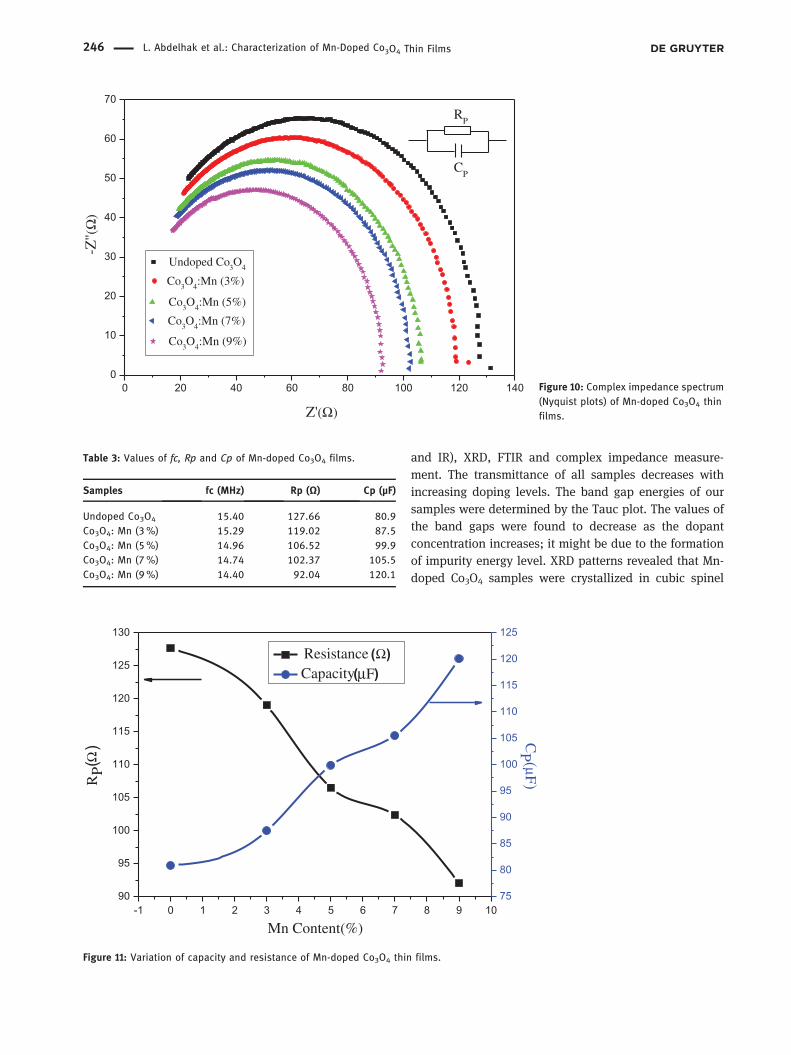
Impedance spectroscopy
The measurement of the electrical properties of materialsrequires powerful tools to explore the electrical behavior,and that is through modeling them by an equivalentcircuit [24]. In this method, we apply a sinusoidal distur-bance of constant amplitude and a variable frequency todetermine the conduction properties of a polycrystallineoxide and also, in theory, the different contributions to
20 30 40 50 60 70 80
Undoped Co3O
4
Co3O
4 :Mn (3%)
Co3O
4 :Mn (5%)ytisnetnI
(a.u
)
2θ (°)
Co3O
4 :Mn (7%)
Co3O
4 :Mn (9%)
(220
)
(311
)
(222
)
(400
)
(422
)
(511
)
(440
)
Figure 6: XRD patterns of Mn-doped Co3O4 powders.
Table 2: Structural parameters of Mn-doped Co3O4 powders.
Samples (hkl) θ d spacing (Ǻ) Lattice parameter (Ǻ) FWHM (deg) Crystallite size D (Ǻ)
Undoped CoO () . . . .
CoO: Mn (%) () . . . .
CoO: Mn (%) () . . . .
CoO: Mn (%) () . . . .
CoO: Mn (%) () . . . .
242 L. Abdelhak et al.: Characterization of Mn-Doped Co3O4 Thin Films
the conduction of a material (grains, grain boundariesand Pores, defects). It also characterizes the differentelectrically active regions in the material and demon-strates their existence by their individual electrical prop-erties. The following complex expressions describe theelectrical behavior of our films [15].
complex impedance : Z* = Z′+ jZ′′=Rs −j
ωCs(7)
complex admittance : Y* =Y ′−Y ′′ =1RP
+ jωCp (8)
complex permittivity : ε* = ε′− jε′′ (9)
complex modulus :M* =M′+M′′ (10)
These expressions are interrelated as : M* =1ε*
= jωC0Z*
= jωC01Y*
� �
(11)
where RS and CS are the series resistance and capaci-tance; RP and CP are the parallel resistance and capaci-tance, C0 is the empty capacitance, the real andimaginary components are ω = 2πʋ, ʋ is the applied fre-quency and j2 =−1. The plot (Zˊˊ versus Zˊ) thatdescribes the electrical behavior of our samples whichhave three components; each of these components
corresponds to a particular relaxation frequency. Theelectrical response is due to the bulk properties (νb) athigher frequencies. At intermediate frequencies, theelectrical response is due to the grain boundaries (νgb)and at low frequencies the electrical response corre-sponds to electrode process (νel), or processes occurringin the material/electrode interface (νel ≪ νgb≪ νb) [25].Several factors influence the properties of grain bound-aries as chemical composition, impurities, ageing andconditions of preparation. The electrical characteristic ofa material is shown by the appearance of semicirculararcs in the Nyquist plots. Figure 10 is the Nyquist repre-sentation of undoped and Mn-doped Co3O4 thin films,whose f frequency varies from 75 KHz to 20MHz at ambi-ent temperature. The processes that occur in the elec-trode are modeled by an equivalent electrical circuit.The physical logic of the system indicates that the con-current processes are connected in parallel. The capacityCp of the layer was calculated using the following equa-tion [10]:
CP =1
2πfcRp(12)
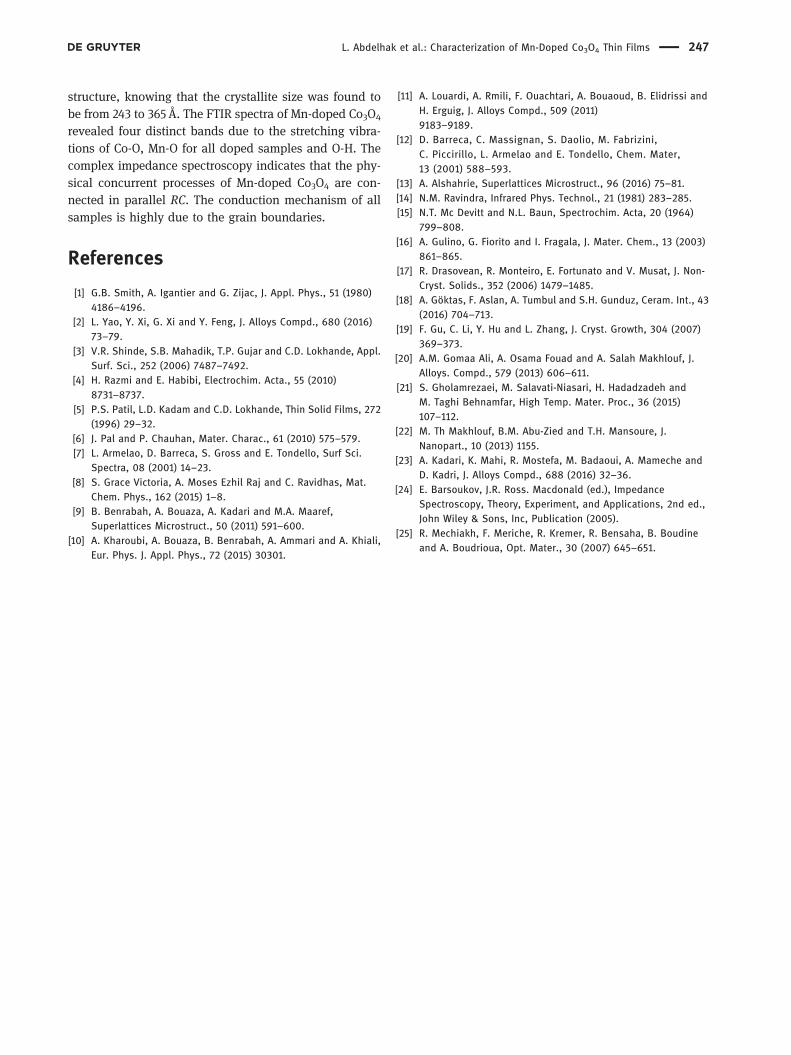
The variation of the resistance and capacitance as afunction of Mn-doping levels are listed in Table 3 andshown in Figure 11. It is clear that the resistance ofcobalt oxide decreases and the capacity increaseswith the increase of doping level; this shift is also dueto the introduction of manganese ions in Co3O4 lattice
-1 0 1 2 3 4 5 6 7 8 9 108,06
8,07
8,08
8,09
8,10
8,11
8,12
Lattice parameter ( )Grain size ( )
Mn content (%)
retemarap
ecittaL
100
120
140
160
180
200
220
240
Grain size
Figure 7: Network parameter and grain size of Mn-doped Co3O4.
L. Abdelhak et al.: Characterization of Mn-Doped Co3O4 Thin Films 243
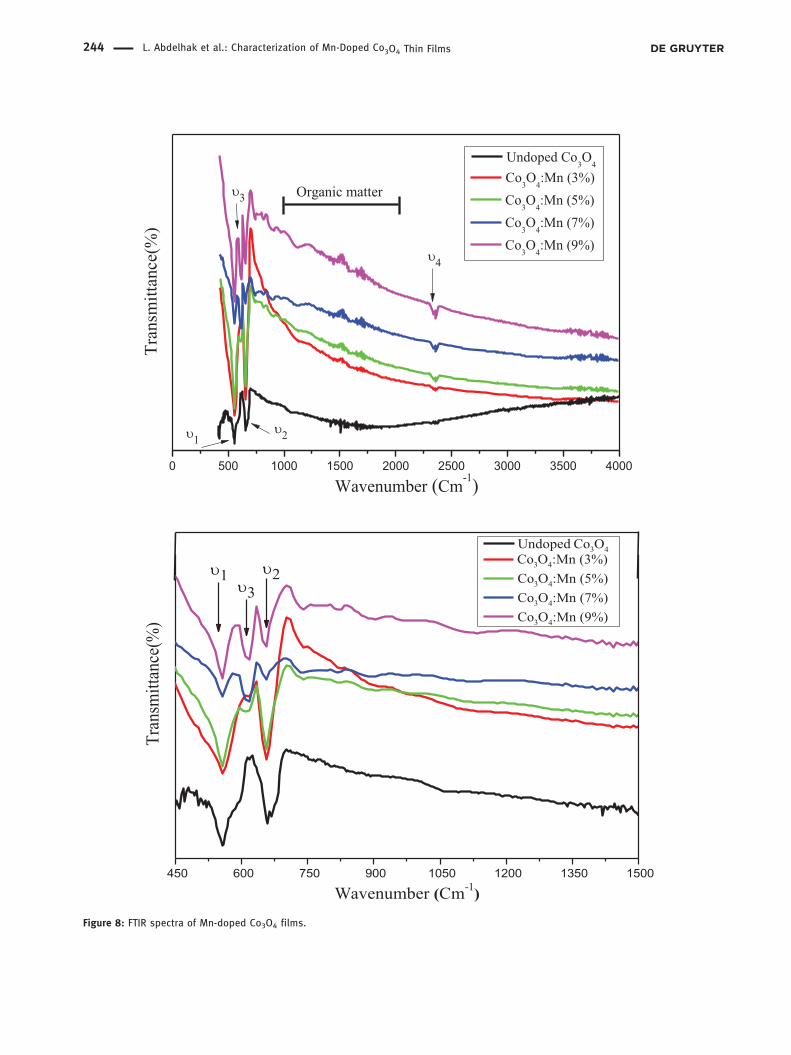
Figure 8: FTIR spectra of Mn-doped Co3O4 films.
244 L. Abdelhak et al.: Characterization of Mn-Doped Co3O4 Thin Films
which induces a variation in the particle size and con-sequently introduce more grain boundaries within thesamples. Two conduction mechanisms are simulta-neously present: conduction across the grain and theconduction through the grain boundaries. The effect ofgrain boundaries in samples becomes more dominantin the conduction mechanism compared to the graincontribution.
Conclusion
In conclusion, we have successfully synthesized Mn-doped cobalt oxide (Co3O4) thin films using a sol geldip-coating technique. We used several experimentalmethods of investigation to study the effect of Mn dopingon optical, structural and electrical properties of cobaltoxide as optical transmission spectroscopy (UV-visible
a
bc
d e
a
Figure 9: SEM of Co3O4 powder at different doping levels of manganese (a) undoped, (b) 3%Mn, (c) 5%Mn, (d) 7%Mn and (e) 9% Mn.
L. Abdelhak et al.: Characterization of Mn-Doped Co3O4 Thin Films 245
and IR), XRD, FTIR and complex impedance measure-ment. The transmittance of all samples decreases withincreasing doping levels. The band gap energies of oursamples were determined by the Tauc plot. The values ofthe band gaps were found to decrease as the dopantconcentration increases; it might be due to the formationof impurity energy level. XRD patterns revealed that Mn-doped Co3O4 samples were crystallized in cubic spinel
0 20 40 60 80 100 120 1400
10
20
30
40
50
60
70-Z
'' (Ω
)
Z'(Ω)
Co3O4:Mn (7%)
Co3O4:Mn (3%)
Co3O4:Mn (5%)
Undoped Co3O4
Co3O4:Mn (9%)
CP
RP
Figure 10: Complex impedance spectrum(Nyquist plots) of Mn-doped Co3O4 thinfilms.
Table 3: Values of fc, Rp and Cp of Mn-doped Co3O4 films.
Samples fc (MHz) Rp (Ω) Cp (µF)
Undoped CoO . . .CoO: Mn (%) . . .CoO: Mn (%) . . .CoO: Mn (%) . . .CoO: Mn (%) . . .
-1 0 1 2 3 4 5 6 7 8 9 1090
95
100
105
110
115
120
125
130
Resistance (Ω)
Capacity(μF)
Mn Content(%)
RP(Ω
)
75
80
85
90
95
100
105
110
115
120
125
CP (μF)
Figure 11: Variation of capacity and resistance of Mn-doped Co3O4 thin films.
246 L. Abdelhak et al.: Characterization of Mn-Doped Co3O4 Thin Films
structure, knowing that the crystallite size was found tobe from 243 to 365Å. The FTIR spectra of Mn-doped Co3O4
revealed four distinct bands due to the stretching vibra-tions of Co-O, Mn-O for all doped samples and O-H. Thecomplex impedance spectroscopy indicates that the phy-sical concurrent processes of Mn-doped Co3O4 are con-nected in parallel RC. The conduction mechanism of allsamples is highly due to the grain boundaries.
References
[1] G.B. Smith, A. Igantier and G. Zijac, J. Appl. Phys., 51 (1980)4186–4196.
[2] L. Yao, Y. Xi, G. Xi and Y. Feng, J. Alloys Compd., 680 (2016)73–79.
[3] V.R. Shinde, S.B. Mahadik, T.P. Gujar and C.D. Lokhande, Appl.Surf. Sci., 252 (2006) 7487–7492.
[4] H. Razmi and E. Habibi, Electrochim. Acta., 55 (2010)8731–8737.
[5] P.S. Patil, L.D. Kadam and C.D. Lokhande, Thin Solid Films, 272(1996) 29–32.
[6] J. Pal and P. Chauhan, Mater. Charac., 61 (2010) 575–579.[7] L. Armelao, D. Barreca, S. Gross and E. Tondello, Surf Sci.
Spectra, 08 (2001) 14–23.[8] S. Grace Victoria, A. Moses Ezhil Raj and C. Ravidhas, Mat.
Chem. Phys., 162 (2015) 1–8.[9] B. Benrabah, A. Bouaza, A. Kadari and M.A. Maaref,
Superlattices Microstruct., 50 (2011) 591–600.[10] A. Kharoubi, A. Bouaza, B. Benrabah, A. Ammari and A. Khiali,
Eur. Phys. J. Appl. Phys., 72 (2015) 30301.
[11] A. Louardi, A. Rmili, F. Ouachtari, A. Bouaoud, B. Elidrissi andH. Erguig, J. Alloys Compd., 509 (2011)9183–9189.
[12] D. Barreca, C. Massignan, S. Daolio, M. Fabrizini,C. Piccirillo, L. Armelao and E. Tondello, Chem. Mater,13 (2001) 588–593.
[13] A. Alshahrie, Superlattices Microstruct., 96 (2016) 75–81.[14] N.M. Ravindra, Infrared Phys. Technol., 21 (1981) 283–285.[15] N.T. Mc Devitt and N.L. Baun, Spectrochim. Acta, 20 (1964)
799–808.[16] A. Gulino, G. Fiorito and I. Fragala, J. Mater. Chem., 13 (2003)
861–865.[17] R. Drasovean, R. Monteiro, E. Fortunato and V. Musat, J. Non-
Cryst. Solids., 352 (2006) 1479–1485.[18] A. Göktas, F. Aslan, A. Tumbul and S.H. Gunduz, Ceram. Int., 43
(2016) 704–713.[19] F. Gu, C. Li, Y. Hu and L. Zhang, J. Cryst. Growth, 304 (2007)
369–373.[20] A.M. Gomaa Ali, A. Osama Fouad and A. Salah Makhlouf, J.
Alloys. Compd., 579 (2013) 606–611.[21] S. Gholamrezaei, M. Salavati-Niasari, H. Hadadzadeh and
M. Taghi Behnamfar, High Temp. Mater. Proc., 36 (2015)107–112.
[22] M. Th Makhlouf, B.M. Abu-Zied and T.H. Mansoure, J.Nanopart., 10 (2013) 1155.
[23] A. Kadari, K. Mahi, R. Mostefa, M. Badaoui, A. Mameche andD. Kadri, J. Alloys Compd., 688 (2016) 32–36.
[24] E. Barsoukov, J.R. Ross. Macdonald (ed.), ImpedanceSpectroscopy, Theory, Experiment, and Applications, 2nd ed.,John Wiley & Sons, Inc, Publication (2005).
[25] R. Mechiakh, F. Meriche, R. Kremer, R. Bensaha, B. Boudineand A. Boudrioua, Opt. Mater., 30 (2007) 645–651.
L. Abdelhak et al.: Characterization of Mn-Doped Co3O4 Thin Films 247
Related Documents


![High‐Performance Doped Silver Films: Overcoming ...shalaev/Publication_list_files/High... · alternative materials (e.g., doped semi-conductor,[9] transition metal nitride,[10]](https://static.cupdf.com/doc/110x72/5faeb7fbb7530528144c716f/highaperformance-doped-silver-films-overcoming-shalaevpublicationlistfileshigh.jpg)


