Characterization of minerals and organic phosphorus species in marine sediments using soft X-ray f luorescence spectromicroscopy Jay A. Brandes a, ⁎ , Ellery Ingall b , David Paterson c,1 a Skidaway Institute of Oceanography, 10 Ocean Science Circle, Savannah, GA 31411, USA b School of Earth and Atmospheric Sciences, Georgia Institute of Technology, Atlanta, GA 30332-0340, USA c Advanced Photon Source, Argonne National Laboratory, 9700 S. Cass Ave, Argonne, IL 60439, USA Received 1 March 2006; received in revised form 29 August 2006; accepted 18 September 2006 Available online 13 November 2006 Abstract Phosphorus Near Edge X-ray Fluorescence Spectroscopy (P-NEXFS) data were collected on phosphorus containing phases including organic and inorganic compounds and minerals. Although phases containing P in the plus five oxidation state P(V) in a tetrahedral PO 4 structure have similar primary fluorescence peak positions, the size, shape, and positions of secondary spectral features are diagnostic for different compounds and minerals. In particular, calcium phosphates exhibited a notable post-peak shoulder at 2154.5 eV, while oxidized iron phosphates had a distinctive pre-peak feature at 2148 eV. Polyphosphates have a broad secondary peak located approximately 2 eV higher in energy than a similar feature in phosphate esters and diesters. Compounds containing P(V) in structures other than PO 4 tetrahedra such as phosphonates have a primary peak shifted about 1 eV lower than corresponding organo-phosphates. Organo-phosphates with P in the plus three oxidation state P(III) such as phosphines had primary fluorescence peaks shifted still further down in energy (2–3 eV). The substitution of aromatic carbon groups in close proximity to P structures in organic compounds generated both pre- and post-peak features as well as a number of secondary peaks. In addition, X-ray fluorescence mapping of P, Si, Al, Mg, and Na was conducted on a marine sediment sample with sub-micron spatial resolution. Phosphorus was heterogeneously distributed in the sample and not correlated on a broad scale with any other element examined. Much of the P present in the sample was located in small, 0.6–8 μm size, P-rich domains. Several P-rich regions were examined with P-NEXFS using a focused beam with 60 nm resolution and were found to consist of either calcium phosphate or polyphosphate phases. The presence of significant polyphosphate-dominated regions in a marine sediment sample supports the recent observations that such phases can play an important role in marine P cycling. The combination of fluorescence mapping and P-NEXFS data collection on fine particles provides a powerful new tool for environmental phosphorus studies. © 2006 Elsevier B.V. All rights reserved. Keywords: Phosphorus; X-ray microscopy; Spectroscopy; Apatite; Polyphosphate; Phosphonate; Marine sediments 1. Introduction Marine primary production is dependent on the avail- ability of the vital nutrient phosphorus. Phosphorus oc- curs as a wide variety of inorganic and organic forms in particulate and dissolved organic matter (DOM) pools (Benitez-Nelson, 2000; Karl and Bjorkman, 2001). Al- though P composition and speciation is an important Marine Chemistry 103 (2007) 250 – 265 www.elsevier.com/locate/marchem ⁎ Corresponding author. E-mail address: [email protected] (J.A. Brandes). 1 Present address: Australian Synchrotron, 800 Blackburn Road, Clayton, VIC 3168, Australia. 0304-4203/$ - see front matter © 2006 Elsevier B.V. All rights reserved. doi:10.1016/j.marchem.2006.09.004

Welcome message from author
This document is posted to help you gain knowledge. Please leave a comment to let me know what you think about it! Share it to your friends and learn new things together.
Transcript

(2007) 250–265www.elsevier.com/locate/marchem
Marine Chemistry 103
Characterization of minerals and organic phosphorus species inmarine sediments using soft X-ray f luorescence spectromicroscopy
Jay A. Brandes a,⁎, Ellery Ingall b, David Paterson c,1
a Skidaway Institute of Oceanography, 10 Ocean Science Circle, Savannah, GA 31411, USAb School of Earth and Atmospheric Sciences, Georgia Institute of Technology, Atlanta, GA 30332-0340, USA
c Advanced Photon Source, Argonne National Laboratory, 9700 S. Cass Ave, Argonne, IL 60439, USA
Received 1 March 2006; received in revised form 29 August 2006; accepted 18 September 2006Available online 13 November 2006
Abstract
Phosphorus Near Edge X-ray Fluorescence Spectroscopy (P-NEXFS) data were collected on phosphorus containing phasesincluding organic and inorganic compounds and minerals. Although phases containing P in the plus five oxidation state P(V) in atetrahedral PO4 structure have similar primary fluorescence peak positions, the size, shape, and positions of secondary spectralfeatures are diagnostic for different compounds and minerals. In particular, calcium phosphates exhibited a notable post-peakshoulder at 2154.5 eV, while oxidized iron phosphates had a distinctive pre-peak feature at 2148 eV. Polyphosphates have a broadsecondary peak located approximately 2 eV higher in energy than a similar feature in phosphate esters and diesters. Compoundscontaining P(V) in structures other than PO4 tetrahedra such as phosphonates have a primary peak shifted about 1 eV lower thancorresponding organo-phosphates. Organo-phosphates with P in the plus three oxidation state P(III) such as phosphines hadprimary fluorescence peaks shifted still further down in energy (2–3 eV). The substitution of aromatic carbon groups in closeproximity to P structures in organic compounds generated both pre- and post-peak features as well as a number of secondary peaks.In addition, X-ray fluorescence mapping of P, Si, Al, Mg, and Na was conducted on a marine sediment sample with sub-micronspatial resolution. Phosphorus was heterogeneously distributed in the sample and not correlated on a broad scale with any otherelement examined. Much of the P present in the sample was located in small, 0.6–8 μm size, P-rich domains. Several P-rich regionswere examined with P-NEXFS using a focused beam with 60 nm resolution and were found to consist of either calcium phosphateor polyphosphate phases. The presence of significant polyphosphate-dominated regions in a marine sediment sample supports therecent observations that such phases can play an important role in marine P cycling. The combination of fluorescence mapping andP-NEXFS data collection on fine particles provides a powerful new tool for environmental phosphorus studies.© 2006 Elsevier B.V. All rights reserved.
Keywords: Phosphorus; X-ray microscopy; Spectroscopy; Apatite; Polyphosphate; Phosphonate; Marine sediments
⁎ Corresponding author.E-mail address: [email protected] (J.A. Brandes).
1 Present address: Australian Synchrotron, 800 Blackburn Road,Clayton, VIC 3168, Australia.
0304-4203/$ - see front matter © 2006 Elsevier B.V. All rights reserved.doi:10.1016/j.marchem.2006.09.004
1. Introduction
Marine primary production is dependent on the avail-ability of the vital nutrient phosphorus. Phosphorus oc-curs as a wide variety of inorganic and organic forms inparticulate and dissolved organic matter (DOM) pools(Benitez-Nelson, 2000; Karl and Bjorkman, 2001). Al-though P composition and speciation is an important

251J.A. Brandes et al. / Marine Chemistry 103 (2007) 250–265
factor in determining its bioavailability, there are rela-tively few analytical tools available to provide detailedcharacterization. Typically, studies of P speciation inmarine sediments and waters rely upon sequential che-mical extraction or NuclearMagnetic Resonance (NMR)techniques. These techniques have painted a complexpicture of marine P composition and cycling in waters,particulates, and sediments showing that P occurs in anumber of different organic, inorganic, and mineralphases and that these phases can undergo many transfor-mations in response to environmental conditions. Forexample, numerous sequential extraction studies of ma-rine sediments and water column particulates haveshown redistribution of phosphorus associated with or-ganic matter, mineral surfaces, iron oxyhydroxides, andauthigenic phases commonly occurs during transportand diagenesis (Anderson and Delaney, 2000; Faul et al.,2005; Filippelli et al., 2003; Hyacinthe and Van Cap-pellen, 2004; Ruttenberg, 1992; Ruttenberg and Berner,1993; Schenau and De Lange, 2001; Slomp and VanCappellen, 2004; Sutula et al., 2004; Tamburini et al.,2003). NMR studies of P present in particulate anddissolved organic matter in the water column and sedi-ments indicate the presence of a wide range of com-pounds including organic P monoesters, diesters, andpolyphosphates (Ahlgren et al., 2005; Benitez-Nelsonet al., 2004; Cade-Menun et al., 2005; Carman et al.,2000; Clark et al., 1999; Kolowith et al., 2001; Paytanet al., 2003; Sannigrahi and Ingall, 2005). Although greatprogress has been made identifying P compounds andphases present in marine systems, there remain manyquestions regarding the origin and fates of compoundssuch as phosphonates and polyphosphates and the pro-cesses leading to the formation of authigenic P phases.
While much has been learned from sequential extrac-tion and NMR studies, there are several drawbacks tothese techniques. Sequential extractions can typicallyquantify particulate P in simple classes such as hydro-lysable, Fe-bound, detrital, and authigenic but provideno specific details on mineralogy within such classes.Furthermore, as an operationally defined technique,there are no assurances that an unusual or atypical spe-cies would not fall outside general classification sche-mes defined by analysis of standard materials. Liquidand solid state 31P-NMR techniques can identify diffe-rent P bonding configurations present in a bulk sampleor extract, but they typically cannot be used to identifyspecific compounds and minerals. Additionally, solid-state 31P-NMR methods cannot partition between inor-ganic and organic phases within marine particulates andhave significant sample size requirements and interfer-ences from salts and paramagnetic species (e.g., Fe) that
limit their application to organic-rich materials or sam-ples artificially enriched in organic P (Paytan et al.,2003). Dissolved organic P studies typically requireconcentration of organic molecules from hundreds ofliters of seawater (Bauer et al., 1996; Clark et al., 1999;Kolowith et al., 2001) to provide enough material for31P-NMR analysis. During such concentration process-es losses of small organic molecules from the concen-trates typically occur. Most demineralization techniquesused to concentrate P for analysis subject samples tohighly acidic conditions that can result in the hydrolysisand loss of labile P species as well as dissolving manyinorganic P minerals.
In this paper we demonstrate the potential of com-bined X-ray microscopy and fluorescence spectroscopy(hereafter referred to as “spectromicroscopy”) for theanalysis of P in marine samples. The use of X-ray spec-tromicroscopy is relatively new, having been developedover the last two decades (Kirz, 1991; Kirz et al., 1994)and refined into a tool capable of being used by non-specialists in the last 10 years (Jacobsen et al., 2003,2000). X-ray spectromicroscopy provides informationthat cannot be obtained using NMR or extraction tech-niques. Namely, with X-ray spectromicroscopy differentorganic mineral and polymeric P phases can be identifiedand mapped at micro-scales (b1 μm) with minimalsample handling. These micro-scales are particularlyrelevant for examining the microbially-mediated storageand degradation mechanisms often proposed for Pcycling (Hirschler et al., 1990; Konhauser et al., 1994;Roden and Edmonds, 1997; Schulz and Schulz, 2005).
Synchrotron-based soft X-ray microscopes have beenused to examine P distributions in phytoplankton cells(Twining et al., 2003, 2004) and carbon speciationwithinmarine particulates (Brandes et al., 2004). Such instru-ments rely upon the interaction of X-rays in the b10 keVrange with inner shell electrons in selected elements. Theposition and shape of absorption and fluorescencespectra collected from samples provide insights intolocal bonding environments, and the high spatialresolution of X-ray microscopes (typically b100 nm)allows for a minimum of signal averaging and thepossibility that interactions between regions of contrast-ing chemical composition can bemapped and quantified.While a growing body of research has focused oncarbon-specific X-ray spectromicroscopy (Myneni,2002), the use of this technique in exploring otherbiologically important elements (e.g., N, O, P) remainsin its infancy. Studies exploring the use of X-ray absorp-tion and fluorescence spectroscopy have been scatteredacross the soil, materials, and atmospheric sciences fields(Bertsch and Hunter, 2001; Boese et al., 1997; Flynn
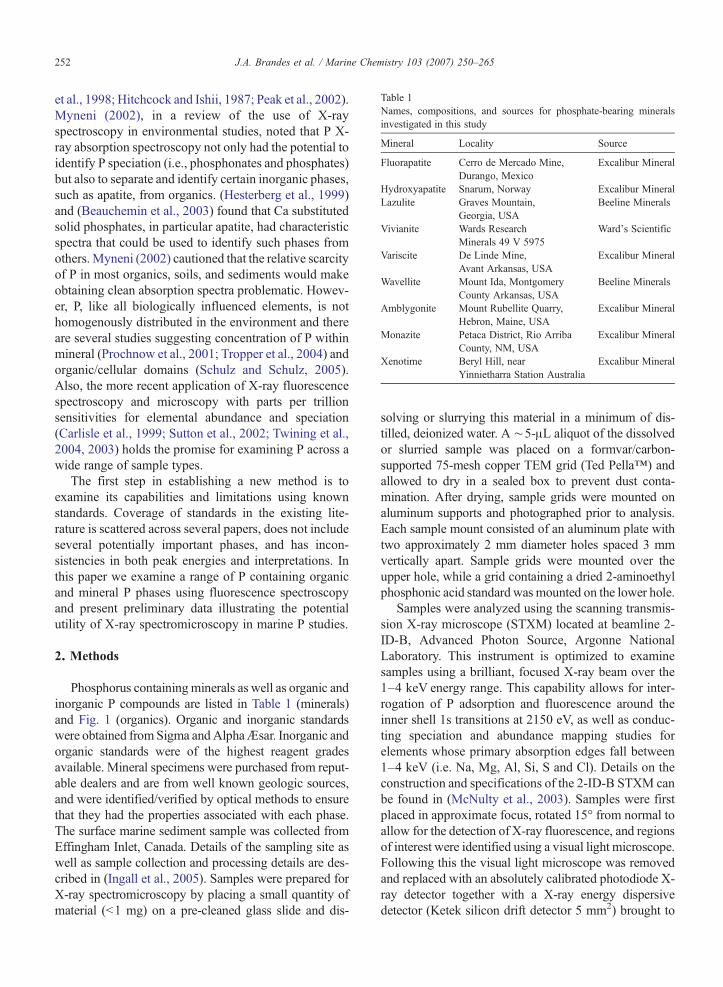
Table 1Names, compositions, and sources for phosphate-bearing mineralsinvestigated in this study
Mineral Locality Source
Fluorapatite Cerro de Mercado Mine,Durango, Mexico
Excalibur Mineral
Hydroxyapatite Snarum, Norway Excalibur MineralLazulite Graves Mountain,
Georgia, USABeeline Minerals
Vivianite Wards ResearchMinerals 49 V 5975
Ward's Scientific
Variscite De Linde Mine,Avant Arkansas, USA
Excalibur Mineral
Wavellite Mount Ida, MontgomeryCounty Arkansas, USA
Beeline Minerals
Amblygonite Mount Rubellite Quarry,Hebron, Maine, USA
Excalibur Mineral
Monazite Petaca District, Rio ArribaCounty, NM, USA
Excalibur Mineral
Xenotime Beryl Hill, nearYinnietharra Station Australia
Excalibur Mineral
252 J.A. Brandes et al. / Marine Chemistry 103 (2007) 250–265
et al., 1998; Hitchcock and Ishii, 1987; Peak et al., 2002).Myneni (2002), in a review of the use of X-rayspectroscopy in environmental studies, noted that P X-ray absorption spectroscopy not only had the potential toidentify P speciation (i.e., phosphonates and phosphates)but also to separate and identify certain inorganic phases,such as apatite, from organics. (Hesterberg et al., 1999)and (Beauchemin et al., 2003) found that Ca substitutedsolid phosphates, in particular apatite, had characteristicspectra that could be used to identify such phases fromothers. Myneni (2002) cautioned that the relative scarcityof P in most organics, soils, and sediments would makeobtaining clean absorption spectra problematic. Howev-er, P, like all biologically influenced elements, is nothomogenously distributed in the environment and thereare several studies suggesting concentration of P withinmineral (Prochnow et al., 2001; Tropper et al., 2004) andorganic/cellular domains (Schulz and Schulz, 2005).Also, the more recent application of X-ray fluorescencespectroscopy and microscopy with parts per trillionsensitivities for elemental abundance and speciation(Carlisle et al., 1999; Sutton et al., 2002; Twining et al.,2004, 2003) holds the promise for examining P across awide range of sample types.
The first step in establishing a new method is toexamine its capabilities and limitations using knownstandards. Coverage of standards in the existing lite-rature is scattered across several papers, does not includeseveral potentially important phases, and has incon-sistencies in both peak energies and interpretations. Inthis paper we examine a range of P containing organicand mineral P phases using fluorescence spectroscopyand present preliminary data illustrating the potentialutility of X-ray spectromicroscopy in marine P studies.
2. Methods
Phosphorus containingminerals as well as organic andinorganic P compounds are listed in Table 1 (minerals)and Fig. 1 (organics). Organic and inorganic standardswere obtained fromSigma andAlphaÆsar. Inorganic andorganic standards were of the highest reagent gradesavailable. Mineral specimens were purchased from reput-able dealers and are from well known geologic sources,and were identified/verified by optical methods to ensurethat they had the properties associated with each phase.The surface marine sediment sample was collected fromEffingham Inlet, Canada. Details of the sampling site aswell as sample collection and processing details are des-cribed in (Ingall et al., 2005). Samples were prepared forX-ray spectromicroscopy by placing a small quantity ofmaterial (b1 mg) on a pre-cleaned glass slide and dis-
solving or slurrying this material in a minimum of dis-tilled, deionized water. A ∼5-μL aliquot of the dissolvedor slurried sample was placed on a formvar/carbon-supported 75-mesh copper TEM grid (Ted Pella™) andallowed to dry in a sealed box to prevent dust conta-mination. After drying, sample grids were mounted onaluminum supports and photographed prior to analysis.Each sample mount consisted of an aluminum plate withtwo approximately 2 mm diameter holes spaced 3 mmvertically apart. Sample grids were mounted over theupper hole, while a grid containing a dried 2-aminoethylphosphonic acid standard was mounted on the lower hole.
Samples were analyzed using the scanning transmis-sion X-ray microscope (STXM) located at beamline 2-ID-B, Advanced Photon Source, Argonne NationalLaboratory. This instrument is optimized to examinesamples using a brilliant, focused X-ray beam over the1–4 keV energy range. This capability allows for inter-rogation of P adsorption and fluorescence around theinner shell 1s transitions at 2150 eV, as well as conduc-ting speciation and abundance mapping studies forelements whose primary absorption edges fall between1–4 keV (i.e. Na, Mg, Al, Si, S and Cl). Details on theconstruction and specifications of the 2-ID-B STXM canbe found in (McNulty et al., 2003). Samples were firstplaced in approximate focus, rotated 15° from normal toallow for the detection of X-ray fluorescence, and regionsof interest were identified using a visual light microscope.Following this the visual light microscope was removedand replaced with an absolutely calibrated photodiode X-ray detector together with a X-ray energy dispersivedetector (Ketek silicon drift detector 5 mm2) brought to

Fig. 1. Names, formulae, CAS numbers, and structures for organic and inorganic phosphorus standards investigated in this study.
253J.A. Brandes et al. / Marine Chemistry 103 (2007) 250–265

254 J.A. Brandes et al. / Marine Chemistry 103 (2007) 250–265
within approximately 5 mm of the sample's surface. Thesample and detector regions were bathed in a He gasstream to reduce backscatter fromN2, O2 andAr aswell asto minimize radiation-induced oxidation. Standards werethen analyzed both at fine focus (beam size on sampleapproximately 80 nm diameter) and defocused (beam sizeapproximately 50 μm diameter) prior to spectral acquisi-tion. Elemental maps and P X-ray fluorescence spectra onregions within the marine sediment sample were acquiredat fine focus. Typically, spectra were collected between2130 and 2190 eV with 0.25 eV steps and a 1.0-s dwelltime per sample point. Mapping of sample elementalconcentrations was accomplished by setting the incidentradiation to 2190 eV and using a 500-ms dwell time perpixel. Fluorescence and absorbance spectra on points ofinterest were collected using the same settings as withstandard spectra, except that dwell timeswere increased to5 s/point to obtain higher signal/noise (S/N) spectra.
For organic standards, it is important to establish theposition of the primary absorption and fluorescence peak.However, minor differences in monochromator position-ing between energy scans led to significant (1–2 eV) driftsin apparent peak positions. To minimize and account forthe effects of this monochromator drift, we followed theprocedure described below when collecting standard andsample spectra. Typically, we collected 10 spectra inautomated order on a grid containing a 2-aminoethylphosphonic acid (AEP) standard (Clark et al., 1999) inorder to “warm up” the monochromator. During this timethe apparent primary absorbance peak position was ob-served to drift downwards in energy by ∼1.5 eV, stabi-lizing towards the end of these repetitive scans. After thiswas completed we moved to a previously identifiedsample location and ran one spectral scan. Then wemoved back to the AEP standard, using a different samplelocation to minimize any influences of radiation damagefrom previous scans and repeated a spectral scan. Wecontinued this process in rapid fashion until an adequatenumber of spectra had been collected. If scans wereconducted within a few minutes of each other only minordrifts (b0.3 eV) were observed. Spectral data presented in(Figs 2, 3, 5) and Table 2 were averaged over 2–3 scans toimprove S/N ratios. For inorganic P standards and mine-rals the primary edge at 1/2 peak heightwas set to 2151 eV,and all other features were referenced to this value. Usingthis method the energy found at maximum peakfluorescence did not vary by more than 0.3 eV betweeninorganic standards and minerals. For organic standardsthe fluorescence/absorbance peak varies as a function of Predox state, and therefore care was taken always toreference collected scans to AEP and/or KH2PO4 standardspectra collected immediately after sample analysis.
3. Results
3.1. Minerals
Phosphorus X-ray absorption and fluorescence spec-tra exhibit several spectral features, which vary frommaterial to material and can be used to establish anidentifying “fingerprint.” Fig. 2 shows the fluorescencespectra obtained from a variety of P-bearing minerals.For phosphorus the major peak absorption and fluores-cence occurs around 2151 eV (Myneni, 2002) and is theresult of transferring an electron from a 1s inner shellorbital to a t2* orbital (or, in the case of fluorescence,from the decay of a higher energy electron to an unoc-cupied 1s orbital, releasing photons). Typically, X-rayspectroscopy literature discusses either “edge” or “peak”positions with regards to this feature. “Edge” positionsare the energy found on the lower edge of the peak at 1/2full height. Although the literature for carbon X-rayspectroscopy generally uses peak locations, the P litera-ture generally favors edge locations. Although all Pminerals measured in this study contained P in the +Vstate, and had indistinguishable (within the 0.3 eVresolution of the monochromator) absorption andfluorescence edge positions, most of the minerals andorganic P compounds examined contained either pre-edge or post-edge energy features that can be used toidentify specific minerals or differentiate between mine-ral and organic phases (Fig. 2). Pre-edge features, fallingaround 3 eV lower in energy than the primary edge, wereseen clearly only in a sample of vivianite allowed tooxidize in air after grinding for 3 months (Fig. 2). Otherstudies have indicated that this feature is associated withthe presence of Fe3+ in either the mineral (Pratesi et al.,2003) or oxide-associated (Hesterberg et al., 1999;Khare et al., 2004, 2005) forms. It is not present in thereduced iron phosphate minerals vivianite (if fresh) andlazulite (Fig. 2, and Pratesi et al., 2003). Althoughsimilar pre-edge features have been observed in Cr andCo phosphates (Okude et al., 1999) such phases areunlikely to be present in natural marine sediments. Atenergies slightly greater than the primary edge, calciumphosphate minerals exhibit a strong shoulder centeredaround 3 eV from the edge (Fig. 2). In highly crystallineforms such as the metamorphic fluorapatite and hydro-xyapatites measured here, substitution of F− vs. OH−
anions in the mineral structures appears to have onlysubtle effects in the secondary peak spectral region(N2155 eV). However, it has been observed that lesscrystalline forms of calcium phosphate minerals canexhibit smaller or less well separated shoulder peaks(Hesterberg et al., 1999).

Fig. 2. X-ray fluorescence spectra of phosphorus containing minerals.
255J.A. Brandes et al. / Marine Chemistry 103 (2007) 250–265
Minerals examined here were distinguishable primarilyby their secondary peak “fingerprints” above the primaryedge. Examining Table 2 and Fig. 2, it is clear thatphosphate minerals containing counterions such as Mg,Ca, Fe(II), Fe(III), Al, and rare earths can be distinguishedby these spectral features. These differences are due to thedifferent co-ordination spheres between the phosphatesand their counterions (Myneni, 2002). Even similarminerals such as variscite and wavelite, which differ
only slightly in Al:P stoichiometery, have distinctivesignatures, with variscite exhibiting a peak at 2159 eV thatis absent in wavelite aswell as having a broad peak locatedat a higher energy range. The rare-earth phosphates hadquite distinctive and unusual P NEXFS spectra, withmonzanite having a very broad peak (full width at halfheight=5.5 eV as compared to a value of 2.5 eV forvariscite). This feature may be due to the overlapping of amultiplicity of states resulting from the mixture of

256 J.A. Brandes et al. / Marine Chemistry 103 (2007) 250–265
elements found in this mineral. Xenotime also haddistinctive P NEXFS spectra with five sharp resonancepeaks in the edge/near edge region. There are clearinteractions between phosphate's electronic structure andouter orbitals in period four element phosphates (Okude etal., 1999) such asCo, Fe, andCr, although no patternswereobserved concerning peak position/number and number ofouter shell electrons. The unique nature of these spectra
Fig. 3. X-ray fluorescence spectra of inorganic and organic phosphates, wit
indicates that PNEXFS could be useful in investigations ofsuch phases within ancient sediments (Rasmussen, 1996).
3.2. Inorganic compounds
Phosphate salts have been examined previously byseveral researchers (Franke et al., 1997; Franke andHormes, 1995; Myneni, 2002). Although the primary
h a reference line at 2150 eV (left group) and 2149 eV (right group).

Table 2P NEXFS spectral peak positions for mineral, organic, inorganic, and sample regions investigated in this study
Mineral standard Edge Center Higher Order Peaks
Hydroxyapatite 2151 2152 2154.4 2163.3 2166.4 2169.9Fluorapatite 2151 2152 2154.8 2163.3 2170Variscite 2151 2152.1 2159.1 2170.1 2172.3Wavelite 2151 2152 2165.8 2172.3Amblygonite 2151 2152.2 2156.2 2161 2166.8 2171.2Vivianite Ox 2151 2152.1 2165.3 2169.6 2172.1Vivianite Pre-Edge 2148Vivianite Fresh 2151 2152.1 2157.3 2163.8 2165.3 2171.6Lazulite 2151 2152.3 2156.9 2161.6 2167.1 2171.3Monzanite 2151 2152.9 2164.5 2171Xenotime 2151 2152 2155 2158.4 2163.3 2172.9
Organic and inorganics Edge Center Higher Order Peaks
Potassium Phosphate 2151 2152.4 2165.8Tripolyphosphate Pentasodium 2151 2152.3 2170.3Phytic Acid 2151 2152.5 2168.7Phosphatidylethanolamine 2151 2152.1 2167.7Adenosine 5′-triphosphate 2151 2152.3 2170.3O-phosphoryl ethanolamine 2151 2152.1 2167.3Phenyl Phosphate 2151 2152.3 2158.8 2165.8 2170.3 2176Pre edge 21492-Aminoethylphosphonic acid 2149 2150.5 2160.8 2168.8Phenylphosphonic acid 2149 2151 2162Pre edge 2148Propylenediphosphonic acid 2149 2151 2156.5 2160 2167.2Phenylphosphinic acid 2147 2148.8 2159.8 2166.3Tri(1-naphthylphosphine) 2145 2145.4 2146.2 2148.7 2152.8 2163.7Pre edge 2144 2144.2
Sediment regions Edge Center Higher Order Peaks
A 2151 2152 2170.9B 2151 2152 2154.9 2162.9 2166.5C 2151 2152.1 2170D 2151 2152.2 2154.9 2163.3 2170.1E 2151 2152 2171.1
257J.A. Brandes et al. / Marine Chemistry 103 (2007) 250–265
edge is unaffected by cation species, both pre-edge andpost-edge features have been noted (Franke and Hormes,1995). Although most pronounced in Ca phosphates, apost-peak shoulder is also observed in K salts (Fig. 3).However, distinguishing between K and Ca Phosphates isstraightforward as Ca phosphates have secondary peaks at2163 eV and 2170 eV, while K phosphates have only abroad single secondary peak at 2166 eV. Potassiumphosphate salts are highly soluble and will only be presentin marine samples as a consequence of freeze-drying theseawater matrix in a sample, and any such salts will likelybe co-localizedwith sodium.A small pre-edge feature wasalso observed with K2HPO4, and similar features havebeen observed in Ni, Mn and the previously discussed Fephosphate species (Franke and Hormes, 1995).
Intriguingly, compounds containing chains of poly-merized tetrahedral PO4 structures such as tripolypho-
sphate pentasodium and adenosine 5′ triphosphatedisodium (ATP) both have a distinctive secondary peakat 2170 eV. This distinctive secondary peak is higher inenergy than any of the secondary peaks found in organicphosphate monoesters (phytic acid, phenyl phosphate, O-phosphorylethanamine) (Fig. 3). Therefore it may bepossible to distinguish between organic esters andpolyphosphates using P NEXFS spectra. Several of theinorganic phosphate minerals also have secondary peaksin this region (Table 2), but each of these other species hasother diagnostic peaks that can be used to distinguish themfrom polyphosphates.
3.3. Organic compounds
Compounds incorporating P(V) examined here haveidentical edge and peak positions within the resolution of

258 J.A. Brandes et al. / Marine Chemistry 103 (2007) 250–265
this instrument, but have different secondary peakpositions (Fig. 3, Table 2). Each organic phase had asingle, fairly broad secondary peak, with the lipid (phos-phatidylethanolamine) and phosphoamine (O-phosphor-ylethanamine) having lower peak energies than phyticacid. Carbohydrates are susceptible to radiation damage(Brandes et al., 2004), and therefore all reported spectraldata were taken from analyses where the beam was de-focused to decrease the average radiation level to sixorders of magnitude less than that for focused scans.Repeated radiation exposure experiments on phytic acidusing a focused beam indicated that radiation damageprimarily resulted in mass loss with relativelyminor shiftsin relative peak intensity (data not shown). We did notobserve any spectral shifts in other organic standards afterrepeated analyses. One intriguing trend was for theprimary secondary peak to appear around 2 eV higher inenergy with polyphosphates vs. monophosphates(Table 2). Although this is not an exhaustive survey oforgano-phosphate compounds it is likely that the shiftbetweenmono and poly-phosphates should have an effecton the secondary NEXFS structure, as such shiftsapparently do in the mineral phases shown above. Finerdistinctions in monophosphate compounds, such as bet-ween phospho-lipids, energy storage compounds (i.e.AMP) and phytic acid, remain elusive but might berevealed with a more intensive EXAFS study of sampleregions.
The potential for P-NEXFS to identify more reducedorgano-P compounds is robust. The primary peak edgeand peak positions for phosphonates such as 2-amino-ethylphosphonic acid were approximately 1 eV lowerthan for similar organic phosphate esters such as 2-aminoethoxyphosphonic acid (Table 2). This is less of aseparation than reported by Myneni (2002) but was con-sistent and may be a function of the use of fluorescence,rather than absorption, spectroscopy in our work. Thisdegree of separation will require both very good mono-chrometer precision and stability aswell as the use of peakdeconvolution software to quantify the amounts of redu-ced organo-P phases within samples. More exotic/reduced organic molecules are easier to identify but arelikely to be rare or absent in natural samples. The subs-titution of aromatic carbon in organo-phosphates incompounds such as phenyl phosphate and Tri(1-naphthyl-phosphine) generated a pre-edge shoulder (Fig. 3). Thisshoulder was located about 2 eV lower in energy than theprimary edge, and was similar to energy to the peak edgesmeasured for phosphonates. As more direct C–P bonds aresubstituted for C–O–P bonds, the edge energy decreases,roughly 1–2 eV per additional C–P bond (Table 2). Com-pounds containing P(III) such as Phenylphosphinic acid
and Tri(1-naphthylphosphine) have peak and edge posi-tions approximately 2–3 eV lower than compounds con-taining P(V).
3.4. Effingham Inlet surface sediment
As a preliminary test for X-ray element-specific fluo-rescence mapping and P NEXFS, a surface sedimentsample collected from a site in Effingham Inlet, Canada,whichwas overlain by oxygen containing bottomwaters,was examined. Effingham Inlet is a coastal fjord onVancouver Island containing a permanent anoxic basinin close proximity to an oxic basin. As such it hasprovided a good location for studies of oxic vs. anoxiceffects on sedimentary nutrient cycling (Ingall et al.,2005; Sannigrahi and Ingall, 2005). Phosphorus releasefrom oxic sediments here is much lower than fromnearby anoxic sediments (Ingall et al., 2005; Sannigrahiand Ingall, 2005). An overview map of the sample wasconducted over a 120×80-μm region on the TEM gridwith 0.6 μm step size (Fig. 4). Although there weresignificant differences in sample thickness as revealed inthe transmission scan (Fig. 4, top left), fine features wererevealed throughout the sample in the fluorescencescans. The scanning microscope at 2-ID-B can simulta-neously map fluorescence signals from elements withresonance energies below the incident energy used toconduct the map, in this case 2190 eV. Therefore inaddition to P (2150 eV), the relative abundances of Si(1775 eV), Al (1490 eV), Mg (1250 eV), and Na(1050 eV) were mapped. Absolute elemental concentra-tions were not determined in this study, but it is possibleto do so with the use of thin film standards (Twining etal., 2004). Phosphorus was distributed heterogeneouslywithin the sample (Fig. 4, top right), primarily in 0.5–5 μm size regions. These P-rich regions were notcorrelated with high abundance regions of the otherelements mapped, ruling out association with clay (Al),quartz, and diatoms (Si) and precipitated salt (Na). Fig. 5shows the relative abundances of P, Si, and Na plotted incolor. Any covariance between these elements will showup as an intermediate color (e.g., Na and P together willresult in a brown–yellow color). There was littlecorrelation noted among these three elements, andindeed only Si, Al, and Mg showed any visible cova-riance. In the case of this sample the concentration of Naalong particle edges was probably an artifact of theslurrying process used to prepare these samples. As theslurries dried any dissolved salts would be concentratedand precipitated along particle boundaries. An exami-nation of the entire P-fluorescence map indicateddetectable (S/NN10) P over most of the sample region.

Fig. 4. X-ray transmission map and X-ray fluorescence maps of elemental abundance in a surface marine sediment sample. Lighter regions containgreater relative abundances of each element.
259J.A. Brandes et al. / Marine Chemistry 103 (2007) 250–265
However, given the time constraints on this instrumentwe focused our attention on the P-rich regions.
The particular strength of X-ray spectromicroscopy isthe ability to interrogate the chemical composition ofindividual regions once identified with fluorescencemaps. In Fig. 5 the P NEXFS spectra associated withfive P-rich regions are plotted along with lines denotingtheir positions in the sample. The regions can be dividedinto two spectral categories: Organic or polyphosphate(A, C, and E), and apatite-like (B and D, Fig. 5). While itis not possible at this point to subdivide these categoriesstill further, and the presence of minor phases withinthese regions cannot be discounted, the spectra of thesesample locations matches our standard spectra well. Thetwo apatite regions, although similar in containing thecharacteristic Ca-associated shoulder at 2155 eV, andthe apatite secondary peaks at 2163 and 2170 eV differin the relative intensity of the secondary peaks, andregion B has a more significant resonance at 2166.4 eV.Comparing these spectra with those of the standards(Fig. 2), both B and D regions match up well with both
apatites, but the extra spectral feature at 2166 eV in Bmost closely matches hydroxyapatite. Region B also hadsignificantly more co-variance with Al than did regionD, but none of the characteristic peaks found in the Al-phosphates (Table 2, Fig. 2) are present. However, theclear spectral differences between the 2 apatite mineralsclearly indicate the ability of P NEXFS to distinguishbetween subtle differences in mineral compositions.
Regions A, C, and E appear to be polyphosphates,based upon the positions of their secondary peaks. In allthree cases the secondary peak fell at a high value, above2170 eV, in and two cases were as high as 2171 eV(Table 2). None of the organic mono-phosphates have asecondary peak in this energy range, and only tripoly-phosphate pentasodium and ATP have peaks in thisregion. The high energy values for region C's and E'ssecondary peaks may indicate a greater degree of poly-merization than our standards. Potassium phosphate hasa secondary resonance at 2166 eV, the monophosphateshave resonances around 2167–2168 eV, and the tri-polyphosphates have resonances around 2170 eV. Thus,

Fig. 5. X-ray fluorescence map of co-variance between silica, sodium and phosphate relative abundances in the sediment sample from Fig. 3. Silicaabundances are depicted in blue, sodium abundances in red, and phosphorus abundances in green. Also shown are phosphorus X-ray fluorescencespectra from selected regions (indicated by lines).
260 J.A. Brandes et al. / Marine Chemistry 103 (2007) 250–265
a penta-, octa- or larger polyphosphate may reasonablybe expected to have still higher energy secondary reso-nances. Confirmation of this will require further stan-dard measurements, but if so P NEXFS may provideanother level of information on the structure of phos-phates within natural samples. One important caveat isthat the instrument at 2-id-b does not adjust focus duringenergy scans. Focus for these scans (50–100 nm spotsize) was performed at 2190 eV. The spot size at2152 eV increased to roughly 1/2 μm under these con-ditions. Thus for small P-rich regions the relativefluorescence peak heights decreased as one approachesthe 2152 primary peak region and more of the X-ray fluxilluminates P-poor surrounding sample regions. Whilethis will not affect the overall spectra (unless the sur-rounding material is relatively P enriched) it may causeminor upward shifts in the apparent positions offluorescence peaks and will generate significant differ-ences in peak intensities. For larger spots (N1 μm
diameter) this is not likely to be a concern unless there issome in-spot compositional heterogeneity.
4. Discussion
The marine phosphorus cycle is proving to be asdynamic and complicated as the marine nitrogen cycle,with a short residence time (Benitez-Nelson, 2000),multiple solid and dissolved phases (Benitez-Nelsonet al., 2004; Clark et al., 1999; Kolowith et al., 2001;Paytan et al., 2003; Sannigrahi and Ingall, 2005), andsusceptibility to redox conditions (Colman and Holland,2000; Ingall and Jahnke, 1994, 1997; McManus et al.,1997; VanCappellen and Ingall, 1996). The resultspresented above argue for a similar level of complexityat the micron and nanoscale levels. Although only a fewregions were intensively examined, it is evident from theresults in Fig. 5 that there exists a range of particulatephosphate morphologies and compositions. Potentially,

261J.A. Brandes et al. / Marine Chemistry 103 (2007) 250–265
P-NEXFS and X-ray elemental mapping can providevery detailed information on these particles. One paper(Hesterberg et al., 1999) contains data that implies thatthe shoulder width on Ca-Phosphates depends on thecoordination number. Hydroxyapatite (Ca5(PO4)3·2H2O)and octacalcium phosphate (Ca4H(PO4)3·2.5H2O) hadbroader and better separated shoulder features than didmonetite (CaHPO4) and brushite (CaH(PO4)·2H2O). Thishas not been rigorously examined using a suite of theappropriate standards; however, it is possible that even-tually the distribution of authigenic vs. detrital phosphateswithin sediments can be characterized using phosphorusX-ray fluorescence spectroscopy. The differences inshoulder separation and size, when compared to precursorphases, may allow one tomap out the very early formationstages of apatites within sediments, a long-standing pro-blem in phosphorus chemistry. Further information can beobtained by examining the positions and intensities ofsecondary peaks, and in the case of the study here the datasuggest that differences between hydroxy- and fluor-apatites can be detected within sediments. Although thenarrow range of spectral types observed here did notrequire spectral analyses such as peak deconvolution orprincipal component analysis (PCA) to identify species,such techniques will prove useful in more complexsystems.
Minerals other than Ca-Phosphates, although notobserved in this limited dataset, should theoretically beidentifiable by their spectra. In particular, Al, rare earthand the iron-phosphates may be important in certainenvironments (Hyacinthe and Van Cappellen, 2004;Rasmussen, 1996). In the case of Al-phosphates, a strongco-variance with Al fluorescence should be diagnostic.In the case of iron phosphates there are two possibleanalytical routes to take. The presence of a strong pre-edge feature in Fe(III) phosphates will be clearly mea-surable in P NEXFS spectra. In Fe(II) phosphates thepresence of a 2157-eV feature appears diagnostic. Inaddition, if confirmation for the presence of Fe isrequired, in-situ photo-oxidation using the X-ray beam,with He flow turned off, should generate Fe(III) rapidlyand generate a pre-edge feature at 2148 eV. Despite themuch discussed role of iron in sediment P cycling andsequestration (Hyacinthe and Van Cappellen, 2002;Slomp et al., 1996, 1998; Waychunas et al., 2005), atleast in this sample little evidence for a major role for Fe–P minerals was seen. One could argue that P–Fe inter-actions at this site occur primarily through absorption ofphosphate onto Fe-oxide phases; however, (Khare et al.,2005) found that P absorbed to both goethite andferrihydrite also produced distinctive P XANES pre-edge features. This does not preclude extensive interac-
tions between these elements at lower concentrations,and indeed the entire subject of P composition andelemental associations in the lower concentration re-gions of our samples remains for future studies. Acompanion instrument at the Advanced Photon Source,the X-ray microprobe at beamline 2-ID-D, has thecapability of mapping abundances of higher Z elementssuch as Fe and could provide definitive information onthe elemental abundances of nanoscale P mineraldomains.
Schultz and Schultz (2005) argued for a major role ofpolyphosphates in sediment P cycling, with bacteriallymediated polyphosphate sequestration and release res-ponsible for mediating the formation of phosphoritephases. Polyphosphates were found in our Effinghamoxic sediments using NMR techniques (Sannigrahi andIngall, 2005). Our results confirm those results and pointto a significant role for polyphosphates in marine oxicsediments. Although the cells generating polyphos-phates in the Shultz and Shultz study were quite large,over several hundred microns in size, the polyphosphateinclusions themselves were on the order of 1 μm in size.Some of our regions (Fig. 5E) are of this size, whileothers (Fig. 5A and C) are much larger and may repre-sent aggregations of inclusions or polyphosphatesgenerated by some other mechanism. They do not,however, appear to be surrounded by or in any wayphysically associated with phosphorite (apatite) forma-tion in these oxic sediments.
The mechanisms behind the formation of concen-trated polyphosphate (or, for that matter, any non-mineral phase) regions are unknown at this time. Onemight expect that mineral phases, such as apatites,would grow around nucleation sites and be heteroge-neously distributed, however organic and polyphos-phates would represent a potential energy source forbacteria and presumably would be quickly degraded. Itis possible, however, that bacteria colonies that storelarge amounts of polyphosphate are the sources of theseregions, and this would help explain the possible releaseof phosphate under anoxic conditions from polypho-sphate pools (Sannigrahi and Ingall, 2005; Schulz andSchulz, 2005). It is also been shown in other sedimen-tary systems that oxidized iron phosphate phases arepreserved in anoxic sediments in spite of presenting apotential energy source to bacteria (Hyacinthe and VanCappellen, 2004), thus it is clear that the assumption thatinorganic phosphate phases are rapidly brought intoequilibrium by bacterial activity is incorrect. More datafrom a variety of redox environments will be needed toexamine the potential fates of concentrated polypho-sphate phases.

262 J.A. Brandes et al. / Marine Chemistry 103 (2007) 250–265
Most studies of P speciation in sediments have indi-cated that significant amounts of P are sequestered inorganic phases or as loosely bound orthophosphate(Sannigrahi and Ingall, 2005). While we did not observeany regions of high P concentration that could becharacterized by P-NEXFS as organic or orthophos-phate salts, it is likely that these pools occur distributedin lower concentrations over the sample and thus weremissed by our brief survey of the higher concentrationregions. However, using P-NEXFS one can examineand characterize P at very low levels (b1 ppm). It ispossible to gain increased sensitivity in the fluorescencemaps by setting the incident X-ray energy to the peak ofthe P fluorescence energy region (2152 eV) rather thanwell above the peak at 2190 eV as we have done in thisstudy. However, doing so will require careful attentionto separating the elastically scattered component of theincident beam from the P fluorescence signal at appro-ximately in the spectra as this difference is not resolvedby the energy dispersive detector. We use a spectrumfitting routine MAPS (Vogt, 2003) that can be applied toeach pixel in a 2D map or to each step in an energy scanand this is essential for obtaining unambiguous signalsfrom the sample particularly for mapping low P con-centration regions.
Presently, the major limitations in the use of X-rayspectromicroscopy in marine and environmental studiesare 1) the lack of instruments, 2) few standard spectrallibraries, and 3) the lack of an accepted energy cali-bration for XANES peaks. The first issue will not beresolved until laboratory X-ray microprobes with energyranges in the 2–4 KeV range become available. Thismay optimistically take place within the next decade astunable free-electron laser sources capable of reachingthis region are developed (Jacobsen, 2000). The secondissue is one that we and other groups are working on.The third issue is simply one of attention to detail andwill become less significant as more research is done inthis and other fields. There is interest in P-minerals inthe natural and anthropogenically-disturbed cycles oftoxic and radioactive metals (Adler and Sibrell, 2003;Bea et al., 1992; Hettiarachchi et al., 2001). The moreexotic P-minerals, those with associations with rare-earth or high-Z elements, appear to have quite dis-tinctive spectra that will allow them to be clearlyidentified (Fig. 2). Thus there is the promise that a widerspectral library will allow for unambiguous quantifica-tion of more exotic phases. The use of deconvolutionsuch as principal component analysis will allow for thequantification of minor phases within samples. Similar-ly, the use of phosphonates, phosphenes, phosphides,and reduced organo-phosphates in the chemical synthe-
sis, biochemical, and herbicide industries provides thepotential for such exotic compounds to make their wayinto the environment, and having a library of organiccompound P NEXFS data will become useful in theseinstances. A recent report highlighting the importance ofmicroscale polyphosphate domains in blood clottingmechanisms (Smith et al., 2006) may provide impetus inexamining these compounds in other organisms andcells.
Our understanding of marine phosphorus cyclingmay benefit in several ways from the ability to examineP speciation at sub-micron scales. It has been estab-lished that certain phytoplankton species, notablydiatoms and the cyanobacteria Trichodesmium, can se-quester P as polyphosphate bodies within their cells(Romans et al., 1994; Rubin, 2003; Sambrotto andMace, 2000). Such pools of particulate P may present apossible mechanism for the transfer of “inorganic” P insinking organic matter (Benitez-Nelson et al., 2004) andmay explain shifts in C:P remineralization ratios indifferent water masses (Sambrotto and Mace, 2000).Examining sinking organic matter using P-NEXFS mayallow scientists to follow the distributions of polypho-sphates and other P phases within this material. Theformation mechanisms of calcium phosphates, especial-ly apatite precursor phases, cannot be studied easilyusing bulk extraction techniques (the first extractionstep tends to extract all precursor phases) and must beexamined using microprobe techniques. There is stillconsiderable debate over the mechanisms that drive theformation of phosphorite deposits (Filippelli, 1997;Follmi, 1996; Schulz and Schulz, 2005; Sokolov et al.,2001); examining modern analogs where phosphoritedeposition occurs today (Ruttenberg and Berner, 1993)at micro-scales can potentially provide a way of unra-veling this process by examining precursor phase distri-butions and associations with other elements. Finally,the still-unexplained observations of high proportions ofphosphonates in certain marine environments (Benitez-Nelson et al., 2004; Kolowith et al., 2001) need to beinvestigated in more detail with techniques that candetermine if such patterns are repeated at the nano-scale,possibly from bacterial sources or their remains. Pre-sently, P specific X-ray spectromicroscopy is the onlymethod available that can tackle this issue.
5. Conclusions
Revealing the complex nature of phosphate chemistrywithin environmental samples is an analytical challengerequiring new techniques and analytical approaches.Studies using sequential chemical extractions and

263J.A. Brandes et al. / Marine Chemistry 103 (2007) 250–265
nuclear magnetic resonance techniques have provided awealth of information on bulk scale sediment phos-phorus composition. X-ray fluorescence microscopy andspectroscopy can add to this database through its uniquecapability to investigate micro-and nano-scale patternsand composition of phosphates within marine sedimentsand other environmental samples. Examination of avariety of phosphate mineral, organic, and inorganicstandards found that each exhibited a unique spectral“fingerprint.” Such spectral features were more distinc-tive between mineral classes (i.e. Ca-phosphates vs. Fe-phosphates) but even within mineral classes subtle diffe-rences were observed. Organic phosphates had similarspectra, but the energy of secondary peaks appeared to beshifted upwards in polyphosphates, thus providing a wayto identify this class. Spectral differences were morepronounced between organic phosphate classes contain-ing reduced P and organic phosphates containing aro-matic carbon. Phosphonate primary peak edges wereshifted downwards by ∼1 eV from correspondingphosphate primary peaks. Each additional direct C–Pbond appeared to reduce the primary peak positionenergy by ∼1–2 eV, while addition of aromatic groupsproduced both pre- and post-primary peak features.
Fluorescence mapping of a natural marine sedimentsample revealed that phosphorus was distributed hetero-geneously throughout the sample. High P concentrationswere observed in domains ranging from b1 μm to∼6 μmin diameter. Overall, P was not correlated with Si, Al, Mg,or Na, although occasional correlations with Al and Mgwere observed in individual particles. Several high Pabundance regions were examined using nanoscale X-rayfluorescence spectroscopy and found to consist of eitherapatite minerals or polyphosphates. The results supportthe hypothesis that polyphosphates play an important rolein sediment phosphorus cycling.
Acknowledgements
This material is based upon work supported by theNational Science Foundation underGrantsOCE#0526178and 0526161. We wish to thank Paul Northrup atBrookhaven National Laboratory for sample assistanceand helpful discussions, Patricia Garlough at the Univer-sity of Texas for sample assistance, and Martin de Jongeand Lixin Fan for data analysis and instrumentalassistance, and Susan Ryan for draft editing of themanuscript. The use of the Advanced Photon Sourcewas supported by the US Department of Energy, Office ofScience, Office of Basic Energy Sciences, under ContractNo. W-31-109-ENG-38. Any opinions, findings, andconclusions or recommendations expressed in this
material are those of the author(s) and do not necessarilyreflect the views of the National Science Foundation.
Appendix A. Supplementary data
Supplementary data associated with this articlecan be found, in the online version, at doi:10.1016/j.marchem.2006.09.004.
References
Adler, P.R., Sibrell, P.L., 2003. Sequestration of phosphorus by acidmine drainage floc. Journal of Environmental Quality 32 (3),1122–1129.
Ahlgren, J., et al., 2005. Sediment depth attenuation of biogenicphosphorus compounds measured by P-31 NMR. EnvironmentalScience and Technology 39 (3), 867–872.
Anderson, L.D., Delaney, M.L., 2000. Sequential extraction andanalysis of phosphorus in marine sediments: streamlining ofthe SEDEX procedure. Limnology and Oceanography 45 (2),509–515.
Bauer, J.E., Ruttenberg, K.C., Wolgast, D.M., Monaghan, E., Schrope,M.K., 1996. Cross-flow filtration of dissolved and colloidalnitrogen and phosphorus in seawater: results from an intercom-parison study. Marine Chemistry 55 (1–2), 33–52.
Bea, F., Fershtater, G., Corretge, L.G., 1992. The geochemistry ofphosphorus in granite rocks and the effect of aluminum. Lithos 29(1–2), 43–56.
Beauchemin, S., et al., 2003. Speciation of phosphorus in phosphorus-enriched agricultural soils using X-ray absorption near-edgestructure spectroscopy and chemical fractionation. Journal ofEnvironmental Quality 32 (5), 1809–1819.
Benitez-Nelson, C.R., 2000. The biogeochemical cycling of phospho-rus in marine systems. Earth-Science Reviews 51 (1–4), 109–135.
Benitez-Nelson, C.R., O'Neill, L., Kolowith, L.C., Pellechia, P.,Thunell, R., 2004. Phosphonates and particulate organic phospho-rus cycling in an anoxic marine basin. Limnology and Oceanog-raphy 49 (5), 1593–1604.
Bertsch, P.M., Hunter, D.B., 2001. Applications of synchrotron-basedX-ray microprobes. Chemical Reviews 101 (6), 1809–1842.
Boese, J., Osanna, A., Jacobsen, C., Kirz, J., 1997. Carbon edgeXANES spectroscopy of amino acids and peptides. Journal ofElectron Spectroscopy and Related Phenomena 85, 9–15.
Brandes, J.A., et al., 2004. Examining marine particulate organicmatter at sub-micron scales using scanning transmission X-raymicroscopy (STXM) and carbon X-ray adsorption near edgespectroscopy (C-XANES). Marine Chemistry 92, 107–121.
Cade-Menun, B.J., Benitez-Nelson, C.R., Pellechia, P., Paytan, A.,2005. Refining P-31 nuclear magnetic resonance spectroscopy formarine particulate samples: storage conditions and extractionrecovery. Marine Chemistry 97 (3–4), 293–306.
Carlisle, J.A., et al., 1999. Soft-X-ray fluorescence studies of solids.Journal of Electron Spectroscopy and Related Phenomena 103,839–845.
Carman, R., Edlund, G., Damberg, C., 2000. Distribution of organic andinorganic phosphorus compounds in marine and lacustrine sedi-ments: a P-31 NMR study. Chemical Geology 163 (1–4), 101–114.
Clark, L.L., Ingall, E.D., Benner, R., 1999. Marine organic phosphoruscycling: novel insights from nuclear magnetic resonance. Amer-ican Journal of Science 299 (7–9), 724–737.

264 J.A. Brandes et al. / Marine Chemistry 103 (2007) 250–265
Colman, A.S., Holland, H.D., 2000. The global diagenetic flux ofphosphorus from marine sediments to the oceans: redox sensitivityand the control of atmospheric oxygen levels. SEPM SpecialPublication 66, 53–75.
Faul, K.L., Paytan, A., Delaney, M.L., 2005. Phosphorus distributionin sinking oceanic particulate matter. Marine Chemistry 97 (3–4),307–333.
Filippelli, G.M., 1997. Controls on phosphorus concentration andaccumulation in oceanic sediments. Marine Geology 139 (1–4),231–240.
Filippelli, G.M., et al., 2003. A sediment-nutrient-oxygen feedbackresponsible for productivity variations in Late Miocene sapropelsequences of the western Mediterranean. Palaeogeography,Palaeoclimatology, Palaeoecology 190, 335–348.
Flynn, G.J., Keller, L.P., Miller, M.A., Jacobsen, C., Wirick, S., 1998.Organic compounds associated with carbonate globules and rimsin the ALH84001 meteorite. Lunar and Planetary Science,Houston, TX, USA.
Follmi, K.B., 1996. The phosphorus cycle, phosphogenesis and marinephosphate-rich deposits. Earth-Science Reviews 40 (1–2),55–124.
Franke, R., Hormes, J., 1995. The P K-near edge absorption spectra ofphosphates. Physica B 216 (1–2), 85–95.
Franke, R., Chasse, T., Reinhold, J., Streubel, P., Szargan, R., 1997.Extended Fenske-Hall LCAO MO calculations of core-level shiftsin solid P compounds. Chemical Physics 220 (3), 299–310.
Hesterberg,D., Zhou,W.Q.,Hutchison,K.J.,Beauchemin, S., Sayers,D.E.,1999. XAFS study of adsorbed and mineral forms of phosphate.Journal of Synchrotron Radiation 6, 636–638.
Hettiarachchi, G.M., Pierzynski, G.M., Ransom, M.D., 2001. In situstabilization of soil lead using phosphorus. Journal of Environ-mental Quality 30 (4), 1214–1221.
Hirschler, A., Lucas, J., Hubert, J.C., 1990. Bacterial involvement inapatite genesis. FEMS Microbiology Ecology 73 (3), 211–220.
Hitchcock, A.P., Ishii, I., 1987. Carbon K-shell excitation-spectra oflinear and branched alkanes. Journal of Electron Spectroscopy andRelated Phenomena 42 (1), 11–26.
Hyacinthe, C., Van Cappellen, P., 2002. Composition and chemicalreactivity of an iron–phosphorus–manganese phase in a freshwaterestuarine sediment. Geochimica et Cosmochimica Acta 66 (15A),A349–A349.
Hyacinthe, C., Van Cappellen, P., 2004. An authigenic iron phosphatephase in estuarine sediments: composition, formation and chemicalreactivity. Marine Chemistry 91 (1–4), 227–251.
Ingall, E., Jahnke, R., 1994. Evidence for enhanced phosphorusregeneration from marine-sediments overlain by oxygen depletedwaters. Geochimica et Cosmochimica Acta 58 (11), 2571–2575.
Ingall, E., Jahnke, R., 1997. Influence of water-column anoxia on theelemental fractionation of carbon and phosphorus during sedimentdiagenesis. Marine Geology 139 (1–4), 219–229.
Ingall, E., Kolowith, L., Lyons, T., Hurtgen, M., 2005. Sedimentcarbon, nitrogen and phosphorus cycling in an anoxic fjord,Effingham Inlet, British Columbia. American Journal of Science305 (3), 240–258.
Jacobsen, C., 2000. X-ray microscopy using FELs: possibilities andchallenges. In: Edwards, G.S., Sutherland, J.C. (Eds.), BiomedicalApplications of Free-Electron Lasers. SPIE, San Jose, pp. 16–25.
Jacobsen, C., Wirick, S., Flynn, G., Zimba, C., 2000. Soft X-rayspectroscopy from image sequences with sub-100 nm spatialresolution. Journal of Microscopy-Oxford 197, 173–184.
Jacobsen, C., et al., 2003. Cluster analysis of soft X-ray spectro-microscopy data. Journal de Physique. IV 104, 623–626.
Karl, D.M., Bjorkman, K.M., 2001. Phosphorus cycle in seawater:dissolved and particulate pool inventories and selected phosphorusfluxes, methods in microbiology. Methods in Microbiology,vol. 30. Academic Press Inc., San Diego, pp. 239–270.
Khare, N., Hesterberg, D., Beauchemin, S., Wang, S.L., 2004. XANESdetermination of adsorbed phosphate distribution between ferrihy-drite and boehmite in mixtures. Soil Science Society of AmericaJournal 68 (2), 460–469.
Khare, N., Hesterberg, D., Martin, J.D., 2005. XANES investigation ofphosphate sorption in single and binary systems of iron andaluminum oxide minerals. Environmental Science and Technology39 (7), 2152–2160.
Kirz, J., 1991. X-ray microscopy. Synchrotron Radiation News 4 (2),17–22.
Kirz, J., et al., 1994. Soft X-ray microscopy-physical basis and recentdevelopments. Proceedings of the Fifth Asia-Pacific PhysicsConference, Singapore and River Edge, New Jersey, pp. 200–215.
Kolowith, L.C., Ingall, E.D., Benner, R., 2001. Composition andcycling of marine organic phosphorus. Limnology and Oceanog-raphy 46 (2), 309–320.
Konhauser, K.O., Fyfe,W.S., Schultzelam, S., Ferris, F.G., Beveridge, T.J.,1994. Iron phosphate precipitation by epilithic microbial biofilms inArctic Canada. Canadian Journal of Earth Sciences 31 (8), 1320–1324.
McManus, J., Berelson,W.M., Coale, K.H., Johnson,K.S., Kilgore, T.E.,1997. Phosphorus regeneration in continental margin sediments.Geochimica et Cosmochimica Acta 61 (14), 2891–2907.
McNulty, I., et al., 2003. The 2-ID-B intermediate-energy scanning X-ray microscope at the APS. Journal de Physique. IV 104, 11–15.
Myneni, S.C.B., 2002. Soft X-ray spectroscopy and spectromicro-scopy studies of organic molecules in the environment, applica-tions of synchrotron radiation in low-temperature geochemistryand environmental sciences. Reviews in Mineralogy and Geo-chemistry, 485–579.
Okude, N., et al., 1999. P and SK-edge XANES of transition-metalphosphates and sulfates. Journal of Electron Spectroscopy andRelated Phenomena 103, 607–610.
Paytan, A., Cade-Menun, B.J., McLaughlin, K., Faul, K.L., 2003.Selective phosphorus regeneration of sinking marine particles:evidence from P-31-NMR. Marine Chemistry 82 (1–2), 55–70.
Peak, D., Sims, J.T., Sparks, D.L., 2002. Solid-state speciation ofnatural and alum-amended poultry litter using XANES spectros-copy. Environmental Science and Technology 36 (20), 4253–4261.
Pratesi, G., Cipriani, C., Giuli, G., Birch, W.D., 2003. Santabarbaraite: anew amorphous phosphate mineral. European Journal ofMineralogy15 (1), 185–192.
Prochnow, L.I., Clemente, C.A., Dillard, E.F., Melfi, A., Kauwenbergh,S., 2001. Identification of: compounds present in single superpho-sphates produced from Brazilian phosphate rocks using SEM, EDX,and X-ray techniques. Soil Science 166 (5), 336–344.
Rasmussen, B., 1996. Early-diagenetic REE-phosphate minerals (flor-encite, gorceixite, crandallite, and xenotime) in marine sandstones: amajor sink for oceanic phosphorus. American Journal of Science 296(6), 601–632.
Roden, E.E., Edmonds, J.W., 1997. Phosphate mobilization in iron-rich anaerobic sediments: microbial Fe(III) oxide reductionversus iron-sulfide formation. Archiv fur Hydrobiologie 139 (3),347–378.
Romans, K.M., Carpenter, E.J., Bergman, B., 1994. Buoyancyregulation in the colonial diazotrophic cyanobacterium trichodes-mium tenue — ultrastructure and storage of carbohydrate,polyphosphate, and nitrogen. Journal of Phycology 30 (6),935–942.

265J.A. Brandes et al. / Marine Chemistry 103 (2007) 250–265
Rubin, S.I., 2003. Carbon and nutrient cycling in the upper water columnacross the Polar Frontal Zone and Antarctic Circumpolar Currentalong 170 degrees W. Global Biogeochemical Cycles 17 (3).
Ruttenberg, K.C., 1992. Development of a sequential extractionmethod for different forms of phosphorus in marine-sediments.Limnology and Oceanography 37 (7), 1460–1482.
Ruttenberg, K.C., Berner, R.A., 1993. Authigenic apatite formationand burial in sediments from non-upwelling, continental-margin environments. Geochimica et Cosmochimica Acta 57 (5),991–1007.
Sambrotto, R.N., Mace, B.J., 2000. Coupling of biological andphysical regimes across the Antarctic Polar Front as reflected bynitrogen production and recycling. Deep-Sea Research. Part 2.Topical Studies in Oceanography 47 (15–16), 3339–3367.
Sannigrahi, P., Ingall, E., 2005. Polyphosphates as a source of enhancedP fluxes in marine sediments overlain by anoxic waters: evidencefrom P-31 NMR. Geochemical Transactions 6 (3), 52–59.
Schenau, S.J., De Lange, G.J., 2001. Phosphorus regeneration vs.burial in sediments of the Arabian Sea. Marine Chemistry 75 (3),201–217.
Schulz, H.N., Schulz, H.D., 2005. Large sulfur bacteria and theformation of phosphorite. Science 307 (5708), 416–418.
Slomp, C.P., Epping, E.H.G., Helder, W., VanRaaphorst, W., 1996. Akey role for iron-bound phosphorus in authigenic apatite formationin North Atlantic continental platform sediments. Journal ofMarine Research 54 (6), 1179–1205.
Slomp, C.P., Malschaert, J.F.P., Van Raaphorst, W., 1998. The role ofadsorption in sediment-water exchange of phosphate in North Seacontinental margin sediments. Limnology and Oceanography 43(5), 832–846.
Slomp, C.P., Van Cappellen, P., 2004. Nutrient inputs to the coastalocean through submarine groundwater discharge: controls andpotential impact. Journal of Hydrology 295 (1–4), 64–86.
Smith, S.A., et al., 2006. Modulates blood coagulation andfibrinolysis. Proceedings of The National Academy of Sciencesof the United States of America, vol. 103(4), pp. 903–908.
Sokolov, A.S., Eganov, E.A., Krasnov, A.A., Shkol'nik, E.L., 2001.Problems of phosphorite genesis. Geologiya i Geofizika 42 (4),569–582.
Sutton, S.R., et al., 2002. Microfluorescence and microtomographyanalyses of heterogeneous earth and environmental materials,applications of synchrotron radiation in low-temperature geo-chemistry and environmental sciences. Reviews in Mineralogy andGeochemistry, 429–483.
Sutula, M., Bianchi, T.S., McKee, B.A., 2004. Effect of seasonalsediment storage in the lower Mississippi River on the flux ofreactive particulate phosphorus to the Gulf of Mexico. Limnologyand Oceanography 49 (6), 2223–2235.
Tamburini, F., Adatte, T., Follmi, K., Bernasconi, S.M., Steinmann, P.,2003. Investigating the history of East Asian monsoon and climateduring the last glacial–interglacial period (0–140000 years):mineralogy and geochemistry of ODP Sites 1143 and 1144, SouthChina Sea. Marine Geology 201 (1–3), 147–168.
Tropper, P., Recheis, A., Konzett, J., 2004. Pyrometamorphicformation of phosphorus-rich olivines in partially molten metape-litic gneisses from a prehistoric sacrificial burning site (Otz Valley,Tyrol, Austria). European Journal of Mineralogy 16 (4), 631–640.
Twining, B.S., et al., 2003. Quantifying trace elements in individualaquatic protist cells with a synchrotron X-ray fluorescencemicroprobe. Analytical Chemistry 75 (15), 3806–3816.
Twining, B.S., Baines, S.B., Fisher, N.S., Landry, M.R., 2004. Cellulariron contents of plankton during the Southern Ocean IronExperiment (SOFeX). Deep-Sea Research. Part 1. OceanographicResearch Papers 51 (12), 1827–1850.
VanCappellen, P., Ingall, E.D., 1996. Redox stabilization of theatmosphere and oceans by phosphorus-limited marine productivity.Science 271 (5248), 493–496.
Vogt, S., 2003. A set of software tools for analysis and visualization of3D X-ray fluorescence data sets. Journal de Physique. IV 104,635–638.
Waychunas, G.A., Kim, C.S., Banfield, J.F., 2005. Nanoparticulateiron oxide minerals in soils and sediments: unique properties andcontaminant scavenging mechanisms. Journal of NanoparticleResearch 7 (4–5), 409–433.
Related Documents