This content has been downloaded from IOPscience. Please scroll down to see the full text. Download details: IP Address: 134.157.146.58 This content was downloaded on 16/09/2014 at 20:53 Please note that terms and conditions apply. Characterization of graphene oxide reduced through chemical and biological processes View the table of contents for this issue, or go to the journal homepage for more 2013 J. Phys.: Conf. Ser. 433 012001 (http://iopscience.iop.org/1742-6596/433/1/012001) Home Search Collections Journals About Contact us My IOPscience

Welcome message from author
This document is posted to help you gain knowledge. Please leave a comment to let me know what you think about it! Share it to your friends and learn new things together.
Transcript

This content has been downloaded from IOPscience. Please scroll down to see the full text.
Download details:
IP Address: 134.157.146.58
This content was downloaded on 16/09/2014 at 20:53
Please note that terms and conditions apply.
Characterization of graphene oxide reduced through chemical and biological processes
View the table of contents for this issue, or go to the journal homepage for more
2013 J. Phys.: Conf. Ser. 433 012001
(http://iopscience.iop.org/1742-6596/433/1/012001)
Home Search Collections Journals About Contact us My IOPscience
Characterization of graphene oxide reduced through chemical and biological processes
M. Boutchich 1*, A. Jaffré 1, D. Alamarguy 1, J. Alvarez 1, A. Barras 2, Y. Tanizawa3, R. Tero3, H. Okada3, T. V. Thu3, J. P. Kleider 1 and A. Sandhu 3
1LGEP, CNRS UMR8507, SUPELEC, Univ Paris-Sud, UPMC Univ Paris 6, 11 rue Joliot-Curie, Plateau de Moulon, 91192 Gif-sur-Yvette Cedex, France 2Institut de Recherche Interdisciplinaire IRI, (USR CNRS 3078), Université Lille 1, Parc de la Haute Borne 50, av de Halley – BP 70478 59658 Villeneuve d'Ascq cedex, France 3Toyohashi Tech Graphene Research Group, Toyohashi University of Technology, 1-1 Hibarigaoka, Tempaku-cho, Toyohashi, Aichi 441-8580, Japan.
*corresponding author: [email protected]
Abstract. The study of new materials for transparent electrodes or new heterojunctions made of 2D materials combinations is a very active research topic. Challenges to overcome are the modulation of the optoelectronic properties of such materials to achieve competitive photovoltaic devices. In this work, graphene oxide was reduced into graphene through different chemical (hydrazine, ultraviolet photocatalysis) and biological (microorganisms) processes. We benchmarked the reduction efficiency by probing materials characteristics using various physical characterization techniques. X-ray photoelectron spectroscopy (XPS) analyses were carried out to observe the effectiveness of the reduction processes through the sp2/sp3 content. In addition, the homogeneity of the reduction is investigated on micrometer scale sample with micro Raman mapping and extraction of the ID/IG ratio. Conductive-probe atomic force microscopy (CP-AFM) was employed to investigate the longitudinal conductivity of the different samples. The results show that hydrazine based reduction remains the most efficient. However, the bacterial procedure demonstrated partial reconstruction of the carbon network and reduced the amount of oxygenated functional groups.
1. Introduction In order to improve the efficiency and reduce manufacturing costs, corporate and academic research groups are striving to develop new alternative technologies for photovoltaic (PV) devices. The emphasis is on both rigid as well as flexible PV devices opening new opportunities for different class of materials and technologies. 2D materials have attracted tremendous attention worldwide for all kind of nanoelectronic applications including PV. Indeed, graphene [1] is seen as a serious candidate to replace Indium Tin Oxide (ITO) as a transparent electrode [2] but manufacturing cost and optoelectronic properties remain difficult to control. In that respect, reduced graphene oxide (rGO) could possibly be an alternative thanks to its potentially low manufacturing cost [3]. Exfoliated graphene exhibits optoelectronic properties that could potentially outperform any alternative to ITO currently investigated. However, there is no technological pathway to exploit exfoliated graphene. On the other hand, reduced graphene oxide (rGO) is a potential alternative under investigation that could be mass produced at low cost [4]. Nevertheless to envision applications the optoelectronic properties of rGO and CVD-graphene still remain to be tailored to become competitive with current rare earth
The Irago Conference 2012 IOP PublishingJournal of Physics: Conference Series 433 (2013) 012001 doi:10.1088/1742-6596/433/1/012001
Published under licence by IOP Publishing Ltd 1
electrode materials. For that purpose, most of the research work on this topic is devoted to the optimization of the optoelectronic properties through either deposition techniques or reduction for CVD graphene and graphene oxide respectively [5, 6, and 7]. As opposed to pristine exfoliated graphene composed of exclusively sp²-hybridized carbon atoms, a GO sheet is hybrid network of carbon network sp² hybridized with neighboring carbon atoms or with carboxyl and carbonyl groups on the edges as well as sp3 hybridized carbon atoms that form covalent bonds with epoxyl and hydroxyl groups [8]. The latter renders the GO soluble in various solvents and allows the development of a low cost wafer-scale technology. However, to achieve an electrically active material, GO must be reduced and different reduction methods have emerged [9, 10, 11]. The reduction process partially restores a sp² network by removing a large fraction of these defects. Therefore, the structural disorder decreases and the carrier transport improves. Nevertheless, electrical properties such as conductivity and mobility are orders of magnitude below the ones attainable with exfoliated graphene [12]. Yet, these values allow the fabrication of low cost electronics that usually don’t require outmost performance. In this work, we investigate the impact of different reduction methods hydrazine, UV-photocatalysis and microorganisms through physical characterization techniques. Micro-Raman spectroscopy has been utilized to investigate the signatures and the structural disorder with the ID/IG ratio before and after reduction. X-ray photoelectron spectroscopy monitors the variation of the sp²/sp3 content as well as the oxygen/carbon atomic ratios. At last, conductive CP-AFM set-up was utilized to probe local electrical properties of rGO.
2. Experimental 2.1. General methods Graphite powder was obtained from SEC Carbon with grade reference SNO-30 [13]. 2D Raman scattering images and Raman spectra were collected at room temperature, using a WiTec alpha 300R confocal Raman microscope with a UHTS300 spectrometer and a DV401A CCD detector. The laser beam spot size was around 900nm. The films were illuminated with 100µW for 2s for each spectrum using a frequency doubled Nd:YAG Laser at 532 nm and Raman signal was collected in a backscattering geometry. A 600 grooves/mm diffraction grating was utilized enabling a spectral resolution of 3cm-1. The mapping was collected with 250 nm between spectra using a piezoelectric stage.
XPS measurements were performed using a Versaprobe PHI5000 spectrometer (Physical Electronics) operating at a base pressure of 1x10⁻⁷Pa. A monochromatic Al Kα X-ray source (1486.6 eV) was used at 15 kV with take-off angle of 45°. The analysed area of the sample was 50 µm in diameter. High resolution core level spectra were acquired with 23.5 eV pass energy, an energy step of 0.1 eV and a 50 ms dwell time. A dual beam charge neutralisation system consisting of low energy ions and electrons was utilized. The spectrometer was calibrated with Cu 2p3/2 and Cu LMM of clean copper at 932.7 eV and 918.7 eV respectively. The binding energy scale was calibrated by positioning the reference peak of Si 2p3/2 corresponding to SiO2 from the substrate to 103.5 eV. Spectroscopic data were processed by the PHI Multipak software, using a peak fitting routine with symmetrical Gaussian-Lorentzian functions. The Shirley background was subtracted from the spectra.
CP-AFM measurements were performed using a Digital Instruments Nanoscope IIIa Multimode AFM associated with the home-made conducting probe extension called “Resiscope” [14]. This setup allows us to apply a stable DC bias voltage (from -10 to +10 V with 0.01 V resolution) to the device and to measure the resulting current flowing through the tip as the sample surface is scanned in contact mode. Local resistance values can be measured in the range of 102-1012 Ω, which allows investigations of a variety of materials [15, 16] and devices [17, 18]. Reliable and understandable electrical measurements through CP-AFM setup require a well-characterized conductive tip. Depending on the experimental conditions, the AFM conductive tip should be the most suitable in terms of serial resistance that must be taken into account in the electrical analysis of rGO. PtIr-coated Si cantilever, with a spring constant of about 0.2 N/m, proves to be suitable for our experimental conditions, since
The Irago Conference 2012 IOP PublishingJournal of Physics: Conference Series 433 (2013) 012001 doi:10.1088/1742-6596/433/1/012001
2
measured resistance values are greater than the intrinsic tip resistance that was estimated around 300 Ω.
In this work, we investigated three different reduction methods: hydrazine, UV photocatalysis and bacterial. All samples were extracted from the initial GO source described in the experimental section. GO and rGOs samples were spin coated, on oxidized (300nm) silicon substrate following the procedure described by [19]. This yields to a dispersion of GO flakes ranging from monolayer to multilayer.
2.2. preparation of graphene oxide GO was synthesized by the modified Hummer’s method using natural graphite powder (SEC Carbon SNO-30). The powder was cleaned in a K2S2O8 and H2SO4 bath and subsequently oxidized in KMnO4 and H2SO4. After centrifuging, the resulting graphite oxide was exfoliated into GO by ultra-sonication (100 W, 30 min, 60 °C). At last, a GO aqueous dispersion was produced by centrifugation and dialysis to neutral pH.
2.3. reduction of graphene oxide by hydrazine rGOhydrazine was obtained by reduction with hydrazine hydrate [9]. A homogeneous GO aqueous suspension (1 mg.mL-1) was achieved by dispersing GO in distilled water using ultra sonication and 20 mL were loaded in a 50-mL round bottom flask. Hydrazine monohydrate (200 µL) was then added and the solution heated in an oil bath at 100 °C under a water-cooled condenser for 24 h over which the reduced GO gradually precipitated out as a black solid. This product was isolated by filtration on a 0.45 µm PVDF membrane, washed with water and methanol, and dried on the filter in oven (80 °C) during 24 h. The solid was subsequently dissolved in dimethylformamide (DMF) at 1 mg.mL-1.
2.4. reduction of graphene oxide by UV photocatalysis rGOUV was obtained from a homogeneous GO aqueous suspension (1 mg.mL-1) elaborated by dispersing GO in distilled water using ultra sonication. Aqueous graphene oxide solution (20 mL) in a quartz tube was irradiated for 6 h using a home-made photo reactor (λ = 254 nm) under direct irradiation. The dark insoluble graphene was isolated by filtration over Anodisc 0.22 μm, washed copiously with methanol and dried on the filter in oven (80 °C) during 2 minutes. The solid was dissolved in DMF solvent at 1 mg.mL-1. 2.5. reduction of graphene oxide by microorganisms rGObacterial was reduced using microorganism extracted from a river in Aichi prefecture (Japan) following multiple iterations of transfer and cultivation of river sediments in a medium containing salts and organic materials in anaerobic conditions. Silicon substrates covered with a suspension of GO flakes were immerged into the microbial culture in serum bottles and incubated in the culture at 28°C for 3 days under dark [19].
3. Results and analysis Figure 1(a) presents the µ-Raman spectra of the different samples acquired at constant power of 100µW and for 2s per spectrum. All samples exhibit a strong D-band (~1350 cm-1) and G-band (~1580 cm-1) usually assigned to structural disorder and the graphitized structure respectively. GO presents a dominant D peak arising from the attachment of functional groups such as hydroxyl, epoxy on the carbon skeleton. The overtone 2D-band does not vary significantly with respect to the reduction processes indicating that graphitization is rather poor. The D+D’ peak (~2940 cm-1) represents a defect activated combination of phonons with different momenta [20]. The large D-band and the attenuated 2D-band may be attributed to the small sp² domains subsequent to the oxidation process and ultra-sonication [3]. In order to assess the homogeneity of the material, µ-Raman mapping has been carried out on micro scale flakes. The mapping illustrates the variation of the peaks across the sample geometry. The full width half maximum (FWHM) of all samples is large indicating multi-layer
The Irago Conference 2012 IOP PublishingJournal of Physics: Conference Series 433 (2013) 012001 doi:10.1088/1742-6596/433/1/012001
3
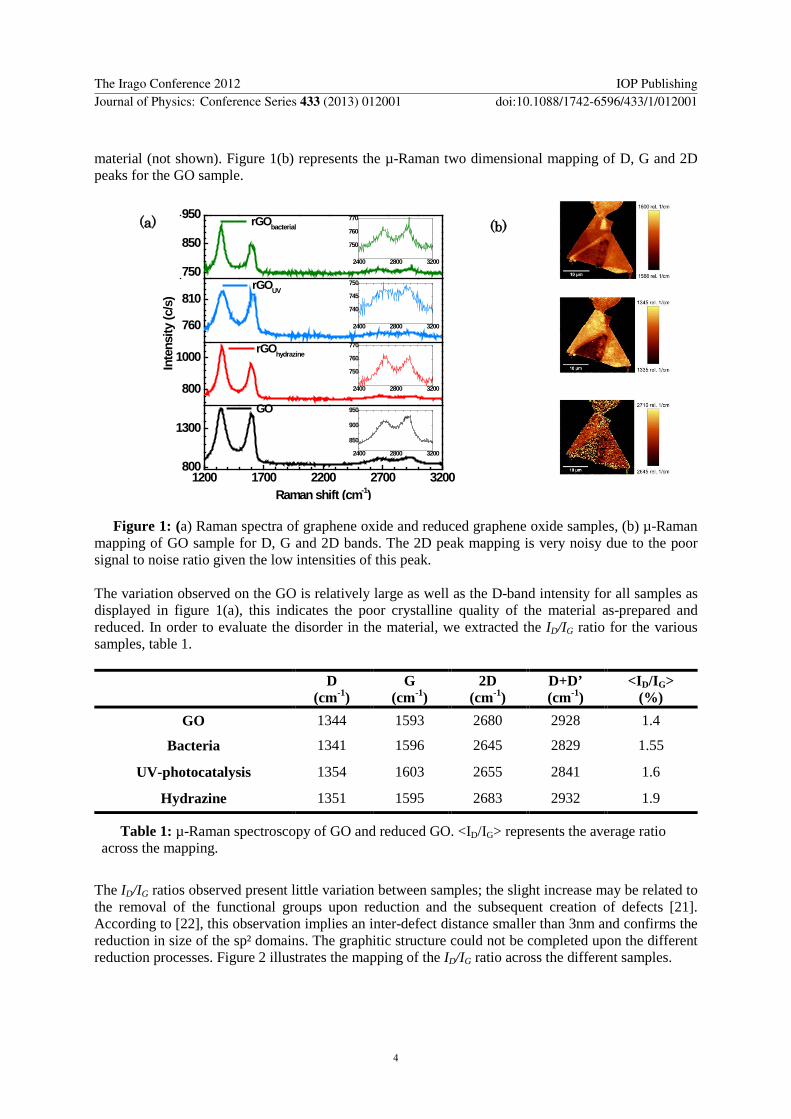
material (not shown). Figure 1(b) represents the µ-Raman two dimensional mapping of D, G and 2D peaks for the GO sample.
1200 1700 2200 2700 3200800
1300
800
1000
760
810
750
850
950
GO
Raman shift (cm-1)
rGOhydrazine
Inte
nsity
(c/s
)
rGOUV
rGObacterial
2400 2800 3200
750
760
770
2400 2800 3200
740
745
750
2400 2800 3200
750
760
770
2400 2800 3200
850
900
950
Figure 1: (a) Raman spectra of graphene oxide and reduced graphene oxide samples, (b) µ-Raman
mapping of GO sample for D, G and 2D bands. The 2D peak mapping is very noisy due to the poor signal to noise ratio given the low intensities of this peak. The variation observed on the GO is relatively large as well as the D-band intensity for all samples as displayed in figure 1(a), this indicates the poor crystalline quality of the material as-prepared and reduced. In order to evaluate the disorder in the material, we extracted the ID/IG ratio for the various samples, table 1.
D (cm-1)
G (cm-1)
2D (cm-1)
D+D’ (cm-1)
<ID/IG> (%)
GO 1344 1593 2680 2928 1.4
Bacteria 1341 1596 2645 2829 1.55
UV-photocatalysis 1354 1603 2655 2841 1.6
Hydrazine 1351 1595 2683 2932 1.9
Table 1: µ-Raman spectroscopy of GO and reduced GO. <ID/IG> represents the average ratio across the mapping.
The ID/IG ratios observed present little variation between samples; the slight increase may be related to the removal of the functional groups upon reduction and the subsequent creation of defects [21]. According to [22], this observation implies an inter-defect distance smaller than 3nm and confirms the reduction in size of the sp² domains. The graphitic structure could not be completed upon the different reduction processes. Figure 2 illustrates the mapping of the ID/IG ratio across the different samples.
(a) (b)
The Irago Conference 2012 IOP PublishingJournal of Physics: Conference Series 433 (2013) 012001 doi:10.1088/1742-6596/433/1/012001
4
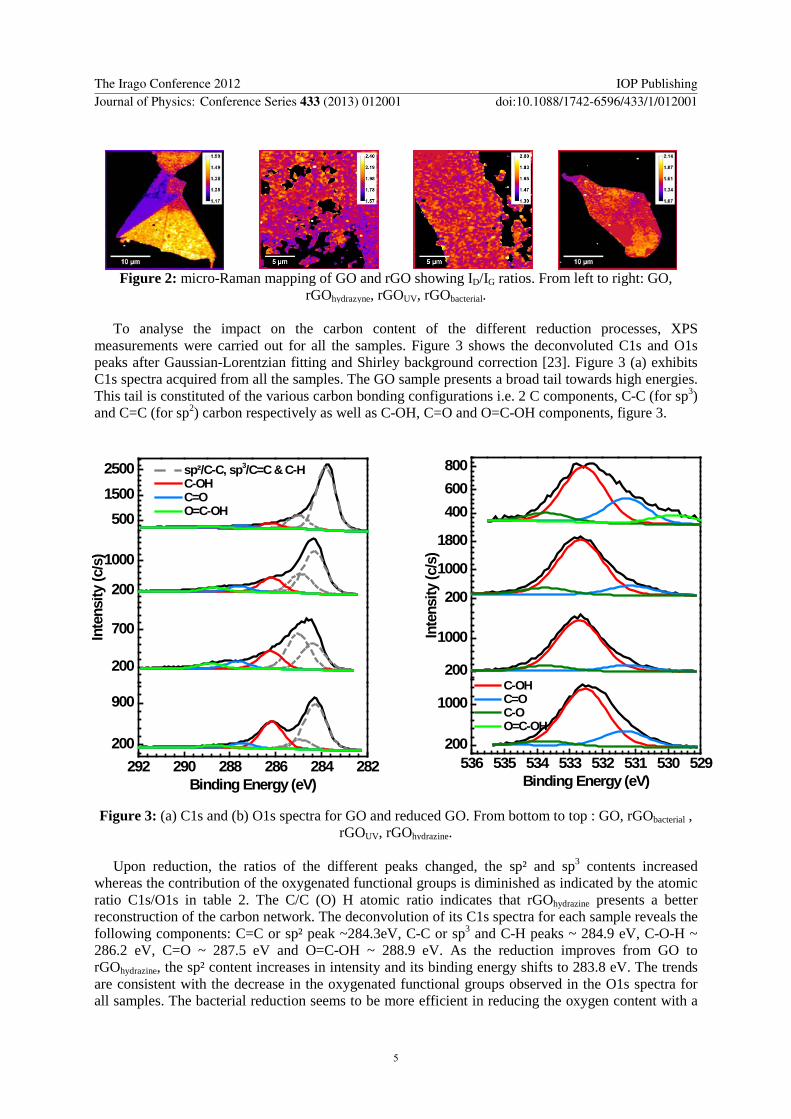
Figure 2: micro-Raman mapping of GO and rGO showing ID/IG ratios. From left to right: GO,
rGOhydrazyne, rGOUV, rGObacterial.
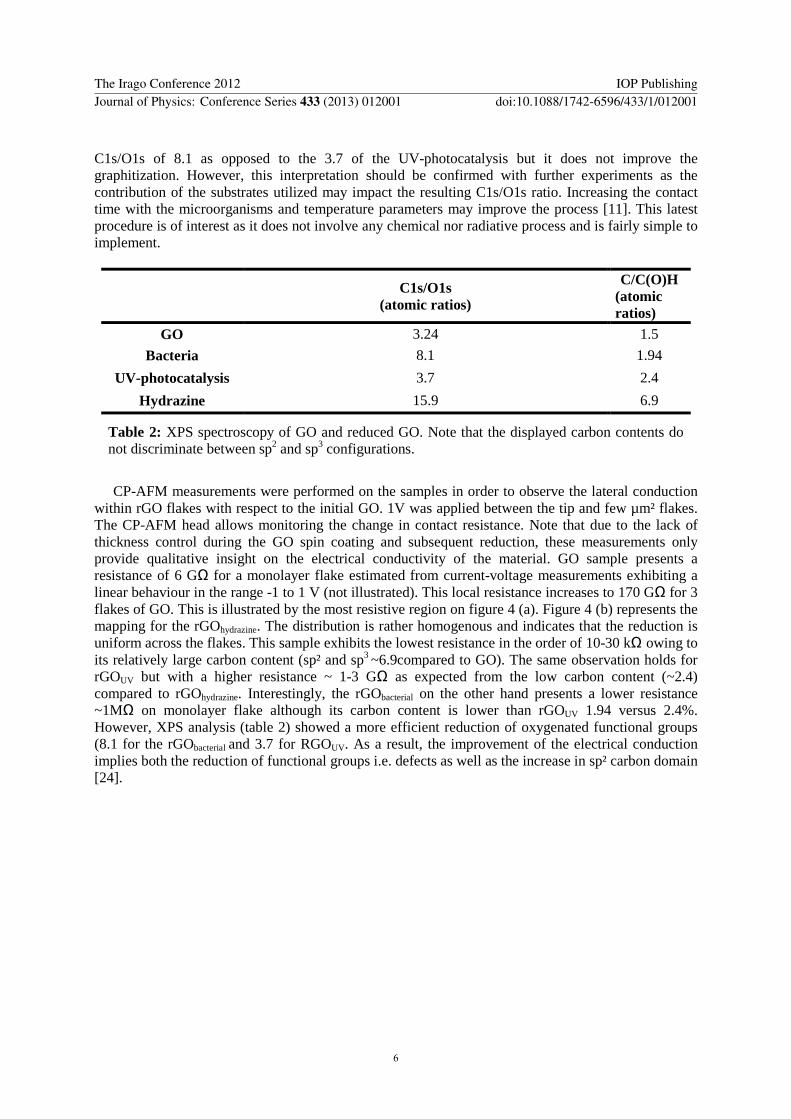
To analyse the impact on the carbon content of the different reduction processes, XPS measurements were carried out for all the samples. Figure 3 shows the deconvoluted C1s and O1s peaks after Gaussian-Lorentzian fitting and Shirley background correction [23]. Figure 3 (a) exhibits C1s spectra acquired from all the samples. The GO sample presents a broad tail towards high energies. This tail is constituted of the various carbon bonding configurations i.e. 2 C components, C-C (for sp3) and C=C (for sp2) carbon respectively as well as C-OH, C=O and O=C-OH components, figure 3.
292 290 288 286 284 282200
900
200
700
200
1000
sp²/C-C, sp3/C=C & C-H C-OH C=O O=C-OH500
15002500
Binding Energy (eV)
Inte
nsity
(c/s
)
536 535 534 533 532 531 530 529200
1000
200
1000
200
1000
1800
C-OH C=O C-O O=C-OH
400600800
Binding Energy (eV)
Inte
nsity
(c/s
)
Figure 3: (a) C1s and (b) O1s spectra for GO and reduced GO. From bottom to top : GO, rGObacterial ,
rGOUV, rGOhydrazine.
Upon reduction, the ratios of the different peaks changed, the sp² and sp3 contents increased whereas the contribution of the oxygenated functional groups is diminished as indicated by the atomic ratio C1s/O1s in table 2. The C/C (O) H atomic ratio indicates that rGOhydrazine presents a better reconstruction of the carbon network. The deconvolution of its C1s spectra for each sample reveals the following components: C=C or sp² peak ~284.3eV, C-C or sp3 and C-H peaks ~ 284.9 eV, C-O-H ~ 286.2 eV, C=O ~ 287.5 eV and O=C-OH ~ 288.9 eV. As the reduction improves from GO to rGOhydrazine, the sp² content increases in intensity and its binding energy shifts to 283.8 eV. The trends are consistent with the decrease in the oxygenated functional groups observed in the O1s spectra for all samples. The bacterial reduction seems to be more efficient in reducing the oxygen content with a
The Irago Conference 2012 IOP PublishingJournal of Physics: Conference Series 433 (2013) 012001 doi:10.1088/1742-6596/433/1/012001
5
C1s/O1s of 8.1 as opposed to the 3.7 of the UV-photocatalysis but it does not improve the graphitization. However, this interpretation should be confirmed with further experiments as the contribution of the substrates utilized may impact the resulting C1s/O1s ratio. Increasing the contact time with the microorganisms and temperature parameters may improve the process [11]. This latest procedure is of interest as it does not involve any chemical nor radiative process and is fairly simple to implement.
C1s/O1s (atomic ratios)
C/C(O)H (atomic ratios)
GO 3.24 1.5 Bacteria 8.1 1.94
UV-photocatalysis 3.7 2.4 Hydrazine 15.9 6.9
Table 2: XPS spectroscopy of GO and reduced GO. Note that the displayed carbon contents do not discriminate between sp2 and sp3 configurations.
CP-AFM measurements were performed on the samples in order to observe the lateral conduction
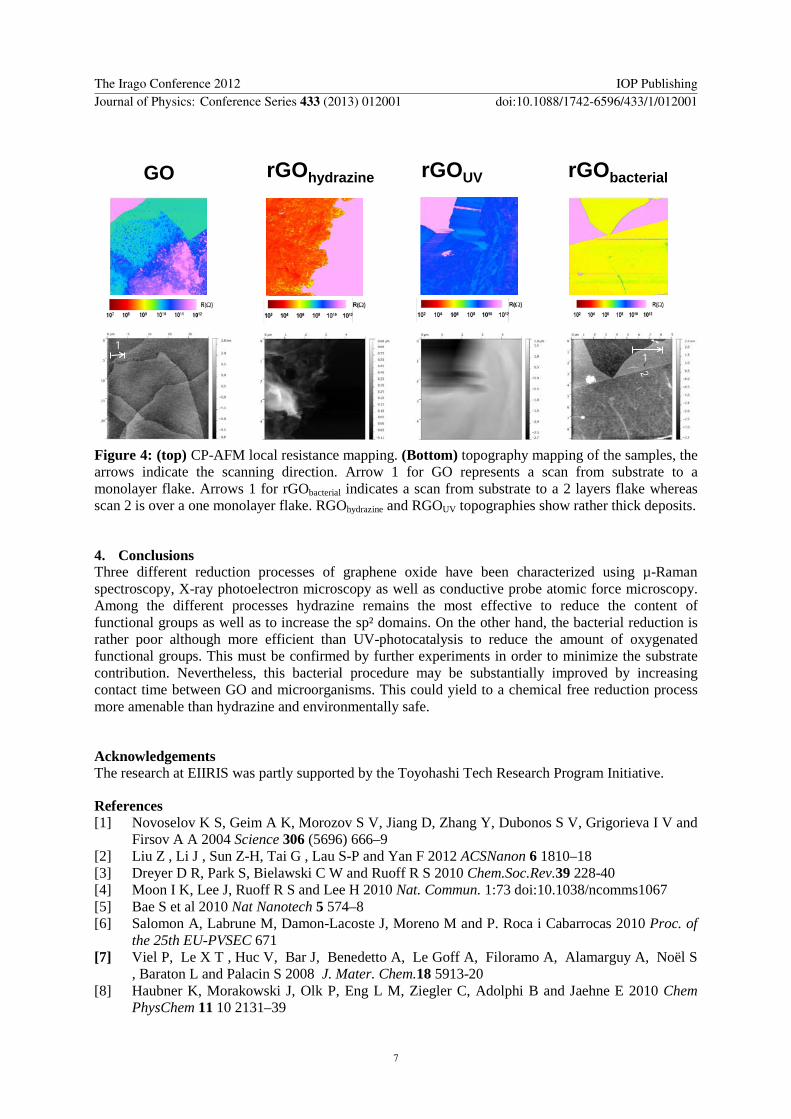
within rGO flakes with respect to the initial GO. 1V was applied between the tip and few µm² flakes. The CP-AFM head allows monitoring the change in contact resistance. Note that due to the lack of thickness control during the GO spin coating and subsequent reduction, these measurements only provide qualitative insight on the electrical conductivity of the material. GO sample presents a resistance of 6 GΩ for a monolayer flake estimated from current-voltage measurements exhibiting a linear behaviour in the range -1 to 1 V (not illustrated). This local resistance increases to 170 GΩ for 3 flakes of GO. This is illustrated by the most resistive region on figure 4 (a). Figure 4 (b) represents the mapping for the rGOhydrazine. The distribution is rather homogenous and indicates that the reduction is uniform across the flakes. This sample exhibits the lowest resistance in the order of 10-30 kΩ owing to its relatively large carbon content (sp² and sp3 ~6.9compared to GO). The same observation holds for rGOUV but with a higher resistance ~ 1-3 GΩ as expected from the low carbon content (~2.4) compared to rGOhydrazine. Interestingly, the rGObacterial on the other hand presents a lower resistance ~1MΩ on monolayer flake although its carbon content is lower than rGOUV 1.94 versus 2.4%. However, XPS analysis (table 2) showed a more efficient reduction of oxygenated functional groups (8.1 for the rGObacterial and 3.7 for RGOUV. As a result, the improvement of the electrical conduction implies both the reduction of functional groups i.e. defects as well as the increase in sp² carbon domain [24].
The Irago Conference 2012 IOP PublishingJournal of Physics: Conference Series 433 (2013) 012001 doi:10.1088/1742-6596/433/1/012001
6
GO rGOhydrazine rGOUV rGObacterial
1
1
1
Figure 4: (top) CP-AFM local resistance mapping. (Bottom) topography mapping of the samples, the arrows indicate the scanning direction. Arrow 1 for GO represents a scan from substrate to a monolayer flake. Arrows 1 for rGObacterial indicates a scan from substrate to a 2 layers flake whereas scan 2 is over a one monolayer flake. RGOhydrazine and RGOUV topographies show rather thick deposits.
4. Conclusions Three different reduction processes of graphene oxide have been characterized using µ-Raman spectroscopy, X-ray photoelectron microscopy as well as conductive probe atomic force microscopy. Among the different processes hydrazine remains the most effective to reduce the content of functional groups as well as to increase the sp² domains. On the other hand, the bacterial reduction is rather poor although more efficient than UV-photocatalysis to reduce the amount of oxygenated functional groups. This must be confirmed by further experiments in order to minimize the substrate contribution. Nevertheless, this bacterial procedure may be substantially improved by increasing contact time between GO and microorganisms. This could yield to a chemical free reduction process more amenable than hydrazine and environmentally safe.
Acknowledgements The research at EIIRIS was partly supported by the Toyohashi Tech Research Program Initiative.
References [1] Novoselov K S, Geim A K, Morozov S V, Jiang D, Zhang Y, Dubonos S V, Grigorieva I V and
Firsov A A 2004 Science 306 (5696) 666–9 [2] Liu Z , Li J , Sun Z-H, Tai G , Lau S-P and Yan F 2012 ACSNanon 6 1810–18 [3] Dreyer D R, Park S, Bielawski C W and Ruoff R S 2010 Chem.Soc.Rev.39 228-40 [4] Moon I K, Lee J, Ruoff R S and Lee H 2010 Nat. Commun. 1:73 doi:10.1038/ncomms1067 [5] Bae S et al 2010 Nat Nanotech 5 574–8 [6] Salomon A, Labrune M, Damon-Lacoste J, Moreno M and P. Roca i Cabarrocas 2010 Proc. of
the 25th EU-PVSEC 671 [7] Viel P, Le X T , Huc V, Bar J, Benedetto A, Le Goff A, Filoramo A, Alamarguy A, Noël S
, Baraton L and Palacin S 2008 J. Mater. Chem.18 5913-20 [8] Haubner K, Morakowski J, Olk P, Eng L M, Ziegler C, Adolphi B and Jaehne E 2010 Chem
PhysChem 11 10 2131–39
The Irago Conference 2012 IOP PublishingJournal of Physics: Conference Series 433 (2013) 012001 doi:10.1088/1742-6596/433/1/012001
7
[9] Stankovich S, Dikin D A, Piner R D, Kohlhaas K A, Kleinhammes A, Jia Y, Wu Y, Nguyen S T, Ruoff R S 2007 Carbon 45 1558–65
[10] Fellahi O, Das M R, Coffinier Y, Szunerits S, Hadjersi T, Maamache M and Rabah Boukherroub 2011 Nanoscale 3 4662–69
[11] Akhavan O and Ghaderi E 2012 Carbon 50 1853-60 [12] Eda G, Ball J, Mattevi C, Acik M, Artiglia L, Granozzi G et al 2011Mater Chem 21 30 11217-
23 [13] Ishikawa R, Bando M, Morimoto Y, Park S Y and Sandhu A 2010 Jpn. J. Appl. Phys.49
06GC02 [14] Houzé F, Meyer R, Schneegans O and Boyer L 1996 Appl Phys Lett 69 1975 [15] Kleider JP, Longeaud C, Brüggemann R and Houzé F 2001 Thin Solid Films 57 383 [16] Planès J, Houzé F, Chrétien P and Schneegans O 2001 Appl Phys Lett 79 2993 [17] Alvarez J, Ngo I, Gueunier-Farret ME, Kleider JP, Yu L, Roca i Cabarrocas P, Perraud S,
Rouvière E, Celle C, Mouchet C and Simonato JP 2011 Nanoscale Research Letters 6 110 [18] Alvarez J, Kleider JP, Houze F, Liao MY, Koide Y 2007 Diamond Relat Mater 16 1074 [19] Tanizawa Y, Okamto Y, Tsuzuki K, Nagao Y, Yoshida N, Tero R, Iwasa S, Hiraishi A, Suda A,
Takikawa H, Numano R, Okada H, Ishikawa R and Sandhu A 2012 JPCS 352 12011-015 [20] Ferrari A C, Meyer J C, Scardaci V, Casiraghi C, Lazzeri M, Mauri F, Pisanec S, Jiang D,
Novoselov K S, Roth S and Geim A K 2006 PRL 97 187401 [21] Eigler S, Dotzer C and Hirsch A 2012 Carbon 50 3666-73 [22] Cançado L G, Jorio A, Martins Ferreira E H, Stavale F, Achete C A, Capaz R B, Moutinho M V
O, Lombardo A, Kulmala T S and Ferrari A C 2011 Nano Lett 11 3190-96 [23] S.Kaciullis 2012, Surf.Interface Anal. 44 1155-61 [24] Yang D, Velamakanni A, Bozoklu G L, Park S, Stoller M, Piner R D, Stankovich S, Jung I,
Field D A, Ventrice Jr C A, Ruoff R S 2009 Carbon 47 145-152
The Irago Conference 2012 IOP PublishingJournal of Physics: Conference Series 433 (2013) 012001 doi:10.1088/1742-6596/433/1/012001
8
Related Documents