Characterization of genetic resistance to Coffee Berry Disease (Colletotrichum kahawae Waller and Bridge) in Arabica coffee (Coffea arabica L.) that is introgressed from Coffea canephora Pierre. BY GICHURU, Elijah Kathurima BSc (Agriculture, UoN), MSc (Plant Pathology, UoN) THIS THESIS IS SUBMITTED IN FULL FULFILMENT OF THE REQUIREMENTS FOR THE DEGREE OF DOCTOR OF PHILOSOPHY IN PLANT PATHOLOGY FACULTY OF AGRICULTURE COLLEGE OF AGRICULTURE AND VETERINARY SCIENCES UNIVERSITY OF NAIROBI. 2007 ^™ver« y Of NAIROBI Utxar,

Welcome message from author
This document is posted to help you gain knowledge. Please leave a comment to let me know what you think about it! Share it to your friends and learn new things together.
Transcript

Characterization of genetic resistance to Coffee Berry
Disease (Colletotrichum kahawae Waller and Bridge)
in Arabica coffee (Coffea arabica L.) that is
introgressed from Coffea canephora Pierre.
BY
GICHURU, Elijah KathurimaBSc (Agriculture, UoN), MSc (Plant Pathology, UoN)
THIS THESIS IS SUBM ITTED IN FULL FULFILM ENT OF THE REQUIREM ENTS FOR THE DEGREE OF
DOCTOR OF PHILOSOPHY IN
PLANT PATHOLOGY
FACULTY OF AGRICULTURECOLLEGE OF AGRICULTURE AND VETERINARY SCIENCES
UNIVERSITY OF NAIROBI.
2007
^™ver« y Of NAIROBI Utxar,
DECLARATION BY THE CANDIDATE
I declare that this is my original work and it has not been submitted in any other University for award o f a degree.
GICHURU, Elijah KathurimaDepartment of Plant Science and Crop Protection Faculty of AgricultureCollege of Agriculture and Veterinary Sciences University of Nairobi P O Box 29053 Nairobi
This thesis is submitted for examination with our approval as university supervisors
2.
Signed........... .'TTrrrrrr!T..TT7.......,'TT.. .............. DateProf. Eunice W. MUTITU Associate Professor (Plant Pathology)Department of plant Science and Crop Protection University o f Nairobi PO Box 29053 Nairobi
\
v / £\l/jSignedDr. Eliud C. K. NGUpI . .Senior Lecturer (Mo|ecularj3g*4tieyj Department of plant Science and Crop Protection University of Nairobi P 0 Box 29053 Nairobi
Date
3. Signed .... .V:.. .V^rSY. Y^(V}rr?Y7^................ DateProf. Philippe LASHERMESUMR RPB (Resistance des Plantes aux Bioagresseurs)Equipe DIVersite et Amelioration (DIVA)GeneTrop,Institut de Recherche pour le Developpement (IRD), BP 64501F-34394, Montpellier Cedex 5 France,
i

DEDICATION
*! cittceneiy dedicate tdia t/tecia ta my dean fam ily: Cecilia,, 'Kanca* and TZetoi* TOcdey
ii

ACKNOWLEDGEMENTS
Languages consist o f words with very polymorphic meanings (phenotypes). It is piteous that at times, this polymorphism may not be perfectly linked to the intended meaning. Consequently, 1 feel that whatever words I will use, I will not be able to deliver my genuine feelings o f gratitude. I therefore propose a 5 centimorgan linkage to my genuine feelings. If I was to disregard traditions, 1 would have made this section a full chapter with even a materials and methods section. However. I have to compress it and therefore 1 apologise in advance to any o f you whom I may leave out. You are there in my heart and receive my appreciation and God bless you.
1 am deeply indebted to my supervisors in 1RD (Montpelier, France), University of Nairobi (Kenya) and CRF (Ruiru, Kenya). I imagined myself to be a child with multiple parents who enabled me to smoothly change from one institution to another like seasons of the year. Kindly. Prof Philippe Lashermes and Mrs Marie-Christine Combes o f IRD, Montpellier, receive my heartfelt appreciation. You were there for me not only academically, but also socially and morally. I really felt at home away from home. Equally, Prof Eunice W Mutitu and Dr. Eliud C K Ngugi of the University of Nairobi, my cup of praises for you is overflowing. I can only equate you to parents in a struggle for the best for their child. To Dr Charles O Agwanda, you are a real brother. Thanks for introducing and encouraging me into the world of molecular breeding. I appreciate your foundations on which I trod.
1 compassionately register my gratitude to the IRD fellowships programme, which was the main financier of this study. Subsequently, I thank both the Academic and Administrative staff of IRD at Paris, Nairobi and most profoundly in Montpellier especially in the former UMR Resistance des plantes led by Dr Michel Nicole. Thank one, thanks all. Through the Director of Research, CRF, 1 sincerely thank the CRF Board o f Directors, CRF management and by extension the Kenyan coffee farmers for financial, material and moral support during this study. As it is in the jungle, the most ferocious feeding is in meagre times, but that is also when true families stand together. 1 truly feel that I am a member o f the family. 1 am also grateful to EU for financial assistance through the CBDRESIST project (Contract No. ICA4-CT-2001-10008).
To my dear friends, I salute you all. At coffee breeding unit o f CRF, I sincerely thank Dr Chrispine O Omondi and his team led by Messrs M W King’oro, Samwel M Njeruh, John M Ithiru and Peter N Goco. In Plant Pathology Section, I received wonderful support from Mrs Jane W Njogu, Miss Charity W Ngugi, Messrs James M Chege, David M Wambua and other associates. I cannot fail to say that 1 am grateful to many more CRF staff in both research and support sections (especially accounts and transport sections). At IRD, Montpellier, we lived as a networked international community that 1 may describe as “International Alliance o f Research on Tropical Agriculture”. Obviously, it is not possible to list all the names, which would be akin to a list of participants of a congress! However, let me mention a few from the coffee family: - Ms Laetitia Mahe, Ms Anne-Claire Lecouls, Ms Anne-Sophie Petitot, Mr Alpizar Edgardo. Dr Juan-Carlos Hererra and Dr Leandro Diniz. Your support was a vital ingredient in my work. To the French communities with whom I interacted, 1 cannot lack a few words of gratitude out of the modest French you taught me, especially with the support of Fondation nationale Alfred Kastler. “ Je vous remercie fortement pour tout. Merci beaucoup a tous".
Just as a hunter or warrior setting out requires home support, so was I. To my dear wife Cecilia: your support was overwhelming both in our family, friendship and professional capacities. You are surely a pillar that is resistant from all sides. Whenever I reflected on the situation, I was always scared of the thought that “suppose we were in the opposite sides?" To our children.
in

Karean and Kelvin Wesley, thanks for your kindness, understanding and prayers during my absence and stressing periods. I wish to thank my relatives and in-laws for their support to me and my family during the trying period of this study. I passionately remember our late grandma, Cucu Wairimu wa Kamotho, who despite her enviable age o f about a dozen decades, always preserved a sweet banana in her farm to await me after every trip from France. What a wonderful ritual trip 1 always made to see her and rediscover true tropical taste after a winter in Montpellier!!
I kindly wish to extend my thanks to the examiners appointed by the University for their useful suggestions and comments that helped to enrich this thesis
Finally but most significantly, I thank Almighty God who is “a master-planned. We were all His instruments in this work to deliver what, when, where and how He wished. I pray that He will never forsake us as individuals, institutions and industry.
IV
LIST OF CONTENTSDECLARATION iDEDICATION iiACKNOWLEDGEMENTS iiiLIST OF CONTENTS VLIST OF TABLES viiiLIST OF FIGURES ixLIST OF PLATES XLIST OF APPENDICES xiiLIST OF MAJOR ABBREVIATIONS xiiiABSTRACT xiv
CHAPTER 1. INTRODUCTION 11.1. Coffee production and its constraints in Kenya 11.2 Coffee berry disease (CBD) 31.2.1 The pathogen 31.2.2 Symptoms of the disease 41.2.2.1 Berries 41.2.2.2 Seedling hypocotyls and shoot tips 51.2.2.3 Flowers 61.2.2.4 Leaves 61.3 Sources and breeding for CBD resistance 71.4 Selection for CBD resistance 11CHAPTER 2. JUSTIFCATION 14CHAPTER 3. OBJECTIVES 18CHAPTER 4. LITERATURE REVIEW 194.1 Molecular markers 194.1.1 Restriction Fragment Length Polymorphisms 214.1.2 Cleavable Amplified Polymorphic Sequences 2 2
4.1.3 Randomly Amplified Polymorphic DNAs 224.1.4 Sequence Characterised Amplified Regions 234.1.5 Simple Sequence Repeats and Inter-Simple Sequence Repeats 234.1.6 Amplified Fragment Length Polymorphism 254.2 C. arabica genome 274.3 Genetic variability and introgression into Coffea arabica 294.4 Molecular markers of disease resistance in Arabica coffee 324.5 Diversity of microsatellites and SCARs related to genomic
introgression from C. canephora into C. arabica 334.6 Major commercial cultivars o f C. arabica in Kenya 364.7 Coffee varieties used in this study 36CHAPTER 5. SECTIONS ON SPECIFIC STUDY AREAS 39SECTION 5.1. IDENTIFICATION OF C. canephora CHROMOSOMAL
FRAGMENTS PRESENT IN LINES OF CV CATIMOR IN KENYA AND POTENTIAL MARKERS FOR CBDRESISTANCE 39
5.1.1 INTRODUCTION 395.1.2 OBJECTIVE 425.1.3 MATERIALS AND METHODS 425.1.3.1 Plant genotypes 425.1.3.2 Sampling and treatment of leaves 435.1.3.2.1 Mature plants 43
v

5.1.3.2.2 Seedlings 445.1.3.3 Extraction of genomic DNA 445.1.3.4 AFLP analysis 455.1.3.4.1 Digestion of DNA 455.1.3.4.2 Ligation 465.1.3.4.3 Pre-amplification 465.1.3.4.4 Labelling o f EcoK\ primers 475.1.3.4.5 Final amplification 475.1.3.4.6 Electrophoresis and revelation of radiographs 485.1.3.4.7 Primer combinations and samples analysed 495.1.3.4.8 Data scoring and identification of introgressed fragments 495.1.3.5 Identification of C. comphora linkage groups (chromosomes)
associated with the introgression fragments 505.1.3.5.1 Extraction of DNA from AFLP bands 505.1.3.5.2 Cloning of the extracted DNA 525.1.3.5.3 Analysis of SCARs derived from the introgressed fragments 535.1.3.6 Analysis of RAPD markers o f CBD resistance 555.1.4 RESULTS 575.1.4.1 AFLP analysis 575.1.4.2 Mapping of the C. canephora chromosomal fragments introgressed
into C. arabica onto Coffee genome 625.1.4.3 Analysis of RAPD markers o f CBD resistance 685.1.5 DISCUSSION 71SECTION 5.2 ESTABLISHMENT OF POPULATIONS FOR MAPPING
RESISTANCE TO CBD 815.2.1 INTRODUCTION 815.2.2 OBJECTIVE 835.2.3 MATERIALS AND METHODS 845.2.3.1 Establishment of seedlings 845.2.3.2 Verification of segregation for CBD resistance 865.2.3.3 Molecular verification of segregation 875.2.4 RESULTS 885.2.5 DISCUSSION 93SECTION 5.3 DEVELOPMENT AND USE OF YOUNG SEEDLINGS
INOCULATION METHOD TO SCREEN COFFEEPLANTS FOR RESISTANCE TO CBD 96
5.3.1 INTRODUCTION 965.3.2 OBJECTIVE 985.3.3 MATERIALS AND METHODS 995.3.3.1 Preliminary testing of young seedlings inoculation method 995.3.3.2 Field inoculation tests 995.3.3.3 Screening of F2 populations by the young seedlings inoculation method 1005.3.4 RESULTS 1015.3.4.1 Preliminary test of young seedlings inoculation method 1015.3.4.2 Inoculation of attached coffee berries in the field 1025.3.4.3 Screening of the F2 mapping populations by young seedlings
inoculation method 1045.3.5 DISCUSSION 109
VI

SECTION 5.4 IDENTIFICATION AND MAPPING DNA MARKERS LINKED TO CBD RESISTANCE AND POSSIBLE CANDIDATE MARKERS FOR CLR ESISTANCE 117
5.4.1 INTRODUCTION 1175.4.2 OBJECTIVES 1185.4.3 MATERIALS AND METHODS 1195.4.3.1 Plant materials and DNA extraction 1195.4.3.2 Identification of molecular markers of CBD resistance 1195.4.3.2.1 Identification of microsatellite markers of CBD resistance 1195.4.3.2.2 AFLP analysis of the chromosomal fragment conferring resistance
to CBD 1205.4.3.2.3 Mapping Sat 235 1215.4.3.3 Analysis of SCARs derived from AFLP markers o f the chromosomal
fragment conferring resistance to CBD 1225.4.3.4 Determination of association between RAPD M20g3o SCAR and
identified markers o f CBD resistance 1235.4.3.5 Survey of markers o f CBD resistance in various HDT derivatives 1245.4.4 RESULTS 1255.4.4.1 Analysis of microsatellites 1255.4.4.2 Analysis of AFLPs 1305.4.4.3 Mapping and analysis of Sat 235 data 1335.4.4.4 Analysis of SCARs derived from AFLP markers o f T2 fragment 1365.4.4.5 Analysis of the SCAR derived from RAPDg30 marker of CBD
resistance (M20s3o) 1395.4.4.6 Survey of markers o f CBD resistance in diverse HDT derivatives 1415.4.5 DISCUSSION 143SECTION 5.5 VARIABILITY OF MICROSATELLITES AND SCARS
RELATED TO GENOMIC INTROGRESSION FROMC. canephura INTO C. arabica 156
5.5.1 INTRODUCTION 1565.5.2 OBJECTIVE 1595.5.3 MATERIALS AND METHODS 1595.5.4 RESULTS 1635.5.5 DISCUSSION 170CHAPTER 6. GENERAL DISCUSSION 1747. CONCLUSIONS AND RECOMMENDATIONS 1818. REFERENCES 1839. APPENDICES 199
vii

LIST OFTablet.
Table 2.
Table 3.
Table 4.
Table 5.
Table 6.
Table 7.
Table 8.
Table 9.
Table 10.
Table 11.
Table 12.
TABLESSummary of AFLP primer combinations tested on accessions of C. arabica cvs Catimor, Sarchimor and SL28 and BCi F2 populations derived from the two cultivars and characteristics of polymorphic bands generatedScores o f polymorphic AFLP bands between two trees of cv Catimor (lines 88 and 127), two trees of cv SL28 and three BC1 F2 populations of the two cvs ((SL28 x Catimor) x Catimor)) Scores of polymorphic AFLP bands in two trees o f cv Catimor (lines 88 andl27), two trees o f cv SL28 and 8 trees of BCi F| progenies involving different cv Catimor lines ((SL28 x Catimor) x Catimor))A summary of characteristics of SCARs developed from AFLP markers of C. canephora chromosomal fragments introgressed
into C. arabicaDisease infection scores of one year old coffee seedlings of two F2 populations (D and E) from crosses between cvs SL28 and Catimor. five weeks after inoculation with C. kahawae Summary of the occurrence o f two microsatellite markers of two C. canephora chromosomal fragments [T2 (A) and T3 (B)] that are introgressed into C. arabica, as analysed in two F2 populations between cv SL28 and two lines of cv Catimor i.e. line 127 (Population D) and line 88 (Population E)Percent incidence of markers of three C. canephora chromosomal fragments (T2, T3 and T4) in two F2 populations (Catimor x SL28) screened by inoculation of seedling hypocotyls with C. kahawae (Group 1) and in an un-screened sub-population (Group 2)Ordered AFLP markers and a microsatellite (Sat 207) of the C. canephora chromosomal fragment (T2) and one marker each for fragments T3 and T4 introgressed into C. arabica analysed on selected F? plants obtained from crossings of cv Catimor lines 88 and 127 to cv SL28 (Populations E and D)Percent occurrence of two introgressed microsatellite marker alleles for CBD resistance in seedlings screened for resistance by young seedlings inoculation method (Group 2). The data is shown before and after correction by exclusion (not transfer) of seedlings which were considered as misclassified by screening of young seedlings.The corrected values are in parenthesisOccurrence of introgressed alleles of Sat 207, Sat 235 and Sat 11 in different HDT derivatives screened for CBD resistance by hypocotyls inoculation method or observed in the field for CBD and CLR infectionAccessions of C. arabica, C. canephora, C. congensis, C. eugenioides and C. anthonyi analysed with microsatellite markers and SCARs derived from AFLP markers for chromosomal fragments introgressed from C. canephora into C. arabica Tabulation of the number of alleles amplified and shared between in accessions of five Coffea species and HDT derivatives using microsatellites and SCAR markers of genetic introgression from C. canephora into C. arabica
60
58
61
63
108
129
130
132
136
142
161
167
VIII

LIST OF FIGURESFigure 1. Alignment of sequences of AFLP bands aligned using CLUSTAL W
(1.82) multiple sequence alignment programme. Sequences D4, D5 and W3 are from AFLP bands of samples from F2generation o f the T5296 x ET6 while sequences C l, C4, XI and X3 were from samples of BCi F2 ((Catimor x (Catimor x SL28)) 64
Figure 2. Alignment of sequences obtained by direct sequencing (withoutcloning) of PCR products from four C. canephora DH plants amplified with SCAR primers D4 designed from an AFLP maker of fragment T3: (a) CLUSTAL W (1.82) multiple sequence alignment of the sequences and (b) comparison of two of the sequences with the full length sequence of AFLP band cloned fromC. arabica and used to design the primers 67
Figure 3 Alignment (CLUSTAL W (1.82)) of sequences amplified from three C. canephora double haploid plants (accessions 506, 507and 508) and the original sequence (N 18-Inverse) of the RAPD band (RAPD marker N 18250) that was used to design SCAR primers 70
Figure 4. Schematic diagram of the plan adopted to establish and verifyresistance to CBD in the F2 populations obtained by selfing two F| plants already available in the field 85
Figure 5. Bar graph presentation of infection scores of seedling hypocotyls of the two replicates of F2 populations of after inoculation with C. kahawae 91
Figure 6. Genetic linkage map of the C. canephora chromosomal fragment T2introgressed into C. arabica genome 135
Figure 7. Diagrammatic presentation o f identities of microsatellites those were polymorphic between two CBD and CLR susceptible cultivars (SL8 and Caturra) and two donor varieties of resistance (Rume Sudan) and tolerance (K7) for the two diseases 169
IX

LIST OF PLATESPlate 1. Symptoms of C. kahawae infection on susceptible green coffee
berries in the field. (A) Active CBD lesions and dried young berries on susceptible cv SL28. (B) infection of cv SL28 showing conidial masses on green berries, blackened berries and stalks from which infected berries have detached (C) infection on cv Caturra showing dry brown mummified berries 5
Plate 2. Infection of C. kahawae in coffee hypocotyls and shoot tips growing under a canopy of a cv SL28 tree of in the field: (A) symptoms on a seedling hypocotyl; (B) symptoms on a young sprout growing on the stump 6
Plate 3. Seedling hypocotyls showing symptoms of infection by C. kahawae on the fifth week after inoculation. The phenotypic categories comprising of highly resistant seedlings (Classes 1-4), moderately resistant (Classes 5-7), moderately susceptible (Classes 8-10) and highly susceptible (Classes 11-12) as categorised in this study 13
Plate 4. Radiographs of PCR products generated by SCAR primers designed from sequences of AFLP markers of the C. canephora chromosomal fragments introgressed into C. arabica genome 66
Plate 5. Radiographs of banding patterns of SCAR products amplified withprimers designed from RAPD markers of CBD resistance identified by Agwanda et al. (1997) (A) N I8250 and (B) M2083O 69
Plate 6. Patterns obtained after digestion of SCAR products amplified from four C. canephora DH plants (510, 511, 512 and 513) with primers designed from the sequence o f a RAPD marker for CBD resistance N I8250 (Agwanda et al., 1997) with the restriction enzyme Bfa I.Panel A shows the pattern before digestion and panel B after digestion.M is a 100 base pair ladder 71
Plate 7. Some phenotypic traits that were observed to segregate in the two F2 populations of cv Catimor x cv SL28; (A) resistance to CBD by hypocotyls inoculation test and (B, C) colour of young tips and vigour of young shoot tips 90
Plate 8. Screening of the potential mapping populations D and E using three microsatellites: Sat 32 (A), Sat 207 (B) and Sat 11 (C and D) which are markers of C. canephora fragments introgressed into C. arabica genome: Tl, T2 and T3 respectively (arrowed) 92
Plate 9. Symptoms observed on young coffee seedlings after inoculation with C. kahawae. (A and B); early symptoms of infection on cv SL28 seedlings, (C); an active lesion on infected a cv SL28 seedling showing the dead top and halo zone ahead of the necrotic area (D) a cv SL28 seedling after regeneration of a young shoot during recovery after infection. (E); a cv Catimor 88 seedling showing a dead young tip and infection arrested at the first node 103
Plate 10. Symptoms of infection on attached green coffee berries in the field three weeks after inoculation with C. kahawae. (A); blackened berries of SL28 (note the stalks from which berries had fallen indicating susceptible infection. (B); attached berries inoculated on a cv Catimor tree, (C); close-up of the infected Catimor berries showing the limited progress of the lesions 103
x

Plate II.
Plate 12.
Plate 13.
Plate 14.
Plate 15.
Plate 16.
Plate 17.
Plate 18.
Plate 19.
Plate 20.
Plate 21.
Symptoms observed on F2 seedlings (Catimor x SL28) five weeks after inoculation with C. kahawaeAutoradiographs o f three selected microsatellites analysed an F2 population of a cross between cvs Catimor (line 88) and SL28 (Population E) demonstrating analytical experiences An example of the pattern o f Sat 235 in F2 plants (cv Catimor x cv SL28) that were resistant (R) and susceptible (S) to infection by C. kahawaeAutoradiograph o f AFLP amplification products o f selected F2 plants derived from crossing cvs Catimor (Resistant) and SL28 (susceptible) to infection by C. kahawae. Some recombinant resistant plants (R) are visible with AFLP-27 but without AFLP-28 and vice-versa for one susceptible plant (S). The arrowed plants were misfits that were considered as misclassified by the young seedlings inoculation method Different PCR products of AGC-CTG-c-aa4 SCAR at different annealing temperatures exhibiting temperature dependent polymorphism between plants with the parent AFLP marker
(AGC-CTG-c +) and those without the marker (AGC-CTG-c -) in 2% agarose (A, B, C and D). Plate E shows the PCR products of the same samples amplified with radioactive labelling at 60 °C and separated in denaturing polyacrylamide gel Hybridization patterns of high density membranes spotted with BAC DNA o f C. arahica genome that were probed with sequences of three AFLP markers of the C. canephora chromosomal fragment T2 that is introgressed into C. arabica. The lower panel shows close-ups of selected quadrants as indicated by the arrows.Alignment of radiographic patterns of SRAPD83o SCAR marker (top panel) and Sat 235 (bottom panel) amplified on the same panel of F2 plants from a cross of cvs Catimor and SL28 Banding patterns of four selected microsatellites in different Coffea spp with amplification patterns depicting either presence or absence of specificity to the constitutive sub-genomes in C. arabica (Ca and Ea) A radiograph of AFLP derived SCAR marker J3 in different Coffea spp. An accession o f C. canephora with three alleles is arrowed The amplification pattern o f Sat 225 in nineteen C. arabica accessions including variety Rume Sudan and cv K7 that are used as donors of resistance and tolerance respectively to both CBD and CLR in Kenya. The details of the accessions and serial numbers are as in Table 10A radiograph of the banding pattern of Sat 235 in accessions of different Coffea species. All the samples are subsets of the samples analysis by LICOR fluorescence methodology and results presented in Plate 18 D. The differences in clarity can be seen especially in the C. arabica samples in the two systems
127
128
106
133
138
139
140
165
166
169
170
xi
LIST OFAppendix
Appendix
AppendixAppendixAppendixAppendix
APPENDICES1 Sketch diagrams of the scoring system (Classes 1 to 12) of
coffee seedling hypocotyls after inoculation with C. kahawae as described by van der Vossen el al. (1976).
2: Genetic linkage groups in an introgressed C. arabica line, based on analysis of a F2 population o f a cross between cv Sarchimor line T5296 and a wild Ethiopian C. arabica collection (ET6) as mapped by Ansaldi (2003)
3: Preparation of reagents (alphabetical order)4: DNA Cloning Protocol5: Extracting plasmid DNA from transformed bacteria6: Labelling of hybridization probes
199
200201204205 205
xu

LIST OF MAJOR ABBREVIATIONSAFLP Amplified Fragment Length PolymorphismBAC Bacterial Artificial ChromosomeBBC Bacterial Blight of CoffeeBC, i1*1 Back Crossbp base pairsCRF Coffee Research FoundationCBD Coffee Berry DiseaseCIFC Centro de Investigate das Ferrugens do Cafeeiro (translation into English: Coffee
Rusts Research Centre, Portugal)CLR Coffee Leaf RustcM centimorgancv(s) cultivar(s)DH(s) Doubled haploid(s)DNA Decoy-ribonucleic aciddNTPs deoxyNucleotide Triphosphates. This refers to the four DNA building nucleotides:
dATP: deoxyadenosine triphosphate; dCTP: deoxycytodine triphosphate; dGTP: deoxyguanosine Triphosphate and dTTP: deoxythymidine triphosphate
Fi i1*1 Filial generationg gramhr hourHDT Hibrido de TimorIRD Institut de Recherche pour le Devdloppementkb kilobase pairsMAS Marker assisted selectionMb Mega (million) base pairsmg milligramml millilitremM millimolarng nanogramPCR Polymerase Chain ReactionPg picogramQTL Quantitative Trait LociRAPD Randomly Amplified Polymorphic DNARFLP Restriction fragment Length PolymorphismSCAR Sequence Characterised Amplified RegionSSRs Short Sequence RepeatsV VoltsW WattsMg microgramMl microlitrepM micromolar°C degrees centigrade/celcius
XIII

ABSTRACT
Coffee Berry Disease (CBD) is an anthracnose of young berries of Arabica coffee (Cqffea
arabica L.) that is caused by the fungus Colletotrichum kahawae. It is a major limitation to
economic production o f the crop in Africa. Various sources o f resistance to the disease have
been identified and are used in breeding resistant cultivars. One such source of resistance is
Hibrido de Timor (HDT), which is a natural hybrid between C. arabica and C. canephora. In
Kenya, accessions o f HDT progenies and its derivatives (cv Catimor) are used as donors of
resistance to both CBD and CLR. The objective of this study was to decipher the genetic basis of
CBD resistance derived from Hibrido de Timor and to identify molecular markers associated
with it. which can be used for selection purposes.
Potential Amplified Fragment Length Polymorphism (AFLP) and microsatellite markers for the
resistance were identified by characterisation of HDT derived polymorphism in resistant lines of
cv Catimor. The accessions analysed included two lines o f cv Catimor), eight resistant
accessions of BCi Fi progenies (Catimor x (Catimor x SL28)), up to 76 plants from three BCi F2
populations and two accessions of the susceptible cv SL28. A Sarchimor line (T5296) and
accessions of its F2 progeny derived from its cross with a wild C. arabica collected from
Ethiopia (ET6), which was used to map introgressed C. canephora chromosomal fragments,
were included in some of the experiments. Three mapped C. canephora chromosomal fragments
(T2, T3 and T4) were found to be present in the cultivars Catimor and Sarchimor and were
therefore considered to be candidate carriers for CBD resistance. However fragment T4 was
considered to be a weaker candidate because it was absent in one resistant BC| F| plant. Some
AFLP markers of the introgressed fragments were cloned and converted into sequence
characterised amplified regions (SCARs), and then assessed for polymorphism in a doubled
haploid (DH) population so as to identify their linkage to coffee chromosomes. The SCARS
xiv

displayed very low polymorphism and it was possible to identify chromosome linkage for only
one SCAR (J3), derived from the C. canephora chromosomal fragment T l. This SCAR was
duplicated in chromosomes 2 and 8 of coffee genome.
Two F2 populations (D and E) were raised by from crosses between two lines o f cv Catimor
(lines 127 and 88 respectively) and cv SL28. Phenotypic segregation for CBD resistance was
verified by inoculation of half of each seed lot on the sixth week after germination by hypocotyls
inoculation method. Resistant seedlings obtained from these tests were established in a nursery
as Group 1 sub-populations and were used as checks in subsequent molecular studies. The other
halves of the seed lots were transferred directly to the nursery without inoculation as Group 2
sub-populations representing unaltered F2 populations for later studies. Segregation of candidate
molecular markers of the resistance was verified using three microsatellites (Sat 11, Sat 32 and
Sat 207) that are mapped onto the introgressed C. canephora chromosomal fragments T3, Tl and
T2 respectively.
All the seedlings (both Groups 1 and 2 sub-populations) were screened for CBD resistance after
one year by young seedlings inoculation method developed in this study. The method achieved a
degree of success that was considered to be sufficient for identification of DNA markers of the
resistance, despite o f an expectation of some phenotypic misclassifications. Misclassification
was expected due to the observation that plants with low vigour (stunted and/or thin) exhibited
exceptionally high susceptibility including plants from Group 1 (resistant sub-populations) and
some plants of cv Caturra failed to be infected.
Fifty-seven (57) microsatellites were screened for polymorphism amongst accessions of cvs
Catimor, T5296, SL28 and the two F2 populations (D and E). Twenty three (23) microsatellites
xv

were variously polymorphic within or between lineages. Seven microsatellites had alleles that
were common in the HDT derivatives, polymorphic in the two F2 populations and absent in cv
SL28. These were considered to be candidate markers of resistance to CBD. The seven
microsatellites were then analysed in 95 Group 2 plants from Population E for segregation
fitness and possible linkage to CBD resistance. Six of the microsatellites displayed segregation
ratios that fitted Mendelian inheritance but one microsatellite (Sat 11) had distorted segregation
in favour of the introgressed allele. It was further observed that Sat 207 and Sat 235 had marker
alleles that were linked to CBD resistance. The same plants were analysed for an AFLP marker
of the T4 fragment and it was observed to be present in 70.23% of the plants which suggested
that it followed random Mendelian inheritance and it did not co-segregate with CBD resistance.
Further confirmation that the markers were linked to CBD resistance, the seven potential
candidate microsatellites were amplified in fifty-six (56) Group 1 plants consisting o f 29 and 27
individuals from Populations D and E respectively. These plants were also analysed with
selected AFLP markers of the introgressed fragments T2, T3 and T4. The fragment T2 was
confirmed to be linked to CBD resistance and further studies focussed it. Analysis was done with
AFLP markers spread on the T2 fragment in plants selected from the two F2 populations to cover
the two screening methods, resistant and susceptible phenotypes. Sat 235 that was observed to be
linked to CBD resistance was mapped using the same samples which had originally been used to
map the introgressed C. canephora fragments. The established limits of the location of the gene
confined it to a 26.9 cM segment, with high possibility of the gene to be within or near the limits
of a 10.6 cM segment. The segregation o f Sat 207 and Sat 235 in 47 resistant and 18 susceptible
plants included in the 95 plants of Group 2 amplified earlier was re-examined with the mapping
information. It was observed that two resistant plants had the introgressed Sat 207 allele but not
the introgressed Sat 235 allele, while one susceptible plant without the introgressed Sat 207
xvi

allele had the introgressed Sat 235 allele. This prompted the assumption that the two markers
maybe located on the opposite sides of the gene. If this is proved to be true, then the gene is
located within a 13.2 cM chromosomal segment. No prominent skew in favour of homozygous
introgressed genotypes compared to the heterozygous ones was observed in the resistant
category o f plants, indicating that the gene is of major action. It is therefore concluded that the
locus carries a major resistance gene that was designated Ck- 1 and is likely to be synonymous to
T gene described earlier by other researchers.
Four out of five AFLP markers o f the introgressed C. canephora chromosomal fragment T2 were
successfully cloned, sequenced and specific primers designed. One primer pair amplified a
monomorphic band whose intensity in agarose gel was related to the presence and absence of the
parent AFLP marker at the theoretical optimum annealing temperature of 60 °C. At a higher
annealing temperature of 62 °C, it amplified a dominant marker (AGC-CTG-cAa4). The SCAR
marker was analysed against Sat 207 and Sat 235 and it amplified as expected except in two
plants that were assumed to be recombinant
RAPD markers for CBD resistance identified earlier by other researchers could not be
reproduced, but specific primers designed from their sequences were tested in the F2 populations
by radioactive PCR and separated in denaturing polyacrylamide gels. One amplified a
monomorphic band in all accessions while the other amplified two polymorphic bands, one of
which was derived from HDT and it was linked to the T2 fragment. A survey of the
microsatellite markers for CBD resistance was carried out in twenty-two (22) accessions bred
from different accessions of HDT and agreement with earlier results was demonstrated.
xvi 1

Ninety one (91) accessions of Coffea species consisting of C. arabica, its putative parents
namely C. canephora (and its close relative C. congensis) and C. eugenioides (and its close
relative C. anthonyi) were analysed with eighteen (18) microsatellite markers of C. canephoru
chromosomal fragments introgressed into C. arabica and seven (7) SCARs developed from
AFLP markers of some o f the introgressed fragments. Different amplification characteristics of
the microsatellites and SCARs were observed in the different Coffea species. Un-introgressed C.
arabica accessions exhibited low variability. In cases where two microsatellite alleles per
accession were amplified in C. arabica, there was amplification in all the species analysed with
or without distinction between the canephoroid species (C. canephora and C. congensis) and
eugenioid species (C. eugenioides and C. anthonyi). In cases where the un-introgressed C.
arabica had one allele per accession, there was no amplification in all or most of the eugenioid
species (C. eugenioides and C. anthonyi). Species specificity was also observed regarding some
SCAR alleles, but no null alleles observed in amplifications in this system. In all cases there was
an allele in canephoroid species (C. canephora and C. congensis) that was similar to the
introgressed allele in HDT derivatives in regard to both microsatellites and SCARs. Sat 235 had
no alleles shared between any of the un-introgressed C. arabica accessions and the accessions of
the canephoroid group.
The maximum number of microsatellite alleles observed was seventeen and the minimum was
three alleles, while the maximum number o f SCAR alleles was five and the minimum was one.
C. canephora had the highest number of alleles and the least polymorphic was the eugenioid
group (C. eugenioides and C. anthonyi). The un-introgressed C. arabica accessions as a group
had more alleles than the introgressed ones despite the introgressed accessions having extra
alleles due to the introgression. In some cases, alleles similar to the marker alleles for
introgression were observed in some accessions of the un-introgressed accessions of C. arabica.
xvm

In all cases, the genotypes of the HDT derivatives could be constituted by a combination of
alleles observed in C. arabica and the canephoroid group. The alleles of HDT that were shared
with the eugenioid group (C. eugenioides and C. anthonyi) were all observed in the un-
introgressed C. arabica accessions. In HDT derivatives, only one of their alleles was replaced
by the introgressed allele, even where there was more than one allele per accession of the un-
introgressed C. arabica.
Microsatellites with potential for use as breeding tools for CBD and CLR resistance from the
donor varieties Rume Sudan (resistant) and K7 (tolerant) were identified by their polymorphism
between these varieties and the susceptible cultivars SL28 and Caturra. However it was noted
that this potential would be attained by high performance techniques like LICOR fluorescence
system that was used in this phase o f study.
Key words: Coffee Berry Disease, Colletotrichwn kahawae, Coffea arabica, Coffea canephora.
Hibrido de Timor, introgression, resistance, chromosomal fragment, AFLP, Microsatellite,
marker, allele
xix

CHAPTER I. INTRODUCTION
Coffee is an important export crop and a major foreign currency earner for many countries
located in the tropics o f Africa. Asia and Latin America. It provides the livelihood for over 120
million people worldwide (Pare, 2002; Osorio, 2002). Arabica coffee (Coffea arabica L.)
accounts for about 75% of the total world coffee production and the rest is mainly Robusta
coffee (Coffea canephora Pierre). Major constraints to coffee production include pests and
disease epidemics with various extents of impact in different regions, countries and continents.
1.1 Coffee production and its constraints in Kenya
Coffee is among the top three agricultural exports in Kenyan and it contributes up to 12% of the
total export revenue (International Trade Centre, 2002). However, coffee productivity in Kenya
is low with a national average of 400kg o f clean coffee per hectare (International Trade Centre,
2002). Smallholders produce an average o f 2.8 kg of cherry per tree while large estate growers
realise an average o f 5.6 kg per tree. This is very low compared to yields of 18.4 kg per tree,
which are practically achieved in some estates (Karanja, 1996). Between 1989 and 1999, the
national coffee production fell from 126,000 metric tons o f clean coffee to 56,000 tons
amounting to a loss of US$870 million. Although there is an interplay of factors whose
individual level of contribution to the decline in production is difficult to isolate, one of the
factors is poor disease management. This is partly due to high costs of pesticides that currently
constitute the main control method. The strategy involves intensive pesticides spray programmes
that accounts for up to 30% of the total cost of production. Disease management is a major
limitation to economic coffee production especially to the smallholders, who find the use of
pesticides beyond their financial and technical capabilities (Griffiths et al., 1971; Walyaro et al.,
1984; Wrigley, 1988; Masabaand Waller, 1992). The major coffee diseases in Kenya are Coffee
Berry Disease (CBD) caused by Colletotrichum kahawae, Coffee Leaf Rust (CLR) caused by
1

Hemileia vastatrix and Bacterial Blight o f Coffee (BBC), caused by Pseudomonas syringae pv
garcae (Kairu, 1998). Fusarium bark disease (FBD) and Fusarium root disease (FRD) that are
caused by Fusarium stilboides and F. solani respectively, are becoming increasingly important
in certain areas especially in lower altitude coffee growing areas (< 1500m above sea level).
Minor coffee diseases include those caused by Cercospora coffeicola, Botrytis cinerea,
Armilaria mellea and nematodes. Coffee is mainly produced by developing countries and it is
here where the impact of crop diseases is particularly acute (McDowell and Woffenden, 2003).
An attractive alternative strategy for disease management is the development o f resistant
varieties. This strategy involves introduction of disease resistance genes from other varieties
followed by backcrossing to the commercial cultivars to restore desirable traits especially yields
and quality.
Conventional breeding methods take a long time due to the long generation interval o f coffee (5
years) (Agwanda et al., 1997). Furthermore, it would take at least 25-30 years after an inter
specific cross to eliminated undesirable traits and restore genetic makeup of the recipient coffee
cultivar using conventional breeding methods (Anthony and Lashermes, 2005). The seedling
hypocotyls inoculation method developed by Van der Vossen et al. (1976) shortened the period
required to detect resistance to CBD. However it is limited when the programme requires
procedures such as back crossing. The time required for breeding by traditional method can be
shortened by use of DNA based marker assisted selection (MAS). The markers help in detecting
a targeted genomic fragment and therefore selects for a desirable trait that is linked to it such as
disease resistance, and this can be done in the early stages of plant growth. Selection by use of
molecular markers results in a gain of about two generations of backcrossing and this gain can be
higher if the objective is to reduce linkage drag (Riesenbierg et al., 2000). Development of
2

modem breeding methods, whereby the genotypes o f a progeny in a breeding cycle can be
accurately detected early, is therefore of high priority.
1.2 Coffee Berry Disease (CBD)
As the name highlights, the main tissue infected is the berry. This is also the infection of highest
economical importance, especially on green immature fruits, a stage in which it can cause up to
80% crop loss if not controlled and conditions are favourable (Griffiths et al., 1971; Masaba and
Waller, 1992).
1.2.1 The pathogen
The disease is caused by the species Colletolrichum kahawae, which belongs to the Genus:
Colletotrichunv, Family: Phyllachoraceae; Order: Phyllachorales; Class: Sardariomycetes;
Phylum: Ascomycota; Kingdom: Fungi (Kirk et al., 2001; Online site: http://www.Indexfungo
rum.org/Names/fundic.asp). Like many other members of the species Colletotrichum. C.
kahawae is considered to be an anamorph of the genus Glomerella. Until 1993 when it was
renamed, the fungus was referred to as Colletotrichum coffeanum (Waller et a!., 1993). This was
composite species taxon that included C. gloeosporioides and C. acutatum strains isolated from
coffee, although the CBD pathogen displayed specific differentiating features like virulence on
immature green coffee berries and colouration (whitish grey to dark grey). There are various
differences in isolates of the pathogen including their aggressiveness (Rodrigues et al., 1991;
Rodrigues, et al., 1992; Omondi et al., 2000, 2001), but no conclusive evidence on the existence
o f its races has been demonstrated. Moreover, the isolates of the pathogen in Kenya belong to
one vegetative compatibility group (Gichuru et al., 2000) and are therefore of a clonal nature.
Flowever the possibility of appearance of races of the pathogen cannot be ruled out, especially
due to the continued planting of resistant varieties in the field.
3

Apart from genetic factors, the susceptibility of coffee berries to CBD depends on their age and
they are most susceptible when they are expanding between 4 and 16 weeks after flowering, and
also when they are ripening (Mulinge, 1970). The infection agents are conidia whose optimum
germination temperature is 22°C in water but it is higher in presence of leachates from coffee
berries (Nutman and Roberts, 1960). After germination and infection, success o f subsequent
disease progress requires cool and humid weather conditions which are usually encountered on
higher altitudes and in particular months depending on location. Chemical control aims at
protecting the berries when they are at the susceptible stage especially if it coincides with
favourable conditions (Griffiths et al., 1971).
1.2.2 Symptoms of the disease
The CBD pathogen is able to infect several coffee tissues either naturally or by artificial
inoculation that result into variable symptoms.
1.2.2.1 Berries
Infection of green expanding berries is the major and the most economically important natural
occurrence of the disease. The first symptoms of infection on green immature are dark-brown
slightly sunken spots. Under suitable environmental conditions, the spots enlarge to cover the
whole berry' and masses of conidia maybe visible (Plate 1). The lesions may reach the beans that
become black and shrivelled. Finally the berries become brown or black and if desiccation
occurs, they are mummified (Plate 1). The stalks of the berries are also attacked and destroyed
and the berries are shed or they remain on the tree in mummified form. Infection on ripe berries
is seen as dark sunken patches that spread rapidly and may cover whole berries resulting in
symptoms referred to as brown blight. The disease may occur in another form where buff-
coloured scab lesions develop, with scattered dark-coloured stromata during the hard berry stage
4

(Wrigley, 1988). Few spores if any are produced on these lesions. The fungus may die out in
these areas and the infected tissue may be sloughed off. Scabs are frequently formed on resistant
plants or in susceptible plants if the environmental conditions are unfavourable for the disease
(Masaba and van der Vossen, 1982). In dry weather conditions, progress o f the disease is halted
and the lesions take on an ash-grey colour except where it is ringed by a dark brown edge. The
mycelia under a scab may penetrate deeper and destroy the beans. During berry ripening, the
scab-lesions may become active if weather conditions are ideal.
Plate 1. Symptoms o f infection by C. kahawae on susceptible green coffee berries in the field(A) Active CBD lesions and dried young berries on susceptible cv SL28, (B) infection of cv SL28 showing conidia! masses on green berries, blackened berries and stalks from which infected berries have detached (C) infection on cv Caturra showing dry brown mummified berries
1.2.2.2 Seedling hypocotyls and shoot tips
Infection of seedling hypocotyls and shoots is largely induced by artificial inoculation under
controlled conditions, and symptoms largely depend on the degree of resistance of the seedlings
that determine the degree of progress of the disease. In the most resistant cultivars, the symptoms
do not develop beyond small scabs or brownish superficial lesions (van der Vossen et al., 1976).
In the moderately resistant cultivars, the symptoms develop into deeper black lesions that either
become larger or increase in number as susceptibility increases. In the most susceptible
5
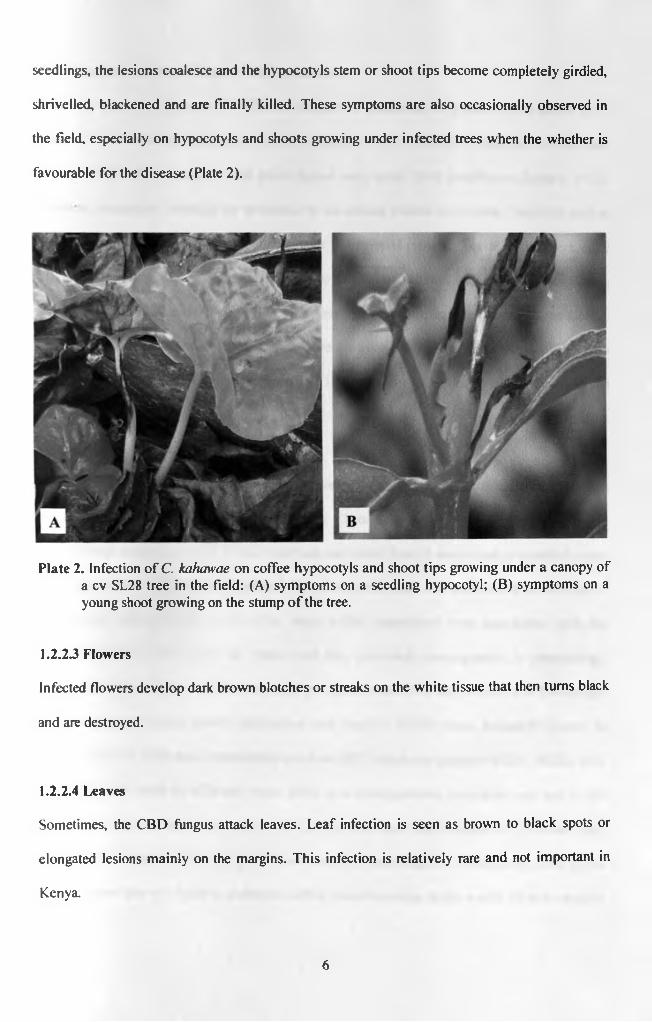
seedlings, the lesions coalesce and the hypocotyls stem or shoot tips become completely girdled,
shrivelled, blackened and are finally killed. These symptoms are also occasionally observed in
the field, especially on hypocotyls and shoots growing under infected trees when the whether is
favourable for the disease (Plate 2).
Plate 2. Infection o f C. kahawae on coffee hypocotyls and shoot tips growing under a canopy of a cv SL28 tree in the field: (A) symptoms on a seedling hypocotyl; (B) symptoms on a young shoot growing on the stump o f the tree.
1.2.2.3 Flowers
Infected flowers develop dark brown blotches or streaks on the white tissue that then turns black
and are destroyed.
1.2.2.4 Leaves
Sometimes, the CBD fungus attack leaves. Leaf infection is seen as brown to black spots or
elongated lesions mainly on the margins. This infection is relatively rare and not important in
Kenya.
6

There are numerous sources of different degrees of resistance to CBD in accessions of C.
arabica. This was recognised quite early in the history o f CBD whereby bronze tipped trees were
observed to be more resistant than green tipped ones under field conditions (Rayner, 1952).
However, systematic breeding for resistance to the disease started much later. Varieties such as
Blue Mountain and K7 were recommended for commercial growing due to their tolerance to
CBD and CLR that allowed acceptable yields to be realised without spraying. Van der Vossen
and Walyaro (1980, van der Vossen. 2006) reported four CBD resistance genes in three loci i.e.
Ri and R2 (in variety Rume Sudan and Pretoria respectively but in the same locus), T (in variety
Hibrido de Timor or Timor hybrid) and k (in K7). The authors described R/ as dominant, R2 and
T as intermediate and k as recessive.
Hibrido de Timor (HDT) is a natural cross between C. canephora and C. arabica that was first
observed in 1927 in ex-Portuguese Timor; now Timor Lorosae (Bettencourt, 1973). A single
plant without symptoms of CLR was observed and seeds from it were used to establish small
coffee plantations. These plants exhibited vigour but yields were low and seeds from the best of
these plants were selected. From 1956, large coffee plantations were established with the
selected plants in all regions o f Timor and they exhibited heterogeneity in morphology,
interspecific origin and yields. The seeds o f this hybrid were first sent to Centro de Investigate
das Ferrugens do Cafeeiro (CIFC) (translation into English: Coffee Rusts Research Centre) in
Portugal in 1957. Different introductions (such as HDT accession numbers 832/1, 832/2, 1343
and 2570) were done at different times. HDT is a heterogeneous population and out of the
various introductions that were made to CIFC, only those that were resistant to all known races
of CLR (i.e. of physiological group A) were used as resistant parents. Subsequently, this hybrid
was distributed free o f charge to almost all coffee research centres in the world, either as straight
1.3 Sources and breeding for CBD resistance
7

progenies or as crosses with the best Arabica cultivars. Progenies of HDT have therefore been
used in breeding programmes all over the world as sources of resistance, especially against CLR,
CBD and nematodes. The hybrid acquired the resistance from genomic material from C.
canephora.
The main hybrids produced at CIFC with HDT include HW26 (Caturra Vermelho x HDT 832/1),
H46 (Caturra Vermelho x HDT 832/2), H361 (Villa Sarchi x HDT 832/2), H528 (Catuai
Amarelo x HW26/13) and H529 (Caturra Amarelo x H361/3). In the pedigree selections, F3 and
F4 generations of HW26 and H46 received the designation o f “Catimor” by the Universidade
Federal de Vifosa (UFV), Brazil. The hybrids H361, H528 and H529 were introduced in the
American Continent in 1970, and their F3 and further generations received the designations of
Sarchimor, Cavimor and Cachimor (Bettencourt. 1983). Catimor and Sarchimor are the most
advanced selections and have been widely distributed in the coffee-growing countries, not only
in Latin America but also in Africa (Malawi), Asia (India) and Oceania (Papua New Guinea).
After local selection for several years, Catimor received regional designations such as Oeiras,
Tupi, Obata, Iapar59 (Brazil), Catrenic (Nicaragua), Costa Rica 95 (Costa Rica), Ihcafe-90 and
Lempira (Honduras), Catisic (el Salvador) and Mida 96 (Panama). In Colombia, HDT 1343 was
crossed with Caturra to produce the original hybrid from which variety "Colombia" is derived.
More details on HDT and its utilization in breeding can be obtained in Bettencourt (1983),
Rodrigues Jr. et al. (2000) Varzea and Marques (2005), Pereira et al. (2005) and Silva et al.
(2006). There are still introductions of HDT derivatives that are being introduction in more
countries or into the same countries under different names or of lineages. This has contributed to
confusion about the derivatives of HDT and wrongful use of the word '‘Catimor” to refer to any
kind of HDT derivative, a situation that can lead to use of wrong genotypes.
8

In Kenya, straight progenies of HDT of accession number HDT 1349/269 (Omondi et al., 2001)
were introduced in 1960 from C1FC (Portugal). Later in 1975 and 1977, F3 and F4 progenies of
cv Catimor, from a cross between HDT (CIFC accession number 1343) and C. arabica cv
Caturra, were received from Colombia (Van der Vossen and Walyaro, 1981; Walyaro, 1983).
These cv Catimor lines are homozygous for compact growth and are resistant to CLR. In Kenya
they were screened for resistance to CBD and CLR. When these Catimors were introduced into
Kenya, they were seeds from single trees and each seed lot had a number that signified its
lineage. The numbers were retained by CRF's Coffee Breeding Unit and denoted as “Progeny”
numbers hence designations like Catimor 88, Catimor 90, Catimor 127 etc. In this thesis, the
term “//we” is used to refer to the coding o f “Progeny”. The introduced lines of cv Catimor
established in Kenya as they were received or were advanced by selfing. This means that the
Catimors presently in Kenya are either F3, F4 or F5 progenies. These Catimors and do not have
adequate cup quality for direct commercial planting when compared to the major commercial
cultivars in Kenya (Van der Vossen and Walyaro, 1981, Omondi et al., 2001). However, they are
used as donors of disease resistance in breeding programmes up to date. In fact the cv Catimor
lines are the maternal parents of the hybrid cultivar Ruiru 11 bred in Kenya. More HDT
derivatives are still being introduced into the country.
Due to filial advancement of the original HDT accessions and their use in different breeding
programmes, there are different genomic fragments derived from the initial C. canephora
genome that occur in different derivatives o f the hybrid across the world. Such coffee progenies
individually contain 9-29% of the C. canephora genome, while in combination they contain an
estimate of 51% of the C. canephora genome (Lashermes et al., 2000a), and are of great value in
C. arabica breeding especially for resistance to pests and diseases. Molecular analysis can help
in characterising desirable and undesirable C. canephora genomic fragments present in the HDT
9

derivatives and consequently select elite lines for breeding programmes or commercial
cultivation.
A coffee-breeding programme was started at CRF in 1971 with a total of 35 coffee varieties as
progenitors and it resulted in the release o f cv Ruiru 11, which is a composite of 60 hybrids (van
der Vossen and Walyaro, 1981, Omondi et al.. 2001). Several o f the progenitors were included
as donors o f CBD resistance such Rume Sudan. HDT, Blue Mountain, K.7, Pretoria and Geisha
10. Several multi-cross lineages were developed and backcrossed to the commercial cvs SL28
and SL34 to restore quality and yield while selecting for resistance to CBD and CLR. This
resulted in different lines that are used as males to make the final hybrid cross with cv Catimor
lines as maternal parents.
Individual Ruiru 11 hybrids are realised by pollinating trees of specific Catimor lines with pollen
bulked from specific males of the same lineage. The males may posses different assortment of
the resistance genes and most likely in heterozygous state. The guaranteed genetic resistance in
the Ruiru 11 hybrids is therefore that present in cv Catimor. Although phenotypically they are
homogeneous (due to dominant compact growth habit of cv Catimor), Ruiru 11 hybrids are
genetically heterogeneous which theoretically buffers them against pathogen and environmental
variations. However, this heterogeneity leaves room for genetic improvement and selection for
environmental adaptation and possibly other traits. Another source of resistance to CBD is that
observed in collections of wild C. arabica from Ethiopia (van der Graaff, 1978: van der Vossen
and Walyaro. 1981). However this is yet to be exploited in commercial coffee production.
10

1.4 Selection for CBD resistance
Apart from natural CBD infection in the field, several artificial inoculation methods have been
developed to screen coffee plants for resistance to the disease. The major ones are inoculation of
detached green berries; seedling hypocotyls and seedling shoot tips (van der Vossen et al, 1976).
The last one is less used partly due to the time it would require to raise the seedlings and their
bulky nature. In the hypocotyls inoculation method, seedlings are germinated in sterile sand and
their hypocotyls are double inoculated on the 6th week after germination. Typically, the seedlings
have unopened cotyledons and the inoculation is done twice at 48-hour interval by spraying with
a C. kahawae spore suspension of 2xl06 conidia/ml. After an initial incubation at room
temperature for 96 hours after the first inoculation, the seedlings are incubated in a temperature
controlled room at 18±2°C for 2 weeks. They are then transferred back to room temperature and
scored one to two weeks later. The most resistant seedlings with no infection signs are scored
into class 1 and thereafter progressively in upper classes as the symptoms increase from small
specks, to brown superficial lesions, to deep larger black lesions and finally to girdling and
seedling death in class 12, which is the most susceptible (Plate 3, Appendix 1). Despite different
opinions especially on data interpretation, this method is very valuable especially in screening
populations to obtain resistant plants and/or using the averaged results to classify the CBD
phenotype of the mother plant (Van der Vossen, et al., 1976; van der Graaff, 1978. 1982;
Dancer. 1986; Owour and Agwanda, 1990).
In shoot tips inoculation, one-year-old seedlings with 1-2 cm long young shoots are inoculated
once with the same inoculum conditions as for hypocotyls and incubated for 48 hours in a moist
chamber. The seedlings are then left in the nursery for symptom development and scored as for
the hypocotyls but from Class 0 to 11. It is imperative that for the symptoms to develop well, the
ambient temperatures have to be favourable and the seedlings have to be selected so as to have
11

young shooting tips o f 1-2 cm length. This limits random or total population screening since they
cannot all be in the right stage at the same time.
There are various possible mechanisms o f resistance to infection by C. kahawae in coffee. They
include pre-formed and induced antifungal compounds and structural barriers as reviewed by
Gichuru (1997). Since then, more mechanisms have been reported which include rapid localised
cell death, accumulation of callose. lignin-like and phenolic compounds (Gichuru, 1999,
Rodrigues et al., 1999; Silva et al., 2006). Some of these mechanism are likely to be pathogen
non-specific and could also be induced by mechanical injury. It may be possible to develop some
of the observed biochemical and structural changes into methods of screening for CBD
resistance. Widespread MAS application o f RAPD markers identified by Agwanda et al. (1997)
is hampered by their lack of reproducibility in different laboratories and over time. They could
be improved by developing them into SCAR markers. Mapping them in relation to the CBD
resistance gene(s) would help in judging their genetic reliability. In vitro selection methods
reported by Nyange et al. (1995, 1997) maybe technically demanding and therefore limit their
routine and large-scale use. The methods would also require further studies for adaptation to
explants obtained from other plant tissues rather than hypocotyls, which involves destruction of
the individual seedlings sampled.
12

V______________ J \ ______________ JHighly resistant Moderately
resistant
V______________ J \___ __________ JModerately Highlysusceptible susceptible
Plate 3. Photographs o f hypocotyls of coffee seedlings showing symptoms of infection by C. kahawae at scoring time on the fifth week after inoculation. The phenotypic categories comprise o f highly resistant seedlings (Classes 1-4), moderately resistant (Classes 5-7), moderately susceptible (Classes 8-10) and highly susceptible (Classes 11-12) as categorised in this study.
13
CHAPTER 2. JUSTIFCATION
As coffee production expands, production costs increase, consumer health and environmental
issues become of priority, it becomes crucial to develop and use disease resistant varieties. In
totality, the production of coffee is extremely vulnerable due to the narrow genetic base of the
cultivated varieties. This is because these varieties are derived from a few individual collections
and subsequent dispersal has progressively narrowed their genetic base (Anthony et al., 2002a).
The cultivated genotypes are susceptible to various pests and diseases including leaf rust,
anthracnose, blight, nematodes, wilts and insects. The current methods for control o f these pests
are largely chemical that are of high costs to the farmers and injurious to the environment and
humans. The need for developing coffee production strategies that reduce cost of production and
are friendly to the environment and humans is thus overwhelming. Therefore as in other crops,
the search for durable resistance against coffee pests continues to be a priority objective though
elusive (Michelmore, 2003). Host plant resistance may be singly adequate for commercial use or
be incorporated into integrated disease management programmes.
As a contribution to this objective. Coffee Research Foundation (CRF), Kenya, released an
Arabica coffee cultivar (cv Ruiru 11) in 1985 (Nyoro and Sprey, 1986). This cultivar combines
resistance to CBD and CLR with high yields, fine cup quality and compact growth habit.
However some isolates of the pathogens are isolated from this variety raising the concern of the
durability of its resistance. Inheritance studies for CBD resistance revealed three genes on
separate loci: R and T (dominant/intermediate) and k (recessive) (van der Vossen and Walyaro,
1980, van der Vossen, 2006). Cultivar Ruiru 11 is a composite o f about 60 hybrids, each derived
from a cross between a specific female and male population (Omondi et al., 2001). Further more,
each hybrid may express only the T gene or both T and R genes but not the recessive k gene. The
population is therefore not genetically uniform, raising a need to conduct detailed studies to
14

establish the genomics of its resistance to facilitate tracing of the genes. However, it is difficult
to study the individual genes in a complex product like Ruiru 11 without previously developing
molecular markers and other basic knowledge for each gene. This study addresses this need by
focusing on resistance gene(s) introgressed into C. arabica from C. canephora via HDT, which
as noted earlier (Section 1.3) is o f great importance in breeding for CBD resistance in Kenya.
The C. canephora chromosome fragments introgressed into C. arabica through HDT are
important in breeding for pest and disease resistance, (Orozco-Castillo et al., 1994, Lashermes et
al. 2000a), though some of them may lead to reduction of cup quality compared to pure Arabica
varieties (Bertrand et al., 2003). This study was formulated with the general objective of
generating DNA based information on these C. canephora introgressed genomic fragments with
emphasis on resistance to CBD. Development of DNA markers for the introgressed C.
canephora fragments will hasten selection for the desired ones in future and against undesired
ones. Selection would best be for the smallest fragments carrying the desired gene(s).
Identification of markers linked to the resistance is possible by analysing the segregation of
polymorphic bands and CBD resistant phenotype in an F2 generation between a donor variety
(such as cv Catimor) and a recipient variety (such as cv SL28). The markers can then be mapped
and used as selection tools in the development of resistant varieties as well as refining the current
varieties. The mapping population(s) can also be a source of different genetic assortments which
can be of great value as elite breeding parents, be developed into pure line cultivars or used for
gene mining. This study took into account all these aspects and plants o f the developed F2
populations were established in the field for later uses.
Although traditional breeding methods are considered difficult, they are essential in the
development of new varieties and in verification of molecular markers. Suitable CBD screening
15

method(s) had to be selected from documented procedures and modified if necessary to ensure
maximum reliability of identified markers. One disadvantage of the hypocotyls inoculation
method (Van der Vossen el al., 1976) is that susceptible seedlings are killed very early and they
cannot be used for later studies in living form. It is also very difficult to obtain enough DNA
from these seedlings (e.g. from roots) before the tissues are colonised by the fungus or die.
Another disadvantage is that the results o f inoculations of seedlings even from the same source
may give different results in different repeats overtime thus creating inconsistency. The other
screening method developed by the same authors is the inoculation of young seedlings with
young shoots. As reported by the authors, there was no control of temperature and this would
limit the tests to periods with favourable conditions. Furthermore, the need o f selecting seedlings
at the right growth stage would not allow the whole population to be screened at the same time.
The option of raising the plants to maturity, for field evaluation or laboratory tests on the berries
or seeds that they produce, is time consuming because it requires a whole generation interval.
There was thus a need to develop a method that addresses the above limitations. The method
would have to give a high value to the individual seedling disease reaction, allow extraction of
DNA from the entire population and enhance survival chances for susceptible plants. In this
study, a modification of the shoot tip inoculation method was assessed and used. The
modifications aimed at enhancing infection and disease progress, and also developing a scoring
scale with reduced intermediate classes.
rhere is little work done on the genomics of disease resistance in Arabica coffee, and more so in
regard to CBD. Previous work includes the classical gene identification through inheritance
studies by Van der Vossen and Walyaro (1980), search for isozyme markers for CBD resistance
by Gichuru (1993) and identification of RAPD markers for CBD resistance by Agwanda et al.
(1997). Molecular work by Noir et al. (2001, 2003) focussed on Resistance Gene Analogs
16
(RGAs) and nematode resistance while that of Prakash et al. (2004) focussed on resistance to
CLR. There is therefore need to widen the knowledge of the genomics of disease resistance in
coffee and develop appropriate markers. Development of easy to use and/or highly informative
DNA marker(s) for disease resistance is o f major priority. This was the major objective of this
study in relation to CBD using microsatellites and the versatile AFLP methodology coupled with
development of SCARs to improve reproducibility.
HDT derivatives are increasingly becoming more important in production of C. arabica
especially as donors o f resistance to various pests and diseases. Molecular studies have been
carried out on these materials in relation to genetic diversity, relatedness to diploid relatives,
cultivar identification, effects of the introgression on traits like beverage quality, and mapping of
pest resistance (Lashermes et al., 2000a; Steiger, et al., 2002; Anthony et al., 2002b; Bertrand et
al., 2003; Moncada and McCouch, 2004). Some anticipated studies in the future include
identification of the functions of the introgressed fragments in the C. arabica, walking on Coffea
genome in attempt to isolate and clone various genes o f interest, use of transferable markers to
search and transfer homologous genes from different Coffea species/genotypes into elite C.
arabica cultivars, and subsequently fingerprinting the developed varieties. This can be done with
highly reproducible markers like microsatellites and SCARs, but these may be complicated
depending on degree o f their diversity or repetition in the Coffea genome. This study explored
the practical application potential of these marker systems by analysing their diversity in C.
arabica and its progenitors with emphasis on markers of C. canephora chromosomal fragments
introgressed into C. arabica.
17

CHPTER3. OBJECTIVES
The general objective of this study was to decipher the genomics of C. canephora chromosomal
fragments that are introgressed into C. arabica genome via Hibrido de Timor (HDT) and
subsequently identify the one(s) that confers resistance to CBD.
The specific objectives were:
1. to identify and characterise introgressed C. canephora chromosomal fragments in cv
Catimor lines that are used as donors of resistance to CBD and CLR in Kenya.
2. to develop mapping F2 populations from crosses between cvs SL28 x Catimor
3. to develop a suitable method for early screening the of F2 populations for CBD resistance
while preserving susceptible seedlings
4. to identify and map DNA markers o f resistance to CBD
5. to assess the diversity of microsatellite and AFLP-derived SCAR markers of
introgression from C. canephora into C. arabica in C. arabica and its putative parents
18
CHAPTER 4. LITERATURE REVIEW
4.1 Molecular markers
Each gene or DNA sequence occupies a particular place on a chromosome called “locus”.
Stansfield (1986) stated that the term marker usually refers to “locus marker”. Due to mutations,
genes can be modified into several mutually exclusive forms called “alleles” or allelic forms, and
all allelic forms o f a gene occur at the same locus on homologous chromosomes. All “molecular
markers” are loci markers related to DNA and they can also be biochemical or morphological.
Allozymes (or isozymes) are different forms of the same enzyme, coded for by alleles of the
same gene and can be separated by electrophoresis, which enables their use as molecular
markers. DNA based markers are better markers for close relatives and can be detected at all
stages of development, unlike allozymes that may be age or environment dependent. DNA
markers are also more numerous than allozymes. Over time, various methodologies for
generating DNA markers have been developed and used in various plants, including coffee, with
diverse objectives such as mapping traits o f interest, evolutionary studies and biosystematics.
Characteristics o f good markers include:
1. Mendelian inheritance: transmitted from one generation to another in a predictable
manner
2. Polymorphic: present several alleles at the locus investigated (multi-allelic)
3. Co-dominant: allow the discrimination between homozygotes and heterozygotes
4. Neutral: all alleles have the same fitness
5. Not epistatic: the genotype of a phenotype can be determined irrespective o f the other
loci
6. Independent o f environment: no phenotypic plasticity
7. Frequent occurrence in the genome
8. Even distribution throughout the genome
19
9. Highly repeatable
10. Easy to generate and interpret
One type o f molecular marker may not meet all the above qualities and generally none is suitable
for all applications. Different marker systems vary in technical requirements, cost (development
and running), speed (throughput), amount and quality of DNA needed, level of polymorphism
revealed, precision o f genetic distance estimates and statistical power. The thrust in developing
new marker systems has been the need to increase the resolution of the different systems and to
overcome the limitations of each one (Rafalski et al., 1996). Allozymes and Restriction
Fragment Length Polymorphisms (RFLP) were the earlier ones developed but are not numerous
enough for high-density mapping. Since the development of Polymerase Chain Reaction (PCR),
more maker systems have been developed and they include Randomly Amplified Polymorphic
DNAs (RAPD), Simple Sequence Repeats or Simple Sequence Repeat polymorphisms
(SSRs)[also referred to as Variable Number of Tandem Repeats (VNTR), Microsatellites. Short
Tandem Repeats or Simple Tandem Repeats (STRs), or Simple Sequence Length
Polymorphisms (SSLP)], Cleavable Amplified Polymorphic Sequences (CAPS), Amplified
Fragment Length Polymorphism (AFLP) and Inter-SSR Amplification (lSA)[also referred to as
Inter-SSR (ISSR)].
A marker that is randomly generated without prior knowledge o f its sequence can be sequenced
and specific primers be designed to amplify the region. The subsequent PCR-based marker is
referred to as Sequence Characterised Amplified Region (SCAR, or Sequence Tagged Site,
STS). PCR products can be analysed for conformational polymorphism by Single Strand
Conformational Polymorphism (SSCP) whereby it is denatured and then electrophoresed in non
denaturing polyacrylamide gel (Orita et al., 1989). The DNA strands fold onto themselves
20

resulting into different conformations of different mobility. The conformation is dependent on
the sequences of the fragments and thus reveals sequence differences such as point mutations.
Typically the choice o f which fingerprinting technique to use depends on (1) the application (e.g.
DNA genotyping, genetic mapping, population genetics); (2) the organism under investigation
and its state of knowledge (e.g., prokaryotes, plants, animals,); (3) the resources available (time,
skills, money, equipments, availability and supply of chemicals), and (4) amount and quality of
DNA (Vos et a i, 1995; Rafalski et al., 1996; Robinson and Harris, 1999; Grivet and Noyer,
2003). The emergence of analysis kits and automation of procedures reduces the technological
skills required, and increases the throughput of samples analysed. Collaboration between experts
in the different types of marker technologies is a good way to realise objectives in an efficient
and most cost effective way (Farooq and Azam, 2002). This is true not only for people starting
the technologies, as in developing world, but also in developed world. This justifies the initiation
of various international genomic networks including the International Coffee Genomics Network
(ICGN). Below are brief descriptions of the various DNA markers, many o f which were used in
various stages of this study.
4.1.1 Restriction Fragment Length Polymorphism
Restriction Fragment Length Polymorphism (RFLP) involves digestion (restriction) o f the DNA
being analysed, agarose electrophoresis, southern blotting and probing with labelled sequence-
specific probes (Botstein et al., 1980). It is limited by requirement of large amounts of high
quality DNA (1-10 pg per gel lane), but it has low start-up cost especially if probes are available
(probes from one species may work in several other species) and involves simple techniques.
RFLP markers are co-dominant and thus can analyse multiple alleles in a locus. Depending on
the probe, coding and non-coding sequences of DNA can be analysed. This methodology was
not used in this study.
21
4.1.2 Cleavable Amplified Polymorphic Sequences
Cleavable Amplified Polymorphic Sequences (CAPS) technique is related to RFLP in that
polymorphism is revealed by restriction, but differs in that the substrate is a locus specific PCR
product and revelation is by ethidium bromide (Konieczny and Ausubel, 1993). A segment of
DNA is amplified with locus specific primers and the product is restricted using various
enzymes. The restriction product is then analysed for polymorphism by electrophoresis in
agarose gel and staining in ethidium bromide. Total polymorphism is by both the PCR
(present/absent and size) and cleavage. This method is somehow less informative than RFLP
because only the amplified region of the genome is analysed. Specific restriction enzymes may
be used if the sequences of the PCR products are known and are polymorphic between
individuals screened in a population. Otherwise several enzymes are tested at random and those
that generate polymorphism are identified. This methodology was used to analyse PCR products
from DH plants using primers specific to the sequences o f RAPD markers identified by
Agwanda et al. (1997). The products were first sequenced and potentially polymorphic cutting
sites were identified (Section 5.1).
4.1.3 Randomly Amplified Polymorphic DNAs
Randomly Amplified Polymorphic DNAs (RAPD) is based on the fact that using short arbitrary
primer sequences; they can by chance anneal on random sequences within the genome in close
proximity and in opposite orientation to be amplified in a PCR programme (Williams et al.,
1990; Welsh and McClelland, 1990). The amplification products are then separated in agarose
gel and revealed by ethidium bromide, but they can also be analysed in acrylamide gel. The
technology is simple, low cost and the random primers are easily available. This method requires
low amount of DNA, which can be of lower quality than for RFLP, but optimization of PCR
conditions is needed to improve repeatability. The markers are scored as dominant. This
22

methodology was used to regenerate RAPD markers of CBD resistance that were identified by
Agwanda el al. (1997).
4.1.4 Sequence Characterised Amplified Regions
Sequence Characterised Amplified Region (SCAR) technique involves sequencing of markers
(DNA fragments) and designing locus specific primers can overcome some limitations of
particular markers like sensitivity to PCR conditions. The subsequent sequence-specific PCR
products may maintain the polymorphism of their parental markers, exhibit different
polymorphism like co-dominance while the parent markers were dominant, or loose the
polymorphism (Paran and Michelmore, 1993). New methodology for analysis of polymorphism
may then be employed like identification of polymorphic restriction sites in different alleles
followed by electrophoresis o f the restriction products (CAPS), or by single strand
conformational polymorphism (SSCP). In this study, SCARs were developed from AFLP
markers to facilitate mapping of AFLP markers onto coffee chromosomes (Section 5.1), to make
the AFLP markers more repeatable (Section 5.4) and for analysis of the diversity o f the SCARs
between C. arabica and its putative parents (Section 5.5).
4.1.5 Simple Sequence Repeats and Inter- Simple Sequence Repeats
Simple Sequence Repeats (SSRs) consist o f variable stretches o f repeated motifs o f one to six
nucleotides, which are abundantly and randomly found in eukaryotic genomes (Rafalski el al.,
1996). However, recent data suggest that their genomic distribution is non-random and are found
mainly in non-coding DNA regions (Li et al., 2002). First the genomic DNA is sequenced, SSRs
are identified and PCR primers are designed from the two sides flanking the SSR motif. The
primers are orientated such that they amplify the region carrying the SSR. Polymorphism is
largely due to how many times the motif is repeated in different chromosomes, but can also be
23
due to the sequences between the primer annealing sites and the repeated motifs. If the primers
are orientated such that they amplify the region between the repeated motifs, the product is
referred to as Inter-Simple Sequence Repeats (ISSR) and polymorphism is due to size of these
regions. The products are separated in acrylamide sequencing gels and can be revealed by
radioactive/fluorescent labelling or silver nitrate staining. SSR markers are generally co
dominant, highly repeatable and transferable between laboratories, making them ideal for
sharing. ISSRs are generally dominant but may sometimes be co-dominant. However, these
marker systems are more costly to develop because the genomic sequence has to be established
first. The most common steps in identification of SSR polymorphisms are:
1. Genomic library construction
2. Library screening by hybridization to enrich certain bases
3. DNA sequence determination of positive clones
4. Designing o f locus specific primers
5. PCR analysis and identification of polymorphism
6. Mapping o f polymorphic markers
High resolution electrophoretic separation is required to reveal allelic polymorphism that may
differ by only two base pairs. Denaturing poly-acrylamide gels are the best, but they require
radioactive, fluorescent labelling or silver staining to reveal the bands. However, electrophoresis
in high concentration agarose gels followed by ethidium bromide staining can sometimes offer
satisfactory results (Rafalski et al., 1996). Such a procedure would make them relatively easy to
use, especially in low technology laboratories. Although the expectation is the occurrence of one
locus, multiple loci may occur due to duplication, or as in polyploids, due to homologous loci in
the different genomes. Null alleles may also occur due to deletion or alteration of the priming
sites. SSRs have a mutation rate ranging from 10'2 to 10-6 events per locus per generation, which
24
is very high compared to point mutations especially at coding gene loci (Li et al., 2002). They
have the highest information content compared to other markers but their very high cost of
development may not be justified in many laboratories. This limitation might be reduced once
more laboratories submit the SSR sequences they develop into public domain. Use of SSRs is
also made easier by the fact that those developed from sequences o f one taxon may work in other
taxa. For example, SSRs that are developed from C. arabica or C. canephora work well in other
Coffea species and even in the closely related genus Psilanthus (Combes et al., 2000; Coulibaly
et al., 2003, Poncet et al., 2004). Microsatellites from Coffea spp were tested for linkage to CBD
resistance in Section 5.4 and for their diversity between C. arabica and its putative parents
(Section 5.5).
4.1.6 Amplified Fragment Length Polymorphism
Amplified Fragment Length Polymorphism (AFLP) has most characteristics of a good marker,
except co-dominance and a degree of non-repeatability. It combines the random polymorphism
of restriction sites and a few nucleotides (typically 6) adjacent to the restriction sites. It takes
advantage of the polymerase chain reaction (PCR) and the specificity of restriction enzymes, to
amplify a limited set o f DNA fragments from a specific DNA sample. It analyses many loci over
the entire genome in one reaction (Vos et al., 1995; Rafalski et al., 1996; Blears et al., 1998;
Robinson and Harris, 1999). Due to the high polymorphism that they can detect, AFLP markers
are a priority as the most efficient markers (Mueller and Wolfenbarger, 1999). Garcia et al.
(2004) found AFLP to be best suited for fingerprinting and assessing relationship in maize
compared to other markers based on its practicability and precision of results. Although AFLP
markers analyse a large part of the genome simultaneously, they occasionally exhibit clustered
distribution especially in centromeric regions. This may be affected by the choice o f enzymes
25

(methylation sensitive or insensitive) and this feature reduces the degree of whole genome
coverage (Saliba-Colombani et al., 2000; Wang et al., 2005).
The AFLP methodology involves digestion of high quality genomic DNA (0.20-0.50|ig) with
restriction enzymes (usually a combination of a rare and a frequent cutter), ligation of double-
stranded adaptors to the restriction ends, pre-selective and selective amplifications and then
electrophoresis. During the amplifications, oligonucleotide primers complementary to the
adaptors are used. One selective nucleotide is added to the 3’ end of the primers during pre-
selective stage, and two additional nucleotides in the final amplification stage. During final
amplification, the primer matching the adaptor to the rare cutter is end-labelled by a radioactive
or fluorescent label, and therefore only fragments with this primer are visualised after
electrophoresis. Many laboratories use £coRI and Msel restriction enzymes, both o f which have
restriction sites distributed over the genome, are insensitive to methylation and can digest in the
same buffer and at the same temperature (Rafalski et al., 1996). These enzymes also permit
restriction and ligation reactions to be done simultaneously under the same conditions.
Despite the high informative potential of AFLP, it is more sophisticated involving more steps
and reagents, thus making it more laborious and requires higher technical skills. The method also
requires relatively higher amount of high quality template genomic DNA to start a reaction.
However, there is high multiplicity in down stream reactions making it possible to test many
primer combinations without going back to the genomic DNA stock. The method is relatively
expensive, much o f the cost being the synthetic primers and labelling chemical (radioactive or
fluorescent) (Rafalski et al., 1996). Capital requirements vary with the electrophoresis and
revelation methodologies used. AFLP polymorphism can be co-dominant but this relationship is
not obvious and requires more inheritance or sequence analysis for verification. Co-dominance is
26

mainly due to differences in fragment sizes while dominance is mainly due to presence or
absence of restriction sites or primer annealing sites. Pearl et al. (2004) observed eight AFLP
bands to be co-dominant in C. arabica. In tomato, Saliba-Colombani et al. (2000) observed as
many as twenty eight markers to be co-dominant, while Wang et al. (2005) observed two co
dominant AFLP bands that were amplified by different primer pairs in pawpaw (Asimina
triloba). However, AFLPs are usually analysed as dominant. In this study, AFLPs were used to
map the gene for resistance to CBD (Sections 5.1 and 5.4).
In most cases, no one fingerprinting technique is ideal for all applications. However, AFLPs are
quickly becoming the tool of choice for many applications and organisms. Potential applications
include screening DNA markers linked to genetic traits, parentage analysis, forensic genotyping,
diagnostic markers for pathogen borne diseases, and population genetics. Since the AFLP
technique can be applied to a wide variety o f organisms w ith no prior sequence information, this
technique has the potential to become a universal DNA fingerprinting tool. Universal reagents
and kits for this methodology are also now commercially available. Molecular markers of choice
therefore include amplified fragment length polymorphism (AFLP) for rapid genome wide
analysis, and microsatellites and sequence characterised amplified regions (SCARs) for highly
repeatable anchor markers.
4.2 C. arabica genome
The subjects of origin, evolution and diversity of C. arabica genome have been reviewed
recently by Anthony and Lashermes (2005). There are about 100 species in the genus Coffea but
C. arabica is the only tetraploid (2n = 4x = 44) (Charrier and Berthaud, 1985). It has for long
been suggested that C. arabica is an allotetraploid with diploid meiotic behaviour, and has a
centre of diversity outside the centre of origin of its parental diploid Coffea species (Carvalho,
27
1952). The various molecular markers developed in recent times have been used to study this
subject. Genomic analysis using Restriction Fragment Length Polymorphism (RFLP) of
chloroplast DNA (cpDNA), which is maternally inherited, demonstrated that Coffea eugenioides
(or a closely related ecotype such as Coffea anthonyi: formerly referred to as Coffea sp
moloundou (Anthony et al., 2006)) donated the maternal genome (Lashermes et al., 1995). On
the other hand, analysis of ribosomal DNA (rDNA) demonstrated that Coffea canephora (or a
closely related ecotype like C. congensis) donated the paternal genome (Lashermes et al., 1995).
The amphidiploid nature of the C. arabica genome was further confirmed almost
simultaneously, by two independent teams using genomic in situ hybridisation (GISH) (Raina et
al., 1998; Lashermes et al., 1999). Using the genomes o f the two potential diploid progenitors as
probes, the affinity o f the two sets of chromosomes in C. arabica to those of the putative
progenitors was demonstrated. Lashermes et al. (1999) further suggested the speciation of C.
arabica took place not more than 1 million years ago, and the two constitutive genomes in the C.
arabica (Ea and Ca referring to the chromosome sets from C. eugenioides and C. canephora
respectively) have not differentiated much from their unique donor parents. The two sets of
chromosomes in the C. arabica genome display a disomic inheritance pattern due to genetic
control rather than structural differences o f the chromosomes (Lashermes et al., 2000b; Herrera
et al., 2002).
The nuclear DNA content of C. arabica is about 2.6 lpg with a dihaploid (2x) estimate of about
1300Mb (Cros et al., 1995). The genetic size of C. arabica genome can only be deduced from
that of the haploid genome of C. canephora which is about 1400 cM corresponding to about 570
kb per cM (Lashermes et al., 2001), though the physical size is less than twice that of C.
canephora (700 Mb). There possibly could be factors such as gene loss/silencing or differential
expression that occur after polyploidization (Adams and Wendel, 2005). These factors might
28
also have occurred in the speciation o f C. arabica. It is evident that C. arabica is more
susceptible to diseases than its diploid progenitors and it has diverged in other traits such as
quality. The functional status o f the constitutive genomes in the C. arabica is therefore an
interesting subject to investigate.
4.3 Genetic variability and introgression into Coffea arabica
Morphologically, there are distinctive characters observed in varieties o f C. arabica such as
growth vigour, canopy habit, leaf size, leaf colour, shape of leaves, angle of branching, berry
shape, bean size and pest resistance. However at DNA level, C. arabica generally exhibits low
variability that is attributed to its allotetraploid origin, selfing reproductive nature, and recent
speciation (Lashermes el al., 1999). Cultivated Arabica coffee varieties are o f even lower genetic
diversity compared to wild accessions, because they are derived from a few individual
collections (Lashermes et al., 1996; Anthony el al., 2002a). This means that cultivated C.
arabica is more vulnerable to pests and diseases than the wild population. This is typical due to
domestication bottleneck, intensive breeding and pedigree selection that make genetic variability
within gene pools o f many crops to be at risk (Tanksley and McCouch, 1997; Schneider, 2005).
Inter-specific crosses help to increase the size of the gene pool and the contribution of wild
species in the form o f introgression lines is therefore of high value, especially in respect to traits
like disease resistance. From the discussions above, Arabica coffee is certainly one such
example.
Although breeders have managed to exploit this low variability to develop improved coffee
varieties, transfer o f traits of agronomic importance from other Coffea species is desirable. One
avenue of such transfer is by use of Hibrido de Timor (HDT) (Timor hybrid). This is a
spontaneous inter-specific cross between C. arabica and C. canephora that was observed as an
29
atypical tree in a C. arabica field planted in 1927, in the island of Timor (Bettencourt, 1973).
Details are given in section 1.3. Progenies o f this hybrid (mainly three accessions (numbers HDT
832/1. HDT 832/2 and HDT 1343) have been and continue to be used worldwide as the main
source o f resistance to various pests including CBD, CLR and nematodes (Meloidogyne spp).
Molecular genetic analysis of derivatives of these progenies have demonstrated that they
variously contain an estimate o f 9-29% of the C. canephora genome, and they constitute a
considerable source o f diversity for Arabica coffee improvement (Lashermes et al., 2000a).
Breeding programmes utilizing these progenies have given rise to introgressed cultivars like
'IAPAR59' in Brazil, ‘Variedad Colombia' in Colombia ‘IHCAFE 90' and ‘Costa Rica 95’ in
Central America ‘Ruiru 11’ in Kenya and ‘Sin 12’ in India (Anthony et al., 2002b). The
continued use of the derivatives o f HDT for Arabica coffee breeding emphasizes the importance
of these materials and introduction of genes from diploid relatives of C. arabica. It should be
however noted that introgression of some C. canephora genomic fragments into C. arabica
varieties may affect their beverage quality (Bertrand et al., 2003). Marker assisted breeding can
help to select for desired fragments and against unwanted ones.
Various researchers have used different DNA marker systems to assess the genetic variability of
C. arabica including HDT derivatives. Lashermes et al. (1993) did not observe any RAPD
polymorphism between pure C. arabica accessions, but there was some difference between them
and an HDT accession. Combes et al. (2000) observed a mean heterozygosity value o f only 0.04
in C. arabica using SSRs compared to 0.47 in C. canephora. Similarly, Moncada and McCouch
(2004) observed highest average number o f SSR alleles/locus in diploid Coffea species (3.6), less
in wild C. arabica tetraploids from Ethiopia (2.5) and the least in C. arabica cultivars (1.9). Aga
et al. (2003) observed a mean diversity value of 0.30 between wild C. arabica populations from
different regions o f Ethiopia by RAPD. Using RAPD and ISSR respectively, Masumbuko et al.
30
(2003) and Masumbuko and Bryngelson (2005) observed clustering of C. arabica accessions
from different regions o f Tanzania but with low overall genetic diversity. Pearl et al (2004)
observed extremely low polymorphism between two pure Arabica varieties with only two
polymorphic bands from 24 AFLP primer combinations (0.083 polymorphic bands per primer
pair). They however observed a slightly higher polymorphism o f an average o f 1.34 polymorphic
bands per primer pair between a pure Arabica cultivar and cv Catimor (a derivative o f HDT).
AFLP variation within and between C. arabica cultivars is similar but accessions within a
cultivar tend to form clusters (Steiger et al., 2002). Consequently, it is difficult to identify
cultivar-specific markers especially in the absence of introgressed genetic material, but some
DNA markers can distinguish accessions derived from the two basic populations of cultivated C.
arabica i.e. ‘Typica* and ‘Bourbon’ (Anthony et al., 2002b). Although Crochemore et al. (2004)
reported the ability o f identify ing seeds o f different coffee cultivars using RAPD, it should be
noted that they used both HDT derivatives and interspecific crosses (C. arabica x C. canephora).
Low variability of cultivated varieties compared to wild relatives has also been reported in maize
using molecular methods (Matsuoka et al., 2002) and cassava (Olsen and Schaal, 2003), which is
an aspect of domestication bottleneck that reduces the genetic variability of cultivated crops
(Tanksley and McCouch, 1997; Schneider, 2005).
Another source of genetic introgression into C. arabica is that from C. liberica genome that
includes a fragment that carries the SH3 gene for resistance to CLR (Prakash et al., 2002; 2004).
Genetic introgression into C. arabica from its wild relative has thus played an important role in
its production and this will continue even in future. It also can be anticipated that artificial
introduction of desirable genes will be done to supplement natural events. Molecular and genetic
engineering tools will be vital in this respect.
31

4.4 Molecular markers of disease resistance in Arabica coffee
Development of molecular markers of resistance to CBD in coffee has been of interest for a
period and still continues to be. There are differences in isozyme patterns, peroxidase and
proteolytic activities between resistant and susceptible coffee plants infected by C. kahawae with
some potential to be developed for screening purposes (Gichuru, 1993, Gichuru et al., 1996,
Gichuru and King’ori, 1999). Agwanda et al. (1997) were able to identify RAPD markers of
CBD resistance derived from HDT. However analysis by methodologies like AFLP,
microsatellites and SCARs would improve DNA markers in versatility and reproducibility. Noir
et al. (2003) identified 14 AFLP markers derived from C. canephora by introgression through
HDT that are associated with a major gene for resistance to Meloidogyne exigua,. Prakash et al
(2004) similarly identified 21 AFLP markers introgressed from C. liberica that are linked to Sh3
gene for resistance to CLR. It therefore appears possible to use the same methodology and
develop markers for resistance to other diseases. Nine families of resistance gene analogs
(RGAs) of NBS type have been identified (Noir et al., 2001). It is anticipated that use of primers
targeting more conserved motifs might reveal more RGAs. Extensive studies of the RGAs are
required and they might ultimately lead to mapping the RGAs as resistance gene candidates
(RGCs). More research is thus required to develop markers for resistance genes and facilitate
marker-assisted breeding and finally isolate the genes.
The actual genetic map of C. arabica has not been developed yet. On the other hand, a genetic
map of C. canephora that distinguishes eleven (11) linkage groups that potentially correspond to
the 11 chromosomes of C. canephora genome was developed by Lashermes et al. (2001). This
map permits the mapping of different markers onto C. canephora genome, which in turn
corresponds to the basic haploid Coffea genome. Such a strategy for mapping markers of
resistance would enhance the knowledge o f their genomic organisation.
32

4.5 Diversity of Microsatellites and SCARs
Microsatellites have characteristic genomic distribution and motif dependent dispersion in the
genome, with most o f them being concentrated in centromeric chromosomal regions (Schmidt
and Heslop-Harrison, 1996). Microsatellites and their flanking DNA sequences are rarely
conserved in a whole genus leave alone other genera in the family, but some may be conserved
even across the genus (Hale et al., 2005). However, microsatellites developed from one Coffea
species may be transferable to other species with a fair degree o f success, and even to the related
genus Psilanthus (Combes et al., 2000; Coulibaly et al., 2003; Poncet et al., 2004). Poncet et al.
(2004) reported that the transferability o f 110 microsatellite primer pairs developed from C.
arabica ranged from 72.7 to 86.4% in other Coffea species. Microsatellites vary in the number of
alleles in different Coffea species. Moncada and McCouch (2004) observed that diploid Coffea
species averaged 3.6 alleles per microsatellite locus, wild tetraploid C. arabica averaged 2.5
alleles per locus and cultivated C. arabica had only 1.9 alleles per locus. In addition, 55% of the
alleles found in wild C. arabica accessions were not shared with the cultivated genotypes. They
also observed that the accessions of HDT in their study resembled C. arabica cultivars more than
C. canephora accessions. On the other hand. Anthony et al (2002b) identified four microsatellite
alleles related to introgression in HDT and observed closer similarity between the introgressed
lines and C. canephora from Central Africa than with a C. canephora accession from West
Africa. Poncet et al. (2004) observed a maximum of 9 and 8 alleles per locus in C. canephora
and C. pseudozanguebariae respectively. The two species shared a total of thirty polymorphic
loci, which indicated microsatellite evolution with shared ancestry.
Samples showing only one microsatellite allele are usually considered to be homozygous and
this omits occurrence of null alleles. In C. canephora and C. pseudozanguebariae, Poncet et al.
(2004) observed more than 3 alleles per polymorphic locus and estimated null allele percentages
33
o f -9% and -11% in the two species respectively. In maize, Matsuoka et al. (2002) observed
modest rates of null phenotypes averaging less than 5% when analysing microsatellites derived
from maize in diploid Zea species. Microsatellite loci may also be duplicated in a genome but the
duplicated loci may or may not amplify depending on conservation of the primer binding sites.
Coulibaly et al. (2003) observed two microsatellite loci which were duplicated in both C.
canephora and C. heterocalyx and that unlike AFLPs, SSRs are not clustered and are randomly
distributed in the genome. Matsuoka et al. (2002) also observed duplicated microsatellite alleles
in Zea species i.e. more than two products per plant (1.8% for teosinte and 0.02% for maize
landraces). This could have been due to duplicated alleles, contamination o f PCR or some other
types of error such as inter well leakage. Such results may be treated as missing data and
therefore eliminate bias.
Between species, a given microsatellite may have different genomic location and therefore be
subjected to different evolutionary forces (Poncet et al., 2004). Diversity o f microsatellites may
also differ in relation to the focal species (from which they were developed). Hale et al. (2005)
observed that there were generally more repeats in the focal species in the genus Clusia than in
non-focal species. Although they tested only 3 microsatellites, Hale et al. (2005) reported that
there is a relationship between polymorphism and the size of a microsatellite. The diversity of
microsatellites may also be affected by factors other than the number o f repeat units. By
sequencing the amplification products, Matsuoka et al. (2002) observed that variability was not
restricted to repetition of the motifs but also included insertions and deletions (indels) in the
regions flanking the repeat motifs. They showed that 40 out o f 46 microsatellites have allele
distributions that do not strictly adhere to the simple model of allelic variation based on changes
in the number of repeated motifs. This high level of occurrence o f indels prompted the authors to
suggest the term Indel-Rich Regions (IRRs) to describe the maize microsatellites. The
34

occurrence of indels may have been enhanced by the pre-screening methodology like
polymorphism in agarose that requires large size differences to be noticeable. Hale et al. (2005)
also reported stepwise motif mutations and indels in Clusia species. Microsatellite data may
differ with the method of analysis due to factors such as sensitivity of detection or efficiency of
resolution. For example, Poncet et al. (2004) reported a discrepancy between positive
amplifications observed in agarose and by fluorescent analysis in acrylamide gel, such that some
samples that had detectable products in agarose were negative in the acrylamide. This is an
indication of analytical complications that may be purely technical.
Microsatellites can be viewed as SCARs with highly variable segments in between the priming
sites. Other types o f SCARs such as those developed from AFLP bands lack such a segment and
are expected, at least in theory, to be less polymorphic in size since this is entirely by indels.
Poncet et al. (2005) tested the performance of 14 SCAR primers developed from AFLP markers
specific to C. pseudozanguebariae, and they observed that the primers amplified only one band
with a size similar to the parental band in other Coffea species. However there were some null
allele phenotypes but the cross transferability was high with a minimum of 58%. Furthermore,
the amplification pattern in C. arabica was a juxtaposition of the patterns o f its putative diploid
parent species, and the SCARs did not conserve the polymorphism of parental AFLP bands.
These results not only confirm the ancestral parentage but may also help in analysing the
behaviour of the sub-genomes in the tetraploid C. arabica, especially by analysing a large
number of accessions of the different species.
The characteristics o f a marker system including null alleles, low or lack of polymorphism,
hyper-polymorphism and duplication of alleles in the genome present experimental challenges.
In this study, the distribution o f microsatellite and AFLP-derived SCARs was assessed in
35

relation to C. canephora chromosomal fragments introgressed into C. arabica via HDT. The
aims were to evaluate the possibility of tagging or tracing these fragments and their homologs in
C. arabica genome and its putative parents, seek to reveal genetic and evolutionary inter
relationships and evaluate challenges that are likely to be encountered in terms of practical utility
of these marker systems in breeding.
4.6 Major commercial cultivars of C. arabica in Kenya
Two of the most widely grown Arabica coffee varieties in Kenya are SL28 and SL34. They
belong to a series o f single-tree selections done at Scott Laboratories between 1935 and 1939 in
Kenya, thus the prefix as ‘SL’ (Jones, 1956). Both are of very fine cup quality and high yields
but very susceptible to all major coffee diseases present in Kenya. Coffee breeding programmes
in Kenya traditionally use these varieties as recurrent parents for agronomic traits, especially the
fine cup quality. Another cultivar is K7, which is a progeny of one of two trees selected in 1936
from ‘French Mission’ for tolerance to CBD and CLR (Jones, 1956). The composite hybrid
Ruiru 11 bred for compact growth and resistance to both CBD and CLR was released for
commercial planting in 1985 (Nyoro and Sprey, 1986) and is still in high demand.
4.7 Coffee varieties used in this study
Apart from cvs SL28 and Catimor from Kenya that constituted the bulk o f the study material,
other C. arabica varieties and Coffea species were also used for comparison or to take advantage
of knowledge previously generated using the varieties or their progenies. Cv SL28 is used as a
recurrent parent in breeding programmes in Kenya and is a Bourbon type of C. arabica.
Accessions of cv Catimor in Kenya were introduced from Colombia and have been shown to
carry a resistance gene to CBD (Van der Vossen and Walyaro, 1980). All the Catimors currently
present in Kenya were bred from the HDT accession number 1343 and the numbers after them
36

e.g. cvs Catimor 88 or 127, which were used a lot in this study, denotes single tree descent as
received from Colombia. Before Catimor was introduced into Kenya, progenies of HDT
(accession HDT 1349/269) had been introduced in 1960s and they were used in this study to
survey for prevalence o f markers for CBD resistance. C. arcibica cvs Villasarchi and Caturra that
are cultivated in Central and South America also belong to Bourbon type of C. arabica
(Lashermes et al., 2000a) and are susceptible to CBD, CLR and nematodes. They were crossed
with derivatives o f the original accessions of HDT to give rise to cvs Sarchimor and Catimor
respectively. T5296 is a Sarchimor line derived from the HDT accession 832-2. ET 6 is a sub-
spontaneous collection from Ethiopia whose F2 progeny with T5296 was used to map some C.
canephora chromosomal fragments present in HDT derivatives (Ansaldi, 2003). Analysis of
markers of interest on the same DNA samples that she used would enable mapping them directly
onto the same maps. Although there is intra-cultivar variation, hypocotyls inoculation tests have
demonstrated that T5295 has resistance to CBD (Bertrand, Unpublished data). It was therefore
expected that the fragment carrying the resistance would be common between T5296 and the
resistant cv Catimor lines in Kenya.
The cultivar IAPAR59 is also a Sarchimor line that is cultivated in Brazil and was used by Noir
et al. (2004) to construct a BAC library for Coffea arabica. These two varieties (T5295 and
IAPAR59) represent highly introgressed derivatives of HDT. For chromosomal analysis of the
coffee genome without complications due to heterozygosity or multiplicity expected in the
tetraploid C. arabica genome, a C. canephora clone IF200 and a doubled haploid (DHs)
mapping population derived from it were used (Lashermes et al., 1994; Lashermes et al., 2001).
Since the same plants were used by Lashermes et al. (2001) to develop a genetic map, data
generated in this study could be directly analysed alongside that of their study especially in
mapping of linkage groups corresponding to chromosomes. C. eugenioides which is a putative
37

progenitor of the C. arabica genome was also included in some studies to generate information
on alleles in C. arabica which could be o f Ea sub-genome while the C. canephora clone IF200
played the counterpart role regarding the Ca sub-genome (Lashermes et al., 1999). To assess the
diversity o f microsatellites and SCAR markers in C. arabica and its progenitor genomes, diverse
accessions of C. arabica (wild, cultivated and introgressed), C. canephora and its close relative
C. congensis plus C. eugenioides and its close relative C. anthonyi were used.
38

CHAPTER 5. SECTIONS ON SPECIFIC STUDY AREAS
SECTION 5.1. IDENTIFICATION OF C canephora CHROMOSOMAL FRAGMENTS
PRESENT IN LINES OF cv CATIMOR IN KENYA AND POTENTIAL
MARKERS FOR CBD RESISTANCE
5.1.1 INTRODUCTION
Accessions of advanced generations (F3 and F4) of cv Catimor were first introduced in Kenya in
1970s and they were screened for resistance to CBD and CLR upon which susceptible ones were
discarded (van der Vossen and Walyaro, 1981). The remaining accessions are homozygous for
resistance to CBD and CLR and compact growth (van der Vossen and Walyaro, 1981) and they
constitute very important donor genotypes. This selection is expected to have reduced the initial
diversity. The disease resistance in these accessions is due to C. canephora chromosomal
fragment(s) introgressed through the Hibrido de Timor (HDT) lineage. It is of interest therefore
to identify the diversity o f the introgressed fragments present in the current breeding populations
because these are the candidate carriers for the resistance to the two diseases. This information
would also facilitate identification of the presence of other useful fragments like those conferring
resistance to nematodes, by comparison with results of other research work with similar
genotypes. This information is also very useful in designing conservation and utilization
strategies of accessions o f HDT derivatives, such that accessions with fragments that are absent
in cv Catimor can be given priority for conservation so as to widen the diversity.
It is also of interest to identify inbred lines that are unique in presence or absence of specific
introgressed C. canephora fragments. Any unique phenotype of these plants can thus be
attributed to the introgression genotype. Such plants can be obtained by analysis of F2 of
backcrosses or advanced selfings (Zamir, 2001; Jeuken and Lindhout, 2004; Von Korff et al.,
2004). In this study, analysis of accessions of cv Catimor. BCi Fi and BC| F2 progenies derived
39

from cultivars Catimor and SL28 was expected to widen the coverage o f the polymorphism
between and within the lineages of cv Catimor. It should be noted that these studies on the
introgressed fragments in cv Catimor were done while at the same time two F2 populations were
being raised for mapping resistance to CBD and therefore advance identification o f candidate
markers for CBD resistance was advantageous.
Among coffee populations developed in various coffee breeding programmes in Kenya, there are
different progenies o f crosses between cvs Catimor and SL28 that are made with the aim of
introducing disease resistance to the susceptible commercial cv SL28. It is possible to use these
materials to identify markers or candidate markers for traits such as disease resistance depending
on the appropriateness o f the progeny, though some difficulties might be encountered. One
problem is failure to identify individual parents because the crosses were not based on individual
plants. The crosses were made using bulked pollen from several trees of a cv Catimor line to
pollinate several trees o f cv SL28 and the Fi seed was bulked. In this study, individual parents of
the F| and BC| Fi plants were therefore not identified.
Five C. canephora chromosomal fragments that are introgressed into C. arabica through HDT
have been mapped using an F2 generation of a cross between a Sarchimor line (T5296) and a
pure Arabica line (ET6) from Ethiopia (Ansaldi, 2003; Appendix 2). The fragments are serially
designated as T l, T2, T3, T4 and T5. A genomic segment homologous to the introgressed
fragment T4 has been identified in the genetic map of C. canephora corresponding to Coffea
chromosomes (Lashermes el al., 2001, Lashermes, Unpublished data), but the segments that are
homologous to the other four fragments (T l, T2, T3 and T5) have not been identified. One way
of identify ing the location of these fragments is by sequencing their markers, designing sequence
specific primers and then testing the PCR products for polymorphism in the C. canephora
40
mapping population (Lashermes el al., 2001). This would enable chromosomal positioning of the
fragments and reveal their organisation in the Coffea genome. In this study, the same double
haploid (DH) population that was used by Lashermes el al. (2001) was used towards this
endeavour. It is important to note that in different derivatives o f HDT, the number and size of
introgressed fragments of C. canephora genome may differ from those mapped by Ansaldi
(2003). This would obviously have different implications in phenotypes of different introgressed
lines/accessions. During this phase of the study. AFLP markers of the mapped C. canephora
genomic fragments were used to detect the presence of these fragments in accessions of cv
Catimor in Kenya. Alongside this observation, other AFLP bands that were polymorphic
between the cvs Catimor and SL28 were identified. The identified fragments and polymorphic
markers therefore constituted an inventory of candidates o f disease resistance, for later
investigation in F2 populations and other subsequent studies. The genomic organisation of the
fragments was then investigated as SCARs by sequencing their AFLP markers and designing
specific primers.
Another possible way for identifying the candidate markers for CBD resistance was to establish
any relationship between the polymorphic markers and any markers that are already developed.
Agwanda el al. (1997) identified three RAPD markers of CBD resistance derived from HDT.
However they did not map these markers though they recommended the analysis o f the markers
in a segregating F2 population as a means of further confirmation. This could be achieved by
regenerating the RAPD markers or SCARs developed from them in a segregating population.
Furthermore, two o f these markers (those amplified by RAPD primers N18 and M20) have been
cloned, sequenced and SCAR primers designed (Lashermes, personal communication).
However, apart from tests in agarose, in which there was no polymorphism, no further studies
have been done with the SCARs. It was therefore of interest to try to map them onto the
41

introgressed fragments, an aspect which would indicate the priority candidate carrier(s) of CBD
resistance. Additionally, this would improve the markers because SCAR markers developed
from RAPD markers are more allele specific (non-random), can be amplified under higher
stringency conditions and are less sensitive to PCR conditions (Paran and Michelmore, 1993;
Zhang and Stommel, 2001). SCAR markers may not display the polymorphism o f the parent
bands and various approaches like redesigning of primers; optimization of PCR conditions and
assessment by other methods like cleavage (CAPS) may help in recovery o f polymorphism. All
these options were differentially tried in this study with both the AFLP and RAPD derived
SCARs. If polymorphic, the SCARs developed from the RAPD markers o f resistance to CBD
would make the linkage map denser and provide further proof of linkage to the resistance as
identified from independent works. The SCARs would also be used to analyse their organisation
in coffee genome using the DH population.
5.1.2 OBJECTIVE
The objective of this phase of study was to identify and characterise introgressed C. canephora
fragments in lines o f cv Catimor used as donors of resistance to CBD and CLR in Kenya, and
subsequently establish an inventory of candidate markers for disease resistance.
5.1.3 MATERIALS AND METHODS
5.1.3.1 Plant genotypes
Mature coffee trees derived from crosses between different lines of cv Catimor that are resistant
to CBD and CLR and the susceptible commercial cv SL28 were selected randomly in CRF field
for this study. The sample constituted of two trees of different cv Catimor lines (line 127: PI and
line 88: P2), two trees of cv SL28 (P3 and P4), and eight BC| Fi plants derived from different
lines of cv Catimor (Catimor x (Catimor x SL28)). A total of 76 BC| F2 seedlings were raised
42

and used in this study from selfed seeds of three different BCi F| plants to obtain three
populations namely; population A and population B (both derived from cv Catimor line 127),
and population C derived from cv Catimor line 129. It was not possible to trace the individual
trees used in breeding o f the BC| F| plants. DNA stock of an accession of Sarchimor line T5296
was also obtained at IRD for these studies. This accession was the HDT derived parent that was
used to raise the mapping population used by Ansaldi (2003) to map the introgressed fragments.
5.1.3.2 Sampling and treatment of leaves
The details of how the plant materials were handled prior to DNA extraction at IRD in
Montpellier, France was influenced by their stage of development.
5.1.3.2.1 Mature plants
The four representative parental trees of cvs Catimor and SL28 from Kenya (PI, P2, P3 and P4)
and the BC] Fi trees were mature trees growing in breeding fields at CRF, Ruiru, Kenya. Healthy
disease free leaves were picked preferably from second and third nodes from the growing tips,
w rapped in tissue papers and wetted slightly. Groups of the wrapped leaves were then packed in
polythene bags, stapled to seal and then packed in paper envelopes. The parcels were then sent
by express mail to IRD, Montpellier, France on the same day. Upon arrival at Montpellier which
took 3-4 days after dispatch, the leaves were lyophilized immediately or dipped in liquid
nitrogen and then stored at -80 °C until when they were lyophilized. Lyophilization was by
dipping the leaves wrapped in paper towels into liquid nitrogen and then rapidly transferring
them into a pre-cooled lyophilizer (Freeze mobile 5SL, Virtis Co. Inc. New York, 12525). After
72 hours of lyophilization, the leaves were stored in a cold room at 4°C awaiting DNA
extraction.
43
5.1.3.2.2 Seedlings
Seeds obtained by selfing BC| F| plants were germinated in sterile sand at CRF until the
cotyledons of the resultant BCi F2 population were open. They were then transplanted into
polythene bags and transferred into a nursery. When the seedlings developed two to three pairs
of true leaves, the lowest pair was picked, wrapped in paper towels and dispatched to
Montpellier for subsequently lyophilization as explained above for mature plants (Section
5.1.3.2.1).
5.1.3.3 Extraction of genomic DNA
Genomic DNA was extracted from the lyophilized leaves by the method o f Diniz et al. (2005)
with minor modifications. Fifty (50) to hundred (100) milligrams of lyophilized leaf material
without mid-veins was placed into round bottomed 2 ml plastic tubes and two metal beads of 5
mm diameter were added into each tube. The tubes were put into horizontal mechanical shaker
(Retch MM300) for 1 min at a frequency o f 30 cycles/s to obtain fine powder. In each tube, 400
pi each of extraction and lysis buffers respectively (Appendix 3) were added, vigorously shaken
to mix and incubated at 62 °C in a water bath for 20-30 minutes with regular shaking. After
incubation, 1 ml o f chloroform/isoamyl-alcohol mixture, 24:1, was added to each tube, then
mixed vigorously by shaking and centrifuged at 13000 rpm for 5 minutes in a desktop micro-
centrifuge. The supernatants were carefully pipetted out into new 2 ml tubes. Though not of
absolute necessity, a second centrifugation at this stage was generally helpful to eliminate any
debris pipetted with the supernatant before proceeding to the next step. Twenty to thirty micro
litres of RNase (10 mg/ml) was added to the supernatants and incubated at 37 °C in a water-bath
for 30 minutes. A volume of isopropyl alcohol equal to the volume of each supernatant was
added into each tube, and mixed gently by inverting the tubes several times to precipitate DNA.
The suspended DNA was centrifuged at 13000 rpm for 5 min to obtain a DNA pellet and the
44

supernatant was carefully removed. The DNA pellets were then washed with 200pl of 70%
ethanol and centrifuged at 13000 rpm for 3 minutes. The ethanol was drained by decanting or
micro-pipetting, and the pellets dried in a vacuum centrifuge for 20 minutes. The pellets were
dissolved overnight in 20-40 pi o f TE (Tris-EDTA; Appendix 3) (depending on pellet size) at 4
°C. Estimation of DNA quantity was done by agarose gel electrophoresis. The stock solution and
or their 10'1 dilution were electrophoresed in 1% agarose gel (QBiogene, France) and visually
compared to standardized Lambda DNA ladders (Promega, Madison, WI, USA). This procedure
also allowed assessment of the DNA quality attributes such as degradation and contamination
that distort its migration. The gel was made in 0.5X TAE buffer (Tris/Acetic acid/EDTA;
Appendix 3) and electrophoresis was done in the same buffer in a horizontal trough at 50 W for
1.5 hr. DNA was visualized and photographed in UV trans-illumination chamber after staining in
Ethidium Bromide (2.5 mg/1) for 5 minutes.
5.1.3.4 AFLP analysis
The AFLP protocol used was basically as developed by Vos et al. (1995) and adopted by
Lashermes et al. (2000a) for coffee but with some modifications. The stepwise procedure is
presented below.
5.1.3.4.1 Digestion of DNA
The genomic DNA mother stocks were diluted to 50 ng/pl and 5 pi of this solution (a total of
250 ng of DNA) was pipetted into 0.5 ml tubes. The tubes contained 20 pi o f digestion mixture
comprising of 0.2 pi of £coRI enzyme (lOU/pl, Invitrogen, Life Technologies), 0.4 pi of Mse\
enzyme (5 U/pl, Invitrogen, Life Technologies), 5.0 pi of T4 DNA Ligase buffer (5X, Gibco
BRL) and 14.4 pi o f water (Chromatography grade, Merck KGaA, Germany: hereafter referred
to as PCR water). The mixture was vortexed slightly and incubated at 37 °C for 3 hr and the
45

digested DNA was visualized in 1% agarose gel. Samples that were difficult to digest were
excluded from later procedures. The enzymes were not denatured at the end of this digestion step
so as to allow any remnant undigested DNA to be digested during the ligation step below.
5.1.3.4.2 Ligation
To each digestion tube, 25 pi o f ligation mixture containing; 1 (il each of £coRI and Mse 1
adaptors (Appendix 3), 5 pi of T4 DNA Ligase buffer (5X, Invitrogen), lpl of T4 DNA ligase (1
U/pl. Invitrogen) and 17 pi of PCR water was added. The ligase buffer was vortexed before
pipetting the necessary volume to completely dissolve any precipitates. The components were
mixed by gently turning the tube upside down several times because T4 ligase is fragile and
needs gentle handling. The mix was incubated for 3 hr at 37 °C and the enzymes denatured at 60
°C for 10 min.
5.1.3.4.3 Pre-amplification
The ligation products were diluted ten times or less depending on the observed intensity of the
digestion product in agarose (Section 5.1.3.4.1). Five micro-litres of this dilution was used for
pre-amplification in a 50 pi mixture containing 0.5 pi of £coRI pre-amplification primer (150
ng/pl). 0.5 pi of Msel pre-amplification primer (150 ng/pl), 5pl of buffer (10X, Promega), 5 pi
o f MgCl2 (25 mM). 0.2pl Taq DNA polymerase (5U/pl, Promega), 2 pi o f dNTPs mix (5mM;
Appendix 3) and 31.8 pi of PCR water. Only one £coRl pre-amplification primer (E+A) and two
Msel preselection primers (M+A and M+C) were used. The letter ‘E’ refers to the universal
£coRI primer sequence 5‘-GACTGCGTACCAATTC while ‘M’ refers to the universal Msel
primer sequence 5'-GATGAGTCCTGAGTAA. The letters after the ‘E’ or ‘M ’ refer to
additional selective nucleotides. Amplification consisted of 20 PCR cycles o f denaturation at 94
°C for 30 seconds, primer annealing at 56 °C for 1 min and extension at 72 °C for 1 min in a
46

DNA Engine PTC-200 thermocycler (MJ Research Inc. Massachusetts). The amplification
products were quantitatively assessed by their intensity in 1% agarose gel, using 5 pi of the
product.
5.1.3.4.4 Labelling of EcoR\ primers
For final amplifications, EcoK\ primers were end labelled with a radioactive phosphate group
(yP33 dATP). The labelling was in a 0.41 pi mixture containing 0.2 pi of the appropriate £coRI
(28 ng/pl, Eurogentec, Belgium), 0.04 pi of Kinase buffer 10X (QBiogene), 0.016 pi of T4
Kinase (10 U/pl, QBiogene) 0.06 pi of yP33 dATP (10 pCu/pl, Amersham Biosciences, UK) and
0.094 pi of PCR water. The Kinase buffer was left to thaw completely so as to have no
precipitates. The labelling mixture was mixed by gentle tapping of the tubes because the T4
Kinase is fragile. The mix was incubated at 37 °C for lhr followed by enzyme denaturation at 70
°C for 10 min.
5.1.3.4.5 Final amplification
The pre-amplification products were diluted by 1/30 or less (such as 1/10 or 1/20) if the intensity
of the products observed in Section 5.1.3.4.3 was low, so as to achieved more uniform
concentrations before final amplification. Five micro-litres o f the diluted pre-amplification
products were amplified in a 20pl reaction mixture containing 2pl of buffer (10X, Promega), 2
pi ofMgCI2 (25 mM. Promega), 0.8 pi o f 5 mM dNTPs, 0.1 pi o f Taq DNA polymerase (5 U/pl,
Promega,), 0.33 pi o f Mse\ primer (100 ng/pl Eurogentec, Belgium), 0.41 pi of the labelled
£coRI primer mix (section 5.1.3.4.4) and 9.36 pi of PCR water. The pre-amplification and
amplification primer combinations were matched such that if pre-amplification was by the
primer pair EA x MA. the final amplification primer pairs had to be EAXX x MAXX; where the
Xes refer to additional selective nucleotides. The amplification was done by a step down PCR
47
programme consisting o f 12 cycles of 30 sec of denaturation at 94 °C, 30sec of primer annealing
at 65 °C (reducing by 0.7 °C/sec) and lmin of elongation at 72 °C, followed by 33 (cycles with
constant annealing temperature) consisting of 30sec o f denaturation at 94 °C, 30 sec of primer
annealing at 56 °C and lmin o f elongation at 72 °C in a DNA Engine PTC-200 thermocycler
(MJ Research Inc, Massachusetts, USA). After the amplification, 12.5 pi of loading stain
(Formamide blue, Appendix 3) was added to each of the samples and stored at 4 °C until when
required for electrophoresis.
5.1.3.4.6 Electrophoresis and revelation of radiographs
The ingredients for 6% denaturing polyacrylamide gel (Appendix 3) were mixed and carefully
poured (avoiding trapping air bubbles) into 33 cm x 39 cm casting plates separated by 0.35 mm
spacers. A plane mould was inserted at the top and the gels were left to set for at least 2 hr if
used the same day or overnight for use the next day. The gels were assembled in vertical
electrophoresis apparatus (Gibco, BRL sequencing system. Model S2, Life Technologies) and
IX TBE buffer for running (Appendix 3) was placed into the top reservoirs to cover the inner
smaller plates. After ascertaining that there was no leakage, the plane moulds were removed and
the gels rinsed with the running buffer. More running buffer was put into the bottom reservoir
and pre-runs were made at 55W per gel for about 20 min before the samples were loaded. The
samples were denatured by heating to 95 °C for 5 min and then immediately put into ice until
when loaded. After pre-running, the gels were rinsed again and 62 well combs inserted at the top
of the gels until the teeth slightly penetrated the gels. Aliquots of 4.5 pi o f the samples were
carefully loaded between the teeth of the combs. Electrophoresis was conducted at 55 W per gel
for 2.5 hr and stopped when the slower moving xylene-cyanol dye was about two-thirds down
the gel. After electrophoresis, the gels were fixed for 20min in a fixing solution (Acetic acid 1:
Ethanol 2: Distilled water: 7), then removed and attached to blotting papers (3MM Whatman
48

paper) followed by drying at 80 °C for 1-2 hr in slab gel drier (Drygel Sr, Model SE 1160,
Hoefer Scientific Instruments, San Francisco). Once the gels were well dried, they were put into
cassettes with the sides attached to the gels up and Kodak Biomax X-ray films placed on top.
After 4 to 7 days o f incubation (depending on age of the radioactivity), the films were removed
and developed to reveal the bands.
5.1.3.4.7 Primer combinations and samples analysed
Thirty one AFLP primers combinations (Table 1) were used to analyse the two Catimor trees (PI
and P2), two SL28 trees (P3 and P4). an accession of Sarchimor (T5296) and a selection of 6, 4
and 5 seedlings from BC| F2 Populations A, B and C respectively (described in Section 5.1.3.1).
The primers were chosen on the basis o f their polymorphism between pure Arabica lines and
HDT derivatives in the studies of Lashermes el al. (2000a), Noir el al. (2003) and Ansaldi
(2003). Out of the tested primer pairs, 10 o f them were selected, based on their polymorphism
and amplification quality, for analysis in 61 additional plants o f the BC| F2 progeny, comprising
of 25, 15 and 21 plants from the three populations A, B and C respectively, to confirm their
segregation behaviour in the populations. Five primer pairs were further tested in the eight BC|
F| plants of different cv Catimor lines.
5.1.3.4.8 Data scoring and identification of introgressed fragments
Bands that were polymorphic between the parental accessions, within the BC| F| or within BCi
F2 progenies were scored in binary form as “ 1” for presence and “0” for absence. Unclear bands
were indicated by *?’. Bands that were monomorphic in all samples were not scored. If the
primer combinations were the same as those used by either Noir et al. (2003) or Ansaldi (2003),
the films were compared with theirs to identify the markers of introgressed C. canephora
49
fragments and consequently identify the mapped introgressed fragments T l, T2, T3, T4, and T5
(Ansaldi, 2003).
5.1.3.5 Identification of C. canephora linkage groups (chromosomes) associated with the
introgression fragments.
This was anticipated by consideration o f the possibility of transforming AFLP markers into
SCARs, and then assessing their polymorphism in the DH mapping population of Lashermes et
al. (2001). If any polymorphism was observed, the samples were amplified in a sample of 60
plants of the DH population and associated linkage group identified.
5.1.3.5.1 Extraction of DNA from AFLP bands
AFLP markers of four C. canephora chromosomal fragments introgressed into C. arabica (Tl,
T2, T3 and T5) were selected for this study based on size, (more than lOObp) and clear
separation from other bands. The number of appropriate bands available and subsequently
utilized was related to the number of markers mapped onto the fragments. DNA samples of
seven HDT derivatives (4 from T5296 x ET6 and 3 from Catimor x SL28 populations) and a cv
SL28 or cv Caturra sample (to confirm marker by absence) were used. However in a few tests,
no accessions from the Kenyan populations were used because they had not been pre-amplified
with the appropriate pre-selective primers in previous studies. For them to be used, it would have
been necessary to pre-amplify just a few samples for these tests only. The samples were
amplified with the appropriate final selective AFLP primers by the AFLP protocol outlined in
Section 5.1.3.4. However instead of the normal 62-well comb for loading, one with alternate
teeth removed to give double size wells was used, and 10 pi o f each sample was loaded instead
of 4.5 pi. After electrophoresis, the dried gels were stapled onto the films before placing them
into the cassettes to avoid movements between the two, which could cause misalignment in later
50

steps. Before separating the gel from the film for development (after incubation), extra marks
were made by cutting through the films and the Whatman papers to enhance correct realignment
when extracting bands. To extract the DNA from the bands o f interest, the developed films and
the gels were re-matched with the aid of the cut and staple marks and held firmly together again
by new staples. The films were then cut using sterile scalpels at the limits of bands of interest,
such that the cuts extended through the films, gels and into the filter paper underneath. The
delimited pieces o f the gels were then detached from the Whatman papers, (sometimes with the
top layer of the papers attached) with aid of clean forceps, and put into 0.5 ml tubes into which
50-100 pi of PCR water was added (depending on the size of the piece of gel). Two replicates of
each band from different plants (preferably from the different populations) were cut for cloning
as counter-checks, but when two adjacent samples from the same population had the band of
interest, the band was extracted as one. The soaked gels were incubated at 4 °C for two days with
occasional agitation to enhance diffusion of DNA into the water. The solution was then pipetted
out into new 0.5 ml tubes and 2 pi used for amplification. The remaining solution was
concentrated to 10-20 pi in a vacuum centrifuge and 2 pi taken for duplicate amplification as a
precaution in case the first solution was too dilute.
Amplification was in 25 pi reaction mixtures containing 2 pi o f the DNA solution, 2.5 pi of I OX
buffer, 2.0 pi of MgCb (25 mM), 0.5 pi o f dNTPs (5 mM), 0.6 pi of each of the primers used to
amplify the particular bands during AFLP (lOpM), 0.1 pi of Taq DNA polymerase and 16.7 pi of
PCR water. The PCR programme consisted of an initial denaturation step o f 5 minutes at 95 °C
followed by 35 cycles of denaturation at 94 °C for 45 sec, primer annealing at 50 °C for 45 sec,
elongation at 72 °C for 45 sec and a final extension step of 10 min at 72°C. Two microlitres of
the amplification products were electrophoresed in 2% agarose gel and revealed in ethidium
51

bromide. Only samples with one clear band were judged to be good for cloning and the sample
with more intense band between the two duplicates of the same AFLP band extract was used.
5.1.3.5.2 Cloning of the extracted DNA
The fresh PCR products were cloned using TOPO TA Cloning5' kit with pCR* 2.1-TOPO®
vector and chemically competent cells (Invitrogen, Life Technologies) according to the
manufacturer’s instructions (Appendix 4). Depending on the assessment o f intensity in agarose
of the extracted DNA in Section 5.1.3.5.1, 2-3 pi of the PCR products were used for ligation into
the vector. After the transformation, 50pl o f the E. coli cells were plated onto pre-selection plates
of LB (Luria-Bertani) agar medium (25 g/L) containing 50 pg/ml ampicillin, onto which 40 pi of
40mg/ml X-gal in DMF (dimethylformamide) had been spread and dried. The inoculated plates
were incubated at 37 °C for 14-16 hr (overnight) after which they were put into a refrigerator
until when used for testing for positive clones. Ten white or light blue colonies were individually
used for analysis to confirm that they had acquired the plasmid with the right inserts of DNA
fragments. Blue colonies were disregarded as negative clones. The cultures were aseptically
picked with sterile wooden toothpicks, which were then dropped into sterile plastic tubes
containing 5 ml of LB liquid medium with ampicillin at a concentration o f 50 pg/ml. The tubes
w ith the inoculated media were incubated overnight in a rotary shaker (200 rpm) for 14-16 hr at
37 °C.
The cultures were then tested for inserts by PCR using 2 pi o f the liquid culture and the same
reaction mix as the one used to amplify the AFLP bands DNA before cloning. The PCR
programme was also the same as during amplification of extracted AFLP DNA but the initial
denaturation step was increased to 10 min, to ensure adequate rupturing of the bacterial cells to
release the plasmids. To assess the inserts, 2 pi of the PCR products were electrophoresed in 2%
52

agarose gel and visualized under UV after staining with ethidium bromide. A sample of the PCR
product used for cloning was included to ascertain that the size o f the cloned fragments were the
ones targeted. Clones with inserts of different sizes from the targeted fragments and those
w ithout inserts were discarded. A maximum of four and a minimum of two clones with the right
size of insert per individual cloning reaction (depending on availability) were selected for
extraction of plasmid DNA for sequencing. Before plasmid extraction, a glycerol stock of each
of the selected transformed cultures was prepared for long-term storage (at -80°C). The stocks
were made by adding 500 pi o f the culture broths to 500 pi o f LB/Glycerol mix (1:2) in 2 ml
vials labelled with the details of the culture. Plasmid DNA was extracted from two of the
selected cultures, hence four replicates o f the same AFLP band for sequencing. The other
cultures which were not extracted were centrifuged to precipitate the cells and then stored at -20
°C as a contingency measure, in case something went wrong with the first extractions or if the
initial sequence results needed further confirmation by comparison with extra samples.
Extraction of the plasmid DNA was done with QIAprep® spin kit (QIAGEN Sciences,
Maryland, USA) according to manufacturers' manual (Micro-centrifuge option) (Appendix 5).
The extracted DNA was estimated using spectrophotometer at 260 nm or in 1% agarose gel and
diluted to 130 ng/pl before sending to Genome Express, France for sequencing.
5.1.3.5.3 Analysis of SCARs derived from the introgressed fragments
When the sequences were received, the actual plant DNA sequences were identified from the
entire sequences to exclude AFLP primers and vector sequences. Replicate sequences of the
same band were aligned using CLUSTAL W 1.82 programme (European Bioinformatics
Institute, http://www.ebi.ac.uk/clustalw). Only sequences that were highly similar were
considered as allelic. If the four sequences from the same band were highly divergent, the results
were discarded and the corresponding culture stocks discarded from long-term storage.
53
Sequence specific primers were designed from one of the alleles of the same band using Primer3
programme (Whitehead Institute, USA, http://frodo.wi.rnit.edu/cgi-bin/primer3/primer3_w ww.
cgi). The parameters considered in designing the primers targeted sizes between 18 and 22bp and
optimum annealing temperature o f 55 °C, so that they could all be analysed under the same PCR
conditions. The primers (synthesised by Eurogentec, Belgium) were first tested for performance
and possible polymorphism in 2% agarose gels. The samples used included two plants from
which the AFLP bands were extracted, two un-introgressed accessions, the C. canephora clone
IF200 and two DH accessions derived from it that are part of those used to construct C.
canephora genetic linkage groups that correspond to the 11 chromosomes o f Coffea sp
(Lashermes el a i, 2001). Amplification was in 25 pi reaction mixtures containing 5 pi of
genomic DNA (I ng/pl), 2.5 pi of 10X buffer, 2.0 pi of MgCb (25 mM), 0.8 pi o f dNTPs (5
mM), 1.0 pi of each of the left and right primers (10 pM), 0.1 pi of Taq DNA polymerase (5
U/pl) and 13.7 pi o f PCR water. The amplification regime consisted of an initial denaturation
step of 5 min at 95 °C followed by 35 cycles of denaturation for lmin at 94°C, 45 sec of primer
annealing at 55 °C (which was adjusted to improve the quality o f product or when the optimum
annealing temperature of the primers designed was different), 45sec of elongation at 72 °C and a
terminal extension step of 10 min at 72 °C. The amplification was done either in a PTC-200
(DNA Engine, MJ Research Inc, Massachusetts, USA) or GeneAmp® PCR system 9700
(Applied Biosystems) thermocycler.
Where amplification was successful but without polymorphism in agarose, further amplification
was done using a radioactive nucleotide (adATP33) followed by electrophoresis in 6% denaturing
acrylamide gel. In these tests, the samples consisted of C canephora clone IF200 and five DH
plants derived from it, two or four F2 plants, 2 un-introgressed Arabicas and an accession of C.
eugenioides. Amplification was done in a 25 pi PCR mixture containing 5 pi of genomic DNA
54

(lng/pl), 2.5 nl o f Buffer (1 OX), 2.0 pi o f MgCl2(25 mM), 1.0 pi of SSR dNTPs (Appendix 3),
1.0 pi each of the right and left primers (lOpM), 0.1 pi of Taq DNA polymerase (Promega, 5
U/pl), 13.6 pi o f PCR water and 0.08 pi of radioactive adATP3' (10 pCi/pl; Amersham
Biosciences, UK). The amplification programme was the same as that used for agarose tests.
Thereafter, electrophoresis and gel treatment was done as for AFLP (Section 5.1.3.4). However
the exposure was either on film or on Amersham storage Phosphor screen. To reveal the results
using the screen, the dried gels were incubated in cassettes with the screen and scanned after 24
to 48 hr with Typhoon scanner (9700 series, Amersham Biosciences) and TIFF digital images
were obtained. Where polymorphism was observed within the DH plants, the total number of the
DHs analysed was increased by 60 plants.
If no polymorphism was observed in the poly-acrylamide gel electrophoresis and the product
was only one uniform band, genomic DNA of four DH plants was amplified with the same
reagents and programme as for the agarose test. The PCR products were visualized in 1%
agarose to estimate the quantity and then sent to Genome Express, France for sequencing. The
sequences were analysed using RestrictionMapper programme version 3 (http://www.restriction
mapper.org) to determine if there were polymorphic restriction sites that could be exploited to
map the alleles in the DH plants by cleavable amplified polymorphisms (CAPs).
5.1.3.6 Analysis of RAPD markers of CBD resistance
Attempts were made to regenerate the RAPD markers amplified by primers N18 and M20 as
described by Agwanda et al. (1997) using the accessions of cvs Catimor and SL28.
Amplification was in a 25 pi mix consisting of 5 pi of genomic DNA (lng/pl), 7.5 pi of dNTPs
(500 pM; 1/10 dilution of the 5 mM dNTPs in Appendix 3), 2.5 pi of buffer (1 OX, Promega), 2.0
pi of MgC12 (25 mM, Promega), 0.1 pi of Taq DNA polymerase (Promega), 1 pi o f primers (10
55

pM. Appligene) and 7.0 pi of PCR water. In attempt to optimise the amplifications, MgC^ was
increased to 4 pi and water reduced appropriately. Taq DNA polymerase was increased to 0.2 pi
and another DNA polymerase (HotGoldstarrM. Eurogentec, Belgium) was tested. Amplification
was done in a PTC-200 (DNA Engine, MJ Research Inc, Massachusetts, USA). Amplification
programme consisted o f initial denaturation at 95 °C for 5min followed by 45 cycles of
denaturation at 95 °C for 1 min, annealing at 35 °C (or 37°C) for 1 min, elongation at 72°C for 2
min and final elongation at 72 °C for 7 minutes. The total PCR products were electrophoresed in
2% agarose gel in IX TBE at 80 W in a 20 cm wide gel. Revelation was by UV after staining in
ethidium bromide.
The primers designed from the sequences o f RAPD markers identified by Agwanda et al. (1997)
were then analysed in the same way as explained in section 5.1.3.5 for SCARS from AFLP
bands. The SCAR products of the M20g3o consisted of two bands of which the introgressed one
was identified. Subsequently, it was amplified in 60 o f the same plant samples used by Ansaldi
(2003) and the data generated was assessed in attempt to determine if it is linked to one of the
mapped C. canephora fragments. The N18 SCAR which amplified one monomorphic band in all
accessions was cloned and sequenced from four DH plants (one clone per plant) and analysed for
restriction polymorphisms (CAPs) as explained in section 5.1.3.5. Potentially polymorphic
restriction sites for enzymes Mse\ and B/al (an isoschizomer of Mae\ and Rmal) were identified.
The SCARs were then amplified and digested with MseI (Invitrogen) and Bfa\ (New England
BioLabs Inc.) as per the manufacturers’ instructions and separated in 2% agarose gel as
explained for RAPD gels above. Digestion was in a 20 pi mixture consisting o f 15 pi o f the PCR
product, 0.5 pi of the appropriate enzyme (5 U/pl), 2.5 pi of enzyme buffer and 2.5 pi of PCR
water and incubated was for 3 hr at 37 °C. To check the efficiency of digestion without PCR
contaminants, the PCR products were cleaned before the digestion. For the cleaning, entire PCR
56
products were transferred into 1.5 ml tubes into which 80 pi o f 70% ethanol was added and
vortexed slightly. The mix was left for 15 minutes at room temperature (precipitation stage) and
then centrifuged for 20 min at maximum speed (13000 rpm) noting the orientation o f the tubes.
The supernatant was then carefully pipetted out. In some cases, the precipitate was not visible
but consideration o f the orientation of the tubes avoided its disruption. Two hundred microlitres
of 70% ethanol was added, vortexed briefly and centrifuged for 10 min at 13000 rpm. The
ethanol was carefully pipetted out and the tubes were dried in a vacuum centrifuge for 10 min.
The DNA was then dissolved overnight at 4 °C in PCR water ready for digestion.
5.1.4 RESULTS
5.1.4.1 AFLP analysis
Thirty-one AFLP primer combinations were analysed for polymorphism between cv Catimor
accessions (PI and P2), cv SL28 (P3 and P4) and an accession of Sarchimor line T5296. They
generated between 1 and 9 polymorphic bands (Table 1). The polymorphism was either within or
between the two categories i.e. HDT derivatives (cvs Catimor and Sarchimor accessions) versus
cv SL28. The two cv Catimor accessions had some polymorphism between them but the two
SL28 accessions always exhibited the same banding pattern. A total of 100 polymorphic bands
were observed (Table 1). Some polymorphisms were observed in the BC| F2 progenies which
were not observed in the parental representatives such that 2 bands were present and 2 others
were absent in all the parental representatives but were polymorphic in the BC| F2 progenies.
Forty four (44) bands were present in both cv Catimor accessions but absent in cv SL28. Sixteen
(16) of these “Catimor” bands were also shared with the cv Sarchimor line T5296. Fifteen (15)
bands were present in cv SL28 but absent in the HDT derivatives. Eighteen (18) bands were
present in at least one of the HDT derivatives but absent in SL28. Nineteen (19) bands were
present in at least one of the HDT derivatives and present in cv SL28. Two (2) bands were
57

present in all the parental accessions and 2 bands were absent in all the parental accessions but
they were polymorphic in the BC| F2 plants. Polymorphic bands which were present in at least
one of the HDT derivatives but absent in cv SL28 were classified as HDT bands (Table 1).
Tablel. Summary o f AFLP primer combinations tested on accessions of C. arabica cvs Catimor, Sarchimor and SL28 and BCj F2 populations derived from the two cultivars and characteristics o f polymorphic bands generated.
Primer combination Number ofpolymorphicbands
HDTbands*
SL28 bands (P3 and P4)
Present in at least one HDT derivative and present in both P3 and P4
Monomorphic in both parental accessions
1. EAAC-MCAC' 2 1 1 -
2. EAAC-MCTG 4 3 1 - -
3. EAAC-MCTT 1 1 -
4. EAAG-MAAG 2 1 1 -
5. EAAG-MACA 3 2 1 -
6. EAAG-MACT 1 i -
7. EAAG-MCAA 9 7 1 18. EAAG-MCTA 2 - 29. EAAG-MCTC* 5 5 -
10. EAAG-MCTT 2 1 111. EACA-MCAA 1 1 -12. EACA-MCAC 4 I 1 1**, 1***13. EACC-MAAG" 2 1 1 -14. EACC-MCAA 3 2 115. EACG-MCAA 3 2 1 -
16. EACG-MCAT 3 2 1 -
17. EACG-MCTA 7 2 2 318. EACT-MAAC* 8 5 1 1 1**19. EACT-MAAG* 3 2 120. EACT-MACT* 3 2 121. EACT-MAGC* 1 1 -
22. EACT-MAGT* 4 3 123. EACT-MCAA 1 1 -
24. EAGA-MAAC 2 1 125. EAGA-MACA 2 1 1 -
26. EAGA-MCGA 1 1 -
27. EAGC-MCTG 4 2 2 -
28. EAGG-MCTC 3 2 129. EATC-MAAC* 4 2 1 1***30. EATC-MAAT* 3 2 1 - -
31. EATC-MACT* 7 4 1 2 -
Total 100 62 15 19 4
Notesprimers that were also tested on the enlarged BQ F2 populations
* bands that were present in at least one HDT derivatives but absent in SL28bands that were absent in all parental accessions but polymorphic in the BCi F2 progeny
*** bands that were present in all parental accessions but polymorphic in the BCi F2 progeny
58

Ten primer combinations were tested on a larger number of BCi F2 seedlings by analysing 60
additional plants from populations A, B and C in addition to the 15 used in pre-screening stage
so as to confirm their behaviour in the populations. These primers generated 37 polymorphic
bands (Table 2). Twenty three (23) of these bands were attributed to cv Catimor (absent in cv
SL28) and 14 bands were attributed to cv SL28 (absent in cv Catimor). Out of the 23 bands
attributed to cv Catimor, 15 were not segregating (always present in all individuals of the 3
populations), 5 were segregating in the Mendelian ratio of 3:1 only in populations A and B and
were always present in population C. Three (3) bands had distorted segregations whereby one
appeared overrepresented and another underrepresented in all populations. The third band was
overrepresented in populations A and C but absent in population B.
During this phase o f the study, some AFLP markers o f C. canephora chromosomal fragments
introgressed into C. arabica that revealed the presence of fragments T2, T3 and T4 in the cvs
Catimor and Sarchimor accessions and the BC| F| and BCi F2 breeding progenies were
generated. No markers of C. canephora fragments T1 and T5 were observed in the cv Catimor
accessions and derivatives. Most of the polymorphic markers in the BCi F2 populations co
segregated with markers of C. canephora introgressed fragment T4. Some of the ever-present
bands were identified as markers of the C. canephora fragments T2 and T3. Seven plants lacking
the introgression fragment T4 were identified from the BCi F2 seedlings and preserved as a
resource for future studies alongside plants with other introgressed fragments. Preservation of
plants with unique recombination in subsequent studies was envisaged.
59

Table 2. Scores of polymorphic AFLP bands between two trees o f cv Catimor (lines 88 and 127), two trees of cv SL28 and three BC1 F2 populations of the two cvs ((SL28 x Catimor) x Catimor)).
AFLP Pnmers Band No. Cat 127 (PI) Cat 88 (P2) SL28 (P3) SL28 (P4)Population
A Population BPopulation
CEAAG/MCTC i 1 1 0 0 m m m
ii 1 1 0 0 m m miii 1 1 0 0 p m m
EACC/MAAG i 0 0 1 1 p p m-ii 0 0 1 I m p m-iii 1 1 0 0 m m m
EACT/MAAC i 0 0 1 1 p p pii 1 1 0 0 m m miii 0 1 0 0 m m miv 1 1 0 0 m m mV 0 1 1 1 m- p pvi 1 1 0 0 p p m
Vii* 1 1 1 1 p p pEACT/MAAG i 1 1 0 0 m m m
ii 0 1 1 1 p p piii 1 1 0 0 m m m
EACT/MACT i 1 0 1 1 p m pii 1 1 0 0 m m miii 1 1 0 0 m m m
EACT/MAGC i 1 1 0 0 m m mEACT/MAGT i 0 0 1 1 m- p p
ii 1 1 0 0 m m miii 0 1 1 1 p p piv 1 1 0 0 m m m
EATC/MAAC i 1 1 0 0 p p pii 0 0 1 1 p p piii 0 0 1 1 m- p p
EATC/MAAT i 1 1 0 0 m m mii 0 0 1 1 m- p m-
iii 1 1 0 0 p p mEATC7MACT i 0 0 1 1 p p p
ii 1 0 0 0 p p piii 1 0 1 1 p p piv 0 1 0 0 p m pV 1 1 0 0 m m mvi 1 1 0 0 p p mvii 1 1 0 0 ____E____ p m
Key:m: monomorphic band that was present in all individuals of BCi F2 populations m-: monomorphic band that was absent in all individuals of BCi F2 populations p: a band that was polymorphic in the BCi F2 populations* a band that was present in all parental accessions but polymorphic in the BC| F2 progenies
60

Five AFLP primer combinations were analysed in 8 accessions o f BC| F| plants alongside the
accessions o f cvs Catimor and SL28 (P1-P2) and twenty-three 23 bands which were polymorphic
between the parental accessions were generated (Table 3). Eight (8) of these bands were present
in the accessions o f cv Catimor and all the BC| F| plants while one was absent in both Catimor
accessions and all the BC| Fi samples. The rest displayed varied polymorphism between the
parental accessions and the BC| Fi plants. Some of the bands present in both accessions of cv
Catimor were not present in all the BCi F| samples as would be expected for fixed dominant
markers and this demonstrated further the diversity between the lines of cv Catimor. One lineage
o f cv Catimor line 88 appeared to be particularly low in bands derived from cv Catimor
including fragment T4.
Table 3. Scores of polymorphic AFLP bands in two trees of cv Catimor (lines 88 andl27), two trees of cv SL28 and 8 trees of BCi Fi progenies involving different cv Catimor lines ((SL28 x Catimor) x Catimor)).
Pure cultivar accessions BC| F, plants bred from the following lines of cv Catimor and cv SL28
AFLP Primers T ested
Band*
Cat. 88 (PI)
Cat.127(P2)
SL28(P3)
SL28(P4)
127 127 129 88 88 119 90 127
EACT/MACT i 0 l i l 0 i 0? 0 l i 0 iii i 1 0 0 l l 1 l l l 1 iiii l 1 0 0 l 1 1 l i i 1 i
EACT/MAAC i 0 0 1 1 l 0 0 l 1 i 0 lii(T2) 1 1 0 0 l 1 1 1 i i 1 iiii I 0 0 0 i 1 1 0 0 0 1 liv 1 1 0 0 l 1 1 1 1 1 1 lV 1 0 1 1 0 0 0 0 1 1 1 ivi(T4) t 1 0 0 1 1 1 0 1 1 1 i
EATC/MACT i 0 0 1 1 0 0 0 1 0 0 0 0ii 1 1 0 0 1 1 I I 1 1 1 1iii 0 1 1 1 0 1 I? 0 1 0 0 1iv 1 0 0 0 1 1 1 1 1 1 1 0V 1 1 0 0 1 1 1 1 1 1 1 1?vi(T4) 1 1 0 0 1 1 1 0 1 1 1 1vii (T4) 1 1 0 0 1 1 1 0 1 1 1 1
EACT/MAGT i 0 0 1 1 0 0 0 0 0 0 0 0ii 1 1 0 0 1 1 t 1 1 1 0? 1iii 1 0 1 1 1 1 1? 1 0 1 1 1iv 1 I 0 0 1 1 1 1 0 1 0 1
e a c t /a a g i 1 1 0 0 1 1 1 1 1 1 1 1ii t 0 1 1 1 1 I 1 1 1 1 1iii 1 1 0 0 I 1 1 1 1 1 1 1
Key: Cat. Catimor Notes
i. Polymorphic bands were serially numbered from the largest in size to the lowest.ii. Where the markers identified C. canephora fragments, the fragments are indicated in
brackets as mapped by Ansaldi (2003) (Appendix 2).
61
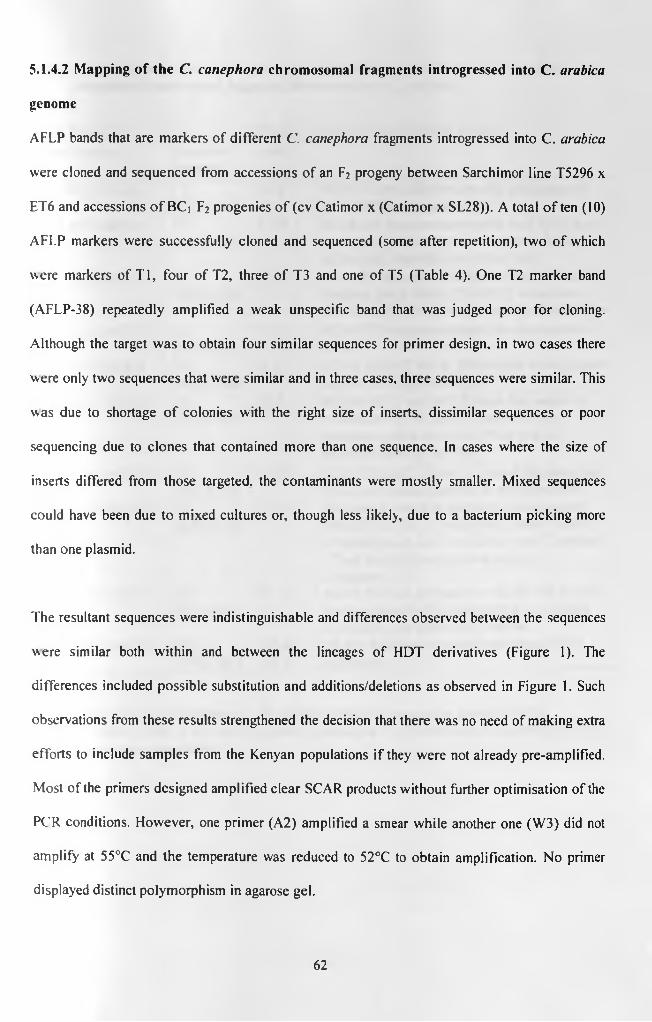
5.1-4.2 Mapping of the C. canephora chromosomal fragments introgressed into C. arabica
genome
AFLP bands that are markers of different C. canephora fragments introgressed into C. arabica
were cloned and sequenced from accessions of an F2 progeny between Sarchimor line T5296 x
ET6 and accessions o f BCi F2 progenies o f (cv Catimor x (Catimor x SL28)). A total o f ten (10)
AFLP markers were successfully cloned and sequenced (some after repetition), two of which
were markers of T l, four of T2, three of T3 and one of T5 (Table 4). One T2 marker band
(AFLP-38) repeatedly amplified a weak unspecific band that was judged poor for cloning.
Although the target was to obtain four similar sequences for primer design, in two cases there
were only two sequences that were similar and in three cases, three sequences were similar. This
was due to shortage o f colonies with the right size o f inserts, dissimilar sequences or poor
sequencing due to clones that contained more than one sequence. In cases where the size of
inserts differed from those targeted, the contaminants were mostly smaller. Mixed sequences
could have been due to mixed cultures or, though less likely, due to a bacterium picking more
than one plasmid.
The resultant sequences were indistinguishable and differences observed between the sequences
were similar both within and between the lineages of HDT derivatives (Figure 1). The
differences included possible substitution and additions/deletions as observed in Figure 1. Such
observations from these results strengthened the decision that there was no need of making extra
efforts to include samples from the Kenyan populations if they were not already pre-amplified.
Most of the primers designed amplified clear SCAR products without further optimisation of the
PCR conditions. Flowever, one primer (A2) amplified a smear while another one (W3) did not
amplify at 55°C and the temperature was reduced to 52°C to obtain amplification. No primer
displayed distinct polymorphism in agarose gel.
62

Table 4. A Summary of characteristics o f SCARs developed from AFLP markers of C. canephora chromosomal fragments introgressed into C. arabica.
AFLP primers combination
C.canephorafragment
Cloningcode
Remarks on amplified SCARs
1. EACT-MAAC T2(AFLP-16)
A, B SCAR A2 amplified unspecific products as a trail of DNA on agarose
2. EACT-MCAA T3(AFLP-29)
C, D SCAR D4 was a monomorphic band in all test accessions whose sequence did not exhibit differential cleavable site in the DHs
3. EAAC-MCTT T1(AFLP-24)
E, F SCAR FI was monomorphic in the DHs but Arabicas had 2 alleles Ea and Ca. Sequences from the DHs lacked polymorphic cleavage sites
4. EAAC-MCTT T5(AFLP-25)
G, H SCAR G3 was monomorphic in all accessions tested
5. ECAC-MCCA T1(AFLP-M8)
J, K SCAR J3 had 2 loci in DHs which were mapped onto the C. canephora map
6. ECAC-MCTA T2(AFLP-93)
N, P SCARs N2-R and N2-2R were four bands of which one was Ea, one Ca and two were common in all accessions. There was no polymorphism in the DHs.
7. ECAC-MCAT T3(AFLP-12)
S, T SCAR S3 had 3 alleles of almost the same size which were monomorphic in all accessions
8. ECAC-MCAT T3(AFLP-12)
u , v This was a band that perfectly co-segregated with S/T. SCAR U2 amplified 3 bands but not polymorphic in DH. One allele was Ea, another Ca and the third was present only in C. canephora
9. EACG-MCAT T2(AFLP-36)
w ,x SCAR W3 was polymorphic in DH but was not highly repeatable for exploitation. In Arabica accessions, one band was observed
10. EAGC-MCTG T2(AFLP-33)
AA4,AB5
SCAR AA4 was a monomorphic band in all accessions
Notesi. The number in parenthesis is the marker identity as mapped by Ansaldi (2003).
ii. Ea and Ca refer to the two constitutive genomes in C. arabica from C. eugenioides and C. canephora respectively.
63
(a) Sequences an AFLP marker (AFLP-29) of the C. canephora chromosomal fragment T3 introgressed in C. arabica via HDT
D4 CAACTAAATCGTTCACATAACACTCAATATTTTTGTGCAGCATGTCGTCAAAGATATTTT 6 0D5 CAACTAAATCGTTCACATAACACTCAATATTTTTGTGCAGCATGTCGTCAAAGATATTTT 6 0C l CAACTAAATCGTTCACATAACACTCAATATTTTTGTGCAGCATGTCGTCAAAGATATTTT 60C4 CAACTAAATCGTTCCCATAACACTCAATATTTTTGTGCAGCATGTCGTCAAAGATATTTT 6 0
D4 GCATTGCTCTTTGATACTTGGCTCCAGCATTTTTGAGATCAAAGGGCATTACTTTATAGT 1 2 0D5 GCATTGCTCTTTGATACTTGGCTCCAGCATTTTTGAGATCAAAGGGCATTACTTTATAGT 1 2 0C l GCATTGCTCTTTGATACTTGGCTCCAGCATTTTTGAGATCAAAGGGCATTACTTTATAGT 1 2 0C4 GCATTGCTCTTTGATACTTGGCTCCAGCATTTTTGAGATCAAAGGGCATTACTTTATAGT 1 2 0
************************************************************
D4 AACAAATACCCTTAGGAGTACGAAATGCAGT 1 5 1D 5 AACAAATACCCTTAGGAGTACGAAATGCAGT 1 5 1C l AACAAATACCCTTAGGAGTACGAAATGCAGT 1 5 1C4 AACAAATACCCTTAGGAGTACGAAATGCAGT 1 5 1
♦♦★ ★ ★ ★ ★ ★ ★ ★ ★ ★ ★ ★ ★ ★ ★ ★ ★ ★ ★ ★ ★ ★ ★ ★ ♦★ ★ A*
(b) Sequences of AFLP marker (AFLP-36) of the C. canephora chromosomal fragment T2 introgressed in C. arabica via HDT
W3 ACGGTGAATGGTTACAATTTGACAGGGCTGTTGCTTGGTGCTTGAGCCAAACAGACATTT 6 0X3 ACGGTGAATGGTTACAATTTGACAGGGCTGTTGCTTGGTGCTTGAGCCAAACAGACATTT 6 0X I ACGGTGAATGGTTACAACTTGACAGGGCTGTTGCTTGGTGCTTGAGCCAAACAGACATTT 6 0
★ ***★ ★ *****★ ★ ***★ ******************************************
W3 ATTTTTATGTGCCACGTCAGCCACAAGAATAAGTGGAACTACGTAGTTTTGTGTTGGACA 1 2 0X3 ATTTTTATGTGCCACGTCAGCCACAAGAATAAGTGGAACTACGTAGTTTTGTGTTGGACA 1 2 0X1 ATTT - - ATGTGCCACGTCAGCCACAAGAATAAGTGGAACTACGTAGTTTTGTGTTGGACA 1 1 8
**** ******************************************************
W3 GGAAATTGGACACAGAAAATTGGACAGAGGATCCCGTCTGGTGTTGTGCATCCTTGCAGA 1 8 0X3 GGAAATTGGACACAGAAAATTGGACAGAGGATCCCGTCTGATGTTGTGCATCCTTGCAGA 1 8 0X I GGAAATTGGACACAGAAAATTGGACAGAGGATCCCGTCTGATGTTGTGCATCCTTGCAGA 1 7 8
**************************************** *******************
W3 TTCTGTGCATGTATCCATGTTATTATTGATTTGAGTTAGTTCCATGGACGATTTGTAGAA 2 4 0X3 TTCTGTGCATGTATCCATGTTATTATTGATTTGAGTTAGTTCCATGGACGATTTGTAGAA 2 4 0X I TTCTGTGCATGTATCCATGTTATTATTGATTTGAGTTAGTTCCATGGACGATTTGTAGAA 2 38
************************************************************
W3 CAACCAGGCTGAATGCAGTTATTCATGTACAGAGCATG 2 7 8X3 CAACCAGGCTGAATGCAGTCATTCATGTACAGAGCATG 2 7 8X I CAACCAGGCTGAATGCAGTTATTCATGTACAGAGCATG 2 7 6
* * * * * * * * * * * * * * * * * * * * ** * * * * * * * * * * * * * * *
Figure 1. Alignment o f sequences of AFLP bands aligned using CLUSTAL W (1.82) multiple sequence alignment programme. Sequences D4, D5and W3 are from AFLP bands of samples from F2 generation of the T5296 x ET6 while sequences C l, C4, XI and X3 were from samples of BCi F2 ((Catimor x (Catimor x SL28)).
Notesi. * denotes the presence of identical nucleotides in all the sequences aligned.
ii. Dashes (-) are introduced into the sequences to maximise similarity.
64

The primers were used for radioactive amplification on samples comprising of pure Arabicas,
Arabicas with introgressed C. canephora genomic fragments, C. canephora and C. eugenioides.
The amplification products were separated in denaturing acrylamide gel and various
characteristic patterns were observed (Table 4). Some o f the products amplified did not display
any polymorphism in all the accessions, others amplified alleles specific to the sub-genomes in
C. arabica i.e. Ea and Ca, but only one (J3) had polymorphism that could be mapped in the DH
population (Plate 4). Analysis of the segregation pattern of the J3 SCAR derived from an AFLP
marker of fragment T1 (Plate 4 B) revealed that alleles ‘b’ and ‘c’ segregated as alleles of the
same locus (locus 2 ) while allele ‘a ' is a different locus (locus 1 ) possibly coupled by an allele
slightly smaller than allele ‘c \ Allele ‘b’ was observed in the un-introgressed C. arabica
accessions and C. eugenioides though with a difference in intensity, which could have been due
to more copies in C. arabica. Allele ‘c’ was observed in one plant o f the F2 population of T5296
x ET6 (Plate 4 B, sample 7) and was concluded to be the allele introgressed from C. canephora
into C. arabica. The segregation pattern of the alleles in the DH population enabled mapping of
locus 2 onto the linkage group corresponding to chromosome 8 while locus 1 tended to associate
with linkage group/chromosome 2. Locus 1 could not be perfectly mapped due to some
unexpected amplifications, for example in sample 4 (Plate 4 B) where it seemed not to have been
amplified.
On general terms, primers designed from markers of fragments T3 and T5 gave monomorphic
patterns in all the samples, except U2 that had polymorphism between the species (Plate 4 C, D,
and E). In contrast, SCARs of fragment T2 generally had more bands with alleles that were
monomorphic within the coffee species but polymorphic between the species. C. arabica
exhibited alleles which were specific to the two sub-genomes shared with the other two species
65

(E* and Ca). For example, the first primer pair from N2 sequence gave four clear bands of which
one was specific to C. canephora and another specific to C. eugenioides genomes (Plate 4F).
.— . COX _________ - o
C 1 <N (N CJ> CO
CDa>" O
oCD
o T— CM c O ^ rU - LL LL L D
r v CD o oO )
u-> ID I D I D I DC D<=> CM r ^ < c E—■>
CM __1 OD
X X X X X CM Q _ C Y CO oQ o Q o o U L > - > -
C D CNjT— c m CO ^ r I D c o r X o o o > T“ T—
1 2 3 4 5 6 7 8 9 10 11 1 2
-A
C (D4. T3)1 2 3 4 5 6 7 8 i a 9 10 11 12
E (U2, T3)
1 2 3 4 5 6 7 8 9 10 11 12
D (S 3 . T3). L I J L 4 , .5 -^ .6 . 7_ 8 9 10 11 12
Plate 4. Radiographs o f PCR products generated by SCAR primers designed from sequences of AFLP markers o f the C. canephora chromosomal fragments introgressed into C. arabica genome.
Legend on samplesSamples 1 - 5 are Doubled Haploid (DH) plants accession numbers 510, 511, 512, 513 and 514 respectively; sample 6 is: IF200 (the C. canephora parent of the DHs); samples 7 and 8 are F2 plants accession numbers 112 and 117 from a cross between T5296 x ET6; sample 9 is IAPAR 59 (a Sarchimor line); samples 10 and 11 are C. arabica varieties Rume Sudan and SL28 while sample 12 is an accession o f C. eugenioides.
* Where included, i and ii refers to F2 plant numbers 120 and 140 o f the T5296 x ET6 cross.
Legend on panels of radiographsPanel A represents SCAR FI from AFLP marker of C. canephora fragment T1 Panel B represents SCAR J3 from AFLP marker of C. canephora fragment T1 Panel C represents SCAR D4 from AFLP marker of C. canephora fragment T3 Panel D represents SCAR S3 from AFLP marker of C. canephora fragment T3 Panel E represents SCAR U2 from AFLP marker of C. canephora fragment T3 Panel F represents SCAR N2-R from AFLP marker of C. canephora fragment T2
66

A second primer was designed on the right side of this sequence (N2-2R), which reduced the
prominent bands to two but lacked the specificity to the two genomes. An exception in the
general behaviour of SCARs ofT2 was AA4 which amplified only one monomorphic band in all
accessions tested. Unlike the observation with AFLP, no effect o f PCR machine model was
observed on the amplification patterns of the SCARs.
(a) Alignment of sequences of PCR products amplified with the SCAR primer D4 from four DH plants (510,511, 512 and 513).
D 4 - 5 1 2 GATACTTTGCATTGCTCTTTGATATGTGGCACCAGCATTTTTGAGACCAAAG 52D 4 - 5 1 3 ATCAAGATACTTTGCATTGCTCTTTGATATGTGGCACCAGCATTTTTGAGACCAAAG 5 7D 4 - 5 1 0 AGATACTTTGCATTGCTCTTTGATATGTGGCACCAGCATTTTTGAGACCAAAG 53D 4 - 5 1 1 TCATCAAAGATACTTTGCATTGCTCTTTGATATGTGGCACCAGCATTTTTGAGACCAAAG 6 0
****************************************************
D 4 - 5 1 2 GG-CATCACTTT-ATAACAATAAATACCCTTAGGAGTACGAAATGCAG 9 8D 4 - 5 1 3 GG-CATCACTTT-ATAACAATAAATACCCTTAGGAGTACGAAATGCAG 1 0 3D 4 - 5 1 0 G G -C A T C A C T T T - ATAACAATAAATACCCTTAGGAGTACGAAATGCAG 9 9D 4 - 5 1 1 GGGCATCACTTTTATAACAATAAATACCCTTAGGAGTACGAAATGCAG 1 0 8
** * * * * * * * * * * * * * * * * * * * * * * * * * * * * * * * * * * * * * * * * * * * *
(b) Comparison of sequences of SCAR D4 in two DH plants and the sequence (D4) used to design the primers.
D 4 - 5 1 0 AGATACTTT 9D 4 - 5 1 1 TCATCAAAGATACTTT 1 6D 4 CAACTAAATCGTTCACATAACACTCAATATTTTTGTGCAGCATGTCGTCAAAGATATTTT 6 0
★ ★ ★
D 4 - 5 1 0 GCATTGCTCTTTGATATGTGGCACCAGCATTTTTGAGACCAAAGGG-CATCACTTT-ATA 6 7 D4 - 5 1 1 GCATTGCTCTTTGATATGTGGCACCAGCATTTTTGAGACCAAAGGGGCATCACTTTTATA 7 6 D4 GCATTGCTCTTTGATACTTGGCTCCAGCATTTTTGAGATCAAAGGG-CATTACTTT-ATA 1 1 8
**************** **** *************** ******* *** ***** ***
D 4 - 5 1 0 ACAATAAATACCCTTAGGAGTACGAAATGCAG- 9 9D 4 - 5 1 1 ACAATAAATACCCTTAGGAGTACGAAATGCAG- 1 0 8D 4 GTAACAAATACCCTTAGGAGTACGAAATGCAGT 1 5 1
*********** * * * * * * * * * * * * * * * * * * *
Figure 2. Alignment o f sequences obtained by direct sequencing (without cloning) of PCR products from C. canephora DH plants amplified with SCAR primer D4 designed from an AFLP maker of fragment T3: (a) CLUSTAL W (1.82) multiple sequence alignment of the sequences and (b) comparison of two o f the sequences with the full length sequence of AFLP band cloned from C. arabica and used to design the primers.
Notesi. Dashes (-) are introduced in the sequences to maximise similarity.
ii. The missing sequences from the DHs on the left ends are due to poor initial sequencing since the products were sequenced directly without cloning.
iii. * indicates that the nucleotides in the three sequences are identical in the locus
67

Some products of the SCAR amplifications that consisted of a single band in the DHs were
amplified and sequenced without cloning. The sequences from the DHs were highly similar to
the ones obtained from the C. canephora fragments introgressed into Arabica coffee (Figure 2).
The percentage of bases that were different between the individual sequences from the DHs and
the sequence used to design the SCAR primers ranged from 1.73 to 8.08 %. No potentially
polymorphic restriction sites were observed in the sequences.
5.1.4.3 Analysis of RAPD markers of CBD resistance
It was not possible to regenerate polymorphic bands with the RAPD primers N18 and M20 as
reported by Agwanda et al. (1997). This was despite changes of the concentrations of
Magnesium chloride and DNA polymerase in PCR reaction mixtures, source o f DNA
polymerase and PCR programme. Since SCAR primers had been previously designed from two
o f the RAPD markers but they do not exhibit polymorphism in agarose, (Lashermes,
unpublished) they were tested by radioactive PCR and separation in polyacrylamide
electrophoresis. The SCARs of the markers N1825o and M20g3O consisted of one and two bands
respectively in denaturing polyacrylamide gel (Plate 5). The smaller allele of M20g3o was clearly
the one introgressed due to its presence in HDT derivatives and C. canephora. However, when
amplified in a set of 60 samples of the F2 population used by Ansaldi (2003) to map the
introgressed fragments, the quality o f amplification was not good despite several repetitions. It
could therefore not be clearly mapped although it tended to be associated with markers of the
introgressed fragment T2. There seemed to be competition between the two alleles especially in
the heterozygous state in favour of the introgressed allele and also poor amplification in many
samples.
6 8
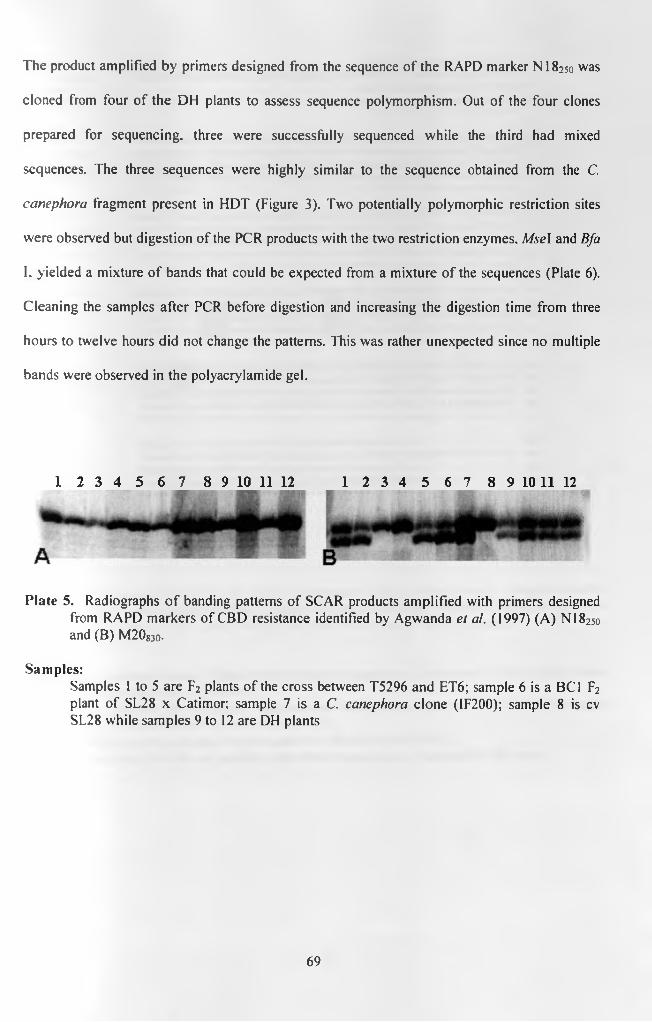
The product amplified by primers designed from the sequence of the RAPD marker N I8250 was
cloned from four of the DH plants to assess sequence polymorphism. Out of the four clones
prepared for sequencing, three were successfully sequenced while the third had mixed
sequences. The three sequences were highly similar to the sequence obtained from the C.
canephora fragment present in HDT (Figure 3). Two potentially polymorphic restriction sites
were observed but digestion of the PCR products with the two restriction enzymes, Mse\ and Bfa
I, yielded a mixture o f bands that could be expected from a mixture of the sequences (Plate 6).
Cleaning the samples after PCR before digestion and increasing the digestion time from three
hours to twelve hours did not change the patterns. This was rather unexpected since no multiple
bands were observed in the polyacrylamide gel.
1 2 3 4 5 6 7 8 9 10 11 12 1 2 3 4 5 6 7 8 9 10 11 12
Plate 5. Radiographs o f banding patterns of SCAR products amplified with primers designed from RAPD markers of CBD resistance identified by Agwanda et al. (1997) (A) N I8250 and (B) M2083o-
Samples:Samples 1 to 5 are F2 plants of the cross between T5296 and ET6; sample 6 is a BC1 F2 plant of SL28 x Catimor; sample 7 is a C. canephora clone (IF200); sample 8 is cv SL28 while samples 9 to 12 are DH plants
69
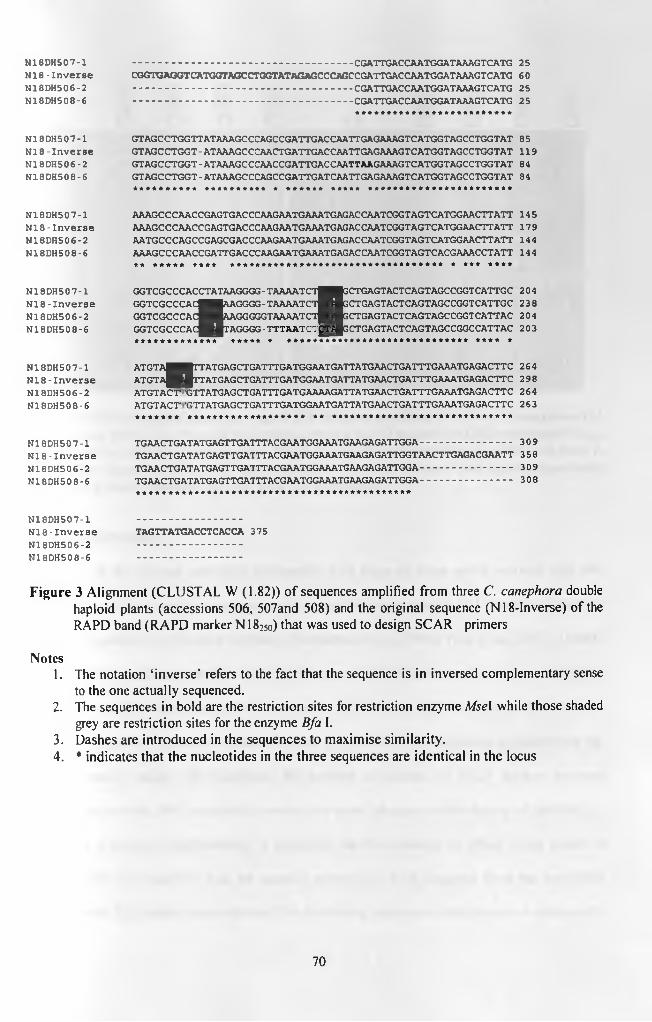
N 18D H 507-1 -CGATTGACCAATGGATAAAGTCATG 25N 18 - I n v e r s e CGGTGAGGTCATGGTAGCCTGGTATAGAGCCCAGCCGATTGACCAATGGATAAAGTCATG 60N 18D H 506-2 ......................................................................- .................. -CGATTGACCAATGGATAAAGTCATG 25N 18D H 508-6 CGATTGACCAATGGATAAAGTCATG 25
N 18D H 507-1 GTAGCCTGGTTATAAAGCCCAGCCGATTGACCAATTGAGAAAGTCATGGTAGCCTGGTAT 85N 1 8 - I n v e r s e GTAGCCTGGT - ATAAAGCCCAACTGATTGACCAATTGAGAAAGTCATGGTAGCCTGGTAT 119N18DH 5 0 6 -2 GTAGCCTGGT - ATAAAGCCCAACCGATTGACCAATTAAGAAAGTCATGGTAGCCTGGTAT 8 4N 18D H 508-6 GTAGCCTGGT - ATAAAGCCCAGCCGATTGATCAATTGAGAAAGTCATGGTAGCCTGGTAT 84
********** ********** * ****** ***** ***********************
N 18D H 507-1 AAAGCCCAACCGAGTGACCCAAGAATGAAATGAGACCAATCGGTAGTCATGGAACTTATT 145N 18 - I n v e r s e AAAGCCCAACCGAGTGACCCAAGAATGAAATGAGACCAATCGGTAGTCATGGAACTTATT 179N 18D H 506-2 AATGCCCAGCCGAGCGACCCAAGAATGAAATGAGACCAATCGGTAGTCATGGAACTTATT 144N 18D H 508-6 AAAGCCCAACCGATTGACCCAAGAATGAAATGAGACCAATCGGTAGTCACGAAACCTATT 144
** ***** **** ********************************** * *** ****
N 18D H 507-1 GGTCGCCCACCTATAAGGGG- TAAAATCTMMGCTGAGTACTCAGTAGCCGGTCATTGC 204N 1 8 - I n v e r s e GGTCGCCCAC^MAAGGGG-TAAAATCT^MGCTGAGTACTCAGTAGCCGGTCATTGC 238N 18D H 506-2 GGTCGCCCAC^HAAGGGGGTAAAATCT^HGCTGAGTACTCAGTAGCCGGTCATTAC 204N 18D H 508-6 GGTCGCCCAC|^(TAGGGG-TTTAATCT|^JGCTGAGTACTCAGTAGCCGGCCATTAC 203
************* ***** * ***************************** **** *
N18DH5 0 7 -1 ATGTAljMTTATGAGCTGATTTGATGGAATGATTATGAACTGATTTGAAATGAGACTTC 264N 1 8 - I n v e r s e ATGTaJ^TTATGAGCTGATTTGATGGAATGATTATGAACTGATTTGAAATGAGACTTC 298N 18D H 506-2 ATGTACTTGTTATGAGCTGATTTGATGAAAAGATTATGAACTGATTTGAAATGAGACTTC 264N 18D H 508-6 ATGTACTTGTTATGAGCTGATTTGATGGAATGATTATGAACTGATTTGAAATGAGACTTC 263
******* ******************* ** *****************************
N 18D H 507-1 TGAACTGATATGAGTTGATTTACGAATGGAAATGAAGAGATTGGA----------------------------------309N 1 8 - I n v e r s e TGAACTGATATGAGTTGATTTACGAATGGAAATGAAGAGATTGGTAACTTGAGACGAATT 358N18DH5 0 6 -2 TGAACTGATATGAGTTGATTTACGAATGGAAATGAAGAGATTGGA....................................... 309N18DH5 0 8 -6 TGAACTGATATGAGTTGATTTACGAATGGAAATGAAGAGATTGGA............. - ........................308
********************************************
N 18D H 507-1 ----------------------------------N 1 8 - I n v e r s e TAGTTATGACCTCACCA 375N 18D H 506-2 .................... .......................N 18D H 508-6 ----------------------------------
Figure 3 Alignment (CLUSTAL W (1.82)) of sequences amplified from three C. canephora double haploid plants (accessions 506, 507and 508) and the original sequence (N 18-Inverse) of the RAPD band (RAPD marker N 182so) that was used to design SCAR primers
Notes1. The notation ‘inverse’ refers to the fact that the sequence is in inversed complementary sense
to the one actually sequenced.2. The sequences in bold are the restriction sites for restriction enzyme MseI while those shaded
grey are restriction sites for the enzyme Bfa I.3. Dashes are introduced in the sequences to maximise similarity.4. * indicates that the nucleotides in the three sequences are identical in the locus
70

Plate 6. Patterns obtained after digesting SCAR products amplified from four C. canephora DH plants (510, 511, 512 and 513) derived from a RAPD marker for CBD resistance NI8250 with the restriction enzyme Bfa I. Panel A shows the pattern before digestion and panel B after digestion. M is a 100 base pair ladder. It can be observed that digestion generated extra bands (arrowed) but they were not polymorphic.
5.1.5 DISCUSSION
The work of this section had direct relationship with those of some earlier workers such that
regeneration of their results was required. It was possible to regenerate AFLP markers identified
by other researchers in the same laboratory (Lashermes et al., 2000a; Noir el al., 2003, Ansaldi,
2003). However, this was possible by using the same model of thermocycler as the one that they
used. The use of another model o f thermocycler led to slight differences from the reference
patterns obtained by the above researchers, and this reduced the confidence of identifying the
targeted marker bands. This highlights the problem of sharing of AFLP markers between
laboratories or even their repeatability within the same laboratory with change of facilities, or
even with a change o f performance of machines. On the contrary, no effect of the model of
thermocycler was observed with the specific primers (SCARs) designed from the sequenced
AFLP bands. This demonstrates the need for developing sequence-based primers to enhance the
71

transferability of non-sequence based markers. AFLP markers can however be reproduced in
different laboratories with some success. Working in another laboratory and using silver staining
instead of radioactive labelling, Diniz et al. (2005) were able to reproduce some markers of
nematode resistance (M ex-\) identified by Noir el al. (2003).
The analysis of the accessions of C. arabica cvs Catimor and SL28, their BC| F; and BC* F2
progenies backcrossed to cv Catimor, showed that while there is a large uniformity in cv SL28,
there is diversity between and within the cv Catimor lines. Similarly, Agwanda et al. (1997) and
Pearl et al. (2004) observed higher heterozygosity in the cv Catimor accessions that they used
compared to accessions of un-introgressed Arabicas. There is therefore a high potential for
selection within these lines. The selection would depend on the objectives and knowledge of
genetic segments to select for. For instance, one lineage of cv Catimor 88 seemed to be
particularly low in markers of introgression including T4 (Table 2), and this could be either
advantageous or disadvantageous depending on what genes are located on the introgressed
fragments. For example, the absence of T4 markers that have also been identified as markers for
resistance to the nematode Meloidogyne exigua (by collaboration of work by Noir et al., 2003
and Ansaldi, 2003) makes this line less favourable for breeding. Markers of the fragments T2
and T3 were present in all the accessions analysed. This may be speculated to be a reflection of
their association with characters that were selected for during the breeding history of these
genotypes, first in Colombia and later in Kenya. The introgressed chromosomal fragments T1
and T5 were not identified but it may not be certain if they were selected against during selection
stages or they were absent even in the parental accessions of HDT derivatives at the start of the
breeding. Out of the total HDT derived markers, it is probable that potential markers for genes of
resistance to CBD and CLR (at least the genes related to races o f CLR present in Kenya) are
present in all the cv Catimor and BC| Fi plants analysed in this study because they are all
72

resistant to these diseases. Consequently, the identified C. canephora chromosomal fragments
and any unmapped HDT derived markers are potential candidate markers o f the introgressed
resistance genes. Another category o f common markers in the cv Catimor lines would be those
related to the dominant compact growth. However, this is a mutation within C. arabica to give
rise to cv Caturra (Jones, 1956), which was crossed with HDT to give rise to cv Catimor. This
character is therefore not o f HDT origin.
Different accessions o f HDT derivatives have different levels o f introgressed C. canephora
genome (Lashermes et al., 2000a). Some introgressed C. canephora fragments may affect
beverage quality of C. arabica (Bertrand et al., 2003) and lines o f cv Catimor in Kenya are of
lower cup quality than SL28 (van der Vossen and Walyaro, 1981) It is therefore of interest to
identify undesirable fragments and possibly use plants with the smallest fragments carrying
desirable gene(s) as the donor parent in breeding. Such plants may be obtained from
accessions/progenies o f either cv Catimor or HDT using DNA markers. Apart from the diversity
due to the number o f mapped C canephora fragments present in the various lineages, the
fragments may also be different in size compared to those in the T5296 x ET6 cross that was
used for mapping by Ansaldi (2003). This could be particularly true for the fragment T4 because
there were polymorphic bands that co-segregated with markers of this fragment but are
unmapped by Ansaldi (2003). The fragment T4 was not present in all BC| F| plants as would be
expected for a backcross to homozygous dominant parent. This may indicate lack of strict
selection for or against this fragment during the breeding programmes both in Colombia and
Kenya. This is interesting while noting that these materials were selected for resistance to CLR
in Colombia and for resistance to CLR and CBD in Kenya. The absence of this fragment in the
BCi F| plants which were resistant to both CBD and CLR in the field at CRF makes it a lower
priority candidate for resistance to these diseases at least under the particular field conditions.
73
However, it may be a complement o f some type to other fragment(s). It should be noted that by
collaboration of the results o f Noir et al (2003) and Ansaldi (2003), this fragment (T4) carries the
resistance gene to the nematode Meloidogyne exigua. Future breeding and conservation work
should therefore pay attention to this aspect and ensure that it is not lost.
Breeding programmes in Kenya have been based on bulking pollen from several similar plants of
paternal variety and using it to pollinate several similar plants o f the maternal variety. It was
therefore not possible to identify individual parents of the BC| F| plants. The four parental
representatives used in this study (P1-P4) are therefore not the real parents but were
representatives of the parental cultivars. During AFLP analysis o f BC| F2 progenies, four bands
were observed to be polymorphic in these progenies but they were not polymorphic in the
parents such that two were present and the other two were absent in all parental representatives.
This may therefore be due to the fact that the accessions designated PI, P2, P3 and P4 were not
identified as the actual parents o f the progenies. Other researchers have also observed
polymorphic bands in progenies that were not observed in the parents such as Yang et al. (2000)
in soybean. Explanations could be PCR errors or restriction artefacts, genomic mutations and
contaminations, but the repeatability and frequency of the bands observed in this study rules out
these possibilities. Yang et al. (2000) could not explain their observations but ruled out the above
explanations also. Recently, Lolle et al. (2005) demonstrated by use of single nucleotide
polymorphism in Arabidopsis, that some characters can be observed in a progeny and not in the
parents but in earlier generations, possibly by storage as extra-genomic information in RNA.
However, this is not likely to be the explanation in this study. The observations of this study are
likely due presence of extra polymorphism within the cultivars which was not present in the four
representative plants (PI, P2, P3, P4). However, such bands that were not polymorphic between
the parents were not considered as potential makers of disease resistance.
74

In this study, seven plants lacking the introgression fragment T4 were identified from the BC| F2
seedlings and were preserved alongside a sample with the fragment as a resource for future
research. These plants will be useful in comparative studies with the plants with T2 and T3 to
identify candidate fragments for different phenotypes, the same way inbred lines (ILs) are used
(Zamir, 2001; Jeuken and Lindhout, 2004, Von Korff el al., 2004). The intention was to have a
collection of plants with or lacking one o f the possible introgression fragments in various
combinations to serve as differentials for different phenotypes. In this endeavour, preservation of
plants identified to have unique combination of the introgressed C. canephora genomic
fragments in later studies was envisaged.
AFLP markers of different C. canephora chromosomal fragments introgressed into C. arabica
were cloned and sequenced from different HDT derivatives i.e. cv Catimor lines which were
initially bred from HDT accession 1343 and a Sarchimor line T5296 bred from HDT accession
832/2. The sequences o f AFLP bands from T5296 x ET6 and cv Catimor x cv SL28 progenies
were indistinguishable (Figure 1). This agrees with the suggestion that the genomic fragments
introgressed from C. canephora through HDT share the uniqueness of the original introgression
in the original HDT (Orozco-Castillo el al., 1994). It was evident that knowledge generated from
either of the progenies was valid for the other. It was also possible to identify markers mapped
by Ansaldi (2003) in cv Catimor accessions from Kenyan although an F2 population o f T5296 x
ET6 was used to map them. This was useful in reducing the need to repeat mapping of
introgressed fragments unless later studies showed that the fragment(s) carrying the CBD
resistance genc(s) was not mapped.
The sequences of AFLP marker of genomic introgression from C. canephora into C. arabica
also displayed high similarity to the sequences of SCARs amplified from DH plants with primers
75

designed from the introgressed fragments (Figure 2), with a range of 1.73 to 8.08 % difference
on a base per base comparison. Lashermes et al. (2000a) and Anthony et al. (2002b) observed
that HDT derivatives are more similar to C. canephora accessions from Central Africa than those
from West Africa. The C. canephora clone IF200 that was used to generate the DHs belong to an
intermediate genetic group (Lashermes et al., 1994) and this may explain the variability of the
similarity of the DH sequences to the introgressed fragments.
When some cloned bands were sequenced, they gave highly dissimilar sequences between
themselves. This could be due to a chance o f co-migration of non-homologous bands (Robinson
and Harris, 1999; Zhang and Stommel, 2001) or poor delimitation of the gel containing the band
when cutting such that an adjacent band was included. Such dissimilar bands were not used to
design SCAR primers. The least number of similar sequences used for primer design was two, in
two cases, and this was due to inadequate number of positive clones with the right size of inserts.
There were some cultures that yielded multiple sequences and they could not therefore be
sequenced in full. This could have been due to an error when picking the positive (white)
colonies such that mixed colonies were picked or, though less likely, due to a colony picking
more than one plasmid during transformation. Poor results necessitated repetition of the
experiments but this did not improve on some bands like A2. Absolute confirmation that the
bands cloned were the targeted ones would be if the designed primers amplified products with
polymorphism matching that of the parent AFLP bands and several bands subsequently mapped
on the parent fragment. Similarly, confirmation of the chromosomal location o f the fragments in
the DH populations would be possible if more than one of the SCARs developed from AFLP
markers of the same fragment generated co-segregating polymorphism. However this was not
achieved in this study, and judging from the rate of success, it would require much more cloning.
There was extremely low polymorphism o f the SCARs within genotypes assessed (Table 4,
76
Figures 2 and 3). The probability o f success also needs to consider the number o f markers
available for a fragment and of large size (preferably more than 150 bp) to enhance the
probability o f getting useful polymorphism both by size or restriction. The SCAR primer pair A2
did not amplify clear bands. Unspecific amplification may be due to poor primer design, poor
sequence results or duplication of homologous regions in the genome. Once amplification of
clear bands in agarose was obtained, PCR conditions were not further optimised because the
intention was to be able to use the same programme to analyse many primer pairs.
The results obtained with the various AFLP SCAR primers (Table 4, Plate 4) clearly
demonstrated the existence of allelic specificity to C. canephora and C. eugenioides genomes in
the C. arabica genome. This is in agreement with the reported origin of the C. arabica genome,
as a rather recent combination of C. canephora and C. eugenioides or their close relatives (Raina
et al., 1998; Lashermes, et al., 1999). In addition, the results demonstrated the existence of
conserved regions across the three Coffea species. These can be explored further for use as
anchor markers within wider taxa as also found by Poncet et al. (2005). The results are also in
agreement with those o f Lashermes et al. (2000b) and Hererra et al. (2002), who using molecular
markers in C. arabica and C. canephora inter-specific hybrids concluded that the chromosomes
in their genomes are very similar to allow random pairing and cross-overs. There was duplication
of some sequences even in DHs (Plate 4). Some DNA fragments such as T3 seemed to be more
conserved than others such as T1 and T2. Multiplicity of RFLP loci in the same DH population
was earlier reported by Paillard et al. (1996). It would be interesting to investigate if this is
related to the function o f genes in these genomic regions that necessitated differential evolution.
Three sequences each o f fragments T2 and T3 were compared for their content of the nucleotides
A and T (AT). Two markers of each fragment were from the same cluster or within 3 cM from
the cluster. The markers from T2 had 50.7%, 55.6% and 58.2% AT, while those from T3 had
77

60.36%, 61.49% and 64.0% AT. From these observations, it would appear that sequences on T2
are more likely to be putatively of the coding type as explained by Poncet el al (2005) whereby
putative expressed sequences have AT content averaging 55%, but this is entirely subject to
further study.
The SCAR primer J3 demonstrated the existence of two loci in C. canephora using the DH
population (Plate 4 B). From the results o f this study, it can be argued that allele (c) is the
introgressed allele of fragment T1 due to its occurrence in introgressed population T5296 x ET6
(Plate 4 B: sample 7). This would mean that C. arabica has only one allele (by size) in locus 2
and introgression from C. canephora introduced the second allele while locus 1 is either absent
or has the same allele as locus 2. The fragment T1 is therefore located on the linkage group 8
which putatively correspond to chromosome 8 (Lashermes et al., 2001). IAPAR 59 is a cultivar
derived from HDT but possibly the accession used in this study did not have the T1 fragment as
was also observed with cv Catimor from Kenya. SCAR markers may not exhibit the
polymorphism of the markers from which they are cloned. The segregation of the SCAR marker
J3 in the DHs was observed and scored as co-dominant markers while the parental AFLP marker
was scored as dominant. The successful conversion of a dominant AFLP marker to a more
informative co-dominant marker will be very useful in future studies on the chromosomal
fragment T l. Polymorphism of an AFLP marker band largely reflects polymorphism related to
the enzyme cutting site and/or primer annealing sequences and not absence of homologous
fragments. On the other hand, SCAR primers are designed to match sequences of the AFLP
fragments usually interior to the site(s) affecting AFLP polymorphism. This affects both the
presence and/or type o f polymorphism. Similar loss of target polymorphism upon conversion of
AFLP bands into SCAR markers was reported by Shan et al. (1999) in barley and wheat and by
Poncet et al. (2005) in Coffea genus. In this study, products o f the SCAR primers variably
78
included unspecific amplifications, monomorphism, genome specific polymorphism and co
dominance. The work o f other researchers has revealed similar results (Paran and Michelmore,
1993. Shan et al., 1999; Zhang and Stommel. 2001; Weiland and Yu. 2003; Boukar et al., 2004;
Diniz el al., 2005).
It was not possible to regenerate the RAPD markers of CBD resistance identified by Agwanda et
al. (1997). This is not unexpected since the PCR conditions affect the repeatability o f RAPD
polymorphisms (Rafalski et al., 1996). Genomic DNA concentration, temperature profile of
thermocycler, magnesium chloride concentration and the type o f DNA polymerase affect
reproducibility of RAPD. In this study all these parameters would have affected the results since
the chemicals (except for the primers) and the thermocycler were from different manufacturers
while the estimation o f DNA concentration and its quality might have differed from that of
Agwanda et al. (1997). This has been one limitation of earlier markers that led to the need for
more repeatable markers of high reproducibility and easily transferable between laboratories
(Rafalski et al., 1996). The banding pattern of the product amplified by the primers designed
from the sequence of the RAPD marker M2083o amplified two bands in C. arabica one of which
was the introgressed allele due to its presence in introgressed accessions. However, in C.
canephora, it was clear that there were at least two alleles which were monomorphic in all
accessions even the DH plants, and were therefore not in the same locus (Plate 4). This SCAR
was amplified in 60 o f the samples used by Ansaldi (2003) to determine if it is linked to any
mapped C. canephora genomic fragments. It was observed that there was some kind of
competition between the two alleles in C. arabica accessions having the introgressed allele. The
competition was such that the non-introgressed allele was poorly amplified or not at all.
Moreover, there was poor amplification in several samples causing unclear scoring. When the
marker was scored alongside the data generated by Ansaldi (2003), it was evident that it was
79

linked to the fragment T2 but due to the above observations, it could not be clearly mapped.
Despite some repetitions, poor amplifications were observed which could not be explained.
When the SCAR derived from RAPD N I8250 marker was digested, some extra bands were
observed but not polymorphism. This was rather unexpected on the assumption that each DH
plants had one allele and based on the occurrence of a single band in acrylamide gel (Plate 5).
These results implied that there were mixtures of sequences in the products. This indicated
repetition of the sequences. In a haploid genome, it would be expected that sequences occur
singly unless they are duplicated and thus the maximum number of alleles expected in DH
population derived from a single diploid plant is two. The occurrence of multiple sequences of
the SCARs could be explained by existence o f duplicated regions. This observation was true for
SCARs derived from both AFLP and RAPD. Paillard et al. (1996) also observed restriction
fragment length polymorphisms (RFLP) indicative of repeated DNA in the DH plants from the
C. ccinephora clone IF200. The authors suggested that the duplicated loci probably referred to
gene families dispersed on different chromosomes. The repetition o f sequences therefore seems
to be of common occurrence in coffee.
In conclusion, this phase of study set a firm starting point in the search for CBD resistance gene
in a F; population that was being bred when these studies were being carried out. It highlighted
an inventory o f candidate targets in terms of C. canephora chromosomal fragments introgressed
into C. arabica and as AFLP markers. In reference to the fragments, the most probable ones
were T2 and T3. This phase also indicated the expectations for instance, in the analysis of
SCARs due to their lack of polymorphism and duplication. This phase also enhanced the
information available on the introgressed C. canephora fragments that is useful for any
subsequent studies aimed at their utilization and conservation especially in cv Catimor in Kenya.
80
SECTION 5.2 ESTABLISHMENT OF POPULATIONS FOR MAPPING RESISTANCE
TOCBD
5.2.1 INTRODUCTION
In order to be able to map markers o f a trait, it is necessary to have a collection of a segregating
progeny (population) derived from parents that differ in that trait and then characterise the
phenotypes o f the individuals of the population. Such a population is called a mapping
population and such populations are the foundation of genomics research. The choice o f the type
of mapping population to use is affected by the reproductive mode of the plant to be analysed
(self-fertile or not) and the relative ease of raising the population. Analysis of correlation
between phenotypic data of the mapping population and marker data, prove or disapprove
potential candidate genes controlling mono- or polygenic traits. An ideal mapping population
should be derived from parents with a large variation in the trait to be analysed (Schneider,
2005). Self-fertile naturally inbreeding plants such as Arabica coffee can attain a high degree of
homozygosity, and obtaining well-varied pure line parents for generating mapping populations is
possible. The mapping populations possible for such plants are F2 plants, recombinant inbred
lines (RIL), backcross (BC) plants and doubled haploid lines (DH).
F2 populations are the simplest form of mapping populations and are the basis o f Mendelian laws
of inheritance. Two pure or DH lines are crossed to give rise to F| generation that ideally is
uniform. An individual F| plant is selfed to produce an F2 population that segregates for the
differentiating traits o f the parents. F2 plants are therefore the outcome of one meiotic event
hence one recombination event. It is of advantage if the F2 plants can be preserved as they are or
as clones, for any future analysis as a permanent source of DNA since propagation of F2 plants
by crossing or selfing changes their genotypes. Some plant species do not allow easy selfing or
cloning, but fortunately coffee is a perennial plant that can be cloned even by simple methods
81

like cuttings and the potential yield from one plant is in thousands of seeds. To produce a
genome wide overview map, a population of about 100 F2 plants is a good compromise between
linked loci and cost/feasibility (Schneider, 2005). This size can then be increased for higher
resolution of selected genomic regions whereby many plants are analysed with fewer markers.
The use of an F2 population was thus highly rated for this study.
Distorted segregation o f some markers, meaning markers that do not obey laws of inheritance, is
an often encountered problem in mapping populations. This maybe due to selection o f gametes
in favour or against some particular gametal genotypes, selective fertilization of particular
gamete genotypes or other mechanisms operating during seed development, seed germination or
plant growth (Lashermes et a!., 2001; Schneider, 2005). The complexity of a fragment may also
be a cause o f segregation distortion as observed by Nikaido et al. (1999) using AFLPs in
Cryptomeria japonica. The authors were able to reduce or eliminate the distortion by adding
more selective bases to the primers. Different methods o f analysis may also cause
interpretational problems that may be erroneously referred to as segregation distortion. This may
include occurrence of “slippage" products in microsatellite analysis (Robinson and Harris, 1999).
In coffee breeding fields at Coffee Research Foundation (CRF) (Kenya), there are mature F|
plants of crosses between different lines of cv Catimor and cv SL28. These trees can be used to
rapidly develop F2 generations by selfing. The F2 populations would be expected to segregate in
traits that present major differences between the parents such as resistance to CBD and CLR and
compact growth. However, since the earlier breeding protocols was not designed with molecular
studies in mind, some technical hitches might be encountered since the crosses were made using
bulked pollen from several trees of a cv Catimor line to pollinate several cv SL28 trees and
bulking the Fj seed. Individual parents that donated the gametes cannot therefore be traced and
82

this might result in some polymorphism in progenies that cannot be explained by polymorphism
between representative accessions o f the parental varieties. In this study, individual parents of
the F| plants could therefore not be identified. However, segregation of traits that are divergent
between the parents is expected in the F2 and these populations can therefore be used to map a
trait such as CBD resistance that is uniform and contrasting between the parental cultivars. The
first trait targeted was resistance to CBD but other traits could also be analysed in the same
populations alongside the studies and/or after field establishment, so long as the traits are
divergent between the parents and segregate predictably in the population. The particular
population(s) used for the study of CBD resistance may not at the end be the most appropriate on
'as is’ basis for all future studies due to lack o f identity of individual parent plants, but they can
generate very useful highlights. In addition, quantitative trait loci (QTL) may also be identified
for composite traits like yield and quality by analysing mapping populations derived from these
crosses, despite the lack of identity of individual parents. This would be done by raising a large
mapping population o f about 150 individuals from one of the F] trees that would cover the range
o f variation in the trait. The use of these parents also increases the level of polymorphism which
otherwise is much lower between un-introgressed C. arabica varieties, making the generation of
dense maps more difficult (Lashermes et al., 1999; Anthony et al., 2002a, Pearl et al., 2004).
5.2.2 OBJECTIVE
The objective of this phase of the study was to develop an F2 generation between cvs SL28
(susceptible) and Catimor (resistant) suitable for genetic mapping and verify its segregation.
83

5.2.3 MATERIALS AND METHODS
5.2.3.1 Establishment of seedlings
The plan of activities in establishing two segregating F2 populations for mapping CBD resistance
gene is presented schematically in Figure 4. The span of the activities presented (Figure 4)
covered the entire period of this study with molecular studies being carried out when the plant
materials were in the appropriate stage or after appropriate treatment such as screening for CBD
resistance. It should be noted that the search for candidate markers for CBD resistance (Section
5.1) was done while the F2 seeds were maturing in the field. Two Fi plants, one from a cross
between of cv Catimor line 127 and cv SL28 and another from a cross between cv Catimor line
88 and cv SL28 were selfed in October 2003, and the seeds harvested in June 2004 to give rise to
populations D and E from the first and second trees respectively. Harvesting was done on two
different dates (two weeks apart) as the berries ripened. On the first date, 128 and 134 seeds were
harvested from the two trees respectively while 134 and 160 seeds were harvested on the second
date.
The seeds harvested on the two dates were planted separately as replicates. Seeds of susceptible
C. arabica cv Caturra were harvested on the second date from the same field and subsequently
treated in the same way as the seeds of populations D and E. This was to provide a susceptible
control to verify success of infection and comparative disease score during inoculation tests.
After pulping by squeezing the berries, the seeds were partially dried, the parchment was
removed by hand and then the seeds were germinated at room temperature in moist sterile sand
in plastic boxes with a capacity of 200 seeds each. The seeds were watered frequently but lightly
to avoid water logging.
84
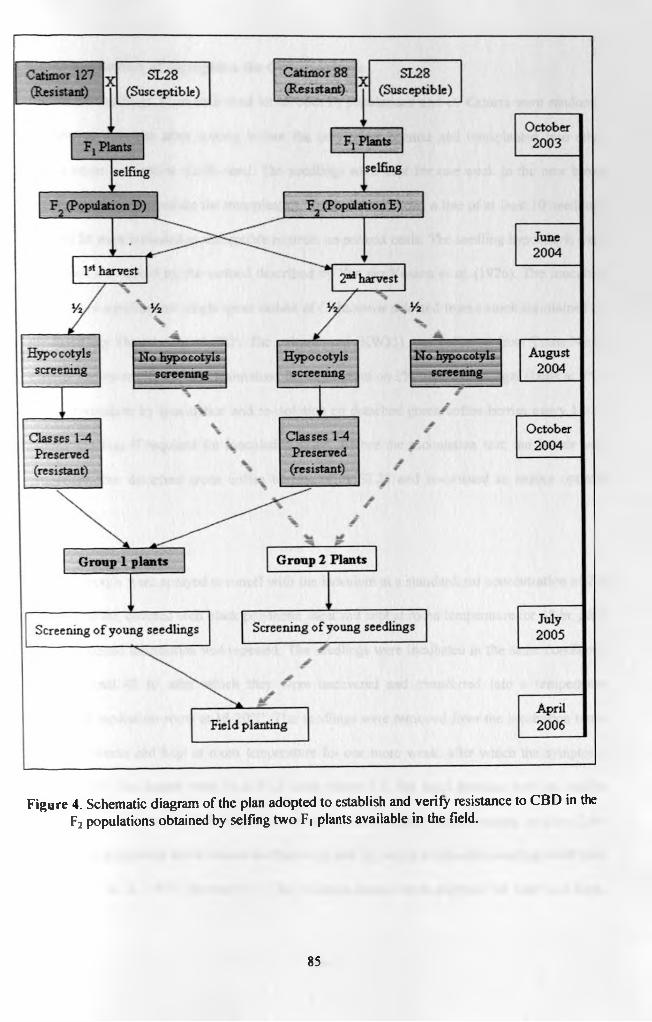
Figure 4. Schematic diagram of the plan adopted to establish and verify resistance to CBD in the F2 populations obtained by selfing two Fi plants available in the field.
85

5.2.3.2 Verification of segregation for CBD resistance
Half of the seedlings from each seed lot of both F2 populations and cv Caturra were randomly
uprooted at 5 weeks after sowing before the cotyledons opened and transplanted into other
plastic boxes with moist sterile sand. The seedlings were kept for one week in the new boxes
before inoculation to reduce the transplanting shock. In each new, a line of at least 10 seedlings
o f cv SL28 were included as susceptible controls on per box basis. The seedling hypocotyls were
inoculated and scored by the method described by Van der Vossen et al. (1976). The inoculum
consisted of a pathogenic single spore isolate of C. kahawae selected from a stock maintained by
the Pathology Department o f CRF. The culture used (KW33) was collected from Trans Nzoia
District in western Kenya and maintained for eight years on 2% malt extract agar slants at 4°C,
with rejuvenation by inoculation and re-isolation on detached green coffee berries every 18-24
months (or less if required for inoculation tests). Before the inoculation test, the isolate was
inoculated into detached green coffee berries of cv SL28 and re-isolated to ensure optimal
virulence.
The hypocotyls were sprayed to runoff with the inoculum at a standardized concentration of 2 x
106 conidia/ml, covered with black polythene sheet and kept at room temperature for 48 hr, after
which a second inoculation was repeated. The seedlings were incubated in the same conditions
for additional 48 hr after which they were uncovered and transferred into a temperature
controlled incubation room at 18-20°C. The seedlings were removed from the incubation room
after two weeks and kept at room temperature for one more week, after which the symptoms
were scored. The scores were on a 1-12 scale where 1 is the most resistant with no visible
symptoms which progressively become more severe from minute brown lesions in class 2 , to
girdling by deep black active lesions in Classes 11 and 12, which results into seedling death (van
der Vossen et al., 1976, Appendix 1). The infection scores were analysed for inter and intra
86
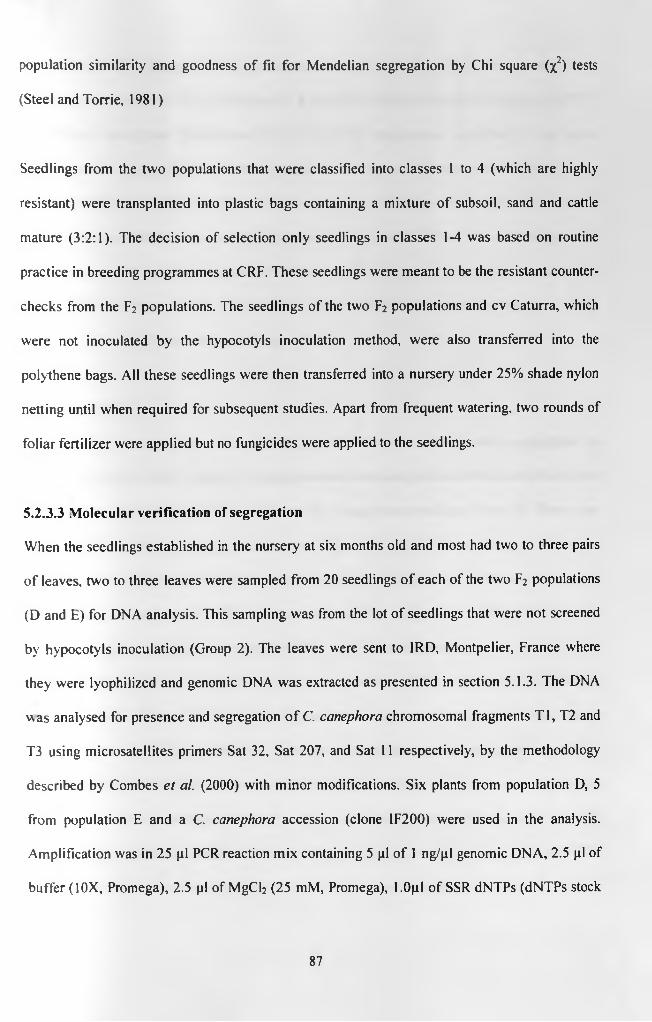
population similarity and goodness of fit for Mendelian segregation by Chi square (x2) tests
(Steel and Torrie, 1981)
Seedlings from the two populations that were classified into classes 1 to 4 (which are highly
resistant) were transplanted into plastic bags containing a mixture o f subsoil, sand and cattle
mature (3:2:1). The decision of selection only seedlings in classes 1-4 was based on routine
practice in breeding programmes at CRF. These seedlings were meant to be the resistant counter
checks from the F2 populations. The seedlings of the two F2 populations and cv Caturra, which
were not inoculated by the hypocotyls inoculation method, were also transferred into the
polythene bags. All these seedlings were then transferred into a nursery under 25% shade nylon
netting until when required for subsequent studies. Apart from frequent watering, two rounds of
foliar fertilizer were applied but no fungicides were applied to the seedlings.
5.2.3.3 Molecular verification of segregation
When the seedlings established in the nursery at six months old and most had two to three pairs
of leaves, two to three leaves were sampled from 20 seedlings o f each of the two F2 populations
(D and E) for DNA analysis. This sampling was from the lot of seedlings that were not screened
by hypocotyls inoculation (Group 2). The leaves were sent to IRD, Montpelier, France where
they were lyophilized and genomic DNA was extracted as presented in section 5.1.3. The DNA
was analysed for presence and segregation o f C. canephora chromosomal fragments T l, T2 and
T3 using microsatellites primers Sat 32, Sat 207, and Sat 11 respectively, by the methodology
described by Combes el al. (2000) with minor modifications. Six plants from population D, 5
from population E and a C. canephora accession (clone IF200) were used in the analysis.
Amplification was in 25 pi PCR reaction mix containing 5 pi of 1 ng/pl genomic DNA, 2.5 pi of
buffer (10X, Promega), 2.5 pi of MgC^ (25 mM, Promega), l.Opl of SSR dNTPs (dNTPs stock
87

with a little dATP, Appendix 3), 2.5 pi each of right and left primers (2 pM, Eurogentec,), 0.1 pi
of Taq DNA polymerase (5U/pl, Promega), 8.8 pi of PCR grade water and 0.08 pi of adATP P33
(10 pCi/pl, Amersham Biosciences, UK). The PCR programme consisted of an initial
denaturation o f 2 min at 94 °C followed by 5 cycles of 45 sec o f denaturation at 94 °C, lmin
primer annealing at 60 °C reducing by 1 °C every cycle, elongation for 1 min at 72 °C and 30
cycles of 45 sec of denaturation at 90 °C, primer annealing at 55 °C for 1 min and elongation at
72 °C for 1 min 30s and final extension of 8 min at 72 °C. Electrophoresis and gel treatment was
as for AFLP in Section 5.1.3.4 and revelation was by digital scanning using Phosphor storage
screen (Amersham Biosciences) as in Section 5.1.3.5.
5.2.4 RESULTS
The hypocotyls inoculation results displayed distribution consistent with segregation in
resistance to CBD (Plate 7, Figure 5). The populations also segregated in visible traits like vigour
(height, girth and leaf size) and the colour of the young leaves and tips (Plate 7). There were
more stunted seedlings in population D than in E. The distribution of the seedlings in the classes
displayed some differences both between the populations and between seed lots o f the same
population. The success of infection was evaluated by comparison with severity in the
susceptible check cv Caturra. Majority (97.5%) of cv Caturra seedlings were in the highly
susceptible classes 11 and 12 (Figure 5 A) with a mean score of 11.8, and therefore infection was
highly successful. On the other hand, the F2 populations segregated into all the classes, except
class 1 (Figure 5 B, C). The distribution of the seedlings within the infection classes was similar
between the seed lots and populations, though Population D appeared to be more evenly spread
out. However, there were higher counts of seedlings in the highly susceptible classes (11 and 12)
within the lots of seeds harvested at the onset of ripening (Lot 1) than in the later lot (Lot 2). The
mean infection grades of the first and second seed lots of Population D were 7.6 and 6.5
88

respectively and an overall population mean o f 7.1. In Population 2, the mean infection grades
were 7.3 and 6.9 respectively for first and second lots and an overall average o f 7.1. By
comparing the infection results the F2 populations with those of the susceptible cultivar,
seedlings in classes 11 and 12 were considered as susceptible and the rest o f the seedlings were
considered to express some degree o f resistance. Using this criterion, it was observed that there
were neither significant differences in the distribution of the seedlings between lots o f the same
population (x2 = 1 05; p = 0.300 and x2 = 0.85; p = 0.336 for Populations D and E respectively)
nor between the two populations (x2 = 0.21; p = 0.646). However, the distribution was highly
significant between the two mapping populations and the susceptible cultivar (cv Caturra). The
ratios of resistant to susceptible seedlings were 96:35 and 103:44 in populations D and E
respectively, which fitted a 3:1 ratio for a major gene action (x2 = 0.206; p=0.650 and x2 = 1.907;
p=0.167 for the respective populations). Despite the above categorisation, only seedlings within
classes 1 to 4 were preserved for use in subsequent studies as resistant sub-populations so as to
facilitate direct comparison with observations of breeding programmes at CRF. Susceptible
seedlings were completely killed without a chance of obtaining DNA from them (Plate 7).
The presence and segregation of three microsatellite markers of introgressed C. canephora DNA
fragments was evaluated, and two fragments (T2 and T3) were present in both populations and
appeared to segregate in the expected 3:1 ratio while one (Tl) was not observed (Plate 8). Sat 11
generated a pattern with an allele in the C. canephora accession IF200 similar to the highest
allele in the Populations D and E (Plate 8 C), but comparison with cv Catimor accessions (PI
and P2) demonstrated that the introgressed allele from C. canephora was another one (Plate 8
D). The difference in the details of the autographs of Plates 8 C and 8 D is the level o f separation
which was due to electrophoretic conditions in which the gel for Plate 8 D was migrated for
longer distance thus attaining better separation of the bands.
89

Plate 7. Some phenotypic traits that were observed to segregate in the two F2 populations of cv Catimor x cv SL28; (A) resistance to CBD by hypocotyls inoculation test and (B, C) colour of young tips and vigour of young seedlings.
90

I 2 3 4 5 6 7 8 9 10 II 12A
Disease score class
Population D
0 Loti ■ Lot 220 n
1 2 3 4 5 6 7 8 9 10 II 12B
Disease score class
Population E
Disease score class
Figure 5. Bar graph presentation of infection scores of seedling hypocotyls o f the two replicates of F2 populations of after inoculation with C. kahawae.
NotesLots 1 and 2 refer to first and second harvest batches o f each population: (A) Population D (Catimor 127 x SL28) and (B) population E (Catimor 88 x SL28).
91
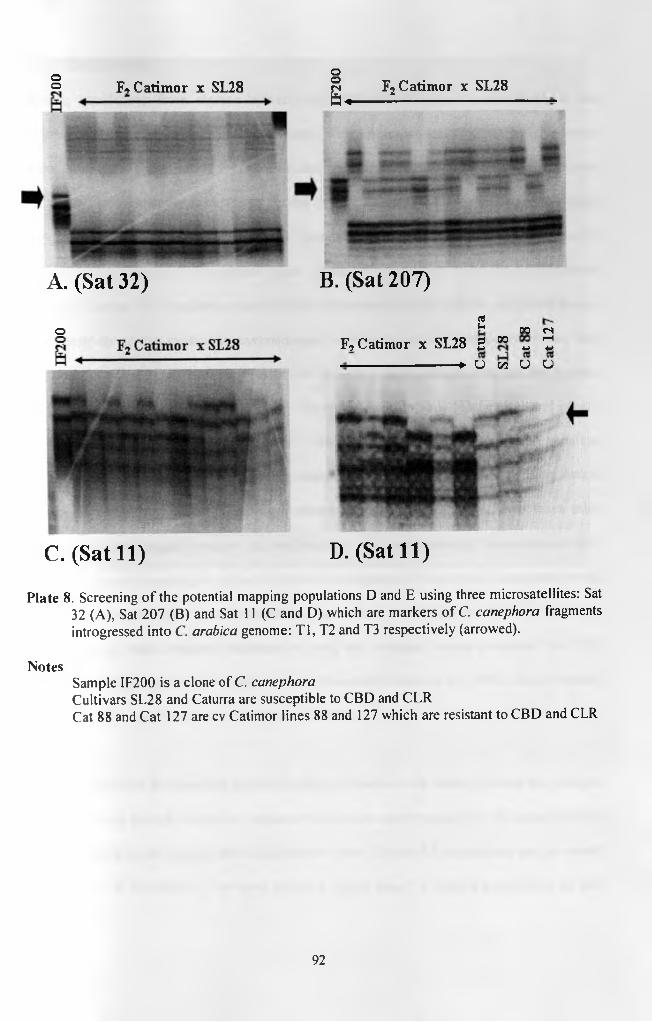
F . Catirrm r y ST.1S F2 Catim or x SL28oo
A. (Sat 32)
oo
E*
B. (Sat 207)
O
C.(Sat 11)
g 00 fSF, Catimor x SL28 2 ” « 7!---------------------------- ► U &5 u o
D. (Sat 11)
Plate 8. Screening o f the potential mapping populations D and E using three microsatellites: Sat 32 (A), Sat 207 (B) and Sat 11 (C and D) which are markers of C. canephora fragments introgressed into C. arabica genome: T l, T2 and T3 respectively (arrowed).
NotesSample IF200 is a clone of C. canephoraCultivars SL28 and Caturra are susceptible to CBD and CLRCat 88 and Cat 127 are cv Catimor lines 88 and 127 which are resistant to CBD and CLR
92

5.2.5 DISCUSSION
Two F2 populations from crosses between cvs SL28 and Catimor were realised. It was
demonstrated that the populations were segregating in resistance to CBD by hypocotyls
inoculations tests. The infection results of the two populations exhibited high similarity between
and within them. However the tendency for the first lots of the two populations to have slightly
more sensitive plants (Figure 5) indicated the possibility of the action of factors that may not be
limited to the occurrence o f resistance genes. These were not likely to be the environmental
conditions during the inoculation tests because all treatments were random and simultaneous.
The sensitivity of the method to environmental conditions especially temperatures has been
observed for a long time (van der Vossen and Waweru, 1976; Masaba and van der Vossen,
1982). The possible cause of the observed tendencies could include biochemical and genetic
composition of the seeds. The former would affect both inter- and intra-population variation,
while the second would affect the inter population variation. The interplay o f multiple factors
during inoculation o f hypocotyls generates results that may differ over time even when using
seeds of the same origin. However, the verification of the involvement of factors such as seed
biochemistry and physiology is subject to further investigations. Despite the inconsistencies and
arguments o f scaling and data interpretation, the method is valuable especially in screening
populations to obtain resistant seedlings or using the averaged results to deduce the CBD
reaction phenotype o f the mother plant or line (Van der Vossen, el al., 1976; van der Graaff,
1978, 1982; Dancer, 1986; Owourand Agwanda, 1990).
The distributions of the seedlings within the infection classes were similar between the seed lots
and populations, though Population 1 appeared to be more evenly spread out. The mean infection
grades of the first and second lots of Population 1 were 7.6 and 6.5 respectively and an overall
mean of 7.1. In Population 2, the mean infection grades were 7.3 and 6.9 respectively for first
93

and second lots with an overall average o f 7.1. There were no significant differences in the
distribution of the seedlings between lots o f the same population (x2 = 105; p = 0.300 and x2 =
0.85; p = 0.336 for Populations 1 and 2 respectively), nor between the two F2 populations (x2 =
0.21; p = 0.646). By comparing the infection results of the F2 populations with those of the
susceptible cultivar, seedlings in classes 11 and 12 were considered as susceptible and the rest of
the seedlings were considered to express resistance. Using this criterion, the ratios of resistant to
susceptible seedlings were 96:35 and 103:44 in Populations 1 and 2 respectively. The ratios
fitted a 3:1 ratio for a major gene action (x2 = 0.206 p=0.650 and x2 = 1.907; p=0.167 for
Populations D and E respectively). However, it was still borne in mind that the spread of the
reaction phenotypes suggested lack of strict dominance, presence of other modifying genes or
gene by environment interaction.
In routine breeding programmes at CRF, preselection by inoculation of hypocotyls results into
plants with high resistance to CBD and CLR, with very few exceptions that are discarded as
escapes. In this study, no seedling o f the cv Caturra was classified within the resistant classes (1-
4) which demonstrated that the infection was effective. However, the two seedlings in
intermediate susceptible classes indicated the possible ambiguity of the classes and this
demonstrates the advantage of retaining the highly resistant classes. Another advantage is that
these seedlings have higher survival chances in the nursery than the more infected seedlings.
Finally, by adopting the routine CRF procedure, the expected field resistance could be directly
related to results of previous breeding programmes. The disadvantage of the method is killing
susceptible plants as was demonstrated in this study (Plate 7). In fact, the seedlings were
completely killed even before their cotyledons opened and they could not be used for DNA
extraction.
94

Molecular analysis using microsatellite markers revealed that two C. canephora chromosomal
fragments (T2 and T3) were present and segregating in the two F2 populations (Plate 8). The
results of these tests and those of Section 5.1 made fragments T2 and T3 the most probable
candidates for disease resistance in the cv Catimor accessions, though not exclusively. T1 was
not observed in this phase of the studies and its absence in cv Catimor accessions introduced into
Kenya from Colombia is therefore further confirmed because it was also not observed in Section
5.1. In this case, if an accession with this fragment is encountered (either in cv Catimor or HDT
accessions); it should be preserved as source of extra diversity. Analysis of the DNA markers in
these populations coupled with traits like disease resistance or agronomic traits like compact
growth habit in these or similar populations would generate information on their possible genetic
linkages. The polymorphic microsatellite markers of C. canephora introgressed fragments were
considered to be priority candidate markers for CBD resistance gene alongside the AFLPs
identified in section 5.1. The seedlings classified as resistant (Classes 1-4) by the hypocotyls
inoculation test (Group 1) were maintained as counter checking population for later studies
during alternative screening method(s) and genetic mapping.
In conclusion, two segregating F2 populations between a donor (cv Catimor) and a recipient (cv
SL28) were realised as demonstrated both by phenotypic and molecular traits. This was an
important prerequisite for subsequent work in deciphering the genetic basis of resistance to
CBD, derived from C. canephora that is introgressed into C. arabica via HDT. The populations
will also avail a collection of plants that at the end of the study will constitute an important
source of breeding material for coffee improvement. This will be in form of plants identified to
be of differential genetic assortment and can be used as breeding parents or even developed into
single-tree selection cultivars.
95

SECTION 5.3 DEVELOPMENT AND USE OF YOUNG SEEDLINGS INOCULATION
METHOD TO SCREEN COFFEE PLANTS FOR RESISTANCE TO CBD
5.3.1 INTRODUCTION
In order to be able to identify and map a certain phenotype, the phenotypes o f the individuals of
a mapping population have to be determined. In regard to this study, the overall objective was to
identify and map markers for CBD resistance. Noting that there was no mature mapping
population and the need to gain on time, a young mapping population had to be screened early
and DNA obtained from all the plants irrespective of susceptibility to the disease. One widely
used method to characterise resistance to CBD in immature coffee plants is the inoculation of
seedling hypocotyls (van der Vossen el al., 1976). However as observed in Section 5.2 above
(Plate 7 A), this method results in the death o f susceptible seedlings and they cannot be available
for later studies in living form. The resultant population is thus biased towards resistance and
factors that affect its expression. The susceptible seedlings also die very early before extraction
of DNA can be done and the dead seedlings are necrotic and colonised by the fungus, such that
extraction o f DNA from them would be little, contaminated by the DNA of the pathogen and
degraded. Another disadvantage o f the method is that the results o f inoculations of seedlings of
the same source may give different results in different repeats overtime thus creating some
inconsistency. This is partly due to the sensitivity of the method to temperature that necessitates
the need for a temperature-controlled room for such inoculations (van der Vossen and Waweru,
1976).
However, the method as it was developed or with minor modifications especially on data
interpretation and analysis, is very valuable especially in screening populations or using the
averaged results to infer the phenotype of the mother plant or line (Van der Vossen, el al., 1976;
van derGraaff, 1978, 1982; Dancer, 1986; Owourand Agwanda. 1990). An alternative screening
96
method that was also developed by Van der Vossen et al. (1976) is the inoculation of shoot tips
of young seedlings. This method has the advantage that leaves can be sampled from the entire
population for DNA extraction, and at least part of the susceptible plants can survive for later
studies. However, as described by the authors, the method requires selection of only seedlings
with tips at the right stage (1-2 cm long with unopened leaves). It is also not clear if the authors
chose their plants irrespective o f vigour such that even weak and stunted seedlings were
included. Furthermore, environmental conditions were not controlled which implies that the
success of infection depends on the occurrence favourable weather conditions, and therefore can
only be done within specific periods of the year. Moreover, the climatic conditions have changed
over the last three decades at the site where the method was developed (Ruiru, Kenya), such that
the average maximum and minimum temperatures have increased while rainfall seasons have
become shorter (Gichuru, 2005). This is also the site where the mapping population for this study
was to be screened and therefore there was concern of not achieving results similar to those of
the authors.
The in vitro selection methods proposed by Nyange et al. (1995, 1997) require development of
technical skills and capital investment, and may not be the most suitable for screening large
populations. Since the authors used calli generated from seedling hypocotyls, the methods are
destructive which would eliminate a population if all individual were to be screened. This is also
true also for biochemical and histochemical methodologies reported by Gichuru (1993, 2001)
and Gichuru et al. (1996, 1999). The option of raising the plants to maturity for observations
tests in the field or laboratory tests on the berries or the seeds that they produce is time
consuming. There was consequently a need to develop a method for early screening of resistance
to CBD, which addresses the above limitations. The method would have to give a high value to
the individual seedling reaction as opposed to the average value o f the progeny. In this study, a
97

modification o f the shoot tip inoculation method was assessed. The modifications were aimed at
enhancing the infection and disease progress and then develop a scoring scale based on the
details of infection.
It was recognised that it might be crucial to confirm the results of laboratory screening by testing
in the field at least for some plants, especially those with unique genetic assortments of value
either in refining the genetic map or as candidates for breeding lines. The subsequent
confirmatory tests on mature plants would either be by inoculation of their progenies (F3), field
infection (natural infection or artificial inoculation) or a combination o f both field and
hypocotyls tests. In addition, F3 populations would generate further recombination which may be
important for fine mapping while field infection would generate information directly related to
the actual mother plant genotype without genetic recombinations. One foreseen problem
regarding natural field infection was that the plants were first to be established in the fields at
CRF's main station in Ruiru, where natural CBD infection has been low for several years in the
past (personal observation). This problem may be solved by introduction of clonal materials into
research substations in more favourable regions, but this would require even more time. To
address this issue, the effectiveness of artificial field inoculation under current field conditions
was assessed at CRF Ruiru, so that the initial berries borne could possibly be inoculated in the
field and therefore save time.
5.3.2 OBJECTIVE
To develop and use a suitable method to screen the F2 populations for CBD resistance at an early
stage, while allowing availability of DNA from the entire population and enhancing the survival
of susceptible plants.
98
5.3.3 MATERIALS AND METHODS
5.3.3.1 Preliminary testing of young seedlings inoculation method
Two lots of ten seedlings each were randomly used per the cultivars SL28 and Catimor line 88.
The seedlings were picked irrespective of visual growth status o f the tips from a nursery at CRF.
Ruiru in early June 2004. The two lots of each cultivar differed in age such that they were 6 and
12 months old respectively. The seedlings had been raised on a mixture of soil, sand and cattle
manure (3:2:1) as outlined in Section 5.2. The seedlings were picked randomly irrespective of
the visual assessment o f the physiological state of the growing tip and then taken to the
laboratory for inoculation tests. Inoculation was by spraying the top part of the seedlings (up to
the third node from the tip) with C. kahawae conidial suspension at 2 x 1O*1 conidia/ml. The
fungus had been freshly isolated from berries infected by CBD in the field at Coffee Research
Station, Ruiru. The seedlings were incubated in the dark (covered with dark polythene sheet and
humidified) for 48 hr at room temperature (22-24 °C) and then transferred into a cold room at
18-20 °C for three weeks, after which they were transferred back to room temperature. They
were maintained in this condition for two months with frequent watering and observation twice a
week for progress o f infection and recovery processes.
5.3.3.2 Field inoculation tests
Field inoculation tests were carried out on expanding green coffee berries on four trees of cv
SL28 and eleven trees from different lines o f cv Catimor by the method of van der Vossen et at.
(1976). Berries on three selected branches per tree with at least thirty (30) berries per branch
were sprayed to run-off with the same inoculum used to inoculate the young seedlings. The
inoculations were done in the evening and the inoculated branches were subsequently covered
with translucent polythene tubes for 4 days. The berries were then uncovered and infection was
99

left to progress under natural conditions with weekly observations but final records were taken
after three weeks.
S.3.3.3 Screening of F2 populations by the young seedlings inoculation method
The seedlings established in the nursery as explained in Section 5.2, were maintained for one
year up to late June 2005, without any application of fungicides and only two applications of
foliar fertilizer. Fungicides were not applied even to control nursery diseases such as brown eye
spot (Cercospora coffeicola) so as to avoid any possible interference of the fungicide residues
with inoculation with C. kahawae later and also to allow natural infection by CLR, a trait that
was expected to segregate. One week before inoculation, leaves were sampled from all the
seedlings and sent to IRD, Montpellier where they were lyophilized or stored at -80°C as
described in Section 5.1. The one-week interval was a precaution to be sure that the samples had
reached Montpellier before carrying out inoculations.
The seedlings were arranged in boxes for ease of handling during the inoculation process and
each box could hold 32 potted seedlings. In each box, two seedlings of the susceptible cv Caturra
were placed randomly among the F2 seedlings as checks for the effectiveness of inoculation and
infection. In addition, one box with only seedlings of cv Caturra and another box containing ten
seedlings each of cvs SL28 and Catimor line 88 were included as extra controls, although these
seedlings were older. The seedlings were inoculated as outlined in Section 5.3.3.1 but using the
single spore isolate o f C. kahawae (KW33) used in Section 5.2 to inoculate seedling hypocotyls
of the two F2 populations D and E. They were then covered at room temperature with black
polythene sheet for 48 hr and the enclosure was kept humid by placing dishes with water inside
plus three daily water sprays with a hand atomiser between mid-morning and late afternoon. The
temperature of the room was monitored with a maximum-minimum thermometer. After the 48
100

hr, the seedlings were then transferred into a cold room used for inoculation of hypocotyls
(Section 5.2), where they stayed for three weeks and the temperature monitored. During this
time, they were observed at least twice a week for infection and those that were infected with
likelihood of drying were removed from the room in attempt to save them. After three weeks, all
the seedlings were transferred from the cold room back to the nursery for two more weeks after
which the symptoms were recorded. Then a disease scoring scale was described considering all
aspects of infection process observed during the entire screening process. The seedlings were
thereafter maintained in the nursery for establishment in the field later.
5.3.4 RESULTS
5.3.4.1 Preliminary test of the young seedlings inoculation method
The initial symptoms on the seedlings of the susceptible cv SL28 were dark lesions mainly at
leaf bases (Plate 9 A, B). This was observed in the two age groups (6 and 12 months) and it led
to either leaf fall or the leaves dried but remained attached. Initial infection was also observed in
the intemode areas. The lesions then progressed rapidly in the susceptible cultivars and all the 6-
month old seedlings o f SL28 finally dried completely by the fourth week. The lesions in older
seedlings also progressed down the main stem and most leaves dropped. There was a leading
yellow halo ahead o f the dead areas (between the dead and healthy areas) as a sign of
progressing infection that had not been arrested (Plate 9 C). The number of infected nodes varied
from 2 to 4 on the older seedlings of cv SL28. However, the nodes below the infected areas
started sprouting and by the third month, they had developed new shoots (Plate 9 D). The
infection had stopped by this time possibly due to unfavourable weather since the average
ambient temperature had also increased and humidity reduced in the months of August and
September. One of the 12 months old seedlings of cv SL28 failed to be infected and it was
101
observed to have a dormant tip. This highlighted the possibility o f occurrence o f failed infection
in some susceptible genotypes.
Unlike the cv SL28 seedlings, there were no marked differences between the 6 and 12 months
old seedlings o f cv Catimor. Some of these seedlings did not have any symptoms o f infection
and even the leaves on the tips were not affected. Some seedlings were slightly infected and
dropped the young leaves on the tip while some infections on the young tips progressed
downwards but stopped at the first node below the young leaves (Plate 8 E). There was no halo
below these nodes and the leaves at these nodes did not fall. Young shoots then developed from
the node below the dead tips. Seedlings o f cv Catimor did not have the general defoliation
observed in SL28. Aspects of pathogenesis which were considered to be of potential in
differentiating resistance and susceptible plants included the number of nodes or length of
infected area, the rate o f lesion progress, lesion type/characteristics and defoliation or drying of
leaves. Death of the very young shoot tips was observed in both cvs Catimor and SL28 and was
considered to be ambiguous in terms of genetic interpretation.
5.3.4.2 Inoculation of attached coffee berries in the field
The infection on attached berries of cv SL28 inoculated in the field ranged from 84-96 % on per
tree basis ( 100-120 berries per tree) with most of the berries turning black and others falling off
the branches (Plate 10 A). This was despite the intermittent cloudy and sunny weather observed
during that period and open tree canopies. These factors were unfavourable for the disease
progress and this was evident from the lack of natural infection on the non-inoculated branches
on the same trees (Plate 10). In cv Catimor, the range of infection was 0-20%. However, even in
the more infected plants, the lesions were superficial and berry drop was not observed as for cv
102

SL28 (Plate 10 B, C). This was despite the fact that canopies of the cv Catimor trees were thicker
than in cv SL28 due to growth habit, close spacing and lack ofCLR infection.
Plate 9. Symptoms observed on young coffee seedlings after inoculation with C. kahawae. (A and B); early symptoms o f infection on cv SL28 seedlings, (C); an active lesion on infected a cv SL28 seedling showing the dead top and halo zone ahead of the necrotic area (D) a cv SL28 seedling after regeneration o f a young shoot during recovery after infection. (E); a cv Catimor 88 seedling showing a dead young tip and infection arrested at the first node.
Plate 10. Symptoms o f infection on attached green coffee berries in the field three weeks after inoculation with C. kahawae. (A); blackened berries of SL28 (note the stalks from which berries had fallen indicating susceptible infection), (B); inoculated attached berries on a cv Catimor tree, (C); close-up of the infected berries of cv Catimor showing the limited progress of the lesions (resistance).
103
5.3.4.3 Screening of the F? mapping populations by young seedlings inoculation method
The F; seedlings were inoculated after 10 months in the nursery. The seedlings exhibited large
differences in growth vigour, with some being just 4-6 cm high, especially in population D. and
some being as tall as 50-60 cm. Some seedlings were also very thin in relation to their height.
Some of the small seedlings had few internodes while others had several but short internodes.
This was in contrast to the seedlings of pure cultivars o f both cv SL28 and cv Catimor which
were used for pre-testing the method and the seedlings of cv Caturra which were raised alongside
the F2 populations, all o f which had exhibited highly uniform growth. Most o f the F2 seedlings
had brown eye spot disease (Cercospora coffeicola), while 9 (9%) and 4 (3.2%) seedlings from
populations D and E respectively were observed to have at least one sporulating lesion of CLR.
One of the CLR infected seedlings was very small and was growing under the canopy of the
other seedlings. To estimate the disease pressure of CLR based on incidence, 50 seedlings of cv
Caturra grown alongside the two F2 populations were randomly observed for CLR infection.
Infection was recorded as being present where at least one lesion with some sporulation was
observed. All the observed seedlings of cv Caturra were infected hence an incidence o f 100%. It
was also observed that the severity of the disease on individual seedlings was higher in cv
Caturra than in the F2 populations.
The ambient temperature of the room at the time of inoculation ranged from 18.5 °C to 21 °C for
the two days (48 hr) that the seedlings were kept there for infection before being transferred into
the cold room. They were then incubated in the cold room for three weeks when infection was
judged to be satisfactory from observations of the seedlings of cv Caturra which were severely
infected. During this period, temperatures in the cold room ranged from 15 °C to 18 °C. The
weather during the whole inoculation period was cool and humid with occasional light rains. The
initial infection symptoms were the typical ones observed during the pre-testing stage, though
104

infection on several nodes per seedling was more common. The infection progress was variable
in these populations resulting in a continuum of severity at the time of recording. Some seedlings
did not exhibit any infection symptoms at all while in the most susceptible cases; there was
complete seedling death or infection of a large part o f the plant, more than 3 internodes on
medium height plants with or without sporulation (Plate 11).
Most of the small seedlings were infected and killed, mostly within the first three weeks thus
casting doubt on their reliability in phenotype identification. However on some of these stunted
seedlings, the severity o f infection was low or even none especially those with short internodes
and thick stems (Plate 11 C). Although some seedlings were infected at the nodes resulting into
girdling, the other parts of these seedlings remained visually healthy without even signs of
wilting up to five weeks after inoculation when symptoms were recorded (Plate 11 C). Seedlings
that were severely infected before the full incubation period in the cold room (3 weeks) were
removed in attempt to rescue them (Plate 11 D). It was observed that even when the seedlings
were taken to the nursery, further progression of infection occurred which killed some more
seedlings. When scoring the symptoms, all the aspects of the pathogenesis were considered.
However, the time o f first symptoms appearance was not found to correspond to the final
severity of infection, and was therefore disregarded as a criterion for phenotype identification.
105

Plate 11. Symptoms observed on F2 seedlings (Catimor x SL28) five weeks after inoculationw ith C knhnw np
(A) A mixture o f symptoms in one of the inoculation boxes(B) An active lesion with heavy sporulation of the pathogen(C) Two seedlings whereby one had no symptoms o f infection except defoliation (in addition
to leaves sampled for DNA extraction) and another with restricted infection on a node resulting in girdling but not wilting o f upper part,
(D) a group of severely infected seedlings which were removed from the inoculation room before the end of incubation period as an attempt to save them.
106

In consideration of the symptoms observed, a five class disease scale was described and adopted
as described below:
0 No visible symptoms of infection
1 Infection on leaves and very small brown lesions on the stem. The lesions were
superficial and inactive. Infection signs occurred mainly on the young shoot above the
fully expanded leaves.
2 Larger lesions (than in Class 1), on stem above first node but not active. The variable
symptoms include scabs, brown superficial lesions small, small deep black lesions with
restricted borders lacking a leading yellow halo
3 Large black lesions sometimes mixed with scab lesions, total collapse of the young shoot
tips, girdling at the points where fallen leaves detached but with limited extension of the
subsequent lesion into the inter-node areas. Dead intemode areas that did not exhibit the
blackening associated with colonisation by the pathogen but results from wilting due to
girdling at the nodes.
4 Very active lesions progressing into the inter-node areas with leading halo zones, dead
areas are characterised by the typical tissue blackening associated with tissue colonisation
by the pathogen, death of multiple nodes or whole seedling, pathogen sporulation.
The distributions of seedlings into the various classes are presented in Table 5. There were
differences between the populations and between the groups screened and not screened by
hypocotyls inoculation method i.e. groups 1 and 2 respectively (Table 5). Eight out of eleven
small (non-vigorous) seedlings were rapidly killed within the first three weeks and were not
subsequently put into any phenotypic class. These included one seedling from Group 1 of
Population D. Two seedlings whose reaction was doubtful due to mechanical damage and signs
of root infections were also not categorised. However, the plants that were not categorised into
107

CBD resistance phenotype were included in molecular analysis o f entire populations, to avoid
segregation distortion o f markers.
Table 5. Disease infection scores o f one year old coffee seedlings o f two F2 populations (D and E) from crosses between cvs SL28 and Catimor, five weeks after inoculation withC. kahcrwae.
Group 1* Group 2*Class Population D Population E Population D Population E cv Caturra
0 5 14 12 26 01 10 7 17 22 32 5 6 9 10 23 6 8 24 37 104 3 0 33 26 36
Total 29 35 95 121 51
Notes* Group 1 were the seedlings which were screened by hypocotyls inoculation method and
identified as resistantGroup 2 were the seedlings that were not screened by hypocotyls inoculation method
The first three classes (0-2) were considered to be resistant and the fifth one (Class 4) to be
susceptible. Plants in Class 3 could not be clearly categorised into resistant or susceptible due to
presence of mixed symptoms which were observed in both the resistant and susceptible parents
(cvs Catimor and SL28/Caturra respectively) both during preliminary testing of the methodology
and in this phase. This class also had many plants that had low vigour especially in girth and
were girdled. However, when the infection was observed as continuous tissue colonisation, these
low vigour plants were placed in Class 4. Although no elaborate data was taken, the low vigour
plants (small or thin) were more frequent in Population D than in Population E. Attempts to
subdivide Class 3 further was too laborious and un-rewarding. Five plants o f cv Caturra (9.8%)
were in classes 0-2 and were interpreted as failed infection. Two of these plants had dormant
shoot tips though the topmost leaves were dark green and fully expanded. On the other hand,
there were three plants (10.3%) o f Group 1 of Population D that were classified as susceptible
108
although they were resistant by hypocotyls screening test. These plants had thin stems as
explained above. In population D, the number of seedlings in the resistant category (Classes 0-2)
was almost equal to that in the susceptible category (Class 4) i.e. 38 and 33 respectively while in
population E, the number of seedlings in the resistant classes 0-2 was a little more than twice that
in the susceptible class i.e. 58 and 26. In both cases these figures appeared to reflect higher
susceptibility than expected, but no definite conclusions could be drawn due to the relatively
large numbers in Class 3.
5.3.5 DISCUSSION
Coffee has a long generation interval of about 5 years. On the other hand, CBD is a disease of
the mature crop since it affects the fruits. It is therefore consequential that if field/natural
screening for resistance to the disease has to be done, a long time is required to pass from one
generation to another. However, there are artificial methods of screening which have been
developed to detect CBD resistance in early stages of coffee, notably the inoculation of seedling
hypocotyls and shoot tips (van der Vossen et al., 1976). In order to be able to relate molecular
results to phenotypes for genomic mapping, individual plants have to be phenotyped and DNA
extracted from them. The methods reported above had some shortcomings in this respect. The
hypocotyls inoculation method diminishes the chance of obtaining DNA from susceptible plants
because they are killed and eliminated from later studies in living form. The shoot tips
inoculation method is unsuitable for whole population screening in view of the fact that it
requires selection of seedlings in a particular growth stage. In this study, the hypocotyls
inoculation method and a modification o f the shoot tips inoculation method was co-utilized so as
to overcome the disadvantages o f each. Inoculation o f shoot tips of seedlings at about one year
was considered a suitable screening method allowing early screening without high loss of
susceptible plants, and it was pre-tested and then used. The methodology was modified by
109

provision o f suitable environmental conditions that were anticipated to enhance infection beyond
the shoot tips and irrespective of the stage o f growth o f the tips. This would facilitate screening
of the entire population because the seedlings do not need to be selected as described by van der
Vossen et al. (1976). While selection of only the seedlings with appropriate shoot tips may not
affect the random distribution of resistance genes, it would necessitate starting with much larger
populations or carry out multiple inoculations on subsets of the same population at different
times. The seedlings were incubated in a cooled inoculation room rather than nursery conditions
as w as done by van der Vossen el al. (1976). The length of period that the seedlings were kept in
the inoculation room was determined by the incidence and severity o f infection on the
susceptible controls (cvs Caturra and SL28). While pre-screening was done in plants of highly
uniform genotypes and phenotypes, the screening of the F2 population was more challenging
because of the mixed phenotypes especially with regard to plant vigour that resulted into more
variable disease expressions.
A five-scale classification of the symptoms was proposed by grouping symptoms that were
perceived as similar levels of expression of resistance. The first three classes (0-2) reflect
categories which were considered to result from incompatibility (resistance) while the fifth
(Class 4) was considered to be due to lack of resistance (susceptibility). Class 3 was perceived as
ambiguous in terms o f possible genotype as it appeared to be transitory reflecting either the
physiological status or moderated gene action that may have been due to genotype, environment
or interaction of the two. It was clear from the results of both pre-testing and F2 screening (Table
4) that there were factors other than genotype, which affected the final disease symptoms
w hereby with some seedlings of the susceptible cultivars even failed to be infected. There was an
effect of age of the seedlings in view of the fact that no misclassification was observed on the
young seedlings o f cv SL28 in the pre-testing because all of them were infected and ultimately
110
killed. On the contrary one of the older seedlings of the same variety failed to be infected. By
comparison with the seedlings screened by hypocotyls inoculation method and found to be
resistant, there were also some resistant plants which were as much infected as the susceptible
ones either in Classes 3 or 4 (Table 4). In the F2 populations, non-vigorous plants were observed
to be particularly susceptible which was suspected to be unrelated to absence of the resistance
gene. It was also evident that it would be difficult to save susceptible plants if they are inoculated
at a young stage or are of low vigour. Recording of the symptoms and development of disease
scale considered different attributes of pathogenesis. One o f the difficult aspects was to
recognise plants that were infected only at the nodes but the girdling caused wilting and death of
the upper part. Infection at the nodes may have been enhanced by accumulation of the inoculum
run-off at these points and presence of natural entry points like hydathodes. Such infection could
then cause defoliation that in turn would avail additional entry points even for secondary
pathogens such as Fusarium spp.
Rescuing o f susceptible seedlings was improved by transferring them from the incubation room
to ambient room temperature that was unfavourable for CBD development, though the absolute
conditions can be affected by weather conditions depending on the season and may approach
favourable conditions for CBD development. Salvaging of the susceptible plants could be further
improved where necessary by cutting the infected part if the growth structure allows, since some
seedlings had small compact stems. Upon recovery the seedlings sprouted later from nodes
below the infected area (Plate 8). However, it can be expected that some plants would be lost
because sometimes the infection progressed very rapidly and if the ambient temperatures are
favourable, infection can continue even when the seedlings are outside the cold room. Infection
by C. kahawae can also facilitate secondary infections by other pathogens such as Fusarium spp
that can accelerate seedling death. Infection below the grey mature part of the stem was not
111
easily noticeable which led to some seedlings appearing to be healthy towards the based but were
infected. To ensure analysis of DNA from all the plants, sampling of leaves for DNA analysis
w as done before inoculation which is an advantage of using this method.
In consideration of the results o f inoculation of young seedlings, Population E was chosen for
marker identification and mapping purposes and Population D as a cross-checking population
especially in respect to resistant seedlings obtained after screening by hypocotyls inoculation
method. This was because population D potentially had more plants misclassified as susceptible
comparing with group 1 plants (Table 5). It was anticipated that later studies would detect
misclassified plants and the significance of the intermediate class (Class 3).
Inoculation of attached berries in the field was successful and clearly differentiated resistant and
susceptible genotypes despite the prevailing climatic conditions that were unfavourable for
natural infection (Plate 10). This will be very useful in confirming the results o f the early
screening methods especially in clarification of results of the subsequent molecular studies that
may require phenotypic confirmation, especially o f recombinant plants without progeny
advancement that would lead to genetic reconstitution. Inoculation of attached berries in the field
would also save on time that would be required for the berries to mature and germinate seedlings
for hypocotyls inoculation tests.
The infection of coffee by C. kahawae is highly dependent on temperature such that at low
temperatures of 15°C and below, even resistant genotypes are infected while at temperatures
higher than 22°C even susceptible plants exhibit resistance phenotype (Nutman and Roberts,
1960; Van der Vossen and Waweru, 1976; Masaba and van der Vossen; 1982). In fact, this was
the factor that necessitated the construction of a temperature-controlled room (inoculation room)
112

at CRF to improve the efficiency of preselection by enhancing infection (van der Vossen and
Waweru, 1976). The mode of temperature control in the inoculation room is based on cooling
and not heating. This means that if the ambient temperatures fall below the optimum range of 18
°C to 20° C, as happens at night especially in the cold months o f June and July in Kenya, the
temperature of the inoculation room similarly falls below the optimum range and as a
consequence expression of CBD resistance is inhibited. During very cold weather, the room is
likely to experience even lower temperatures than in a normal closed room because the fan may
blow in the air from outside into the room.
During the period that the F2 populations were screened, the temperatures in the inoculation
room ranged between 15-18° C. This factor might have enhanced infection of otherwise resistant
seedlings as observed in this study. Another possible factor that could affect disease
development in the room could be light. Plants in the inoculation room receive less light
intensity than those outside, even if the curtains are opened and lights are switched on. As a
practice, the electric lighting in the room is usually off unless someone is in the room. In totality,
the seedlings receive less light hours and of less intensity, which could affect their
photosynthetic rate and hence nutritional status. This could have weakened the seedlings
especially the less vigorous ones leading to their succumbing to the infection. While hypocotyls
are largely non-photosynthetic and rely on stored food, the young seedlings are photosynthetic.
This aspect might cause some differences in the efficiency of the two methods. It is possible that
the ultimate reaction to infection by C. kahawae is affected by multi-genetic and environmental
factors that may be related to plant vigour and general defence systems. While major gene
actions are important in hypersensitive reactions like cell death at infection points, other
subsidiary mechanisms such as lignifications of cell walls and formation of cork barrier are also
113

involved (Masaba and van der Vossen, 1982; Gichuru et al., 2001). The net effect of the
potential mechanisms and their interaction with abiotic factors are subject to investigation.
It was nonetheless anticipated that even under these circumstances, plants with the resistance
gene(s) would display some phenotypic difference from the ones without the gene(s). This was
why all aspects that could reflect resistance such as lesion type, rate of lesion development and
sporulation were considered in developing the disease scale and classification of reaction type.
Seedlings in class 3 were not categorically classified as resistant or susceptible although a bias in
opinion was indicated as (R?) or (S?) for resistance and susceptibility respectively. Efforts to
separate this class further did not help to clear ambiguity even by enlarging the range of classes
and it was impossible to avoid misclassification. It was observed that even some cv Caturra
seedlings displayed symptoms within the resistant classes. Despite the limitations, it was
anticipated that misclassifications would not be very high and make it impossible to detect DNA
markers linked to resistance gene(s) and that the misclassified plants would be revealed by
molecular studies. A further precaution for detection of markers was by using plants classified as
resistant by hypocotyls inoculation method (Group 1) as controls in mapping work. Previous
experience at CRF with this pre-screening method laid a lot o f confidence on detecting resistant
plants. This strategy also had the advantage that Group 1 plants and Group 2 plants could be
directly compared since they were derived from the same segregating populations hence no
cross-specific concerns.
Although no artificial inoculation with H. vastatrix for screening purpose was done, natural CLR
pressure in the nursery was high enough to effect selection for the disease. The seedlings were
raised in a space surrounded by many older coffee seedlings and mature coffee trees that were
infected by CLR. The seedlings stayed in the nursery for about 8 months including two
114
favourable CLR infection periods in October-December 2004 (short rains) and from March-June
2005 (long rains). Furthermore, all the examined seedlings o f cv Caturra growing in the same
nursery bed with the F2 populations were infected. Chances of disease escape either due to lack
of inoculum or unfavourable infection conditions were arguably low and the main reason for
non-infection was most likely due to genetic factors. The observation of CLR infection on a
small seedling growing under un-infected seedlings indicated further the lack o f physical
protection. No CLR infection was observed on seedlings that were selected for CBD resistance
by hypocotyls inoculation method (Group 1). This agrees with the routine observations in
breeding programmes in Kenya whereby selection for CBD resistance generates populations that
are also highly resistant to CLR. CLR infection on HDT derivatives is characterised by
occurrence of small to medium size yellow spots with low sporulation and it occurs particularly
on plants of poor nutritional status, overbearing plants or senescing leaves (Gichuru, 2005). It is
also of interest to note that most accessions selected for resistance or tolerance to CBD (such as
Rume Sudan, K7, Catimor and accessions of HDT) exhibit similar reactions to CLR, at least
under Kenyan conditions. This would indicate some genetic linkage of the two traits. Seedlings
with CLR infection were therefore included in the mapping studies in order to observe any
similarity in their genotypes that may indicate potential candidate markers for CLR resistance.
In conclusion, the inoculation of seedlings of F2 populations at an age of one year facilitated their
screening for CBD at a relatively early stage with a degree of success that was considered
sufficient for identification and mapping of DNA markers o f the resistance. This method also
allowed DNA to be obtained from both susceptible and resistant individuals especially by
sampling leaves before inoculation tests. Seedlings of the two F2 populations that were screened
by hypocotyls inoculation method and identified to be highly resistant were preserved for use as
confirmatory controls during subsequent molecular studies. It was anticipated that there would
115

be a need to confirm the CBD phenotype o f some plants after maturity in the field. To facilitate
this in the event o f low natural infections, effectiveness o f phenotyping by inoculation of
attached green coffee berries was successfully demonstrated.
116

SECTION 5.4 IDENTIFICATION AND MAPPING DNA MARKERS LINKED TO CBD
RESISTANCE AND POSSIBLE CANDIDATE MARKERS FOR CLR
RESISTANCE
5.4.1 INTRODUCTION
This phase o f the studies utilized the results of the previous phases in order to identify the
markers of CBD resistance. The candidate markers analysed in Section 5.1 were tested on the F2
populations that were established in Section 5.2 and screened for CBD resistance in Section 5.3.
There were two possible situations that were expected after identification markers linked to CBD
resistance. One possibility was that such marker(s) could be located on one of the C. canephora
chromosomal fragments already mapped by Ansaldi (2003), in which case there would be no
need for remapping the fragment but rather walking on it to locate the gene. Secondly, it was
possibly that the identified marker(s) might be unmapped since some polymorphic unmapped
bands were observed in Section 5.1. In this case, it would be necessary to map the chromosomal
fragment carrying the gene. In section 5.1, the priority was AFLP due to its versatility to detect
polymorphism but in this section, microsatellites were given first priority due to their relative
ease of use and higher repeatability compared to AFLP (Vos et al., 1995; Rafalski et al., 1996).
However, it was envisaged that due to the low number of microsatellites, AFLP analysis would
be required to refine the region around any identified microsatellite marker(s). There are three
accessions o f HDT i.e. 832/1, 832/2 and 1343 that have been widely used in different breeding
programmes over the world. Previous molecular studies have demonstrated that these materials
are similar as shown in Section 5.1 and also by Lashermes et al. (2000a) and Noir et al. (2003).
It w as therefore of interest to evaluate if this is also true for markers of CBD resistance.
Development of SCAR markers enhances reproducibility of their parent markers such as AFLP
or RAPD (Paran and Michelmore, 1993; Shan et al., 1999). In relation to this aspect, it was an
117

aim within this stage o f study to develop SCAR markers from identified markers for CBD
resistance such as AFLP which are not sequence based, and try to establish any relationship
shared with those which were analysed in Section 5.1, including those based on RAPD markers
of CBD resistance (Agwanda et al., 1997). The SCARs designed from AFLP bands developed in
Section 5.1 may be useful indirectly even if they were not polymorphic. One way would be to
use them as probes in physical mapping or chromosome walking. Monomorphic SCARs can be
used as probes to screen genomic DNA libraries, the positive clones are end sequenced and the
sequences are in turn used to design more SCAR primers that may be polymorphic and validate
the initial sequences. This procedure also helps in saturation o f the map with more markers that
are sequence based and therefore more reproducible. For the SCARs to be useful for such a
purpose, they have to be of single or low copies, and if physical mapping targets a specific trait,
they preferably have to be tightly linked to the trait. After development of a SCAR marker, there
is need to validate it because there could be an error during cloning or duplication in the genome
in some other loci that are not associated with the trait. In this study, it was endeavoured to
assess characteristics o f SCARs located on the chromosomal fragment carrying the resistance
gene as possible starting points for chromosome walking or physical mapping.
5.4.2 OBJECTIVES
The general objective of this phase of study was to identify and characterise markers of CBD
resistance with specific sub-objectives being:-
i. To identify and map DNA markers linked to the gene(s) for CBD resistance and
highlight possible candidate markers for gene(s) resistance to CLR.
ii. To develop SCAR markers from AFLP markers and/or establish relationship with
SCARs already developed
118

iii. To assess the repetitive characteristics of SCARs developed from AFLP bands in C.
arabica genome
iv. To assess the prevalence of any identified markers in germplasm bred from different
accessions o f HDT
5.4.3 MATERIALS AND METHODS
5.4.3.1 Plant materials and DNA extraction.
Plants from two F2 populations D and E used for this study were established, sampled and
screened for CBD resistance as in Sections 5.2 and 5.3, while DNA was extracted from their
leaves as described in Section 5.1.
5.4.3.2 Identification of molecular markers of CBD resistance
5.4.3.2.1 Identification of microsatellite markers of CBD resistance
The methodology for microsatellite analysis is described in section 5.2. A total o f fifty-seven
(57) microsatellites including those tested in Section 5.2 (Sat 11. Sat 32 and Sat 207 that are
markers of C. canephora chromosomal fragments T3, T1 and T2 respectively) were screened for
polymorphism. Twenty seven o f these microsatellites had not been tested by Ansaldi (2003).
Fifteen plants were used for the initial screening which included five plants from each of the two
F2 populations (D and E), one accession each of cvs Catimor line 88, Catimor line 127,
Sarchimor line T5296, SL28 and Caturra. Out of these, seven microsatellites had common alleles
in HDT derivatives that were also polymorphic in the F2 populations. These microsatellites were
selected for further analysis as priority candidate markers for CBD resistance. In order to assess
the segregation behaviour of the markers in population E that was chosen for mapping, the seven
microsatellites were amplified in 95 Group 2 plants (which were not inoculated at hypocotyls
stage). These plants consisted of 47 resistant plants, 18 susceptible plants and 30 plants in Class
119

3. For further verification of linkage to CBD resistance, the microsatellites were also amplified
in fifty-six (56) Group 1 plants comprising of 29 and 27 individuals from populations D and E
respectively. Microsatellites that appeared to be linked to CBD resistance were tested for
segregation fitness by Chi square tests (Steel and Torrie, 1981). Eight Group 2 plants from
population D that were observed to be infected by CLR in the nursery were also included to
highlight possible markers for CLR resistance. These CLR susceptible plants ranged from Class
3 to 4 in CBD resistance as screened by young seedlings inoculation method. In addition, 18
randomly selected Group 2 plants from population D, which had their DNA extracted for tests of
segregation in section 5.2, were amplified with Sat 11 and Sat 207 to highlight the segregation
pattern in this population, and compare it with that of population E.
S.4.3.2.2 AFLP analysis of the chromosomal fragment conferring resistance to CBD
The plants analysed with microsatellites were also amplified with a T4 marker (AFLP-17) to
reveal the segregation pattern of this fragment and if it was related to CBD resistance. From the
results and those of the tests with microsatellites above, a fragment linked to CBD resistance was
identified and AFLP markers mapped on this fragment (T2) were selected for further
confirmation and refining the location of the gene. In this endeavour, all Group 1 plants (resistant
by hypocotyls inoculation method) that were analysed by the microsatellites were further
analysed with the AFLP primer pair EACT-MCTT that amplifies two markers of the T2
fragment (AFLP-21 and AFLP-22) and one marker of T3 fragment (AFLP-23) (Ansaldi, 2003,
Appendix 2). Based on the combined results of this test and those of microsatellites, 30 plants
w ere chosen for further analysis with more AFLP markers of the T2 fragment for recombinations
and assessment for possible linkage to CLR resistance. The selected plants consisted of: 3
resistant Group 2 plants which were homozygous for the HDT derived allele o f Sat 207, 4
resistant plants from both Groups 1 and 2 that were heterozygous for Sat 207, 7 resistant plants
120
from both Groups 1 and 2 that lacked the HDT allele o f Sat 207, 5 CBD susceptible plants and
11 plants which had some CLR infection (from both populations D and E). The CLR susceptible
plants were either in classes 3 or 4 for CBD reaction by young seedlings inoculation method.
These plants were analysed for AFLP markers of the T2 fragment spanning Sat 207 i.e. AFLP-
32, AFLP-28 (on one side of Sat 207), AFLP-22, AFLP-27, AFLP-33, AFLP-34. and AFLP-36
(on the other side) and mapped in that respective order (Ansaldi. 2003, Appendix 2). Due to lack
of recombinants on one side of Sat 207 in the above selection o f plants, all remaining Group 1
plants that were heterozygous for this marker (20 plants) and 10 heterozygous resistant Group 2
plants were analysed for three AFLP markers (AFLP-33, AFLP-34 and AFLP-36). This was
done with an aim o f revealing the limits o f the location of the resistance gene of this side.
5.4.3.2.3 Mapping Sat 235.
From the analysis o f microsatellites in Section 5.4.3.2.1, it was observed that one of the un
mapped microsatellites (Sat 235) co-segregated with Sat 207 and was linked to CBD resistance.
To facilitate mapping o f this marker, it was amplified on the samples used by Ansaldi (2003) to
map the introgressed C. canephora fragments and then mapped using Mapmaker programme
Version 3.0b. An initial LOD score of 5.0 was used to ascertain linkage of markers and mapping
was done at an LOD value of 3.0. This marker was also analysed for polymorphism in the DH
population with an objective o f identifying an associated linkage group corresponding to the
basic coffee genome. In these mapping experiments, Sat 262 was also included because out of
the priority candidate markers it was the only one that was not tested by Ansaldi (2003).
121

The SCARs developed from AFLP markers of the introgressed C. canephora fragment T2 in
section 5.1 were amplified on a set of six CBD resistant and four CBD susceptible plants.
Primers N2-1R, N2-2R and W3 were amplified at an annealing temperature of 55 °C and AA4 at
60 °C, which were their theoretical optimum annealing temperatures. All other conditions were
as in section 5.1. SCAR AA4 revealed intensity in 2% agarose that appeared to be differential
between resistant and susceptible samples. Further tests were then done to determine if the
difference in intensity was due to temperature dependent efficiency of amplification or was due
to amplification of multiple products in resistant plants that were not separated in agarose gel.
This was investigated by amplifying the SCAR at annealing temperatures of 55 °C, 62 °C and 64
°C and separated in agarose, and then at 60 °C followed by separation in 6% denaturing poly
acrylamide gel as described in Section 5.1.
The multiplicity characteristics o f three SCARs (A2, W3 and AA4) that were derived from
AFLP markers of T2 fragment were investigated in a BAC library for C. arabica genome. The
SCARs were used to hybridize high-density membranes containing DNA from the BAC library
constructed by Noir et al. (2004). SCAR N2 was not used because the results of Section 5.1 had
demonstrated that it is a repeated sequence but A2 was analysed because although it did not
amplify specific products, it could be a single copy but the primers were poorly designed. Probes
of SCAR DNA were produced by amplification o f thawed stock cloning bacterial cultures
(prepared in Section 5.1) using universal primers of the cloning vector. The PCR mixtures and
conditions were as presented in Section 5.1 for testing positive clones. Then the DNA quality
was assessed in 2% agarose gel and its quantity estimated by comparing with lambda standards.
5.4.3.3 Analysis of SCARs derived from AFLP markers of the chromosomal fragment
conferring resistance to CBD
122
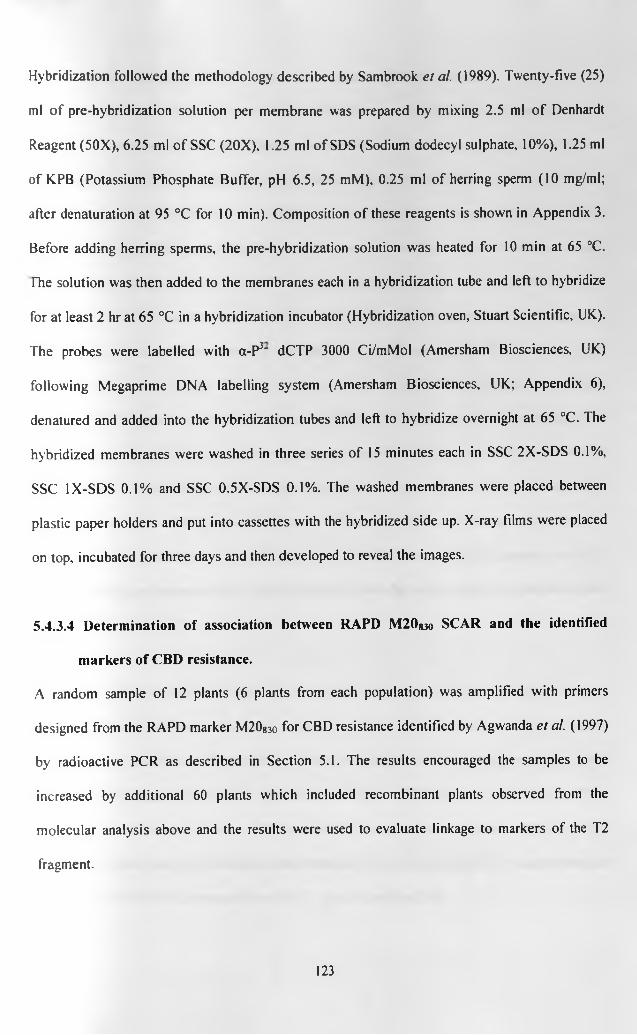
Hybridization followed the methodology described by Sambrook el al. (1989). Twenty-five (25)
ml o f pre-hybridization solution per membrane was prepared by mixing 2.5 ml o f Denhardt
Reagent (50X), 6.25 ml o f SSC (20X), 1.25 ml of SDS (Sodium dodecyl sulphate, 10%), 1.25 ml
of KPB (Potassium Phosphate Buffer, pH 6.5, 25 mM), 0.25 ml of herring sperm (10 mg/ml;
after denaturation at 95 °C for 10 min). Composition of these reagents is shown in Appendix 3.
Before adding herring sperms, the pre-hybridization solution was heated for 10 min at 65 °C.
rhe solution was then added to the membranes each in a hybridization tube and left to hybridize
for at least 2 hr at 65 °C in a hybridization incubator (Hybridization oven, Stuart Scientific, UK).
The probes were labelled with a-P3' dCTP 3000 Ci/mMol (Amersham Biosciences, UK)
following Megaprime DNA labelling system (Amersham Biosciences, UK; Appendix 6),
denatured and added into the hybridization tubes and left to hybridize overnight at 65 °C. The
hybridized membranes were washed in three series of 15 minutes each in SSC 2X-SDS 0.1%,
SSC 1X-SDS 0.1% and SSC 0.5X-SDS 0.1%. The washed membranes were placed between
plastic paper holders and put into cassettes with the hybridized side up. X-ray films were placed
on top, incubated for three days and then developed to reveal the images.
5.4.3.4 Determination of association between RAPD M20g3o SCAR and the identified
markers of CBD resistance.
A random sample of 12 plants (6 plants from each population) was amplified with primers
designed from the RAPD marker M2083o for CBD resistance identified by Agwanda et al. (1997)
by radioactive PCR as described in Section 5.1. The results encouraged the samples to be
increased by additional 60 plants which included recombinant plants observed from the
molecular analysis above and the results were used to evaluate linkage to markers of the T2
fragment.
123
Seeds were obtained from twenty-one (21) individual trees o f advanced progenies of crosses
between C. arabica cultivars and Hibrido de Timor derivatives in a germplasm collection
maintained at Cicafd (Costa Rica) and one Catimor line (129) from Kenya (Table 9). These
materials have been bred using three different accessions o f the original Hibrido de Timor
collections (832/1, 832/2 and 1343). Due to limited seed availability and germination percentage,
only 10 to 25 seedlings were available for inoculation. Seedlings were screened for CBD
resistance at C1RAD (Montpellier, France) by dipping into a spore suspension of a pathogenic C.
kahawae isolate from Cameroon at a strength of 2 x 10⁶ conidia/ml. The seedlings were
incubated in moist boxes at 20 °C and symptoms were scored after 14 days on a 0-5 scale. Class
0 had no visible symptoms of infection and the lesions enlarged progressively up to class 5, in
which the top halves o f the hypocotyls were dead. Classes 0 to 3 were considered resistant while
classes 4 and 5 were susceptible. A mean infection score was calculated from the inoculated
seedlings and used to classify the accessions as resistant (mean score < 2), moderately resistant
(mean score of 3), moderately susceptible (mean score of 4) and susceptible (mean score of 5).
Genomic DNA was extracted from lyophilized leaves from the mother plants and amplified with
Sat 11, Sat 207 and Sat 235.
In addition, DNA was extracted from four accessions of Hibrido de Timor with field resistance
to CBD in Kenya and included in these studies. A search was also made in young F2 plants of
crosses between HDT and either SL28 or K7 that are established in field, but are not yet in full
bearing, for plants infected by CLR. Three plants of HDT x SL28 cross and one plant of HDT x
K7 cross were obtained. A tree of cv Catimor which was observed to be infected by some CLR
and CBD in some years in the field was also included. DNA was extracted from these plants and
amplified with the three microsatellites (Sat 11, Sat 207 and Sat 235).
5.4.3.5 Survey of markers of CBD resistance in various HDT derivatives
124
5.4.4 RESULTS
5.4.4.1 Analysis of microsatcllites
A total of fifty seven (57) microsatellites were screened in fifteen individuals which included
five each from the two F2 populations (D and E), accessions of cvs Catimor line 88, Catimor line
127, Sarchimor line T5296, SL28 and Caturra. Twenty-three of these microsatellites were
variously polymorphic either within or between lineages/accessions while the rest were
monomorphic. There was also differential polymorphism between the two F2 populations such
that one and three microsatellites were polymorphic only in populations D and E respectively.
The most probable candidate marker alleles for CBD resistance were expected to be common in
all the Hibrido de Timor derivatives, absent in cvs SL28 and Caturra but polymorphic in both F2
populations. Seven microsatellites (Sat 11, Sat 41. Sat 162, Sat 172, Sat 207, Sat 235 and Sat
262) satisfied this criterion and were chosen for analysis in the F2 populations. The
microsatellites were analysed in 95 Group 2 plants from population E, fifty-six (56) plants from
Group 1 (29 and 27 plants from populations D and E respectively), eight (8) Group 2 plants from
population D observed to be infected by CLR in the nursery and (18) Group 2 plants from
population D.
During the experiments with enlarged F2 samples, some microsatellites (e.g. Sat 11; Plate 12)
displayed a pattern that was slightly different from the pattern observed during tests for pre
selection and verification o f segregation in the F2 populations (Section 5.2; Plate 8). However the
interpretation of genotypes in the various tests was the same, even by comparing amplification of
the same samples but of different DNA extractions. Sometimes one allele was observed in the
middle band of this microsatellite (Sat 11) in heterozygous plants, but it was evident from
homozygous plants that the introgressed allele was slightly bigger (Plant 12 A). Sat 172 also
displayed uniform intensity of all its four bands during the pre-selection tests while in the large
125

sample analysis, the intensity of the two bigger bands was weak (Plate 12 B). It also seems that
there could have been size differences in the middle alleles (arrowed) but they could not be
reliably separated and scored in different experiments and were therefore scored as one allele.
An alternative explanation would be presence of “slippage" products, which may explain the
lowest band in the sample marked with an asterix (*) (Plate 12 A). Some other microsatellites
(e.g. Sat 41) had ‘slippage' products that co-migrated with the lower bands and were fairly
strong in some cases where the larger allele was homozygous (Plate 12 C). In heterozygous
situations, the top band was weaker but it was always scored as present because there was no
evidence o f ‘slippage' products that were bigger than the main (parent) bands. A unique allele of
Sat 41 was observed in one and three seedlings of populations D and E respectively and these
plants were concluded to be off-types and excluded in analysis.
126

I I
C (Sat 41)
Plate 12. Autoradiographs of three selected microsatellites analysed in an F2 population of a cross between cvs Catimor (line 88) and SL28 (Population E) demonstrating analytical experiences.
Notes(A) Sat 11 showing a pattern that is different from that in Plate 7. Comparison of
homozygous samples (arrowed) reveals that the bands at the middle o f the pattern are slightly different in size: the sample on the left is homozygous un-introgressed while the one on the right is homozygous introgressed,
(B) Two radiographs from different experiments with Sat 172 (i and ii) showing products which appeared to be polymorphic alleles (arrowed)
(C) A pattern of Sat 41 showing ‘slippage' products that were smaller than their “parental" bands: (1) heterozygous samples; (2) homozygous samples for the bigger allele and (3) homozygous samples for the smaller allele
127

Six of the microsatellites displayed segregation patterns conforming to Mendelian inheritance
while one (Sat 11) was distorted in favour o f the presence of the allele that is introgressed from
C. canephora (Table 6). Introgressed alleles of Sat 11, Sat 207 (which are mapped onto the
introgressed C. canephora fragments T3 and T2 respectively) and Sat 235 were observed to be
highly present in resistant plants (Tables 6 and 7). In the general population E plants (total of
Group 2 plants), Sat 11 had observed values of 35:49:9 (T3/T3:T3/0:0/0) which significantly
deviated from a 1:2:1 ratio in favour of the introgressed allele (x2=14.806; p=0.00I). In the same
population. Sat 207 had observed values of 21:48:26 (T2/T2:T2/0:0/0) that fitted the ratio of
1:2:1 that is expected by Mendelian segregation (x2=0.537; p=0.764). It was apparent that the Sat
207 allele which is a marker of the introgressed C. canephora fragment T2 was linked to CBD
resistance by its higher presence in resistant plants and higher absence in susceptible plants
compared to the general population. The distribution of Sat 11 was not affected by the phenotype
of reaction to infection by C. kahawae and it displayed the distorted pattern in all sub
populations. The distribution of this microsatellite in the random sample of population D was not
clear possibly due to the small sample size. It was evident from the results that Sat 235 which
was un-mapped co-segregated with Sat 207 and was linked to CBD resistance (Table 7, Plate
13).
B-------------- 4,--- 3--- ► I
Plate 13. An example of the pattern of Sat 235 in F2 plants (cv Catimor x cv SL28) that were resistant (R) and susceptible (S) to infection by C. kahawae.
128

Table 6. Summary o f the occurrence o f two microsatellite markers of two C. canephora chromosomal fragments [T2 (A) and T3 (B)] that are introgressed into C. arabica, as analysed in two F2 populations between cv SL28 and two lines of cv Catimor i.e. line 127 (Population D) and line 88 (Population E).
(A) Sat 207 (marker for the introgressed C. canephora chromosomal fragment T2)
Population EMolecular genotype
CBDphenotype T2/T2 T2/0 0/0 Total
Group 1 Resistant Observed 10 15 2 27Expected 6.75 13.5 6.75
Group 2 Resistant Observed 13 29 5 47Expected 11.75 23 11.75
Susceptible Observed 0 5 13 18Expected 4.5 9 4.5
Others Observed 8 14 8 30Expected 7.5 15 7.5
TOTAL Observed 21 48 26 95Expected 23.75 47.5 23.75
Population DGroup 2 Resistant Observed 14 13 1 28
Expected 7 14 7Random Observed 6 8 4 18
Expected 4.5 9 4.5
(B) Sat 11 (marker for the introgressed C. canephora chromosomal fragment T3)
Population E Molecular genotypeCBDphenotype T3/T3 T3/0 0/0 Total
Group 1 Resistant Observed 8 14 5 27Expected 6.75 13.5 6.75
Group 2 Resistant Observed 14 27 5 46Expected 11.5 23 11.5
Susceptible Observed 8 9 1 18Expected 4.5 9 4.5
Others Observed 13 13 3 29Expected 7.25 14.5 7.25
TOTAL Observed 35 49 9 93Expected 23.25 46.5 23.25
Population DGroup 1 Resistant Observed 9 19 1 29
Expected 7.25 14.5 7.25Group 2 Random Observed 4 11 3 18
Expected 4.5 10 4.5
Note: Some discrepancy in the entries o f the total number o f samples between the two markers was due to failed amplification o f some samples in the different PCRs.
129

Table 7. Percent incidence of markers o f three C. canephora chromosomal fragments (T2, T3 and T4) in two F2 populations (Catimor x SL28) screened by inoculation o f seedling hypocotyls with C. kahawae (Group 1) and in a general sub-population (Group 2)
C. canephora c h ro m o so m a l fra g m e n ts in tro g re sse d in to C. arabica
M ark ers o f T 2 M arkers o f T3 M arkero fT 4
N u m b e ro fse e d lin g s
C B DR eac tio n
S at20 7
A F L P-22 a f l p -33 and34
A F L P -3 6
Sat235
S at 11 A F L P -23
A F L P -17
Pop 1 G ro u p1
29 R esis tan t 9 6 .4 3 100 00 96.55 9 6 55 100.00 96 .56 9 3 .6 7 72.67
P op 2 G ro u p1
27 R e sis tan t 9 2 .6 0 100.00 100.00 9 6 .3 0 100.00 81.48 8 3 .3 0 69.85
G ro u p2*
95 A llp h en o ty p es
7 2 .6 3 nt nt n t 73.91 90.32 n t 70.23
NotesPop 1: - Population 1 derived from cv Catimor line 127 x cv SL28 Pop 2: - Population 1 derived from cv Catimor line 88 x cv SL28 * This figure includes seedlings in the intermediate phenotype class (Class 3) and
those which were not classified due to low vigour or mechanical damage nt not testedT2 markers Sat 207, AFLP-22, AFLP-33, AFLP-34 and AFLP-36 are arranged in their mapped order by Ansaldi (2003) (Appendix 2)
S.4.4.2 Analysis of AFLPsAll the plants which were analysed by microsatellites above were also analysed with an AFLP
primer combination EAAG x MCGT which amplifies a marker o f the T4 fragment (AFLP-17) to
evaluate if this fragment was related to CBD resistance. This marker was observed to be present
in 70.23% of the Group 2 plants suggesting random Mendelian inheritance and did not appear to
be affected by CBD phenotype (Table 7). The fragment (T4) was therefore concluded to be
unlinked to CBD resistance. This fragment was however conspicuously absent in all plants that
had some CLR infection (Table 8). No other polymorphic bands amplified by this AFLP primer
combination co-segregated with CBD resistance.
130

All Group 1 plants (56 plants) were analysed with the AFLP primer combination EACT x
MCTT, which amplifies two T2 markers (AFLP-21 and AFLP-22). and one T3 marker (AFLP-
23). AFLP-21 was not clear in many samples and was therefore not considered. It was observed
that all the samples had AFLP-22 marker even in samples without the introgressed Sat 207 allele
(Table 7), while the T3 marker (AFLP-23) displayed the same pattern as the Sat 11 allele.
Furthermore, these results demonstrated that the resistant plants of Group 1 that lacked the
introgressed allele o f Sat 207 were recombinant on one side o f this marker. Further analysis of
the T2 fragment was done on a selection of 30 plants with AFLP markers that are mapped on
both sides o f Sat 207. All the resistant plants had T2 markers on one side o f Sat 207, except one
plant (E l02) that did not have any T2 markers on both sides of Sat 207, and was therefore
considered as misclassified by young seedlings inoculation method (Group 2) (Table 8, Plate
14). Conversely, two plants of the susceptible samples (from Group 2 of population E), had T2
markers and were considered misclassified. One Group 2 plant from population D (D84) had T2
markers on one side o f Sat 207 similar to resistant plants and was also considered most likely to
be resistant though it was classified in Class 3 (intermediate category).
There were no recombinants observed in this set of plants on the side of the fragment carrying
the resistance gene relative to Sat 207. This necessitated analysis of additional thirty (30)
resistant plants that were heterozygous for Sat 207 (20 from Group 1 plants of both populations
and 10 plants from Group 2 plants of population E) with three AFLP markers (AFLP-33, AFLP-
34 and AFLP-36) which revealed three (3) recombinant plants. Two of these recombinant plants
were resistant by hypocotyls method (Group 1), one of which lacked the three markers while the
other lacked only AFLP-36. The other recombinant plant belonged to Group 2 and lacked all the
markers and this confirmed earlier results that since it had been observed to lack AFLP-22. This
result showed that the resistance gene is certainly not beyond AFLP-33 and
131

Table 8. Ordered AELP markers and a microsatellite (Sat 207) of the C. canephora chromosomal fragment (T2) and one marker each for fragments T3 and T4.introgressed into C. arabica analysed on selected F2 plants obtained from crossings of cv Catimor lines 88 and 127 to cv SL28 (Populations E and D)
CMIII
min E11 CO00
III E132
E135
E144
m E12
E90
E10
2
E150
E151
D11
3
E41
E50
E84
E11
1
E12
2
E39 i n CD
r - r - LU LU E1
03 h-CMO
r-s
5 COh-
CBD reaction R R R R R* R* R?* R R R R R* R* R* S S S s S S? s? s R s s s s s? s? s?Class 0 0 1 2 2 0 3 1 1 1 0 2 1 2 4 4 4 4 4 3 4? 4 0 4 4 4 4 3 3 3
AFLP-32 1 1 1 ? 1 1 1 0 0 0 0 0 ? 0 0 0 0 0 1 0? 0 1 0? 0 0 0 1? ? 0 0AFLP-28 1 1 1 1 1 1 1 0 1? 0 0 0 1? 0 0 0 0 0 1 1 0 1 1 0 0 0 1 1 0 0
Sat 207(T2) 1 1 1 1 1 1 1 0 0 0 0 0 0 0 0 1 0 0 1 0 1 1 1 0 1 0 0 1 1 0AFLP-22 1 1 1 0? 1 1 1 1 1 1 0 1 1 1 0 0? 0 0 1 0 0 1 1 0 0 0 0 0 1 0AFLP-38 1 1 1 ? 1 1 1 1 1 1 0 1 1 1 0 0 1 ? 1 0 1? 1? 1 ? 0? ? 1? 0? 1? 0AFLP-27 1 1 1 1 1 1 1 1 1 1 0 1 1 1 0? 0 0 0 1 0 0 1 0 0 0 0 0 0 0 0AFLP-33 1 1 1 1 1 1 1 1 1 1 0 1 1 1 0 0 0 0 1 0 0 1 1 0 0 0 0 0 1 0AFLP-34 1 1 1 1 1 1 1 1 1 1 0 1 1 1 0 0 0 0 1 0 0 1 1 0 0 0 0 0 1 0AFLP-36 ? 1 ? 1 1 1 1 1 1? 1 0 1 1 1? 0 0 0 0 1 0 0 1 1 0 0 0 0 0 1 0
Sat 11 (T3) 1 1 1 1 1 1 1 1 1 1 0 1 1 1 1 1 1 1 1 1 1 1 0 1 0 1 0 0 1 1A F L P - 1 7 (T4) 0 0 1? 0 1 0 1 1 ? 1 0 0 1 0 1 1 1 0 1 0 0 0 0 0 0 0 0 0 0 0
Notesi. * Seedlings of Group I and were classified by the hypocotyls inoculation test as resistant, however the disease classification shown in the table
is that of young seedlings inoculation method.ii. Microsatellite data is inform of presence (1) or absence (0) of the introgressed allele and not homo- or heterozygous.
iii. The letter in front of the plant number refers to the populations D (Catimor 127 x SL28) and E (Catimor 88 x SL28).iv. The shaded samples were observed to have some CLR infection in the nursery.v. The plants in bold were considered as misclassified for CBD resistance.vi. ? indicates that the score or classification was not clear/certain
132

Plate 14. Autoradiograph of AFLP amplification products o f selected F2 plants derived from crossing cvs Catimor and SL28, that are resistant and susceptible to infection by C. kahawae respectively. Some recombinant resistant plants (R) with AFLP-27 but without AFLP-28 are visible, and vice-versa for one susceptible plant (S). The arrowed plants were misfits that were considered as misclassified by the young seedlings inoculation method.
possibly not beyond AFLP-22, but since this was observed in only one Group 2 plant it could not
be taken as confirmatory.
5.4.4.3 Mapping and analysis of Sat 235 data
Sat 235 was mapped by amplification on the same DNA samples that were used by Ansaldi
(2003) and analysing the data against the data that she generated. Mapping was done using
MapMaker programme Version 3.0b with a LOD score o f 5.0 to identify linked markers.
Polymorphic AFLP bands were named by the three selective nucleotides o f the primer
combinations (£coRI followed by Mse 1) and a letter in increasing order from the largest band
except two bands that were named by numbers because they were observed as additional
polymorphic bands during mapping and were not observed when screening parents. Sat 235
133

mapped onto the T2 fragment (Figure 6). Its position agreed with the results earlier observed
using the other mapped markers above. It was interestingly observed that Sat 262 mapped in the
same position as Sat 172 of Ansaldi (2003). On comparison with population E seedlings
screened only by the young seedlings inoculation method (Group 2), four (4) resistant plants had
the Sat 207 allele but not the Sat 235 allele, one (1) susceptible plant without the Sat 207 allele
had the Sat 235 allele and six (6) recombinant plants were observed in the Class 3 category. By
considering resistant plants lacking both markers as misclassified, two plants (including the one
reported earlier in Section 5.4.4.2) were identified as misclassified into resistant group. By
applying the converse argument to the susceptible plants, four plants were considered as
misclassified including the two plants reported in Section 5.4.4.2. By applying these results to
those of Sat 207 in Table 5, it was deduced that out of the resistant plants in Group 2 lacking the
introgressed allele o f Sat 207, two were misclassified while the other three were recombinant.
Similarly, of the five susceptible plants with Sat 207 allele, four were misclassified while one
(E50) unexpectedly amplified with this allele yet it did not have the flanking AFLP markers
(Table 8). This plant was further tested using the same DNA solution to amplify both Sat 207
and Sat 235. Even then, the results showed presence of the introgressed allele of Sat 207 but not
the introgressed allele of Sat 235. Double recombination on both of Sat 207 was considered to be
the possible explanation.
The percentages o f the two markers in the resistant and susceptible plants screened by the young
seedlings inoculation method (Group 2) were then recalculated excluding the misclassified plants
and the corrected results are shown in Table 9. The resistant plants i.e. Group I plants from both
Populations and resistant plants of Group 2 from Population 2 (after correction for
misclassifications), were compared by genotype ratios of homozygous introgressed:
heterozygous: homozygous non-introgressed in regard to Sat 235, and the observed values were
134
17:12:0, 11:16:0 and 15:26:2 respectively. There was therefore no pronounced favour for the
homozygous introgressed genotypes compared to the heterozygous ones especially in Group 2
plants.
T 2
23.7— 1
11,1 —
9,0
Sat 172, Sat262
ACT-CTG-a (AFLP-32)
ACC-CAA-f (AFLP-28)
Sat207
SU235ACT-CTMi (AFLP-22)AAC-CTG-a(AFLP-38)ACC-CAA-e (AFLP-27)ACT-CTT-f (AFLP-21). ACT-AAC-b (AFLP-16)a c t -c a a < (a f l p -30)AGC-CTG-c (AFLP33)AGC-CTG-d (AFLP-34)CAC-CTA-l(AFLP-93). ACG-CAT-a (AFLP-36)
CTA-ACA-1 (AFLP-10)
Figure 6. Genetic linkage map o f the C. canephora chromosomal fragment T2 introgressed into C. arabica genome.
Notes: The identities of AFLP markers as named in the map by Ansaldi (2003) are shown in brackets. The values on the left are the distances between the markers in cM. The larger rectangle on the left shown the established limits of the location of the Ck- 1 locus while the smaller one show the speculated limits (10.6 cM) but further phenotypic confirmation o f the indicator plants is required.
135

Table 9. Percent occurrence of two introgressed microsatellite marker alleles for CBD resistance in seedlings screened by young seedlings inoculation method (Group 2). The data is presented before and after correction by exclusion (not transfer) of seedlings which were considered as misclassified. The corrected values are in parenthesis.
CBD Phenotype Number of seedlings Sat 207 Sat 235
Resistant 46 (44) 89.36 (93.02) 91.10(95.35)
Susceptible 18(14) 27.78 (7.14) 35.71 (7.14)
5.4.4.4 Analysis of SCARs derived from AFLP markers of T2 fragment
The SCARs N2 (first and second primer designs), W3 and AA4 which were developed from
AFLP markers the introgressed C. canephora fragment T2 (Section 5.1) were amplified on a set
of six resistant and four susceptible plants and revealed in 2% agarose gel. There were no
observable differences between the amplification products of SCARs N2-1R and N2-2R and W3.
No further investigations were therefore deemed to be necessary in addition to what was done
before in Section 5.1. The amplification products of SCAR AA4 appeared to be more intense in
samples with the parent AFLP marker (AGC-CTG-c/AFLP-33) than in samples without this
marker including one recombinant resistant plant that lacked this marker (Plate 15 A), although
one plant with the marker also displayed weak amplification. Further tests at different annealing
temperatures and electrophoresis in denaturing poly-acrylamide gel were done to confirm if the
difference was due to primer mismatch which can be exploited by altering the annealing
temperature or due to multiple products in plants with the parent marker. Reduction of the
annealing temperature to 55 °C resulted into PCR products that did not appear to have
differences between the two categories o f samples (Plate 15 B). At an annealing temperature of
62 °C, only samples with the parent AFLP marker were amplified (Plate 15 C), while at higher
136

temperature of 64 °C, the intensity decreased and one sample, which had low intensity at 60 °C,
did not amplify (Plate 15 D).
When the products were amplified with a radioactive nucleotide and separated in denaturing
poly-acrylamide gel, only one band was observed and there was no visual evidence of
differential intensity as observed in agarose under the same amplification conditions (Plate 15
E). The marker was designated AGC-CTG-c-aa4 in regard to its parental AFLP marker (AGC-
CTG-c) and the code AA4 of the clone culture used in primer design. To test its reliability, it was
amplified in all the samples amplified with Sat 207 and Sat 235, and electrophoresed in 2%
agarose. By comparison with position o f the parent AFLP marker (AGC-CTG-c) relative to Sat
235, the SCAR amplified as expected except in four plants that were assumed to be recombinant.
TTiree o f these plants had the SCAR but lacked the introgressed Sat 235 allele, while one plant
lacked the SCAR but had the introgressed Sat 235 allele.
The multiplicity characteristic o f three SCARs (A2, W3 and AA4) derived from three AFLP
markers of T2 fragment were investigated by using them as probes to hybridize high-density
membranes containing BAC DNA from C. arabica. The results are presented in Plate 16. The
SCAR AA4 hybridized to seven (7) clones only. W3 hybridized more strongly to 27 clones and
weakly to 33 clones while A2 hybridized uncountable colonies showing that it matches very
many sequences in the C. arabica genome.
137

AGC-CTG-c +______| AGC-CTG-c - j | AGC-CTG-c + AGC-CTG-c -
a r . r r -t c l _ “ a a i/ - m n . <- -t- A C ii- '.r 'T f 'i-r -
E A radiograph (60°C)
Plate 15. Different PCR products of AGC-CTG-c-aa4 SCAR at different annealing temperatures exhibiting temperature dependent polymorphism between plants with the parent AFLP marker (AGC-CTG-c +) and those without the marker (AGC-CTG-c -) in 2% agarose (A, B, C and D). Plate E shows the PCR products of the same samples amplified with radioactive labelling at 60 °C and separated in denaturing polyacrylamide gel.
138
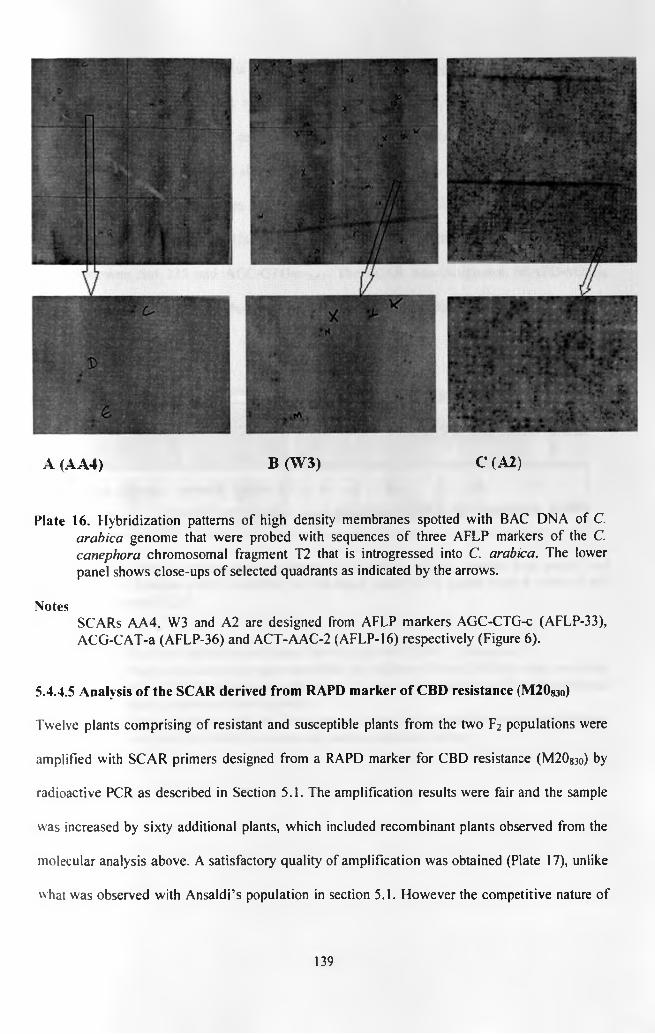
A (A A 4 ) B (W3) C ( A 2 )
Plate 16. Hybridization patterns of high density membranes spotted with BAC DNA of C. arabica genome that were probed with sequences of three AFLP markers of the C. canephora chromosomal fragment T2 that is introgressed into C. arabica. The lower panel shows close-ups o f selected quadrants as indicated by the arrows.
NotesSCARs AA4. W3 and A2 are designed from AFLP markers AGC-CTG-c (AFLP-33), ACG-CAT-a (AFLP-36) and ACT-AAC-2 (AFLP-16) respectively (Figure 6).
5.4.4.5 Analysis of the SCAR derived from RAPD marker of CBD resistance (M20g3o)
Twelve plants comprising of resistant and susceptible plants from the two F2 populations were
amplified with SCAR primers designed from a RAPD marker for CBD resistance (M20g30) by
radioactive PCR as described in Section 5.1. The amplification results were fair and the sample
was increased by sixty additional plants, which included recombinant plants observed from the
molecular analysis above. A satisfactory quality of amplification was obtained (Plate 17), unlike
what was observed with Ansaldi’s population in section 5.1. However the competitive nature of
139
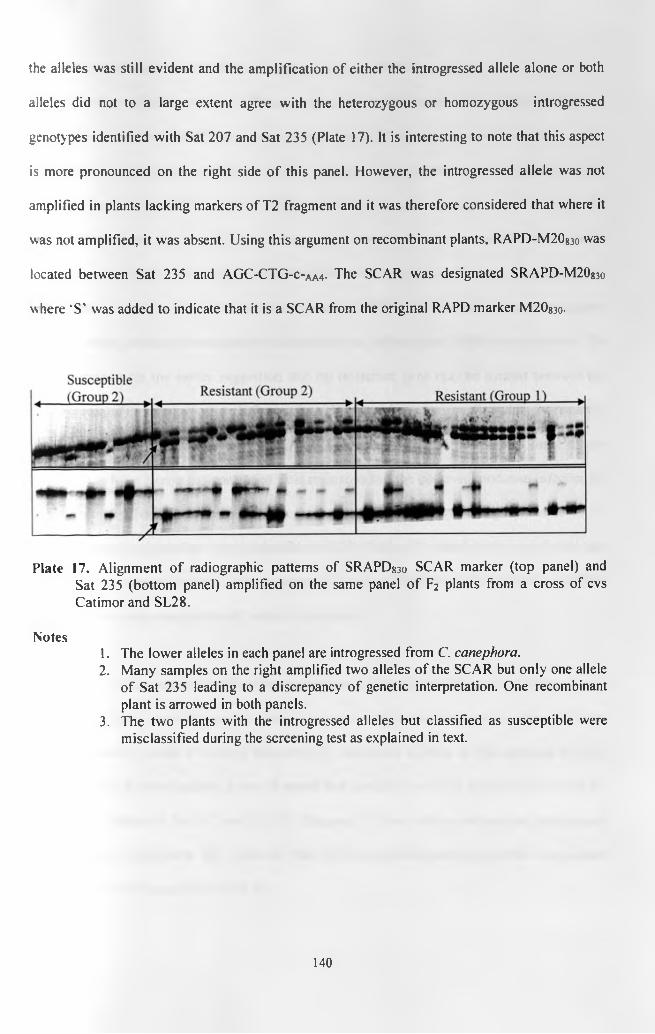
the alleles was still evident and the amplification of either the introgressed allele alone or both
alleles did not to a large extent agree with the heterozygous or homozygous introgressed
genotypes identified with Sat 207 and Sat 235 (Plate 17). It is interesting to note that this aspect
is more pronounced on the right side o f this panel. However, the introgressed allele was not
amplified in plants lacking markers of T2 fragment and it was therefore considered that where it
was not amplified, it was absent. Using this argument on recombinant plants, RAPD-M20g3o was
located between Sat 235 and AGC-CTG-c-Aa4- The SCAR was designated SRAPD-M20g3o
where ‘S' was added to indicate that it is a SCAR from the original RAPD marker M20g3o.
SusceptibleResistant (Group 2) Resistant (Group I)(Group 2)
Plate 17. Alignment of radiographic patterns of SRAPDg3o SCAR marker (top panel) and Sat 235 (bottom panel) amplified on the same panel o f F2 plants from a cross of cvs Catimor and SL28.
Notes1. The lower alleles in each panel are introgressed from C. canephora.2. Many samples on the right amplified two alleles of the SCAR but only one allele
of Sat 235 leading to a discrepancy of genetic interpretation. One recombinant plant is arrowed in both panels.
3. The two plants with the introgressed alleles but classified as susceptible were misclassified during the screening test as explained in text.
140

S.4.4.6 Survey of markers of CBD resistance in diverse HDT derivatives
Twenty-two progenies bred from different accessions of Hibrido de Timor (832/1, 832/2 and
1343) were screened for CBD resistance by inoculation of hypocotyls raised from their seeds.
DNA from the parents was analysed with two markers of CBD resistance (Sat 207 and Sat 235)
and Sat 11 that is a marker of the T3 fragment. It was observed that plants with introgressed
alleles of these two microsatellites in homozygous state were either resistant or moderately
resistant by their mean scores (Table 10). Plants that were recombinant between the two markers
were either resistant or susceptible while two plants (T17940 and T 18131) lacked both markers
but were rather resistant. Heterogeneity o f accessions of cultivars like IAPAR was observed. The
results agreed with the earlier suggestion that the resistance gene may be located between the
two microsatellite markers (Sat 207 and Sat 235) but phenotype confirmation is required,
particularly for the recombinant plants. O f the accessions analysed in this step, only the cv
C’atimor line from Kenya has confirmed field resistance and the observed moderate infection on
it demonstrates the delicateness of this screening method. There was a high presence of T3
fragment even in plants that were susceptible to CBD (Table 10), which further confirmed that
this fragment is not linked to CBD resistance. It was also noticed that the accession of T5296
used in this test was susceptible and lacked the markers.
In addition. DNA was extracted from four accessions of Hibrido de Timor with field resistance
to CBD in Kenya, one Catimor tree which has been noticed to be infected by some CLR and
CBD. and four F2 plants of crosses between HDT and either SL28 or K7 but infected by CLR
were included in these studies. It was observed that the CBD and CLR resistant plants had the
introgressed alleles o f Sat 207 and Sat 235 (fragment T2) but with or without the introgressed
allele of Sat 11 (fragment T3). However, the CLR susceptible plants lacked the introgressed
alleles o f both microsatellites (Table 10).
141

Table 10. Occurrence of introgressed alleles of Sat 207, Sat 235 and Sat 11 in different HDT derivatives screened for CBD resistance by hypocotyls inoculation method or observed in the field for CBD and CLR infection
Accession Cultivar ParentCIFCHDT
Origin CBD 1 Sat2071
Sat235*
Sat 11(T3)
1 IAPAR59-43 Sarchimor 832/2 Brazil MS h h 12 1APAR Sarchimor 832/2 Brazil MS 1 0 13 T5I75 Catimor 832/1 Brazil S 0 0 14 T5296 Sarchimor 832/2 Brazil s 0 0 15 T17926 Catimor 1343 Colombia s 0 0 16 T17930 var Colombia 1343 Colombia R 1 1 17 T17931 var Colombia 1343 Colombia R(?) h 0 18 T17933 Var Colombia 1343 Colombia MR 1 1 19 T17940 Catimor 1343 Colombia MR/MS 0 0 110 T18121 Catimor 832/1 Brazil MS 0 0 111 T18122 Catimor 832/1 Brazil S 0 0 012 T18123 Catimor 832/1 Brazil MS 0 h h13 T18126 Catimor 832/1 Brazil R 0 1 014 T18127 Catimor 832/1 Brazil S 0 0 115 T18130 Catimor 832/1 Brazil MR/MS 1 0 116 T18131 Catimor 832/1 Brazil MR/MS 0 0 117 T18137 Sarchimor 832/2 Brazil S 0 0 018 T18138 Sarchimor 832/2 Brazil S 1 0 019 T18139 Sarchimor 832/2 Brazil MS 0 0 h20 T18140 Sarchimor 832/2 Brazil MR 1 1 121 T18141 Sarchimor 832/2 Brazil MS h h h22 Catimor 129 Catimor 1343 Kenya MR 1 1 123 Caturra Caturra - Costa Rica S 0 0 0i HDT progeny 1349/269 Kenya FR 1 1 0ii HDT progeny 1349/269 Kenya FR 1 1 0iii HDT progeny 1349/269 Kenya FR h h hiv HDT progeny 1349/269 Kenya FR 1 1 ?V Catimor Catimor 1343 Kenya CLR/CBD 0 0 0vi F2HDTxSL28 1349/269 Kenya CLR 0 0 0vii F2 HDT x SL28 1349/269 Kenya CLR 0 0 7
v iii F2 HDT x SL28 1349/269 Kenya CLR 0 0 0ix F2 HDT x K7 1349/269 Kenya CLR 0 0 ?
R: resistant, MR: moderate resistant; MS: moderate susceptible; S: susceptible 1: - homozygous presence o f introgressed allele; h - heterozygous 0 - absence of introgressed allele
HR Field resistant to CBD and CLRCLR/CBD Susceptible to CLR and/or CBD in the field in Kenya
142

5.4.5 DISCUSSION
Different DNA based marker systems were used in this study. Each marker system had different
characteristics related to its repeatability and transferability over time, space and facilities.
Microsatellites and SCARs are rated as some of the best in these attributes (Rafalski et al.,
1996). This however does not mean that they do not exhibit problems in these attributes. For
example there were differences in the pattern of some microsatellites in different experiments
especially in regard to the number and relative intensity of bands (e.g. Sat 11 in Plates 8 and 12).
This could have been due to PCR or electrophoresis conditions or both. However, the genotypic
interpretations were the same despite these differences and the extra bands were interpreted as
"slippage” products or due to differences in resolution. Some microsatellites such as Sat 41
(Plate 12) had ‘slippage’ products that co-migrated with major products. Keen evaluation was
therefore necessary during scoring of data and mistakes in judgement could have caused some
error. Such aspects can create data interpretation problems in the use of microsatellites
(Robinson and Harris, 1999) that can even cause inaccurate conclusions like segregation
behaviour or un-linkage of a marker to a trait. Another problem encountered was the possibility
of'm issed' polymorphism, as might have been the case with Sat 172, in which there appeared to
be two alleles that were poorly separated and one was somewhat faint to be reliably scored (Plate
12). This can potentially lead to loss of some information.
The low genetic diversity of C. arabica was demonstrated by the fact that out o f a total of 57
microsatellites tested; only 23 exhibited any polymorphism at all. Out of these microsatellites,
only seven fitted the expectation of candidate markers of the resistance by having alleles that
were common in the CBD resistant derivatives of HDT and absent in the susceptible evs SL28
and Caturra. From the exploratory experiments with candidate microsatellites linked to CBD
resistance, it was apparent that the introgressed C. canephora allele of Sat 207, that is mapped on
143

fragment T2 (Ansaldi, 2003; Appendix 2), is linked to resistance to CBD (Table 5). This
conclusion was possible after considering all the infection categories of the seedlings after
screening the F2 populations by both the hypocotyls method (Group 1) and young seedlings
method (Group 2). This was because from the resistant groups alone, the introgressed C.
canephora allele o f Sat 11 (fragment T3) also appeared to be equally linked to the resistance.
However in the susceptible seedlings, T2 was markedly absent while T3 was still highly present.
It was also clear that in the intermediate category (Class 3), there was no bias for or against T2
fragment meaning that the presence or absence of this fragment did not determine the appearance
of this class. Furthermore, the total score of the two fragments revealed that while T2 fitted the
expected distribution by Mendelian laws of inheritance, the presence of T3 was higher in the
whole population than would be expected and therefore had segregation distortion. It was not
clear whether this marker was equally distorted in population D because even though the
resistant plants by hypocotyls inoculation method (Group 1) indicated so, the random sample of
eighteen (18) plants did not appear to be distorted, probably due to the small size.
Segregation distortion o f some markers is an often-encountered problem in mapping populations.
This maybe due to selection of gametes, selective fertilization of particular gamete genotypes or
other mechanisms operating during seed development, seed germination or plant growth
(Lashermes el al., 2001; Schneider, 2005). For this particular fragment, Ansaldi (2003) did not
observe segregation distortion in a cross between a Sarchimor line (T5296) and a wild accession
of C. arabica from Ethiopia (ET6). This would imply that the segregation distortion was specific
to the cross of this study. Segregation distortion is commonly observed in coffee. Pearl et al.
(2004) observed segregation distortion o f 25% of markers in a mapping population between the
C. arabica cvs Catimor and Mokka. Coulibaly et al. (2003) observed that in BCt (C. canephora
x C. heterocalyx) x C. canephora, sixteen percent of both microsatellite and AFLP markers had
144
distorted segregation all in favour of the C. ccmephora alleles. Lashermes et al. (2000b) noted
from their data on HDT derivatives that introgression into C. arabica may involve asymmetric
chromosome segment exchange mechanisms which indicates the occurrence of atypical genetic
mechanisms in these lineages. Marker distortion might also be due to data recording, which can
in turn depend on the type of markers e.g., recording of microsatellites with 'slippage' products
or null alleles (Robinson and Harris, 1999). The complexity of a fragment may also be a cause of
segregation distortion as observed by Nikaido et al. (1999) using AFLPs in Cryptomeria
japonica. The authors were able to reduce or eliminate the distortion by adding more selective
bases to the primers. However in this study, both microsatellite (Sat 11) and AFLP (AFLP-23)
data displayed the same pattern. It is therefore clear that the distortion was fragment based and
not marker specific. Saliba-Colombani el al. (2000) reported a similar type of fragment based
segregation distortion in tomato in-bred lines.
The method of hypocotyls inoculation method (van der Vossen et al., 1976) is very efficient in
isolating a group o f resistant genotypes especially when the medium classes are discarded as has
been the practice at CRF. No potentially misclassified seedlings were observed in the resistant
sub-populations (Group 1) obtained by this method as was the case with young seedlings
inoculation method (Sections 5.2 and 5.3). This is supported by the inoculation results of
molecular analysis in this Section. However, the method leads to recovery of DNA from only
resistant plants and as observed in this study, it would have been difficult to distinguish true
markers from distorted makers like T3 (Table 6). The resistant plants obtained by the two
methods were valuable counter checking populations during mapping of the DNA markers of
resistance. Normally, observation of a few plants of susceptible varieties in resistant classes is
taken as an error due to failed infection, whose detection is the objective of including susceptible
varieties in inoculation tests. However, some of these plants can be actually resistant whose
145

presence in the susceptible lot could be due to pollen, seed or seedling contamination during the
entire breeding and screening process up to scoring. Three plants with unusual pattern of Sat 41
were observed in population E and one in population D. Such illegitimate plants may have been
due to the same reasons. While such atypical plants can affect mapping studies, they are still
useful in confirming markers. Other researchers like Coulibaly et al. (2003) also observed
illegitimate plants in their mapping population and also reported that microsatellites are more
efficient in identifying such plants than AFLP.
AFLP analysis was undertaken to define the location of the gene in relation to Sat 207 and
increase the number of markers linked to the gene. The initial AFLP test with Group 1 plants
proved that all the three seedlings that did not have the introgressed allele of Sat 207, were
recombinant on one side of this marker since they all had the marker AFLP-22. The analysis of
the 30 selected plants confirmed these results and furthermore demonstrated that three of the four
resistant Group 2 plants that lacked the introgressed allele of Sat 207 were similar recombinants.
However, the results of this set o f plants did not reveal any recombinant plants that would help to
identify a limit o f the location o f the gene on the opposite side to Sat 207. An extra sample of 30
resistant plants (from the two screening methods) were therefore analysed and three 3
recombinant plants were identified. Two plants were of Group 1 and one o f them was
recombinant from AFLP-33 onwards while the other lacked only AFLP-36. The third plant was
from Group 2 and lacked all the markers from AFLP-22. In reference to the molecular results
obtained from samples screened by the hypocotyls inoculation method, all the Group 1 plants
had the middle segment of the introgressed fragment T2. Judging from the extensive use of the
hypocotyls inoculation method, the effectiveness of infection in this study and the molecular
results, the possibility of having misclassified plants among the Group 1 plants was negligible. It
was therefore conclusive that the gene conferring resistance to CBD in this cross is located
146

between Sat 207 and AFLP-33 markers, which is a genetic distance of 26.9cM (Figure 6). The
AFLP results of the selected plants showed close linkage between Sat 235 and AFLP-22 and this
was confirmed by mapping Sat 235 (Figure 6). The distance from Sat 235 to ACT-CAA-c
(AFLP-30) is 10.6 cM and it is evident that the gene is located within or just outside this
fragment. Since more plants were analysed by the microsatellites, more recombinant plants were
revealed. There were four resistant plants of Group 2 that lacked the introgressed allele of Sat
235 but had the introgressed allele of Sat 207. This could suggest that the resistant gene is
located between the two microsatellites, which a distance of 13.2 cM, but most likely nearer to
Sat 235. A precaution was necessary in that these plants were not analysed for other markers of
this fragment for confirmation and that they were screened by the young seedlings inoculation
method, which had some errors in terms of misclassification and therefore less confident.
Nevertheless, judging from the fact that three out of five plants that were similarly screened and
lacked Sat 207 marker allele were recombinant, it is unlikely that all the four plants are
misclassified. Ultimate phenotypic confirmation will be available when the plants mature in the
field and are assessed by natural infection, artificial field inoculation and hypocotyls inoculation
on their progeny.
A pair o f primers was designed from the sequence of an AFLP marker (AGC-CTG-c/AFLP-33)
and it amplified a SCAR (coded as AGC-CTG-c-aa-O that identified the presence of the parent
marker in a dominant manner. The primers were sensitive to annealing temperature and the
optimum temperature to detect the polymorphism in this study was 62 °C. At lower annealing
temperature of 55 °C, there was amplification also in samples without the marker, with no
appreciable difference of intensity (Plate 15). For successful use of this marker, pre-testing to
optimise and ascertain the difference in amplification is due to genetic factors and not due to
technical factors would therefore be required. This is because the temperature regimes of
147
different thermocyclers might affect the results. In addition, it is necessary to ensure that lack of
amplification is not due to technical attributes of the DNA sample. The conversion of AFLP
markers into SCAR markers is not often successful as observed in Section 5.1 and by other
workers such as Shan et al. (1999) in wheat and barley and Diniz et al. (2005) in coffee. An
interesting observation was that this marker was missed out in Section 5.1 and retrials in this
section revealed that there was utilizable polymorphism. This was because in Section 5.1, few
samples o f each genotypic category were used and the difference in intensity of the amplified
product was ignored as a technical aspect. The most effective parameters in optimization of PCR
results are annealing temperatures and concentration of Mg+t ions (Paran and Michelmore, 1993;
Zhang and Stommel, 2001). The success o f achieving polymorphism by alteration o f annealing
temperature depends on the degree of mismatch between the primers and DNA sequences. An
optimum is achieved between low temperatures that amplify all samples and higher temperatures
that lead to unreliable results as observed in this study. When successful, the conversion of these
markers may even yield the more informative co-dominant markers as was observed by Boukar
et al. (2004) in cowpea. Though AGC-CTG-c-aa4 is dominant and therefore less informative
than co-dominant markers, it potentially has the advantage of direct revelation after amplification
by addition of ethidium bromide into the reaction tubes without the need for electrophoresis as
demonstrated by Wang et al. (2002). However such a procedure requires the evaluation of the
limit of successful detection, so that weakly positive amplifications are not missed out.
The utility of the SCAR marker AGC-CTG-c-aa4 is especially high in breeding programmes due
to its position in the chromosomal fragment carrying the CBD resistance gene in relation to Sat
207 and Sat 235. Use of the three markers will enable selection of recombinant plants on both
sides of the gene, which will be useful both for MAS breeding and collection of recombinant
plants that can be used later for chromosome walking. Trials demonstrated that Sat 235 can be
148
separated in 2% agarose. It is hoped that a simple method for analysis of Sat 207 will also be
developed either using agarose or silver staining of polyacrylamide gels to facilitate its routine
use in low technology molecular laboratories especially in the developing laboratories.
The multiplicity o f sequences o f three SCARs from AFLP bands was tested in C. arabica
genome by hybridization of BAC library of C. arabica genome. It was observed that A2 is
highly repeated while W3 is less repeated in C. arabica genome. The SCAR coded as AA4
hybridized only seven clones, which fits a single copy sequence in this library (Noir et al., 2003).
These results agree with those obtained in Section 5.1 meaning that the unclear amplification by
primers designed from A2 was most probably not due to poor primer design but multiplicity of
the sequence. This means that out of the three, only AA4 would be useful as a starting point for
chromosome walking but it might be far from the location o f the CBD resistance gene for this
purpose.
Although the consistency of amplification of the SRAPD-M20g3o marker (SCAR amplified with
primers designed from the sequence of RAPD marker of CBD resistance identified by Agwanda
et al. (1997)) was not high, the results clearly demonstrated that it is associated with the
resistance and is located on the T2 fragment. The complication appeared to be allelic competition
in the presence of the introgressed allele, usually resulting in poor or no amplification of the non-
introgressed allele. Amplification in samples used by Ansaldi (2003) was not good enough for
clear mapping but association with T2 fragment was demonstrated. Furthermore, the results
obtained in the F2 plants in this study indicated that the allele is located between Sat 235 and
AFLP-33. The demonstrated association of this SCAR with the identified markers in this study
supported the results of Agwanda et al. (1997) who had recommended further testing of the
markers they identified in a segregating population. At the same time, this association provided
149

further validation o f the markers identified in both studies because the plants used were
independently screened for CBD resistance both in the laboratory and field.
Diverse accessions o f HDT derivatives (Table 9) were assessed for CBD resistance and analysed
with Sat 11, Sat 207 and Sat 235. The results exhibited a correlation between the microsatellite
markers and CBD resistance (Sat 207 and Sat 235), despite the limited number o f seedlings
assessed and the fact that the infection results obtained in this particular test were less stringent
than those obtained when screening the F2 populations. Overall, the results agreed with those
from F2 populations on the supposed location of the resistance gene to be between the two
microsatellites, but this is not conclusive. This is because the two plants that lacked the two
microsatellite markers but were resistant maybe double recombinants or the gene maybe located
beyond Sat 235 on the opposite side of Sat 207. Further confirmatory studies are required. These
observations mean that the two markers can be used for MAS across different derivatives of
HDT and they also demonstrate high similarity between these progenies. The results further
confirmed that the C. canephora fragment T3 (Sat 11) is not linked to CBD resistance because it
was also present in susceptible plants (Table 10). It was also noticeable that Sat 11 was absent in
only 4 o f the 21 HDT derivatives analysed, meaning that it is highly present in these material and
it will be of interest to focus some attention to this fragment. Observations on the accessions of
HDT derivatives from Kenya that were either resistant or susceptible to CBD and/or CLR were
similar (Table 10). It was however observed that the CLR susceptible plants were lacked the
markers of introgressed fragments tested. This raised the question of whether the introgressed C.
canephora chromosomal fragment (T3) is involved in CLR resistance. Similar to the results of
this study, heterogeneity of the cultivar IAPAR has also been reported by Crochemore et al.
(2004) using RAPD. There is thus a lot of selection potential within and between cultivars
derived from HDT as was also observed in lines cv Catimor in Kenya (Section 5.1)
150

The results of this study support the action of a major CBD resistance gene in one locus. The
number of plants identified by both screening methods was not rigorously skewed towards
homozygosity. However, the wide distributions of the phenotypes of the plants suggest deviation
from a strict dominant behaviour. This could be genetic, possibly due to action o f other genes
that may be working through plant vigour, or the complex mechanisms of resistance. The
possibility of dosage effects o f the resistance gene cannot be ruled out especially by
consideration o f group 1 plants. Van der Vossen and Walyaro (1980) also described the CBD
resistance in HDT to be controlled by one gene (T), of intermediate action and whose expression
may be affected by presence o f modifying genes. Earlier, van der Vossen et al. (1976) had
speculated the action o f minor genes even in susceptible varieties. However, it may be argued
that several other factors such as pathogenicity of the inocula, environmental factors and seed
conditions may have affected some of their results but these factors were highly unified in this
study. It was evident that plants of low vigour were particularly susceptible to infection. From
the molecular studies, the cv Catimor lines were polymorphic within themselves while the cv
SL28 accessions were not. This is in agreement with the results o f other researchers (Agwanda et
al.. 1997; Lashermes et al., 2000b; Steiger et al., 2002; Pearl et al., 2004) who observed higher
diversity within HDT derived cultivars than in un-introgressed cultivars. Catimor lines used in
the breeding of cv Ruiru 11 have been shown to have differences in specific and general
combining abilities with the male parents in regard to CBD resistance (Omondi, 1994). It may be
thus postulated that the differences in progenies between these two cultivars is due to the
diversity within cv Catimor.
If it is speculated that the ultimate expression of CBD resistance is affected by some other
genetic factors, then different progenies can be expected to display variations of absolute
reaction types. Although no substantive data was taken. Population D was less vigorous since it
151
had more tiny plants and fewer tall plants compared to population E. A variation in seedling
vigour or physiological state due to seed condition may also explain the difference in the slight
differences in results obtained after inoculation of seedlings from the same tree and under same
inoculation conditions but of different dates of harvest (Section 5.2). This may not be far fetched,
considering the complexity of plants’ resistance to infection by Colletotrichum (Esquerre-
Tugaye et al., 1992, Chongo el al., 2002) and in CofTee-C. kahawae interaction in particular
(Gichuru et al., 1996; Gichuru, 1997, 2001; Rodrigues et al., 1999; Chen et al., 2004a, b, Silva et
al., 2006). The resistance mechanisms operate from pre-germination o f the pathogen to its
sporulation.
It can be perceived that each plant potentially may have a slightly different genetic constitution,
which at the end modifies the final disease reaction. Van der Vossen and Walyaro (1980)
observed that as a pure variety, HDT exhibited the same high degree o f resistance as Rume
Sudan. But after crossing with the susceptible varieties, the resistance appeared to be of
intermediate type. The same question could be asked whether the change of genetic environment
did affect the expression of the resistance. This variation may be more pronounced in young
plants like the seedlings and less noticeable in the field on mature trees. Even the Fi plants used
to raise the F2 populations for this study displayed the same level of CBD resistance as the parent
Catimor lines over the years in the field. This maybe why some authors who have worked with
HDT derivatives in the laboratory' and field have also described the gene as dominant (Omondi,
1994). It was therefore concluded that the C. canephora chromosomal fragment T2 introgressed
into C. arabica via HDT carries a major gene conferring resistance to C. kahawae. The
designation Ck-1 is hereby suggested, as the first mapped locus of resistance to C. kahawae. This
locus is most likely synonymous to the T locus described by van der Vossen and Walyaro
(1980).
152

For refining the map further in relation to the location of the CBD resistance gene, it is appears
more prudent to screen seedlings from segregating populations o f HDT derived donors screened
by hypocotyls inoculation method of van der Vossen el al. (1976). Firstly, the method is more
stringent in terms o f isolating the resistant phenotype. Secondly, both phenotypic and molecular
results can be obtained quite early because DNA can be isolated from the cotyledons or first true
leaves after screening for CBD resistance, long before the plants can be analysed by either shoot
tips or in field. Thirdly, the method would allow screening of much larger starting populations
than either shoot tips or field screening, though more recombinant plants could be potentially lost
with the discarded seedlings. However as with shoot tips inoculation method, plants with unique
recombinations may require reconfirmation especially by field and/or subsequent progeny
analysis. This aspect can be affected by the effectiveness o f infection during the screening
process.
While the experimental conditions were not designed to suit identification of CLR resistance by
for example taking into account race specific interactions and no precise screening was done,
some notes can still be advanced from the observations made in this study. There was high
severity o f CLR in the nursery where the seedlings were raised and all the seedlings of cv
Caturra were severely infected. However, only a few seedlings of the F2 populations, (nine from
Population D and four from Population E), were observed to be infected by CLR. It was also
visually clear that infection on these seedlings was less severe than on cv Caturra. Out of the
eleven CLR infected plants tested by molecular markers, four had T2 fragment, seven had T3
fragment and none had T4 fragment. The conspicuous absence o f T4 in these plants makes it a
likely candidate for CLR resistance. As per previous breeding programmes, plants selected for
CBD resistance normally also exhibit CLR resistance. Three o f the four CBD susceptible plants
that lacked T2 and were not infected by CLR had the T4 marker tested (Table 7) and the other
153

one lacked both fragment at as far as the tested markers are concerned. From these observations,
an opinion can be formed that at least two C. canephora fragments may be involved in CLR
resistance in Kenya i.e. T2 and T4. This may explain why selection for CBD resistance leads to
simultaneous retention of CLR resistance. The absence of T4 in some CLR infected plants that
had T2 may prompt the hypothesis that T4 confers resistance to all CLR races present in the
location but there are some races that are able to exhibit some infection on plants protected by T2
only. There would therefore be a high pressure for the CLR pathogen to overcome resistance that
is linked to CBD resistance, which is more prevalence in breeding materials that are selected for
CBD resistance.
The involvement o f T3 cannot be ruled out whether as major or minor. In fact such a function,
along side possible general segregation distortion in its favour across progenies, may help in
explaining why it is highly present in the cv Catimor as demonstrated in section 5.1 and in Table
10. Coincidentally, the seedling (El 11) which lacked the other fragments had the fragment T3.
The nursery where the seedlings were raised has been used for a long time to propagate breeding
materials (some up to maturity) in different breeding programmes and therefore challenge to the
pathogen by different assortments of genotypes can be anticipated. In the past, some infection
has been observed on HDT derivatives but efforts to determine the races in collaboration with
Coffee Rusts Research Centre (Portugal) have not been conclusive (Gichuru, 2005; Gichuru and
Varzea, unpublished data). The failure to identify races o f the isolates maybe due to their
genotypes, inappropriate differential host ranges or the fact that recovery of viable spores from
the lesions has been low.
In conclusion, a locus carrying a major gene locus (Ck-1) for resistance to infection by C.
kahawae is definitely localised within a 26.9 cM segment of a C. camphors chromosomal
154

fragment introgressed into C. arabica, and possibly within distance of 10.6 cM or just outside
the limits o f this section. More certain and fine localization will be available once the analysed
recombinant plants mature in the field at CRF. Microsatellites 207 and 235 will be very useful in
MAS for this resistance especially if they can be analysed in agarose, which would make them of
practical application in low technology molecular laboratories such as the one at CRF. Sat 235
was observed to be separable in 2% w/v agarose and it differentiated the parents and
heterozygous plants. A dominant SCAR maker derived from an AFLP marker (AGC-CTG-c/
AFLP-33) was also developed and designated as AGC-CTG-c-aa4 and it will be very useful
alongside the microsatellites. The distribution of these markers spans the Ck-1 locus making
their co-utilization o f special interest in MAS breeding and selection of recombinant plants for
further studies of the mapped region.
155

SECTION 5.5 VARIABILITY OF MICROSATELLITES AND SCARS RELATED TO
GENOMIC INTROGRESSION FROM C canephora INTO C. arabica.
5.5.1 INTRODUCTION
Microsatellites have characteristic genomic distribution and motif dependent dispersion in the
genome with most o f them being concentrated in centromeric chromosomal regions (Schmidt
and Heslop-Harrison, 1996; Li el al., 2002). It also appears that their expansions and
contractions are restricted by counter selection, at least for some loci, because of their effects on
aspects such as chromatin organization, regulation of gene activity, recombination, DNA
replication, cell cycle, and mismatch repair system (Li el al., 2002). Microsatellites and their
flanking DNA sequences are rarely conserved in a whole genus, leave alone other genera in the
family, although some may even be conserved across a genus (Hale et al., 2005).
However, microsatellites developed from one Coffea species can be transferable to other species
and even in the closely related genus Psilanthus (Combes et al., 2000; Coulibaly et al., 2003;
Poncet et al., 2004). For example, Poncet et al (2004) observed that 72.7 to 86.4% of 110
microsatellite primer pairs developed from C. arabica amplified in other Coffea species.
Microsatellites also vary in the number of alleles in different Coffea species. Moncada and
McCouch (2004) observed that diploid Coffea species averaged 3.6 alleles per microsatellite
locus while wild tetraploid C. arabica averaged 2.5 alleles per locus and cultivated C. arabica
had only 1.9 alleles per locus. In addition, 55% of the alleles found in wild C. arabica accessions
were not shared with the cultivated genotypes. They also observed that the accessions of HDT in
their study resembled C. arabica cultivars more than C. canephora accessions. On the other
hand. Anthony et al. (2002b) identified four microsatellite alleles related to HDT introgression
and observed closer similarity between the introgressed C. arabica lines and C. canephora from
Central Africa than between them and a C. canephora accession from West Africa. Poncet et al.
156

(2004) observed a maximum of 9 and 8 alleles per locus in C. canephora and C.
pseudozanguebariae respectively. The two species shared 30 polymorphic loci, which could
indicate microsatellite evolution with shared ancestry.
Samples showing only one microsatellite allele are usually considered to be homozygous and
this omits occurrence of null alleles. In C. canephora and C. pseudozanguebariae, Poncet et al
(2004) observed more than 3 alleles per polymorphic locus and estimated null allele percentages
of -9% and -11% respectively. In maize, Matsuoka et al. (2002) observed modest rates (less than
5%) of null phenotypes when analysing microsatellites derived from maize in diploid Zea spp.
Microsatellite loci may also be duplicated in a genome but the duplicated loci may or may not
amplify depending on conservation of the primer binding sites. Coulibaly et al. (2003) observed
two microsatellite loci which were duplicated in both C. canephora and C. heterocalyx, and they
also observed that unlike AFLPs, SSRs are not clustered and are randomly distributed in the
coffee genome. Matsuoka et al. (2002) observed evidence o f possibly duplicated microsatellite
alleles in Zea spp. These workers observed amplification of more than two products in a plant at
low frequencies (1.8% for teosinte and 0.02% for maize landraces) which could have been due to
duplicated alleles, contamination of PCR or some other types of error such as inter well leakage.
Such results may be treated as missing data and thus eliminate bias.
Between species, a given microsatellite may have different genomic location and therefore be
subjected to different evolutionary forces. Diversity of microsatellites may also differ in relation
to the focal species (from which they were developed). Hale et al. (2005) observed that there
were generally more repeats in the focal species of the genus Clusia than in non-focal ones.
Although they tested only 3 microsatellites, it seemed likely that there is a relationship between
the size of the microsatellite and polymorphism. The diversity o f microsatellites may also be
157

affected by factors other than the number of repeat units. By sequencing the amplification
products, Matsuoka et al. (2002) observed that variability o f microsatellite loci in Zea species
was not restricted to repetition o f the motifs but also included indels (insertions and deletions) in
the regions flanking the repeat motifs. They demonstrated that 40 out of 46 microsatellites had
allele distributions that did not strictly adhere to the simple model of allelic variation based on
changes in the number o f repeats. This high level of occurrence of indels prompted the authors to
suggest the term Indel-Rich Regions (IRRs) to describe the maize microsatellites. Hale et al.
(2005) reported that variability of microsatellite loci in Clusia species was affected by stepwise
mutations and indels. Microsatellite data may differ with the method of analysis due to
differences in sensitivity of detection or separation. Poncet et al. (2004) reported a discrepancy
between amplification observed in agarose and that observed in fluorescent analysis in
acrylamide gel, such that some samples that had detectable products in agarose were negative in
the poly-acrylamide tests.
Microsatellites can be viewed as SCARs with highly variable segments in between the primer
annealing sites. Other types of SCARs e.g. those developed from AFLP bands lack such a highly
variable segment and are expected, at least in theory, to be less polymorphic. Poncet et al. (2005)
tested the variability of 14 SCAR primers developed from AFLP markers specific to C.
pseudozanguebariae and they were observed to amplify only one band with a size similar to the
parental band in other coffee species. However there were some null phenotypes but the cross
transferability was high with a minimum of 58%. They further observed that amplification in C.
arabica was a juxtaposition of the patterns of its putative parental diploid species (C. canephora
and C. eugenioides) and that the SCARs did not conserve the polymorphism of parental AFLP
bands. The characteristics o f a marker system including null alleles, low or lack of
polymorphism, hyper-polymorphism and duplication in the genome present experimental
158

challenges such as their use in MAS or in chromosome walking. In this study, the amplification
characteristics of microsatellites and SCARs derived from AFLP markers of C. canephora
chromosomal fragments introgressed into C. arabica via HDT was assessed.
5.5.2 OBJECTIVE
To assess the diversity of microsatellites and SCARs derived from AFLP markers of
chromosomal fragments introgressed from C. canephora into C. arabica, in C. arabica and its
putative parents.
5.5.3 MATERIALS AND METHODS
Ninety-one (91) accessions were used in this study to represent diversity within and between C.
arabica, its putative parents i.e. C. canephora (and its close relative C. congensis) and C.
eugenioides (and its close relative C. anthonyi) (Table 11). DNA from these accessions was
extracted from lyophilized leaves as explained in section 5.1. The leaves were obtained from
plants maintained in Five research centres namely: - IRD (Montpellier. France). CRF (Kenya).
CATIE (Costa Rica), CICAFE (Costa Rica) and C1FC (Portugal). The samples were analysed
with seven (7) SCARs developed from AFLP markers of C. canephora chromosomal fragments
introgressed into C. arabica via HDT (developed in Section 5.1) and eighteen (18)
microsatellites that were found to be associated with this introgression in Section 5.3 (Table 11).
The SCARs were analysed radioactively as in Section 5.1. Microsatellites were analysed by
••tailing” the 5’ end of the forward microsatellite primer with the universal primer M13 (5’-
CACGACGTTGTAAAACGAC-3’) that was labelled with either o f the infrared dyes IRD700 or
IRD800 as described by Poncet el al (2004). Amplification was in 20 pi PCR reaction mixtures
consisting of IX reaction buffer (Promega), 2.0 mM of MgCh. 0.2 mM of dNTPs, 0.2 pM of
forward primer tailed with M13 (Eurogentec, Belgium), 0.2 pM of reverse primer (Eurogentec,
159

Belgium), 0.2 pM o f M13 primer labelled to either IRD700 or IRD800 infrared dyes (MWG-
Biotech AG, Ebersburg. Germany), 0.02 U/pL of Taq. polymerase (Promega) and 20 ng of
genomic DNA. After amplification with the PCR conditions described in Section 5.2, the
samples were diluted two times with a loading buffer (LICOR loading buffer 2X, Appendix 3)
and stored at 4 °C covered with aluminium paper to avoid exposure to light until when used for
electrophoresis. For separation, the samples were denatured at 95 °C for 5 minutes and about 1
pi was loaded in a 25 cm gel of 6.5% w/v KBPIus (Ll-COR, catalogue No. 827-05607) and
electrophoresed using a Ll-COR* DNA Analyser, Global edition IRD2 system (Ll-COR Inc.,
Nebraska, USA). The digital images obtained were scored visually as present (1) or absent (0).
160

Table II. Accessions of C. arabica, C. canephora, C. congensis, C. eugenioides and C. anthonyi analysed with microsatellite markers and SCARs derived from AFLP markers for chromosomal fragments introgressed from C. canephora into C. arabica.
Serial No. Code/Access No Species Genetic group Source Serial No. Code/Access No
Species Genetic group Source
i AR-02-06 C. arabica Wild Ethiopia (Wild) 25 BB59 C. canephora Congolese Central Africa (Wild)
2 AR-03-05 C. arabica Wild Ethiopia (Wild) 26 BC58 C. canephora var Nana coffee Central Africa (Wild)
3 AR-06-05 C. arabica Wild Ethiopia (Wild) 27 BC60 C. canephora var Nana coffee Central Africa (wild)
4 AR-08-06 C. arabica Wild Ethiopia (Wild) 28 BD68 C. canephora Cameroon (wild)
5 AR-13-06 C. arabica Wild Ethiopia (Wild) 29 BD69 C. canephora Cameroon (wild)
6 AR-15-05 C. arabica Wild Ethiopia (Wild) 30 SI 5-2 C. canephora Gainey Guinea (Wild)
7 AR-27-05 C. arabica Wild Ethiopia (Wild) 31 Gui-2 C. canephora Guinea (Wild)
8 AR-30-PG-ABR-27-05 C. arabica Wild Ethiopia (Wild) 32 CA58 C. congensis Central Africa (Wild)9 AR-34-06 C. arabica Wild Ethiopia (Wild) 33 CB65 C. congensis Cameroon (Wild)
10 AR-36B-05 C. arabica Wild Ethiopia (Wild) 34 CC54 C. congensis Congo (wild)
II AR-40-06 C. arabica Wild Ethiopia (Wild) 35 DA54 C. eugenioides Kenya (Kimilili, Wild)
12 AR-50-06 C. arabica Wild Ethiopia (Wild) 36 DA63 C. eugenioides Kenya (Kimilili, Wild)
13 AR-60-06 C. arabica Wild Ethiopia (Wild) 37 CRF 4 C. canephora Kenya
14 CRF 1 C. arabica cv SL28 Kenya 38 OD65 C. anthony i Moloundoupopulation
Cameroon) Wild)
15 C. arabica cv Caturra Costa Rica 39 CRF 5 C eugenioides Kenya (Nandi hills, wild)
16 C. arabica cv Caturra Costa Rica 40 OE56 C. anthonyi Souankcpopulation
Congo (Wild)
17 RS 5/21/4 C. arabica var Rume Sudan Kenya 41 CRF 2 C. arabica Catimor 88/1343 Kenya ex Colombia
18 K7.2S C. arabica cv K7 Kenya 42 CRF 3 C. arabica Catimor127/1343
Kenya ex Colombia
19 K7.2R C. arabica cv K7 Kenya 43 (K)I07 C. arabica (Catimor x SL28) BC1F2
Kenya
20 IF200-DH 06 C. canephora cvIF200 Cote d'Ivoire 44 (K)l 19 C. arabica (Catimor x SL28) BC1F2
Kenya
21 1F200-DH318 C. canephora cvIF200 Cote d ’Ivoire 45 C. arabica Catimor129/1343
Zambia ex Colombia
22 BA53 C. canephora Guinea Cote d’Ivoire (Wild) 46 C. arabica Catimor 86/1343 Kenya ex Colombia
23 BA55 C. canephora Guinea Cote d’Ivoire (Wild) 47 C. arabica Catimor 90/1343 Kenya
24 BB56 C. canephora Congolese Central Africa (Wild) 48 IAPAR59-43 C. arabica Sarchimor/832.2 Brazil
161

Table I I continued
Serial No. C'ode/Access No Species Genetic group Source Serial No. Codc/Accrss No Species Genetic group Source
49 IAPAR C. arabica Sarchimor/832 2 Brazil 71 T 17930 C. arabica var Colombia/ 1343 Colombia
50 T3751 C. arabica Ncmaya Costa Rica 72 TI7931 C. arabica var Colombia/1343 Colombia
51 T4389 C. arabica Hibrido dc Timor Timor 73 T 17932 C. arabica var Colombia/1343 Colombia
52 T5159 C. arabica Catimor 832/1 Brazil 74 T 17933 C. arabica Colombia/1344 Colombia
53 T5175 C. arabica Catimor/832.1 Portugal 75 T17934 C. arabica Catimor/1343 Colombia
54 T5296 C. arabica Sarchimor/832.2 Portugal 76 TI7936 C. arabica Catimor/1343 Colombia
55 T5321 C. arabica Catimor 832/1 Brazil 77 T17937 C. arabica Catimor/1343 Colombia
56 T8666 C. arabica Catimor/832 1 Brazil 78 T 17938 C. arabica Catimor/1343 Colombia
57 TI2835 C. arabica Catimor/832.1 Mexico 79 T 17940 C. arabica Catimor/1343 Colombia
58 TI2856 C. arabica Sarchimor/832 2 Brazil 80 TI8I21 C. arabica Catimor/832.1 Brazil
59 T13229 C. arabica Catimor 832/1 Brazil 81 T18122 C. arabica Catimor/832.1 Brazil
60 T14718 C. arabica Sarchimor/832.2 Brazil 82 T 18123 C. arabica Catimor/832 1 Brazil
61 TI6785 C. arabica Sarchimor/832.2 Brazil 83 T 18126 C. arabica Catimor/832 1 Brazil
62 T16786 C. arabica Sarchimor/832.2 Brazil 84 T18127 C. arabica Catimor/832.1 Brazil
63 T17531 C. arabica Sarchimor/832.2 Brazil 85 TI8I30 C. arabica Catimor/832.1 Brazil
64 T 17543 C. arabica Sarchimor/832.2 Brazil 86 T18131 C. arabica Catimor/832 1 Brazil
65 T 17924 C. arabica Catimor/1343 Colombia 87 T18I37 C. arabica Sarchimor/832.2 Brazil
66 T 17925 C. arabica Catimor/1343 Colombia 88 T18138 C. arabica Sarchimor/832 2 Brazil
67 T 17926 C. arabica Catimor/1343 Colombia 89 T18139 C. arabica Sarchimor/832.2 Brazil
68 T 17927 C. arabica Catimor/1343 Colombia 90 T18I40 C. arabica Sarchimor/832 2 Brazil
69 T 17928 C. arabica Catimor/1343 Colombia 91 TI8I4I C. arabica Sarchimor/832.2 Brazil
70 T 17929 C. arabica Catimor/1343 Colombia
162

5.5.4 RESULTS
Ninety one (91) accessions o f Coffea species consisting o f C. arabica, its putative parents
namely C. canephora (and its close relative C. congensis) and C. eugenioides (and its close
relative C. anthonyi) (Table II) were analysed with eighteen (18) microsatellite markers of
introgression via HDT and seven (7) SCARs developed from AFLP markers of C. canephora
fragments that are introgressed into C. arabica. Out the eighteen microsatellites analysed, four
were not finally considered due to faint signals, poor resolutions or lack of amplification in many
samples that could not be explained by null alleles. Different amplification characteristics of the
microsatellites and SCARs were observed in the different Coffea species and the two marker
systems namely microsatellites and AFLP-derived SCARs. Un-introgressed C. arabica
accessions had either one or two microsatellite alleles that demonstrated high level of
homogeneity (Plate 18). It was observed that in cases where C. arabica had two alleles per
accession, there was amplification in all the species analysed. It was further observed that in such
cases, there was either intersection of the alleles in the different species (Plate 18 A) or one allele
of C arabica was similar to alleles of C. canephora and C. congensis while the other was similar
to those o f C. eugenioides and C. anthonyi (Plate 18 B). In cases where the un-introgressed C.
arabica had one allele per accession, there was no amplification in all or most accessions of C.
eugenioides and C. anthonyi accessions. In some cases, the alleles amplified in C. canephora and
C. congensis spanned those in C. arabica (Plate 18 C) while in other cases there was clear
distinction between the alleles in C. arabica on one side and C. canephora and C. congensis on
the other side (Plate 18 D)
There were no null alleles observed in amplifications with the SCARs but there were species
specific bands, as was also observed in section 5.1 with the same SCARs, and in many cases C.
canephora and C. congensis had the same band, C. eugenioides and C. anthonyi had another
163

band while C. arabica combined the two. In other cases, all the accessions had the same band(s).
The most polymorphic SCAR was J3 in which C. canephora had alleles spanning all the other
species (Plate 19), but one C. canephora accession had three alleles of this SCAR. The
maximum number o f microsatellite alleles was seventeen and the minimum was three for Sat
227 and 255 respectively (Table 12). On the other hand, the maximum SCAR alleles were five
and the minimum was one for SCARs J3 and G3 respectively (Table 12). It was further noted
that the markers mapped onto the C. canephora chromosomal fragment T3 were among the least
polymorphic. C. canephora had the highest number of alleles which might be attributed to both
heterogeneity and the number o f accessions used. For example all the alleles o f Sat 254 were
observed in C. canephora. However for Sat 280, C. arabica had more alleles than C. canephora.
The least polymorphic group was C. eugenioides/C. anihonyi. The un-introgressed C. arabica
accessions as a group had more alleles than the introgressed ones despite the introgressed
accessions having extra alleles due to the introgression.
164
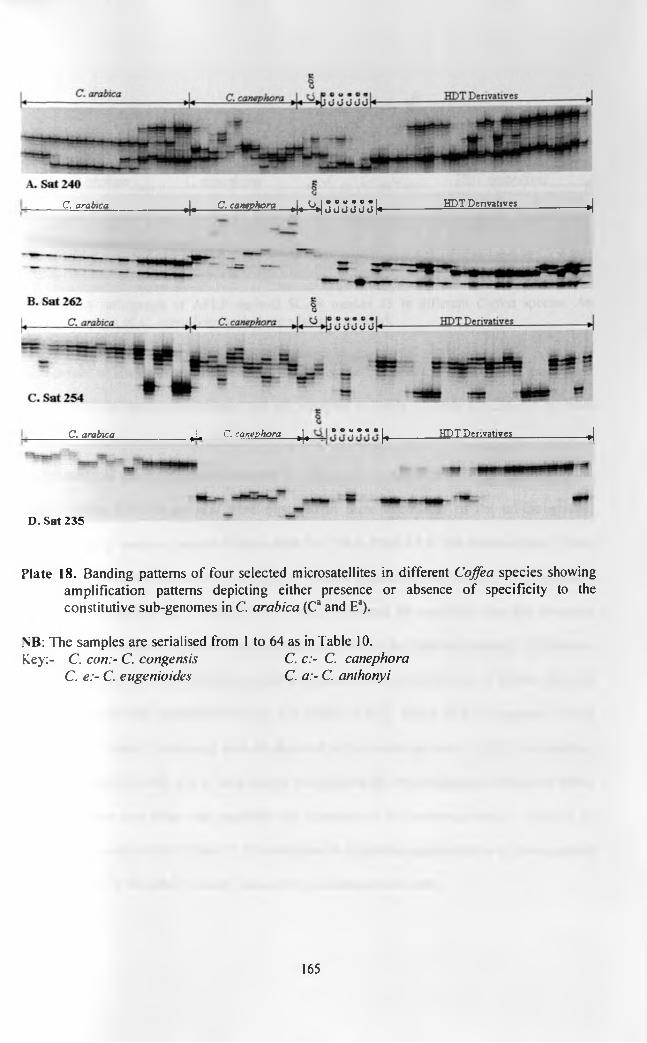
C. arabica --------------4*------C. cantphora----* ( ^ | 3 0 0 <5 U J \*----------------- HDTDerivatives------------------- *|
C. arabica______________( L C. cantphora r |t ” * “• * * * |.,________ HPT PciVatLY^--------------------- *|
D. Sat 235
Plate 18. Banding patterns of four selected microsatellites in different Coffea species showing amplification patterns depicting either presence or absence of specificity to the constitutive sub-genomes in C. arabica (Ca and Ea).
NB: The samples are serialised from 1 to 64 as in Table 10.Key:- C. con:- C. congensis C. c:- C. canephora
C. e:- C. eugenioides C. a:- C. anthonyi
165

Plate 19. A radiograph of AFLP derived SCAR marker J3 in different Coffea species. An accession o f C. canephora with three alleles is arrowed.
The number of alleles shared between the un-introgressed C. arabica, other Coffea species and
the HDT derivatives were calculated and are presented in Table 12. Only Sat 235 did not have
any allele shared between any o f the un-introgressed C. arabica accessions and the accessions of
the canephoroid group (C. canephora and C. congensis). In some cases, alleles similar to the
marker alleles for introgression were observed in some accessions of the un-introgressed
accessions of C. arabica, as can be seen with Sat 254 in Plate 18 C (the lowest allele). It was
observed that one accession of C. arabica cv Caturra (Cenicafd) had markers o f introgressed
fragment T1 including Sat 32 and SCAR J3, which indicated the possibility that this accession
was either contaminated or mislabelled/misidentified either in the field or laboratory. In all cases,
the genotypes of the HDT derivatives could be constituted by a combination of alleles observed
in C. arabica and the canephoroid group. The alleles of HDT shared with the eugenioid group
(C. eugenioides and C. anthonyi) were all observed in the un-introgressed C. arabica accessions.
In HDT derivatives, only one of their alleles was replaced by the introgressed allele even where
there more than one allele was amplified per accession of the un-introgressed C. arabica. In
cases such as with Sat 262 (Plate 18 B) where one of the alleles appeared to be o f the eugenioid
sub-genome (Ea), this allele was not replaced by the introgressed allele.
166

Table 12. Tabulation of the number of alleles amplified and shared between accessions of five Coffea species and HDT derivatives using microsatellites and SCAR markers of genetic introgression from C. canephora into C. arabica.
Tota
l alle
les
1. C
. ara
bica
(19
)
2. C
. can
epho
ra (
13)
3. C
. con
gens
is
4. C
. eug
enio
ides
(3)
5. C
. ant
hony
i (2)
6. H
DT
deriv
ativ
es (5
egX
<
coX
CD
X
D. 1
x5
E. 1
x6
CDXcoegLL
COXm$9
Sat 32 (Tl) 10 5 6 2 3 1 4 2 2 2 1 3 2 2FI (Tl, AFLP-24) 3 2 2 1 1 1 2 1 1 1 1 2 1 1J3 (Tl.AFLP-8) 5 1 5 1 3 1 2 1 0 1 0 1 2 2Sat 262 (T2) 11 2 9 3 1 0 3 1 0 1 0 2 2 1Sat 207 (T2) 9 2 7 3 1 1 3 1 0 1 1 2 2 1Sat 235 (T2) 14 6 8 2 0 0 4 0 0 0 0 2 2 0AA4 (T2. AFLP-33) 3 3 3 2 3 2 3 3 2 3 2 3 3 3N'2-1R (T2, AFLP-93) 4 4 3 3 4 4 4 3 3 4 4 4 3 4
S3 (T3. AFLP-12) 2 2 2 2 2 2 2 2 2 2 2 2 2 2U2 (T3, AFLP-12) 2 2 2 2 1 1 2 2 2 1 1 2 2 1Sat 11 (T3) 4 1 3 3 1 0 2 1 1 0 0 1 2 0Sat 255 (T3) 3 1 3 3 0 0 2 1 1 0 0 1 2 0G3 (T5, AFLP-25) 1 1 1 1 1 1 1 1 1 1 1 1 1 1Sat 27 6 3 4 2 3 0 2 2 1 3 0 2 2 2Sat 225 14 5 10 2 2 1 6 2 1 0 0 2 4 1Sat 227 17 6 11 3 0 0 3 1 2 0 0 2 1 0Sat 237 9 3 5 2 2 1 3 1 2 1 0 3 2 1
Sat 240 16 6 11 4 2 2 4 2 0 2 1 3 2 0Sat 254 9 5 9 3 0 0 3 5 1 0 0 3 3 0Sat 268 12 3 10 3 4 2 3 2 1 1 1 3 2 2
Sat 280 15 8 7 2 3 2 6 2 1 1 2 4 4 2
Legend:1. Columns A to E show the number of alleles that are common between C. arabica, the
other species and HDT derivatives.2. The number o f accessions analysed per species/category are in brackets3. Columns F and G show the number of alleles shared between HDT derivatives and
canephoroid species (C. canephora and C. congensis); and HDT derivatives and eugenioid species (C. eugenioides and C. anthonyi) respectively.
4. Mapped markers are ordered as mapped and the introgression fragments are indicated in bold.
5. In case of SCAR markers, the parental AFLP markers are indicated as in Appendix 2.
167

Microsatellites were o f higher potential as breeding tools both between and within the Coffea
species than the SCARs. This is can be observed in Table 12 especially in regard to C. arabica
by comparing the number of alleles in C. arabica and the number of alleles shared with other
species. For example although Sat 207. Sat 237 and Sat 254 have nine alleles each; Sat 254 has
less selection potential between C. arabica and C. canephora because it has only four unshared
alleles between these species while Sat 207 and Sat 237 have seven each. The SCAR markers
were more polymorphic between the diploid canephoroid and eugenioid groups due to group
specific alleles but both were present in C. arabica. The potential for the use of these
microsatellites as breeding tools for resistance to CBD and CLR from varieties Rume Sudan
(resistant) and K7 (tolerant) was assessed by identifying polymorphic microsatellites between the
accessions of these varieties. Sat 225 was observed to be particularly polymorphic between these
varieties (Figure 7; Plate 20). Cultivar Caturra had high polymorphism with the other accessions
implying that it is a more suitable mapping parent within C. arabica.
It was noted that utility of these microsatellites would better be exploited by high performance
techniques such as LICOR which gave better separations than even radioactive PCR
electrophoresis in denaturing poly-acrylamide gel. This aspect can be observed by comparing
Plate 21 with Plate 18 D although the results of Plate 21 could be improved by longer migration
and length of time o f exposure of the gel to the film.
168

Figure 7. Diagrammatic presentation o f microsatellites those were polymorphic between two CBD and CLR susceptible cultivars (SL8 and Caturra) and two donor varieties of resistance (Rume Sudan) and tolerance (K7) to the two diseases.
C3reT3S
Plate 20. The amplification pattern o f Sat 225 in nineteen C. arabica accessions including variety Rume Sudan and cv K7 that are used as donors of resistance and tolerance respectively to both CBD and CLR in Kenya . The details of the accessions and serial numbers are as in Table 10.
169

Plate 21. A radiograph of the banding pattern of Sat 235 in accessions of different Coffea species. All the samples are subsets of the samples analysed by LICOR fluorescence methodology and results are presented in Plate 18 D. The differences in clarity can be seen especially in the C. arabica samples in the two systems.
5.5.5 DISCUSSION
C. arabica genome originated from the union of a canephoroid genome (either C. canephora or a
close relative such as C. congensis) and a eugenioid genome (either C. engenioides or a close
relative such as C. anthonyi), possibly not more than one million years ago (Lashermes et al.,
1995: Raina et al., 1998; Lashermes et al., 1999). The constitutive genomes may be referred to
as Ea and Ca in reference to the chromosome sets from eugenioid and canephoroid species
respectively. In this regard, DNA based markers like microsatellites and SCARs regularly
display patterns distinct to the two genomes and the C. arabica pattern as a juxtaposition of the
parental diploids. This was observed in this study and also by Poncet et al. (2005). The
microsatellites used in this study were selected to identify C. canephora chromosomal fragments
introgressed into C. arabica and therefore a bias towards the Ca genome was expected. This may
explain why no apparent null alleles were observed in C. canephora and C. congensis and these
species had higher polymorphism. Hale et al. (2005) explained that amplification and variability
of microsatellites is higher in focal species that in related species. Null alleles were observed in
170

eugenioid species in cases where only one allele was amplified in C. arabica, prompting the
hypothesis that only the Ca genome was amplified in C. arabica. Poncet el al. (2004) observed
that amplification o f 110 microsatellites developed from C. arabica ranged from 72.7 to 86.4%
in other Coffea species and estimated null allele to be between -9 to -11%. Null alleles have been
observed in other plants such as Zea spp (Matsuoka el al., 2002). The microsatellites amplified
in this study were not sequenced and therefore the alleles recorded included variability of the
number of repeat motifs as well as insertions and deletions (indels) in the flanking regions as
explained by Matsuoka el al. (2002).
Amplification of intersecting alleles in the different Coffea species demonstrated co-evolution
within the genus. On the other hand, amplification of alleles specific to Ca with close relationship
to alleles of C. canephora and C. congensis on one hand and alleles specific to Ea with close
relationship to alleles o f C. eugenioides and C. anthonyi or null alleles on the other hand reflects
differential evolutionary pathways. This specificity was observed with both microsatellites and
SCARs. One microsatellite (Sat 235) amplified alleles that were not common between un-
introgressed C. arabica and canephoroid species, indicating possible unique origin of the Ca
allele and differential evolution thereafter. This type of a marker has high potential of selecting
introgressed genotypes, breeding of Arabusta hybrids and detection of contaminations or
adulteration even in coffee trade. SCARs had low polymorphism that agreed with observations
made in section 5.1 and there were no null alleles observed with SCAR amplifications. Using
nine Coffea species Poncet et al. (2005) observed high transferability o f SCARs derived from
AFLP with a minimum of 58% and the SCARs could be used as anchor markers for the genus.
The most polymorphic SCAR in this study was J3 with five alleles in C. canephora. One
accession of this species had three alleles that indicated that it is duplicated. This agrees with the
results reported in section 5.1 where two loci were observed in C. canephora double haploid
171
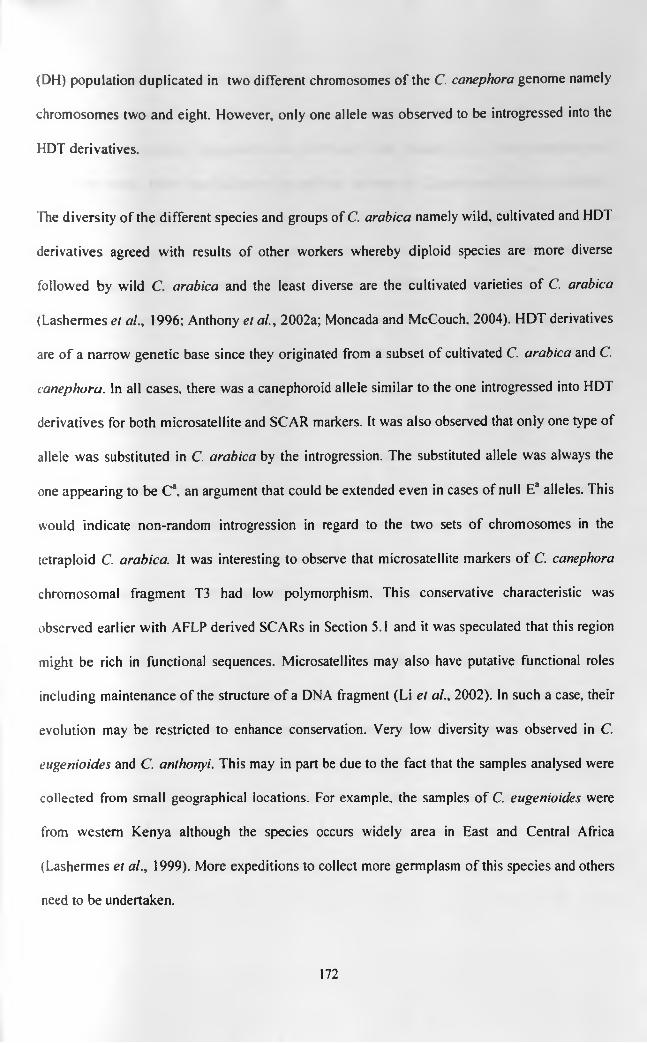
(DH) population duplicated in two different chromosomes of the C. canephora genome namely
chromosomes two and eight. However, only one allele was observed to be introgressed into the
HDT derivatives.
The diversity o f the different species and groups of C. arabica namely wild, cultivated and HDT
derivatives agreed with results of other workers whereby diploid species are more diverse
followed by wild C. arabica and the least diverse are the cultivated varieties of C. arabica
(Lashermes et al., 1996; Anthony et al., 2002a; Moncada and McCouch, 2004). HDT derivatives
are o f a narrow genetic base since they originated from a subset of cultivated C. arabica and C.
canephora. In all cases, there was a canephoroid allele similar to the one introgressed into HDT
derivatives for both microsatellite and SCAR markers. It was also observed that only one type of
allele was substituted in C. arabica by the introgression. The substituted allele was always the
one appearing to be Ca. an argument that could be extended even in cases of null Ea alleles. This
would indicate non-random introgression in regard to the two sets o f chromosomes in the
tetraploid C. arabica. It was interesting to observe that microsatellite markers o f C. canephora
chromosomal fragment T3 had low polymorphism. This conservative characteristic was
observed earlier with AFLP derived SCARs in Section 5.1 and it was speculated that this region
might be rich in functional sequences. Microsatellites may also have putative functional roles
including maintenance of the structure o f a DNA fragment (Li et al., 2002). In such a case, their
evolution may be restricted to enhance conservation. Very low diversity was observed in C.
eugenioides and C. anthonyi. This may in part be due to the fact that the samples analysed were
collected from small geographical locations. For example, the samples of C. eugenioides were
from western Kenya although the species occurs widely area in East and Central Africa
(Lashermes et al., 1999). More expeditions to collect more germplasm of this species and others
need to be undertaken.
172

Several microsatellites were identified that were polymorphic between cv SL28, cv Caturra, cv
K7 and variety Rume Sudan. The last two which are used in breeding programmes as donors of
tolerance and resistance respectively to CBD and CLR. Based on the microsatellites and
accessions tested, there was higher polymorphism between cv Caturra and the donor varieties
than between cv SL28 and the donor varieties. This could mean that it would be easier to map a
population between cv Caturra and the donor varieties than between cv SL28 and the donor
varieties. However, it would be better in Kenya to use cv SL28 for direct comparison of standard
Kenyan commercial traits such as quality and also take advantage of the breeding materials
already established. It should also be noted that the efficiency of detecting and analysing the
polymorphism would require high performance methodologies such as LICOR. In this study, use
of LICOR system gave better resolutions, was faster and less dangerous than radioactivity.
However, this methodology requires higher capital installations and is very sensitive thus
requiring excellent workmanship. The pattern of radiograph o f Sat 235 presented in this section
could have been improved by altering the concentration of samples, distance of migration and
length o f exposure time. Moreover, the observed polymorphisms are only indicative and the
actual polymorphism in a particular mapping population can vary.
In conclusion, this part of the study facilitated the identification of microsatellite and SCAR
markers for breeding especially in relation to canephoroid Coffea species. They would be useful
in mining useful genes from these species and introgressing them into C. arabica. Some
polymorphic microsatellites that could be used in breeding between C. arabica varieties were
also identified. It appeared that introgression into C. arabica was preferential to the related
chromosomes and it would be interesting to find out if introgression from the C. eugenioides
behaves the same. This would facilitate double introgression on the two sub-genomes even at the
same locus.
173

CHAPTER 6. GENERAL DISCUSSION
Despite its variable morphological and agronomic traits, Coffea arabica is characterised by very
low genetic diversity at molecular level as observed in various phases of this study and also by
other workers using various DNA marker systems (Orozco-Castillo et al., 1994, Lashermes et
al, 1999, Steiger et al., 2002, Anthony et al., 2002). However, there is clustering of some
accessions with various degrees of similarity related to lineage or geographical origin. Breeders
have exploited the differences in certain traits to develop improved cultivars by both selection
and cross breeding. The current variations are due to various mutations or enlargement of genetic
base by collection o f more wild accession from the centre of diversity in Ethiopia. However from
a molecular point o f view, these mutations can be very difficult to reveal if they are single point
or involve very small DNA regions (Krug and Carvalho, 1951; Jones, 1956). Low diversity in
adopted cultivars has also been observed in other crops like soybean (Maughan et al., 1996;
Yang et al., 2000). This makes it difficult to construct genetic maps using such cultivars but it
has the advantage o f analysis o f agronomic traits and genetic fragments that are introgressed
from alien sources are easily detected.
Generally, once conditions of a protocol for AFLP have been established, the results exhibit high
repeatability of up 99% (Steiger et al., 2002). In this study it was possible to regenerate AFLP
patterns that were obtained by other workers in the same laboratory such as Lashermes et al.
(2000a), Noir et al. (2003) and Ansaldi (2003). However, the repeatability may be lost due some
change o f PCR conditions. Some of the factors that affect repeatability include human factor
(workmanship), gel resolutions, protocol and condition of reagents and machines. In this study, a
change o f the model of thermocyclers was observed to affect the AFLP patterns obtained, and it
can be expected that even one machine may give different performance over time as it ages and
therefore affect amplification profiles. Sequence-specific primers such as microsatellites and
174

C ARS are less sensitive to these parameters, but they arc relatively few for dense mapping
specially in species such as C. arabica, which is less studied and is of low genetic diversity,
he AFLP technique reveals more polymorphism per reaction by revealing more loci per primer
ombination but it rarely exhibits multiple alleles per locus as is the case for SSR (Vos et al.,
995, Rafalski et al., 1996; Garcia et al., 2004). The high polymorphism revealed by AFLP is
Iso in a way compensates for the high cost of using AFLP when costed on the basis of the
lumber ot markers realised per reaction. In this study, the number of microsatcllite alleles per
ocus per accession in ( . arabica varied from 2 to 3 while the number of loci varied from I to 2.
>ome of the alleles were always present and not polymorphic, and thus not scored for analysis.
The interpretation o f the genetic control of a trait may be alTcctcd by the evaluation procedure
ind genetic constitution of the materials used. In the case of CBD, several researchers have
idvanced different arguments on different classical screening methods (macro-symptoms) in
regard to their reliability, data interpretations, co-relationships, utilities, and genetic control (Van
der Vossen et al., 1976; Van der Graaff, 1978 and 1982; van dcr Vossen and Walyaro, 1980;
Dancer, 1986; Owuor and Agwanda, 1990; Gichuru. this thesis). The introduction of more
technical screening methods like tissue culture (Nyange et al., 1995 and 1997). DNA molecular
markers (Agwanda et al., 1997; Gichuru. this thesis) and numerous biochemical or histochemical
factors (Gichuru, 1996. 1997; Gichuru and King'ori, 1999; Gichuru et al., 1999; Gichuru. 2001,
Rodrigues et al., 1999; Silva et al., 2006) does not seem to provide outright solutions to the
matter, but points out at the depth of intricate factors involved. However, this should be viewed
as a challenge to understand the disease in details and finally utilise all the information in
optimising the management o f the disease in a holistic way in the background of agronomic,
biotic and abiotic factors. This should be supported by similar studies on the pathogen.
175
This study encompassed macro-symptomatic assessment and molecular analysis o f CBD in order
to identify, characterise and map resistance to the disease derived from C. canephora and
introgressed into C. arabica via HDT. The first step (Section 5.1) involved molecular analysis of
cv Catimor which are selected and fixed for resistance to CBD. This was to enable identification
of C. canephora derived chromosomal fragments or markers that are present in these breeding
lines and their progenies (BC| F|, BC1 F2). These markers or fragments would then constitute an
inventory of candidate markers or carriers of resistance to both CBD and CLR. This was
accomplished by AFLP analysis for markers of introgression and collaboration o f the result to
those of Lashermes el al. (2000a), Noir et al. (2003) and Ansaldi (2003) that were generated in
the same laboratory (IRD, Montpellier, France). Out of the overall HDT derived markers, it was
anticipated that potential markers for genes of resistance to CBD and CLR (at least the genes
related to races o f CLR present in Kenya) are present in all the cv Catimor and BC| F| plants
analysed in this study because they were all resistant to these diseases. Consequently, the
identified C. canephora chromosomal fragments fitting this criterion whether mapped or not
constituted potential candidate markers o f the introgressed resistance genes.
Two mapped introgressed C. canephora chromosomal fragments T2 and T3 were identified as
the most probable candidates while fragment T4 was less likely due to its absence in some
resistant trees. Two fragments T1 and T5 were ruled out as candidates because they were absent
in the cv Catimor lines analysed. It was not possible to regenerate the RAPD markers of CBD
resistance identified by Agwanda et al. ( 1 9 9 7 ) . However, the product amplified by primers
designed from the sequence o f the RAPD marker M 2 0 s jo (Agwanda et al., 1 9 9 7 ) consisted of
two bands in C. arabica, one of which was the introgressed allele due to its presence in
introgressed accessions. When the marker was scored alongside the data of Ansaldi (2003), it
was evident that it was linked to the fragment T2, but it could not be clearly mapped due to poor
176

amplifications in many samples. This phase of study set a firm starting point in the search for
CBD resistance gene in a F2 population that was being bred at the time when these studies were
being carried out. This phase also enhanced the information available on the C. canephora
chromosomal fragments especially in cv Catimor in Kenya, which is useful for any subsequent
studies aimed at their utilization and conservation.
A second step (Section 5.2) involved the establishment o f two F2 populations from crosses
between cvs SL28 and Catimor, which was a prerequisite for identification and mapping of
markers. It was demonstrated that the populations were segregating in resistance to CBD by
hypocotyls inoculations. The hypocotyls inoculation results o f the two populations exhibited
high similarity between and within the populations. However there was a tendency for the first
seed lots of the two populations to have slightly more sensitive plants that indicated the
possibility of the action of non-genetic factors. The sensibility of the method to environmental
conditions especially temperatures has been observed for a long time (van der Vossen and
Waweru, 1976; Masaba and van der Vossen, 1982). This may be the cause of the much debate
on scaling and data interpretation, but the method is valuable especially in screening populations
to obtain resistant plants or using the averaged results to determine the phenotype of the mother
plant or line (Van der Vossen, et al., 1976; van der Graaff, 1978, 1982; Dancer, 1986; Owour
and Agwanda, 1990). In this study a cut off between presence and absence o f resistance was
made at Class 10, but only seedlings in Classes 1 to 4 were retained as resistant sub-populations
of the two populations so as to have direct comparison with routine breeding programmes at
CRF. The preserved plants from the inoculated halves of the F2 populations constituted Group 1
plants from each o f the populations (Population D and Population E). However this method
eliminated susceptible plants from the inoculated sub-populations. Molecular analysis using
microsatellite markers revealed that two C. canephora chromosomal fragments (T2 and T3) were
177

present and segregating in the two Ft populations, and they were considered to be the most
probable candidates for disease resistance in support of the results of the First stage.
In the third step (Section 5.3), a suitable method to screen the F2 population for CBD resistance
at an early stage, while allowing availability of DNA from the entire population and enhancing
the survival of susceptible plants was developed and used to screen the F2 populations. This was
necessary to overcome the problem o f elimination of susceptible plants by the hypocotyls
inoculation method (van der Vossen et al., 1976) while saving the time that would be necessary
if the plants were to be screened at maturity. Inoculation of shoot tips of seedlings at about one
year was considered to be a suitable screening method allowing early screening without high loss
of susceptible plants. The method was used for inoculation o f the Group 1 and the un-inoculated
(Group 2) sub-populations of the F2 populations. The methodology was modified by provision of
suitable environmental conditions that were anticipated to enhance infection beyond the shoot
tips irrespective o f the stage o f growth of the tips. This facilitated the screening of the entire
population because the seedlings did not need to be selected as described by van der Vossen et
al. (1976). The results enabled adequate separation of resistant and susceptible plants for
identification of molecular markers linked to the resistance, but it was expected that some plants
would be misclassified into the wrong phenotypes and an intermediate genetically ambiguous
category was observed. However subsequent molecular studies were expected to identify
misclassified plants and Group 1 plants from both populations that were obtained in the second
step of this study were considered as confirmatory for maker identification.
The fourth step o f this study (Section 5.4) involved molecular studies to identify markers of
resistance to CBD and infer its mode o f gene action. Firstly, microsatellites were analysed to
identify candidates markers in the populations established and characterised in preceding
178

sections whereby Group ! plants were used to confirm linkage to CBD resistance and Group 2
plants were used to assess segregation behaviour o f the markers in the populations. Sat 207
which is mapped onto C. canephora chromosomal fragment T2 was found to be linked to CBD
resistance and the introgressed allele o f fragment T3 was highly present due to segregation
distortion. AFLP analysis was carried out to confirm these results further as well as to establish
the limits o f the location of the resistance gene. Fragment T2 was concluded to be linked to the
resistance and the gene was localised within a fragment measuring 26.9 cM. In addition. Sat 235
was also found to be tightly linked to the resistance and mapped onto the T2 fragment. As
expected, misclassified plants were identified in both resistant and susceptible plants of Group 2
but none were observed in Group 1 category. The high complementation of the two phenotypic
screening methods and molecular studies was evident. Analysis of a SCAR (SRAPD-M2083o)
designed from the sequence of a RAPD marker for CBD resistance derived from HD1
(Agwanda el al„ 1997) demonstrated that it is linked to fragment T2, which further validated the
results. One AFLP marker of the resistance was converted into a dominant SCAR marker (AGC-
CTG-C-AA4).
The segregation behaviour of the microsatellite markers indicated that both heterozygous and
homozygous plants were similarly resistant to CBD and it was therefore concluded that the
resistance was major. However the possibility of effect of the dosage of the gene cannot be ruled
out especially in regard to results obtained by hypocotyls inoculation test. The locus was
designated Ck-1 (the first mapped locus for resistance to Colletolrichum kahawae) and is likely
to be synonymous to the T-locus described by van der Vossen and Walyaro (1980). Surveillance
for the markers in diverse derivatives o f HDT with both field and laboratory resistance to CBD
demonstrated the reliability o f the markers. However, further studies are required to refine the
179

map further. Additionally, the studies o f this phase lead to speculation that three C. canephora
chromosomal fragments T2, T3 and T4 may be involved in resistance to CLR.
In the final part o f the study, the diversity of microsatellite markers and SCARs derived from
AFLP markers of introgression o f C. canephora genomic fragments into C. arabica facilitated
the identification o f microsatellite and SCAR markers for breeding especially in relation to
canephoroid Coffea species. They would be useful in mining useful genes from these species and
introgressing them into C. arabica. Some polymorphic microsatellites that could be used in
breeding between C. arabica varieties were also identified. It appeared that introgression into C.
arabica was preferential to the related chromosomes in C. arabica (Ca sub-genome). Species
specific and non-specific evolutionary patterns of the microsatellites were also demonstrated.
Microsatellites that are polymorphic between the susceptible cultivars SL28 and Caturra against
K.7 and Rume Sudan that are donors of resistance and tolerance respectively to CBD and CLR
were identified.
180

CHAPTER 7. CONCLUSIONS AND RECOMMENDATIONS
This study focussed on chromosomal fragments of C. canephora that are introgressed into C.
arabica genome and their effects on disease resistance particularly CBD. In view of all the
analysis done in this study, it is concluded that a major CBD resistance gene hereby designated
Ck-1 that is located on the introgressed fragment T2 was identified and plant genotypes were
established for its further fine mapping and/or breeding. Though not conclusive, two C.
canephora fragments (T2 and T4) were highlighted as priority candidates for CLR resistance in
the derivatives of HDT in Kenya. Another prominent fragment T3 maybe of some function in
these plant materials and it is of interest to study it. Recommendations from this study include:
i. To confirm the disease reaction phenotypes of the plants that are recombinant in regard to
Sat 235 after they start bearing by field inoculation, natural infection and analysis of their
progenies.
ii. To adapt microsatellites 207 and 235, and the SCAR maker AGC-CTG-c-aa4 to low
technology use such as in CRF laboratory under local conditions and using locally
available reagents so that they can be more widely used for MAS.
iii. To utilize the differentially recombinant plants established in the field to develop elite
breeding parents, single line varieties and to study the influence of different introgression
fragments in the genotypes in regard to agronomic traits.
iv. To screen large numbers of segregating progenies of HDT derivatives and HDT
accessions by hypocotyis inoculation method, followed by analysis of the resistant plants
by methodologies of recommendation (ii) to obtain more recombinant plants for future
fine mapping.
v. To collaborate with other laboratories such as IRD, France and assess more markers
those become available for coffee genomics in recombinant plants.
181
vi. With further collaborations, endeavour to walk on the chromosome with the final
objective o f cloning the gene and using it for transformation.
vii. To design studies for identifying markers for resistance to CLR using the plants with
different introgression fragments established in this study.
vii i. To develop markers of disease resistance from other donors such as varieties Rume
Sudan and K7 with the identified polymorphic microsatellites as starting point.
182

8. REFERENCES
Adams. K. L. and Wendel, J. F. (2005). Polyploidy and genome evolution in plants. Current
Opinion in Plant Biology 8: 153-151.
Aga, E., Bryngelsson, T., Bekele, E. and Salomon. B. (2003). Genetic diversity o f forest arabica
coffee (Coffea arabica L.) in Ethiopia as revealed by random amplified polymorphic
DNA (RAPD). Hereditas 138:36-46.
Agwanda, C. O., Lashermes, P., Trouslot, P., Combes, M C and Carrier, A. (1997). Identification
of RAPD markers for resistance to Coffee Berry Disease, Colletoirichum kahawae in
Arabica coffee. Euphytica 97: 241-248
Ansaldi, C. (2003). Analyses moleculaires de l’introgression genetique chez le cafeier (Coffea
arabica L.). DESS Bioingenierie, University Paul, Toulose, France. 31 p
Anthony, F„ Combes, M. C., Astrorga C., Bertrand, B., Graziosi, G. and Lashermes, P.
(2002a). The origin of cultivated Coffea arabica revealed by AFLP and SSR markers.
Theoretical and Applied Genetics 104: 894-900
Anthony, F„ Quiros, O., Topart, P., Bertrand, B. and Lashermes, P. (2002b). Detection by simple
sequence repeat markers of introgression from Coffea canephora in Coffea arabica
cultivars. Plant Breeding 121: 542-544.
Anthony, F. and Lashermes, P. (2005). Origin, Evolution and Diversity of the coffee (Coffea
arabica L.) genome. In: Sharma, A. K. and Sharma, A. (Eds). Plant genome: Biodiversity
and evolution Vol. I (B). Science Publisher, Inc. Plymouth, UK. Pp 208-228.
Anthony, F., Noirot. M., Couturon, P. and StofTellen, P. (2006). New coffee (Coffea L.) species
from Cameroon bring original characters from breeding. 21s1 ASIC Conference, 11-15
September, Montpellier, France.
183

Bertrand. B., Guyot, B„ Anthony, F. and Lashermes. P. (2003). Impact of the Coffea canephora
genome introgression on beverage quality of C. arabica. Theoretical and Applied
Genetics 107: 387-384.
Bettencourt, A. J. (1973). Considera<;oes gerais sobre o “HDT”. Instituto Agronomico de
Campinas, Circular No. 31, Campinas, Brazil.
Bettencourt, A. J. (1983) Caracteristicas agronomicas de seleccoes derivadas de cruzamentos
entre Hibrido de Timor e as variedades Caturra, Villa Sarchi e Catuai. In Simposio sobre
Ferrugens do Cafeeiro, Oeiras, Portugal, pp 353-373.
Blears. M. J., De Grandis, S. A., Lee, H., Trevors, J. T. (1998). Amplified Fragment Length
Polymorphism (AFLP): a review of the procedure and its applications. Journal of
Industrial Microbiology and Biotechnology 21: 99-114.
Botstein, D., White, R. I., Skolnick, M. H. and Davis, R. W. (1980). Construction of genetic
in man using restriction fragment length polymorphisms. American Journal of Human
Genetics 32: 314-331.
Boukar, O., Kong, L., Singh, B. B., Murdock, L. and Ohm, H. W. (2004). AFLP and AFLP-
derived SCAR markers associated with Striga gesnerioides resistance in cowpea. Crop
Science 44: I 259-1264.
Carvalho, A. (1952). Taxonomia de Coffea arabica L. Caracters morfologicos do haploids.
Bragantia 12: 201-212.
Caicedo, A. L., Schaal, B. A. and Kunkel, B. N. (1999). Diversity and molecular evolution of
the RPS2 resistance gene in Arabidopsis thaliana. Proceedings o f National Academy of
Sciences o f USA 96: 302-306.
Charrier, A. and Berthaud, J. (1985). Botanical classification of coffee. In: Coffee botany,
biochemistry and production of beans and beverage. (Eds. Clifford, M. N. and Wilson,
K. C.). Croom Helm, London pp 13-47.
184

Chen, Z.. Guimaraes, L. G. and Rodrigues Jr, C. J. (2004). Pectate lyase inhibitors may condition
non-pathogenicity of Colletotrichum gloeosporioides to green coffee berries. Actas do 4°
Congresso da Sociedade Protuguesa de Fitopatologia pp 111-115.
Chen, Z., Nunes, M. A., Silva, M. C. and Rodrigues Jr, C. J (2004). Appressorium turgor
pressure of Colletotrichum kahawae might have a role in cuticle penetration. Mycologia
96: 1199-1208.
Chongo, G., Gossen, B. D. and Bernier, C. C. (2002). Infection by Colletotrichum truncatum in
resistant and susceptible lentil genotypes. Canadian Journal of Plant Pathology 24: 81-
85.
Combes. M. C., Andrzejewski, S., Anthony, F., Bertrand, B.. Rowelli, P., Graziosi, G. and
Lashermes, P. (2000). Characterization of microsatellite loci in Coffea arabica and coffee
species. Molecular Ecology 9: 1178-1180.
Coulibaly, I., Revol, B., Noirot, M„ Poncet, V., Loriex, M., Carasco-Lacombe, C., Minier, J.,
Dafour, M. and Hamon, P. (2003). AFLP and SSR polymorphism in a Coffea
interspecific backcross progeny [(C. heterocalyx x C. canephora) x C. canephora].
Theoretical and Applied Genetics 107: 1148-1155.
Crochemore, M. L., Nunes, L. M., Andrade, G. A., Molinari, H. B. C. and Vasconcellos, M. E.
(2004). Variety identification of coffee seeds by RAPD techniques. Brazilian Archives of
Biology and Technology 47: 7-11
Cros. J., Combes, M-C., Chabrillange, N., Duperray, C., Monnot des Angles, A. and Hamon, S.
(1995). Nuclear content in the subgenus Coffea (Rubiaceae): inter- and intra-specific
variation in African species. Canadian Journal of Botany 73: 14-20
Dancer. J. (1986). The evaluation of arabica coffee cultivars for resistance to coffee berry
disease: some comments. Euphytica35: 125-126.
185
Diniz, L. E. C., Sakiyama, N. S., Lashermes, P., Caixeta. E. T., Oliveiera, Zambolin, E. M.,
Loureiro, M. E., Pereira, A. A. and Zambolin, L. (2005). Analysis of AFLP markers
associated to the Mex-\ locus in Icatu progenies. Crop Breeding and Applied
Biotechnology 5: 387-393.
Esquerre-Tugay6, M. T, Mazau, D„ Barthe, J. P., Lafitte, C. and Touze, A. (1992). Mechanisms
o f resistance to Colletotrichum species. In: Bailey, J. A. and Jerger, M. J. (Eds),
Colletotrichunv, Biology, pathology and control. CABI Wallingford. UK. pp 121-133.
Farooq, S. and Azam, F. (2002). Molecular markers in plant breeding-II. Some pre-requisites
for use. Pakistan Journal o f Biological Science 5: 1141-1147.
Flor, H. H. (1971). Current status o f the gene-for-gene concept. Annual Review of
Phytopathology 9: 275-296.
Garcia, A. A. F., Benchimol, L. L., Barbosa, A. M. M. , Geraldi. I. O., Souza Jr., C. L., and
Souza, A. P. (2004). Comparison o f RAPD, RFLP, AFLP and SSR markers for diversity
studies in tropical maize inbred lines. Genetic and Molecular Biology 27: 579-588.
Gichuru, E. K. (1993) Isozyme patterns and enzyme activities of Coffea arabica L. cultivars
resistant and susceptible to coffee berry disease (Colletotrichum kahawae Waller and
Bridge: syn; Colletotrichum coffeanum Noack). MSc. Thesis, University of Nairobi, 181 p.
Gichuru, E. K., Mwang'ombe A W. And Gupta, V. K. (1996). Peroxidase activity in Coffea
arabica cultivars resistant and susceptible to coffee berry disease. African Crop Science
Journal 4: 223-232.
Gichuru. E. K. (1997). Resistance mechanisms in arabica coffee to coffee berry disease
(Colletotrichum kahawae Sp. Nov.)- A review. Kenya Coffee 62: 2441-2444.
Gichuru. E. K. and King'ori, P. N. (1999). Proteolytic enzyme activity in Coffea arabica varieties
varying in resistance to coffee berry disease. ASIC, 2-6 August, Helsinki, Finland. Paper
No. A 12 7
186
Gichuru. E. K„ King'ori, P. N. and Masaba, D. M. (1999). Histochemical differences during
infection on Coffea arabica by Colletotrichum kahawae isolates. ASIC proceedings. 2-6
August, Helsinki, Finland. Paper No. P 717.
Gichuru, E. K., Varzea, V. M. P., Rodrigues Jr., C. J. and Masaba, D. M. (2000). Vegetative
compatibility grouping o f Colletotrichum kahawae in Kenya. Journal of Phytopathology
148: 233-237.
Gichuru, E. K. (2001). Microscopic variations in susceptible and resistant infections of Coffea
arabica by Colletotrichum kahawae. ASIC proceedings 14-18 May, Trieste, Italy. Paper
No. PA 602.
Gichuru. E. K (2005). Some notes on coffee leaf rust (Hemileia vastatrix) with regard to changing
coffee production conditions in Kenya. 1st International Workshop on Durable Resistance
to Coffee Leaf Rust, 26-28 September, Viijosa, Brazil.
Griffiths E., Gibbs, J. N. and Waller, J. M. (1971). Control o f coffee berry disease. Annals of
Applied Biology 67: 45-74.
Grovet. L. and Noyer, J-L. (2003). Biochemical and molecular markers. In P. Hamon, M.
Seguin, X. Perrier and J. C. Glaszmann (Eds). Genetic diversity of cultivated tropical
plants Scientific Publishers, Inc., USA and CIRAD, France pp 1 -29.
Hale. M. I., Borland, A. M. and Wolf. K. (2005). High degree of conservation of nuclear
microsatellite loci in the genus Clusia. Genome 48: 946-950.
Hammond-Kasack, K. E. and Parker, J. E. (2003). Deciphering plant-pathogen communication:
fresh perspectives for molecular resistance breeding. Current Opinion in Biotechnology
14: 177-193.
187

Herrera. J-C. Combes, M-C., Anthony, F., Charrier, A. and Lashermes, P. (2002). Introgression
into the allotetraploid coffee (Coffea arabica L.): segregation and recombination of the C.
canephora genome in the tetraploid interspecific hybrid (C. arabica x C. canephora).
Theoretical and Applied Genetics 104: 661-668
Jeuken. M. J. W. and Lindhout, P. (2004). The development o f lettuce backcross inbred lines
(BILs) for exploitation o f the Lactuca saligna (wild lettuce) germplasm. Theoretical and
Applied Genetics 109: 394-401.
International Trade Centre, (2002). Coffee: an exporter’s guide. Geneva, 310 p
Jones, P. A. (1956). Notes on the varieties of Coffea arabica in Kenya. Coffee Board of Kenya,
Monthly Bulletin, November
Kairu, G. M. (1998). Research activities in Plant Pathology Section. Kenya Coffee 63: 2703-
2705
Karanja, A. M. (1996). Highlights of coffee production, cost of production and milling in
Kenya. Kenya Coffee 61: 2325-2329.
Kirk, P. M„ Cannon, P. F., David, J. C. and Stalpers, J. A. (Eds) (2001). Ainsworth and Bisby’s
Dictionary o f the Fungi (9,h Edition). CAB1, Wallingford, 624pp
Konieczny, A. and Ausbel, F. M. (1993). A procedure for mapping Arabidopsis mutations
using co-dominant ecotype-specific PCR based markers. Plant Journal 4: 403-410.
Krug, C. A. and Carvalho, A. (1951). The genetics of coffee. Advances in Genetics 4:127-158.
Lashermes, P., Cros, J., Marmey, P. and Charrier, A. (1993). Use of random amplified DNA
markers to analyse genetic variability and relationship in Coffea species. Genetic
Resources and Crop Evolution 40: 91-99.
Lashermes, P., Couturon, E. and Charrier, A. (1994). Doubled haploids of Coffea canephora:
development, fertility and agronomic characteristics. Euphytica 74: 149-157.
188
Lashermes, P., Combes. M. C., Cros, J., Trouslot, P., Anthony, F. and Charrier, A. (1995).
Origin and genetic diversity of Coffea arabica L. based on DNA molecular markers.
Proceedings o f 16th ASIC, Kyoto, Japan pp 528-536.
Lashermes, P., Trouslot, P.. Anthony, F., Combes, M. C., and Charrier, A. (1996). Genetic
diversity for RAPD markers between cultivated and wild accessions of Coffea arabica.
Euphytica 87: 59-64.
Lashermes, P., Combes. M. C., Robert. J., Trouslot. P., Hont, A. D., F Anthony, F. and Charrier,
A. (1999). Molecular characterization and origin o f the Coffea arabica L. genome.
Molecular and General Genetics 261: 259-266
Lashermes, P., Andrzejewski, S., Bertrand. B., Combes, M. C., Dusert. S., Graziosi, G., Trouslot,
P. and Anthony, F. (2000a). Molecular analysis o f introgressive breeding in coffee
{Coffea arabica L.) Theoretical and Applied Genetics 100: 139-146.
Lashermes, P., Paczek, V., Trouslot, P., Combes, M-C. Couturon, E. and Charrier, A. (2000b).
Single-locus inheritance in the allotetraploid Coffea arabica L. and interspecific hybrid
C. arabica x C. canephora. Journal of Heredity 91: 81-85.
Lashermes P„ Combes, M. C., Prakash, N. S., Trouslot, P., Lorieux, M. and Charrier, A. (2001).
Genetic linkage map of Coffea canephora: effect of segregation distortion and analysis of
recombination rate in male and female meioses. Genome 44: 589-596.
Li, Y-C., Korol, A. B., Fahima, T., Beiles, A. And Nevo, E. (2002). Microsatellites: genomic
distribution, putative functions and mutational mechanisms: a review. Molecular Ecology
11:2453-2465.
Lolle, S. J., Victor, J. L., Young, J. M. and Pruitt, R. E. (2005). Genome-wide non-mendelian
inheritance o f extra-genomic information in Arabidopsis. Nature 434: 505-509.
189

Nlasaba, D. M. and van der Vossen, H. A. M (1982). Evidence of cork barrier formation as a
resistance mechanism to coffee berry disease (Colletotrichum coffeanum) in Arabica
coffee. Netherlands Journal of Plant Pathology 88: 19-22.
Masaba, D. M. and Waller, J. M. (1992). Coffee Berry Disease: The current status. In: Bailey, J.
A. and Jerger, M. J. (Eds), Colletotrichum; Biology, pathology and control. CABI
Wallingford. UK. pp 237-249.
Masumbuko, L. I., Bryngelsson, T., Mneney, E. E. And Salomon, B. (2003). Genetic diversity
in Tanzania Arabica coffee using random amplified polymorphic DNA (RAPD) markers.
Hereditas 139: 56-63.
Masumbuko, L. 1. and Bryngelsson, T. (2005). Inter simple sequence repeat (ISSR) analysis
of diploid coffee species and cultivated Coffea arabica L. from Tanzania. Genetic
Resources and crop Evolution. 00:1-10
Matsuoka, Y., Mitchell, S. E., Kresovich, S., Goodman, M. and Doebley, J. (2002).
Microsatellites in Zea-variability, patterns of mutations, and use for evolutionary studies.
Theoretical and Applied Genetics 104: 436-450.
Maughan, P. J., Saghai-Maroof, M. A., Buss, G. R. and Huestis, G. M. (1996). Amplified
fragment length polymorphism (AFLP) in soybean: species diversity, inheritance and
near-isogenic line analysis. Theoretical and Applied Genetics 93: 392-401.
McDowell, J. M. and Woffenden, B. J. (2003). Plant disease resistance genes: recent insights
and potential applications. Trends in Biotechnology 21: 178-183.
Michelmore, R. W. (2003). The impact zone: genomics and breeding for durable disease
resistance. Current Opinion in Plant Biology 6: 397-404.
Moncada, P. and McCouch, S. (2004). Simple sequence repeats diversity in diploid and
tetraploid Coffea species. Genome 47: 501-509.
190

Mueller. U. G. and Wolfenbarger, L. L. (1999). AFLP genotyping and Fingerprinting. TREE
14: 389-394.
Mulinge, S.K.. (1970). Development of coffee berry disease in relation to the stage of berry growth.
Annals of Applied Biology 65: 269-276.
Nikaido, A., Yoshimaru, H., Tsumura, Y. Suyama, Y., Murai. M. and Nagasaka. K. (1999).
Segregation distorting for AFLP markers in Cryptomeria japonica. Genes and Genetic
Systems 74: 55-59.
Noir, S., Combes, M. C., Anthony, F. and Lashermes, P. (2001). Origin, diversity and evolution
of NBS disease-resistance gene homologues in coffee trees (Coffea L.). Molecular
and General Genetics 265: 654-662
Noir, S., Anthony, F., Bertrand, B., Combes, M. C., and Lashermes, P. (2003). Identification
of a major gene (Mex-1) from Coffea canephora conferring resistance to Meloidogyne
exigua in Coffea arabica. Plant Pathology 52: 97-103.
Noir, S., Patheyron, S., Combes, M-C., Lashermes, P. and Chalhoub, B. (2004). Construction and
characterisation of a BAC library for genome analysis o f the allotetraploid coffee species
{Coffea arabica L.). Theoretical and Applied Genetics 109: 225-230.
Nutman. F.J. and F.M. Roberts (1960). Investigations on a disease of Coffea arabica caused by a
form of Colletotrichum coffeanum. I. Some factors affecting germination and infection and
their relation to disease distribution. Transactions of the British Mycological Society 43:
643-659.
Nyange, N.E., Williamson, B., McNicol, R. J., Lyon, G. D. and Hackett, C. A. (1995). In vitro
selection o f Coffea arabica callus for resistance to partially purified phytotoxic culture
filtrates from Colletotrichum kahawae. Annals of Applied Biology 127: 425-439.
191
Nyange, N.E., Williamson, B., Lyon, G. D„ McNicol, R. J., and Conolly, T. (1997). Responses
o f cells and protoplasts o f Coffea arabica genotypes to partially purified culture filtrates
produced by Colletotrichum kahawae. Plant Cell Reports 16: 763-769.
Nyoro. J. K. and Sprey, L. H. (1986). Introducing Ruiru 11 to estates and smallholders. Kenya
Coffee 51: 7-28.
Olsen, K. M. and Schaal, B. A. (2003) Microsatellite variation in cassava (Manihot esculenta,
Euphorbiaceae) and its wild relatives: Further evidence for a southern Amazon origin of
domestication. American Journal o f Botany 88: 131-142.
Omondi, C. O. (1994). Resistance to Coffee Berry Disease in Arabica Coffee Variety ‘Ruiru 11'.
Plant Breeding 112: 256-259.
Omondi, C O, Ayiecho, P O, Mwang’ombe, A W and H Hindorf, H (2000). Reaction of some
Coffea arabica genotypes to strains of Colletotrichum kahawae, the causal agent of
coffee berry disease. Journal of Phytopathology 148: 61-63.
Omondi, C. O., Ayiecho, P. O., Mwang’ombe, A. W. and Hindorf, H. (2001). Resistance of
Coffea arabica cv Ruiru 11 tested with different isolates o f Colletotrichum kahawae, the
causal agent o f coffee berry disease. Euphytica 121: 19-24
Orita, M, Iwahana, I, Kanazawa, H, Hayashi, K and Sekiya, T (1989). Detection of
polymorphisms of human DNA by gel electrophoresis as single-strand conformation
polymorphisms. Proceedings of National Academy o f Sciences of USA 86: 2766-2770.
Orozco-Castillo, C., Charlmers, K. J., Waugh, R. and Powell, W. (1994). Detection of genetic
diversity and selective introgression in coffee using RAPD markers. Theoretical and
Applied Genetics. 87: 934-940.
Osorio, N. (2002). The global coffee crisis: a threat to sustainable development. ICO, London.
192

Owour. J. B. O. and Agwanda, C. O. (1990). Comparison of the sensitivity of the mean and the
mode in screening for resistance to coffee berry disease (Colletotrichum coffeanum
Noack sensu Hindorf) (A short communication). Euphytica 45: 247- 250.
Paillard. M., Lashermes, P. and Petiard, V. (1996). Construction of a molecular linkage map
in coffee. Theoretical and Applied Genetics 93: 41-47.
Paran. I. and Michelmore. R. W. (1993). Development of reliable PCR-based markers linked
to downy mildew resistance genes in lettuce. Theoretical and Applied Genetics 85: 984-
993.
Pare, S. (2002). Experiences du commerce equitable du caf<5 Recherche et cafeiculture, (Ed M
Harvelaar), Cirad-CP. Montpellier, France pp 22-29.
Parlevliet J. E. (2002). Durability of resistance against, bacterial and viral pathogens; present
situation. Euphytica 124: 147-156.
Pearl, H. M„ Nagai, C., Moore, P. M., Steiger, D. L., Osgood, R. V. and Ming, R. (2004).
Construction o f a genetic map for arabica coffee. Theoretical and Applied Genetics 108:
829-835.
Pereira. A. A., Sakiyama, N. S., Zambolin, L. Moura, W. M., Zambolin, E. and Caixeta, E. T.
(2005). Identification and use of sources of durable resistance to coffee leaf rust in the
UFV/EPAMIG breeding programme. In: Zambolin, L., Zambolin. E. and Varzea, V.
(Eds), Durable resistance to coffee leaf rust. Universidade Federal de Vi90sa, Brazil, pp
215-232.
Poncet V., Hamon, P., Minier, J., Carasco, C., Hamon, S., and Noirot, M. (2004). SSR cross
amplification and variation within coffee trees (Coffea spp.). Genome 47: 1071-1081
Poncet V., Hamon, P., Sauvage de Saint Marc, M. B„ Bernard. T.. Hamon, S. and Noirot M.
(2005). Base composition of Coffea AFLP sequences and their conservation within the
genus. Journal o f Heredity 96: 59-65.
193
Prakash, N. S., Combes. M. C., Somanna, N. and Lashermes. P. (2002). AFLP analysis of
introgression in coffee cultivars (Coffea arabica L.) derived from a natural interspecific
hybrid. Euphytica 124: 265-271.
Prakash, N. S., Marques. D. V., Varzea, V. M. P., Silva, M. C., Combes, M. C. and Lashermes,
P. (2004). Introgressive molecular analysis o f a leaf rust resistance gene from Coffea
liberica into C. arabica L. Theoretical and Applied Genetics 109: 1311-1317.
Rafalski, J. A., Vogel, J. M., Morgante, M., Powell, W. Andre, C. and Tingey, S. V. (1996).
Generating and using DNA markers in Plants. In: Non-mammalian genomic analysis:
A practical guide (Biren, B. and Lai, E., Eds), Academic Press Inc. New York p 75-134.
Raina. S. N„ Mukai, Y. and Yamamoto, M. (1998). In situ hybridization identifies the diploid
progenitors o f Coffea arabica (Rubiaceae). Theoretical and Applied Genetics 97: 1204-
1209.
Rayner, R.W. (1952). Coffee Berry Disease, a survey of investigations carried up to 1950. East
African Agricultural and Forestry Journal 17: 130-158.
Riesenbierg, L H, Baird, S. J. E. and Gardner, K. A. (2000). Flybridization, introgression and
linkage evolution. Plant Molecular Biology 42: 205-224.
Robinson, J. P. and Harris, S. A. (1999). Which DNA Marker for Which Purpose? Chapter
12 in: Final Compendium of the Research Project Development: optimisation and
validation o f molecular tools for assessment of biodiversity in forest trees in the
European Union DGXII Biotechnology FW IV Research Programme Molecular Tools for
Biodiversity. Gil let, E.M. (ed.). URL/http://webdoc.sub.gwdg.de/ebook/y/1999/which
marker/index.htm
Rodrigues Jr, C. J., Varzea, V. M. P., Hindorf, H. and Medeiros, E. F. (1991). Strains of
Colletotrichum coffeanum Noack causing coffee berry disease in Angola and Malawi
194

with characteristics different to the Kenyan strain. Journal of Phytopathology 131: 205-
209.
Rodrigues Jr, C. J., Varzea, V. M. P. and Medeiros, E. F. (1992). Evidence for the existence of
physiological races of Colletotrichum coffeanum Noack sensu Hindorf. Kenya Coffee 57:
1417-1420.
Rodrigues Jr, C. J., Varzea, V. M. P. and Silva, M. C. (1999). Research and creation of coffee
varieties with resistance to coffee berry disease. 4th Annual report Project TS3-CT94-
0307, CIRAD, France.
Rodrigues Jr. C. J, Varzea V, Silva M. C., Guerra-Guimanies L., Rocheta M., Marques D. V.
(2000) Recent advances on coffee leaf rust. In: Proceedings of the International Scientific
Symposium on Coffee, Bangalore, India, pp. 179-193.
Saliba-Colombani, V., Causse, M., Gervais, L. and Philouze, J. (2000). Efficiency of RFLP,
RAPD and AFLP markers for the construction of an interspecific map o f the tomato
genome. Genome 43: 29-40.
Sambrook, J., Fritsch, E. F. and Manitanis, T. (1989). Molecular cloning techniques: a
laboratory manual, 2nd edition, Cold Spring Habour Laboratory Press, New York.
Schmidt, T. and Heslop-Harrison, J. S. (1996). The physical and genomic organisation of
microsatellites in sugar beet. Proceedings of the National Academy of Sciences, USA
93: 8761-8765.
Schneider, K. (2005). Mapping populations and principles o f genetic mapping. In: The
Handbook o f Plant Genome Mapping. Genetic and Physical Mapping (Eds. K. Meksem
and G. Kahl) Wiley-VCH Gmbh & Co. Weinhem, Germany. Pp 4-21.
Shan, X., Blake, T. K. and Talbert, L. E. (1999). Conversion of AFLP markers to sequence
specific PCR markers in barley and wheat. Theoretical and Applied Genetics 98: 1072-
1078.
195

Silva. M. C., Varzea, V.. Guerra-Guimaraes L.. Azinheira, H. G., Fernandez. D., Petitot. A-S,
Bertrand, B., Lashermes, P. and Nicole, M.(2006). Brazilian Journal of Plant Physiology
18: 119-147.
Stansfield, W. D. (1986). Theory and problems of genetics. McGraw-Hill Book Company, New
York.
Steel, R. G. D. and Torrie, J. H. (1981). Principles and procedures of statistics: A biometric
approach (2nd Edition). McGraw-Hill Book Inc. Auckland
Steiger. D. L., Nagai, C., Moore, P. H., Morden, C. W„ Osgood, R. V. and Ming, R. (2002).
AFLP analysis o f genetic diversity within and among Coffea arabica cultivars.
Theoretical and Applied Genetics. 105: 209-215.
Tanksley. S. D. and McCouch, S. R. (1997). Seed banks and molecular maps: unlocking genetic
potential from the wild. Science 277: 1063-1066.
Van der Graaff, N. A. (1978). Selection for resistance to coffee berry disease in arabica coffee in
Ethiopia. Evaluation of selection methods. Netherlands Journal o f Plant Pathology 84:
205-215.
Van der Graaff, N. A. (1982). The principles of scaling and the inheritance of the coffee berry
disease in Coffea arabica. Euphytica 31: 735-740.
Van der Vossen, H. A. M., Cook, R. T. A. and Murakaru, G. N. W. (1976). Breeding for
resistance to coffee berry disease caused by Colletotrichum coffeanum Noack Sensu
Hindorf in Coffea arabica L. I. Methods of preselection for resistance. Euphytica 25:
733-756.
Van der Vossen, H. A. M. and Waweru, J. M. (1976). A temperature controlled inoculation room
to increase the efficiency of preselection for resistance to coffee berry disease. Kenya
Coffee (May): 164-167.
196
Van der Vossen. H. A. M. and Walyaro, D. J. (1980). Breeding for resistance to coffee berry
disease in Coffea arabica L. Inheritance of the resistance. Euphytica 29:777-791.
Van der Vossen. H. A. M. and Walyaro, D. J. (1981). The coffee breeding programme in Kenya:
A review o f progress made since 1971 and plan of action for the coming years. Kenya
Coffee 46: 113-130.
Van der Vossen, H. A. M. (2006). State-of-Art of developing Arabica coffee cultivars with
durable resistance to coffee berry disease (Colletotrichum kahawae).ASIC Proceedings
11-15 September, Montpellier, France pp 794-801.
Varzea, V. M. and Marques, D (2005). Population variability o f Hemileia vastatrix vs. coffee
durable resistance. In: Zambolin, L., Zambolin, E. and Varzea, V. (Eds), Durable
resistance to coffee leaf rust. Universidade Federal de Vifjosa, Brazil, pp 53-74
Von Korff, M., Wang, H., Leon, J. and Pillen, K. (2004). Development o f candidate
introgression lines using exotic barley accession (Hordeum vulgare ssp spontaneum) as
donor. Theoretical and Applied Genetics 109: 1736-1745.
Vos, P., Hogers, R., Bleeker, M., Reijans, M., van der Lee, T., Homes, M., Frijters, A., Pot, J.,
Peleman, J., Kuiper, M. and M Zabeau (1995). AFLP: a new technique for DNA
fingerprinting. Nucleic Acids Research 23: 4407-4417.
Waller, J. M. (1971). The incidence of climatic conditions favourable to coffee berry disease in
Kenya. Experimental Agriculture 7: 303-314.
Waller, J. M.. Bridge. P. D.., Black. R. L. and Hakiza, G. (1993). Differentiation of the coffee
berry disease pathogen. Mycological Research 97: 989-994.
Walyaro, D. J. (1983). Considerations in breeding for improved yield and quality in arabica
coffee (Coffea arabica L.). PhD Thesis, University o f Wageningen, Netherlands.
197

Walyaro, D. J., van der Vossen, H. A. M., Owuor, J. B. O. and Masaba, D. M. (1984). New
varieties to combat old problems in Arabica coffee production in Kenya. In:
Hawksworth. D. L. (Ed) Advancing agricultural production in Kenya. Commonwealth
Agricultural Bureau, Wallingford, UK pp 146-151.
Wang. X., Lai, J., Liu, G. and Chen, F. (2002). Development o f a SCAR marker for the Phi
locus in common wheat and its application. Crop Science 42: 1365-1368.
Wang, Y., Reighard, G. L., Layne, D. R., Abbot, A. G. and Huang, H. (2005). Inheritance of
AFLP markers and their use for genetic diversity analysis in wild and domesticated
pawpaw Asimina triloba (L.) Dunal]. Journal of American Society o f Horticultural
Science 130: 561-568.
Weiland, J. J. and Yu, M.H. (2003). A cleaved amplified polymorphic sequence (CAPS) marker
associated with root knot nematode resistance in sugar beet. Crop Science 43: 1814-1818.
Welsh, J. and McClelland, M. (1990). Fingerprinting genomes using PCR with arbitrary primers.
Nucleic Acids Research 18: 7213-7218.
Williams, J. G. K., Kubelik, A. R., Livak, K. J., Rafalski, J. A. and Tingey, S. V. (1990). DNA
polymorphisms amplified by arbitrary primers are useful as genetic markers. Nucleic
Acids Research 18: 6531-6535.
Wrigley, G. (1988). Coffee. Longhorn Scientific and Technical, New York. 639 p
Yang, W., Weaver, D. B., Nielsen. B. L. and Qiu, J. (2000). A preliminary linkage map of
soybean using an intraspecific cross of two cultivars: ‘Pekin' and ‘Lee’. Soybean Gen.
Newsletter 27 (Online Journal) http://www.soygenetics.org/articles/sgn2000-019.htm.
Zamir, D. (2001). Improving plant breeding with exotic genetic libraries. Nature
Reviews|Genetics 2:983-989
Zhang, Y. and Stommel, J. R. (2001). Development of SCAR and CAPS markers linked to the
Beta gene in tomato. Crop Science 41: 1602-1608.
198

9. APPENDICES
Appendix 1. Sketch diagrams o f the scoring system (Classes I to 12) of coffee seedling hypocotyls after inoculation with C. kahawae as described by van der Vossen et al. (1976).(Source: Wrigley, 1988).
Novisiblesym ptom s
R
A fewscablesions
Small scab o r tiny brow n lesions
R
Scab orbrownlesions
R
8
Scab andbrow nlesionsand a fewsmallblacklesions
M R
Brownandnarrowblacklesions
MR
N arrowblacklesionssom e> 1 cmlong
MS
Black lesions becoming wider andstartingtocoalesce
MS
Largecoalescingblacklesions but not yet com plete girdling
11c/s
12c/s
Large coalescing black lesions com plete girdling of stem
M ost ofth e stemaffected> VS stemshrivelledseedlingdead
Whole stem afffected and shrivellec seedling dead
Key: R: Resistant: MR: Medium resistant; MS: Medium resistant, S: Susceptible c/s: cross section
199

Appendix 2: Genetic linkage groups in an introgressed C. arabica line, based on analysis of a F2 population of a cross between cv Sarchimor line T5296 and a wild Ethiopian C. arabica collection (ET6) as mapped by Ansaldi (2003).
T10 —rr-A R .p .83
17-
30.9 -
48.7 -
56.7 -
Sal-32
-AFLP-24
- AFIP-35
- AFLP-8
E10—
1ft Q__
— AFLP-1
__AFLP-5610,3 —
27.9 — — sat-32
-sat-172
- sat-207’-AFLP-58
- AFLP-46
-AFLP-74 •• AFLP-72
■ *■ AFLP-505/tftNAFLP-66
AFLP-54 ‘ AFLP-70 AFLP-88 AFLP-48 AFLP-42 AFLP-2
T3-AFLP-9 -AFLP-12
^ < ^ AFLP-29AFLP-23 sat-1f AFLP-39
193/ AFIP-31
AFLP-11AFLP-14AFLP-17AFLP-19AFLP-20AFLP-13AFLP-15
T5- AFLP-25
AFLP-100
sat-1*AFLP-3AFLP-44AFLP-52AFLP-112
E40 — p|— AFLP-641,1—11— AFLP-96
AFLP-94AFLP-78AFLP-108AFLP-76
MB. Linkage groups T1 to T5 are the introgressed C. canephora chromosomal fragments while groups El to E6 are C. arabica chromosome segments. Where the numbers correspond between the T and E fragments, they are homologous.
200
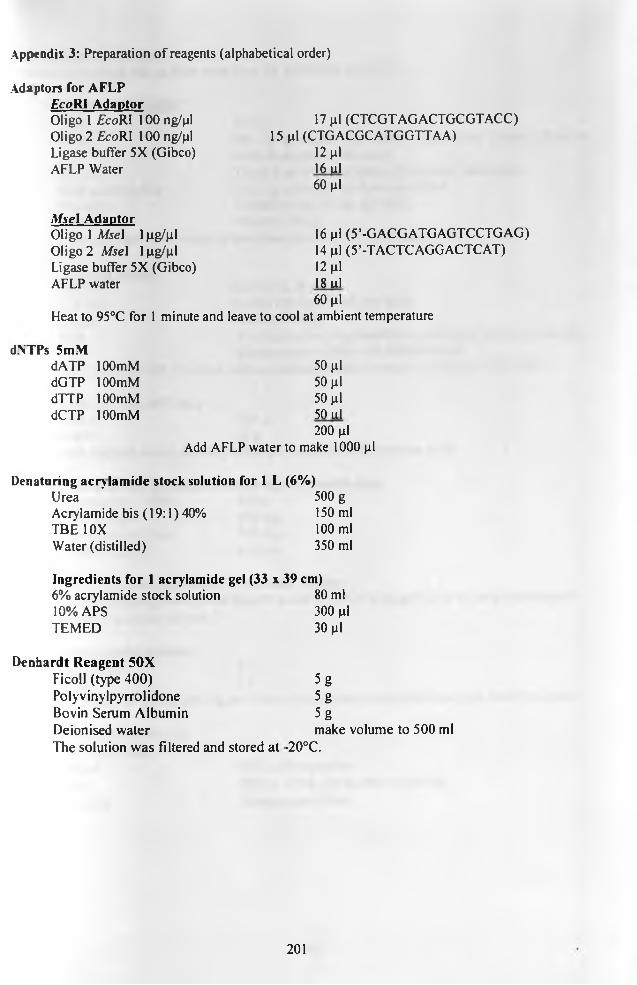
Appendix 3: Preparation of reagents (alphabetical order)
Adaptors for AFLPEcoRI AdaptorOligo 1 £coRI 100 ng/pl 17 pi (CTCGTAGACTGCGTACC)01igo2£coRI 100 ng/pl 15 pi (CTGACGCATGGTTAA)Ligase buffer 5X (Gibco) 12 piAFLP Water 16 ul
60 pi
MseI AdaptorOligo 1 Msel lpg/pl 16 pi (5’-GACGATGAGTCCTGAG)Oligo2 Msel lpg/pl 14 pi (5’-TACTCAGGACTCAT)Ligase buffer 5X (Gibco) 12 piAFLP water 18 ul
60 piHeat to 95°C for 1 minute and leave to cool at ambient temperature
d.NTPs 5mMdATP lOOmM 50 pidGTP lOOmM 50 pidTTP lOOmM 50 pidCTP lOOmM 50 ul
200 piAdd AFLP water to make 1000 pi
Denaturing acry lamide stock solution for 1 L (6%)Urea 500 gAcrylamide bis (19:1) 40% 150 mlTBE 10X 100 mlWater (distilled) 350 ml
Ingredients for 1 acrylamide gel (33 x 39 cm)6% acrylamide stock solution 80 ml10% APS 300 piTEMED 30 pi
Denhardt Reagent 50XFicoll (type 400)Polyvinylpyrrolidone Bovin Serum Albumin Deionised waterThe solution was filtered and stored at
5g5g5gmake volume to 500 ml
■20°C.
201

DNA Extraction buffers(Before extraction, the buffers were kept for 20-30min at 62 °C).
(i) Extraction buffer*NaCl 8.77 gMatab 2% (2 g, added just before extraction) (Mixed
methylammonium Bromide)Sarcosil 3% (9.5 ml of 5% solution) (N-Lauroyl-Sarcosine)Sodium bisulphite 1%(1 g, added just before extraction)Tris HC1 0.20M (20 ml of 1 M, pH=8.0)EDTA 40mM (1.49 g)* The solution was viscous. It was dissolved at 40°C and stored at 4 °C
Alkyltri-
(ii) Lysis bufferSorbitolTris-HClEDTAPVP
NB: Addition of 0.1% active
0.35M (6.38 g)0.20M (20 ml of 1 M, pH=8.0)40mM (1.49 g)2% (2g) (polyvinyl pyrrolidone, added just before extraction) Volume up to 100ml with distilled water
carbon charcoal helped to reduce off colour of the DNA.
EDTA 0.5M pH 8 at 25°C (1L)EDTA 186 gNaOH 20 gAdd distilled water, dissolve, adjust pH and adjust final volume to 2L
Formamide Blue (for loading in denaturing acrylamide gels)Formamide 98% 49 mlEDTAlOmM 186 mgBromophenol Blue 125 mgXylene cyanol a pinch
KPB pH 6.5, 0.5 mM (Potassium Phosphate Buffer)Dissolve enough weights o f KH2PO4 and K2HPO4 to make 0.5M of each in deionized water and adjust pH to 6.5
LB medium (Luria-Bertani)LB premix 25 gWater ILTo make LB plates, add 15g per litre to the mix above, autoclave and pour into 9 cm plates
LICOR loading buffer 2XFor 50 ml of the stain
49 ml 1 ml A pinch
98% o f FormamideEDTA 0.5M, pH 8 (lOmM EDTA)Bromophenol blue
202
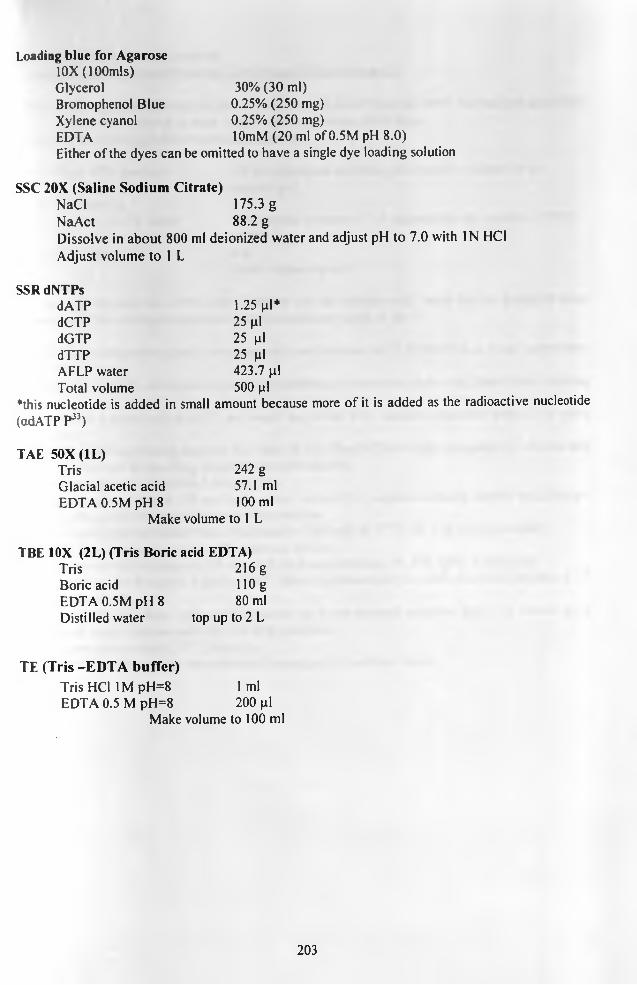
Loading blue for Agarose10X (lOOmls) GlycerolBromophenol Blue Xylene cyanol
30% (30 ml) 0.25% (250 mg) 0.25% (250 mg)
EDTA 10mM (20 ml of 0.5M pH 8.0)Either of the dyes can be omitted to have a single dye loading solution
SSC 20X (Saline Sodium Citrate)NaCI 175.3 gNaAct 88.2 gDissolve in about 800 ml deionized water and adjust pH to 7.0 with IN HC1 Adjust volume to 1 L
SSR dNTPsdATPdCTPdGTPdTTPAFLP water
1.25 pi* 25 pi 25 pi 25 pi 423.7 pi
Total volume 500 pi♦this nucleotide is added in small amount because more of it is added as the radioactive nucleotide (adATP P33)
TAE SOX (1L)TrisGlacial acetic acid
242 g 57.1 ml
EDTA 0.5M pH 8 100 mlMake volume to 1 L
TBE 10X (2L) (Tris Boric acid EDTA)Tris 216 gBoric acid 110 gEDTA 0.5M pH 8 Distilled water
80 ml top up to 2 L
TF. (Tris-ED TA buffer)Tris HC1 1M pH=8 EDTA 0.5 M pH=8
1 ml 200 pi
Make volume to 100 ml
203

Appendix 4 : DNA Cloning ProtocolAdopted from manufacturer’s manual (Invitroeen Life technologies')
(i) Remove the required number of vials of the competent cell from the -80°C freezer and place themin ice to thaw. Never at room temperature and do not shake them.
(ii) Prepare the cloning/ligation reaction as follows:-
■ Fresh PCR product
• Salt solution■ Sterile (AFLP) water
• TOPO® vector
0.5-4 pi (estimate according to intensity of bands in the agarose gel)1 piadd to make volume to 5 pi (depends on the volume of PCR added)1 piTotal volume is 6pl
NB: store all reagents at -20°C when finished but salt solution and water can be stored at room temperature. The cloning reaction mix may be stored overnight at -20 °C
(iii) Mix the reaction mix gently (by gentle stir) and incubate for 5 MINUTES at room temperature(22-23 °C)(iv) Place the reaction on ice and proceed to transforming competent cells (which have been thawingin ice).(v) Equilibrate a water bath at 42 °C and warm the vial of SOC medium (provided with kit) to room temperature(vi) Add 2 pi of the cloning reaction into vials of One Shot® Chemically competent E coli and mix gently. Do not mix by pipetting up and down (Stir slightly)(vii) Incubate the mix on ice for 5-30 min (15)(viii) Heat shock the cells for 30 sec in the water bath at 42 °C and immediately transfer back into ice(ix) Add 250pl of the room temperature SOC medium(x) Cap tubes lightly and shake them horizontally (200rpm) at 37 °C for 1 hr (do not exceed)(xi) While this is on-going, prepare the plates as follows:(a) Warm pre-selection plates for 30 min (LB medium containing 50-100 pg/ml ampicillin)(b) Spread 40 pi of 40mg/ml X-gal in DMF (dimethylformamide) on each plate and incubate at 37 °C until ready to use(xii) Spread 10-50pl from each transformation on a pre-warmed selective plate. To ensure good spreading of small volumes, add 20 pi of SOC medium(xiii) Incubate the plates at 37 °C overnight.(xiv) Pick 5-10 white or light blue colonies for analysis of positive clones
204

Appendix 5: Extracting plasmid DNA from transformed bacteriaAdopted from manufacturer's manual (QIAprep® spin miniprep kit using Micro-centrifuge)
(i) Transfer 1800 pi (2x900 pi) of the culture broth into 2ml tubes. Centrifuge at 8000 rpm for 5 min to obtain bacterial clot. Discard the supernatant and add the same quantity again and repeat the centrifugation(ii) Re-suspend the pelleted bacterial cells in 250 pi buffer PI (stored in refrigerator). Ensure that RNase A has been added to buffer PI. Vortex to mix completely so that no clumps are visible.(iii) Add 250pl of buffer P2 and immediately gently invert the tubes 4-6 times. Do not vortex. You can invert more times if necessary. Do not allow the lysis reaction to proceed for more than 5min.(iv) Add 350pL of buffer N3 and invert the tube immediately but gently 4-6 times. To avoid localized precipitation, mix the solution gently but thoroughly immediately after addition of buffer. NB. The solution should become cloudy.(v) Centrifuge for 10 min at 13,000 rpm (~17,900xg) in a conventional table-top micro-centrifuge. A compact white pellet will form(vi) Apply the supernatants from step (v) to the QIAprep spin column by decanting or pipetting and centrifuge for 30-60 sec. and discard the flow through.Optional:- Wash the QIAprep spin column by adding 0.5 ml buffer PB and centrifuging for 30-60 s and discard the flow through.(vii) Wash QIAprep spin column by adding 0.75 ml Buffer PE and centrifuging for 30-60 s(viii) Discard the flow through, and centrifuge for an additional lmin to remove residual wash buffer. Note: the residual wash buffer will not be completely removed unless the flow-through is removed. Residual ethanol in the buffer will inhibit subsequent enzymatic reactions.(Lx) Place the QIAprep column in a clean 1.5 ml micro-centrifuge tube. To elute DNA, add 50 pi Buffer EB (lOmM Tris-HCl, pH8.5) or water to the centre of each QIAprep spin column, let stand for 5 min, and centrifuge for 1 min. The pure plasmid DNA is now in the flow-through.
Appendix 6: Labelling of hybridization probesAdopted from manufacturer’s manual (Megaprime™ DNA labelling Systems: RPN 1604- Amersham Biosciences)
1. Dissolve the DNA to be labelled to a concentration of 25 ng/pl in distilled water2. Thaw the required solutions of Megaprime system except the enzyme from -20 °C to
room temperature, and return them immediately after use3. Place 25ng o f template DNA into reaction tube (0.5 ml) and 5pl o f the primers followed
by enough water to make the volume 50 pi. Denature by heating to 95-100 °C for 5minutes in a boiling water-bath or incubator
4. Spin briefly in a micro-centrifuge to bring the contents to the bottom of the tube5. Keeping the tubes at room temperature, add 4pl of each of the unlabelled nucleotide, 5
pi of reaction buffer (RPN 1604/5) followed by 5pl o f the radio-labelled dNTP (dCTP) and enzyme (2 pi)
6. Mix gently by pipetting up and down7. Incubate at 37 °C for 10 min8. Denature the labelled DNA by heating to 95-100 °C for 5 min and chill on ice until when
added into the hybridization tubes
205
Related Documents