Int. J. Environ. Res. Public Health 2015, 12, 1651-1666; doi:10.3390/ijerph120201651 International Journal of Environmental Research and Public Health ISSN 1660-4601 www.mdpi.com/journal/ijerph Article Characterization of Extremely Low Frequency Magnetic Fields from Diesel, Gasoline and Hybrid Cars under Controlled Conditions Ronen Hareuveny 1 , Madhuri Sudan 2, *, Malka N. Halgamuge 3 , Yoav Yaffe 1 , Yuval Tzabari 4 , Daniel Namir 4 and Leeka Kheifets 2 1 Radiation Protection Department, Soreq NRC, Yavne 81800, Israel; E-Mails: [email protected] (R.H.); [email protected] (Y.Y.) 2 Department of Epidemiology, UCLA School of Public Health, University of California (UCLA), Los Angeles, CA 90024, USA; E-Mail: [email protected] 3 Department of Electrical and Electronic Engineering, The University of Melbourne, Parkville VIC-3010, Australia; E-Mail: [email protected] 4 Rehovot Center for Gifted Children, Rehovot, Israel; E-Mails: [email protected] (Y.T.); [email protected] (D.N.) * Author to whom correspondence should be addressed; E-Mail: [email protected]; Tel.: +1-310-825-6950; Fax: +1-310-206-6039. Academic Editor: Martin Röösli Received: 29 December 2014 / Accepted: 23 January 2015 / Published: 30 January 2015 Abstract: This study characterizes extremely low frequency (ELF) magnetic field (MF) levels in 10 car models. Extensive measurements were conducted in three diesel, four gasoline, and three hybrid cars, under similar controlled conditions and negligible background fields. Averaged over all four seats under various driving scenarios the fields were lowest in diesel cars (0.02 μT), higher for gasoline (0.04–0.05 μT) and highest in hybrids (0.6–0.9 μT), but all were in-line with daily exposures from other sources. Hybrid cars had the highest mean and 95th percentile MF levels, and an especially large percentage of measurements above 0.2 μT. These parameters were also higher for moving conditions compared to standing while idling or revving at 2500 RPM and higher still at 80 km/h compared to 40 km/h. Fields in non-hybrid cars were higher at the front seats, while in hybrid cars they were higher at the back seats, particularly the back right seat where 16%–69% of measurements were greater than 0.2 μT. As our results do not include low OPEN ACCESS

Welcome message from author
This document is posted to help you gain knowledge. Please leave a comment to let me know what you think about it! Share it to your friends and learn new things together.
Transcript
Int. J. Environ. Res. Public Health 2015, 12, 1651-1666; doi:10.3390/ijerph120201651
International Journal of Environmental Research and
Public Health ISSN 1660-4601
www.mdpi.com/journal/ijerph
Article
Characterization of Extremely Low Frequency Magnetic Fields from Diesel, Gasoline and Hybrid Cars under Controlled Conditions
Ronen Hareuveny 1, Madhuri Sudan 2,*, Malka N. Halgamuge 3, Yoav Yaffe 1, Yuval Tzabari 4,
Daniel Namir 4 and Leeka Kheifets 2
1 Radiation Protection Department, Soreq NRC, Yavne 81800, Israel;
E-Mails: [email protected] (R.H.); [email protected] (Y.Y.) 2 Department of Epidemiology, UCLA School of Public Health, University of California (UCLA),
Los Angeles, CA 90024, USA; E-Mail: [email protected] 3 Department of Electrical and Electronic Engineering, The University of Melbourne,
Parkville VIC-3010, Australia; E-Mail: [email protected] 4 Rehovot Center for Gifted Children, Rehovot, Israel;
E-Mails: [email protected] (Y.T.); [email protected] (D.N.)
* Author to whom correspondence should be addressed; E-Mail: [email protected];
Tel.: +1-310-825-6950; Fax: +1-310-206-6039.
Academic Editor: Martin Röösli
Received: 29 December 2014 / Accepted: 23 January 2015 / Published: 30 January 2015
Abstract: This study characterizes extremely low frequency (ELF) magnetic field (MF)
levels in 10 car models. Extensive measurements were conducted in three diesel, four
gasoline, and three hybrid cars, under similar controlled conditions and negligible
background fields. Averaged over all four seats under various driving scenarios the fields
were lowest in diesel cars (0.02 μT), higher for gasoline (0.04–0.05 μT) and highest in
hybrids (0.6–0.9 μT), but all were in-line with daily exposures from other sources. Hybrid
cars had the highest mean and 95th percentile MF levels, and an especially large percentage
of measurements above 0.2 μT. These parameters were also higher for moving conditions
compared to standing while idling or revving at 2500 RPM and higher still at
80 km/h compared to 40 km/h. Fields in non-hybrid cars were higher at the front seats, while
in hybrid cars they were higher at the back seats, particularly the back right seat where
16%–69% of measurements were greater than 0.2 μT. As our results do not include low
OPEN ACCESS

Int. J. Environ. Res. Public Health 2015, 12 1652
frequency fields (below 30 Hz) that might be generated by tire rotation, we suggest that net
currents flowing through the cars’ metallic chassis may be a possible source of MF. Larger
surveys in standardized and well-described settings should be conducted with different types
of vehicles and with spectral analysis of fields including lower frequencies due to
magnetization of tires.
Keywords: EMF; ELF; magnetic fields; cars; transportation; hybrid
1. Introduction
The transportation system is a possible source of extremely low frequency (ELF) electric and
magnetic fields (MF), to which a large proportion of the population is exposed [1,2]. The health effects
of MF exposure from transportation systems remain unclear, but there has been some public concern
about the MF exposure level from new transportation technologies such as gasoline-electric hybrid
automobiles, which are becoming increasingly popular throughout the world. Scientists and policy
makers agree that hybrid vehicles are good for the planet. However, some concerns about the potential
health risks posed by MF from hybrid cars have been raised [3].
Previous work suggests that major sources of MF in cars include the tires and electric currents [4,5].
The level of MF exposure depends on the position within the vehicle (e.g., proximity to the MF sources)
and can vary with different operating conditions, as changes to engine load can induce MFs through
changes in electric currents. Scientific investigations of the levels of MF in cars are sparse: only one
study evaluated fields only in non-hybrid cars [6], two studies of hybrid cars have been carried out [4,7],
and few studies have systematically compared exposures in both hybrid and
non-hybrid cars [8–12], some based on a very small number of cars. Many have only been presented at
scientific meetings, or in the grey literature, with only two published as peer-reviewed papers.
Vedholm measured the field in seven conventional cars (two of them with the battery underneath the
back seat or in the trunk), with engines running idle and the air conditioning turned on [6]. In the left
front seat, the magnetic field ranged from 0.05 to 3.9 μT, and in the left back seat it ranged from 0.02 to
3.8 μT. A maximum magnetic field of 14 μT was measured at foot level at the left back seat. The highest
values were found in cars with the battery located underneath the back seat or in the trunk.
An Australian study [4] examined the magnetic field in all seats and at the floor level in a hybrid car
and found higher fields in the rear compared to the front and higher fields on the left side than on the
right side. The maximum magnetic field strength levels were found at a frequency of 12 Hz. A Greek
study [7] examined the fields in all four seats and at the feet, chest, and head positions in six hybrid cars,
under four driving conditions: stationary and during 20–40, 80–120, and over 120 km/h. The
measurements showed that the positions with the higher values were located mainly at the rear seats, at
feet level. A remarkable increase in the measured values was observed during braking and speedup in
both studies.
Dietrich and Jacobs provide a detailed characterization of a variety of transportation systems,
including several conventional and electric cars (mostly prototypes) [8]. Although they report that
electric vehicles (cars and light trucks) had average magnetic field levels similar to conventional cars,
Int. J. Environ. Res. Public Health 2015, 12 1653
the majority of tests between the types of vehicles were carried out under different conditions, making
comparisons difficult. Further, they report that while low frequency fields are similar and are the
dominant component in both types of vehicles, higher frequency EMF levels are markedly higher in the
electric vehicles. Austrian scientists evaluated two electric, three hybrid, and two conventional vehicles
[9]. For each vehicle, 12 measurements were taken at each of the front seats and one of the rear seats.
The measurements were carried out under defined stationary speed/load conditions on a car test bench,
during acceleration and braking, and while driving in real traffic, including city, motorway, uphill, and
downhill. The authors evaluated the spatial average of magnetic exposure inside the cars and report that
MF exposure depends on the arrangement of the electric components and cabling between the battery
and engine. In the US, the consumer-product testing organization, Consumer Reports, tested five hybrid
and eight non-hybrid cars. Measurements were taken at the driver’s right foot, knee, waist, and head
while idling, driving in a simulated stop-and-go city-driving course, and accelerating from 0 to 60 miles
per hour. For all vehicles, measurements were highest in the driver’s foot well and second-highest at the
waist. Typically, peak readings were highest during braking [10]. Scientists from the Japan Electrical
Safety & Environment Laboratories [11] evaluated fields from an electric vehicle, a hybrid vehicle, and
a gasoline-electric vehicle. They took measurements in 18 positions within each of the 3 cars while the
driving speed was held at a constant 0, 10, 40, or 80 km/h. They report that all cars displayed multiple
peak fields, with the first two cars having significant peaks at 5.81 Hz, and the third at 6.29 Hz. A US
study evaluated six gasoline and eight electric cars (six of which were hybrids). Each vehicle was fitted
with six EMDEX Lite broadband meters, with a 4-s sampling interval. The vehicle was then driven
around a rectangular 16.3-km loop with a change in elevation of 105 meters that included both city
streets and a high-speed freeway. Overall, fields were higher in electric compared to gasoline cars [12].
The European Health Risk Assessment Network on Electromagnetic Fields Exposure (EFHRAN)
recently produced a report on the level of exposure in the European Union [13] that points to a paucity
of studies on exposure from transportation. Particularly for hybrid cars, they indicate that data exist only
on outdated technologies and should be updated.
The reason for possible differences in MF levels between cars with gasoline, diesel, and hybrid
engines needs to be investigated, and this paper addresses this need. ORCHID (Hebrew abbreviation of
“National Survey of Magnetic Fields in Israel”) is a project aimed at collecting extensive and reliable
information regarding the exposure of children in Israel to power-frequency MFs. The innovation of
ORCHID is its educational aspect, which integrates gifted 6th to 10th grade students as active scientific
participants in the project. The involvement of children also includes personal research projects designed
and implemented by them. This study was designed and carried out in collaboration with two of those
children and characterizes the ELF MF levels in diesel, gasoline and hybrid cars and their dependence
on different parameters.
2. Materials and Methods
MF levels were measured in 11 different car models from eight different car manufacturers: four
gasoline (G1, G2, G3, G4), three diesel (D1, D2, D3), and four hybrid (H1, H2, H3, H4). MF levels from
one of the hybrid cars (H4) were measured under dissimilar conditions, and thus, data from this car were
excluded from analysis, leaving 10 cars with extensive measurements. All measurements were taken
Int. J. Environ. Res. Public Health 2015, 12 1654
under similar conditions with EMDEX-II ELF MF meters that were purchased from Enertech and
calibrated by Soreq Nuclear Research Center certified laboratories. Measurements were taken with the
meters in broadband mode (40–800 Hz) with a sampling rate of 1.5 s. Each car underwent two types of
measurements, “spot measurements” and “continuous measurements.” The cars’ lights were on and the
air-conditioning and radio were turned off during all measurements.
2.1. Spot Measurements
Spot measurements were conducted mainly to identify and describe sources of MF. Measurements were
taken while the car was “standing” (not moving), with the engine turned on and idling in a negligible
background field (<0.01 μT). The spot measurements were taken at six different positions: in contact
with the engine hood (hood closed), at each of the four seats, and inside the trunk. At each of the six
locations, the meter was moved slowly along the whole area or volume, from the floor to the ceiling, to
identify both typical and maximal MF levels as well as the location of the highest fields.
2.2. Continuous Measurements
Continuous measurements were taken under two “standing” and two “driving” operating conditions.
During each of the four conditions, measurements were taken simultaneously by the driver and
three passengers sitting in the four seats inside the car. Each of the four individuals had an EMDEX-II
meter hanging in a pouch from his neck and positioned near the torso. In the standing mode the two
conditions were idling (the accelerator pedal left uncompressed with the engine idling) and
2500 revolutions per minute (RPM) (the accelerator pedal compressed to 2500 RPM of the engine
crankshaft). In hybrid vehicles turning the key to the “on” position did not cause the engine to start
running in the same manner as it does in non-hybrid vehicles. The idling condition in hybrid vehicles is
therefore not well-defined and the 2500 RPM condition does not exist. Each set of measurements was
taken for 60 s in a negligible background field (same location as in the spot measurements).
The MF levels for the driving conditions were measured while driving on the same segment of road,
approximately 1.3 km long, at two different speeds, namely, 40 km/h and 80 km/h. The particular road
segment was chosen for a few reasons. First, despite a nearby high-voltage power line (22 kV) the MFs
along the road were very low (around 0.01 μT), probably due to low currents. Moreover, this segment is
straight with little automobile traffic. These advantages enabled us to conduct the measurements under
stable and well-defined conditions, and to minimize the influence of external disturbances. The driver
was asked to maintain the speed as constant as possible. The MF meters began recording the field once
the vehicle reached the desired speed (either 40 or 80 km/h), and stopped recording before the vehicle
began decelerating. Therefore, moving measurements were taken under approximately constant speeds.
To check for repeatability, two sets of measurements were taken at each speed.
For each diesel and gasoline car, a total of six continuous measurement runs (one idling, one at 2500
RPM, two at 40 km/h, and two at 80 km/h) were conducted. A total of five runs were conducted for each
hybrid car, because the 2500 RPM condition did not exist. For each car, we synchronized the
observations within each run across the four seats based on the timestamps for each recording. This was
done by removing a few observations at the beginning and/or at the end of data for certain seats in some
Int. J. Environ. Res. Public Health 2015, 12 1655
runs where measurements did not start and end at the exact same times across all four seats (368 of the
11,503 observations were removed).
The background field for the moving condition was characterized by walking with an EMDEX-II
meter and recording the MF level along the same segment of road on which the cars were driven. As MF
levels were not assessed on the same day for all cars, the background fields were measured twice on
each day that car measurements took place (ranging on average from 0.005 to 0.0165 μT). The average
background field was subtracted from each car’s MF driving measurements, and any resulting values
less than or equal to zero were coded as 0.001 μT (about 0.6% of measurements). To identify possible
variations in measurements due to MF from other cars, an “event” was marked in the EMDEX-II meter
by the passenger in the back left seat when another car passed by in either the same or opposite direction
(which occurred only few times).
The distribution of MF measurements was highly right-skewed. For each set of measurements
(one seat at one condition), arithmetic and geometric means (AM, GM), arithmetic and geometric
standard deviations (SD, GSD), 5th and 95th percentiles, and percentage of measurements greater
than or equal to 0.2 μT were calculated. The 0.2 μT was chosen as a cut point as the value that while
capturing high exposures occurs with reasonable frequency in cars. MF levels were compared by engine
type, seat position, and operating condition. Statistical tests were performed to identify differences in
average MF levels between groups. Analyses were performed in SAS version 9.3 (SAS Institute, Inc.,
Cary, NC, USA).
3. Results and Discussion
3.1. Spot Measurements
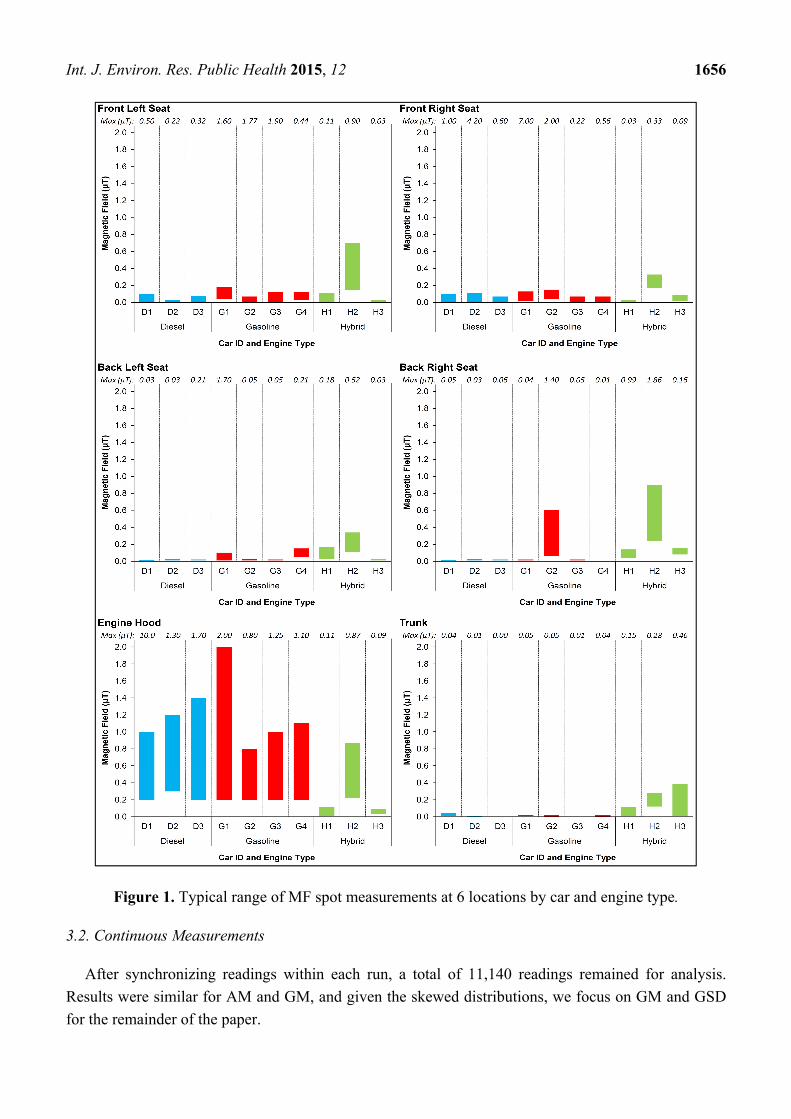
The following results focus on the upper values of typical range of the spot measurements at each of
the six locations in the car. In diesel and gasoline engines, field levels clearly increased when moving
from the trunk (mostly in the range of 0.01–0.02 μT), through the back seats (mostly 0.02–0.03 μT) and
the front seats (mostly 0.07–0.13 μT), up to the engine hood (typically 1.0–1.4 μT) (Figure 1).
In four out of seven cars, the peak fields (of the engine hood) were located near the windshield wiper.
Much higher fields were measured closer to the engine itself while the hood was open. The typical spot
fields at the four seats were lower for diesel cars than gasoline cars (0.05 and 0.10 μT, respectively).
For hybrid cars, the fields were noticeably higher and less stable relative to the non-hybrids, but we
could not find a clear spatial pattern. MFs measured inside the cars were typically 0.05–0.30 μT, and
some were even higher (local peaks up to 1.9 μT). Slightly higher fields were found at the back seats
(approximately 0.3 μT) than at the front seats (approximately 0.2 μT). Fields at the trunk and near the
hood were typically 0.1–0.4 μT.
The maximal fields inside all of the 10 cars were always near the floor (i.e., near the driver’s and
passengers’ legs), and in a few cars, local peaks reached 2–10 μT.
Int. J. Environ. Res. Public Health 2015, 12 1656
Figure 1. Typical range of MF spot measurements at 6 locations by car and engine type.
3.2. Continuous Measurements
After synchronizing readings within each run, a total of 11,140 readings remained for analysis.
Results were similar for AM and GM, and given the skewed distributions, we focus on GM and GSD
for the remainder of the paper.
Int. J. Environ. Res. Public Health 2015, 12 1657
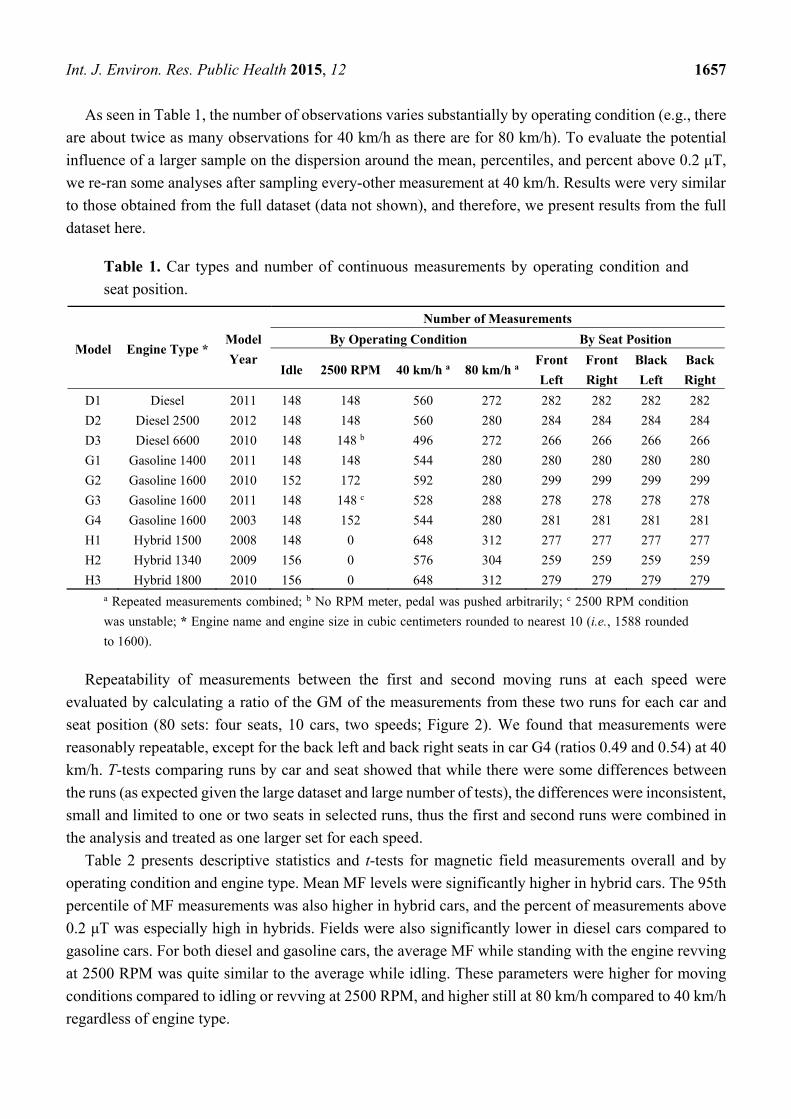
As seen in Table 1, the number of observations varies substantially by operating condition (e.g., there
are about twice as many observations for 40 km/h as there are for 80 km/h). To evaluate the potential
influence of a larger sample on the dispersion around the mean, percentiles, and percent above 0.2 μT,
we re-ran some analyses after sampling every-other measurement at 40 km/h. Results were very similar
to those obtained from the full dataset (data not shown), and therefore, we present results from the full
dataset here.
Table 1. Car types and number of continuous measurements by operating condition and
seat position.
Model Engine Type * Model
Year
Number of Measurements
By Operating Condition By Seat Position
Idle 2500 RPM 40 km/h a 80 km/h a Front
Left
Front
Right
Black
Left
Back
Right
D1 Diesel 2011 148 148 560 272 282 282 282 282
D2 Diesel 2500 2012 148 148 560 280 284 284 284 284
D3 Diesel 6600 2010 148 148 b 496 272 266 266 266 266
G1 Gasoline 1400 2011 148 148 544 280 280 280 280 280
G2 Gasoline 1600 2010 152 172 592 280 299 299 299 299
G3 Gasoline 1600 2011 148 148 c 528 288 278 278 278 278
G4 Gasoline 1600 2003 148 152 544 280 281 281 281 281
H1 Hybrid 1500 2008 148 0 648 312 277 277 277 277
H2 Hybrid 1340 2009 156 0 576 304 259 259 259 259
H3 Hybrid 1800 2010 156 0 648 312 279 279 279 279 a Repeated measurements combined; b No RPM meter, pedal was pushed arbitrarily; c 2500 RPM condition
was unstable; * Engine name and engine size in cubic centimeters rounded to nearest 10 (i.e., 1588 rounded
to 1600).
Repeatability of measurements between the first and second moving runs at each speed were
evaluated by calculating a ratio of the GM of the measurements from these two runs for each car and
seat position (80 sets: four seats, 10 cars, two speeds; Figure 2). We found that measurements were
reasonably repeatable, except for the back left and back right seats in car G4 (ratios 0.49 and 0.54) at 40
km/h. T-tests comparing runs by car and seat showed that while there were some differences between
the runs (as expected given the large dataset and large number of tests), the differences were inconsistent,
small and limited to one or two seats in selected runs, thus the first and second runs were combined in
the analysis and treated as one larger set for each speed.
Table 2 presents descriptive statistics and t-tests for magnetic field measurements overall and by
operating condition and engine type. Mean MF levels were significantly higher in hybrid cars. The 95th
percentile of MF measurements was also higher in hybrid cars, and the percent of measurements above
0.2 μT was especially high in hybrids. Fields were also significantly lower in diesel cars compared to
gasoline cars. For both diesel and gasoline cars, the average MF while standing with the engine revving
at 2500 RPM was quite similar to the average while idling. These parameters were higher for moving
conditions compared to idling or revving at 2500 RPM, and higher still at 80 km/h compared to 40 km/h
regardless of engine type.

Int. J. Environ. Res. Public Health 2015, 12 1658
Figure 2. Ratio of geometric means (1st run/2nd run) for 40 km/h and 80 km/h repeated
runs, sorted from low to high.
Table 2. Descriptive statistics for magnetic field measurements (μT) overall and by
operating condition and engine type.
N Geometric Mean (GSD) 5th Percentile 95th Percentile % ≥ 0.2 μT
Overall 11,140 0.034 (3.277) 0.006 0.199 4.9 By Engine Type
Diesel 3328 0.018 (2.912) 0.001 0.059 0.03 Gasoline 4552 0.041 (2.194) a 0.009 0.094 0.29 Hybrid 3260 0.050 (4.385) b,c 0.002 0.427 16.41
By Operating Condition Idling 1500 0.028 (3.626) 0.001 0.017 1.33
2500 RPM 1064 0.027 (3.047) 0.001 0.087 0.00 40 km/h 5696 0.030 (3.427) d,e 0.006 0.182 4.07 80 km/h 2880 0.052 (2.565) f,g,h 0.009 0.258 10.31
a Significantly different from Diesel (t-test p < 0.0001); b Significantly different from Diesel (t-test
p < 0.0001); c Significantly different from Gasoline (t-test p < 0.0001); d Significantly different from Idling (t-
test p = 0.0831); e Significantly different from 2500 RPM (t-test p < 0.0001); f Significantly different from
Idling (t-test p < 0.0001); g Significantly different from 2500 RPM (t-test p < 0.0001); h Significantly different
from 40 km/h (t-test p < 0.0001).
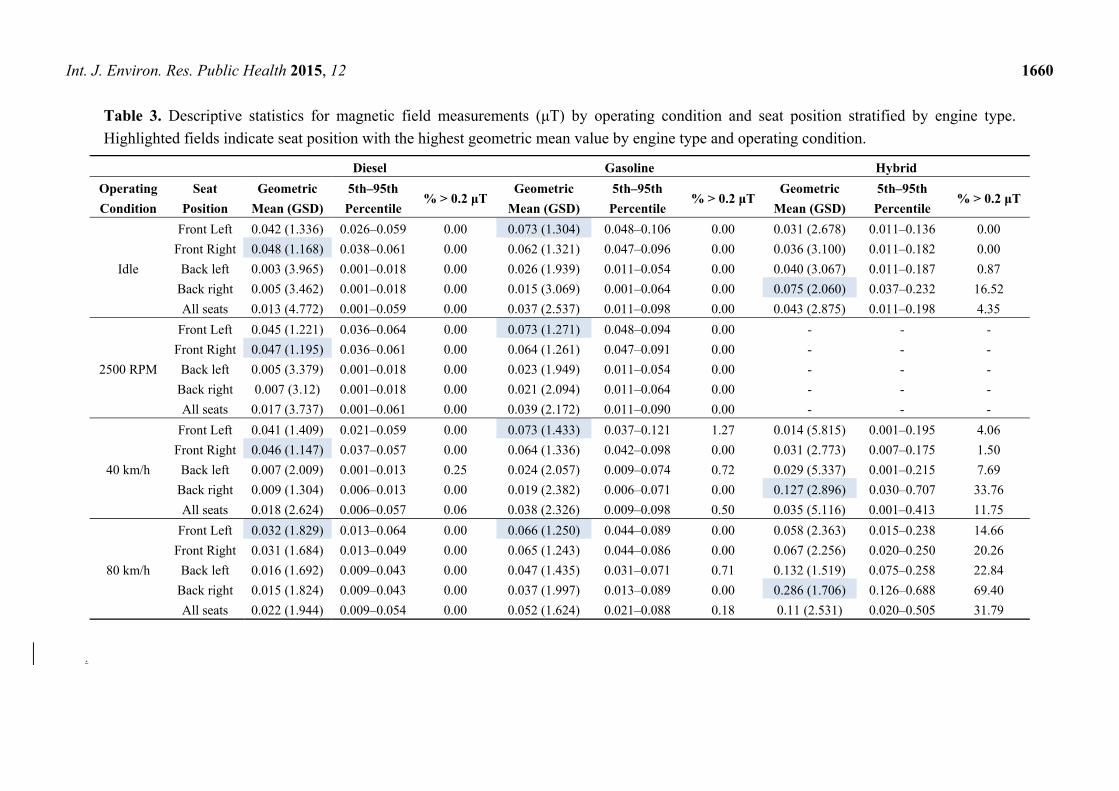
Magnetic field levels in different seat positions varied by engine type. In gasoline and diesel cars,
fields were higher in the front seats (Table 3 and Figure 3). Field levels in the driver’s (front left) seats
and front passenger seats were very similar to each other in diesel cars, while levels in the driver’s seats
were slightly higher than the front passenger seats in gasoline cars (Table 4). For hybrid cars, levels were
higher in the back, particularly the back right seat. The difference was striking for the percent of time
above 0.2 μT (Table 3). For both gasoline and diesel cars, fields rarely, if ever, reached levels greater
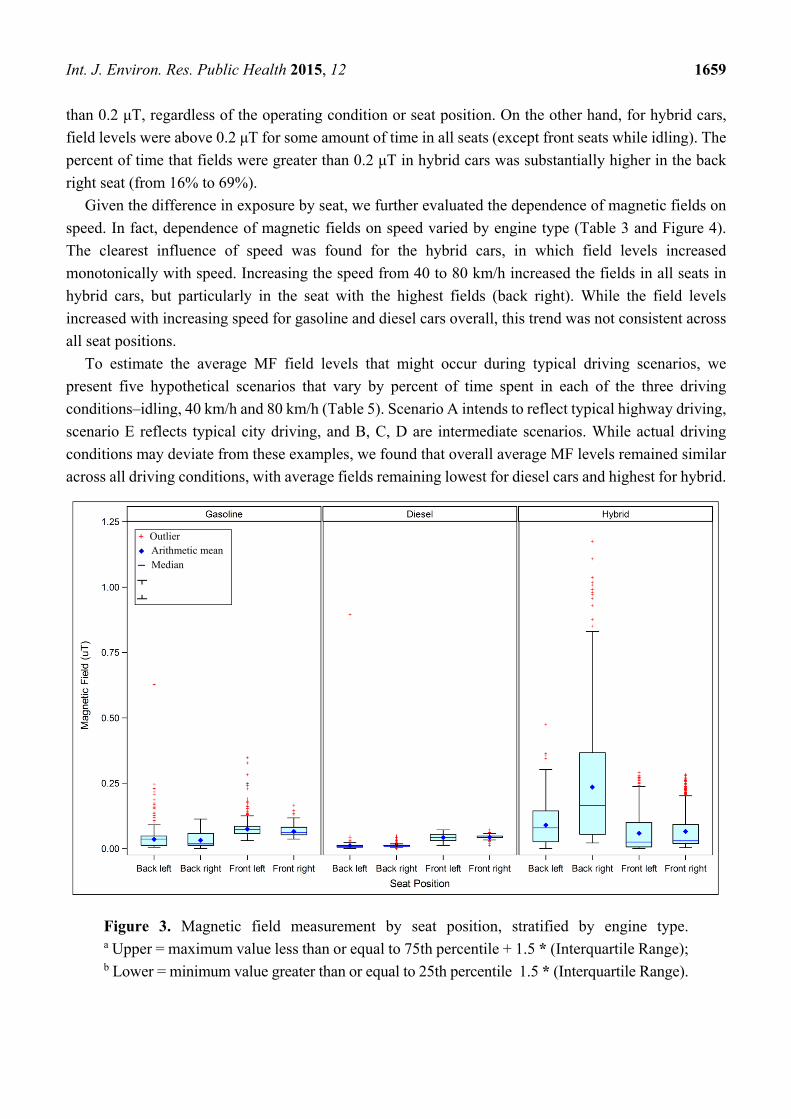
Int. J. Environ. Res. Public Health 2015, 12 1659
than 0.2 μT, regardless of the operating condition or seat position. On the other hand, for hybrid cars,
field levels were above 0.2 μT for some amount of time in all seats (except front seats while idling). The
percent of time that fields were greater than 0.2 μT in hybrid cars was substantially higher in the back
right seat (from 16% to 69%).
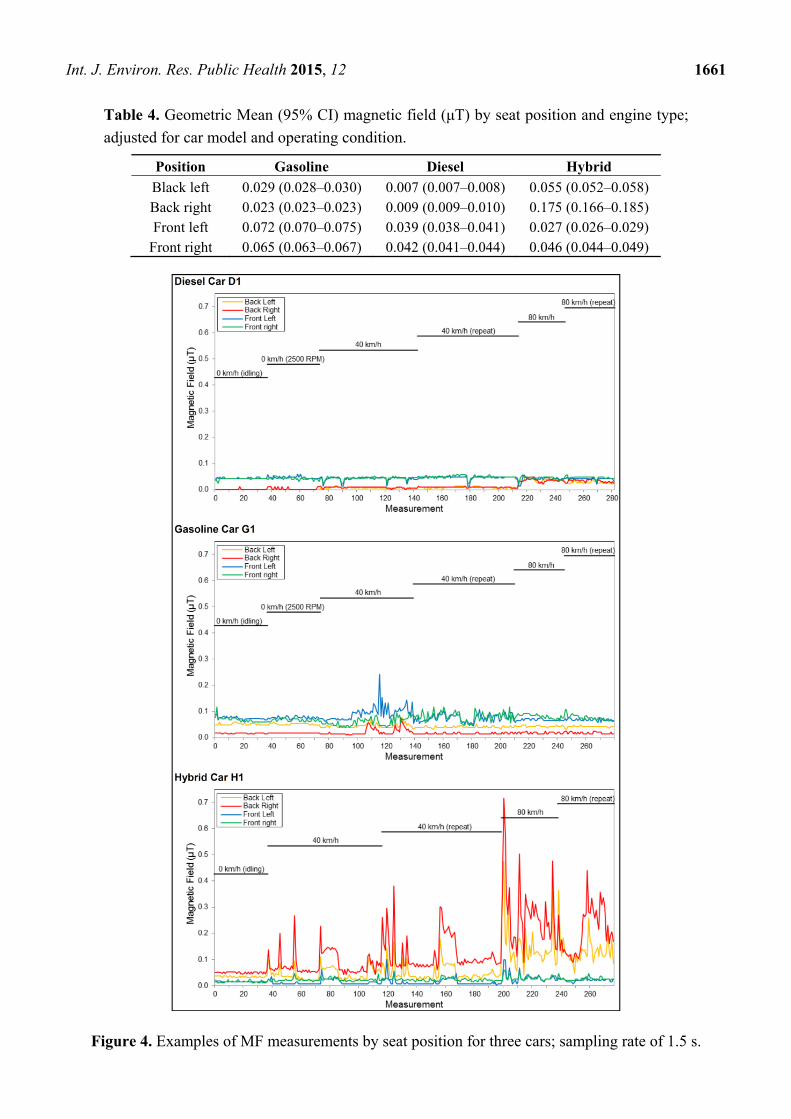
Given the difference in exposure by seat, we further evaluated the dependence of magnetic fields on
speed. In fact, dependence of magnetic fields on speed varied by engine type (Table 3 and Figure 4).
The clearest influence of speed was found for the hybrid cars, in which field levels increased
monotonically with speed. Increasing the speed from 40 to 80 km/h increased the fields in all seats in
hybrid cars, but particularly in the seat with the highest fields (back right). While the field levels
increased with increasing speed for gasoline and diesel cars overall, this trend was not consistent across
all seat positions.
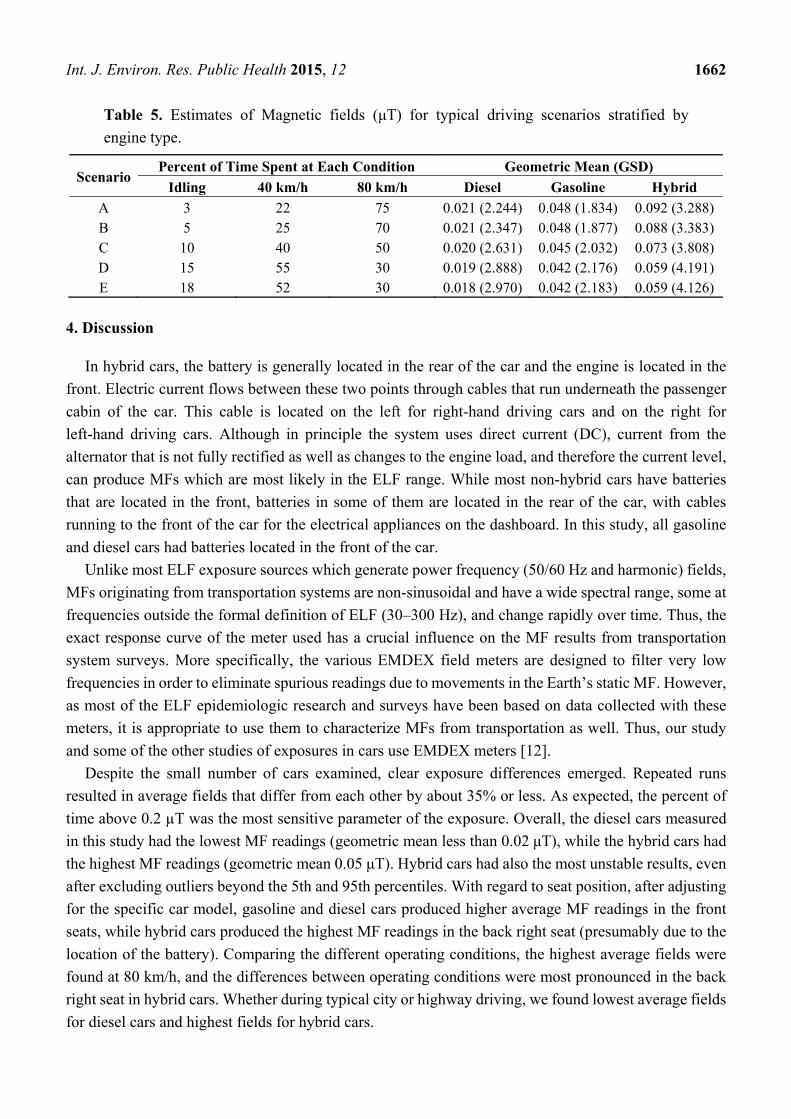
To estimate the average MF field levels that might occur during typical driving scenarios, we
present five hypothetical scenarios that vary by percent of time spent in each of the three driving
conditions–idling, 40 km/h and 80 km/h (Table 5). Scenario A intends to reflect typical highway driving,
scenario E reflects typical city driving, and B, C, D are intermediate scenarios. While actual driving
conditions may deviate from these examples, we found that overall average MF levels remained similar
across all driving conditions, with average fields remaining lowest for diesel cars and highest for hybrid.
Figure 3. Magnetic field measurement by seat position, stratified by engine type. a Upper = maximum value less than or equal to 75th percentile + 1.5 * (Interquartile Range); b Lower = minimum value greater than or equal to 25th percentile 1.5 * (Interquartile Range).
+ Outlier Arithmetic mean Median
Int. J. Environ. Res. Public Health 2015, 12 1660
Table 3. Descriptive statistics for magnetic field measurements (μT) by operating condition and seat position stratified by engine type.
Highlighted fields indicate seat position with the highest geometric mean value by engine type and operating condition.
Diesel Gasoline Hybrid
Operating
Condition
Seat
Position
Geometric
Mean (GSD)
5th–95th
Percentile % > 0.2 μT
Geometric
Mean (GSD)
5th–95th
Percentile % > 0.2 μT
Geometric
Mean (GSD)
5th–95th
Percentile % > 0.2 μT
Idle
Front Left 0.042 (1.336) 0.026–0.059 0.00 0.073 (1.304) 0.048–0.106 0.00 0.031 (2.678) 0.011–0.136 0.00
Front Right 0.048 (1.168) 0.038–0.061 0.00 0.062 (1.321) 0.047–0.096 0.00 0.036 (3.100) 0.011–0.182 0.00
Back left 0.003 (3.965) 0.001–0.018 0.00 0.026 (1.939) 0.011–0.054 0.00 0.040 (3.067) 0.011–0.187 0.87
Back right 0.005 (3.462) 0.001–0.018 0.00 0.015 (3.069) 0.001–0.064 0.00 0.075 (2.060) 0.037–0.232 16.52
All seats 0.013 (4.772) 0.001–0.059 0.00 0.037 (2.537) 0.011–0.098 0.00 0.043 (2.875) 0.011–0.198 4.35
2500 RPM
Front Left 0.045 (1.221) 0.036–0.064 0.00 0.073 (1.271) 0.048–0.094 0.00 - - -
Front Right 0.047 (1.195) 0.036–0.061 0.00 0.064 (1.261) 0.047–0.091 0.00 - - -
Back left 0.005 (3.379) 0.001–0.018 0.00 0.023 (1.949) 0.011–0.054 0.00 - - -
Back right 0.007 (3.12) 0.001–0.018 0.00 0.021 (2.094) 0.011–0.064 0.00 - - -
All seats 0.017 (3.737) 0.001–0.061 0.00 0.039 (2.172) 0.011–0.090 0.00 - - -
40 km/h
Front Left 0.041 (1.409) 0.021–0.059 0.00 0.073 (1.433) 0.037–0.121 1.27 0.014 (5.815) 0.001–0.195 4.06
Front Right 0.046 (1.147) 0.037–0.057 0.00 0.064 (1.336) 0.042–0.098 0.00 0.031 (2.773) 0.007–0.175 1.50
Back left 0.007 (2.009) 0.001–0.013 0.25 0.024 (2.057) 0.009–0.074 0.72 0.029 (5.337) 0.001–0.215 7.69
Back right 0.009 (1.304) 0.006–0.013 0.00 0.019 (2.382) 0.006–0.071 0.00 0.127 (2.896) 0.030–0.707 33.76
All seats 0.018 (2.624) 0.006–0.057 0.06 0.038 (2.326) 0.009–0.098 0.50 0.035 (5.116) 0.001–0.413 11.75
80 km/h
Front Left 0.032 (1.829) 0.013–0.064 0.00 0.066 (1.250) 0.044–0.089 0.00 0.058 (2.363) 0.015–0.238 14.66
Front Right 0.031 (1.684) 0.013–0.049 0.00 0.065 (1.243) 0.044–0.086 0.00 0.067 (2.256) 0.020–0.250 20.26
Back left 0.016 (1.692) 0.009–0.043 0.00 0.047 (1.435) 0.031–0.071 0.71 0.132 (1.519) 0.075–0.258 22.84
Back right 0.015 (1.824) 0.009–0.043 0.00 0.037 (1.997) 0.013–0.089 0.00 0.286 (1.706) 0.126–0.688 69.40
All seats 0.022 (1.944) 0.009–0.054 0.00 0.052 (1.624) 0.021–0.088 0.18 0.11 (2.531) 0.020–0.505 31.79
.
Int. J. Environ. Res. Public Health 2015, 12 1661
Table 4. Geometric Mean (95% CI) magnetic field (μT) by seat position and engine type;
adjusted for car model and operating condition.
Position Gasoline Diesel Hybrid
Black left 0.029 (0.028–0.030) 0.007 (0.007–0.008) 0.055 (0.052–0.058) Back right 0.023 (0.023–0.023) 0.009 (0.009–0.010) 0.175 (0.166–0.185) Front left 0.072 (0.070–0.075) 0.039 (0.038–0.041) 0.027 (0.026–0.029)
Front right 0.065 (0.063–0.067) 0.042 (0.041–0.044) 0.046 (0.044–0.049)
Figure 4. Examples of MF measurements by seat position for three cars; sampling rate of 1.5 s.
Int. J. Environ. Res. Public Health 2015, 12 1662
Table 5. Estimates of Magnetic fields (μT) for typical driving scenarios stratified by
engine type.
Scenario Percent of Time Spent at Each Condition Geometric Mean (GSD)
Idling 40 km/h 80 km/h Diesel Gasoline Hybrid
A 3 22 75 0.021 (2.244) 0.048 (1.834) 0.092 (3.288) B 5 25 70 0.021 (2.347) 0.048 (1.877) 0.088 (3.383) C 10 40 50 0.020 (2.631) 0.045 (2.032) 0.073 (3.808) D 15 55 30 0.019 (2.888) 0.042 (2.176) 0.059 (4.191) E 18 52 30 0.018 (2.970) 0.042 (2.183) 0.059 (4.126)
4. Discussion
In hybrid cars, the battery is generally located in the rear of the car and the engine is located in the
front. Electric current flows between these two points through cables that run underneath the passenger
cabin of the car. This cable is located on the left for right-hand driving cars and on the right for
left-hand driving cars. Although in principle the system uses direct current (DC), current from the
alternator that is not fully rectified as well as changes to the engine load, and therefore the current level,
can produce MFs which are most likely in the ELF range. While most non-hybrid cars have batteries
that are located in the front, batteries in some of them are located in the rear of the car, with cables
running to the front of the car for the electrical appliances on the dashboard. In this study, all gasoline
and diesel cars had batteries located in the front of the car.
Unlike most ELF exposure sources which generate power frequency (50/60 Hz and harmonic) fields,
MFs originating from transportation systems are non-sinusoidal and have a wide spectral range, some at
frequencies outside the formal definition of ELF (30–300 Hz), and change rapidly over time. Thus, the
exact response curve of the meter used has a crucial influence on the MF results from transportation
system surveys. More specifically, the various EMDEX field meters are designed to filter very low
frequencies in order to eliminate spurious readings due to movements in the Earth’s static MF. However,
as most of the ELF epidemiologic research and surveys have been based on data collected with these
meters, it is appropriate to use them to characterize MFs from transportation as well. Thus, our study
and some of the other studies of exposures in cars use EMDEX meters [12].
Despite the small number of cars examined, clear exposure differences emerged. Repeated runs
resulted in average fields that differ from each other by about 35% or less. As expected, the percent of
time above 0.2 µT was the most sensitive parameter of the exposure. Overall, the diesel cars measured
in this study had the lowest MF readings (geometric mean less than 0.02 μT), while the hybrid cars had
the highest MF readings (geometric mean 0.05 μT). Hybrid cars had also the most unstable results, even
after excluding outliers beyond the 5th and 95th percentiles. With regard to seat position, after adjusting
for the specific car model, gasoline and diesel cars produced higher average MF readings in the front
seats, while hybrid cars produced the highest MF readings in the back right seat (presumably due to the
location of the battery). Comparing the different operating conditions, the highest average fields were
found at 80 km/h, and the differences between operating conditions were most pronounced in the back
right seat in hybrid cars. Whether during typical city or highway driving, we found lowest average fields
for diesel cars and highest fields for hybrid cars.

Int. J. Environ. Res. Public Health 2015, 12 1663
The MFs within cars are quite variable, but their origin and dependence on different parameters are
not well understood. To gain a better understanding of some parameters, we held others constant.
In particular, our measurements were taken in a well-defined and stable environment, e.g., same position
on each seat, low background fields, a single location with little or no traffic, and constant speeds. To
accomplish this we avoided accelerations and decelerations. During the measurements we noticed that
fields inside the hybrid cars were highly sensitive to any touch of the gas or brake pedals. Hence the
fields in hybrid cars seem to be sensitive to both the road and the driver. In real life, accelerating and
braking occur frequently, and these will likely increase exposure particularly in hybrid and electric cars
[14]. Nevertheless, our estimates of exposure under different driving scenarios are very close to the ones
reported by Tell and colleagues (GM [GSD]: 0.051 [2.11] μT) in gasoline cars, and our results for hybrid
cars are similar (although a bit lower and more variable) to their measurements in electric cars, most of
which were hybrids (GM [GSD]: 0.095 [2.66] μT) [12]. Our results are also consistent with Halgamuge
et al., in that they observed higher levels on the left side in right-hand driving hybrid cars [4], while we
observed higher fields in the right back seat as the cars in our investigation were the left-hand driving
hybrid cars.
Previous works suggest that the magnetization of rotating tires is the primary source of ELF MFs in
non-hybrid cars [5,15]. However, the relatively strong fields (on the order of a few μT within the car)
originating from the rotating tires are typically at 5–15 Hz frequencies, which are filtered by the
EMDEX II meters. Others found that the influence of tire magnetization on the exposure inside the car
was negligible [9]. While some contribution of the high harmonic content of the rotating tires to the
fields inside the cars is possible, our findings suggest that other sources, possibly the car’s electric
current, are the major contributors to the fields. This is true not only for hybrid cars, where the electric
power system is an obvious source of the elevated MFs, but also for gasoline and diesel cars. In all the
non-hybrid cars, the highest fields from spot measurements were found near the engine hood while idling
(typically 1.0–1.4 μT), and the fields decreased monotonically toward the trunk. Additionally, the fields
were always maximal near the floor, and in few cases reached 2–10 μT. Highest field levels were also
found close to power cables routed near the feet of the occupants in other studies [16]. Based on these
observations, we hypothesize that electric currents that are not fully rectified by the alternator might be
a major source of MF. Since the car’s electric systems generally use a single cable (from the positive
pole), the return current flows through the car’s metallic body, making net currents and stray fields an
intrinsic phenomena in cars. Moreover, although the fields that might be generated via this process
results only from ripples over the DC currents, the DC currents themselves are high relative to what is
used in residential apartments. Due to the low voltage used by cars (usually 12 V), currents can reach
many tens of Amperes. This hypothesis was supported by MFs we found over the entire volume of a car
standing with its engine turned off, due to a refrigerator installed in the trunk. The unexpected time
dependence of the MFs, where most of the peaks are synchronized in all seats (illustrated in Figure 4),
also supports this hypothesis.
It should also be noted that there remained some unexplained variability between specific cars with
the same engine type. For example, MF levels in one of the hybrid cars (H2) were higher overall.
Similarly, there were individual measurements of relatively high fields for some seats at some speeds
during particular runs in a few cars. When another car passed by, either in the same or opposite driving
direction, one of the passengers marked an “event” on the EMDEX II meter so that the other car’s
Int. J. Environ. Res. Public Health 2015, 12 1664
influence on the measurements could be examined. No noticeable changes were found in the data
adjacent to any of the marked events.
Overall, the average MF levels measured in the cars’ seats were in the range of 0.04–0.09 μT (AM)
and 0.02–0.05 μT (GM). These fields are well below the ICNIRP [17] guidelines for maximum general
public exposure (which range from 200 μT for 40 Hz to 100 μT for 800 Hz), but given the complex
environments in the cars, simultaneous exposure to non-sinusoidal fields at multiple frequencies must
be carefully taken into account. Nevertheless, exposures in the cars are in the range of every day exposure
from other sources. Moreover, given the short amount of time that most adults and children spend in
cars (about 30 minutes per day based on a survey of children in Israel (unpublished data), the relative
contribution of this source to the ELF exposure of the general public is small. However, these
fields are in addition to other exposure sources. Our results might explain trends seen in other daily
exposures: slightly higher average fields observed while travelling (GM = 0.096 μT) relative to in bed
(GM = 0.052 μT) and home not in bed (GM = 0.080 μT) [1]. Similarly, the survey of children in Israel
found higher exposure from transportation (GM = 0.092 µT) compared to mean daily exposures
(GM = 0.059 µT). Occupationally, the GM of time-weighted average for motor vehicle drivers is
0.12 μT [18].
As demonstrated by the spot measurements, the results are sensitive to the exact location of the meter,
especially to its height. This sensitivity should be considered in the comparison of different studies, as
well as in the design of future studies. Our results suggest that further surveys should be conducted with
larger samples, in order to verify our results. To obtain valid comparisons, it is important that
measurements are performed in standardized and well-described settings. Additional measurements in a
variety of other vehicles and electric system configurations (electric cars, busses, trucks, motorcycles,
etc.) and under various conditions are needed, including during acceleration and deceleration. Special
attention should be given to spectral analysis of the fields and to the identification and characterization
of the fields’ sources. Further, radio frequency (RF) applications in modern cars are growing and future
assessments should include this frequency range as well. Finally, unintentional sources in electric, hybrid
and conventional vehicles could be best addressed during vehicle design (e.g., by reducing the battery
loop area) [14].
5. Conclusions
The results of this characterization of MFs in hybrid and gasoline cars are consistent with previous
investigations. For the first time, we report results for diesel cars and characterize the dependence of
magnetic field levels on speed. Further, while other studies averaged magnetic field measurements over
various seat positions, we describe how fields vary by seat and engine type. In general, MF levels were
highest in hybrid cars and lowest in diesel cars. We found that MF levels inside the car’s cabin increased
with increasing driving speed and varied by seat position, with the highest levels found in the back seats
in hybrid cars and front seats in gasoline and diesel cars. Thus, MF exposure from cars not only depends
on the type of engine, but also on operating conditions and the position inside the car.
Int. J. Environ. Res. Public Health 2015, 12 1665
Acknowledgments
This work was supported by the Chief Scientist Office at the Israeli Ministry of National
Infrastructures, Energy and Water Resources. The authors would like to thank the transportation
department team at Soreq NRC, Tal Riemer, and those who allowed us to borrow their cars for
this research.
Author Contributions
Ronen Hareuveny, Yoav Yaffe, Yuval Tzabari, and Daniel Namir conceived the study idea and made
the measurements. Ronen Hareuveny, Leeka Kheifets and Madhuri Sudan developed the analysis plan.
Madhuri Sudan and Malka N. Halgamuge analyzed the data. Ronen Hareuveny, Madhuri Sudan and
Leeka Kheifets wrote the paper.
Conflicts of Interest
The authors declare no conflict of interest.
References
1. Zaffanella, L.E.; Kalton, G.W. Survey of Personal Magnetic Field Exposure. Phase II:
1000-Person Survey Interim Report; EMF RAPID Program Engineering Project #6. Vol 2.,
Enertech Consultants, for Oak Ridge National Laboratory EMF Research Program; U.S.
Department of Energy: Washington, DC, USA 1998.
2. Thuróczy, G.; Gajsek, P.; Samaras, T.; Wiart, J. Report on the Level of Exposure (Frequency,
Patterns, and Modulation) in the European Union; Part 1: Extremely Low Frequency (ELF) Fields;
European Health Risk Assessment Network on Electromagnetic Fields Exposure (EFHRAN):
Milan, Italy, 2011.
3. Motavalli, J. Fear, but Few Facts, on Hybrid Risk. Available online: weepnews.blogspot.com/
2008/12/fear-but-few-facts-on-hybrid-risk.html (accessed on 29 December 2014).
4. Halgamuge, M.N.; Abeyrathne, C.D.; Mendis, P. Measurement and analysis of electromagnetic
fields from trams, trains and hybrid cars. Radiat. Protect. Dosim. 2010, 141, 255–268.
5. Milham, S.; Hatfield, J.B.; Tell, R. Magnetic fields from steel-belted radial tires: Implications for
epidemiologic studies. Bioelectromagnetics 1999, 20, 440–445.
6. Vedholm, K.; Hamnerius, Y. Personal exposure resulting from low level low frequency
electromagnetic fields in automobiles (Doctoral dissertation). In Department of Electromagnetics;
Chalmers University of Technology: Gothenburg, Sweden, 1996.
7. Karabetsos, E.; Kalampaliki, E.; Koutounidis, D. Static and extremely low frequency magnetic
fields measurements in various types and models of hybrid technology cars. In Proceedings of the
Joint Meeting of the Bioelectromagnetics Society and the European BioElectromagnetics
Association (BioEM2013), Thessaloniki, Greece, 10–14 June 2013.
8. Dietrich, F.M.; Jacobs, W.L. Survey and Assessment of Electric and Magnetic Field Public
Exposure in the Transportation, Environment; Report Number dot dtrs-57-96-c-00073; U.S.
Department of Transportation: Cambridge, MA, USA, 1999.

Int. J. Environ. Res. Public Health 2015, 12 1666
9. Schmid, G.; Überbacher, R.; Goth, P. ELF and LF magnetic field exposure in hybrid- and electric
cars. In Proceedings of the Joint Meeting of the Bioelectromagnetics Society and the European
BioElectromagnetics Association (BioEM2013), Thessaloniki, Greece, 10–14 June 2013.
10. Shenhar, G.; Hard, G.; Evarts, E. Mythbuster: EMF Levels in Hybrids. Available online:
http://www.consumerreports.org/cro/news/2010/08/mythbuster-emf-levels-in-hybrids/index.htm
(accessed on 29 December 2014).
11. Kato, H.; Ohkubo, C.; Isaka, K. Measurement of the magnetic fields in cars running at constant
speeds. In Proceedings of the Joint Meeting of the Bioelectromagnetics Society and the European
BioElectromagnetics Association (BioEM2013), Thessaloniki, Greece, 10–14 June 2013.
12. Tell, R.A.; Sias, G.; Smith, J.; Sahl, J.; Kavet, R. ELF magnetic fields in electric and gasoline-
powered vehicles. Bioelectromagnetics 2013, 34, 156–161.
13. Thuróczy, G.; Bakos, J.; Ravazzani, P. Report on the Level of Exposure (Frequency, Patterns and
Modulation) in the European Union; Part 2: Extremely Low Frequency (ELF) Fields; European
Health Risk Assessment Network on Electromagnetic Fields Exposure (EFHRAN): Washington,
DC, USA, 2011.
14. Ruddle, A.R.; Topham, D.A.; Ward, D.D. Investigation of electromagnetic emissions
measurements practices for alternative powertrain road vehicles. In Proceedings of the
Electromagnatic Compatibility (EMC), Institute of Electrical and Electronics Engineers (IEEE)
International Symposium Boston, Boston, MA, USA, 21–25 August 2003; pp. 543–547.
15. Stankowski, S.; Kessi, A.; Becheiraz, O.; Meier-Engel, K.; Meier, M. Low frequency magnetic
fields induced by car tire magnetization. Health Phys. 2006, 90, 148–153.
16. Low, L.; Ruddle, A.R. Investigation of human exposure due to unintended electromagnetic
emissions in electric vehicles. In Proceedings of the 7th European Conference on Antennas and
Propagation (EuCAP), Gothenburg, Sweden, 8–12 April 2013; pp. 1285–1289.
17. International Commission on Non-Ionizing Radiation Protection. Guidelines for limiting exposure
to time-varying electric and magnetic fields (1 hz to 100 khz). Health Phys. 2010, 99, 818–836.
18. Bowman, J.D. Exposures to elf-emf in the everyday environment. In The Epidemiology of
Electromagnetic Fields; Röösli, M., Ed.; CRC Press: Boca Raton, FL, USA, 2014; pp. 93–124.
© 2015 by the authors; licensee MDPI, Basel, Switzerland. This article is an open access article
distributed under the terms and conditions of the Creative Commons Attribution license
(http://creativecommons.org/licenses/by/4.0/).
Related Documents


