HAL Id: hal-02132344 https://hal-normandie-univ.archives-ouvertes.fr/hal-02132344 Submitted on 5 Dec 2019 HAL is a multi-disciplinary open access archive for the deposit and dissemination of sci- entific research documents, whether they are pub- lished or not. The documents may come from teaching and research institutions in France or abroad, or from public or private research centers. L’archive ouverte pluridisciplinaire HAL, est destinée au dépôt et à la diffusion de documents scientifiques de niveau recherche, publiés ou non, émanant des établissements d’enseignement et de recherche français ou étrangers, des laboratoires publics ou privés. Characterization of ethane jet from sub-critical to super-critical conditions through visible light and X-ray imaging Nathalie Vallee, Guillaume Ribert, Jean-Bernard Blaisot, S. Dozias To cite this version: Nathalie Vallee, Guillaume Ribert, Jean-Bernard Blaisot, S. Dozias. Characterization of ethane jet from sub-critical to super-critical conditions through visible light and X-ray imaging. 14th ICLASS, 2018, Chicago, United States. hal-02132344

Welcome message from author
This document is posted to help you gain knowledge. Please leave a comment to let me know what you think about it! Share it to your friends and learn new things together.
Transcript
HAL Id: hal-02132344https://hal-normandie-univ.archives-ouvertes.fr/hal-02132344
Submitted on 5 Dec 2019
HAL is a multi-disciplinary open accessarchive for the deposit and dissemination of sci-entific research documents, whether they are pub-lished or not. The documents may come fromteaching and research institutions in France orabroad, or from public or private research centers.
L’archive ouverte pluridisciplinaire HAL, estdestinée au dépôt et à la diffusion de documentsscientifiques de niveau recherche, publiés ou non,émanant des établissements d’enseignement et derecherche français ou étrangers, des laboratoirespublics ou privés.
Characterization of ethane jet from sub-critical tosuper-critical conditions through visible light and X-ray
imagingNathalie Vallee, Guillaume Ribert, Jean-Bernard Blaisot, S. Dozias
To cite this version:Nathalie Vallee, Guillaume Ribert, Jean-Bernard Blaisot, S. Dozias. Characterization of ethane jetfrom sub-critical to super-critical conditions through visible light and X-ray imaging. 14th ICLASS,2018, Chicago, United States. �hal-02132344�
ICLASS 2018, 14th Triennial International Conference on Liquid Atomization and Spray Systems, Chicago, IL, USA, July 22-26, 2018
Characterization of ethane jet from sub-critical to super-critical conditions throughvisible light and X-ray imaging
N. Vallée?, G. Ribert?,*, J.-B. Blaisot?, E. Robert†, S. Dozias†
?CORIA - CNRS, Normandie Université, INSA de Rouen Normandie76000 Rouen, France
†GREMI - CNRS, Université d’Orléans, 45000 OrléansAbstract
The injection of fuel in a high-pressure gaseous environment, for automotive, aeronautical or rocket applicationsleads to thermodynamic conditions where pressure exceeds the critical pressure of working fluids and thus, thesupercritical state of matter is reached. Providing reliable experimental results under these particular conditionsis still nowadays a challenge, but it is of great importance for the validation of numerical codes. Indeed, at sucha high pressure, the distinction between gaseous and liquid phases becomes blurred as surface tension decreasesand the interface disappears completely. For such special conditions, experimental data are scarce and need to beconsolidated. As an example, the modification of the local refractive index induced by density gradient makes thevisible-light imaging technique to be used with care. The REFINE testbench (Real-gas Effect on Fluid Injection:a Numerical and Experimental study) has been designed at CORIA Lab to study the non-reactive injection ofEthane and Propane under sub- and supercritical conditions. The ambient gas pressure can be raised up to 6 MPaand warmed up to 573 K to scan sub- and trans-critical injection conditions. The chamber is equipped with twoperpendicular accesses allowing different simultaneous diagnostics to be applied to the jet. Experimental data arecollected from shadowgraph, diffused backlight illumination techniques and X-Ray. Quantitative measurementsof jet spreading angle, breakup length and density maps are compared to literature results.
IntroductionThe study of high pressure injection is a major topic of research in the transport industry (cars, aircrafts, rock-
ets) because it conditions the combustion performance and therefore the formation of pollutants. Under certainconditions of pressure and temperature the liquid injected into the chamber does not behave as usual and the atom-ization process is replaced by a diffusion one [1, 2]. The experimental study of this transition is a challenge becauseit requires the development of a robust, precise and well-controlled experiment as well as adapted diagnostics. Thenumber of experiments dealing with supercritical injection is therefore small and the amount of experimental datathat can be used for modeling validation [3, 4, 5] is all the more scarce [6]. In particular, the high ambient pressurelocally affects the refractive index gradient making the use of laser-based diagnostics questionable [7, 6] to providequantitative local experimental data. Nevertheless, classical diagnostics such as shadowgraphy or schlieren tech-niques have been used up to now to observe the transition from a system composed of distinct liquid and gaseousphases [6, 8, 9] to a system where dense and light fluids mix together because the surface tension and the heat ofvaporization diminish [10, 11]. Under supercritical conditions, a dense and dark core is visible at the injector exiton shadowgraph [12] and the analysis of the spreading angle shows that supercritical jet has a behavior closer to agaseous jet than to a liquid jet [13, 14].In this study, the first results coming from the research program REFINE (Real-gas Effect on Fluid Injection: aNumerical and Experimental study) are provided. It consists in an injection of Ethane into an environment ofNitrogen or Helium at high pressure and moderate temperature. The objective is to deliver a set of quantitativedata for the dark core length and the spreading angle of a non-assisted jet, from subcritical to supercritical pressurewith respect to the liquid injected, and for various levels of ambiant temperature. A tentative to deliver the value ofdensity on the jet axis through the radiography of the liquid jet is also presented. Radiography is an X-ray imag-ing technique that has been used for the study of diesel jets [15, 16] or cryogenic injections under supercriticalconsiderations [17]. The physical principle of radiography is the absorption of X-rays by the dense fluid. Thetransmission of X-rays thus depends on the mixture composition, i.e. the injected fluid and its surrounding. Anadvantage of X-ray absorption technique is that X-rays are not subject to deflection due to optical index gradients,contrary to laser-based techniques, and the attenuation of the transmitted light is proportional to the mass of fluidcrossed by the X-ray beam.
*Corresponding author: [email protected]
1
14th ICLASS 2018 Imaging of supercritical injection
Experimental setupREFINE testbench
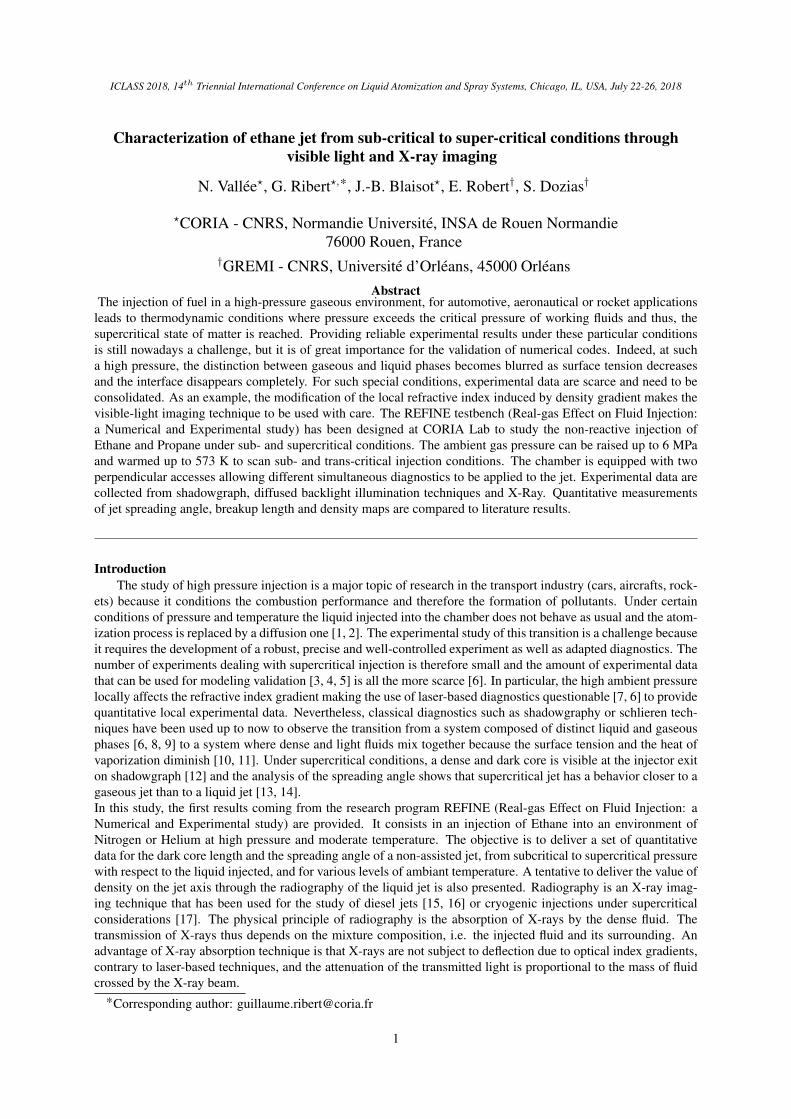
The experiment has been designed to study the injection and atomization of a non-assisted jet under highpressures conditions. REFINE is equipped with a steel chamber able to withstand pressures up to 10 MPa andmoderate temperatures (573 K). Two optical accesses through circular silica windows of diameter 120 mm areavailable for simultaneous measurements (see Fig. 1). The chosen working fluids are Ethane (C2H6, Tc = 305.3 Kand pc = 4.87 MPa) and Propane (C3H8, Tc = 369.8 K and pc = 4.25 MPa). Their moderate critical pressureand temperature are within the range of operating conditions achievable in the chamber. A one-liter pump suppliesthe working fluid at the liquid-gas equilibrium pressure. Before injection, the pump is filled up, and then the fluidcontained inside the vessel of the pump is compressed to the target pressure plus 0.05 MPa to prevent the ambientfluid in the main chamber from entering the pump and creating an effervescent jet.
Figure 1: REFINE testbench.
The injection is performed with a sharp-edged stainless steel tube of 210 mm long, with a 4 mm outer diameterand a 2 mm inner diameter. The injector can be moved vertically over a 150 mm stroke by a motorized systemlocated on the top of the chamber, to expand the field of view. The rig is fully instrumented with thermocouples,pressure gauges and mass flow meters. The chamber is filled with Nitrogen or Helium and the pressure is controlledwith a pressure regulator having a precision of±0.1 MPa. To warm up the ambient fluid, two MICA heating platesare placed at the bottom of the chamber and a heater is inserted just before the feeding of N2 (Tc = 126.2 K andpc = 3.4 MPa) or He (Tc = 5.2 K and pc = 0.228 MPa).
Figure 2: Caption.
Finally, the locus of critical points according to the experimental conditions encountered in the experiment
2

14th ICLASS 2018 Imaging of supercritical injection
REFINE is given in Fig. 2.
ShadowgraphyTwo optical diagnostics, diffused back-light illumination (DBI) and shadowgraphy, are used to quantify the
injection and atomization of the working fluids. The main difference between these two techniques lies in the lightsource arrangement. For shadowgraphy, a collimated laser diode (Cavitar) is used whereas a stroboscope flashlamp(MVS-2601) with a glass diffuser is used for DBI. Depending on the situation and on the desired information,different camera configurations were used, as indicated in Tab. 1. The DBI detects the largest density gradients,which are essentially located at the liquid-gas interface, and the shadowgraphy detects smoother density gradientthat may be found in whole chamber.
Table 1: Table of the different configurations of camera and light source with the associate designation code usedin this manuscript.
Code Camera Resolution (px/mm) Field (mm) Light
BG1 BlueCougar-x24 27.0 59.3 × 44.5 DBI
BG2-1 BlueCougar-x25a 53.5 45.8 × 38.1 DBI
BG2-2 BlueCougar-x25a 130.5 18.8 × 15.7 Shadowgraphy
PCO-1 PCO Edge 5.5 58.0 44.1 × 37.2 DBI
PCO-2 PCO Edge 5.5 121.5 294.3 × 17.8 DBI
RadiographyThe production of X-rays is carried out by an X-ray generator consisting of a high-voltage generator which
supplies an X-ray tube. The electrons are produced by heating the metallic filament of the cathode of the generator,before being accelerated by an electric field in a vacuum tube and hitting a metal target, the anode (or anti-cathode).A continuous radiation called Bremsstrahlung [18] is then produced. The effective radiation is the sum of theBremsstrahlung and the fluorescence of the anode. For a copper anode, the radiation by fluorescence has an energyof about 8 keV. The electrical intensity which passes through the filament determines the quantity of electrons
Figure 3: Calibration of the source X in the case of a chamber filled with nitrogen (at rest) experiencing variousvalues of pressure. The transmission coefficient is normalized by its value at 0.1 MPa. Symbols: present source.Lines: theoretical values.
emitted and therefore the amount of X-rays. The high voltage between the anode and the cathode defines the shapeof the Bremsstrahlung spectrum and the maximum energy of X-rays (Emax). In our case, a voltage of 25 kV isapplies meaning that Emax = 25 KeV with a peak of X-rays emission [19] at Emax/3 = 8 keV.Once emitted by the source, the X-rays beam crosses the fluid environment and hit a scintillator placed insidethe chamber and linked to a camera operating in the visible spectrum. The scintillator Hamamatsu ACS J8734
3
14th ICLASS 2018 Imaging of supercritical injection
(50 × 50 mm2) is used with a luminescent layer of thallium doped cesium iodide, CsI (Tl). X-rays impacting thecarbon plate yield an excitation that is transmitted to the CsI (Tl) layer, which produces a light intensity accordingto its excitation rate and the number of X-rays impacting the carbon plate. Such scintillator having an estimatedefficiency of 70%, the effective transmission is then taken at 5 keV for the peak of X-rays emission, i.e. forsubsequent calculations.
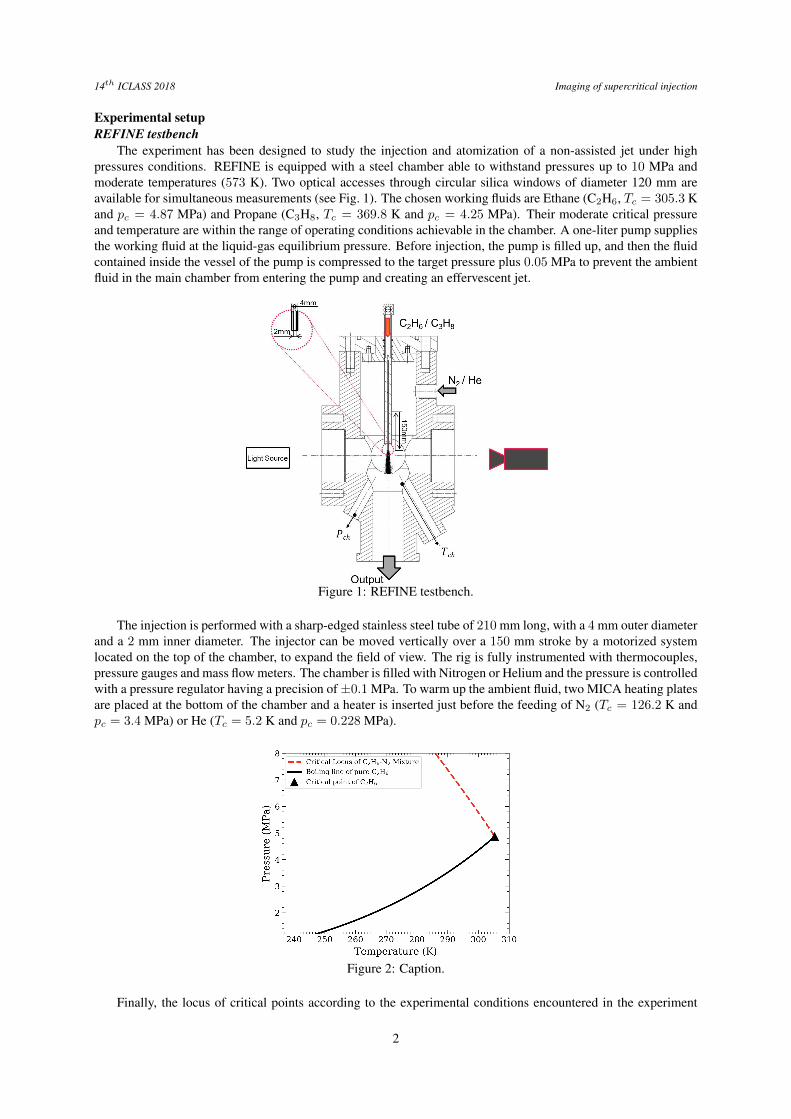
In order to characterize the source (configuration 25 kV and 0.5 mA), the X-ray transmission value (τ ) ismeasured in the case of a chamber filled with nitrogen, at rest, and for different pressure values. In Fig. 3, the
Figure 4: Calibration of the source X with various thicknesses of Kapton for the chamber windows, under atmo-spheric pressure. The transmission coefficient is normalized by its value without Kapton. Symbols: present source.Lines: theoretical values.
experimental value of the reduced transmission (τR), where τR = τ/τ0 with τ0 = τ |P=0.1 MPa, is plotted againstthe pathlength (i.e. density), and compared to theoretical values (see http://henke.lbl.gov for the X-rays database).The energy of X-rays is found between 17 keV and 23 keV. A second calibration is performed at atmosphericpressure with different thicknesses of Kapton for windows (from 25 to 525 µm). Three sets of measurements areperformed to confirm the results. The resulting transmission coefficient is normalized by a reference case withoutKapton. The results are compared to the theoretical transmission of Kapton as shown in Fig. 4. The energy ofX-rays is found between 12 keV and 25 keV. It can be observed that for the thinnest thicknesses of Kapton, thereduced transmission coefficient is greater than one. This anomaly is attributed to the interaction between the targetholder, that corresponds to a cylinder of 2 mm in aluminum.
Results and discussionShadowgraphy
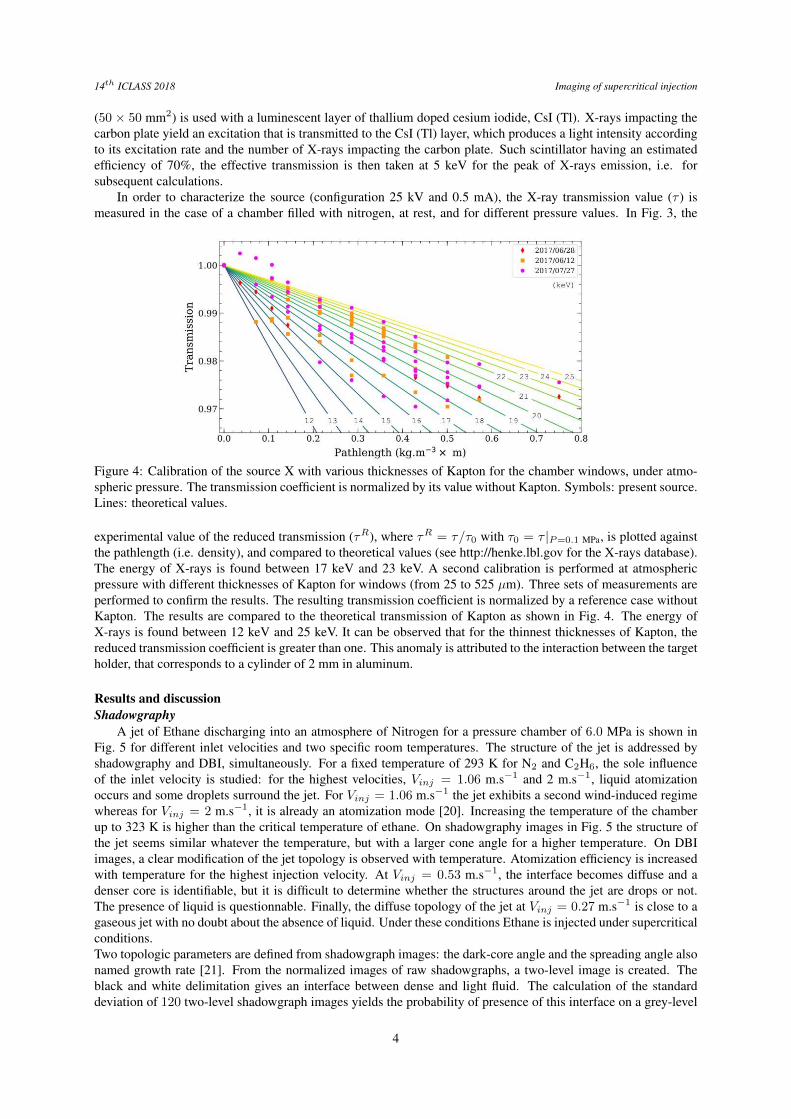
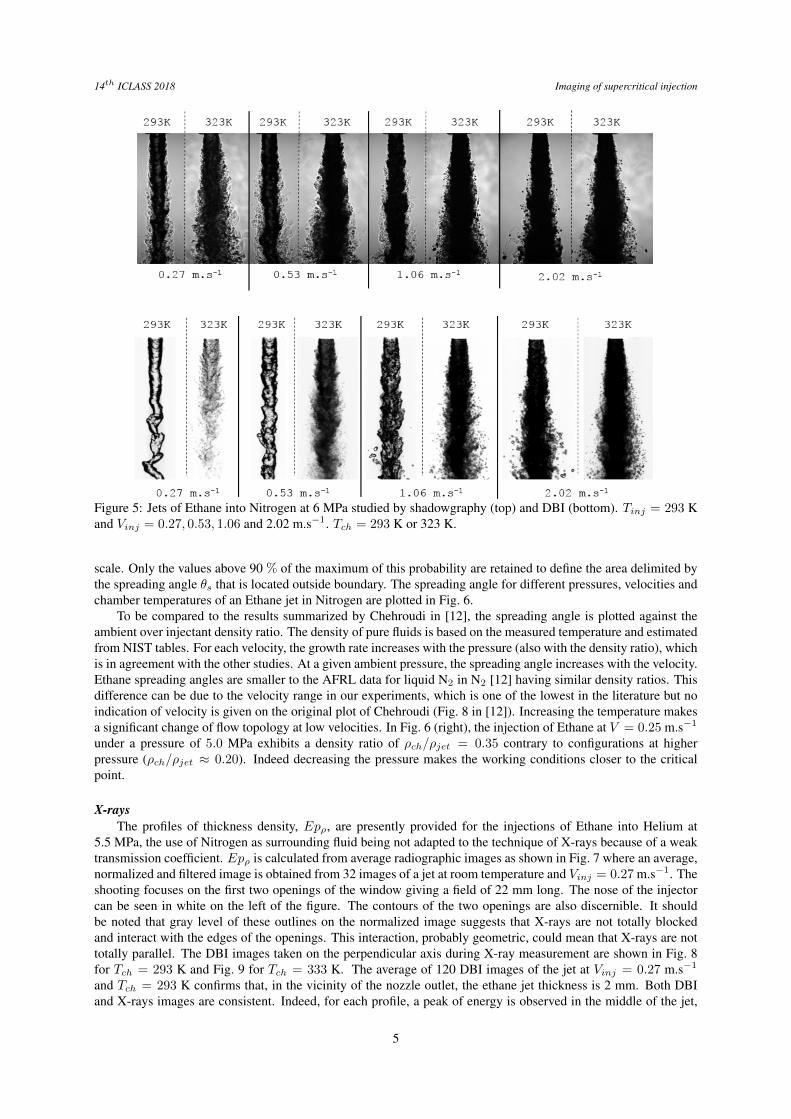
A jet of Ethane discharging into an atmosphere of Nitrogen for a pressure chamber of 6.0 MPa is shown inFig. 5 for different inlet velocities and two specific room temperatures. The structure of the jet is addressed byshadowgraphy and DBI, simultaneously. For a fixed temperature of 293 K for N2 and C2H6, the sole influenceof the inlet velocity is studied: for the highest velocities, Vinj = 1.06 m.s−1 and 2 m.s−1, liquid atomizationoccurs and some droplets surround the jet. For Vinj = 1.06 m.s−1 the jet exhibits a second wind-induced regimewhereas for Vinj = 2 m.s−1, it is already an atomization mode [20]. Increasing the temperature of the chamberup to 323 K is higher than the critical temperature of ethane. On shadowgraphy images in Fig. 5 the structure ofthe jet seems similar whatever the temperature, but with a larger cone angle for a higher temperature. On DBIimages, a clear modification of the jet topology is observed with temperature. Atomization efficiency is increasedwith temperature for the highest injection velocity. At Vinj = 0.53 m.s−1, the interface becomes diffuse and adenser core is identifiable, but it is difficult to determine whether the structures around the jet are drops or not.The presence of liquid is questionnable. Finally, the diffuse topology of the jet at Vinj = 0.27 m.s−1 is close to agaseous jet with no doubt about the absence of liquid. Under these conditions Ethane is injected under supercriticalconditions.Two topologic parameters are defined from shadowgraph images: the dark-core angle and the spreading angle alsonamed growth rate [21]. From the normalized images of raw shadowgraphs, a two-level image is created. Theblack and white delimitation gives an interface between dense and light fluid. The calculation of the standarddeviation of 120 two-level shadowgraph images yields the probability of presence of this interface on a grey-level
4
14th ICLASS 2018 Imaging of supercritical injection
Figure 5: Jets of Ethane into Nitrogen at 6 MPa studied by shadowgraphy (top) and DBI (bottom). Tinj = 293 Kand Vinj = 0.27, 0.53, 1.06 and 2.02 m.s−1. Tch = 293 K or 323 K.
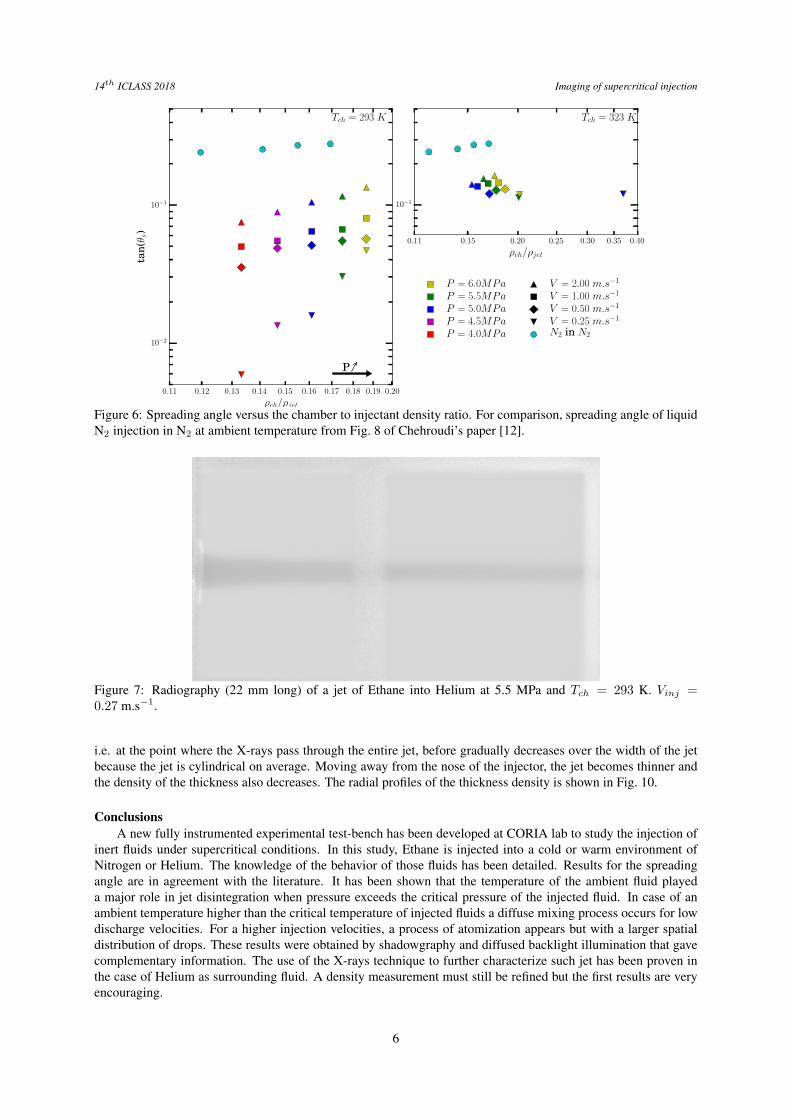
scale. Only the values above 90 % of the maximum of this probability are retained to define the area delimited bythe spreading angle θs that is located outside boundary. The spreading angle for different pressures, velocities andchamber temperatures of an Ethane jet in Nitrogen are plotted in Fig. 6.
To be compared to the results summarized by Chehroudi in [12], the spreading angle is plotted against theambient over injectant density ratio. The density of pure fluids is based on the measured temperature and estimatedfrom NIST tables. For each velocity, the growth rate increases with the pressure (also with the density ratio), whichis in agreement with the other studies. At a given ambient pressure, the spreading angle increases with the velocity.Ethane spreading angles are smaller to the AFRL data for liquid N2 in N2 [12] having similar density ratios. Thisdifference can be due to the velocity range in our experiments, which is one of the lowest in the literature but noindication of velocity is given on the original plot of Chehroudi (Fig. 8 in [12]). Increasing the temperature makesa significant change of flow topology at low velocities. In Fig. 6 (right), the injection of Ethane at V = 0.25 m.s−1
under a pressure of 5.0 MPa exhibits a density ratio of ρch/ρjet = 0.35 contrary to configurations at higherpressure (ρch/ρjet ≈ 0.20). Indeed decreasing the pressure makes the working conditions closer to the criticalpoint.
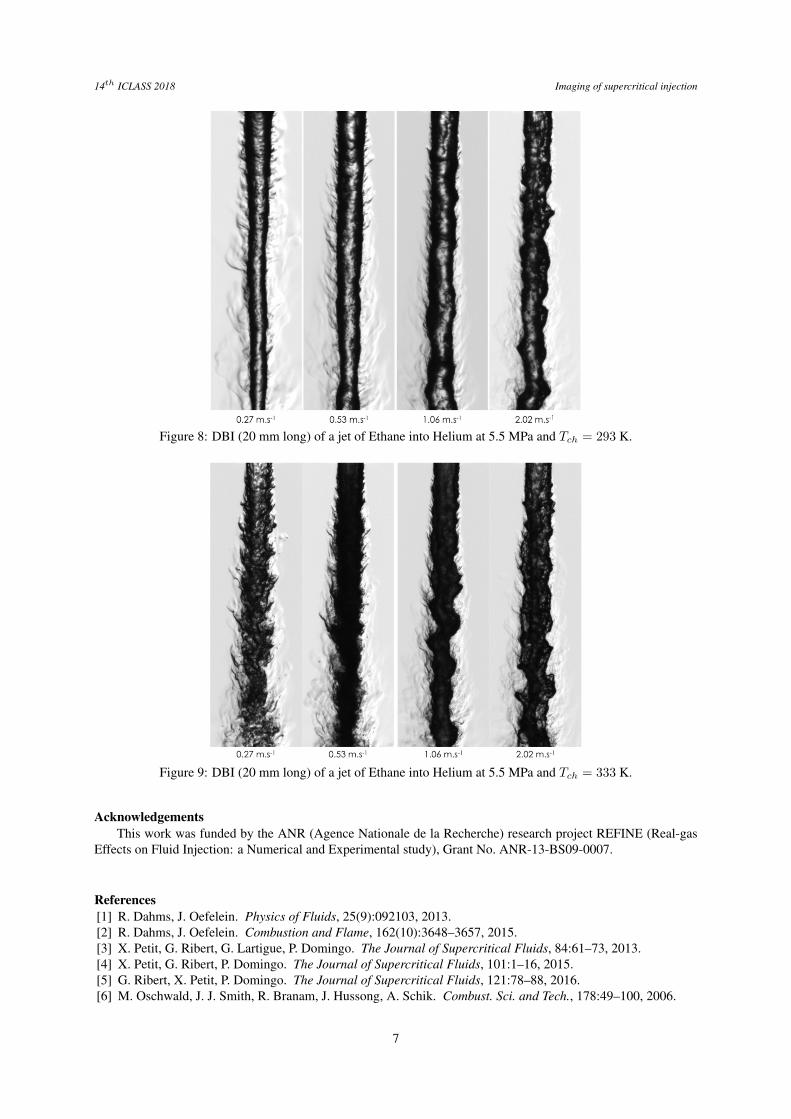
X-raysThe profiles of thickness density, Epρ, are presently provided for the injections of Ethane into Helium at
5.5 MPa, the use of Nitrogen as surrounding fluid being not adapted to the technique of X-rays because of a weaktransmission coefficient. Epρ is calculated from average radiographic images as shown in Fig. 7 where an average,normalized and filtered image is obtained from 32 images of a jet at room temperature and Vinj = 0.27 m.s−1. Theshooting focuses on the first two openings of the window giving a field of 22 mm long. The nose of the injectorcan be seen in white on the left of the figure. The contours of the two openings are also discernible. It shouldbe noted that gray level of these outlines on the normalized image suggests that X-rays are not totally blockedand interact with the edges of the openings. This interaction, probably geometric, could mean that X-rays are nottotally parallel. The DBI images taken on the perpendicular axis during X-ray measurement are shown in Fig. 8for Tch = 293 K and Fig. 9 for Tch = 333 K. The average of 120 DBI images of the jet at Vinj = 0.27 m.s−1
and Tch = 293 K confirms that, in the vicinity of the nozzle outlet, the ethane jet thickness is 2 mm. Both DBIand X-rays images are consistent. Indeed, for each profile, a peak of energy is observed in the middle of the jet,
5
14th ICLASS 2018 Imaging of supercritical injection
0.11 0.12 0.13 0.14 0.15 0.16 0.17 0.18 0.19 0.20
ρch/ρjet
10−2
10−1
tan(θ s
)
Tch = 293 K
P
0.11 0.15 0.20 0.25 0.30 0.35 0.40
ρch/ρjet
10−1
Tch = 323 K
P = 6.0MPaP = 5.5MPaP = 5.0MPaP = 4.5MPaP = 4.0MPa
V = 0.25 m.s−1V = 0.50 m.s−1V = 1.00 m.s−1V = 2.00 m.s−1
N2 in N2
Figure 6: Spreading angle versus the chamber to injectant density ratio. For comparison, spreading angle of liquidN2 injection in N2 at ambient temperature from Fig. 8 of Chehroudi’s paper [12].
Figure 7: Radiography (22 mm long) of a jet of Ethane into Helium at 5.5 MPa and Tch = 293 K. Vinj =0.27 m.s−1.
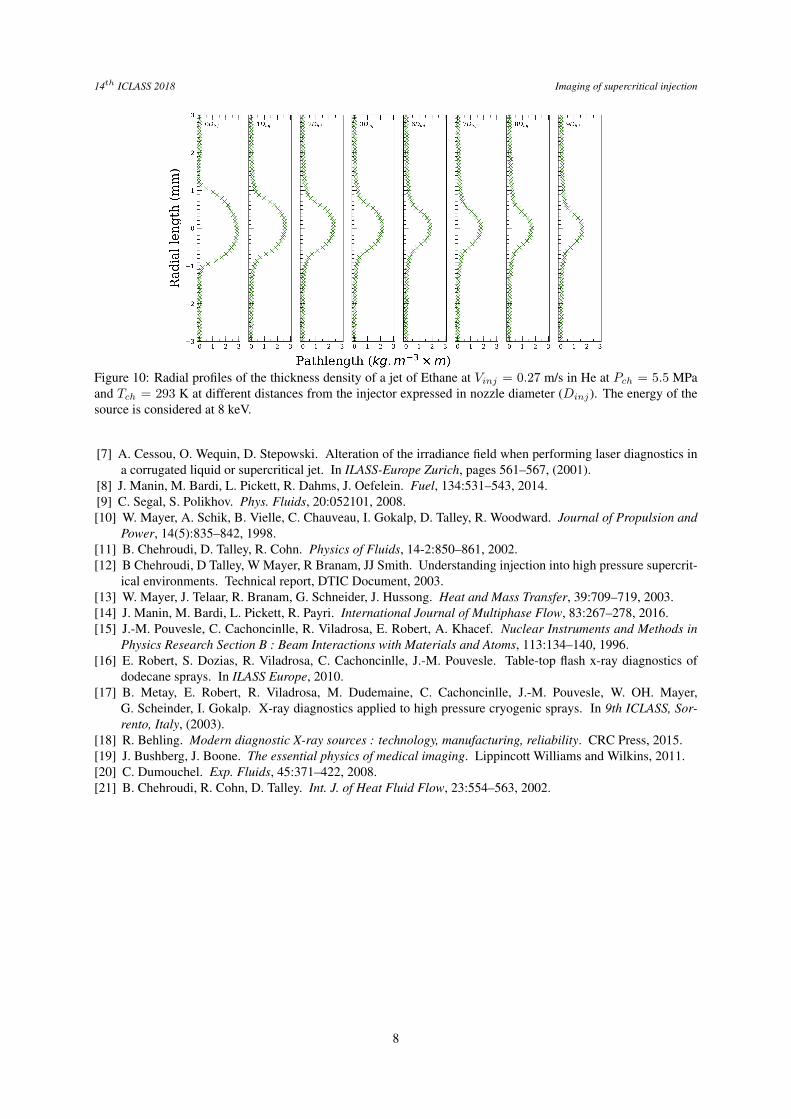
i.e. at the point where the X-rays pass through the entire jet, before gradually decreases over the width of the jetbecause the jet is cylindrical on average. Moving away from the nose of the injector, the jet becomes thinner andthe density of the thickness also decreases. The radial profiles of the thickness density is shown in Fig. 10.
ConclusionsA new fully instrumented experimental test-bench has been developed at CORIA lab to study the injection of
inert fluids under supercritical conditions. In this study, Ethane is injected into a cold or warm environment ofNitrogen or Helium. The knowledge of the behavior of those fluids has been detailed. Results for the spreadingangle are in agreement with the literature. It has been shown that the temperature of the ambient fluid playeda major role in jet disintegration when pressure exceeds the critical pressure of the injected fluid. In case of anambient temperature higher than the critical temperature of injected fluids a diffuse mixing process occurs for lowdischarge velocities. For a higher injection velocities, a process of atomization appears but with a larger spatialdistribution of drops. These results were obtained by shadowgraphy and diffused backlight illumination that gavecomplementary information. The use of the X-rays technique to further characterize such jet has been proven inthe case of Helium as surrounding fluid. A density measurement must still be refined but the first results are veryencouraging.
6
14th ICLASS 2018 Imaging of supercritical injection
Figure 8: DBI (20 mm long) of a jet of Ethane into Helium at 5.5 MPa and Tch = 293 K.
Figure 9: DBI (20 mm long) of a jet of Ethane into Helium at 5.5 MPa and Tch = 333 K.
AcknowledgementsThis work was funded by the ANR (Agence Nationale de la Recherche) research project REFINE (Real-gas
Effects on Fluid Injection: a Numerical and Experimental study), Grant No. ANR-13-BS09-0007.
References[1] R. Dahms, J. Oefelein. Physics of Fluids, 25(9):092103, 2013.[2] R. Dahms, J. Oefelein. Combustion and Flame, 162(10):3648–3657, 2015.[3] X. Petit, G. Ribert, G. Lartigue, P. Domingo. The Journal of Supercritical Fluids, 84:61–73, 2013.[4] X. Petit, G. Ribert, P. Domingo. The Journal of Supercritical Fluids, 101:1–16, 2015.[5] G. Ribert, X. Petit, P. Domingo. The Journal of Supercritical Fluids, 121:78–88, 2016.[6] M. Oschwald, J. J. Smith, R. Branam, J. Hussong, A. Schik. Combust. Sci. and Tech., 178:49–100, 2006.
7
14th ICLASS 2018 Imaging of supercritical injection
Figure 10: Radial profiles of the thickness density of a jet of Ethane at Vinj = 0.27 m/s in He at Pch = 5.5 MPaand Tch = 293 K at different distances from the injector expressed in nozzle diameter (Dinj). The energy of thesource is considered at 8 keV.
[7] A. Cessou, O. Wequin, D. Stepowski. Alteration of the irradiance field when performing laser diagnostics ina corrugated liquid or supercritical jet. In ILASS-Europe Zurich, pages 561–567, (2001).
[8] J. Manin, M. Bardi, L. Pickett, R. Dahms, J. Oefelein. Fuel, 134:531–543, 2014.[9] C. Segal, S. Polikhov. Phys. Fluids, 20:052101, 2008.[10] W. Mayer, A. Schik, B. Vielle, C. Chauveau, I. Gokalp, D. Talley, R. Woodward. Journal of Propulsion and
Power, 14(5):835–842, 1998.[11] B. Chehroudi, D. Talley, R. Cohn. Physics of Fluids, 14-2:850–861, 2002.[12] B Chehroudi, D Talley, W Mayer, R Branam, JJ Smith. Understanding injection into high pressure supercrit-
ical environments. Technical report, DTIC Document, 2003.[13] W. Mayer, J. Telaar, R. Branam, G. Schneider, J. Hussong. Heat and Mass Transfer, 39:709–719, 2003.[14] J. Manin, M. Bardi, L. Pickett, R. Payri. International Journal of Multiphase Flow, 83:267–278, 2016.[15] J.-M. Pouvesle, C. Cachoncinlle, R. Viladrosa, E. Robert, A. Khacef. Nuclear Instruments and Methods in
Physics Research Section B : Beam Interactions with Materials and Atoms, 113:134–140, 1996.[16] E. Robert, S. Dozias, R. Viladrosa, C. Cachoncinlle, J.-M. Pouvesle. Table-top flash x-ray diagnostics of
dodecane sprays. In ILASS Europe, 2010.[17] B. Metay, E. Robert, R. Viladrosa, M. Dudemaine, C. Cachoncinlle, J.-M. Pouvesle, W. OH. Mayer,
G. Scheinder, I. Gokalp. X-ray diagnostics applied to high pressure cryogenic sprays. In 9th ICLASS, Sor-rento, Italy, (2003).
[18] R. Behling. Modern diagnostic X-ray sources : technology, manufacturing, reliability. CRC Press, 2015.[19] J. Bushberg, J. Boone. The essential physics of medical imaging. Lippincott Williams and Wilkins, 2011.[20] C. Dumouchel. Exp. Fluids, 45:371–422, 2008.[21] B. Chehroudi, R. Cohn, D. Talley. Int. J. of Heat Fluid Flow, 23:554–563, 2002.
8
Related Documents