Characterization of Counterion Effects of Gemini Surfactants and In vitro Studies of Transfection Efficiency for Gene Therapy in Epithelial Ovarian Cancer by Muhammad Shahidul Islam A thesis presented to the University of Waterloo in fulfillment of the thesis requirement for the degree of Master of Science in Pharmacy Waterloo, Ontario, Canada, 2015 © Muhammad Shahidul Islam 2015

Welcome message from author
This document is posted to help you gain knowledge. Please leave a comment to let me know what you think about it! Share it to your friends and learn new things together.
Transcript
Characterization of Counterion Effects of Gemini
Surfactants and In vitro Studies of Transfection
Efficiency for Gene Therapy in
Epithelial Ovarian Cancer
by
Muhammad Shahidul Islam
A thesis
presented to the University of Waterloo
in fulfillment of the
thesis requirement for the degree of
Master of Science
in
Pharmacy
Waterloo, Ontario, Canada, 2015
© Muhammad Shahidul Islam 2015

ii
AUTHOR'S DECLARATION
I hereby declare that I am the sole author of this thesis. This is a true copy of the thesis,
including any required final revisions, as accepted by my examiners.
I understand that my thesis may be made electronically available to the public.
iii
ABSTRACT
Gene therapy has emerged as a promising strategy for the treatment or prevention of
many acquired or genetic diseases that are considered incurable at the present time. Although
viral and non-viral vector approaches are the major techniques employed for somatic gene
transfer, non-viral vectors (cationic liposomes, dendrimers, chitosans, polymers &
surfactants) have attracted great interest recently, due to their unique properties. A number of
non-viral carriers have been extensively investigated and developed in recent years for
targeted drug delivery or gene therapy in various pre-clinical/clinical trials. Despite this, the
quest for new non-viral carriers with improved transfection and low toxicity is still
proceeding, driven by a need to overcome safety concerns associated with viral vectors. Of
the non-viral vectors, an intriguing class of building blocks which has elicited extensive
interest are the third generation di-cationic surfactants: a class of bis-surfactants called
“gemini surfactants (GSs)”. The interest is due to their unique self-assembly, hundredfold
lower CMC (compared to their monomeric counterparts), thousand-fold improved surface
activity, and ability to form a rich array of aggregate morphologies. In this project, the effect
of various inorganic and organic counterions on micellization was studied and analyzed at
air–water surfaces as well as in bulk solutions. Additionally, the size & zeta potential of the
nanoparticles, and the in vitro transfection efficiency studies in human ovarian cancer cell
lines were also analysed to investigate the dominant influence of the anions on the
aggregation behavior and DNA delivery efficiency of eight surfactants of the ethanediyl-α,ω-
bis-(dimethylhexadecyl-ammonium) type, [C16H33(CH3)2-N-(CH2)2-N-(CH3)2C16H33].2X–
referred to as gemini 16-2-16; where X refers to the counterion were studied. Counterions of
chloride (Cl–), bromide (Br
–), ½ malate (C4H4O5
– –), ½ tartrate (C4H4O6
– –), adenosine mono
phosphate, AMP (C10H13N5O7P–), guanosine mono phosphate, GMP (C10H13N5O8P
–),
cytidine mono phosphate, CMP (C9H13N3O8P–), and uridine mono phosphate, UMP
(C9H12N2O9P–) were investigated and were classified into three different categories
depending on their nature: (1) small inorganic counterions [chloride (Cl–), and bromide (Br
–)]
taken from the Hofmeister series were studied to focus on the effect of ion type; (2)
Hydroxy-alkyl di-carboxylate counterions [malate (C4H4O5– –
), and tartrate (C4H4O6– –
)] were
studied to focus on the effect of the hydrophilicity of counterions; and (3) heterocyclic ring
containing nucleotide mono phosphate counterions were included to focus on mainly self-
iv
assembly and other parameters. We demonstrate the influence of different anions associated
with this 16-2-16 series of gemini by analyzing the effect of counterions on the micellization
and aggregation behavior of these gemini surfactants, characterized by determination of the
critical micelle concentration (CMC), degree of micelle ionization (α), and free energy of
micellization (ΔGM) and are discussed in terms of the hydrophilicity of anions, counterion
hydration, interfacial packing of ions, and ionic morphology. Our results clearly revealed that
a counterion effect on micellization and aggregate morphology, attributed to the balancing
and controlling forces of the counterions to the surfactant itself. Hydrogen bonding among
the –OH groups of the counterions (where applicable) and water molecules, as well as the
strong hydrophobic interaction among the hydrocarbon side chains is postulated to be the
main origins for the unique aggregation behaviors of these gemini surfactants. These
amphiphiles can form both micelles and vesicles spontaneously with a micelle-to-vesicle
transition at a concentration above the respective CMC. Furthermore, the size & zeta
potential characterizations along with the in vitro transfection data manifest the significant
impact of counterions on the GSs as therapeutic drug delivery carrier. Our transfection
efficiency (TE) data also demonstrated that the surface charge density of the particles formed
by the GSs is the predominant factor for cellular uptake and consequent TE of the respective
GSs.
v
ACKNOWLEDGEMENTS
First and foremost, I would like to convey my profound gratitude and earnest
appreciation to Dr. Shawn David Wettig, Associate Professor of the School of Pharmacy,
Faculty of Sciences; University of Waterloo for his expert supervision, constant inspiration,
invaluable counseling, constructive instructions and concrete suggestions throughout the
research work to solve the impediments that I encountered during my graduate studies. I
would not be here without his expertise and innovative input which continues to spur my
inquisitiveness and incessantly crusade me as an aspiring researcher. It has been an amazing
experience to catch the opportunity for personal and professional growth, and an absolute
honor to have a supervisor/mentor that I can rely on for advice and support now and,
hopefully, in the foreseeable future.
I would like to thank my committee members: Dr. Praveen Nekkar and Dr. Paul
Spagnuolo for all their encouragement and instructions to my research. Many thanks go to
Dr. Roderick Slavcev (and Shirley, from his group), for providing the opportunity to use his
resources and plasmids. As well, I would like to take the opportunity to thank Dr. Jonathan
Blay for making graduate studies at the school of pharmacy a welcoming environment.
I had the opportunity to work with many of my fellow colleagues in Dr. Wettig’s
group. I would like to thank those members of for all their support. A very special thanks
goes to Chi Hong Sum for his professional help, and extraordinary guidelines to conduct
experiments throughout this program. It was always a pleasure working with you, Chi.
I am grateful for the continuing support, inspiration and tremendous patience from
my loving wife for all the good/tough times and for my presence in the lab for unusually
extended periods. My journey would not be complete and possible without her. So, “Thank
you”!! I would like to express my gratitude to my parents for their endless love and
blessings. Their blessing throughout all these years has gotten me through numerous tough
and stressful times. Finally, I would like to thank my family (in-laws) and friends for their
support.
Lastly, I am also thankful to Janet Venne (Department of Chemistry, University of
Waterloo), Eric Lee from Dr. Spagnuolo’s group for the assistance of NMR and Flow
cytometer analysis, respectively.
“The happiest moments of my life have been the few which I have passed at home in the
bosom of my family”. – Thomas Jefferson
vi
DEDICATION
To my family (wife and daughter), my parents and all my well-wishers!
“Call it a clan, call it a network, call it a tribe, call it a family. Whatever you call it, whoever
you are, you need one”.
– Jane Howard (1935-1996) US journalist, writer
vii
TABLE OF CONTENTS
Author’s Declaration ii
Abstract iii
Acknowledgement v
Dedication vi
Table of Contents vii
List of Figures x
List of Tables xiii
List of Abbreviations xv
Chapter-1: Introduction 1
1.1 Gene Therapy (GT) background 1
1.1.1 Recent advances in viral vector based GTs 1
1.1.2 Safety concern associated with viral vectors in GTs 3
1.1.3 Non-viral vectors: Are they superior? 7
1.1.3.1 Cationic lipid based non-viral vectors 10
1.2 Potential barriers for non-viral vector mediated GT 15
1.3 Gemini surfactants (GSs) as non-viral vectors 18
1.3.1 Gemini surfactants (GSs) for DNA transfection in GT 24
1.3.1.1 Role of DOPE lipid in gemini mediated DNA transfection 27
1.3.2 Effect of counterions 29
1.3.2.1 Counterion effect on gemini surfactant aggregation 29
1.3.2.2 Counterion effect of amphiphiles on transfection 33
1.3.3 Selected counterions of the gemini surfactants for this project 39
Chapter-2: Objectives and Hypothesis 41
2.1 Overview of the project 41
2.2 Hypothesis statement 42
2.3 Objectives: short-term goals 43
2.4 Objectives: long-term goals 43
viii
Chapter-3: Materials and Methods 45
3.1 Materials 45
3.1.1 Materials for GS syntheses 45
3.1.2 Materials for in vitro transfection 46
3.1.2.1 Chemicals / Reagents for transfection 46
3.1.2.2 pDNA 47
3.1.2.3 Cell Line 48
3.2 Methods 48
3.2.1 Synthesis of 16-2-16 series of GSs 48
3.2.1.1 Synthesis of 16-2-16 with bromide and chloride counterions 48
3.2.1.2 Synthesis of 16-2-16 with tartrate and malate counterions 49
3.2.1.3 Synthesis of 16-2-16 with nucleotide mono phosphate counterions 50
3.2.2 1HNMR characterization 52
3.2.3 Measurement of CMC 52
3.2.3.1 Surface tension measurement 53
3.2.3.2 Conductivity measurement 53
3.2.4 Krafft temperature measurement 54
3.2.5 Density and pH measurement 55
3.2.6 Bacterial growth and extraction of plasmid 55
3.2.7 Confirmation of extracted plasmids: Agarose Gel Electrophoresis (AGE) 56
3.2.8 Measurement of particle size (diameter) and zeta potential 57
3.2.8.1 Preparation of GS based nanoparticles 58
3.2.8.1.1 Preparation of GS stock solution 58
3.2.8.1.2 Preparation of 1 mM DOPE liposomal solution 58
3.2.8.2 Formulation of nanoparticles and measurement of size and zeta
potential 59
3.2.9 In vitro Transfection assays 60
3.2.9.1 In vitro transfection assays in OVACR-3 cells 60
3.2.9.2 Flow cytometry 62
ix
Chapter-4: Results and Discussion 65
4.1 Syntheses and 1HNMR characterization of the GSs 65
4.2 Physicochemical characterization of Gemini Surfactants 67
4.2.1 Characterization of GS Aggregation using Tensiometry & Conductometry 67
4.2.1.1 CMC and head group are by Tensiometry 68
4.2.1.2 Electrical conductivity measurement: Conductometry 74
4.2.2 Krafft temperature 77
4.2.3 Determination of pH, density 78
4.3 Characterization of GS aggregates by size and zeta potential measurements 80
4.3.1 Size and zeta potential of extracted plasmid 80
4.3.2 Size and zeta potential of DOPE-SUV (D) solution 81
4.3.3 Size and zeta potential of 16-2-16 GSs in solution 81
4.3.4 Size and zeta potential of 16-2-16 gemini based nanoparticles 84
4.3.4.1 Size and zeta potential of 16-2-16/Plasmid (GP) nanoparticles 84
4.3.4.2 Size and zeta potential of GDP and GD nanoparticles 88
4.4 In vitro transfection assays in OVCAR-3 cells 94
4.4.1 Effect of counterions for in vitro transfection assays 94
4.4.1.1 Effect of counterions on TE: 16-2-16-Bromide (G-Br) 95
4.4.1.2 Effect of counterions on TE: 16-2-16-Chloride (G-Cl) 97
4.4.1.3 Effect of counterions on TE: 16-2-16-Malate (G-Malate) 99
4.4.1.4 Effect of counterions on TE: 16-2-16-Tartrate (G-Tartrate) 101
4.4.1.5 Effect of counterions on TE: 16-2-16-AMP (G-AMP) 103
4.4.1.6 Effect of counterions on TE: 16-2-16-CMP (G-CMP) 105
4.4.1.7 Effect of counterions on TE: 16-2-16-UMP (G-UMP) 107
4.4.1.8 Effect of counterions on TE: 16-2-16-GMP (G-GMP) 109
4.4.2 Summary of effect of counterions on TE 111
Chapter-5: Summary and Future directions 117
Bibliography 121
Appendix 133
Letters of copyright permission 161
x
LIST OF FIGURES
Figure-1.1: Different vectors used in GT clinical trials as of January 2014. 3
Figure-1.2: Molecular structures of DTAB, TTAB, and CTAB showing the positively
charged quaternary ammonium moiety in the head groups. 12
Figure-1.3: Structures of commercially available lipids DOTMA, DDAB, DOTAP, DODAC,
DOSPA, DOSPER. 14
Figure-1.4: Basic building block of a non-viral gene delivery system. 16
Figure-1.5: Extracellular and intracellular barriers to gene delivery. 18
Figure-1.6: Schematic representation of typical adsorption and formation of aggregates by
self-assembled amphiphiles. 20
Scheme-1.1: (A) General structure of a conventional and gemini surfactant (without the
associated counterions); (B) Structure of m-s-m GSs (C) Model representing simple lipids,
and (D) Gemini lipids. 23
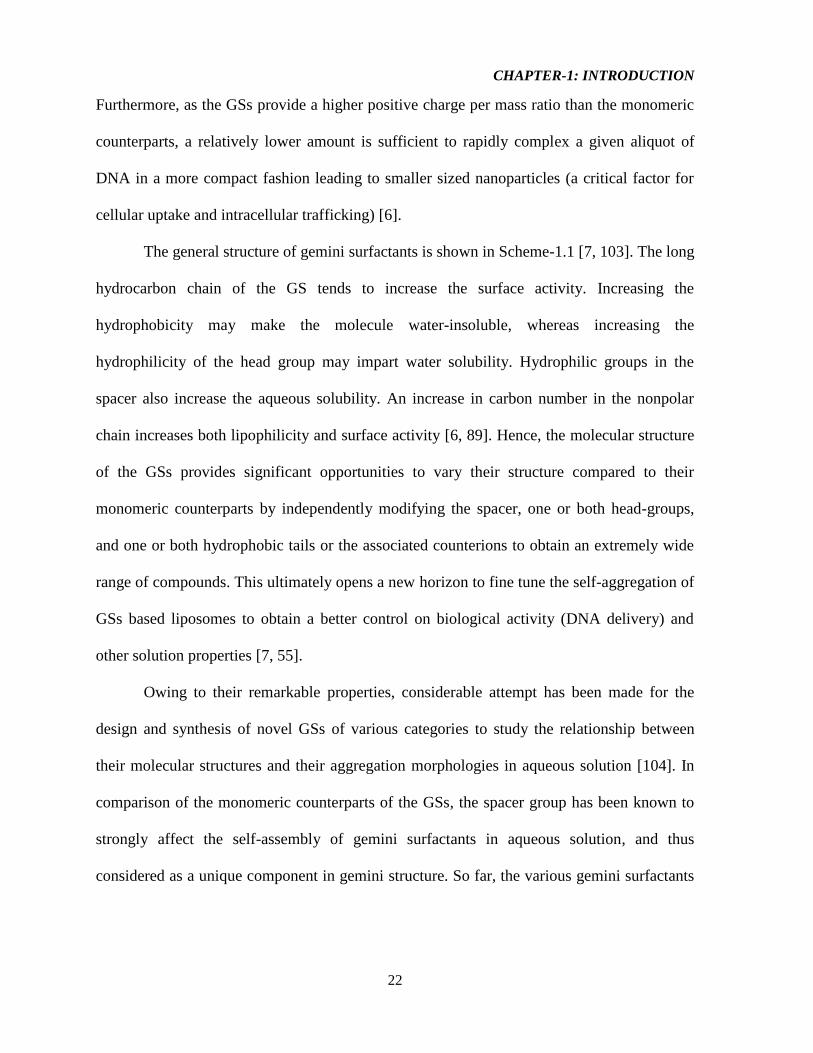
Figure-1.7: Packing parameter showing different morphologies of amphiphilic aggregates
defined by Israelachvili. 34
Figure-1.8: Schematic illustration of endosomal escape of fusogenic DOPE mediating
lipoplexes. 28
Figure-1.9: Various groups of counterions in the study of Oda et al. (2010) 30
Figure-1.10: Table-1 describing the CMC and other parameters of 14-2-14 gemini associated
with the Hofmeister series counterions in the head group. 31
Figure-1.11: Table-2 & Table-3 describing the various solution properties of 14-2-14 gemini
with various organic and polyatomic counterions in the head group. 32
Figure-1.12: CMC of the 14-2-14 with aliphatic carboxylate counterions at 300C. 33
Figure-1.13: Effect of DOTAP with counterions for in vitro transfection in COS-1 cell 35
Figure-1.14: Poly-norbornene based cationic amphiphiles based on different anions 36
Figure-1.15: Transfection efficiencies of methylene-ammonium poly-norbornene polymers
into CHO cell lines. 38
Figure-1.16: Structure of Gemini-UMP, Gemini-tartrate, and Gemini-malate 39
Figure-3.1: The pDNA vector (pNN9) used in this project. 45
Scheme-3.1: Synthesis reaction for preparation of 16-2-16-halides 49
Scheme-3.2: Synthesis reactions for preparation of 16-2-16-malate and -tartrate 49
xi
Scheme-3.3: Ion exchange reactions for 16-2-16-bromide to 16-2-16-acetate 50
Scheme-3.4: Ion exchange reactions for 16-2-16-acetate to 16-2-16-NMP 51
Figure-4.1: Assignment of protons in the 16-2-16-GS structure used in the interpretation of
1HNMR spectra 66
Figure-4.2: Surface tension vs Log (Conc.) plots of 16-2-16 series of surfactants 69
Figure-4.9: Specific conductance vs Concentration for the 16-2-16 gemini surfactants with
various counterions. The intersection of the lines of best fit give the CMC, and the ration of
the slopes above and below the CMC (S2/S1) provides the degree of micellization, . 75
Figure-4.4: Graphical representation of variation of particle sizes (A) and zeta potentials (B)
with the change of different counterions of 16–2–16 series of gemini surfactants (n = 3, error
bar = standard deviation). 83
Figure-4.5: Graphical representation of variation of particle sizes (A), and zeta potentials (B)
of GP nanoparticles at 3 different charge ratios of 16–2–16 gemini to Plasmid with the
change of different counterions (n = 3, error bar = standard deviation). 87
Figure-4.6: Graphical representation illustrating A) particle sizes, and B) Zeta potentials of
GDP nanoparticles at 3 different charge ratios of 16-2-16 gemini surfactants : Plasmid (n = 3,
error bar = standard deviation) 92
Figure-4.7: An example of two way scatter plots from flow-cytometry indicating A) No GFP
expression (treated with Opti-MEM media only i.e. no treatment), B) Live cells with GFP
expression (treated with the control, ‘L’), C) Dying or dead cells with GFP expression
(treated with G-Br based GDP at 10:1), and D) Dead cells with no GFP expression (treated
with G-UMP based GDP at 10:1). Each dot represents a single OVCAR-3 cell. 94
Figure-4.8: Graphical representation illustrating A) TE of the resulting aggregates from 16-2-
16-Br, L, and P & D only, and B) Normalized viability of cells (compared to no treatment,
NT) transfected with resulting aggregates from 16-2-16-Br, L, and P & D only (n = 6, error
bar = standard deviation). 96
Figure-4.9: Graphical representation illustrating A) TE of the resulting aggregates from 16-2-
16-Cl, L, and P & D only, and B) Normalized viability of cells (compared to no treatment,
NT) transfected with resulting aggregates from 16-2-16-Cl, L, and P & D only (n = 6, error
bar = standard deviation). 98
xii
Figure-4.10: Graphical representation illustrating A) TE of the resulting aggregates from 16-
2-16-malate, L and P & D only, and B) Normalized viability of cells (compared to no
treatment, NT) transfected with resulting aggregates from 16-2-16-malate, L, and P & D only
(n = 6, error bar = standard deviation). 100
Figure-4.11: Graphical representation illustrating A) TE of the resulting aggregates from 16-
2-16-tartrate, L, and P & D only, and B) Normalized viability of cells (compared to no
treatment, NT) transfected with resulting aggregates from 16-2-16-tartrate, L, and P & D
only (n = 6, error bar = standard deviation). 102
Figure-4.12: Graphical representation illustrating A) TE of the resulting aggregates from 16-
2-16-AMP, L, and P & D only, and B) Normalized viability of cells (compared to no
treatment, NT) transfected with resulting aggregates from 16-2-16-AMP, L, and P & D only
(n = 6, error bar = standard deviation). 104
Figure-4.13: Graphical representation illustrating A) TE of the resulting aggregates from 16-
2-16-CMP, L, and P & D only, and B) Normalized viability of cells (compared to no
treatment, NT) transfected with resulting aggregates from 16-2-16-CMP, L, and P & D only
(n = 6, error bar = standard deviation). 106
Figure-4.14: Graphical representation illustrating A) TE of the resulting aggregates from 16-
2-16-UMP, L, and P & D only, and B) Normalized viability of cells (compared to no
treatment, NT) transfected with resulting aggregates from 16-2-16-UMP, L, and P & D only
(n = 6, error bar = standard deviation). 108
Figure-4.15: Graphical representation illustrating A) TE of the resulting aggregates from 16-
2-16-GMP, L, and P & D only, and B) Normalized viability of cells (compared to no
treatment, NT) transfected with resulting aggregates from 16-2-16-GMP, L, and P & D only
(n = 6, error bar = standard deviation). 110
Figure-4.16: Graphical representation illustrating TE of particles, based on 16-2-16 series of
gemini surfactants associated with eight different counterions, for all the three charge ratios:
A) For GDP nanoparticles, and B) For GP nanoparticles (n = 6, error bar = standard
deviation). 115
Figure-4.17: Variation of OVCAR-3 percentage cell viability at three different charge ratios
when treated with A) GDP nanoparticles, and B) GP nanoparticles, generated from 16-2-16
series of gemini associated with eight different counterions (n = 6, error bar = standard
deviation). 116
xiii
LIST OF TABLES
Table-1.1: The main group of viral vectors 5
Table-1.2: List of commercially available transfection reagents for in vitro applications 8
Table 1.3 Comparison between viral and non-viral vector mediated gene therapy 10
Table-1.4: Non-viral DNA vectors under clinical evaluation 15
Chart-1.1: The counterions (X –) associated with 16-2-16 series of gemini 40
Table-3.1: Molecular mass of 16 – 2 – 16 series of GS with eight different counterions 58
Table-3.2: Mapping of nanoparticles formulation based on GSs 60
Table-3.3: Transfection formulation template for each well 63
Table-3.4: Mapping for BioLite 24-well multidishes for transfection 64
Table-4.1: Average yield of the gemini surfactants after syntheses 65
Table-4.2: Measured CMC and other parameters of gemini surfactants associated with
different counterions 70
Table-4.3: CMC and degree of micellization values of GSs associated with eight different
counterions measured by conductometric method 76
Table-4.4: Krafft temperature, pH, and density measurements data for GSs. 79
Table-4.5: Average size, PDI, and Zeta potential for GSs with different counterions 82
Table-4.6: Average sizes, polydispersity indices (PDI) and Zeta potentials (ζ) of 16–2–16
gemini/Plasmid (GP) nanoparticles 86
Table-4.7: Average sizes, polydispersity indices (PDI) and Zeta potentials (ζ) of 16–2–16
gemini/Plasmid/DOPE (GDP) nanoparticles 89
Table-4.8: Average sizes, polydispersity indices (PDI) and Zeta potentials (ζ) of 16–2–16
gemini/DOPE (GD) nanoparticles 93
Table-4.9: TE and cell viability for nanoparticles based on 16-2-16-Br (G), Plasmid (P) and
Lipofectamine (L) 95
Table-4.10: TE and cell viability by nanoparticles based on 16-2-16-Cl (G), Plasmid (P) and
Lipofectamine (L) 97
Table-4.11: TE and cell viability by nanoparticles based on 16-2-16-Malate (G), Plasmid (P)
and Lipofectamine (L) 99
xiv
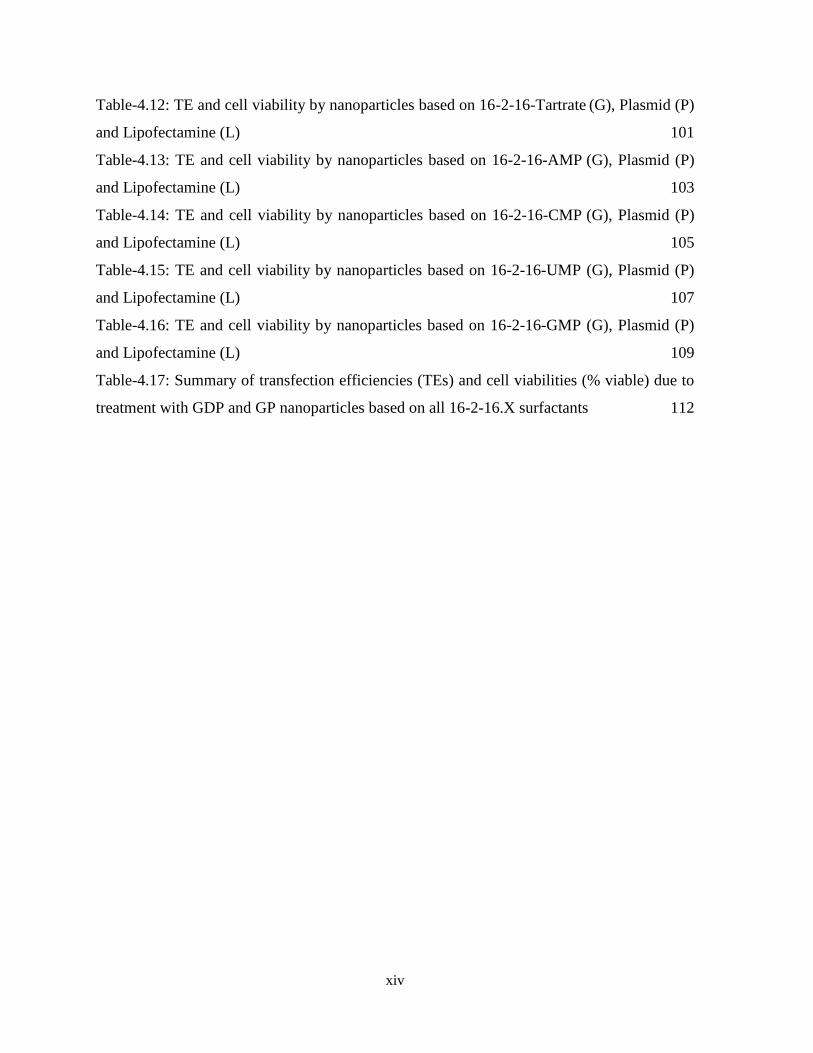
Table-4.12: TE and cell viability by nanoparticles based on 16-2-16-Tartrate (G), Plasmid (P)
and Lipofectamine (L) 101
Table-4.13: TE and cell viability by nanoparticles based on 16-2-16-AMP (G), Plasmid (P)
and Lipofectamine (L) 103
Table-4.14: TE and cell viability by nanoparticles based on 16-2-16-CMP (G), Plasmid (P)
and Lipofectamine (L) 105
Table-4.15: TE and cell viability by nanoparticles based on 16-2-16-UMP (G), Plasmid (P)
and Lipofectamine (L) 107
Table-4.16: TE and cell viability by nanoparticles based on 16-2-16-GMP (G), Plasmid (P)
and Lipofectamine (L) 109
Table-4.17: Summary of transfection efficiencies (TEs) and cell viabilities (% viable) due to
treatment with GDP and GP nanoparticles based on all 16-2-16.X surfactants 112
xv
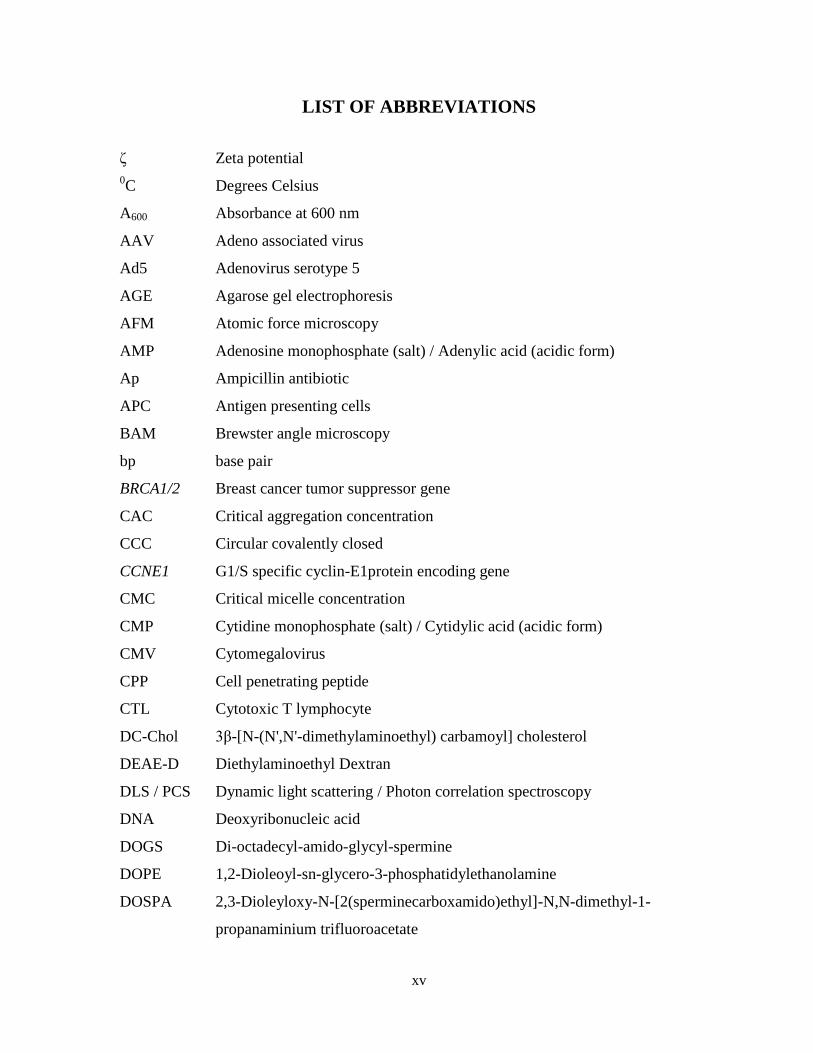
LIST OF ABBREVIATIONS
ζ Zeta potential
0C Degrees Celsius
A600 Absorbance at 600 nm
AAV Adeno associated virus
Ad5 Adenovirus serotype 5
AGE Agarose gel electrophoresis
AFM Atomic force microscopy
AMP Adenosine monophosphate (salt) / Adenylic acid (acidic form)
Ap Ampicillin antibiotic
APC Antigen presenting cells
BAM Brewster angle microscopy
bp base pair
BRCA1/2 Breast cancer tumor suppressor gene
CAC Critical aggregation concentration
CCC Circular covalently closed
CCNE1 G1/S specific cyclin-E1protein encoding gene
CMC Critical micelle concentration
CMP Cytidine monophosphate (salt) / Cytidylic acid (acidic form)
CMV Cytomegalovirus
CPP Cell penetrating peptide
CTL Cytotoxic T lymphocyte
DC-Chol 3β-[N-(N',N'-dimethylaminoethyl) carbamoyl] cholesterol
DEAE-D Diethylaminoethyl Dextran
DLS / PCS Dynamic light scattering / Photon correlation spectroscopy
DNA Deoxyribonucleic acid
DOGS Di-octadecyl-amido-glycyl-spermine
DOPE 1,2-Dioleoyl-sn-glycero-3-phosphatidylethanolamine
DOSPA 2,3-Dioleyloxy-N-[2(sperminecarboxamido)ethyl]-N,N-dimethyl-1-
propanaminium trifluoroacetate
xvi
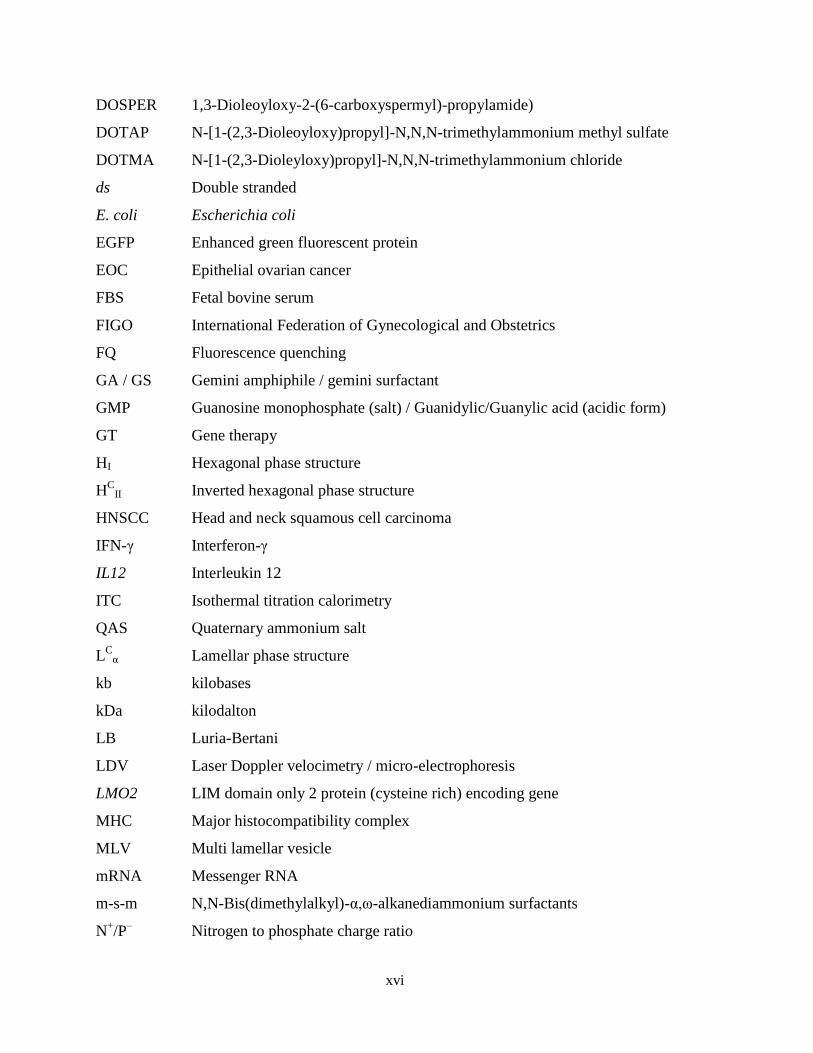
DOSPER 1,3-Dioleoyloxy-2-(6-carboxyspermyl)-propylamide)
DOTAP N-[1-(2,3-Dioleoyloxy)propyl]-N,N,N-trimethylammonium methyl sulfate
DOTMA N-[1-(2,3-Dioleyloxy)propyl]-N,N,N-trimethylammonium chloride
ds Double stranded
E. coli Escherichia coli
EGFP Enhanced green fluorescent protein
EOC Epithelial ovarian cancer
FBS Fetal bovine serum
FIGO International Federation of Gynecological and Obstetrics
FQ Fluorescence quenching
GA / GS Gemini amphiphile / gemini surfactant
GMP Guanosine monophosphate (salt) / Guanidylic/Guanylic acid (acidic form)
GT Gene therapy
HI Hexagonal phase structure
HC
II Inverted hexagonal phase structure
HNSCC Head and neck squamous cell carcinoma
IFN-γ Interferon-γ
IL12 Interleukin 12
ITC Isothermal titration calorimetry
QAS Quaternary ammonium salt
LC
α Lamellar phase structure
kb kilobases
kDa kilodalton
LB Luria-Bertani
LDV Laser Doppler velocimetry / micro-electrophoresis
LMO2 LIM domain only 2 protein (cysteine rich) encoding gene
MHC Major histocompatibility complex
MLV Multi lamellar vesicle
mRNA Messenger RNA
m-s-m N,N-Bis(dimethylalkyl)-α,ω-alkanediammonium surfactants
N+/P
– Nitrogen to phosphate charge ratio
xvii
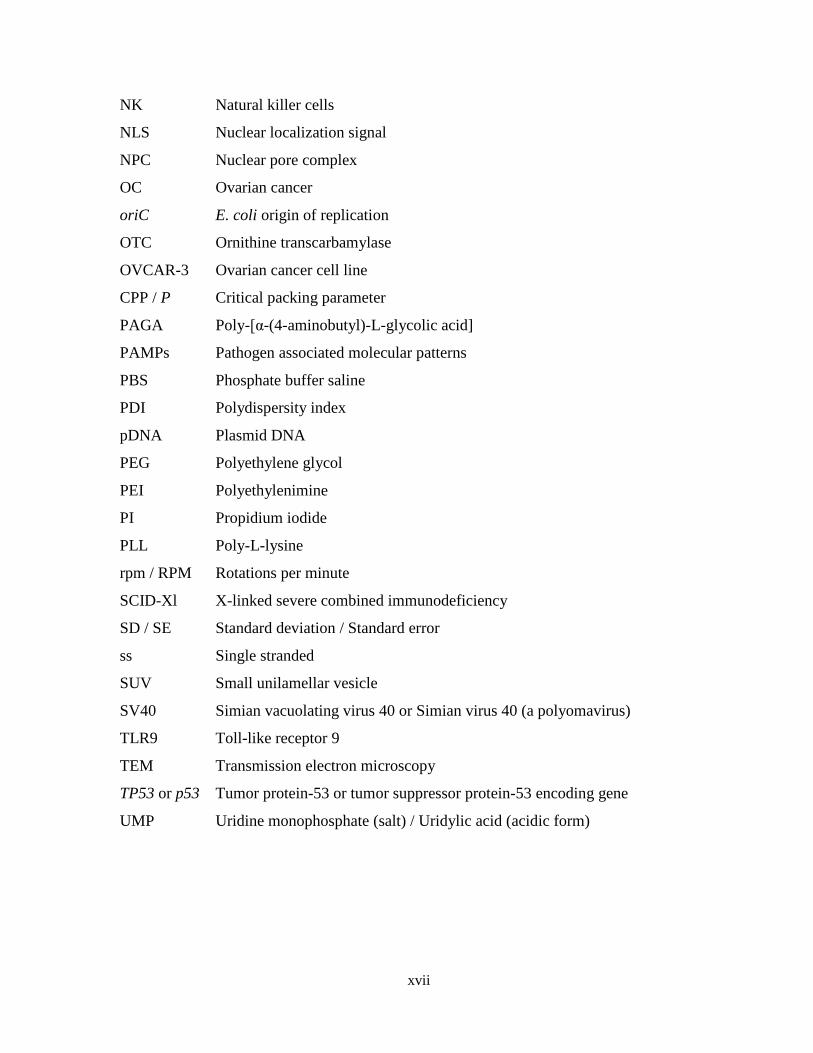
NK Natural killer cells
NLS Nuclear localization signal
NPC Nuclear pore complex
OC Ovarian cancer
oriC E. coli origin of replication
OTC Ornithine transcarbamylase
OVCAR-3 Ovarian cancer cell line
CPP / P Critical packing parameter
PAGA Poly-[α-(4-aminobutyl)-L-glycolic acid]
PAMPs Pathogen associated molecular patterns
PBS Phosphate buffer saline
PDI Polydispersity index
pDNA Plasmid DNA
PEG Polyethylene glycol
PEI Polyethylenimine
PI Propidium iodide
PLL Poly-L-lysine
rpm / RPM Rotations per minute
SCID-Xl X-linked severe combined immunodeficiency
SD / SE Standard deviation / Standard error
ss Single stranded
SUV Small unilamellar vesicle
SV40 Simian vacuolating virus 40 or Simian virus 40 (a polyomavirus)
TLR9 Toll-like receptor 9
TEM Transmission electron microscopy
TP53 or p53 Tumor protein-53 or tumor suppressor protein-53 encoding gene
UMP Uridine monophosphate (salt) / Uridylic acid (acidic form)

CHAPTER-1: INTRODUCTION
1
1. Introduction
1.1 Gene therapy background
Gene therapy (GT) represents a new paradigm for not only the therapeutic treatment
of human genetic diseases, but also for drug delivery. Due to its potential for treating chronic
disease and genetic disorders, gene therapy has drawn increasing attention in the medical,
pharmaceutical and biotechnological sciences [1]. The purpose of gene therapy is to achieve
a desired therapeutic effect in the treatment of a given disease, by delivery of a gene or genes
in order to enable cells to generate therapeutic proteins [2]. Commonly, gene therapy
involves the administration of nucleic acids (specific gene expression cassettes) with a
specific delivery vehicle (also known as a vector) for the purpose of treating diseases
associated with the absence, abnormal expression, or overexpression of specific genes or
genetic elements by replacing, correcting or repressing the gene of interest [3-5]. Essential
components for current gene therapy includes: a) an effective therapeutic gene that can be
expressed at a target site, and b) an efficient and safe delivery system (vector) that delivers
the therapeutic genes to a specific target tissue or organ [6]. Globally, two major types of
gene therapy applications are widely accepted: viral vector mediated and non-viral vector
mediated gene delivery. Each will be described in detail in the following sections.
1.1.1 Recent advances in viral vector based GTs
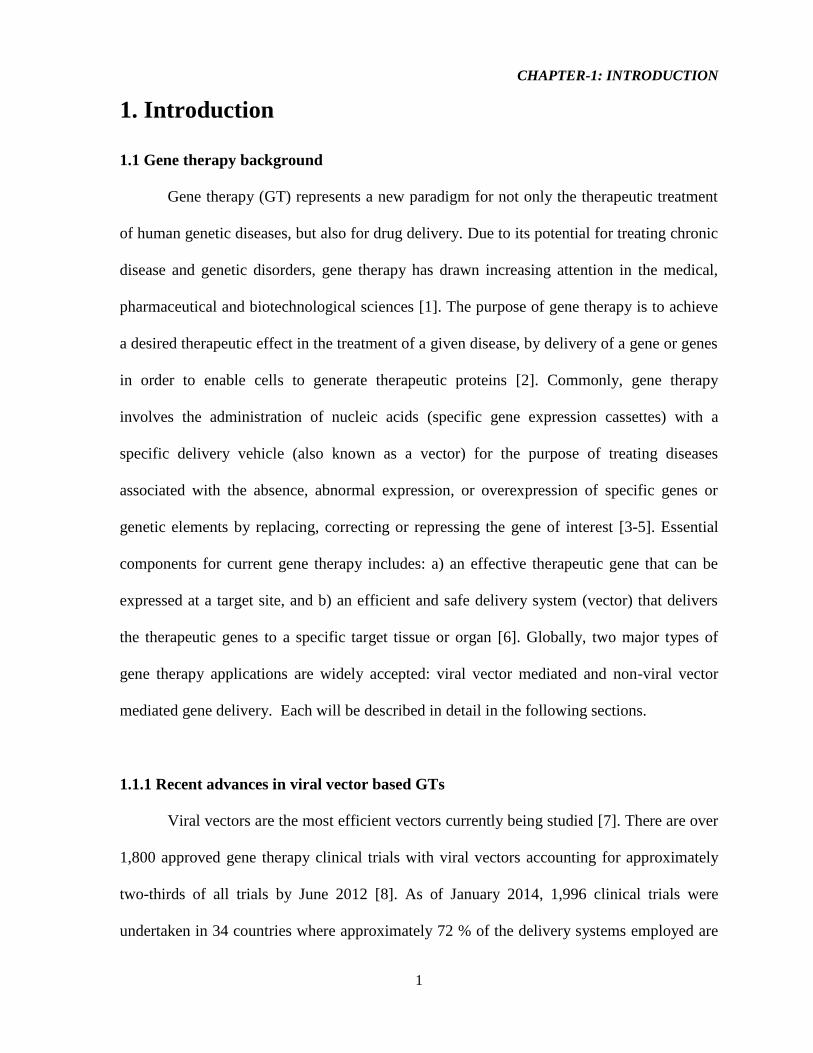
Viral vectors are the most efficient vectors currently being studied [7]. There are over
1,800 approved gene therapy clinical trials with viral vectors accounting for approximately
two-thirds of all trials by June 2012 [8]. As of January 2014, 1,996 clinical trials were
undertaken in 34 countries where approximately 72 % of the delivery systems employed are
CHAPTER-1: INTRODUCTION
2
different viral vectors (Figure-1.1) [9]. Viral vector assisted gene therapy technique exploits
the natural ability of viruses to introduce their genetic cargo to the target cells, and depends
on molecular biology methods to replace essential genes for viral replication, assembly, or
infection [10].
Adenoviral vectors are the most commonly used viral vector due mainly to their high
transfection efficiency, high expression, and infection of non-dividing cells [8]. For instance,
in 2003 the State Food and Drug Administration of China approved gene therapy treatment,
Gendicine (by SioBiono GeneTech), which utilized a recombinant human adenovirus to
deliver the p53 tumor suppressor gene for the treatment of head and neck squamous cell
carcinoma (HNSCC). Gendicine is the world’s first approved gene therapy product that has
had tremendous success for cancer treatment [4, 7]. Additionally, in 2005, China also
approved Onocorine (Sunway Biotech Co. Ltd), a conditionally replicative recombinant
adenoviral vector for the treatment of late stage refractory nasopharyngeal cancer [4]. In the
same year (September 2005), the State Food and Drug Administration of China approved a
second drug based on gene therapy, Endostar, for treatment of cancerous tumours in the
lungs and other organs [11]. The only adenoviral vector that has completed a phase-III
clinical trial for the first time in European Union/Commission (EU/EC) was Cerepro (Ark
Therapeutics Group plc), in 2008 [4]. Finally, in 2012 EC approved the gene therapeutic
“Glybera” (UniQure), an adeno-associated viral vector delivering human lipoprotein lipase
gene in muscle tissue for the treatment of lipoprotein lipase deficiency [4, 12, 13].
CHAPTER-1: INTRODUCTION
3
Figure-1.1: Different vectors used in GT clinical trials as of January 2014 (adapted from
[9]).
1.1.2 Safety concern associated with viral vectors in GTs
Viruses are highly evolved biological machines that efficiently gain access to host
cells and exploit their cellular machinery to facilitate their own replication. Ideal virus-based
vectors for most gene-therapy applications harness the viral infection pathway but avoid the
subsequent expression of viral genes that leads to replication and toxicity. This is achieved
by deleting all, or some, of the coding regions from the viral genome, but leaving intact those
sequences that are required in cis for functions such as packaging the vector genome into the
virus capsid or the integration of vector DNA into the host chromatin [14, 15]. There are a
total five types of viral vectors (Table-1.1) that are available for gene therapy pre-clinical &
clinical trials [14, 16]. These five classes of viral vector can be categorized in two groups
according to whether their genomes integrate into host cellular chromatin (oncoretroviruses
CHAPTER-1: INTRODUCTION
4
and lentiviruses) or persist in the cell nucleus predominantly as extrachromosomal episomes
[adeno-associated viruses (AAVs), adenoviruses (Ad) and herpes viruses] [14]. Table-1.1
summarizes the advantage and disadvantages of these viral vectors for gene therapy [14, 17].
Although the viral based vectors are most widely used due to their high delivery efficiency of
DNA, their usage sometimes poses severe safety concerns due to potential induction of
undesired immunostimulatory responses and/or insertional mutagenesis [14]. Other
limitations of viral vectors include the size of the therapeutic gene, production and packing
problems, as well as high cost of production [7, 18-20].
Among the 5 classes of viral vectors, adenoviral vectors are known to be extremely
efficient and unfortunately, most immunogenic [14, 21]. The majority of recombinant
adenoviral vectors are based on human adenovirus serotypes 2 (Ad2) and 5 (Ad5) of species
C [15, 22]. It has been reported that adenovirus-mediated cancer gene therapy showed only
limited efficacy & less targeting in a number of preclinical and clinical studies [22]. Again,
the use of first generation adenoviral vectors in vivo is associated with the induction of both
innate and acquired immune responses [22, 23]. Cytotoxic T-lymphocyte (CTL) responses
can be elicited against viral gene products or ‘foreign’ transgene products that are expressed
by transduced cells [14].
CHAPTER-1: INTRODUCTION
5
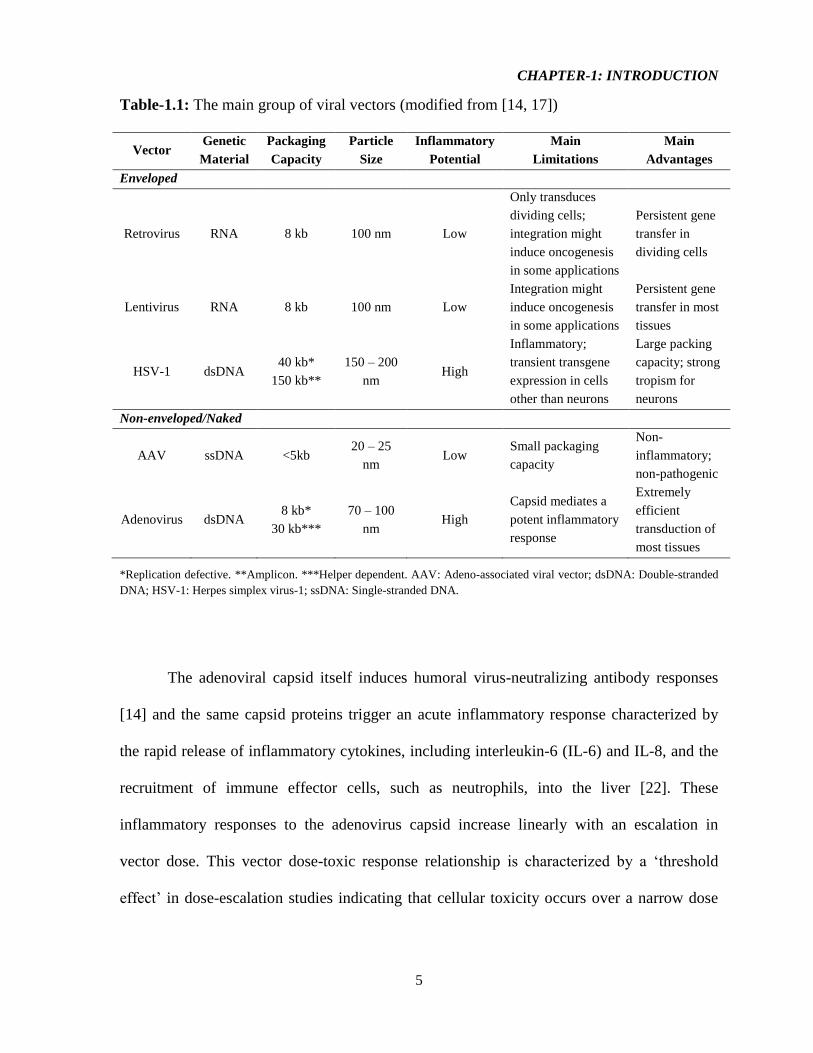
Table-1.1: The main group of viral vectors (modified from [14, 17])
Vector Genetic
Material
Packaging
Capacity
Particle
Size
Inflammatory
Potential
Main
Limitations
Main
Advantages
Enveloped
Retrovirus RNA 8 kb 100 nm Low
Only transduces
dividing cells;
integration might
induce oncogenesis
in some applications
Persistent gene
transfer in
dividing cells
Lentivirus RNA 8 kb 100 nm Low
Integration might
induce oncogenesis
in some applications
Persistent gene
transfer in most
tissues
HSV-1 dsDNA 40 kb*
150 kb**
150 – 200
nm High
Inflammatory;
transient transgene
expression in cells
other than neurons
Large packing
capacity; strong
tropism for
neurons
Non-enveloped/Naked
AAV ssDNA <5kb 20 – 25
nm Low
Small packaging
capacity
Non-
inflammatory;
non-pathogenic
Adenovirus dsDNA 8 kb*
30 kb***
70 – 100
nm High
Capsid mediates a
potent inflammatory
response
Extremely
efficient
transduction of
most tissues
*Replication defective. **Amplicon. ***Helper dependent. AAV: Adeno-associated viral vector; dsDNA: Double-stranded
DNA; HSV-1: Herpes simplex virus-1; ssDNA: Single-stranded DNA.
The adenoviral capsid itself induces humoral virus-neutralizing antibody responses
[14] and the same capsid proteins trigger an acute inflammatory response characterized by
the rapid release of inflammatory cytokines, including interleukin-6 (IL-6) and IL-8, and the
recruitment of immune effector cells, such as neutrophils, into the liver [22]. These
inflammatory responses to the adenovirus capsid increase linearly with an escalation in
vector dose. This vector dose-toxic response relationship is characterized by a ‘threshold
effect’ in dose-escalation studies indicating that cellular toxicity occurs over a narrow dose
CHAPTER-1: INTRODUCTION
6
range and often no symptoms are observed until a slightly higher vector dose is administered,
which induces severe cellular injury [14].
The potential and promising development of these viral vectors has been
unfortunately overshadowed to a great extent due to these limitations as mentioned, and most
importantly due to the reports of patient mortality in clinical trials that use viral vectors for
gene therapy [8, 24-27]. Such an example is represented by the tragic death of Jesse
Gelsinger in September 1999, a 18 year old male patient in phase-I gene therapy clinical trial
(led by Dr. James M. Wilson) at University of Pennsylvania for an adenoviral (attenuated,
recombinant, 3rd
generation) vector based therapeutic treatment for his partial ornithine
transcarbamylase (OTC) deficiency [14, 16, 27-30].
OTC is a metabolic/liver enzyme that is required for the safe removal of excessive
nitrogen from amino acids and proteins [14]. The genetic nature of the disease prompted a
GT approach and the use of adenoviral vectors as a viable option. The vector had been
infused directly into the liver through the hepatic artery, and this systemic delivery of the
vector triggered a massive inflammatory response that led to disseminated intravascular
coagulation, acute respiratory distress and multi-organ failure, and the eventual death of the
subject [14, 29]. Autopsy reports later indicated vector induced activation of innate immunity
as the main cause of death [30].
Insertional mutagenesis is another potential safety concern that has been documented
in an ex vivo GT strategy to treat X-linked severe combined immunodeficiency (SCID-Xl)
using a γ-retroviral vector [8, 25, 27, 29]. The term ‘severe combined immunodeficiency’
(SCID) was coined to indicate rare, lethal conditions in which infants die from an array of
infections associated with a lack of lymphocytes in the blood [25].
CHAPTER-1: INTRODUCTION
7
A total of 20 patients suffering from SCID-Xl were treated with a γ-retroviral vector
to correct the genetic defect from 1999 to 2009, achieving an impressive 85% success rate
[25]. In the SCID-Xl trial, haematopoietic stem cells were genetically reconstituted with the
γ-chain cytokine receptor and went through many cell divisions to generate a repopulating
functional T-cell repertoire [14]. Unfortunately, a quarter (5 out of 20) of these patients were
later found to have developed T-cell leukemia [25]. The development of T cell leukemia was
attributed to the uncontrolled proliferation of T-cells due to vector integration near the LMO2
proto-oncogene promoter, a phenomenon known as insertional mutagenesis leading to
subsequent aberrant expression of oncogenes [8].
1.1.3 Non-viral vectors: Are they superior?
As described above, the resulting complications from the employment the viral
vectors has created controversy regarding their use in human gene therapy applications [24,
26] and thus there is large body of research devoted for the quest of suitable non-viral
vectors. Among the three major class of non-viral delivery systems – naked DNA, physical
delivery, and chemical delivery via synthetic vectors (called non-viral vectors hereafter), the
non-viral vectors, typically comprised of a mixture of cationic and neutral lipids, are
generally non-toxic, non-immunogenic, are not limited in the size of gene they can
encapsulate, are relatively cheap and easy to produce, and allow for specialized delivery
options (such as targeted delivery, time-dependent release, and enhanced circulation times)
[7, 19, 31-33].
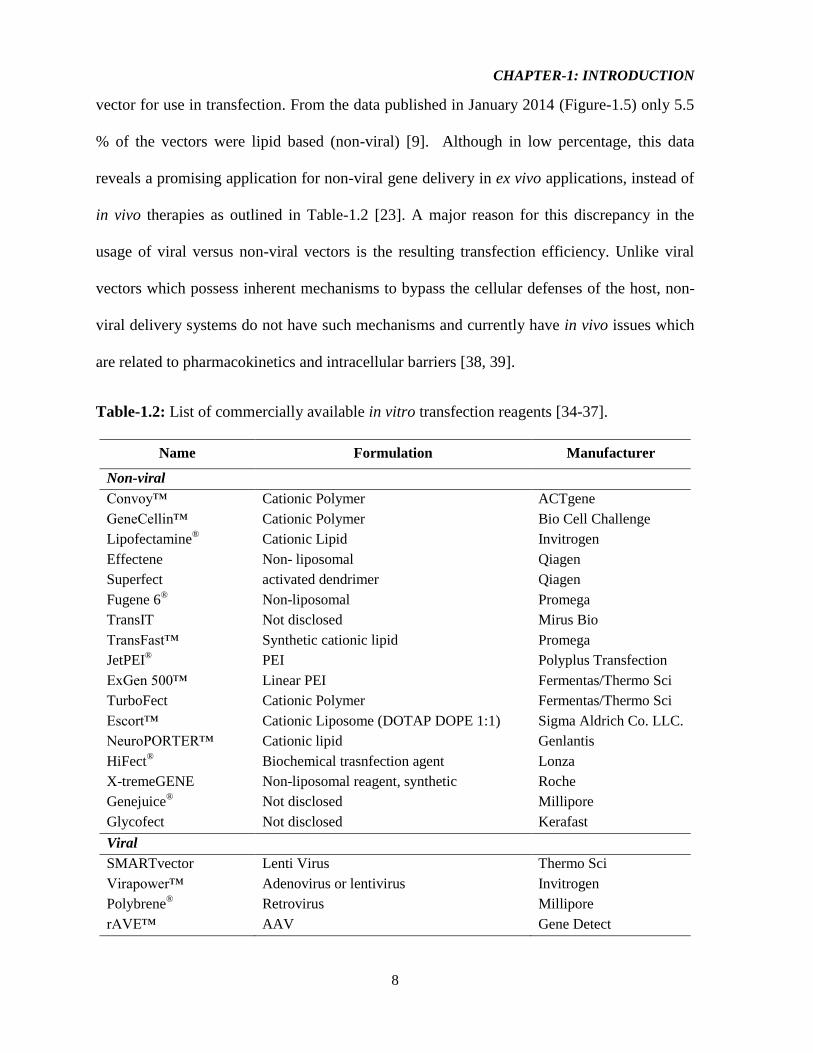
A wide variety of commercial transfection systems based on non-viral delivery
systems are available for in vitro cell studies [34-37]. As shown in Table-1.2, most of the
commercial transfection systems employ a non-viral delivery system, rather than a viral
CHAPTER-1: INTRODUCTION
8
vector for use in transfection. From the data published in January 2014 (Figure-1.5) only 5.5
% of the vectors were lipid based (non-viral) [9]. Although in low percentage, this data
reveals a promising application for non-viral gene delivery in ex vivo applications, instead of
in vivo therapies as outlined in Table-1.2 [23]. A major reason for this discrepancy in the
usage of viral versus non-viral vectors is the resulting transfection efficiency. Unlike viral
vectors which possess inherent mechanisms to bypass the cellular defenses of the host, non-
viral delivery systems do not have such mechanisms and currently have in vivo issues which
are related to pharmacokinetics and intracellular barriers [38, 39].
Table-1.2: List of commercially available in vitro transfection reagents [34-37].
Name Formulation Manufacturer
Non-viral
Convoy™ Cationic Polymer ACTgene
GeneCellin™ Cationic Polymer Bio Cell Challenge
Lipofectamine®
Cationic Lipid Invitrogen
Effectene Non- liposomal Qiagen
Superfect activated dendrimer Qiagen
Fugene 6® Non-liposomal Promega
TransIT Not disclosed Mirus Bio
TransFast™ Synthetic cationic lipid Promega
JetPEI® PEI Polyplus Transfection
ExGen 500™ Linear PEI Fermentas/Thermo Sci
TurboFect Cationic Polymer Fermentas/Thermo Sci
Escort™ Cationic Liposome (DOTAP DOPE 1:1) Sigma Aldrich Co. LLC.
NeuroPORTER™ Cationic lipid Genlantis
HiFect®
Biochemical trasnfection agent Lonza
X-tremeGENE Non-liposomal reagent, synthetic Roche
Genejuice® Not disclosed Millipore
Glycofect Not disclosed Kerafast
Viral
SMARTvector Lenti Virus Thermo Sci
Virapower™ Adenovirus or lentivirus Invitrogen
Polybrene® Retrovirus Millipore
rAVE™ AAV Gene Detect

CHAPTER-1: INTRODUCTION
9
Unfortunately, this major limitation i.e. low transfection efficiency (TE) of non-viral
vectors must be overcome for such systems to be recognized as the ideal vehicles for gene
delivery [7, 33, 40]. The low TEs associated with non-viral delivery systems are directly
attributed to the various barriers encountered by those vectors (discussed later) during the
process of gene delivery. Table-1.3 illustrates a comparison of the advantages and
disadvantages between viral and non-viral vectors in gene therapy. Literature suggests that
cationic amphiphiles are considered to be promising alternatives for viral vectors in gene
therapy [7, 41]. Thus, extensive research is necessary in this field concerning the mechanism
of overcoming the delivery barriers for non-viral vectors for the rational design of suitable
non-viral delivery systems for clinical use [39, 42-44].
The discussion of all the available nonviral vectors is beyond the scope of this thesis.
Between the two most widely used synthetic non-viral vectors – namely cationic lipids &
cationic polymers – only the cationic lipids (also known as cytofectins [45]) will be discussed
in this dissertation. For non-viral gene delivery, the role of a synthetic based vector is to bind
with therapeutic DNA sufficiently and rapidly, then to penetrate the target cell where the
vector releases the DNA from the complex and then uptake of DNA by the nucleus [19, 46-
49]. The first, key step in the whole process is the compaction of DNA into a positively
charged (or neutral) particle small enough to be taken up by the negatively charged cell [18,
19, 48, 49]. This generally requires a synthetic chemical species bearing multiple positive
charges to replace the monovalent counterions of DNA [48].
CHAPTER-1: INTRODUCTION
10
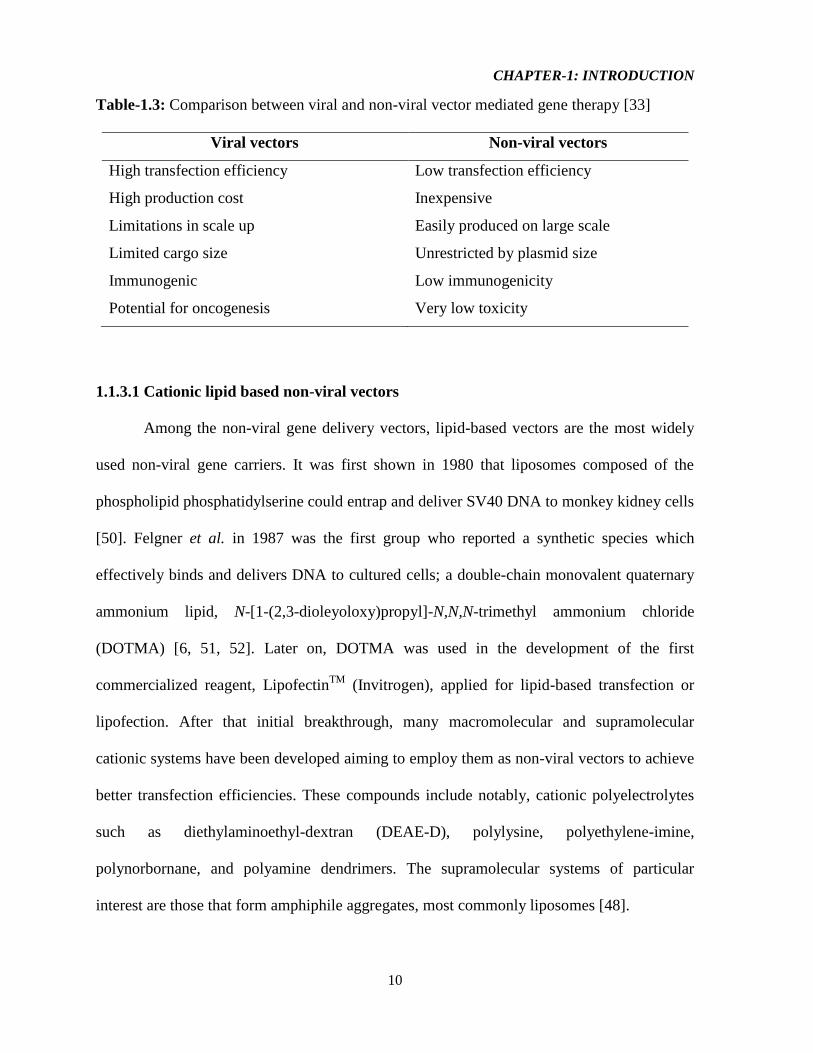
Table-1.3: Comparison between viral and non-viral vector mediated gene therapy [33]
Viral vectors Non-viral vectors
High transfection efficiency Low transfection efficiency
High production cost Inexpensive
Limitations in scale up Easily produced on large scale
Limited cargo size Unrestricted by plasmid size
Immunogenic Low immunogenicity
Potential for oncogenesis Very low toxicity
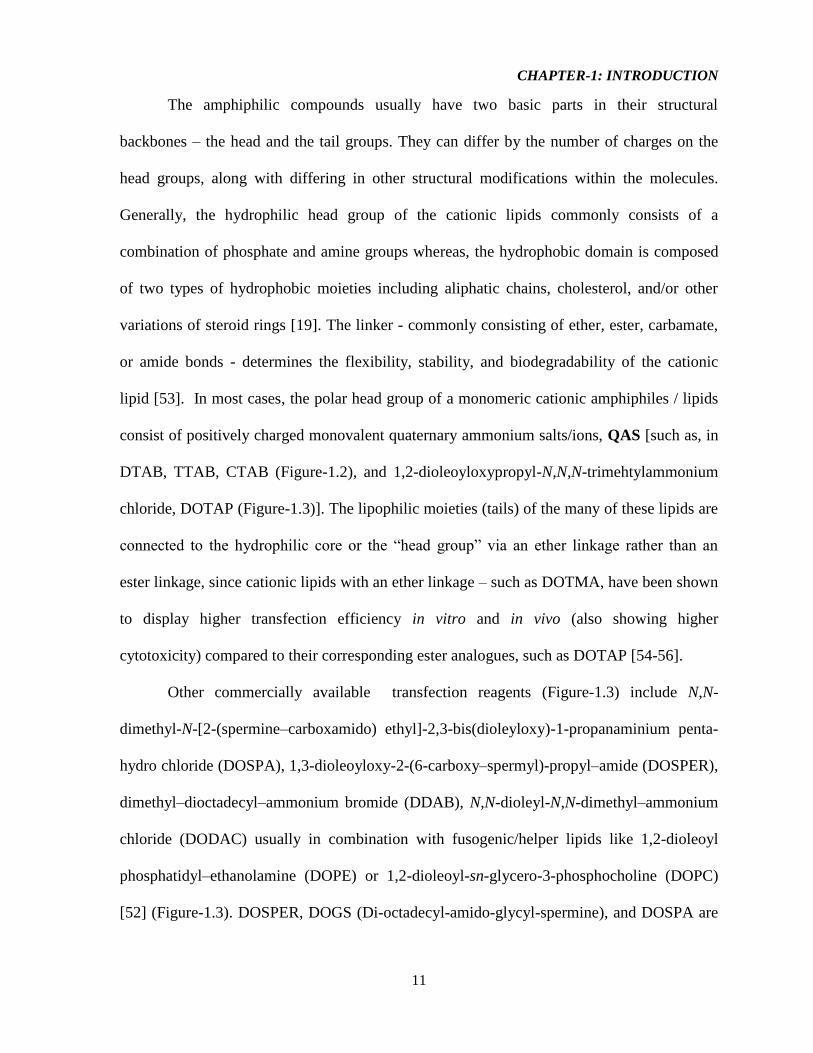
1.1.3.1 Cationic lipid based non-viral vectors
Among the non-viral gene delivery vectors, lipid-based vectors are the most widely
used non-viral gene carriers. It was first shown in 1980 that liposomes composed of the
phospholipid phosphatidylserine could entrap and deliver SV40 DNA to monkey kidney cells
[50]. Felgner et al. in 1987 was the first group who reported a synthetic species which
effectively binds and delivers DNA to cultured cells; a double-chain monovalent quaternary
ammonium lipid, N-[1-(2,3-dioleyoloxy)propyl]-N,N,N-trimethyl ammonium chloride
(DOTMA) [6, 51, 52]. Later on, DOTMA was used in the development of the first
commercialized reagent, LipofectinTM
(Invitrogen), applied for lipid-based transfection or
lipofection. After that initial breakthrough, many macromolecular and supramolecular
cationic systems have been developed aiming to employ them as non-viral vectors to achieve
better transfection efficiencies. These compounds include notably, cationic polyelectrolytes
such as diethylaminoethyl-dextran (DEAE-D), polylysine, polyethylene-imine,
polynorbornane, and polyamine dendrimers. The supramolecular systems of particular
interest are those that form amphiphile aggregates, most commonly liposomes [48].
CHAPTER-1: INTRODUCTION
11
The amphiphilic compounds usually have two basic parts in their structural
backbones – the head and the tail groups. They can differ by the number of charges on the
head groups, along with differing in other structural modifications within the molecules.
Generally, the hydrophilic head group of the cationic lipids commonly consists of a
combination of phosphate and amine groups whereas, the hydrophobic domain is composed
of two types of hydrophobic moieties including aliphatic chains, cholesterol, and/or other
variations of steroid rings [19]. The linker - commonly consisting of ether, ester, carbamate,
or amide bonds - determines the flexibility, stability, and biodegradability of the cationic
lipid [53]. In most cases, the polar head group of a monomeric cationic amphiphiles / lipids
consist of positively charged monovalent quaternary ammonium salts/ions, QAS [such as, in
DTAB, TTAB, CTAB (Figure-1.2), and 1,2-dioleoyloxypropyl-N,N,N-trimehtylammonium
chloride, DOTAP (Figure-1.3)]. The lipophilic moieties (tails) of the many of these lipids are
connected to the hydrophilic core or the “head group” via an ether linkage rather than an
ester linkage, since cationic lipids with an ether linkage – such as DOTMA, have been shown
to display higher transfection efficiency in vitro and in vivo (also showing higher
cytotoxicity) compared to their corresponding ester analogues, such as DOTAP [54-56].
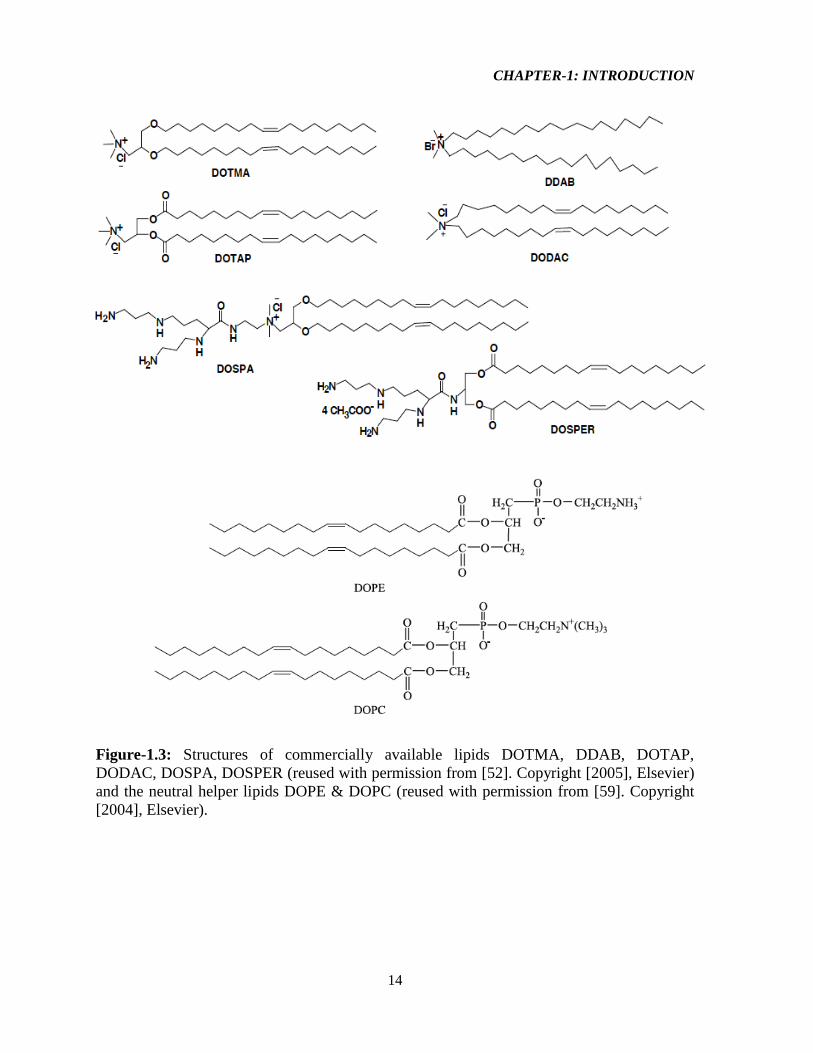
Other commercially available transfection reagents (Figure-1.3) include N,N-
dimethyl-N-[2-(spermine–carboxamido) ethyl]-2,3-bis(dioleyloxy)-1-propanaminium penta-
hydro chloride (DOSPA), 1,3-dioleoyloxy-2-(6-carboxy–spermyl)-propyl–amide (DOSPER),
dimethyl–dioctadecyl–ammonium bromide (DDAB), N,N-dioleyl-N,N-dimethyl–ammonium
chloride (DODAC) usually in combination with fusogenic/helper lipids like 1,2-dioleoyl
phosphatidyl–ethanolamine (DOPE) or 1,2-dioleoyl-sn-glycero-3-phosphocholine (DOPC)
[52] (Figure-1.3). DOSPER, DOGS (Di-octadecyl-amido-glycyl-spermine), and DOSPA are
CHAPTER-1: INTRODUCTION
12
three examples of cationic lipids with modified head groups derived from the polyamine
called spermine. The increased cationic groups in these multivalent lipids promote stronger
DNA interaction for enhanced delivery. Modification of the alkyl tail such as replacement of
the tail(s) with the application of cholesterol derived cationic lipids, DC-Chol (3β-[N-(N',N'-
dimethylaminoethyl) carbamoyl] cholesterol), was shown to promote better stability and
reduced cytotoxicity for improved transfection efficiencies in vitro [57].
. - -
DTAB TTAB
-
CTAB
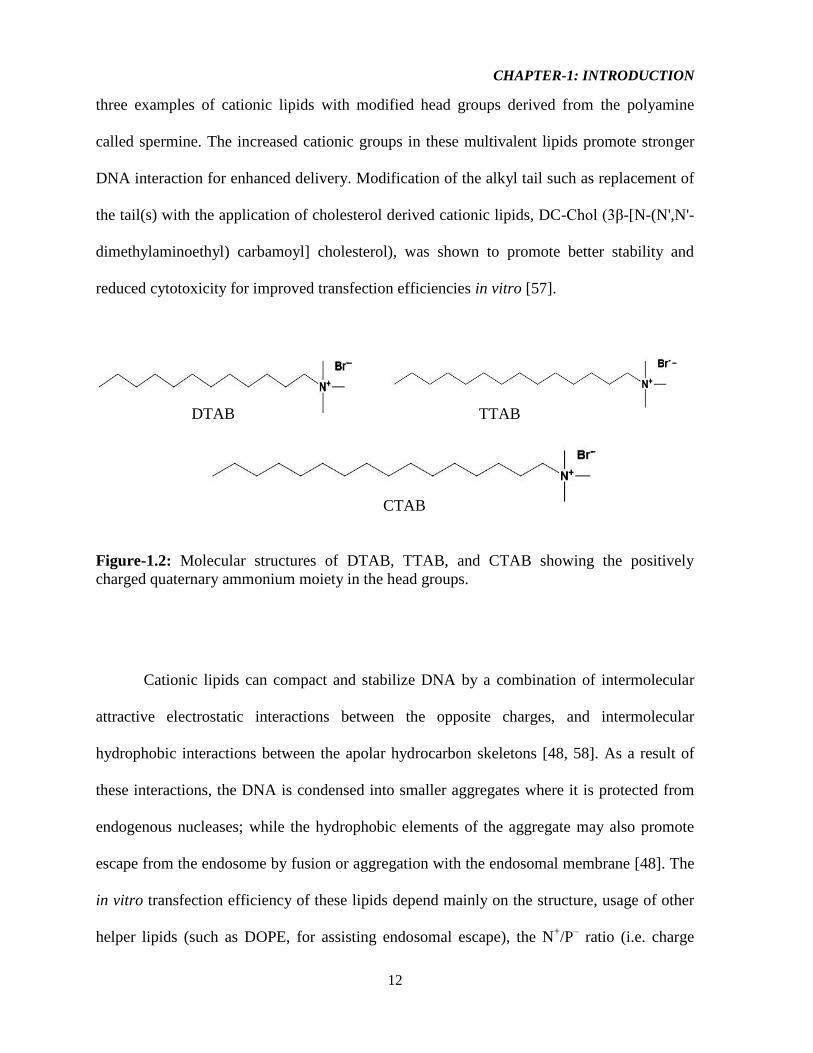
Figure-1.2: Molecular structures of DTAB, TTAB, and CTAB showing the positively
charged quaternary ammonium moiety in the head groups.
Cationic lipids can compact and stabilize DNA by a combination of intermolecular
attractive electrostatic interactions between the opposite charges, and intermolecular
hydrophobic interactions between the apolar hydrocarbon skeletons [48, 58]. As a result of
these interactions, the DNA is condensed into smaller aggregates where it is protected from
endogenous nucleases; while the hydrophobic elements of the aggregate may also promote
escape from the endosome by fusion or aggregation with the endosomal membrane [48]. The
in vitro transfection efficiency of these lipids depend mainly on the structure, usage of other
helper lipids (such as DOPE, for assisting endosomal escape), the N+/P
– ratio (i.e. charge
CHAPTER-1: INTRODUCTION
13
ratio) of the lipids to DNA, the size and magnitude of the charge of the lipoplex, and the type
of cell lines under treatment. Limitations of cationic lipids include low efficacy owing to
poor stability and rapid clearance, as well as the generation of inflammatory or anti-
inflammatory responses [50]. Recently, Allovectin-7, which is a locally administered for-
mulation consisting of (±)-N-(2-hydroxyethyl)-N,N-dimethyl-2,3-bis(tetradecyloxy)-1-
propanaminium bromide (DMRIE) – DOPE and a DNA plasmid, failed to meet its efficacy
end points in a Phase III clinical trial for treatment of advanced metastatic melanoma [50].
Nonetheless, various liposomal formulations continue to be developed clinically, including
DOTAP– cholesterol, Vaxfectin® and GL67A–DOPE– DMPE–polyethylene glycol (PEG)
(Table-1.4) [50]. Notably, the new cytofectin formulation, Vaxfectin® which is composed of
(±)-N-(3-aminopropyl)-N,N-dimethyl-2,3-bis(cis-9-tetradecenyloxy)-1-propanaminium
bromide (GAP-DMORIE) and the co-lipid, 1,2-diphytanoyl-sn-glycero-3-
phosphoethanolamine (DPyPE), has shown significant enhancement of humoral immune
responses against pDNA encoded antigens compared with naked pDNA [45].
CHAPTER-1: INTRODUCTION
14
Figure-1.3: Structures of commercially available lipids DOTMA, DDAB, DOTAP,
DODAC, DOSPA, DOSPER (reused with permission from [52]. Copyright [2005], Elsevier)
and the neutral helper lipids DOPE & DOPC (reused with permission from [59]. Copyright
[2004], Elsevier).
CHAPTER-1: INTRODUCTION
15
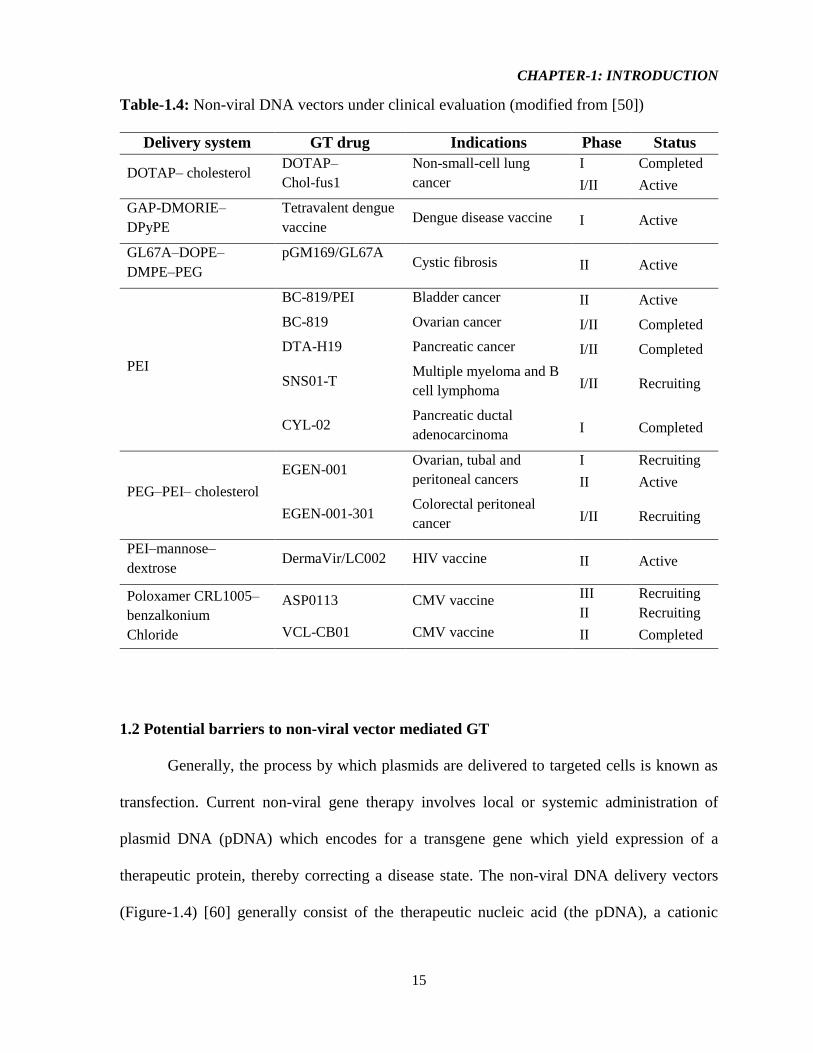
Table-1.4: Non-viral DNA vectors under clinical evaluation (modified from [50])
Delivery system GT drug Indications Phase Status
DOTAP– cholesterol DOTAP–
Chol-fus1
Non-small-cell lung
cancer
I Completed
I/II Active
GAP-DMORIE–
DPyPE
Tetravalent dengue
vaccine Dengue disease vaccine I Active
GL67A–DOPE–
DMPE–PEG
pGM169/GL67A
Cystic fibrosis II Active
PEI
BC-819/PEI Bladder cancer II Active
BC-819 Ovarian cancer I/II Completed
DTA-H19 Pancreatic cancer I/II Completed
SNS01-T Multiple myeloma and B
cell lymphoma I/II Recruiting
CYL-02 Pancreatic ductal
adenocarcinoma I Completed
PEG–PEI– cholesterol
EGEN-001 Ovarian, tubal and
peritoneal cancers
I Recruiting
II Active
EGEN-001-301 Colorectal peritoneal
cancer I/II Recruiting
PEI–mannose–
dextrose DermaVir/LC002 HIV vaccine II Active
Poloxamer CRL1005–
benzalkonium
Chloride
ASP0113 CMV vaccine III Recruiting
II Recruiting
VCL-CB01 CMV vaccine II Completed
1.2 Potential barriers to non-viral vector mediated GT
Generally, the process by which plasmids are delivered to targeted cells is known as
transfection. Current non-viral gene therapy involves local or systemic administration of
plasmid DNA (pDNA) which encodes for a transgene gene which yield expression of a
therapeutic protein, thereby correcting a disease state. The non-viral DNA delivery vectors
(Figure-1.4) [60] generally consist of the therapeutic nucleic acid (the pDNA), a cationic
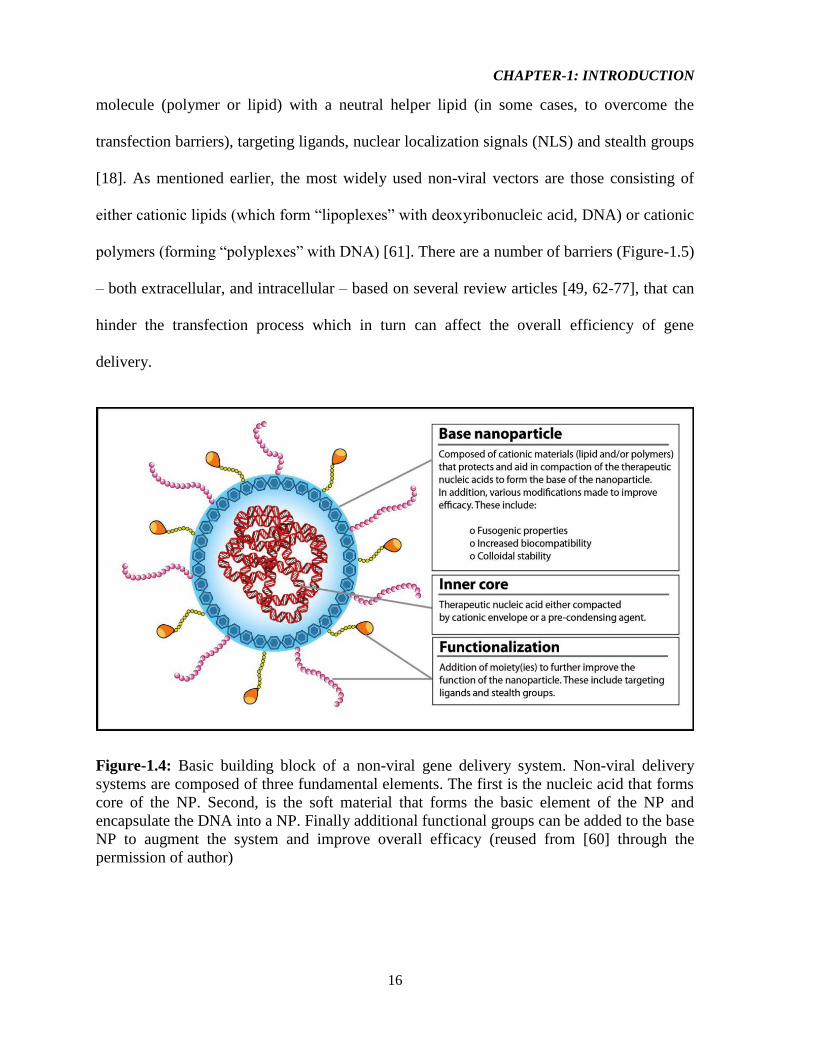
CHAPTER-1: INTRODUCTION
16
molecule (polymer or lipid) with a neutral helper lipid (in some cases, to overcome the
transfection barriers), targeting ligands, nuclear localization signals (NLS) and stealth groups
[18]. As mentioned earlier, the most widely used non-viral vectors are those consisting of
either cationic lipids (which form “lipoplexes” with deoxyribonucleic acid, DNA) or cationic
polymers (forming “polyplexes” with DNA) [61]. There are a number of barriers (Figure-1.5)
– both extracellular, and intracellular – based on several review articles [49, 62-77], that can
hinder the transfection process which in turn can affect the overall efficiency of gene
delivery.
Figure-1.4: Basic building block of a non-viral gene delivery system. Non-viral delivery
systems are composed of three fundamental elements. The first is the nucleic acid that forms
core of the NP. Second, is the soft material that forms the basic element of the NP and
encapsulate the DNA into a NP. Finally additional functional groups can be added to the base
NP to augment the system and improve overall efficacy (reused from [60] through the
permission of author)
CHAPTER-1: INTRODUCTION
17
Briefly, the extracellular barriers consist of vector instability due to components
within the blood, adhesion to non-targeted tissues, phagocytosis of vector by macrophage,
and DNA-degradation [73] In blood circulation, the vector-DNA complexes must evade
uptake by macrophages, clearance by renal filtration, and must have improved ability to
circumvent the RES (reticulo-endothelial system) and degradation by endogenous nuclease
[78]. They need to traverse from blood vessels to target tissues followed by subsequent
translocation into the cells impacting mitochondrial respiration, ATP synthesis, activity of
drug efflux transporters, apoptotic signal transduction, and gene expression [78]. Despite
some tissues such as tumors, inflammatory sites and the RES (e.g., liver, spleen) with leaky
blood vessels, the capillary vessel walls in most organs and tissues are impermeable to large
nucleic acids. Furthermore, extracellular matrix (ECM) resists the movement of gene
medicines to target cells due to its dense polysaccharides and fibrous proteins [73]. The
intracellular barriers include cellular internalization of the vector (cell membrane itself is a
major barrier), escape from the endosome and delivery in the cytoplasm, dissociation of the
nucleic acid-vector complex, cytosolic trafficking of nucleic acid, and nuclear entry of the
DNA cargo [18, 73].
CHAPTER-1: INTRODUCTION
18
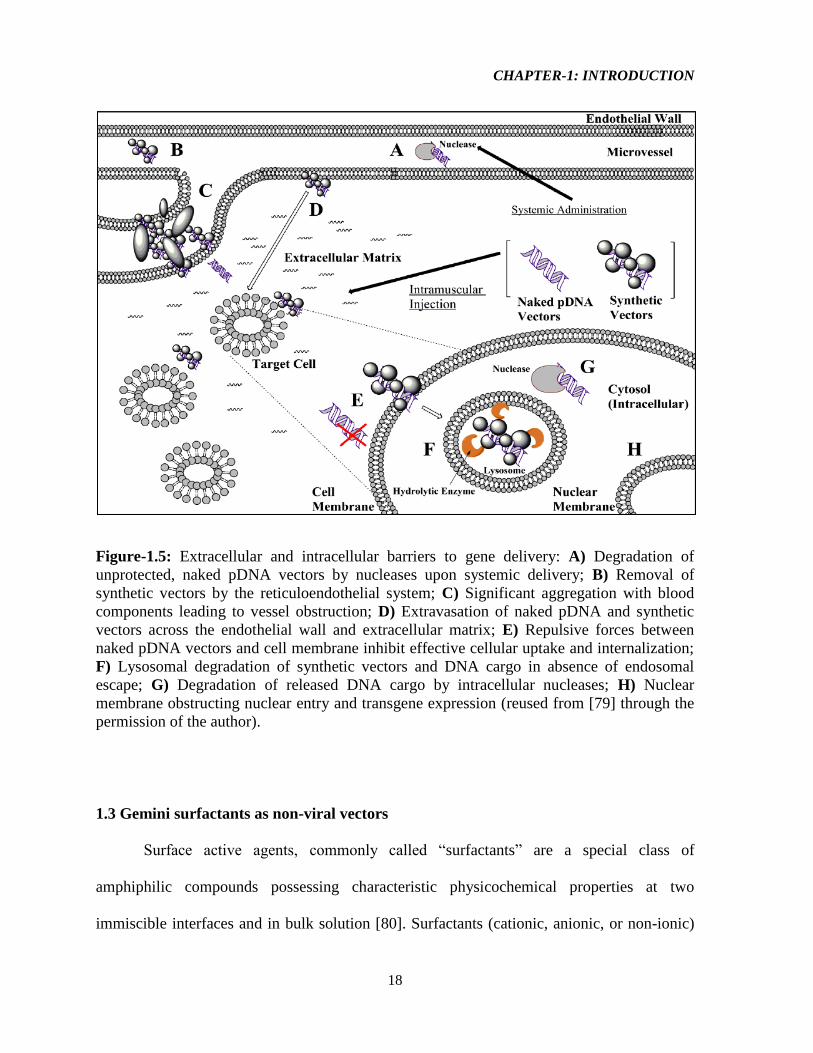
Figure-1.5: Extracellular and intracellular barriers to gene delivery: A) Degradation of
unprotected, naked pDNA vectors by nucleases upon systemic delivery; B) Removal of
synthetic vectors by the reticuloendothelial system; C) Significant aggregation with blood
components leading to vessel obstruction; D) Extravasation of naked pDNA and synthetic
vectors across the endothelial wall and extracellular matrix; E) Repulsive forces between
naked pDNA vectors and cell membrane inhibit effective cellular uptake and internalization;
F) Lysosomal degradation of synthetic vectors and DNA cargo in absence of endosomal
escape; G) Degradation of released DNA cargo by intracellular nucleases; H) Nuclear
membrane obstructing nuclear entry and transgene expression (reused from [79] through the
permission of the author).
1.3 Gemini surfactants as non-viral vectors
Surface active agents, commonly called “surfactants” are a special class of
amphiphilic compounds possessing characteristic physicochemical properties at two
immiscible interfaces and in bulk solution [80]. Surfactants (cationic, anionic, or non-ionic)
CHAPTER-1: INTRODUCTION
19
are versatile materials used in numerous products for purposes including motor oils,
pharmaceuticals, detergents and petroleum, as floating aids for applications, and in high-
technology areas like mining, petroleum, chemical, biochemical research, electronics,
printing, magnetic recording, biotechnology and microelectronics [81, 82]. As surfactants are
utilized extensively throughout the world every day, the quest for high-efficiency,
environment friendly novel surfactants is ongoing.
Classic surfactant molecules are generally composed of two distinct parts in their
molecular structure: one polar head group and a nonpolar alkyl chain or tail. Due to this dual
polar-non polar character, surfactant molecules are often termed as “amphiphiles” [80, 81].
When surfactants are dissolved in water, their hydrophobic groups are directed away from
the water and the free energy of the solution is minimized through a phenomenon called the
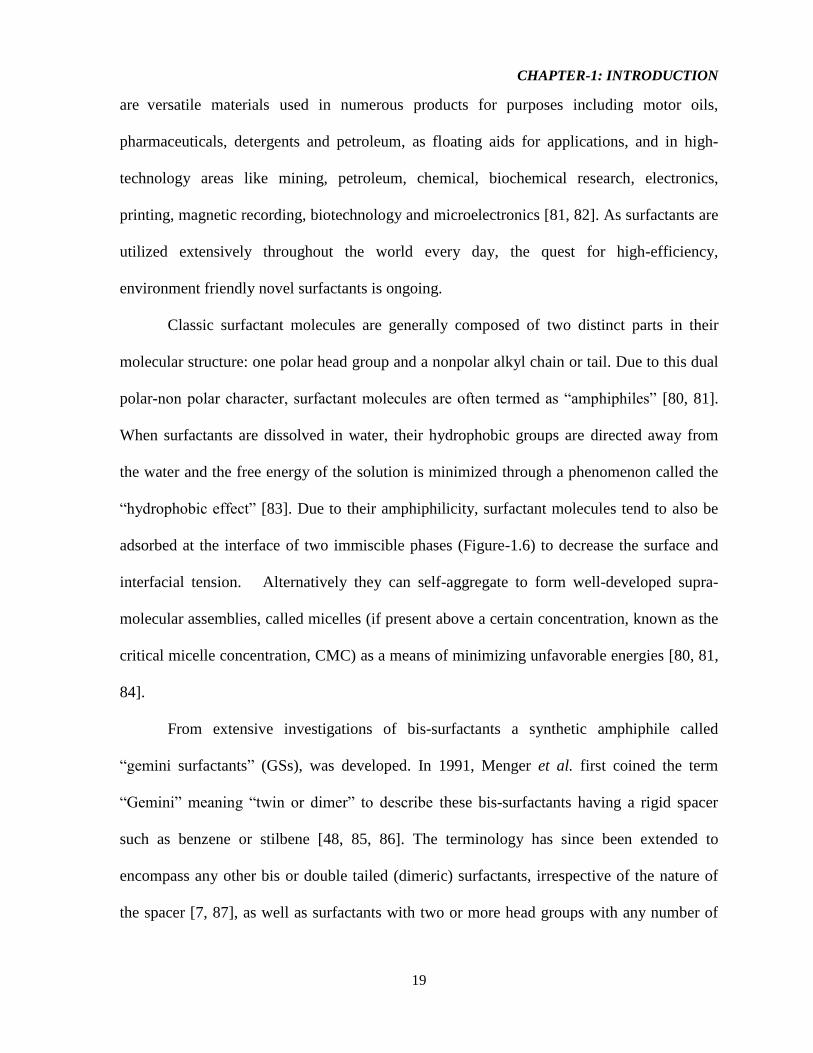
“hydrophobic effect” [83]. Due to their amphiphilicity, surfactant molecules tend to also be
adsorbed at the interface of two immiscible phases (Figure-1.6) to decrease the surface and
interfacial tension. Alternatively they can self-aggregate to form well-developed supra-
molecular assemblies, called micelles (if present above a certain concentration, known as the
critical micelle concentration, CMC) as a means of minimizing unfavorable energies [80, 81,
84].
From extensive investigations of bis-surfactants a synthetic amphiphile called
“gemini surfactants” (GSs), was developed. In 1991, Menger et al. first coined the term
“Gemini” meaning “twin or dimer” to describe these bis-surfactants having a rigid spacer
such as benzene or stilbene [48, 85, 86]. The terminology has since been extended to
encompass any other bis or double tailed (dimeric) surfactants, irrespective of the nature of
the spacer [7, 87], as well as surfactants with two or more head groups with any number of
CHAPTER-1: INTRODUCTION
20
tails [88, 89]. These dimeric gemini surfactants are composed of two monomeric
amphiphilic moieties connected at or near the head group by a spacer or linker group. The
spacer can be short or long, composed of methylene groups, rigid (stilbene), polar (polyether)
or non-polar (aliphatic, aromatic) groups. The polar head group can be positive (ammonium),
negative (phosphate, sulphate, carboxylate) or non-ionic and may be polyether or sugar [6, 7,
48, 55, 85, 86, 89-94].
Figure-1.6: Schematic representation of typical adsorption and formation of aggregates by
self-assembled amphiphiles (adapted from [83]).
In addition to structural variables associated with simple surfactants (such as tail
length and degree of branching, ionic nature of the head group, and counterion type), GSs are
CHAPTER-1: INTRODUCTION
21
also characterized by the number of heads (dimer, trimer, tetramer, etc.), and spacer
solubility (i.e., hydrophilic or hydrophobic) [6, 88, 89]. Gemini analogues of lipids (also
called gemini lipids) have also been reported, which possess multiple head groups and at
least four or more hydrophobic chains as shown in Scheme-1.1 [6, 88]. The great majority of
gemini structures are symmetric with two identical polar groups and two identical chains.
The most commonly studied series of GS is the N,N’-bis (dimethylalkyl)-alkane-
diammonium-dibromide series, or “m-s-m” DMA type gemini surfactants (DMA=dimethyl
ammonium, the m in this notation refers to the number of carbon atoms in the alkyl tails,
while s refers to the number of atoms making up the spacer group) [6, 7, 48, 55, 85, 91, 95].
However, unsymmetrical gemini molecules and GS with three or more polar groups or tails
have also been reported [6, 96, 97].
Gemini surfactants possess unique properties that directly result from their novel
structure, such as a critical micelle concentration (CMC) that is 10 – 100 orders of magnitude
lower than their monomeric counterparts, a thousand-fold increase in surface activity, greater
efficiency in lowering the surface tension, lower Kraft temperature, better solubilization,
better wetting, viscoelasticity, gelification, and shear thickening than the corresponding
conventional monomeric surfactants [7, 80, 81, 84, 92, 94, 98-100].
Due to their unique properties, gemini surfactants have wide applications in skin care
formulations, templates for the synthesis of nanoparticles, biomedical application including
gene delivery, drug entrapment/release, soil remediation, enhanced oil recovery, and
antimicrobial activity as effective emulsifiers, dispersants, bactericidal agents, antifoaming
agents, and detergents. [92, 101, 102]. The extremely low CMC of GSs means reduced
toxicity in vivo as well as minimized cost since less surfactants is required [7, 55].
CHAPTER-1: INTRODUCTION
22
Furthermore, as the GSs provide a higher positive charge per mass ratio than the monomeric
counterparts, a relatively lower amount is sufficient to rapidly complex a given aliquot of
DNA in a more compact fashion leading to smaller sized nanoparticles (a critical factor for
cellular uptake and intracellular trafficking) [6].
The general structure of gemini surfactants is shown in Scheme-1.1 [7, 103]. The long
hydrocarbon chain of the GS tends to increase the surface activity. Increasing the
hydrophobicity may make the molecule water-insoluble, whereas increasing the
hydrophilicity of the head group may impart water solubility. Hydrophilic groups in the
spacer also increase the aqueous solubility. An increase in carbon number in the nonpolar
chain increases both lipophilicity and surface activity [6, 89]. Hence, the molecular structure
of the GSs provides significant opportunities to vary their structure compared to their
monomeric counterparts by independently modifying the spacer, one or both head-groups,
and one or both hydrophobic tails or the associated counterions to obtain an extremely wide
range of compounds. This ultimately opens a new horizon to fine tune the self-aggregation of
GSs based liposomes to obtain a better control on biological activity (DNA delivery) and
other solution properties [7, 55].
Owing to their remarkable properties, considerable attempt has been made for the
design and synthesis of novel GSs of various categories to study the relationship between
their molecular structures and their aggregation morphologies in aqueous solution [104]. In
comparison of the monomeric counterparts of the GSs, the spacer group has been known to
strongly affect the self-assembly of gemini surfactants in aqueous solution, and thus
considered as a unique component in gemini structure. So far, the various gemini surfactants

CHAPTER-1: INTRODUCTION
23
containing different spacers, for example, a flexible hydrophilic, flexible hydrophobic, or
rigid hydrophobic, have been investigated [104, 105].
A
B
C D
Scheme-1.1: (A) General structure of a conventional and gemini surfactant (without the
associated counterions); (B) Structure of m-s-m GSs (C) Model representing simple lipids,
and (D) Gemini lipids {A & B – adapted from [7]}.
Numerous studies reveled that gemini surfactants are able to compact DNA
efficiently when the spacer length s is <4 or >10. Besides, the spacer lengths correspond to

CHAPTER-1: INTRODUCTION
24
conditions where cylindrical micelles (s < 4) or bilayer structures (s > 12) are known to form.
Conversely, intermediate length spacers in gemini were found to be less effective [7, 106,
107]. Now, in case of hydrophobic tail lengths, a general rule for ionic surfactants is that, in
aqueous medium, the CMC decreases as the number of carbon atoms in the hydrophobic
group increases and it is halved by the addition of one methylene group to a straight-chain
hydrophobic group attached to a single terminal hydrophilic group. Due to the coiling of the
long chains in water, when the number of carbon atoms in a straight-chain hydrophobic
group exceeds 16, the CMC no longer decreases so rapidly with increase in the length of the
chain, and when the chain exceeds 18 carbons it may remain substantially unchanged with
further increase in the chain length [108, 109].
1.3.1 Gemini Surfactants (GSs) for DNA transfection in GT
Compaction of DNA by gemini surfactants is affected by both the nature of the head
group (effective head group area, valence) and the length and saturation of the hydrophobic
tail. The optimal structure(s) formed by self-aggregation of these surfactants can be predicted
by the surfactant packing parameter or critical packing parameter, CPP or P (Figure-1.7),
which can be calculated by the following equation –
P = v / (a0*l) 1.1
where v = volume of alkyl tail, l = length of alkyl tail, and a0
= surface area occupied by the
head-group. The P value indicates the preferred curvature of the structure and a value of 0.3
is typical for spherical micelle organization (highly curved), whereas P = 1 represents planar
bilayer formation and P > 1 applies to inverted micelles [7, 108, 110].
CHAPTER-1: INTRODUCTION
25
P =
+ 0 –
Aggregate curvature
Figure-1.7: Packing parameter showing different morphologies of amphiphilic aggregates
defined by Israelachvili (adapted from [83]).
When binding with negatively charged DNA the packing parameter for vesicle
systems (P > 0.5) is larger than that of micelle systems (P < 0.5), and therefore it is easier for
a vesicle system to form non-lamellar structures such as inverted hexagonal and cubic
morphologies (P≥1). When lipoplexes interact with anionic lipids it makes DNA release
easier from the lipoplexes and the low curvature phases (inverted hexagonal and cubic
morphologies) are the controlling factors in lipid-mediated delivery [110].
Electrostatic forces along with attractive hydrophobic interactions, hydrophobic
hydration, and the repulsive forces existing between DNA – DNA and surfactant – surfactant
molecules trigger the formation of DNA – surfactant complexes for gene delivery [93, 110].
These interactions change the shape and size of macromolecular DNA without the loss of
CHAPTER-1: INTRODUCTION
26
therapeutic (biological) properties of the genetic material, into various morphological shapes
that are readily taken up by cells [103].
As mentioned previously, the cationic gemini surfactants effectively complex and
condense the DNA and provide an overall positive charge to the transfection complex
(depending on the charge ratio used) to allow interaction with the negatively charged cell
membrane. Studies on transfection efficiencies of gemini-DNA complexes with respect to
charge ratio suggested that transfection was optimum with excess cationic gemini where the
gemini/DNA charge ratio is approximately 10 [110]. After the rapid uptake of the DNA-
vector complexes by the cell, it is thought that the transfection complexes will escape the
endosome by their ability to form different morphological shapes such as inverse hexagonal
(HC
II) or cubic phases (Pn3m). Gemini surfactants that are capable of forming vesicle
(lamellar) structures in aqueous solution have improved transfection efficiencies than those
with micelle structures due to higher surfactant packing parameter, P value [110].
The total volume of hydrophobic tails of typical cationic surfactant molecules
increase faster than that of the head group areas, because of the existing electrostatic
attraction between the positive head groups and other oppositely charged moieties (such as
counterions). Lamellar lipoplexes generally bind with anionic lipids of cellular membranes
and increase the packing parameter of the cationic surfactants which allow the formation of
inverted hexagonal or cubic structures [110]. However, these non-lamellar structures are not
favorable for binding DNA; instead they are favorable for releasing DNA after cellular
internalization.
CHAPTER-1: INTRODUCTION
27
1.3.1.1 Role of DOPE lipid in gemini mediated DNA transfection for GTs
To achieve better transfection efficiencies 1,2-dioleoyl-sn-glycero-3-phosphatidyl
ethanolyamine, DOPE (Figure-1.3), an important neutral helper lipid is often added to gemini
surfactant-based gene delivery formulations to facilitate the endosomal escape – a crucial
barrier for GT [110].
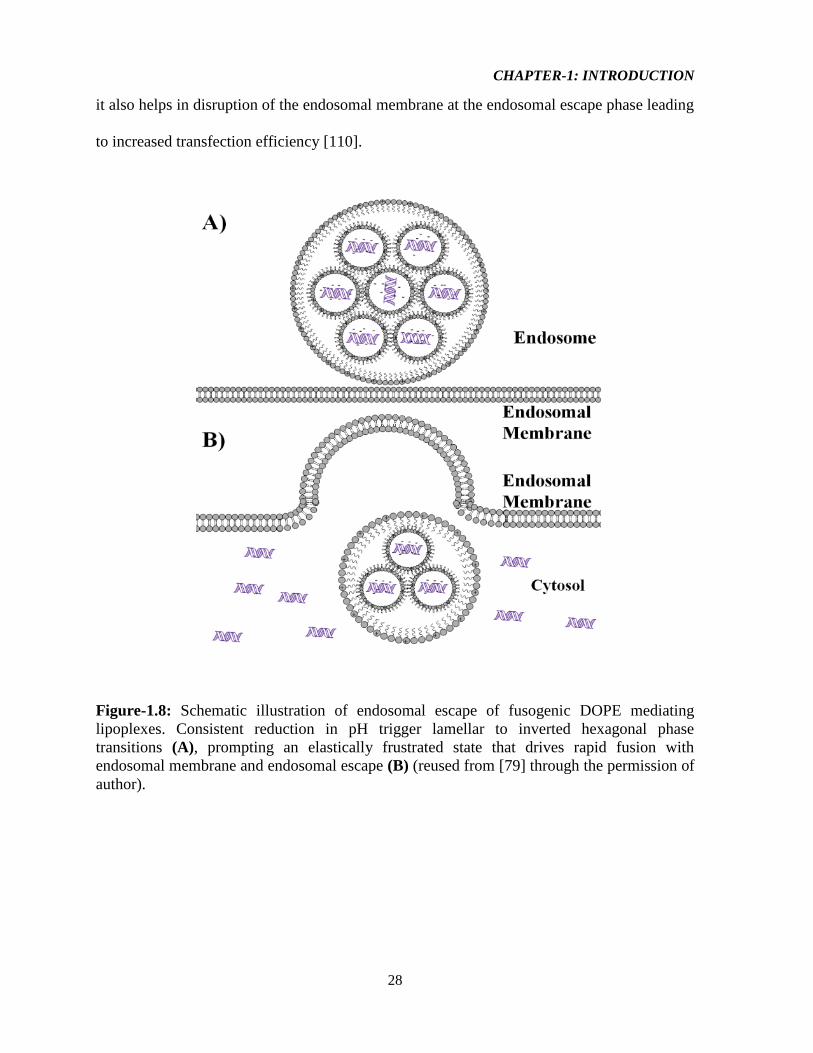
Endosomal escape by DOPE mediated lipoplexes has shown that the escape
mechanism is independent of membrane charge density. Inside the cell membrane, generally
when the endosome matures to lysosome, its pH reduces to acidic condition. This drop in pH
triggers lamellar (LC
α) to inverted hexagonal phase (HC
II) transitions of DOPE lipids in the
lipoplexes. The negative curvature of this inverted hexagonal lipoplexes results in an
elastically frustrated state with the outer lipid monolayer, possessing a positive curvature,
that surrounds the lipoplexes; this establishes the driving force for rapid fusion with cell and
endosomal membranes [111, 112] (Figure-1.8), hence the DOPE is sometimes termed as
“fusogenic lipids”. The ability of DOPE mediated lipoplexes to adopt inverted hexagonal
phase structures for rapid fusion and endosomal escape is a significant contributing factor
[110] to higher transfection efficiency when compared to lipoplexes with lamellar phase
structures.
Studies have shown that the presence of the helper lipid DOPE increased the
transfection efficiency about 10 fold [103, 113]. Addition of pure DOPE causes formation of
mixed aggregates with higher (greater than unity) packing parameter value of the systems;
shifting micelle systems towards vesicles, and vesicle systems toward the inverted hexagonal
or even cubic phase. In addition, DOPE has a positive role to increase the fluidity of cellular
membranes and thus facilitates the penetration of genetic materials into the cell. Furthermore,
CHAPTER-1: INTRODUCTION
28
it also helps in disruption of the endosomal membrane at the endosomal escape phase leading
to increased transfection efficiency [110].
Figure-1.8: Schematic illustration of endosomal escape of fusogenic DOPE mediating
lipoplexes. Consistent reduction in pH trigger lamellar to inverted hexagonal phase
transitions (A), prompting an elastically frustrated state that drives rapid fusion with
endosomal membrane and endosomal escape (B) (reused from [79] through the permission of
author).
CHAPTER-1: INTRODUCTION
29
1.3.2 Effects of Counterions
1.3.2.1 Counterion effects on gemini surfactant aggregation
Many attempts have been made to investigate the effect of salts on micelle formation
in light of the Hofmeister (lyotropic) series and other numerous counterions
(organic/inorganic, monoatomic/polyatomic, nucleotides, peptides etc.) [84, 114-122].
Unfortunately, despite the structural diversity of gemini surfactants, only a few studies have
focused on the effect of the gemini surfactant counterions on the micellization properties
other than bromide or chloride [123]. As the specific properties (solubility, CMC,
aggregation behaviour, richer morphology, and other solution properties) [97, 124] of gemini
varies depending on the associated counterions (along with their chain lengths and spacer
groups), the focus of this section will be to discuss those solutions properties of gemini
surfactants with different inorganic and organic counterions.
The effects of salts on aggregation behaviors of ionic surfactants in aqueous solutions
are vital to many applications for detergency and emulsification in industry as well as in
biotechnological fields [115]. Oda et al. (2010) investigated and analyzed the effect of
counterions to probe the principal ionic effects influencing the micellization behavior of the
dimeric 14-2-14 gemini surfactants [123]. The critical micelle concentration (CMC),
ionization degree of micelle (α), free energy of micellization (ΔGM), and aggregation
numbers (N) of the gemini surfactant (14 – 2 – 14) were used to demonstrate the effect of
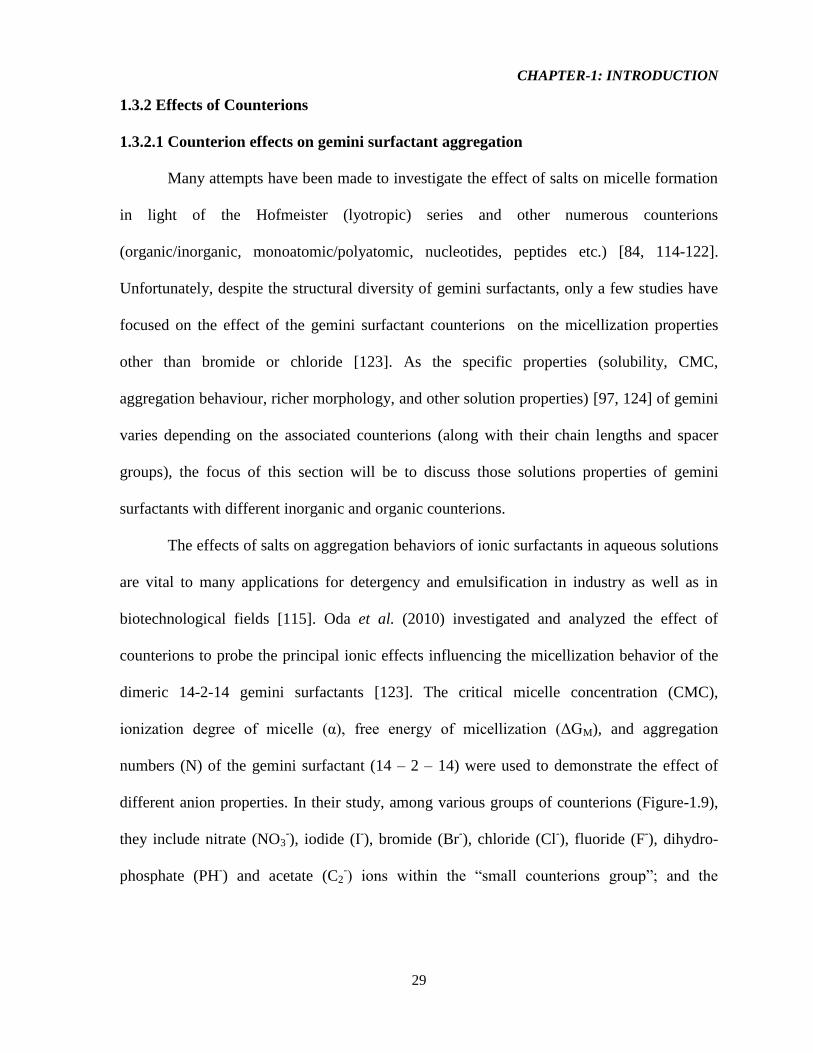
different anion properties. In their study, among various groups of counterions (Figure-1.9),
they include nitrate (NO3-), iodide (I
-), bromide (Br
-), chloride (Cl
-), fluoride (F
-), dihydro-
phosphate (PH-) and acetate (C2
-) ions within the “small counterions group”; and the
CHAPTER-1: INTRODUCTION
30
methoxyacetate (MeOAc), lactate (LACT), trifluoroacetate (TFA), diphenate (DIPH),
sulphate (SO42-
) and tartrate (TART) ions were included in the “orphan group”.
Figure-1.9: Various groups of counterions in the study of Oda et.al (reused with permission
from [123]. Copyright [2010], American Chemical Society).
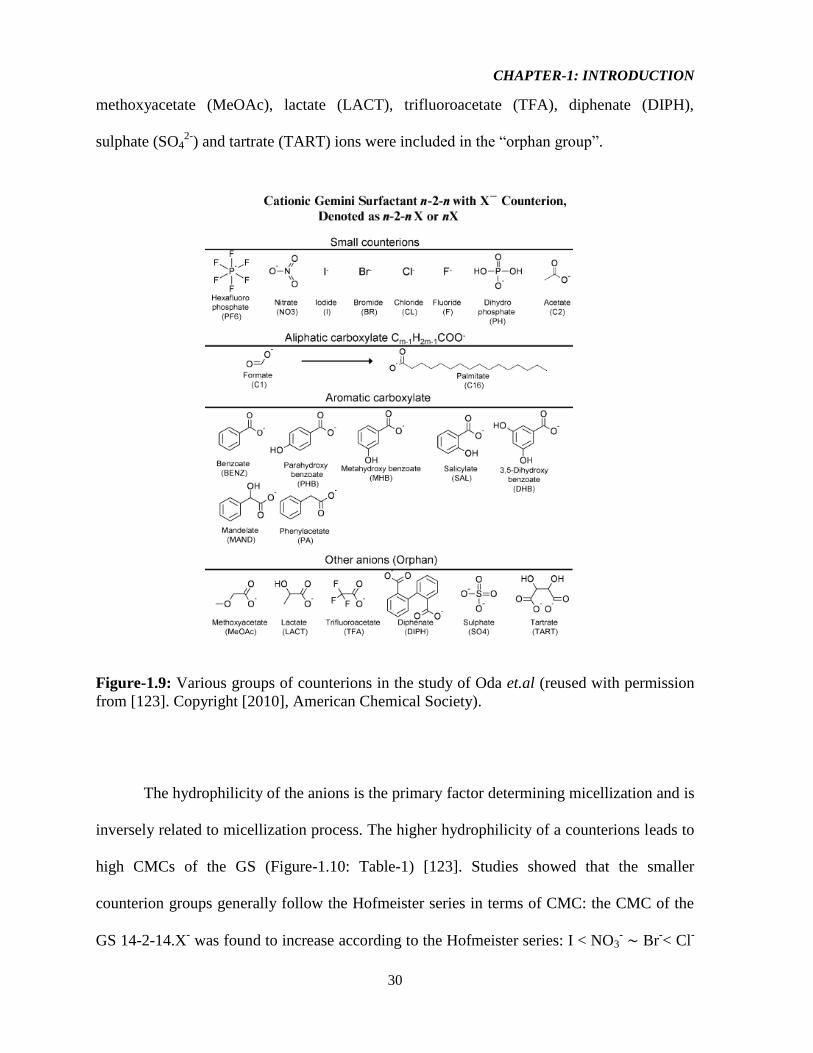
The hydrophilicity of the anions is the primary factor determining micellization and is
inversely related to micellization process. The higher hydrophilicity of a counterions leads to
high CMCs of the GS (Figure-1.10: Table-1) [123]. Studies showed that the smaller
counterion groups generally follow the Hofmeister series in terms of CMC: the CMC of the
GS 14-2-14.X- was found to increase according to the Hofmeister series: I < NO3
- ∼ Br
-< Cl
-
CHAPTER-1: INTRODUCTION
31
< F- ∼ C2
- < PH
-. Among the halide ions of this group, the most polarizable and least
hydrated iodide (I-) ion has a large negative energy transfer value (ΔGHB) indicating that it is
a very chaotropic anion which destroys the structure of water in its vicinity leading to the
lowest CMC value.
Figure-1.10: Table-1 describing the CMC and other parameters of 14-2-14 gemini associated
with the Hofmeister series counterions in the head group (reused with permission from [123].
Copyright [2010], American Chemical Society).
Although two other halides Br- and Cl
- have intermediate properties, the fluoride (F
-)
ion displays opposite properties compared to iodide (I-) ion since it is the smallest anion, the
least polarizable, the most hydrated, and the most Kosmotropic. Overall, for monatomic
anions, the hydration number is directly related to the hydrophilicity: the more hydrophilic
anions have smaller polarizability and higher hydration number leading to higher CMC
values. On the other hand, due to entropic reasons the micellization is disfavored for large
and polyatomic anions with lower hydration number but with similar hydrophilicity of the
monoatomic anions (Figure-1.11: Table-2 & Table-3) [123].
CHAPTER-1: INTRODUCTION
32
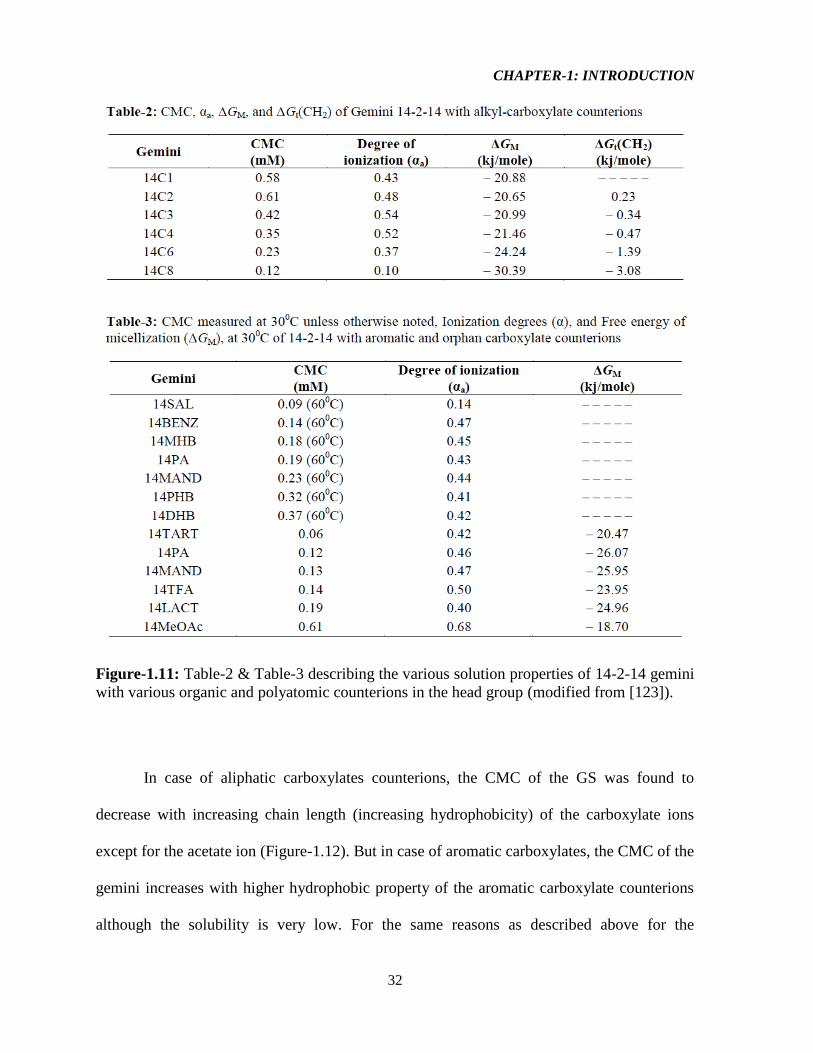
Figure-1.11: Table-2 & Table-3 describing the various solution properties of 14-2-14 gemini
with various organic and polyatomic counterions in the head group (modified from [123]).
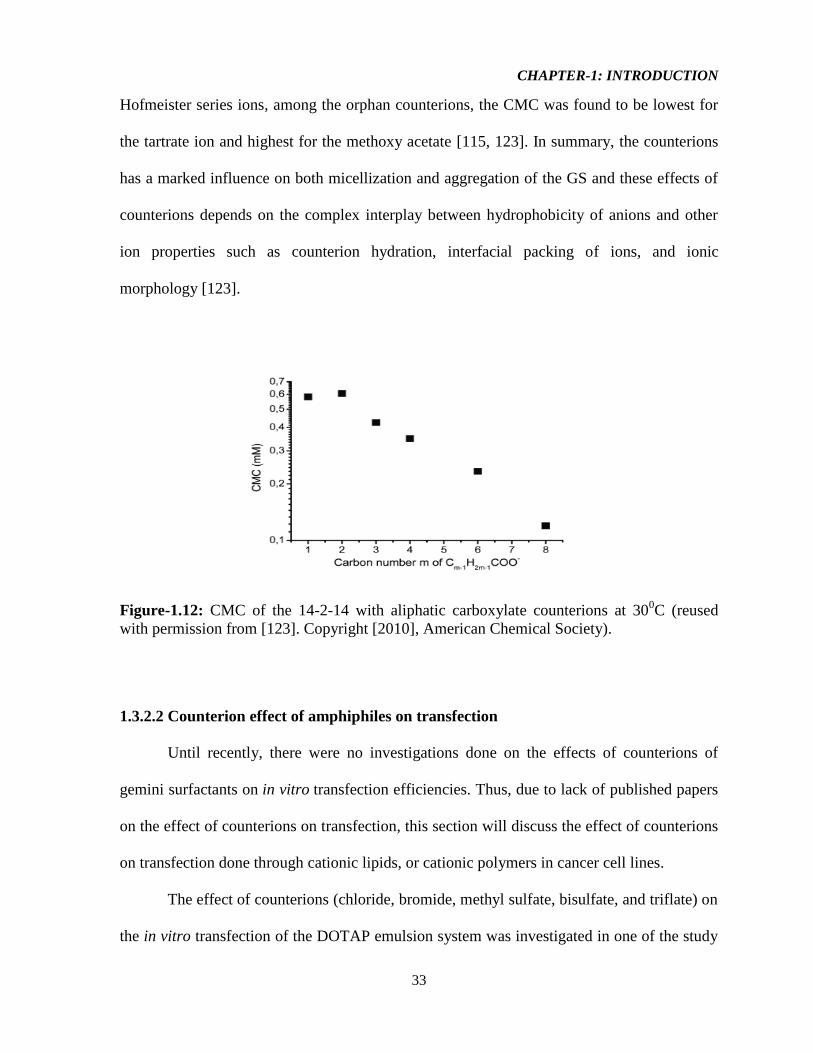
In case of aliphatic carboxylates counterions, the CMC of the GS was found to
decrease with increasing chain length (increasing hydrophobicity) of the carboxylate ions
except for the acetate ion (Figure-1.12). But in case of aromatic carboxylates, the CMC of the
gemini increases with higher hydrophobic property of the aromatic carboxylate counterions
although the solubility is very low. For the same reasons as described above for the
CHAPTER-1: INTRODUCTION
33
Hofmeister series ions, among the orphan counterions, the CMC was found to be lowest for
the tartrate ion and highest for the methoxy acetate [115, 123]. In summary, the counterions
has a marked influence on both micellization and aggregation of the GS and these effects of
counterions depends on the complex interplay between hydrophobicity of anions and other
ion properties such as counterion hydration, interfacial packing of ions, and ionic
morphology [123].
Figure-1.12: CMC of the 14-2-14 with aliphatic carboxylate counterions at 300C (reused
with permission from [123]. Copyright [2010], American Chemical Society).
1.3.2.2 Counterion effect of amphiphiles on transfection
Until recently, there were no investigations done on the effects of counterions of
gemini surfactants on in vitro transfection efficiencies. Thus, due to lack of published papers
on the effect of counterions on transfection, this section will discuss the effect of counterions
on transfection done through cationic lipids, or cationic polymers in cancer cell lines.
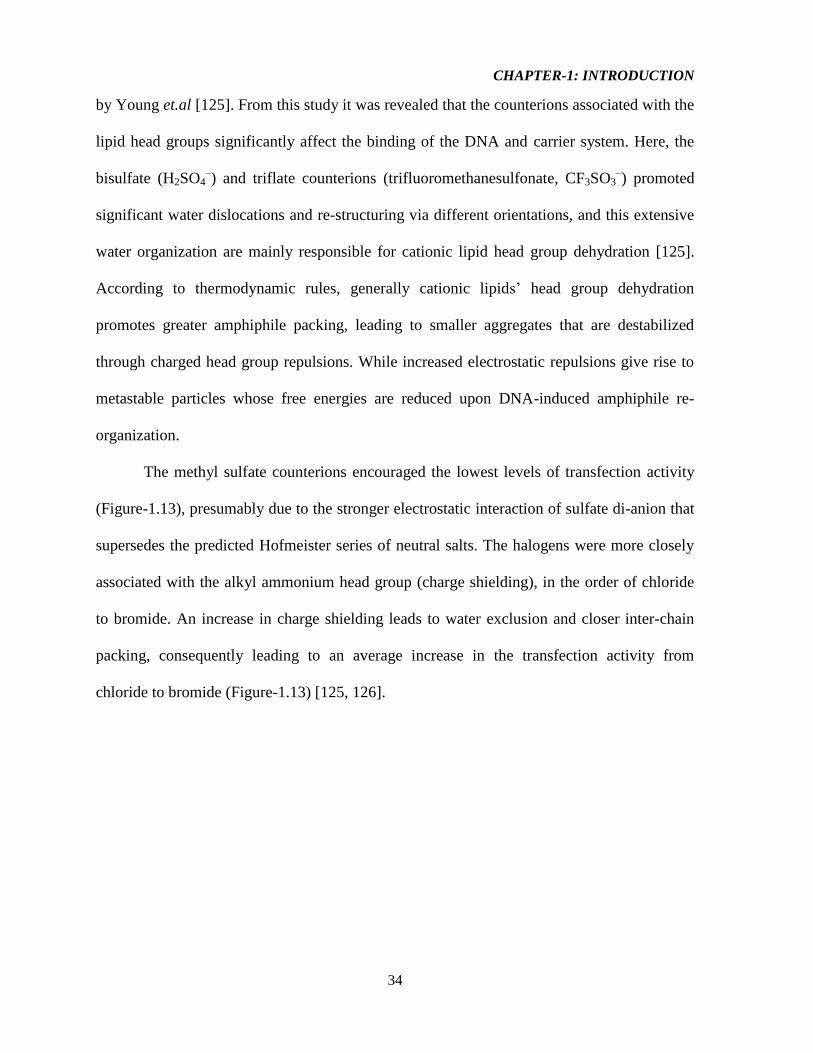
The effect of counterions (chloride, bromide, methyl sulfate, bisulfate, and triflate) on
the in vitro transfection of the DOTAP emulsion system was investigated in one of the study
CHAPTER-1: INTRODUCTION
34
by Young et.al [125]. From this study it was revealed that the counterions associated with the
lipid head groups significantly affect the binding of the DNA and carrier system. Here, the
bisulfate (H2SO4–) and triflate counterions (trifluoromethanesulfonate, CF3SO3
–) promoted
significant water dislocations and re-structuring via different orientations, and this extensive
water organization are mainly responsible for cationic lipid head group dehydration [125].
According to thermodynamic rules, generally cationic lipids’ head group dehydration
promotes greater amphiphile packing, leading to smaller aggregates that are destabilized
through charged head group repulsions. While increased electrostatic repulsions give rise to
metastable particles whose free energies are reduced upon DNA-induced amphiphile re-
organization.
The methyl sulfate counterions encouraged the lowest levels of transfection activity
(Figure-1.13), presumably due to the stronger electrostatic interaction of sulfate di-anion that
supersedes the predicted Hofmeister series of neutral salts. The halogens were more closely
associated with the alkyl ammonium head group (charge shielding), in the order of chloride
to bromide. An increase in charge shielding leads to water exclusion and closer inter-chain
packing, consequently leading to an average increase in the transfection activity from
chloride to bromide (Figure-1.13) [125, 126].
CHAPTER-1: INTRODUCTION
35
Figure-1.13: Effect of DOTAP with counterions for in vitro transfection in COS-1 cell lines
(reused with permission from [125]. Copyright [2001], Springer).
From the literature review, it is evident that, the nature and the type of the counterion
associated with the head group of an amphiphile has an important influence on the
conformation of the amphiphile in solution, and also on the size and the stability of the
complexes with DNA [127-129]. In 2004, Saaida et al. used chloride, acetate and
lactobionate counterions for the poly-norbornene based cationic amphiphile (Figure-1.14) in
their work, where the DNA is not only complexed by electrostatic interactions, but also by
the hydrophobic effect and packing of the poly-norbornene based polymeric units (cationic)
[130]. It was reported that the polymer with the chloride counterion is a fully quarternized
polymer and they can form only stretched chains within the polymer seen from TEM images.
Chloride is a counterion strongly bonded to the ammonium group, leading to a shielding of
the electrostatics repulsions between the units and the formation of large aggregates.
Consequently, the interaction/complexation with DNA involves essentially the electrostatic
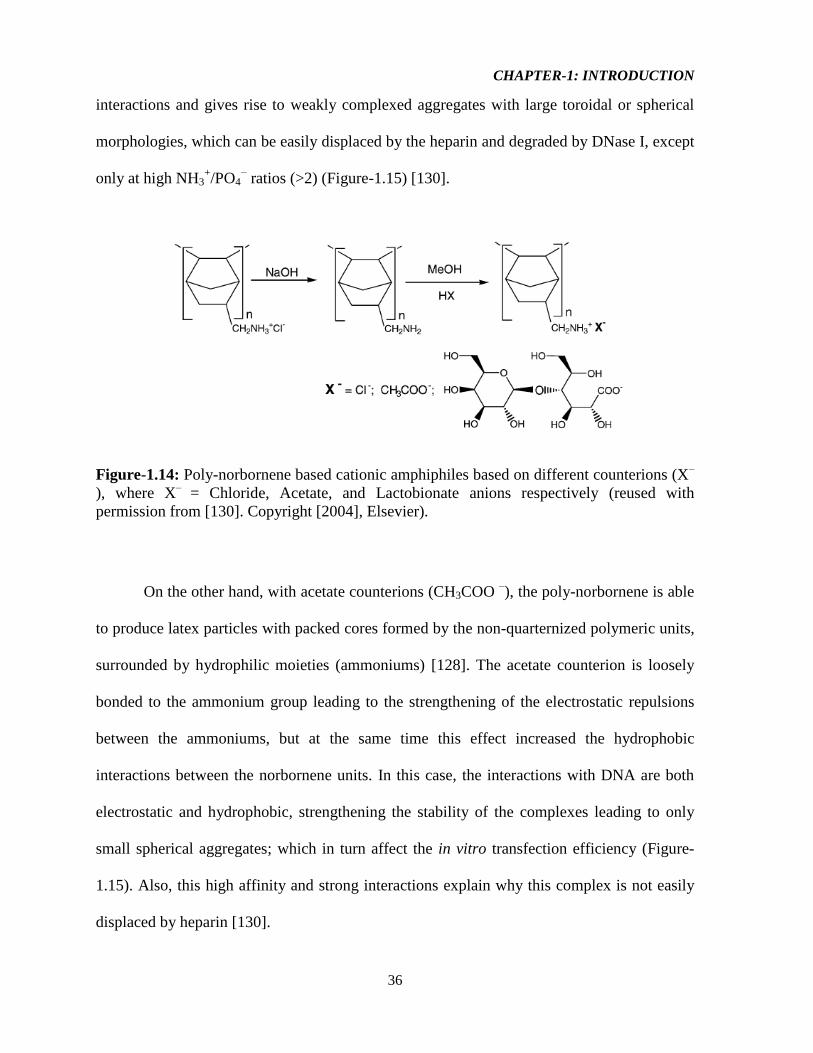
CHAPTER-1: INTRODUCTION
36
interactions and gives rise to weakly complexed aggregates with large toroidal or spherical
morphologies, which can be easily displaced by the heparin and degraded by DNase I, except
only at high NH3+/PO4
− ratios (>2) (Figure-1.15) [130].
Figure-1.14: Poly-norbornene based cationic amphiphiles based on different counterions (X–
), where X–
= Chloride, Acetate, and Lactobionate anions respectively (reused with
permission from [130]. Copyright [2004], Elsevier).
On the other hand, with acetate counterions (CH3COO –), the poly-norbornene is able
to produce latex particles with packed cores formed by the non-quarternized polymeric units,
surrounded by hydrophilic moieties (ammoniums) [128]. The acetate counterion is loosely
bonded to the ammonium group leading to the strengthening of the electrostatic repulsions
between the ammoniums, but at the same time this effect increased the hydrophobic
interactions between the norbornene units. In this case, the interactions with DNA are both
electrostatic and hydrophobic, strengthening the stability of the complexes leading to only
small spherical aggregates; which in turn affect the in vitro transfection efficiency (Figure-
1.15). Also, this high affinity and strong interactions explain why this complex is not easily
displaced by heparin [130].
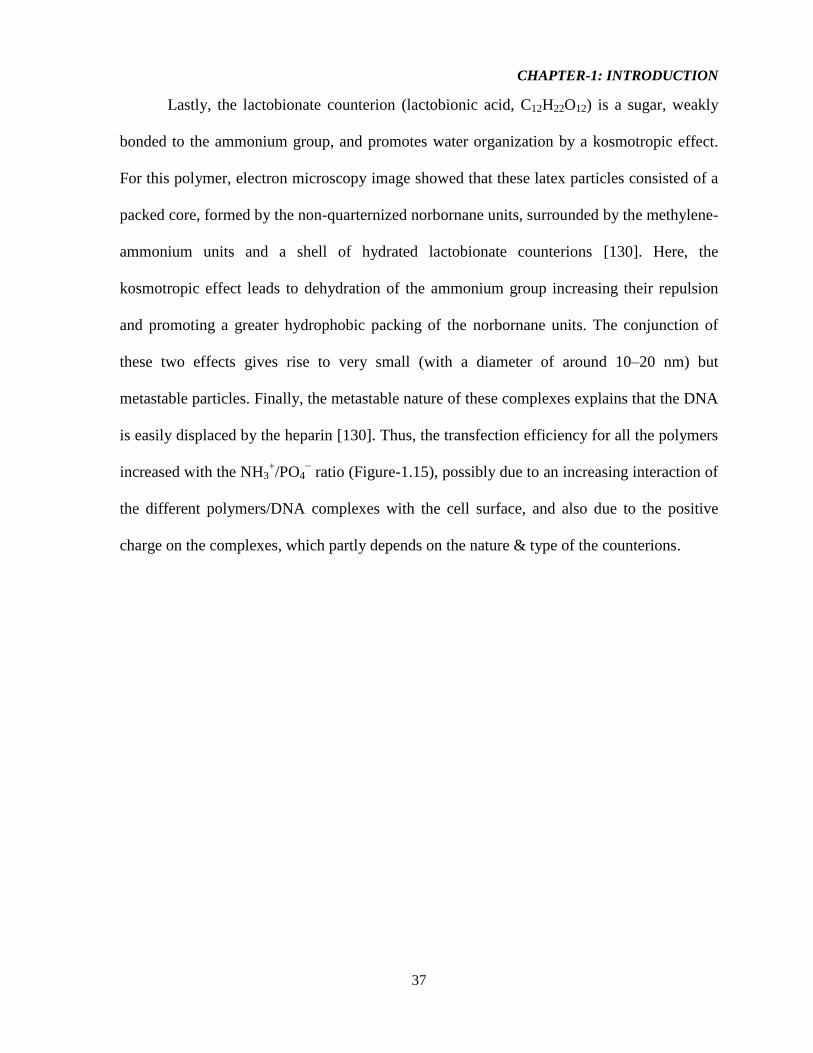
CHAPTER-1: INTRODUCTION
37
Lastly, the lactobionate counterion (lactobionic acid, C12H22O12) is a sugar, weakly
bonded to the ammonium group, and promotes water organization by a kosmotropic effect.
For this polymer, electron microscopy image showed that these latex particles consisted of a
packed core, formed by the non-quarternized norbornane units, surrounded by the methylene-
ammonium units and a shell of hydrated lactobionate counterions [130]. Here, the
kosmotropic effect leads to dehydration of the ammonium group increasing their repulsion
and promoting a greater hydrophobic packing of the norbornane units. The conjunction of
these two effects gives rise to very small (with a diameter of around 10–20 nm) but
metastable particles. Finally, the metastable nature of these complexes explains that the DNA
is easily displaced by the heparin [130]. Thus, the transfection efficiency for all the polymers
increased with the NH3+/PO4
− ratio (Figure-1.15), possibly due to an increasing interaction of
the different polymers/DNA complexes with the cell surface, and also due to the positive
charge on the complexes, which partly depends on the nature & type of the counterions.

CHAPTER-1: INTRODUCTION
38
Figure-1.15: Transfection efficiencies of methylene-ammonium poly-norbornene polymers
into CHO cell lines. The cells were incubated with poly-norbornene polymers/DNA complex
containing 5 μg of plasmid DNA and poly-norbornene polymers at different NH3+/PO4
−
ratios. Cells were harvested and GFP activity determined 48 hour after transfection (reused
with permission from [130]. Copyright [2004], Elsevier).
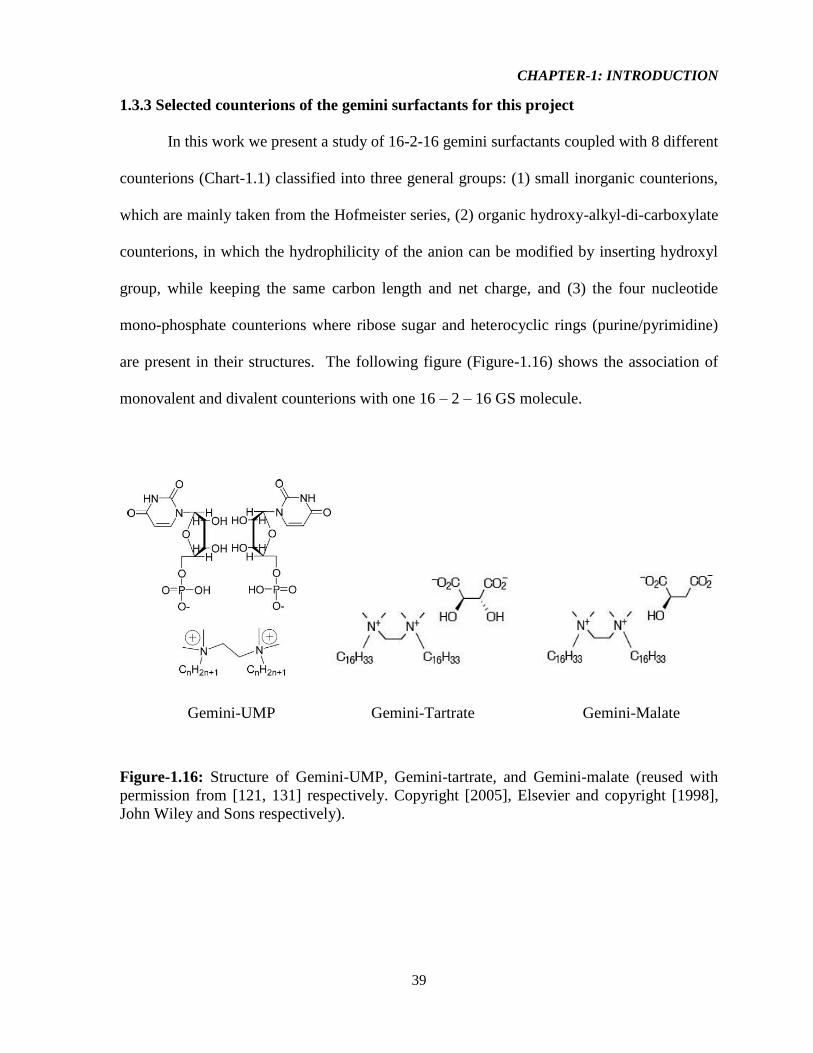
CHAPTER-1: INTRODUCTION
39
1.3.3 Selected counterions of the gemini surfactants for this project
In this work we present a study of 16-2-16 gemini surfactants coupled with 8 different
counterions (Chart-1.1) classified into three general groups: (1) small inorganic counterions,
which are mainly taken from the Hofmeister series, (2) organic hydroxy-alkyl-di-carboxylate
counterions, in which the hydrophilicity of the anion can be modified by inserting hydroxyl
group, while keeping the same carbon length and net charge, and (3) the four nucleotide
mono-phosphate counterions where ribose sugar and heterocyclic rings (purine/pyrimidine)
are present in their structures. The following figure (Figure-1.16) shows the association of
monovalent and divalent counterions with one 16 – 2 – 16 GS molecule.
Gemini-UMP Gemini-Tartrate Gemini-Malate
Figure-1.16: Structure of Gemini-UMP, Gemini-tartrate, and Gemini-malate (reused with
permission from [121, 131] respectively. Copyright [2005], Elsevier and copyright [1998],
John Wiley and Sons respectively).
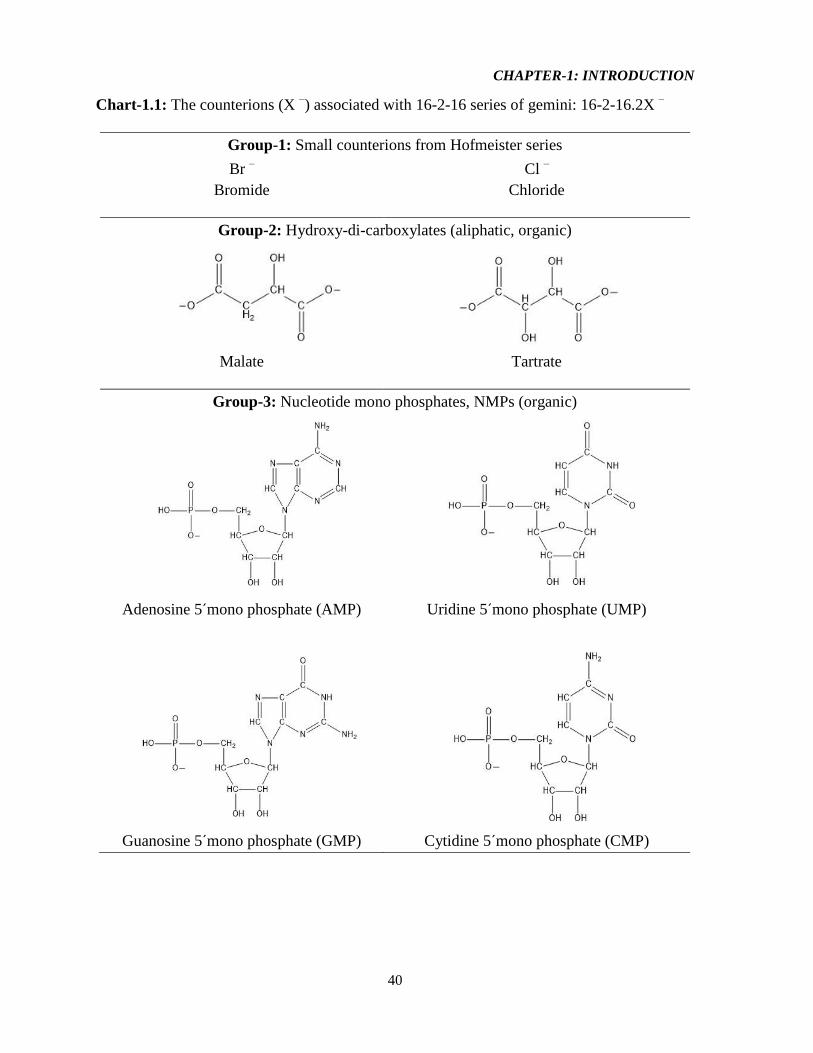
CHAPTER-1: INTRODUCTION
40
Chart-1.1: The counterions (X –) associated with 16-2-16 series of gemini: 16-2-16.2X
–
Group-1: Small counterions from Hofmeister series
Br – Cl
–
Bromide
Chloride
Group-2: Hydroxy-di-carboxylates (aliphatic, organic)
Malate
Tartrate
Group-3: Nucleotide mono phosphates, NMPs (organic)
Adenosine 5´mono phosphate (AMP) Uridine 5´mono phosphate (UMP)
Guanosine 5´mono phosphate (GMP) Cytidine 5´mono phosphate (CMP)
CHAPTER-2: OBJECTIVES & HYPOTHESIS
41
2. Objectives & Hypothesis
2.1 Overview of the project
Success of GT relies on having efficient vectors for the transfer and expression of the
genetic material at the desired location in the living organism. As discussed earlier,
exploitation of the inherent ability of viruses to infect cells has produced the most efficient
delivery vectors in gene therapy, but limitations in the safety of viral vectors restrict the
application of this method. These limitations have motivated our group in the development of
an effective non-viral vector, which uses synthetic, self-assembling gemini surfactants to
deliver the DNA. Our goal is to develop new non-viral systems with high transfection
efficiencies through the modifications of different counterions of gemini surfactants. As
previously mentioned (section 1.3), earlier studies have focused on the effect of variations in
the chemical structure of the surfactant itself. It has been previously established that
significant modification in the shape of nanoparticles, formed from gemini surfactants, can
be achieved through variations in the counterions. We believe that appropriate selection of
counterion will allow for better control of nanoparticle size/shape in our non-viral gene
therapy vectors.
This work will focus on the characterization of cationic gemini nanoparticles
formulated with GSs associated with hydrophilic/hydrophobic anions (mono-atomic or
organic) and will investigate the effect of counterions on transfection efficiency by
modifying micellization process of DNA-GS complexes. The study will also outline the
effects of counterions on micellization of GS in terms of interaction between hydrophobicity
of the anions and other ion properties (hydration number, polarizability, ionic morphology
etc.).
CHAPTER-2: OBJECTIVES & HYPOTHESIS
42
Methods that will be used to study the self-aggregation, solution properties, and
interaction behavior of DNA with GS having different anions are: Tensiometry,
Conductometry, Krafft Temperature & Solubility measurements, Densitometry, pH
measurements, Viscometry, Dynamic Light Scattering (DLS), Laser Doppler Velocimetry
(LDV), and lastly in vitro transfection in human epithelial ovarian cancer cell lines
(OVCAR-3, ATCC). The recombinant plasmid DNA (pDNA), pNN9 (a circular covalently
closed, double stranded helix DNA molecule encoding for an enhanced green fluorescence
protein gene, EGFP) will be extracted from Escherichia coli and can be used in the
nanoparticle formulations for all in vitro transfection assays. Transfected cells will express
EGFP once the pDNA is transcribed in the nucleus of the cancer cells, and the resultant
messenger ribonucleic acid (mRNA) will be translated. The possible outcome will be the
development of less toxic non-viral DNA transfection agent based on different counterions of
the gemini surfactants with improved transfection efficiency for human ovarian cancer cells.
2.2 Hypothesis statement
Nanoparticles formulated from gemini surfactants having different counterions will
enhance the DNA transfection efficiencies for epithelial ovarian cancer cells.
CHAPTER-2: OBJECTIVES & HYPOTHESIS
43
2.3. Objectives: short-term goals
The specific objectives of this project include:
1. Syntheses of all the GSs with selected counterions
2. Physiochemical characterization of GSs and gemini nanoparticles by studying:
a. Tensiometry
b. Conductometry
c. Krafft Temperature measurements
d. Densitometry & pH measurements
e. Viscometry
f. Zeta potential (LDV) and Particle size (DLS) [for nanoparticles].
2.4. Objectives: long-term goals
Investigation of the in-vitro transfection efficiency, in OVCAR-3 examining:
a. Effect of concentration of gemini
b. Effect of different counterions associated with the gemini
c. Effect of charge ratio of surfactant to DNA
d. Effect of helper lipid along with gemini

CHAPTER-3: MATERIALS & METHODS
45
3. Materials & Methods
3.1 Materials
3.1.1 Materials for GS syntheses
The raw materials used for the synthesis of gemini surfactants (GSs) were 1-
bromohexadecane (99.5 %, Fisher Scientific), 1-chlorohexadecane (99.5 %, Fisher
Scientific), N,N,N′,N′-tetramethylethane-1,2-diamine, TMEDA (99%, Fisher Scientific), L-(–
) malic Acid (98%, Sigma-Aldrich), L-(+) tartaric Acid (98%, Sigma-Aldrich), silver Acetate
(99%, Fisher Scientific), silver carbonate (98%, Fisher Scientific), adenosine 5′-
monophosphate, AMP (99.8%, mono-hydrate & acid form, Sigma Aldrich), cytidine 5′-
monophosphate, CMP (99.9%, acid form, Sigma Aldrich), uridine 5′-monophosphate, UMP
(99.9%, acid form, Sigma Aldrich), and guanosine 5′-monophosphate, GMP (99.8%, acid
form, Fisher Scientific). These materials were purchased from the specified companies and
used directly without any further purification. All solvents used in the syntheses of GS were
of HPLC grade (99.99%) and were purchased from Fisher Scientific, USA. Deuterated
chloroform (chloroform-D, 99.8 atom % D), DMSO-d6 (99.9 atom % D), and deuterated
water (heavy water, 99.9 atom % D) were purchased from Sigma Aldrich (USA) and directly
used for 1H NMR analysis (AVANCE 300 MHz, BRUKER, USA) of raw materials (where
applicable) and synthesized GSs. For all experimental analyses, GS solutions were prepared
by using fresh ultrapure Milli Q water (Filtered through 0.22 μm Millipak 4.0 Filter, TOC
(Total Organic Carbon) = 1 ppb, Specific resistance = 18.2 MΩ.cm @ 250C) dispensed from
Gradient A-10 Milli Q water system (Millipore, Canada) as required.
CHAPTER-3: MATERIALS & METHODS
46
3.1.2 Materials for in vitro transfection
3.1.2.1 Chemicals / Reagents for transfection
DOPE [1,2-di-(9Z-octadecenoyl)-sn-glycero-3-phosphoethanolamine] solution
(99%), 25 mg/mL in CHCl3 (C41H78NO8P, M.W. = 744.05 g/mole) was purchased from
Avanti Polar Lipids Inc. (USA) and stored at – 20oC. (±) α-Tocopherol (95%, synthetic,
ACROS Organics™) [F.W. =430.72, S.G. = 0.95] used as membrane stabilizer for DOPE
liposome preparation, was purchased from Fisher Scientific (USA) and used as received.
The following materials were also purchased from Fisher Scientific (USA):
DPBS (Dulbecco's Phosphate-Buffered Saline, 1 X, without Ca2+
& Mg2+
, pH 7.2)
RPMI 1640 1X with L-Glutamine + Phenol Red
Fetal Bovine Serum [FBS, 20% (v/v)]
Trypsin [0.25% (w/v) Trypsin (1X) + 0.53mM EDTA; w/o Ca2+
& Mg2+
] solution
TrypLE™ Express [animal origin free (AOF), recombinant enzyme] solution
Penicillin/Streptomycin antibiotics (10,000U/mL Penicillin, 10,000μg/mL
Streptomycin in 0.85% NaCl)
Trypan Blue 0.4% (w/v, pH = 7.5 ± 0.5) in DPBS, and
Propidium Iodide Solution in DPBS
Opti-MEM®
I (1X) Reduced-Serum Medium w/o Phenol Red, and LipofectamineTM
2000, 1
mg/mL was purchased from Gibco® and Invitrogen
TM, Life technologies (NY, USA)
respectively. Bovine Pancreas Insulin (10 mg/mL insulin in 25 mM HEPES, pH 8.2) solution
was purchased from Sigma Aldrich (USA). All these materials mentioned in this section
were used as received without any further purification.

CHAPTER-3: MATERIALS & METHODS
47
3.1.2.2 pDNA
The recombinant plasmid DNA pNN9 (Figure-3.1) was a generous gift from Dr.
Roderick Slavcev (School of pharmacy, University of Waterloo). After subsequent
amplification, extraction, and confirmation of the extracted DNA by gel electrophoresis and
size determination, these pNN9 plasmids were used for all size and zeta potential
characterizations and for all transfection assays. K-12 strains of Escherichia coli (a Gram-
negative, anaerobic, rod-shaped bacterium) were used in the generation of the recombinant
cell constructs and JM109 strains of the same bacterium were employed as hosts for plasmid
amplification for extraction. For the extraction of pNN9 plasmids intended for size & zeta
potential characterization, centrifugation protocol of the E.Z.N.A.® Plasmid DNA Maxi Kit
(OMEGA bio-tek, Georgia, USA) was used. To eliminate the resulting endotoxins, on the
other hand, E.Z.N.A.® Endo-Free Plasmid DNA Maxi Kit was used for extraction of the
plasmids that are intended to be used for all transfection assays.
Figure 3.1: The pDNA vector (pNN9) used in this project. This 5.6 kb pDNA vector (pNN9)
possesses two Super Sequences (SS, a multipurpose target site) flanking the eukaryotic
expression cassette. SV40 enhancer sequences serve as DNA-targeting sequences (DTS) for
improved nuclear entry during gene delivery. The EGFP (enhanced green fluorescence
protein) gene is the gene of interest used for confirmation of successful transfection (reused
with permission of BioMed Central from [132] through the Creative Commons Attribution
License).
CHAPTER-3: MATERIALS & METHODS
48
3.1.2.3 Cell Line
The adherent cell line that was used for transfection assay in this project is human
epithelial ovarian cancer (NIH:OVCAR-3) cell line (HTB161™) from ATCC® (Manassas,
VA; USA) which is androgen, estrogen, and progesterone receptor positive.
3.2 Methods
3.2.1 Synthesis of 16-2-16 series of GSs [C16H33(CH3)2-N+-(CH2)2-N
+-(CH3)2C16H33].2X
–
3.2.1.1 Synthesis of 16-2-16 with bromide and chloride counterions
The gemini surfactants with bromide and chloride counterions were synthesized
according to the method of Menger and Littau with minor modification (Scheme-3.1) [90,
133-135]. An excess (10 – 50%) of two molar equivalents of the appropriate hexadecyl-
halide, C16H33-X– (X
– = bromide, chloride) and one molar equivalent of N,N,N′,N′-
tetramethylethane-1,2-diamine (TMEDA) in acetonitrile was refluxed with continuous
stirring for 6 – 12 days, in order to obtain one molar equivalent of corresponding 16-2-16
gemini-halide (halide = bromide, chloride). After reaction, the solvent was removed via
rotary evaporation with the resulting product being dissolved in a minimum volume of
chloroform (CHCl3) : methanol (CH3OH) (9 : 1, v/v) and recrystallized with excess acetone.
Recrystallization was repeated 2 – 3 times [134, 135] in order to obtain pure (confirmed by
1H NMR analysis and Tensiometry) gemini surfactants. The white crystals of gemini
surfactant were collected via vacuum filtration through grade-41 filter paper (WhatmanTM
routine quantitative ashless filter paper, Fisher Scientific, USA), and then dried under
vacuum at a temperature of 35 – 400C for 5 – 6 days until a constant weight was attained.
The chemical structure and purity of the gemini surfactants was verified by 1H-NMR (in
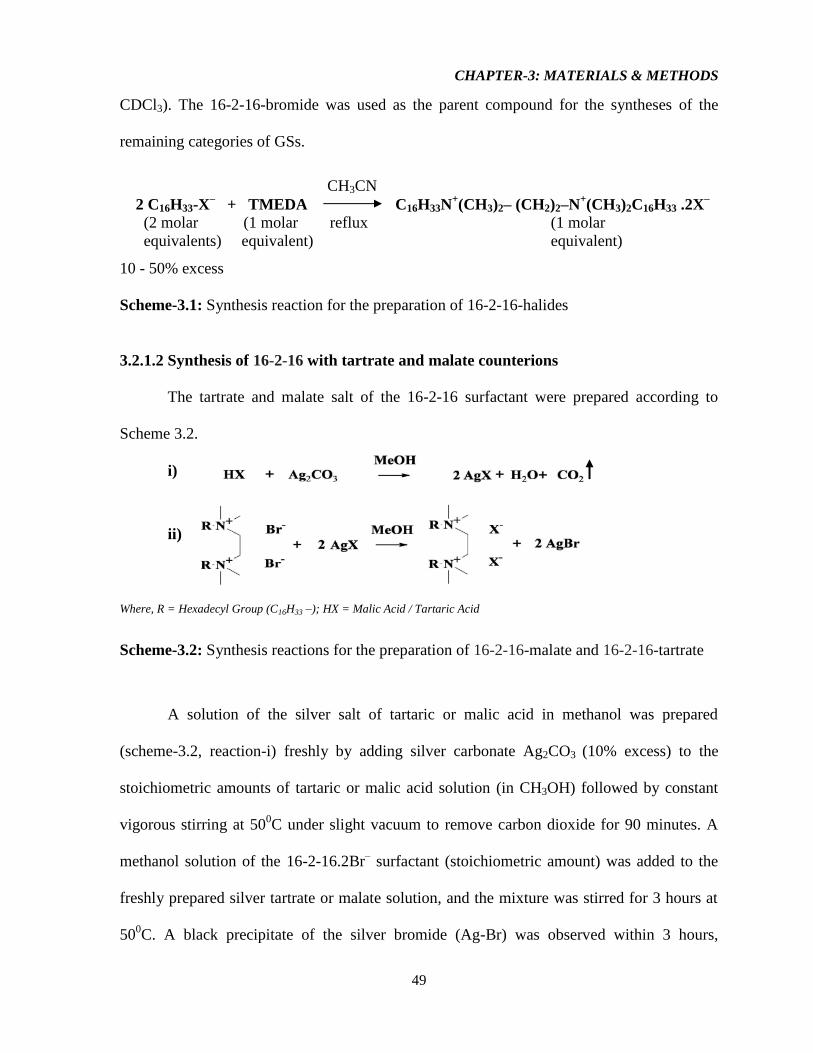
CHAPTER-3: MATERIALS & METHODS
49
CDCl3). The 16-2-16-bromide was used as the parent compound for the syntheses of the
remaining categories of GSs.
CH3CN
2 C16H33-X– + TMEDA C16H33N
+(CH3)2– (CH2)2–N
+(CH3)2C16H33 .2X
–
(2 molar (1 molar reflux (1 molar
equivalents) equivalent) equivalent)
10 - 50% excess
Scheme-3.1: Synthesis reaction for the preparation of 16-2-16-halides
3.2.1.2 Synthesis of 16-2-16 with tartrate and malate counterions
The tartrate and malate salt of the 16-2-16 surfactant were prepared according to
Scheme 3.2.
i)
ii)
Where, R = Hexadecyl Group (C16H33 –); HX = Malic Acid / Tartaric Acid
Scheme-3.2: Synthesis reactions for the preparation of 16-2-16-malate and 16-2-16-tartrate
A solution of the silver salt of tartaric or malic acid in methanol was prepared
(scheme-3.2, reaction-i) freshly by adding silver carbonate Ag2CO3 (10% excess) to the
stoichiometric amounts of tartaric or malic acid solution (in CH3OH) followed by constant
vigorous stirring at 500C under slight vacuum to remove carbon dioxide for 90 minutes. A
methanol solution of the 16-2-16.2Br– surfactant (stoichiometric amount) was added to the
freshly prepared silver tartrate or malate solution, and the mixture was stirred for 3 hours at
500C. A black precipitate of the silver bromide (Ag-Br) was observed within 3 hours,
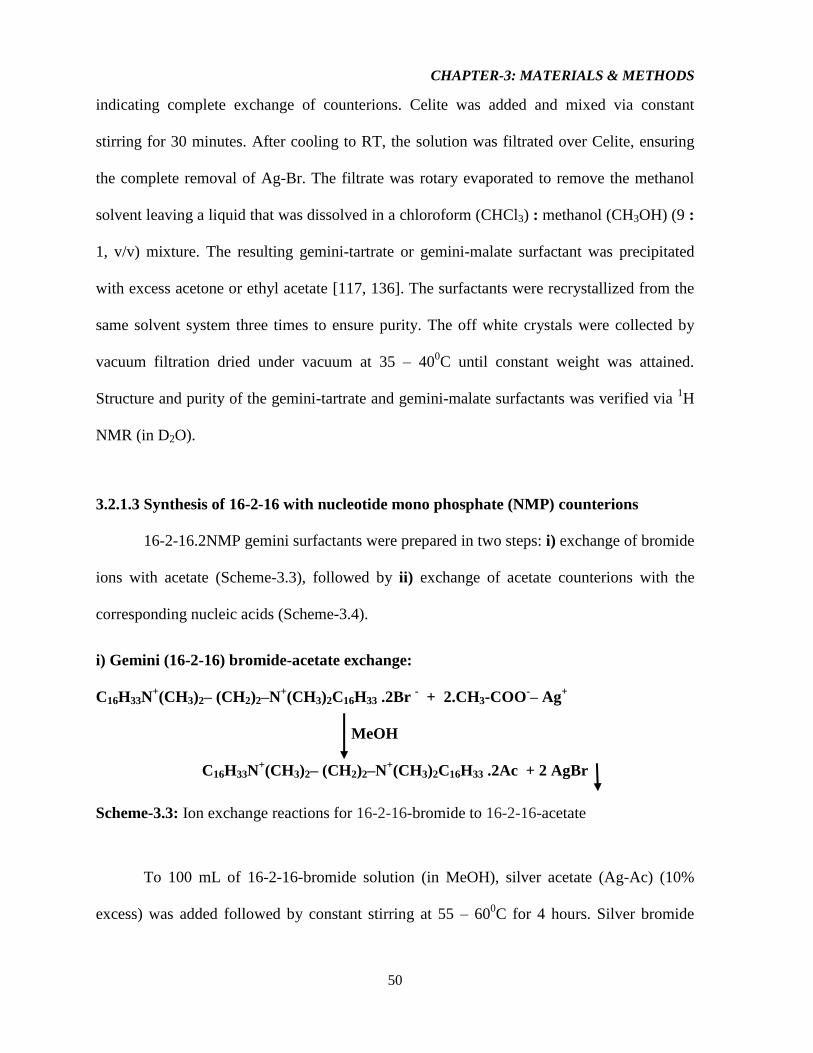
CHAPTER-3: MATERIALS & METHODS
50
indicating complete exchange of counterions. Celite was added and mixed via constant
stirring for 30 minutes. After cooling to RT, the solution was filtrated over Celite, ensuring
the complete removal of Ag-Br. The filtrate was rotary evaporated to remove the methanol
solvent leaving a liquid that was dissolved in a chloroform (CHCl3) : methanol (CH3OH) (9 :
1, v/v) mixture. The resulting gemini-tartrate or gemini-malate surfactant was precipitated
with excess acetone or ethyl acetate [117, 136]. The surfactants were recrystallized from the
same solvent system three times to ensure purity. The off white crystals were collected by
vacuum filtration dried under vacuum at 35 – 400C until constant weight was attained.
Structure and purity of the gemini-tartrate and gemini-malate surfactants was verified via 1H
NMR (in D2O).
3.2.1.3 Synthesis of 16-2-16 with nucleotide mono phosphate (NMP) counterions
16-2-16.2NMP gemini surfactants were prepared in two steps: i) exchange of bromide
ions with acetate (Scheme-3.3), followed by ii) exchange of acetate counterions with the
corresponding nucleic acids (Scheme-3.4).
i) Gemini (16-2-16) bromide-acetate exchange:
C16H33N+(CH3)2– (CH2)2–N
+(CH3)2C16H33 .2Br
- + 2.CH3-COO
-– Ag
+
MeOH
C16H33N+(CH3)2– (CH2)2–N
+(CH3)2C16H33 .2Ac + 2 AgBr
Scheme-3.3: Ion exchange reactions for 16-2-16-bromide to 16-2-16-acetate
To 100 mL of 16-2-16-bromide solution (in MeOH), silver acetate (Ag-Ac) (10%
excess) was added followed by constant stirring at 55 – 600C for 4 hours. Silver bromide
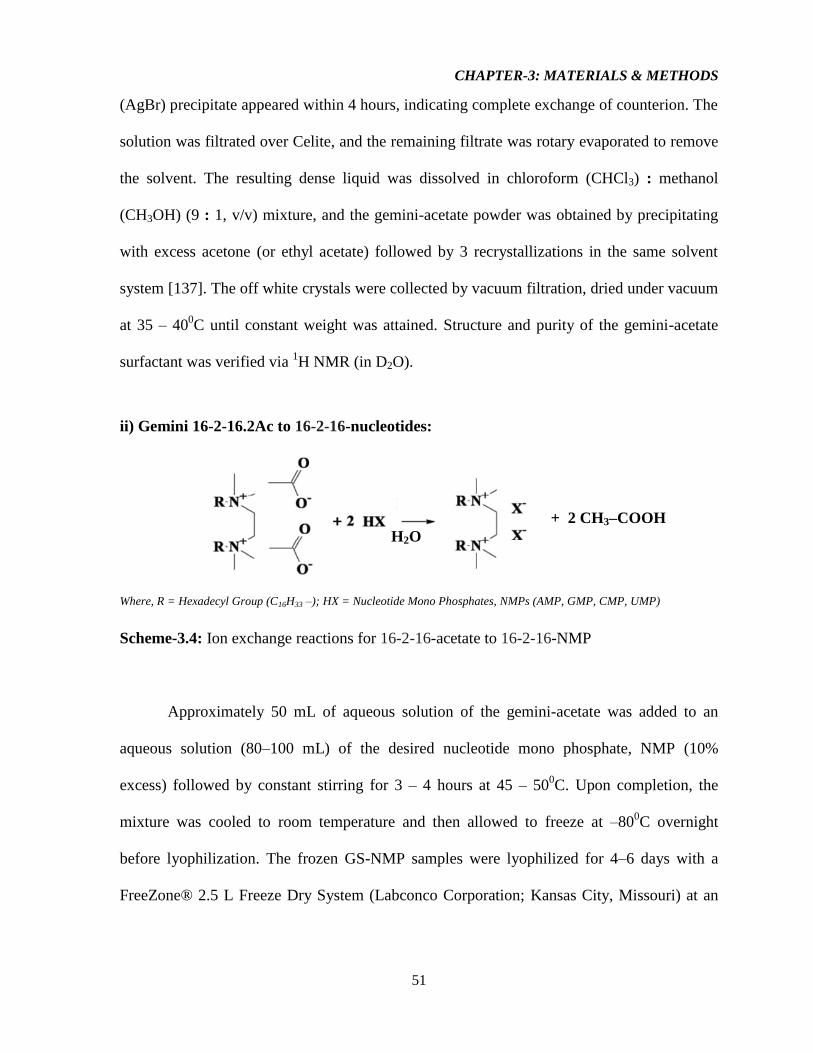
CHAPTER-3: MATERIALS & METHODS
51
(AgBr) precipitate appeared within 4 hours, indicating complete exchange of counterion. The
solution was filtrated over Celite, and the remaining filtrate was rotary evaporated to remove
the solvent. The resulting dense liquid was dissolved in chloroform (CHCl3) : methanol
(CH3OH) (9 : 1, v/v) mixture, and the gemini-acetate powder was obtained by precipitating
with excess acetone (or ethyl acetate) followed by 3 recrystallizations in the same solvent
system [137]. The off white crystals were collected by vacuum filtration, dried under vacuum
at 35 – 400C until constant weight was attained. Structure and purity of the gemini-acetate
surfactant was verified via 1H NMR (in D2O).
ii) Gemini 16-2-16.2Ac to 16-2-16-nucleotides:
+ 2 CH3–COOH
H2O
Where, R = Hexadecyl Group (C16H33 –); HX = Nucleotide Mono Phosphates, NMPs (AMP, GMP, CMP, UMP)
Scheme-3.4: Ion exchange reactions for 16-2-16-acetate to 16-2-16-NMP
Approximately 50 mL of aqueous solution of the gemini-acetate was added to an
aqueous solution (80–100 mL) of the desired nucleotide mono phosphate, NMP (10%
excess) followed by constant stirring for 3 – 4 hours at 45 – 500C. Upon completion, the
mixture was cooled to room temperature and then allowed to freeze at –800C overnight
before lyophilization. The frozen GS-NMP samples were lyophilized for 4–6 days with a
FreeZone® 2.5 L Freeze Dry System (Labconco Corporation; Kansas City, Missouri) at an
CHAPTER-3: MATERIALS & METHODS
52
operating temperature of –860C. Consecutive lyophilisation and dissolution in water were
repeated until the total evaporation of acetic acid occurred (confirmed by 1H NMR) [137].
3.2.2 1H NMR characterization
All 1H NMR measurements were carried out at 25.0 ± 0.1
0C on a Bruker Avance
NMR spectrometer operating at 300 MHz with the field strength of 7.0 Tesla. D2O and
CD3OD (99.9 atom % D) were used to prepare stock solutions (7-10 mg/mL) of the
synthesized surfactants for 1H NMR study. The peaks were referenced with respect to
tertamethylsilane, TMS (δ = 0.00 ppm) when CD3OD was used as a solvent and to 4,4-
dimethyl-4-silapentane-1-sulfonic acid, DSS (δ = 0.00 ppm) when D2O and/or DMSO was
used as a solvent. In all NMR experiments, the number of scans (16 on average) was adjusted
to achieve good signal-to-noise, and was recorded with a two seconds relaxation delay in a
digital resolution of 0.04 Hz/data point at a flip angle of 300 of the pulse program. The
following notation was used for the 1HNMR splitting patterns: singlet (s), doublet (d), triplet
(t), multiplet (m), and double doublet (dd).
3.2.3 Measurement of CMC
Critical micelle concentrations (CMC) of all the synthesized GSs were determined
using surface tension and specific conductance measurement methods.
3.2.3.1 Surface Tension measurement
Surface tension measurements were carried out using the du Noüy ring method [84,
94, 105, 138] on a Lauda TE3 automated Tensiometer (Lauda, Germany) equipped with a
Platinum-Iridium (Pt–Ir) alloy du Noüy ring with a circumference of 6.001 cm (radius =
CHAPTER-3: MATERIALS & METHODS
53
0.955 cm). The ring was thoroughly cleaned and flame dried before each experiment.
Concentrated stock solutions (0.3 mM, and 0.01 mM) of the surfactant of interest were added
to 50 mL of freshly dispensed Milli-Q water (kept within the Simax 80 vessel, Fisher
Scientific, USA) using a model 765 Dosimat auto-titrator (Metrohm, USA) and surface
tension readings were taken after thorough mixing and temperature equilibration. The
measured surface tension values were automatically corrected according to the procedure of
Harkins and Jordan [139, 140] using the instrument software. All measurements were carried
out in replicates with a minimum of five successive measurements having a standard
deviation that did not exceed 0.10 mN/m. Temperature was maintained at a constant value
(25 ± 0.050C) using a Lauda Ecoline RE 304 (Lauda, Germany) circulating water bath. All
CMC determinations were carried out in duplicate for each of the gemini surfactants studied.
3.2.3.2 Conductivity measurements:
Electrical conductivity was used to determine the critical micelle concentration
(CMC) and the degree of micelle ionization (α) of the GSs. Since the conductivity is strongly
influenced by the presence of any metastable or kinetically controlled aggregates [118], care
was taken so that all samples were treated in the same manner. Specific conductance, κ (in
μS/cm) of all the surfactant solutions was measured as a function of concentration with a
SevenEasyTM
S30 Conductivity Meter (METTLER TOLEDO, Switzerland). All
measurements were performed in a double-walled glass titration cell (Fisher Scientific, USA)
with the temperature being controlled at 296.15 K (23 ± 0.050C) using Lauda Ecoline RE 304
(Lauda, Germany) circulating water bath. Concentrated surfactant solution was successively
added to 40 mL of Milli Q water contained in the titration cell. Sufficient time was allowed
between consecutive additions for the system to equilibrate. The specific conductance (κ) as
CHAPTER-3: MATERIALS & METHODS
54
a function of surfactant concentration was measured using an InLab® 730 conductometer
probe (electrode) with a cell constant of 0.56 cm–1
and with inbuilt automatic temperature
compensation (ATC). The conductometer was initially calibrated with standard solutions of
specific conductivity 1413 μS/cm. All the conductometric titrations were carried out in
duplicate for each of the gemini surfactants studied.
3.2.4 Krafft Temperature measurement
Saturated aqueous solutions (~1.5 mM, >> CMC for all surfactants) were prepared,
separately, for each gemini surfactant, by sonication at 550C. After cooling at room
temperature (25 – 300C) they were held at 4
0C in a refrigerator for at least 45 – 48 hours [81,
94], until precipitates of the hydrated surfactant crystals appeared. The precipitated solutions
were then introduced into conductivity titration cell described in the previous section.
Temperature was controlled to ± 0.050C with a Lauda Ecoline RE 304 (Lauda, Germany)
circulating water bath. The initial temperature was set to 50C and then was gradually
increased by 10C in every 10 minutes up to 55
0C. The temperature point where the
precipitated (hydrated crystals of gemini) gemini solution became completely clear was
detected by visual inspection through the transparent titration cell and recorded as the Krafft
temperature (TK). Krafft temperature determinations were carried out in duplicate for each
gemini surfactant.
3.2.5 Density and pH measurement
To measure the density and pH of the GS solutions, stock solutions for each gemini
surfactant, by sonication at 550C were prepared at a specific concentration (~1.5 mM, >>
CMC for all surfactants). The density was measured in triplicate using a 2 mL pycnometer
CHAPTER-3: MATERIALS & METHODS
55
(Fisher Scientific, USA) at 550C (as this temperature is above the TK for all the eight GSs)
using the equation for specific gravity (Equation-3.1) as the following:
Density of a liquid (in g/mL units), DL = (ML x DW) / MW 3.1
Where,
ML = Mass of the liquid at experimental temperature
DW = Density of Milli Q water at experimental temperature (0.98 g/mL @ 550C)
MW = Mass of of Milli Q water at experimental temperature
pH measurements were made in triplicate at 550C using an Accumet XL 60 dual
channel pH meter (Fisher Scientific, USA) through the AccuCap™ Combination pH
electrode (13-620-130) carrying the inbuilt ATC probe (13-602-19).
3.2.6 Bacterial growth and extraction of plasmid
Before the extraction process of plasmids, a single colony of bacterial strain JM109
[pNN9] (JM109 of Escherichia coli is a generous gift from Dr. Slavcev’s research group)
was grown overnight (18 – 20 hours) in 5 mL of growth media [Luria-Bertani (LB) broth +
Ampicillin (Ap) antibiotic (100 μg/mL)] in a temperature controlled bench-top shaker (New
Brunswick Scientific Excella™ E24, Fisher Scientific, US) at 250 rpm and 370C with
circulating air supply. A new batch of cells were grown overnight from that last day culture
at 1:100 dilution in 50 mL of growth media (within a 250 mL Erlenmeyer flask), at the same
temperature and rpm. After the overnight treatment, final culture was taken out from the
shaker when the A600 ≈ 0.8 – 0.9, at which point indicates the exponential bacterial growth of
CHAPTER-3: MATERIALS & METHODS
56
mid logarithmic phase [132]. As already mentioned, E.Z.N.A.®
Endo-Free Plasmid DNA
Maxi Kit and E.Z.N.A.®
Plasmid DNA Maxi Kit (OMEGA bio-tek, Georgia, USA) were
used for extraction of DNA for transfection and Zetasizer studies respectively. In both of the
cases, standard centrifugation protocol was followed to extract the plasmids.
An aliquot of 200 ng/μL plasmid solution (in Milli Q water) was prepared from the
extracted plasmid stock and the pH of that solution was measured in duplicate while the
average is reported (pH = 6.1 ± 0.2). The pH value of the plasmid solutions will help to
extrapolate an assumption on the compatibility of the transfection complexes/nanoparticle
formulation mixtures. The extracted plasmid stock was then immediately stored at – 200C
freezer as recommended in the protocol. The estimated bacterial cell concentration in the
extracted culture was calculated according to optical density readings where, OD600 (= 2 x
A600). The DNA production efficiency and confirmation of the DNA size was assessed by
agarose gel electrophoresis (AGE) (Alpha-Imager HP, Alpha Innotech, Cell Biosciences,
USA). Finally, the concentration of the extracted plasmid were analysed by UV
spectrophotometry (NanoDrop 2000, Fisher Scientific, USA).
3.2.7 Confirmation of extracted plasmids: Agarose Gel Electrophoresis (AGE)
The protocol followed for AGE was as described by Lee et al. (2012) with minor
modification [141]. After casting the AGE tray and initial setup of the apparatus, the required
volume (for ≥ 500 ng of plasmid) of the extracted plasmid sample, 1 L of the DNA-ladder
standard (aka, control, 500 g /L, 1 kb size), and 6X Sample Loading Buffer/Dye solution
(in glycerol) at a ratio of (Loading Buffer : Plasmid =) 1 : 5 was carefully pipetted, and
separately mixed in appropriate combination (Ladder + Dye, and Samples + Dye) on
CHAPTER-3: MATERIALS & METHODS
57
parafilm sheets (Curwood Parafilm M™ Laboratory Wrapping Film, Fisher Scientific, USA).
After adjusting the final volume of the individual mixture(s) by adding Milli Q water, 10 L
of each mixture was separately pipetted into the designated wells before running the power.
The electrophoresis power (potential difference of 100 volts, and 3 amperes of
current) was allowed to run until the blue dye approaches the end of the gel (generally >1.5
hr, until clear band separation). As DNA diffuses within the gel over time, very light bands
are difficult to see, and thus, the UV imaging (provided in the “Appendix” section) was done,
shortly after cessation of electrophoresis, through an UV transilluminator at 302 nm. The
pNN9 plasmid has a size of 5.6 kb in its normal covalently closed circular (CCC) form [132],
and from the UV image of the AGE, the size of the pNN9 plasmid was confirmed.
Experimentally extracted plasmid DNA mainly has two different forms of DNA: a closed
circle supercoiled form (SC), and a nicked circular form (NC) as in small fractions [142]. In
the UV images, the observed bands of closely similar intensity of the pNN9 plasmid near 5
kb and 9 kb (approximately) region corresponding to the DNA ladder control suggested the
existence of both topological form of plasmids within the extracted sample. Lastly, to
confirm the purity of the extracted plasmid, A260/280 values from the NanoDrop 2000
spectrophotometer were also recorded (provided in the “Appendix’ section) and confirmed
with the values given in the extraction kit (within 1.8 – 2).
3.2.8 Measurement of Particle size (diameter) and Zeta potential (ζ)
Particle size and zeta potential were measured for all gemini surfactant solutions, as
well as for nanoparticles prepared from gemini surfactant/DOPE, gemini surfactant/Plasmid
DNA, and gemini surfactant/DOPE/Plasmid DNA combinations at various charge ratios. All

CHAPTER-3: MATERIALS & METHODS
58
particle size & zeta potential measurements were made using a Malvern Zetasizer Nano ZS
instrument (Malvern Instruments, Worcestershire, UK).
3.2.8.1 Preparation of GS based nanoparticles
3.2.8.1.1 Preparation of GSs stock solution
For both the size and zeta potential measurements for all the eight GS, 1.5 mM
solution were prepared after constant sonication at or above their respective Krafft
temperature and then the solutions were filtered through 0.2 μm syringe filters (Thermo
Scientific™ Nalgene™ Syringe Filters, US) immediately after solubilizing them to prepare
the final stock solution for use. The following table (Table-3.1) enlists the molecular mass of
all the GS with different counterions.
Table-3.1: Molecular mass of 16 – 2 – 16 series of GS with eight different counterions
16 – 2 – 16. 2Br – = 726.86 g/mole 16 – 2 – 16. 2GMP
– = 1289.50 g/mole
16 – 2 – 16. 2Cl – = 638.05 g/mole 16 – 2 – 16. 2UMP
– = 1211.40 g/mole
16 – 2 – 16. 2AMP – = 1257.50 g/mole 16 – 2 – 16. Malate
– – = 699.124 g/mole
16 – 2 – 16. 2CMP – = 1209.42 g/mole 16 – 2 – 16. Tartrate
– – = 715.12 g/mole
3.2.8.1.2 Preparation of 1 mM DOPE liposomal solution
DOPE vesicles (1 mM) were prepared in Dulbecco’s Phosphate Buffer Saline (PBS)
with modification of the procedures outlined according to Wettig et al. [143]. Here, lipid film
hydration method (the most widely used method) was followed for the preparation of multi
lamellar vesicles (MLVs) for a lipid, and the method consist of two [144] major steps –
a) Formation of a Lipid Film
b) Hydration of the Lipid Film/Cake
CHAPTER-3: MATERIALS & METHODS
59
3.2.8.2 Formulation of nanoparticles and measurement of size and ζ-potential
The prepared stock solutions of GSs and DOPE was sonicated for 30 minutes at the
Krafft temperature of GSs and then filtered through Nalgen 0.20 μm and 0.45 μm syringe
filters (Thermo Scientific, USA) respectively before using to formulate the nanoparticles.
The same applies to the preparation of nanoparticles for in vitro transfections except that, the
GS stock solutions and the DOPE-vesicle solution were prepared aseptically to avoid
unforeseen contamination.
Different aliquots of the 16 – 2 – 16 stock solution (0.8 μl, 2 μl and 4 μl per 0.4 μg
DNA) were used to generate GS/DNA lipoplexes at 2:1, 5:1, and 10:1 N+/P
– charge ratios
respectively. After 15 minutes of incubation at room temperature, different aliquots (3 μl, 7.6
μl and 15.2 μl) of 1 mM DOPE vesicle solution (in DPBS) were added and then subsequent
mixtures were further incubated for 20 minutes at room temperature to generate lipoplexes,
of varying charge ratios, with a constant GS to DOPE ratio of 2 : 5. The following table
(Table-3.2) was used as a blueprint for the formulation of nanoparticles.
As mentioned earlier, particle sizes for plasmid, GS solutions, and the resulting
plasmid-gemini (G+P) complexes & plasmid-gemini-DOPE (G+P+D) lipoplexes were
measured by dynamic light scattering (DLS, where θ = 173°) using Malvern Zetasizer Nano
ZS instrument (Malvern instruments, UK). A minimum of 700 μL sample volume was taken
into DTS 1070 folded capillary cells / cuvette to measure both sizes and ζ-potentials of the
respective samples, and Zetasizer software of version 7.11 was used for machine operation.
Here, both the sizes & zeta potentials (ζ) values for all the samples mentioned in Table-3.2
were measured at 250C in quintuplicate and the averages (n = 5) were reported.
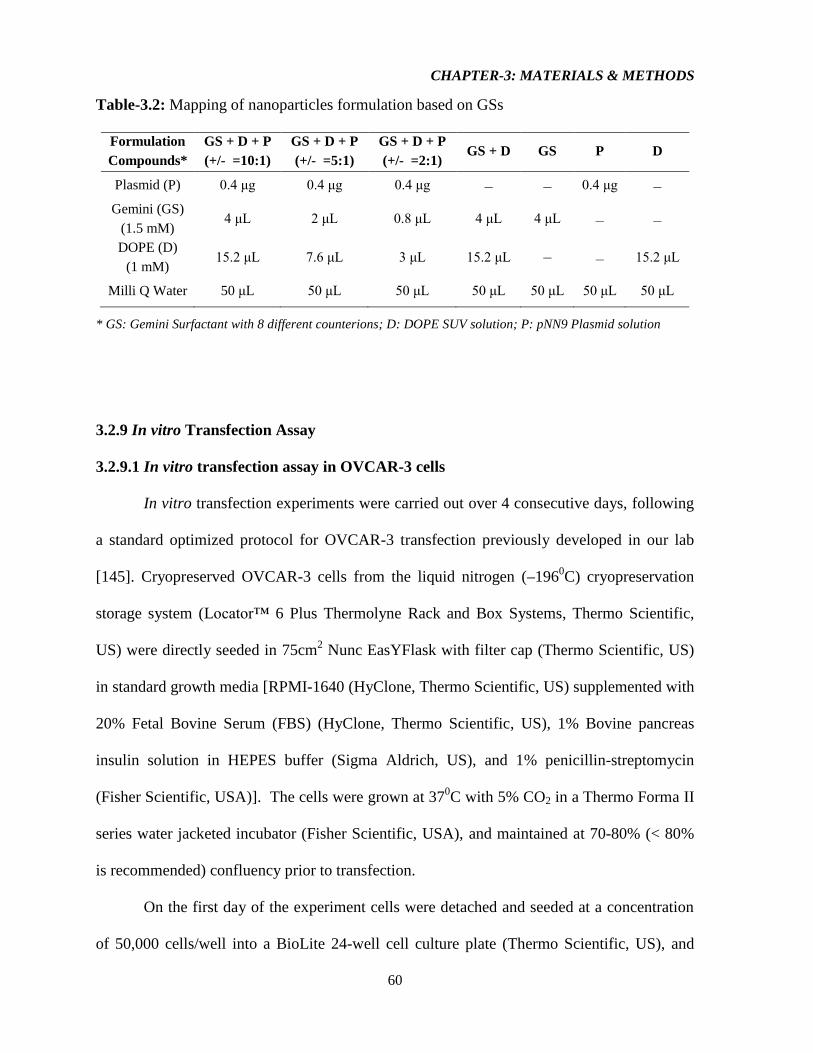
CHAPTER-3: MATERIALS & METHODS
60
Table-3.2: Mapping of nanoparticles formulation based on GSs
Formulation
Compounds*
GS + D + P
(+/- =10:1)
GS + D + P
(+/- =5:1)
GS + D + P
(+/- =2:1) GS + D GS P D
Plasmid (P) 0.4 μg 0.4 μg 0.4 μg – – 0.4 μg –
Gemini (GS)
(1.5 mM) 4 μL 2 μL 0.8 μL 4 μL 4 μL – –
DOPE (D)
(1 mM) 15.2 μL 7.6 μL 3 μL 15.2 μL – – 15.2 μL
Milli Q Water 50 μL 50 μL 50 μL 50 μL 50 μL 50 μL 50 μL
* GS: Gemini Surfactant with 8 different counterions; D: DOPE SUV solution; P: pNN9 Plasmid solution
3.2.9 In vitro Transfection Assay
3.2.9.1 In vitro transfection assay in OVCAR-3 cells
In vitro transfection experiments were carried out over 4 consecutive days, following
a standard optimized protocol for OVCAR-3 transfection previously developed in our lab
[145]. Cryopreserved OVCAR-3 cells from the liquid nitrogen (–1960C) cryopreservation
storage system (Locator™ 6 Plus Thermolyne Rack and Box Systems, Thermo Scientific,
US) were directly seeded in 75cm2 Nunc EasYFlask with filter cap (Thermo Scientific, US)
in standard growth media [RPMI-1640 (HyClone, Thermo Scientific, US) supplemented with
20% Fetal Bovine Serum (FBS) (HyClone, Thermo Scientific, US), 1% Bovine pancreas
insulin solution in HEPES buffer (Sigma Aldrich, US), and 1% penicillin-streptomycin
(Fisher Scientific, USA)]. The cells were grown at 370C with 5% CO2 in a Thermo Forma II
series water jacketed incubator (Fisher Scientific, USA), and maintained at 70-80% (< 80%
is recommended) confluency prior to transfection.
On the first day of the experiment cells were detached and seeded at a concentration
of 50,000 cells/well into a BioLite 24-well cell culture plate (Thermo Scientific, US), and
CHAPTER-3: MATERIALS & METHODS
61
were allowed to grow and to get adhered upon the surfaces of each well for ~24 hours. On
day 2, the seeded cells were washed with DPBS and fresh RPMI-1640 (without FBS or
antibiotics) to which 1 % insulin was added. Transfection lipoplexes were prepared in Opti-
MEM (Gibco, Invitrogen) and the resulting lipoplexes were added drop-wise at amounts
corresponding to 0.4 μg of DNA per well. Transfection with 1.2 μl of LipofectamineTM
2000
(1 mg/mL, Invitrogen) per 0.4 μg of DNA, was also carried out according to the
manufacturer's protocol and served as a positive control. Cells were also transfected with
naked plasmid, plasmid complexed with gemini surfactant alone, DOPE only, and DOPE
complexed with gemini surfactants (Table-3.3 was used as a template), as controls. The
mapping for transfection mixtures is given in Table-3.4. After adding transfection
formulations, cells were incubated at 370C with 5% CO2 for 5 hours before the transfection
medium was replaced by fresh RPMI-1640 supplemented with 20% FBS & 1% insulin. Cells
were further grown until 24 hours post-transfection at which point the cells were collected,
washed, and re-suspended in DPBS in Nunc 15mL Conical Sterile Polypropylene Centrifuge
Tubes (Thermo Scientific, US) for flow cytometry analysis (Day 4). All the experiments for
each transfection formulation were done in triplicate; each experiment was done twice in
parallel, for which average (n = 6) transfection efficiencies and cell viabilities are reported.
CHAPTER-3: MATERIALS & METHODS
62
3.2.9.2 Flow cytometry
Transfection efficiency (TE) was determined 24 hours after transfection by
determination of EGFP fluorescence using a Guava easyCyte™ 8HT benchtop flow
cytometer (EMD Millipore, Merck KGaA, Billerica, MA) which is a part of Dr. Spagnuolo’s
lab in the School of Pharmacy. Flow cytometry analysis gives information about the
comparative expression of green fluorescence which serves as an indicator of transfection
efficiency in terms of % GFP (green fluorescence protein) expression. The % GFP
expression indicates the percentage of cell population expressing GFP over residual
fluorescence of non-transfected cells (no treatment category) or transfected with only pDNA
and lipid mixture alone [146].
Briefly, cells were detached by trypsinization, and then centrifuged at 0 – 40 C and
1800 rpm for 10 min. The resulting cell pellets were washed and suspended with 1000 μL of
DPBS, followed by another centrifugation step, and finally resuspended in 200 μL of DPBS.
The resuspended cells were then seeded again in a flat bottom 96 well plate (SARSTEDT,
Fisher Scientific, USA) as per machine specifications. To determine the cytotoxicities after
transfection by detecting dead cells, 2.5 μL of propidium iodide (PI, 50 mg/mL) was added to
each sample and incubated in an ice bath for at least 30 min before the flow cytometer
analysis. The analyzed data are expressed as Mean (n = 6) ± SD (standard deviation)

CHAPTER-3: MATERIALS & METHODS
63
Table-3.3: Transfection formulation template for each well
Formulation
Compounds
Plasmid
(P)
Gemini
GS (1.5 mM)
DOPE (D)
(1 mM)
Opti-MEM
(1X)
Lipofec-
-tamine
2000
# of
wells
GS + D + P
(+/- =10:1) 0.4 μg 4.04 μL 15.2 μL 50 μL – 7, 7, 7
(Inc. 1
extra for
each
GS)
GS + D + P
(+/- =5:1) 0.4 μg 2.02 μL 7.6 μL 50 μL –
GS + D + P
(+/- =2:1) 0.4 μg 0.81 μL 3.03 μL 50 μL –
GS + D
(+/- =10:1) – 4.04 μL 15.2 μL 50 μL – 7, 7, 7
(Inc. 1
extra for
each
GS)
GS + D
(+/- =5:1) – 2.02 μL 7.6 μL 50 μL –
GS + D
(+/- =2:1) – 0.81 μL 3.03 μL 50 μL –
GS + P
For (+/- =10:1) 0.4 μg 4.04 μL – 50 μL – 7, 7, 7
(Inc. 1
extra for
each
GS)
GS + P
For (+/- =5:1) 0.4 μg 2.02 μL – 50 μL –
GS + P
For (+/- =2:1) 0.4 μg 0.81 μL – 50 μL –
D (Lipid only)
For (+/- =10:1) – – 15.2 μL 50 μL –
7, 7, 7
(Inc. 1
extra)
D (Lipid only)
For (+/- =5:1) – – 7.6 μL 50 μL –
D (Lipid only)
For (+/- =2:1) – – 3.03 μL 50 μL –
P
(Plasmid only) 0.4 μg – – 50 μL –
7 (Inc. 1
extra)
L (Lipofectamine
2000) + Plasmid 0.4 μg – – 50 μL 1.2 μL
13 (Inc.
1 extra)
NT (No
Treatment) – – – 50 μL –
13 (Inc.
1 extra)
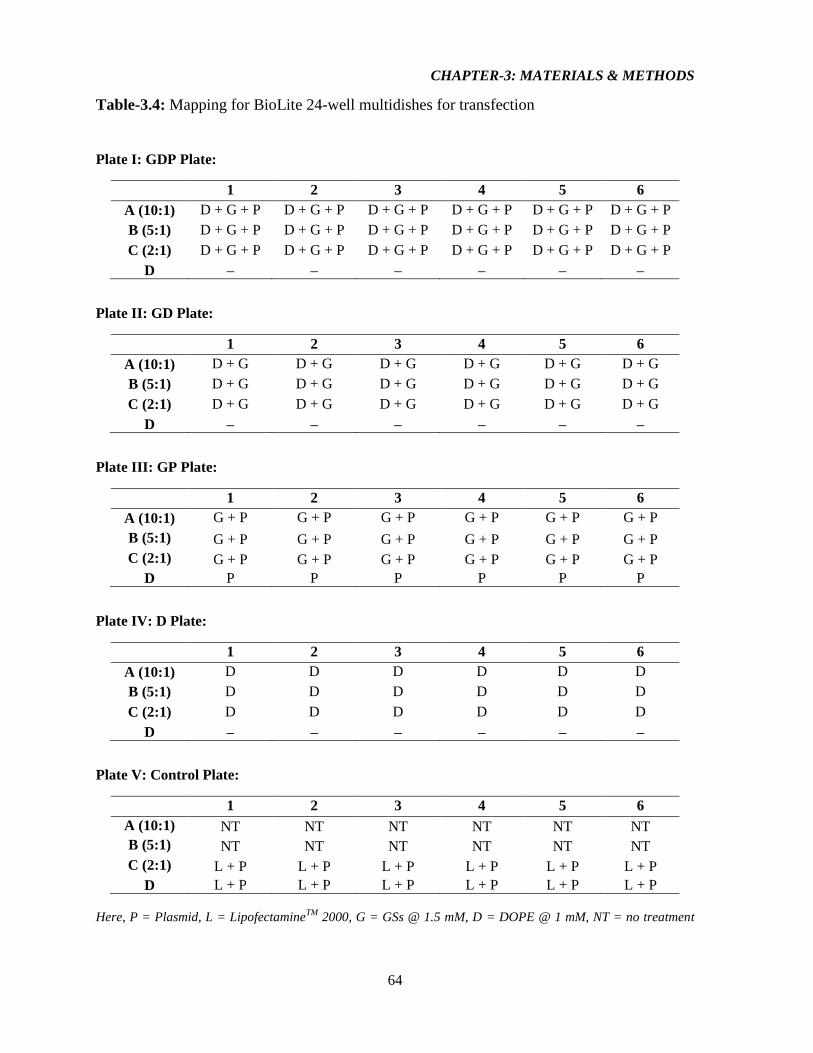
CHAPTER-3: MATERIALS & METHODS
64
Table-3.4: Mapping for BioLite 24-well multidishes for transfection
Plate I: GDP Plate:
1 2 3 4 5 6
A (10:1) D + G + P D + G + P D + G + P D + G + P D + G + P D + G + P
B (5:1) D + G + P D + G + P D + G + P D + G + P D + G + P D + G + P
C (2:1) D + G + P D + G + P D + G + P D + G + P D + G + P D + G + P
D – – – – – –
Plate II: GD Plate:
1 2 3 4 5 6
A (10:1) D + G D + G D + G D + G D + G D + G
B (5:1) D + G D + G D + G D + G D + G D + G
C (2:1) D + G D + G D + G D + G D + G D + G
D – – – – – –
Plate III: GP Plate:
1 2 3 4 5 6
A (10:1) G + P G + P G + P G + P G + P G + P
B (5:1) G + P G + P G + P G + P G + P G + P
C (2:1) G + P G + P G + P G + P G + P G + P
D P P P P P P
Plate IV: D Plate:
1 2 3 4 5 6
A (10:1) D D D D D D
B (5:1) D D D D D D
C (2:1) D D D D D D
D – – – – – –
Plate V: Control Plate:
1 2 3 4 5 6
A (10:1) NT NT NT NT NT NT
B (5:1) NT NT NT NT NT NT
C (2:1) L + P L + P L + P L + P L + P L + P
D L + P L + P L + P L + P L + P L + P
Here, P = Plasmid, L = LipofectamineTM
2000, G = GSs @ 1.5 mM, D = DOPE @ 1 mM, NT = no treatment
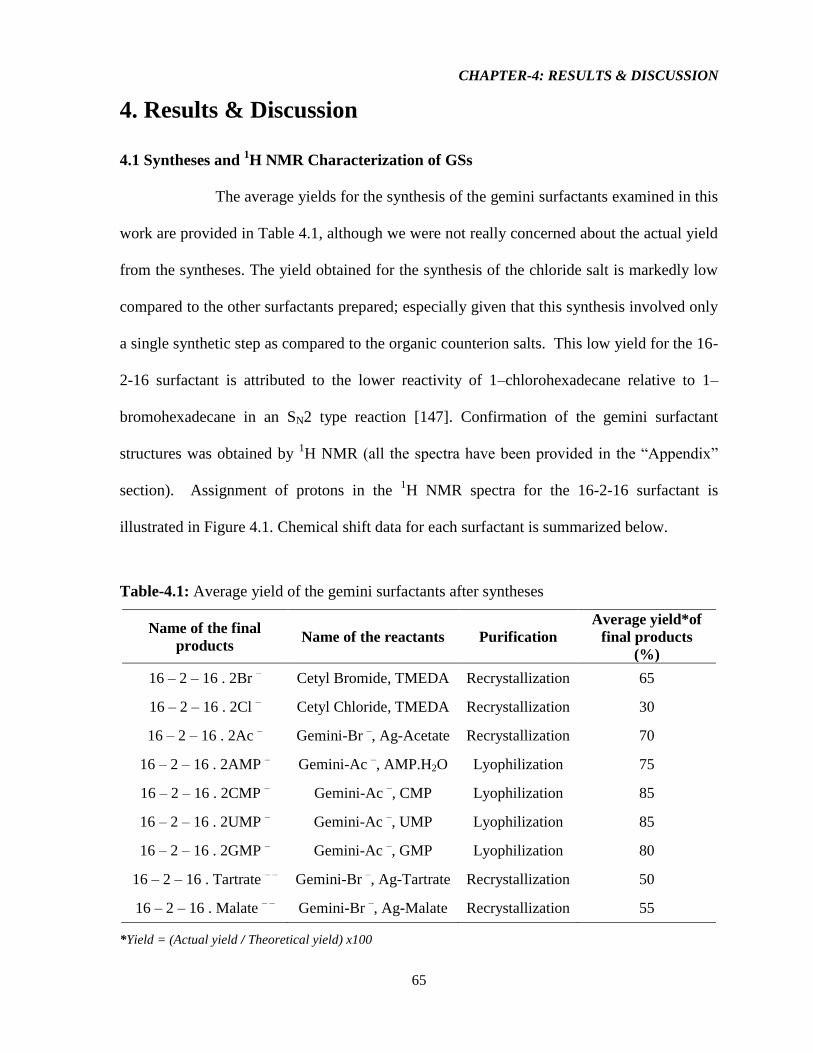
CHAPTER-4: RESULTS & DISCUSSION
65
4. Results & Discussion
4.1 Syntheses and 1H NMR Characterization of GSs
The average yields for the synthesis of the gemini surfactants examined in this
work are provided in Table 4.1, although we were not really concerned about the actual yield
from the syntheses. The yield obtained for the synthesis of the chloride salt is markedly low
compared to the other surfactants prepared; especially given that this synthesis involved only
a single synthetic step as compared to the organic counterion salts. This low yield for the 16-
2-16 surfactant is attributed to the lower reactivity of 1–chlorohexadecane relative to 1–
bromohexadecane in an SN2 type reaction [147]. Confirmation of the gemini surfactant
structures was obtained by 1H NMR (all the spectra have been provided in the “Appendix”
section). Assignment of protons in the 1H NMR spectra for the 16-2-16 surfactant is
illustrated in Figure 4.1. Chemical shift data for each surfactant is summarized below.
Table-4.1: Average yield of the gemini surfactants after syntheses
Name of the final
products Name of the reactants Purification
Average yield*of
final products
(%)
16 – 2 – 16 . 2Br – Cetyl Bromide, TMEDA Recrystallization 65
16 – 2 – 16 . 2Cl – Cetyl Chloride, TMEDA Recrystallization 30
16 – 2 – 16 . 2Ac – Gemini-Br –, Ag-Acetate Recrystallization 70
16 – 2 – 16 . 2AMP – Gemini-Ac –, AMP.H2O Lyophilization 75
16 – 2 – 16 . 2CMP – Gemini-Ac –, CMP Lyophilization 85
16 – 2 – 16 . 2UMP – Gemini-Ac –, UMP Lyophilization 85
16 – 2 – 16 . 2GMP – Gemini-Ac –, GMP Lyophilization 80
16 – 2 – 16 . Tartrate – – Gemini-Br –, Ag-Tartrate Recrystallization 50
16 – 2 – 16 . Malate – – Gemini-Br –, Ag-Malate Recrystallization 55
*Yield = (Actual yield / Theoretical yield) x100
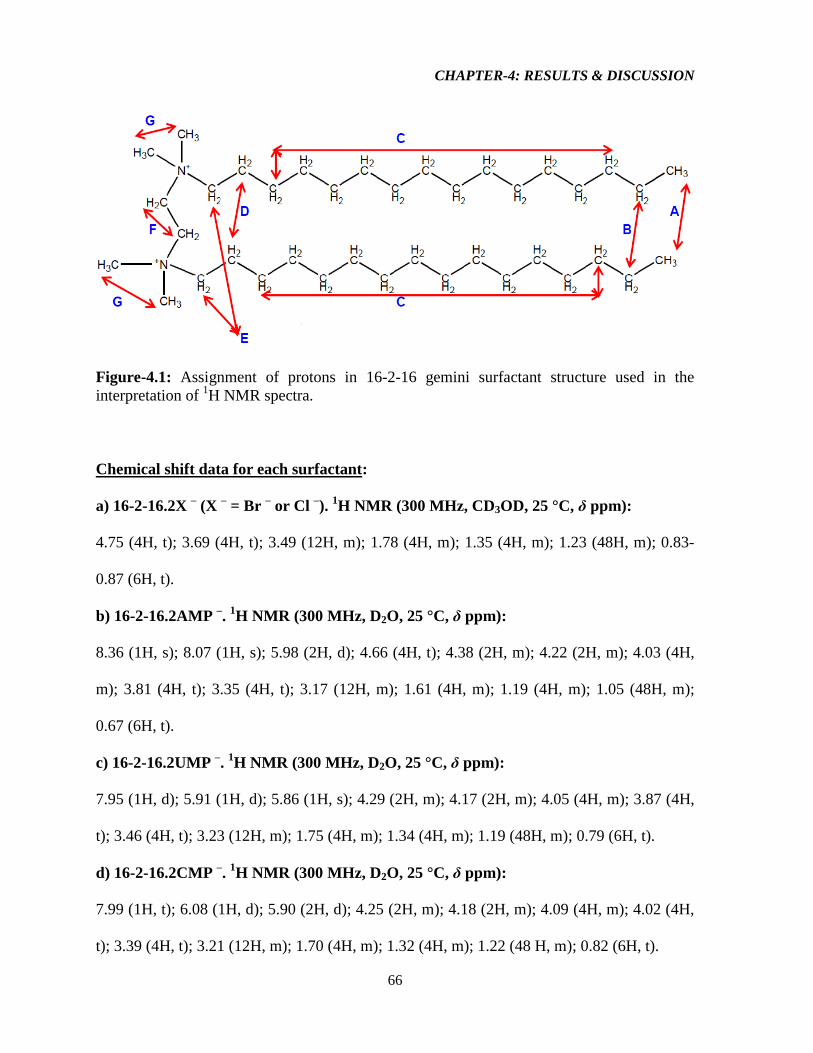
CHAPTER-4: RESULTS & DISCUSSION
66
Figure-4.1: Assignment of protons in 16-2-16 gemini surfactant structure used in the
interpretation of 1H NMR spectra.
Chemical shift data for each surfactant:
a) 16-2-16.2X – (X
– = Br
– or Cl
–).
1H NMR (300 MHz, CD3OD, 25 °C, δ ppm):
4.75 (4H, t); 3.69 (4H, t); 3.49 (12H, m); 1.78 (4H, m); 1.35 (4H, m); 1.23 (48H, m); 0.83-
0.87 (6H, t).
b) 16-2-16.2AMP –.
1H NMR (300 MHz, D2O, 25 °C, δ ppm):
8.36 (1H, s); 8.07 (1H, s); 5.98 (2H, d); 4.66 (4H, t); 4.38 (2H, m); 4.22 (2H, m); 4.03 (4H,
m); 3.81 (4H, t); 3.35 (4H, t); 3.17 (12H, m); 1.61 (4H, m); 1.19 (4H, m); 1.05 (48H, m);
0.67 (6H, t).
c) 16-2-16.2UMP –.
1H NMR (300 MHz, D2O, 25 °C, δ ppm):
7.95 (1H, d); 5.91 (1H, d); 5.86 (1H, s); 4.29 (2H, m); 4.17 (2H, m); 4.05 (4H, m); 3.87 (4H,
t); 3.46 (4H, t); 3.23 (12H, m); 1.75 (4H, m); 1.34 (4H, m); 1.19 (48H, m); 0.79 (6H, t).
d) 16-2-16.2CMP –.
1H NMR (300 MHz, D2O, 25 °C, δ ppm):
7.99 (1H, t); 6.08 (1H, d); 5.90 (2H, d); 4.25 (2H, m); 4.18 (2H, m); 4.09 (4H, m); 4.02 (4H,
t); 3.39 (4H, t); 3.21 (12H, m); 1.70 (4H, m); 1.32 (4H, m); 1.22 (48 H, m); 0.82 (6H, t).
CHAPTER-4: RESULTS & DISCUSSION
67
e) 16-2-16.2GMP –.
1H NMR (300 MHz, D2O, 25 °C, δ ppm):
7.99 (1H, d); 5.79 (1H, d); 4.64 (2H, t); 4.38 (2H, m); 4.16 (2H, m); 3.98 (4H, m); 3.81 (4H,
t); 3.36 (4H, t); 3.15 (12H, m); 1.63 (4H, m); 1.14 (4H, m); 1.11 (48H, m); 0.72 (6H, t).
f) 16-2-16.Tartrate – –
. 1H NMR (300 MHz, D2O, 25 °C, δ ppm):
4.20 (2H, d); 3.84 (4H, t); 3.39 (4H, t); 3.18 (12H, m); 1.68 (4H, m); 1.28 (4H, m); 1.23
(48H, m); 0.81 (6H, t).
g) 16-2-16.Malate – –
. 1H NMR (300 MHz, D2O, 25 °C, δ ppm):
4.11 (1H, t); 3.81 (4H, t); 3.35 (4H, t); 3.14 (12H, m); 2.22-2.26 (2H, m); 1.65 (4H, m); 1.27
(4H, m); 1.19 (48H, m); 0.77 (6H, t).
4.2 Physicochemical characterization of Gemini Surfactants
As mentioned in the “Objective” section 2.3, various techniques were employed for
physicochemical characterization the gemini surfactants. Tensiometry and conductometry
were used to characterize the aggregation behavior of gemini surfactants. Krafft temperature,
solubility of organic counterions, density, pH, viscosity, and foamability measurements were
done as a part of physicochemical characterization for all the gemini surfactants. The data for
solubility, viscosity and foamability measurements have been provided in the “Appendix”
section of this dissertation.
4.2.1 Characterization of Gemini Surfactant Aggregation using Tensiometry and
Conductometry
We employed the tensiometric and conductometric method to study the micellization
of the 16-2-16 series of gemini associated with eight different counterions in the structure.
CHAPTER-4: RESULTS & DISCUSSION
68
The majority of literature studies in which the impact of counterion on surfactant aggregation
is examined use added salt as opposed to exchange of the counterion [114, 115, 134, 138,
148-162]. It should be noted that the effects of added salt, as opposed to the exchange of
counterion can result in dramatic differences in aggregation properties, in part due to the
increase in ionic strength which has a major effect to dissociate the counterions of the GSs,
and partly because the incomplete removal of the original counterion may still affect the
surface and aggregation properties [134].
4.2.1.1 CMC and head group area determinations by Tensiometry
The micellization behavior and surface activity of an ionic surfactant is mainly
dependent on the associated counterion [108]. The variations of the surface tension, γ with
the semi-log concentration, Log C (molar) at 298.16 K (for gemini-tartrate, T=308.16 K) for
16-2-16 series of gemini surfactant are shown in Figure-4.2. From the figure, it can be clearly
observed that the surface tension decreases sharply with an increase in surfactant
concentration until the critical micelle concentration is reached.
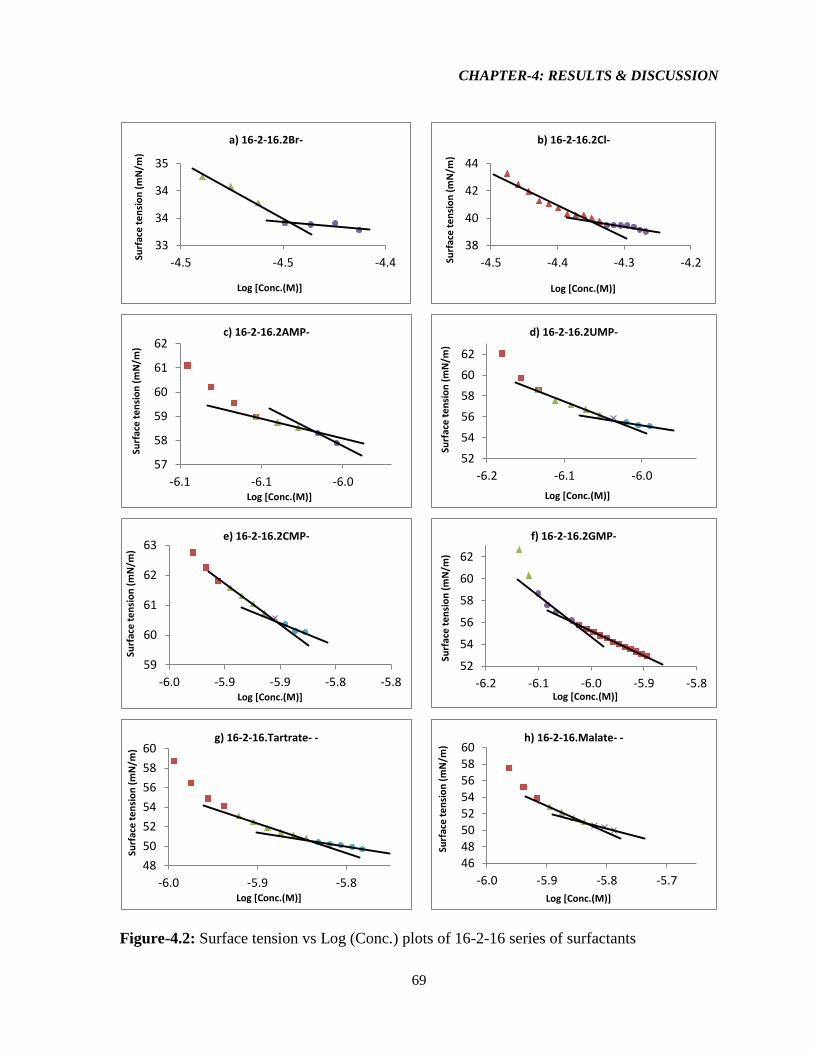
CHAPTER-4: RESULTS & DISCUSSION
69
33
34
34
35
-4.5 -4.5 -4.4Surf
ace
te
nsi
on
(m
N/m
)
Log [Conc.(M)]
a) 16-2-16.2Br-
38
40
42
44
-4.5 -4.4 -4.3 -4.2Surf
ace
te
nsi
on
(m
N/m
)
Log [Conc.(M)]
b) 16-2-16.2Cl-
57
58
59
60
61
62
-6.1 -6.1 -6.0
Surf
ace
te
nsi
on
(m
N/m
)
Log [Conc.(M)]
c) 16-2-16.2AMP-
52
54
56
58
60
62
-6.2 -6.1 -6.0
Surf
ace
te
nsi
on
(m
N/m
)
Log [Conc.(M)]
d) 16-2-16.2UMP-
59
60
61
62
63
-6.0 -5.9 -5.9 -5.8 -5.8
Surf
ace
te
nsi
on
(m
N/m
)
Log [Conc.(M)]
e) 16-2-16.2CMP-
52
54
56
58
60
62
-6.2 -6.1 -6.0 -5.9 -5.8
Surf
ace
te
nsi
on
(m
N/m
)
Log [Conc.(M)]
f) 16-2-16.2GMP-
48
50
52
54
56
58
60
-6.0 -5.9 -5.8
Surf
ace
te
nsi
on
(m
N/m
)
Log [Conc.(M)]
g) 16-2-16.Tartrate- -
46485052545658
60
-6.0 -5.9 -5.8 -5.7
Surf
ace
te
nsi
on
(m
N/m
)
Log [Conc.(M)]
h) 16-2-16.Malate- -
Figure-4.2: Surface tension vs Log (Conc.) plots of 16-2-16 series of surfactants
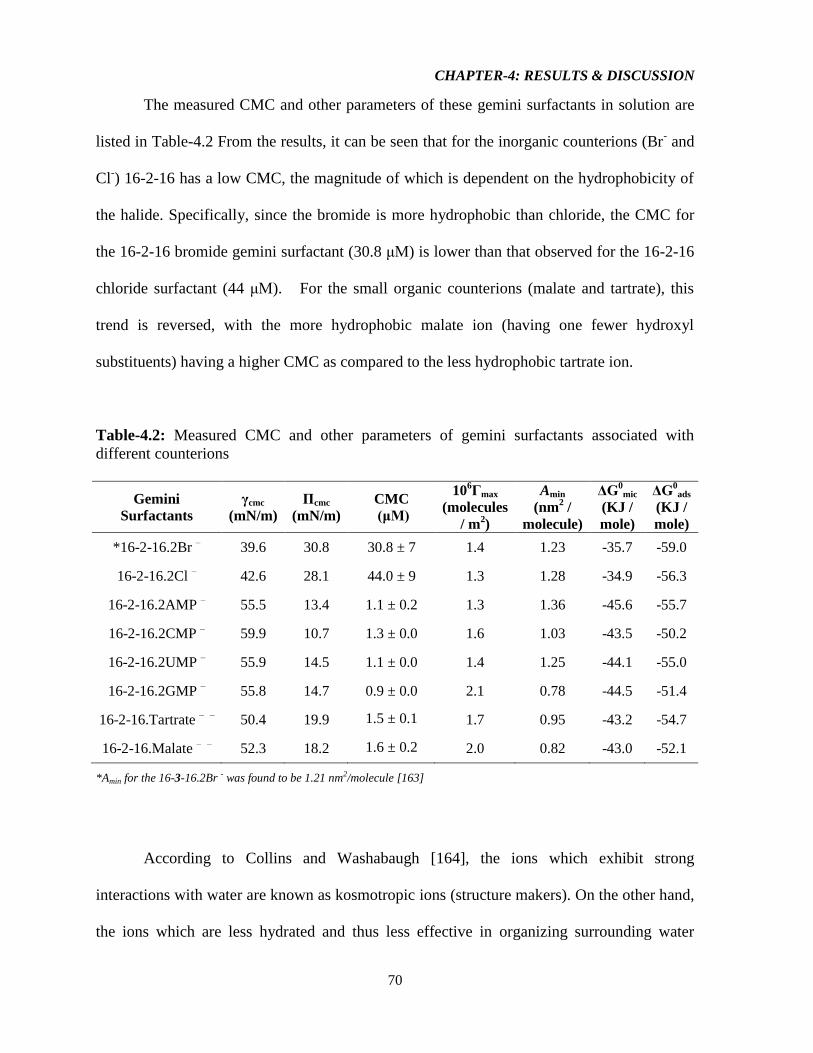
CHAPTER-4: RESULTS & DISCUSSION
70
The measured CMC and other parameters of these gemini surfactants in solution are
listed in Table-4.2 From the results, it can be seen that for the inorganic counterions (Br- and
Cl-) 16-2-16 has a low CMC, the magnitude of which is dependent on the hydrophobicity of
the halide. Specifically, since the bromide is more hydrophobic than chloride, the CMC for
the 16-2-16 bromide gemini surfactant (30.8 μM) is lower than that observed for the 16-2-16
chloride surfactant (44 μM). For the small organic counterions (malate and tartrate), this
trend is reversed, with the more hydrophobic malate ion (having one fewer hydroxyl
substituents) having a higher CMC as compared to the less hydrophobic tartrate ion.
Table-4.2: Measured CMC and other parameters of gemini surfactants associated with
different counterions
Gemini
Surfactants
γcmc
(mN/m)
Πcmc
(mN/m)
CMC
(μM)
106Γmax
(molecules
/ m2)
Amin
(nm2 /
molecule)
ΔG0
mic
(KJ /
mole)
ΔG0ads
(KJ /
mole)
*16-2-16.2Br – 39.6 30.8 30.8 ± 7 1.4 1.23 -35.7 -59.0
16-2-16.2Cl – 42.6 28.1 44.0 ± 9 1.3 1.28 -34.9 -56.3
16-2-16.2AMP – 55.5 13.4 1.1 ± 0.2 1.3 1.36 -45.6 -55.7
16-2-16.2CMP – 59.9 10.7 1.3 ± 0.0 1.6 1.03 -43.5 -50.2
16-2-16.2UMP – 55.9 14.5 1.1 ± 0.0 1.4 1.25 -44.1 -55.0
16-2-16.2GMP – 55.8 14.7 0.9 ± 0.0 2.1 0.78 -44.5 -51.4
16-2-16.Tartrate – – 50.4 19.9 1.5 ± 0.1 1.7 0.95 -43.2 -54.7
16-2-16.Malate – – 52.3 18.2 1.6 ± 0.2 2.0 0.82 -43.0 -52.1
*Amin for the 16-3-16.2Br - was found to be 1.21 nm2/molecule [163]
According to Collins and Washabaugh [164], the ions which exhibit strong
interactions with water are known as kosmotropic ions (structure makers). On the other hand,
the ions which are less hydrated and thus less effective in organizing surrounding water
CHAPTER-4: RESULTS & DISCUSSION
71
molecules are termed as chaotropic ions (structure-breakers) [164]. For inorganic
counterions, ions with low charge density and larger radii (e.g. bromide) typically have a
stronger chaotropic effect. Hydrophobic inorganic counterions are more polarizable and are
least hydrated in aqueous solution; and being chaotropic in nature, they destroy the structure
of water in the vicinity of the counterion leading to reduced CMC values, favoring
micellization [123].
At the end of 19th
century, Hofmeister proposed that the influence of ions on the
precipitation of proteins in salt solutions followed a particular pattern, leading to the
commonly referred to "Hofmeister series" of ions [164, 165]. Although Hofmeister effects
for macromolecules in aqueous solution are ubiquitous (for example enzyme activity, protein
stability, protein–protein interactions, optical rotation of sugar and amino acids, as well as
bacterial growth) [166], this pattern of behavior is also observed in many physico-chemical
mechanisms including the phenomena of micellization of charged surfactants [167]. Cremer
et al. (2006) reported that the direct interactions existing between the ions and
macromolecules are predominantly responsible for most aspects of this pattern [166].
Furthermore, Warr et al. (2004) reported a study to evaluate the affinity of some anions (Br-,
Cl-, I
-, NO3
-) to the head groups of gemini surfactants at the air/water interfaces and their
subsequent effects on gemini aggregation. The order of affinity of the counterions for gemini
surfactant descends I- > NO3
- > Br
- > Cl
-, which follows to the Hofmeister series [168].
Similarly, Manet et al. (2010) reported that the CMC of gemini surfactants with
monatomic counterions generally increases according to the Hofmeister series: I- < NO3
- ∼
Br-< Cl
- < F
- ∼ C2
- < PH. On the other hand, due to entropic reasons, micellization is
disfavored for large polyatomic anions, although they have a lower hydration number, and
CHAPTER-4: RESULTS & DISCUSSION
72
similar hydrophobicity to the monatomic counterions [123]. Our results for the gemini
halides were in agreement with the previously reported trends.
The packing densities of surfactants at the air-water interface are important to the
interpretation of the surface activities of surfactants [80, 84, 169, 170]. The surfactant
molecule occupies an area at the air/water interface (i.e. Amin) which should reflect their
packing densities [80, 170, 171]. The surface excess concentration Γmax (also known as the
Gibbs surface free excess) and the minimum surface area occupied/molecule, Amin at the air-
water interface can be calculated according to the Gibbs adsorption isotherm [108, 172].
𝛤𝑚𝑎𝑥 =−1
2.303𝑛𝑅𝑇
𝑑𝛾
𝑑𝑙𝑜𝑔𝐶 4.1
and, the equation
Amin = (NAΓmax) – 1
× 1018
4.2
where, R = 8.314 J·mol−1
·K−1
, T = 298.15 K with surface tension (γ) expressed in N/m, NA is
Avogadro’s number (6.023 × 10²³
mol−1
), and n is the number of species the surfactant
dissociates into. For monovalent counterions in combination with the gemini surfactant, a
value n = 3 generally used, for the case of divalent counterions combined with the gemini, a
value of n = 2 is used [94, 170, 172-174].
The CMC, average surface tension at the CMC (γcmc), average surface pressure (Πcmc)
Γmax, Amin, the average Gibbs free energy of micellization (∆G0
mic), and the standard free
energy of adsorption (∆G0
ads) have been determined from the tensiometry measurements and
are listed in Table-4.2. ∆G0
mic and G0
ads can be calculated according to [80, 175] –
∆G0
mic = RT ln XCMC 4.3
∆G0
ads = ∆G0
mic – ПCMC / max 4.4
CHAPTER-4: RESULTS & DISCUSSION
73
where, XCMC is the CMC in mole fraction units [i.e. CMC / (CMC + 55.6), where 55.6 is the
number of moles of water per litre], ПCMC is the surface pressure at CMC (ПCMC = γ0 – γcmc:
γ0 is the surface tension of pure water).
Both ∆G0
mic and G0ads are strongly negative, indicating that micelle formation and
adsorption at the air-water interface are spontaneous processes. From our results, it is clear
that a change in the counterion impacts the aggregation of the gemini surfactant, rather
dramatically. The trends in ∆G0
mic and G0ads as well as Amin are similar to that observed for
the CMC, again likely related to the relative hydrophobicity of the counterions.
Although the presence of hydroxyl groups in their structures makes the NMP
counterions hydrophilic in nature, from the solubility data (in Appendix section) it was found
that the solubility of the NMP counterions follows the sequence: UMP > AMP > CMP >
GMP. Overall, these four counterions affect the CMC of 16-2-16, reducing it by almost 40-
fold compared to that for the gemini halides. Although no conclusion can be drawn from our
data based on the hydrophilicity of these counterions (i.e. the CMC values along with the
other parameters does NOT follow the trend of increasing hydrophobicity), all the gemini-
NMPs have approximately the same energies of micellization and adsorption. Again, the
negative values of both ΔG0
mic and ΔG0ads signify that the adsorption of these 16-2-16 series
of surfactants at the air/water interface as well as micellization in the aqueous solution is
spontaneous.
CHAPTER-4: RESULTS & DISCUSSION
74
4.2.1.2 Electrical Conductivity Measurements: Conductometry
The CMC and degree of micelle ionization for an ionic surfactant can be determined
from a plot of the electrical conductivity (κ) of the solution as a function of surfactant
concentration. The conductance increases linear with increasing concentration, as the number
of ions present in solution also increases. At the CMC, aggregation takes place, at which
point the ions no longer move independently from one another, resulting in a dramatic
decrease in slope for the conductivity vs. concentration curve. A linear fit [82, 176-178] of
the conductivity above and below the CMC is used to determine the value of the CMC; the
point of intersection of the two linear fits is equal to the CMC [134, 179]. The degree of
micelle ionization of the micelles, α can be calculated from the ratio of the slopes of the
linear regions above and below the CMC [134]. The degree of ionization α can also be
replaced by the degree of counterion association to micelle, β obtained by the relationship α
= 1 – β. Both the terms α and β are used to reflect the extent of counterion binding to the
micelles. A larger value of α, corresponds to greater dissociation of the counterions from the
surface of the micelle, and indicates weaker binding of the counterions to the micelles [134].
The conductance plots for all surfactants are shown in Figure 4.3, and calculated
values of the CMC and α are provided in Table-4.3. Excellent agreement is observed
between the CMC determined from conductivity measurements and those determined from
surface tension. Again, we see a pronounced effect of counterion exchange on the CMC and
Gibbs free energy of micellization, although surprising, the effect of counterion exchange on
α was minimal.

CHAPTER-4: RESULTS & DISCUSSION
75
0
2
4
6
8
10
12
14
16
0.E+00 2.E-05 4.E-05 6.E-05
Co
nd
uct
ance
(μ
S/cm
)
Conc. (M)
b) 16-2-16.2Cl-
0
2
4
6
8
0.E+00 2.E-05 4.E-05 6.E-05
Co
nd
uct
ance
(μ
S/cm
)
Conc. (M)
a) 16-2-16.2Br-
0
2
4
6
8
0.E+00 4.E-07 8.E-07 1.E-06 2.E-06
Co
nd
uct
ance
(μ
S/cm
)
Conc. (M)
d) 16-2-16.2UMP-
0
2
4
6
8
10
12
0.E+00 4.E-07 8.E-07 1.E-06 2.E-06
Co
nd
uct
ance
(μ
S/cm
)
Conc. (M)
c) 16-2-16.2AMP-
0
2
4
6
8
0.E+00 4.E-07 8.E-07 1.E-06 2.E-06
Co
nd
uct
ance
(μ
S/cm
)
Conc. (M)
f) 16-2-16.2GMP-
0
2
4
6
0.E+00 6.E-07 1.E-06 2.E-06 2.E-06
Co
nd
uct
ance
(μ
S/cm
)
Conc. (M)
e) 16-2-16.2CMP-
0
1.5
3
4.5
0.E+00 7.E-07 1.E-06 2.E-06 3.E-06 4.E-06
Co
nd
uct
ance
(μ
S/cm
)
Conc. (M)
h) 16-2-16.Malate- -
0
2
4
6
8
0.E+00 7.E-07 1.E-06 2.E-06 3.E-06 4.E-06
Co
nd
uct
ance
(μ
S/cm
)
Conc. (M)
g) 16-2-16.Tartrate- -
Figure-4.3: Specific conductance vs Concentration for the 16-2-16 gemini surfactants with
various counterions. The intersection of the lines of best fit give the CMC, and the ratio of
the slopes above and below the CMC (S2/S1) provides the degree of micelle ionization, .
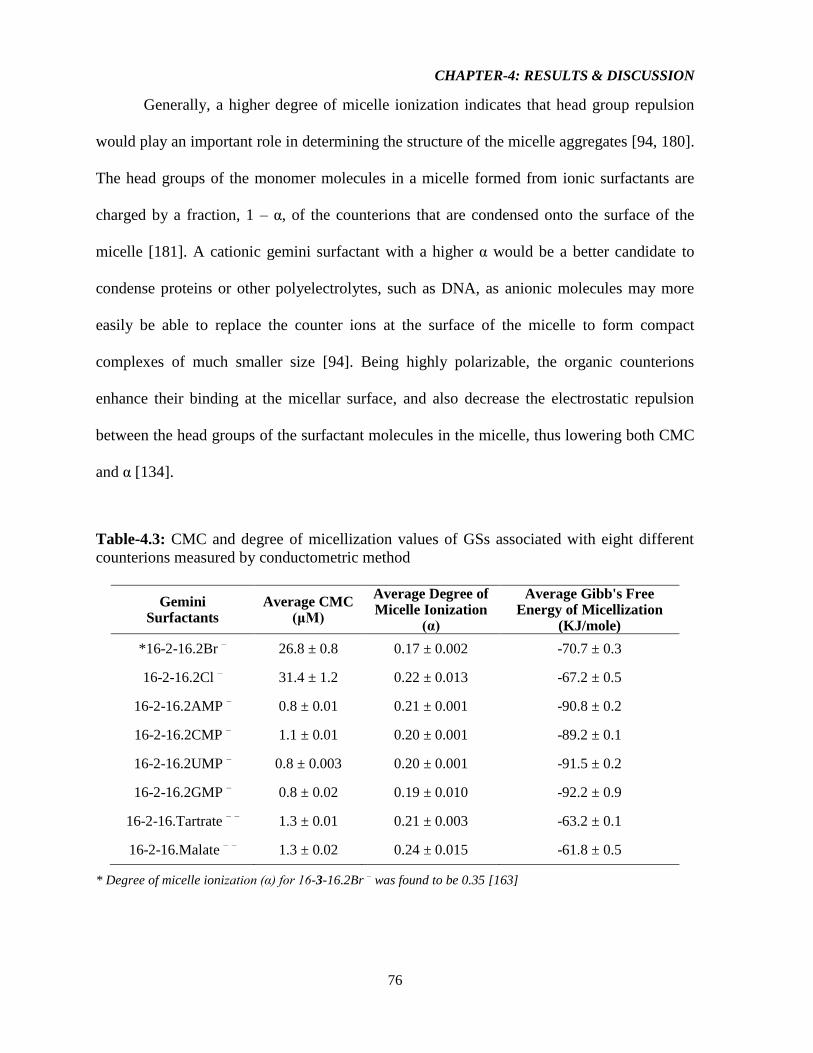
CHAPTER-4: RESULTS & DISCUSSION
76
Generally, a higher degree of micelle ionization indicates that head group repulsion
would play an important role in determining the structure of the micelle aggregates [94, 180].
The head groups of the monomer molecules in a micelle formed from ionic surfactants are
charged by a fraction, 1 – α, of the counterions that are condensed onto the surface of the
micelle [181]. A cationic gemini surfactant with a higher α would be a better candidate to
condense proteins or other polyelectrolytes, such as DNA, as anionic molecules may more
easily be able to replace the counter ions at the surface of the micelle to form compact
complexes of much smaller size [94]. Being highly polarizable, the organic counterions
enhance their binding at the micellar surface, and also decrease the electrostatic repulsion
between the head groups of the surfactant molecules in the micelle, thus lowering both CMC
and α [134].
Table-4.3: CMC and degree of micellization values of GSs associated with eight different
counterions measured by conductometric method
Gemini Surfactants
Average CMC (μM)
Average Degree of Micelle Ionization
(α)
Average Gibb's Free Energy of Micellization
(KJ/mole)
*16-2-16.2Br – 26.8 ± 0.8 0.17 ± 0.002 -70.7 ± 0.3
16-2-16.2Cl – 31.4 ± 1.2 0.22 ± 0.013 -67.2 ± 0.5
16-2-16.2AMP – 0.8 ± 0.01 0.21 ± 0.001 -90.8 ± 0.2
16-2-16.2CMP – 1.1 ± 0.01 0.20 ± 0.001 -89.2 ± 0.1
16-2-16.2UMP – 0.8 ± 0.003 0.20 ± 0.001 -91.5 ± 0.2
16-2-16.2GMP – 0.8 ± 0.02 0.19 ± 0.010 -92.2 ± 0.9
16-2-16.Tartrate – – 1.3 ± 0.01 0.21 ± 0.003 -63.2 ± 0.1
16-2-16.Malate – – 1.3 ± 0.02 0.24 ± 0.015 -61.8 ± 0.5
* Degree of micelle ionization (α) for 16-3-16.2Br – was found to be 0.35 [163]
CHAPTER-4: RESULTS & DISCUSSION
77
The Gibbs free energy of micellization (ΔGmic) was calculated from the following
equations [134]. As the degrees of micelle ionization of the micelles (α) values are readily
available directly from the conductometric plots, literature suggests using these equations
[134] to calculate the ΔGmic more accurately, instead using the equation-4.3 used in case of
tensiometry:
ΔGmic = RT (1+2β) ln (CMC) – RT ln 2 [For monovalent counterions] 4.5
ΔGmic = RT (1+β) ln (CMC / 2) [For divalent counterions] 4.6
where, T = 298.16 K; R = 8.314 J/mole/K; β = (1 – α); α = (Slope–2 / Slope–1); from
Specific conductance (μS/cm) vs. Concentration (M) curve. The CMC values obtained from
tensiometry and conductometry methods were approximately close and in good agreement,
but the free energy of micellization was drastically different due to application of different
equations [94, 108] and experimental technique.
4.2.2 Krafft Temperature
Generally for cationic and anionic surfactants, the solubility in water undergoes an
abrupt increase at a particulate temperature. This temperature is known as the Krafft
temperature (TK) and is the minimum temperature at which point the hydrated surfactant
becomes soluble and is judged visually to be the point of complete clarification of a turbid
saturated solution of surfactant [181-184]. Below TK, a gel or precipitate is formed [118] and
the surfactants remain in crystalline (hydrated crystals) form [80]. Hydrophobic tail lengths,
the nature of the surfactant head group and the nature of the associated counterions are all
key parameters in determining TK. Generally, the TK of a conventional monomeric and ionic
CHAPTER-4: RESULTS & DISCUSSION
78
surfactant is found to increase with increasing the length of the alkyl chain and decrease with
increasing the size of the head group [182]. As such, the double tailed gemini surfactants
with longer chain lengths have higher TK [137].
The inorganic bromide and chloride counterions are more polarizable, less
hydrophilic and as a result less hydrated [123]. As such the more hydrophobic bromide
counterion results in a Krafft temperature higher than that for the chloride counter ion (Table
4.8). Tartaric acid has one additional hydroxyl group in its structure as compared to malic
acid, resulting in increased hydrogen bonding in an aqueous solution of tartaric acid leading
to decreased solubility of tartrate ions at room temperature. As the temperature increases, the
Brownian motion of the water molecules increases exponentially and thus, the existing
intermolecular hydrogen bonds disrupts leading to the solubility of tartaric acid at a higher
temperature. Consequently, the TK for gemini-tartrate was found higher than the gemini-
malate. The solubilities of the NMPs at different temperatures decreases according to this
sequences: UMP > AMP > CMP > GMP, found from the solubility test (see “Appendix”
section). With the exception of AMP and CMP, the Krafft temperatures follow the same
trend (Table 4.4), with the Krafft temperature of GMP being the highest at 550C.
4.2.3 Determination of pH, and density
Table-4.4 also summarizes the average values for pH, and density measurements for
our series of gemini surfactants. Counterions associated with the gemini structure clearly
impact the pH of the gemini surfactant in solution. Among the eight gemini surfactants
examined, the UMP counterion makes the resulting gemini solution most acidic whereas
chloride ions render the gemini solution almost neutral. The optimum pH required for
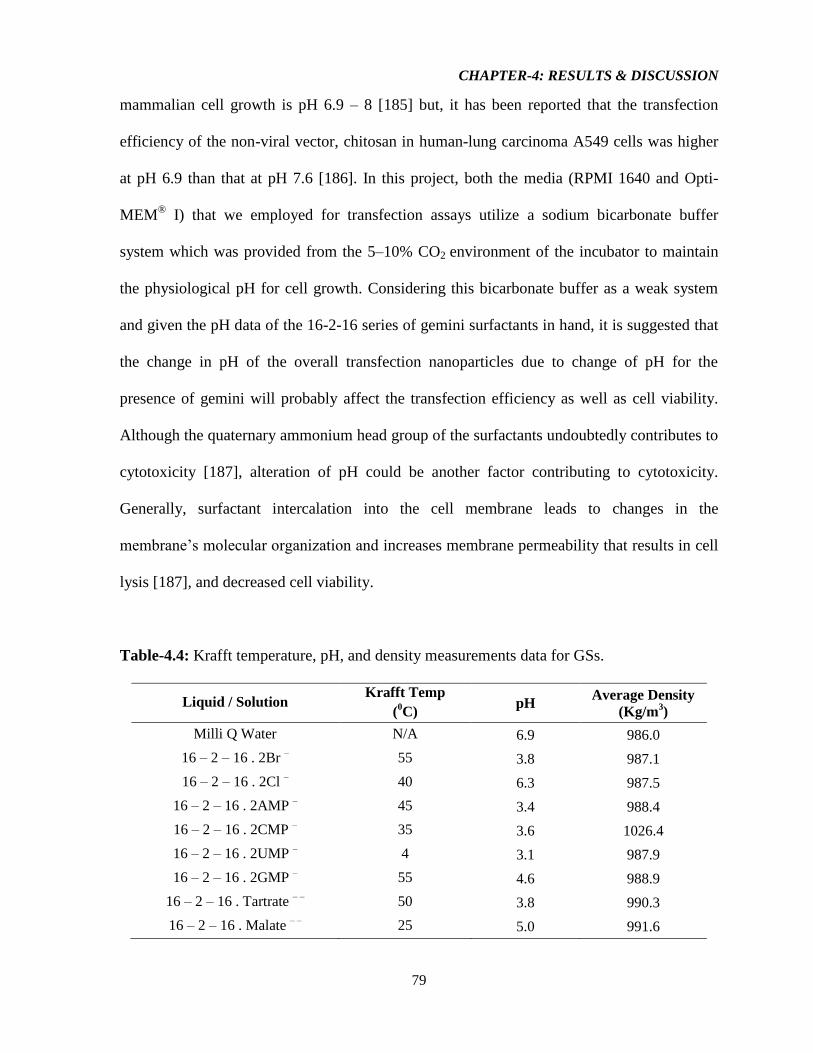
CHAPTER-4: RESULTS & DISCUSSION
79
mammalian cell growth is pH 6.9 – 8 [185] but, it has been reported that the transfection
efficiency of the non-viral vector, chitosan in human-lung carcinoma A549 cells was higher
at pH 6.9 than that at pH 7.6 [186]. In this project, both the media (RPMI 1640 and Opti-
MEM® I) that we employed for transfection assays utilize a sodium bicarbonate buffer
system which was provided from the 5–10% CO2 environment of the incubator to maintain
the physiological pH for cell growth. Considering this bicarbonate buffer as a weak system
and given the pH data of the 16-2-16 series of gemini surfactants in hand, it is suggested that
the change in pH of the overall transfection nanoparticles due to change of pH for the
presence of gemini will probably affect the transfection efficiency as well as cell viability.
Although the quaternary ammonium head group of the surfactants undoubtedly contributes to
cytotoxicity [187], alteration of pH could be another factor contributing to cytotoxicity.
Generally, surfactant intercalation into the cell membrane leads to changes in the
membrane’s molecular organization and increases membrane permeability that results in cell
lysis [187], and decreased cell viability.
Table-4.4: Krafft temperature, pH, and density measurements data for GSs.
Liquid / Solution Krafft Temp
(0C)
pH Average Density
(Kg/m3)
Milli Q Water N/A 6.9 986.0
16 – 2 – 16 . 2Br – 55 3.8 987.1
16 – 2 – 16 . 2Cl – 40 6.3 987.5
16 – 2 – 16 . 2AMP – 45 3.4 988.4
16 – 2 – 16 . 2CMP – 35 3.6 1026.4
16 – 2 – 16 . 2UMP – 4 3.1 987.9
16 – 2 – 16 . 2GMP – 55 4.6 988.9
16 – 2 – 16 . Tartrate – –
50 3.8 990.3
16 – 2 – 16 . Malate – –
25 5.0 991.6
CHAPTER-4: RESULTS & DISCUSSION
80
Variations in counterions have a less prominent effect on the average density of the
16-2-16 series of surfactants, again shown in Table-4.4. Comparatively very subtle increase
in density was observed for the gemini-CMP solution probably due to their actual
morphological shapes and packing densities. The rest of the gemini surfactants have
comparable densities (all approximately that of pure water), likely due to their similarities in
packing and self-assembly behaviour. No notable patterns of changes in densities based on
variation of counterions were found to correlate with the solubility data of the counterions,
although there is no direct or inverse relationship exists between the density and solubility.
4.3 Characterization of 16-2-16 GS aggregates by size and zeta potential measurements
4.3.1 Size and zeta potential of extracted plasmid
It has already been confirmed the presence of supercoiled pNN9 plasmid (CCC) in
our extracted samples, mentioned in the section 3.2.8. Despite the fact that pNN9 was the
larger sized plasmid [79], the DNA supercoiling reduced the overall size and the average size
of the pNN9 plasmid solution was found at 414 (± 15) nm with a polydispersity index (PDI)
of 0.52. Although the DNA supercoiling can mask a fraction of the negative charges attained
from the intramolecular phosphate groups, resulting to a lower effective negative charge
[188, 189] for pNN9 (CCC), our results of measured zeta potential values were found at –33
(± 0.5) mV. These negative zeta potentials of the pNN9 plasmids (CCC) denoted significant
surface charges for extensive electrostatic interaction with the cationic 16-2-16 gemini
surfactant, leading to complete counterion release and reduced head group repulsions.
Reduced intermolecular head group repulsion between the surfactant molecules will ensure
better DNA encapsulation leading to more uniform aggregates.
CHAPTER-4: RESULTS & DISCUSSION
81
4.3.2 Size and zeta potential of DOPE vesicles
The average size of the DOPE vesicles was found to be 124 ± 8 nm with a PDI of
0.46. This value was in excellent agreement with the value reported by Wettig et al. [143].
The average zeta potential for the DOPE vesicles was found to be –30 ± 2 mV.
4.3.3 Size and zeta potential of 16-2-16 gemini surfactants in solutions
The average aggregate size and the average zeta potential of the gemini surfactants
are reported in Table-4.5 and illustrated graphically in Figure-4.4. Due to high concentrations
of the stock solution (1.5 mM, well above the CMC of all the eight surfactants), all the 16-2-
16 gemini surfactants were able to rapidly self-assemble into micelles within the experiment
conditions.
From both the size and zeta potential data, it is evident that counterions play a
significant role on the aggregate hydrodynamic radius and zeta potential for the gemini
surfactants. Comparing the gemini-halides, 16-2-16-bromide forms smaller aggregates (211
± 5) with a more homogenous size (as indicated by the lower polydispersity index) than the
16-2-16-chloride (274 ± 24). This trend followed the CMC pattern of inorganic counterions
(for example, Br– and Cl
–) with the sequence mentioned in Hofmeister series based on
hydrophobicity of inorganic counterions. Both the 16-2-16-Bromide and 16-2-16-Chloride
aggregates have strong positive zeta potential (ζ) values which indicate that the aggregates
possess colloidal stability, but also have sufficient positive charge for interaction with and
compaction of the negatively charged DNA molecules.
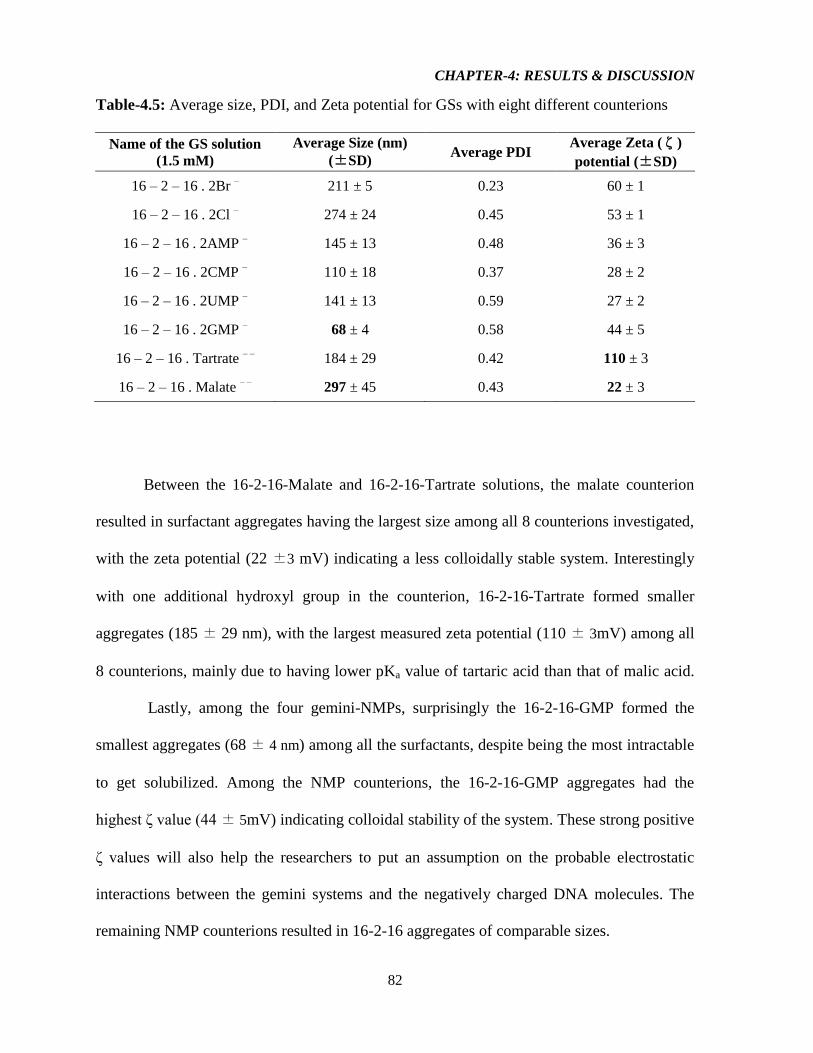
CHAPTER-4: RESULTS & DISCUSSION
82
Table-4.5: Average size, PDI, and Zeta potential for GSs with eight different counterions
Name of the GS solution
(1.5 mM)
Average Size (nm)
(±SD) Average PDI
Average Zeta (ζ)
potential (±SD)
16 – 2 – 16 . 2Br – 211 ± 5 0.23 60 ± 1
16 – 2 – 16 . 2Cl – 274 ± 24 0.45 53 ± 1
16 – 2 – 16 . 2AMP – 145 ± 13 0.48 36 ± 3
16 – 2 – 16 . 2CMP – 110 ± 18 0.37 28 ± 2
16 – 2 – 16 . 2UMP – 141 ± 13 0.59 27 ± 2
16 – 2 – 16 . 2GMP – 68 ± 4 0.58 44 ± 5
16 – 2 – 16 . Tartrate – –
184 ± 29 0.42 110 ± 3
16 – 2 – 16 . Malate – –
297 ± 45 0.43 22 ± 3
Between the 16-2-16-Malate and 16-2-16-Tartrate solutions, the malate counterion
resulted in surfactant aggregates having the largest size among all 8 counterions investigated,
with the zeta potential (22 ±3 mV) indicating a less colloidally stable system. Interestingly
with one additional hydroxyl group in the counterion, 16-2-16-Tartrate formed smaller
aggregates (185 ± 29 nm), with the largest measured zeta potential (110 ± 3mV) among all
8 counterions, mainly due to having lower pKa value of tartaric acid than that of malic acid.
Lastly, among the four gemini-NMPs, surprisingly the 16-2-16-GMP formed the
smallest aggregates (68 ± 4 nm) among all the surfactants, despite being the most intractable
to get solubilized. Among the NMP counterions, the 16-2-16-GMP aggregates had the
highest ζ value (44 ± 5mV) indicating colloidal stability of the system. These strong positive
ζ values will also help the researchers to put an assumption on the probable electrostatic
interactions between the gemini systems and the negatively charged DNA molecules. The
remaining NMP counterions resulted in 16-2-16 aggregates of comparable sizes.
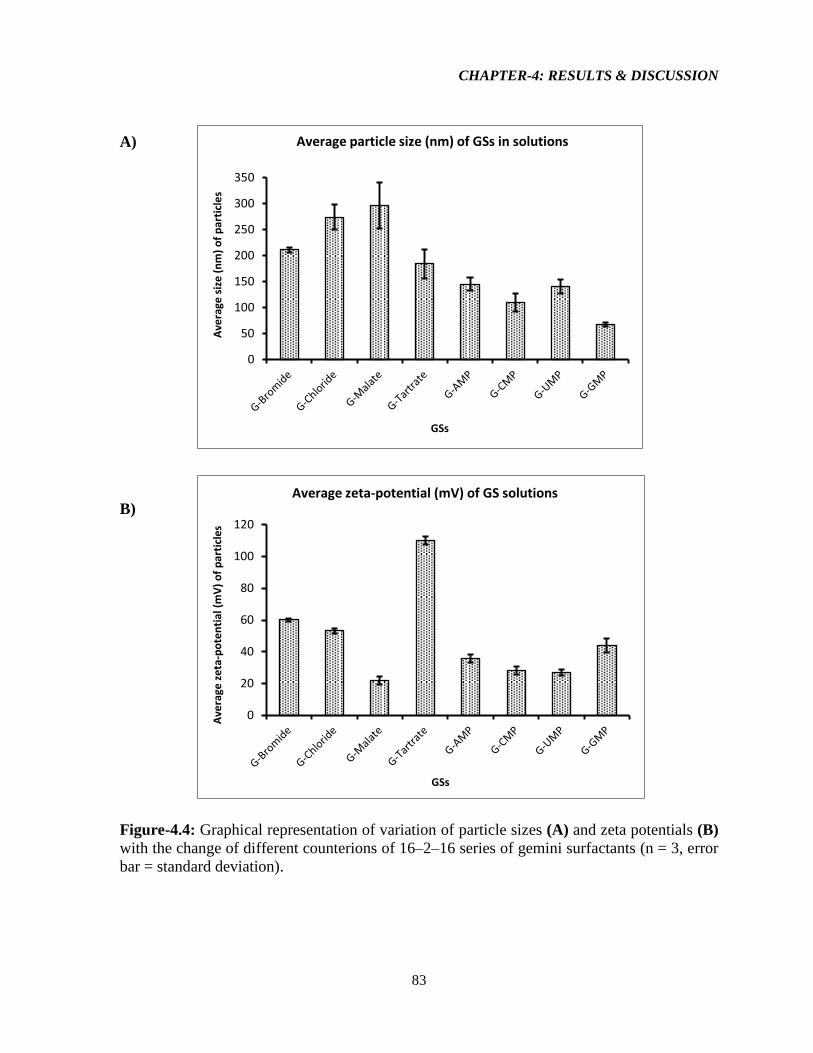
CHAPTER-4: RESULTS & DISCUSSION
83
0
50
100
150
200
250
300
350
Ave
rage
siz
e (
nm
) o
f p
arti
cle
s
GSs
Average particle size (nm) of GSs in solutions
0
20
40
60
80
100
120
Ave
rage
ze
ta-p
ote
nti
al (
mV
) o
f p
arti
cle
s
GSs
Average zeta-potential (mV) of GS solutions
A)
B)
Figure-4.4: Graphical representation of variation of particle sizes (A) and zeta potentials (B)
with the change of different counterions of 16–2–16 series of gemini surfactants (n = 3, error
bar = standard deviation).
CHAPTER-4: RESULTS & DISCUSSION
84
4.3.4 Size and zeta potential of 16–2–16 gemini based nanoparticles
4.3.4.1 Size and zeta potential of 16–2–16/Plasmid (GP) nanoparticles
Nanoparticles containing both 16-2-16 and plasmid were prepared following the
procedure as described in Section 3.2.9.2 of this dissertation. Three different charge ratios of
16–2–16 to DNA (10:1, 5:1, and 2:1) were used to prepare the G+P nanoparticles; these
nanoparticles have been prepared and characterized as controls for the complete 16–2–
16/Plasmid/DOPE (GDP) used in the in vitro transfection assays.
Usually, for a higher charge ratio, more surfactant molecules are available to compact
the plasmids, which intuitively should result in smaller sized GP aggregates with larger,
positive, ζ values. In reality, it was very difficult to draw such a conclusive relationship for
the GP nanoparticles produced using 16-2-16 surfactant with various counterions. From
Table-4.6, and Figure-4.5 it is clearly manifested that some of the 16-2-16 gemini surfactants
can produce much smaller sized aggregates after complexation with the plasmids than the
sizes of the GSs itself. In majority of the cases, the large particles exhibited at the charge
ratio of 2:1 were likely the result of aggregation upon charge neutralization of 16-2-16 head
groups and DNA, and in the case of 5:1 and 10:1 charge ratios, subsequent addition of more
gemini surfactants resulted in a dramatic decrease in particle sizes (except the GP
nanoparticles formulated from 16-2-16-Malate).
Here, based on the hydrophobicity of inorganic counterions (for example, Br– and Cl
–
), 16-2-16-Bromide produced smaller aggregates than the 16-2-16-Chloride, and this trend is
in agreement with the CMC pattern for inorganic counterions as in the Hofmeister series.
Although no notable pattern, based on either solubility or CMC, was seen on the sizes of the
gemini-NMP–plasmid aggregates, the aggregate sizes with the gemini-tartrate and gemini-
CHAPTER-4: RESULTS & DISCUSSION
85
malate followed the CMC trend mentioned in the Hofmeister series based on the
hydrophilicity of organic counterions. Whereas, the zeta potential values (Table-4.6) for the
GP nanoparticles formed from all the charge ratios were strongly positive, indicating the
existence of colloidal stability of the nanoparticles formed. The data presented in the tables
also reinforced that strong electrostatic interactions are responsible to compact the larger
sized DNA molecule to yield smaller nanoparticles, a crucial factor to obtain desired
transfections. In all the cases, the PDI values were found by < 0.4 indicating homogeneity of
the nanoparticles for all the eight GSs, and the SD values were found within ± 20 nm. This is
mainly due to the presence of strong electrostatic as well as hydrophobic interactions
between the 16-2-16 gemini surfactants and the negatively charged pNN9 molecules.
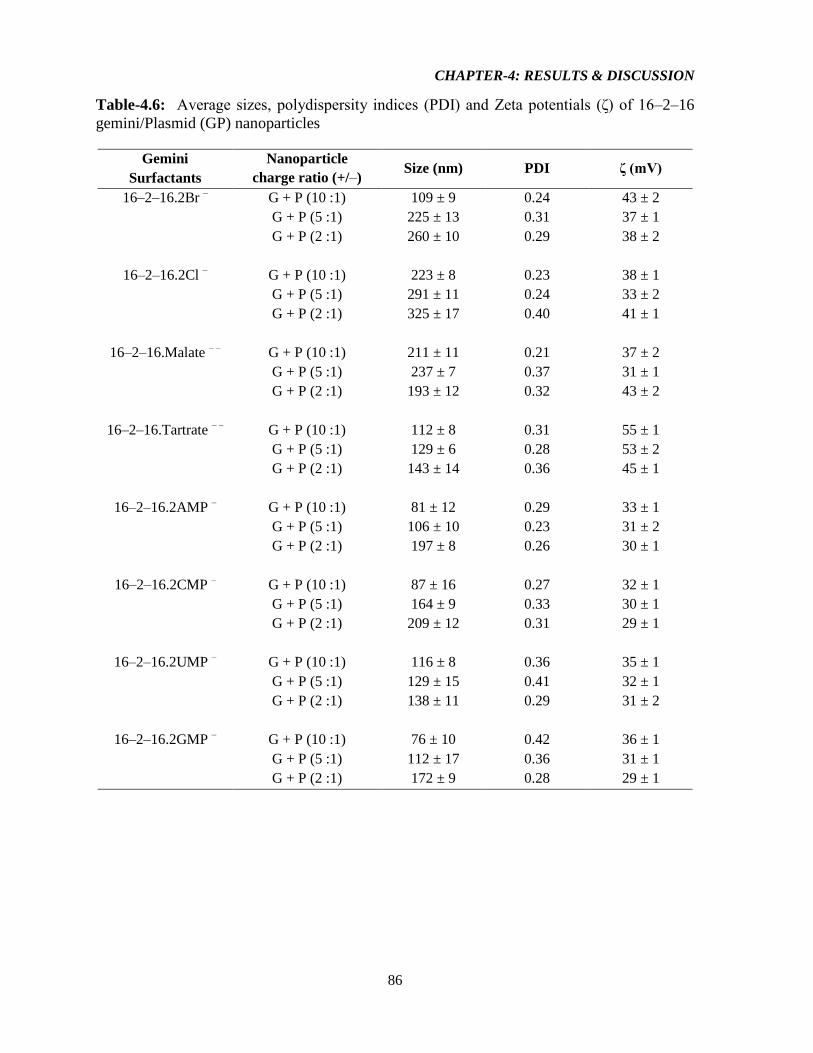
CHAPTER-4: RESULTS & DISCUSSION
86
Table-4.6: Average sizes, polydispersity indices (PDI) and Zeta potentials (ζ) of 16–2–16
gemini/Plasmid (GP) nanoparticles
Gemini
Surfactants
Nanoparticle
charge ratio (+/–) Size (nm) PDI ζ (mV)
16–2–16.2Br – G + P (10 :1) 109 ± 9 0.24 43 ± 2
G + P (5 :1) 225 ± 13 0.31 37 ± 1
G + P (2 :1) 260 ± 10 0.29 38 ± 2
16–2–16.2Cl – G + P (10 :1) 223 ± 8 0.23 38 ± 1
G + P (5 :1) 291 ± 11 0.24 33 ± 2
G + P (2 :1) 325 ± 17 0.40 41 ± 1
16–2–16.Malate – –
G + P (10 :1) 211 ± 11 0.21 37 ± 2
G + P (5 :1) 237 ± 7 0.37 31 ± 1
G + P (2 :1) 193 ± 12 0.32 43 ± 2
16–2–16.Tartrate – –
G + P (10 :1) 112 ± 8 0.31 55 ± 1
G + P (5 :1) 129 ± 6 0.28 53 ± 2
G + P (2 :1) 143 ± 14 0.36 45 ± 1
16–2–16.2AMP – G + P (10 :1) 81 ± 12 0.29 33 ± 1
G + P (5 :1) 106 ± 10 0.23 31 ± 2
G + P (2 :1) 197 ± 8 0.26 30 ± 1
16–2–16.2CMP – G + P (10 :1) 87 ± 16 0.27 32 ± 1
G + P (5 :1) 164 ± 9 0.33 30 ± 1
G + P (2 :1) 209 ± 12 0.31 29 ± 1
16–2–16.2UMP – G + P (10 :1) 116 ± 8 0.36 35 ± 1
G + P (5 :1) 129 ± 15 0.41 32 ± 1
G + P (2 :1) 138 ± 11 0.29 31 ± 2
16–2–16.2GMP – G + P (10 :1) 76 ± 10 0.42 36 ± 1
G + P (5 :1) 112 ± 17 0.36 31 ± 1
G + P (2 :1) 172 ± 9 0.28 29 ± 1
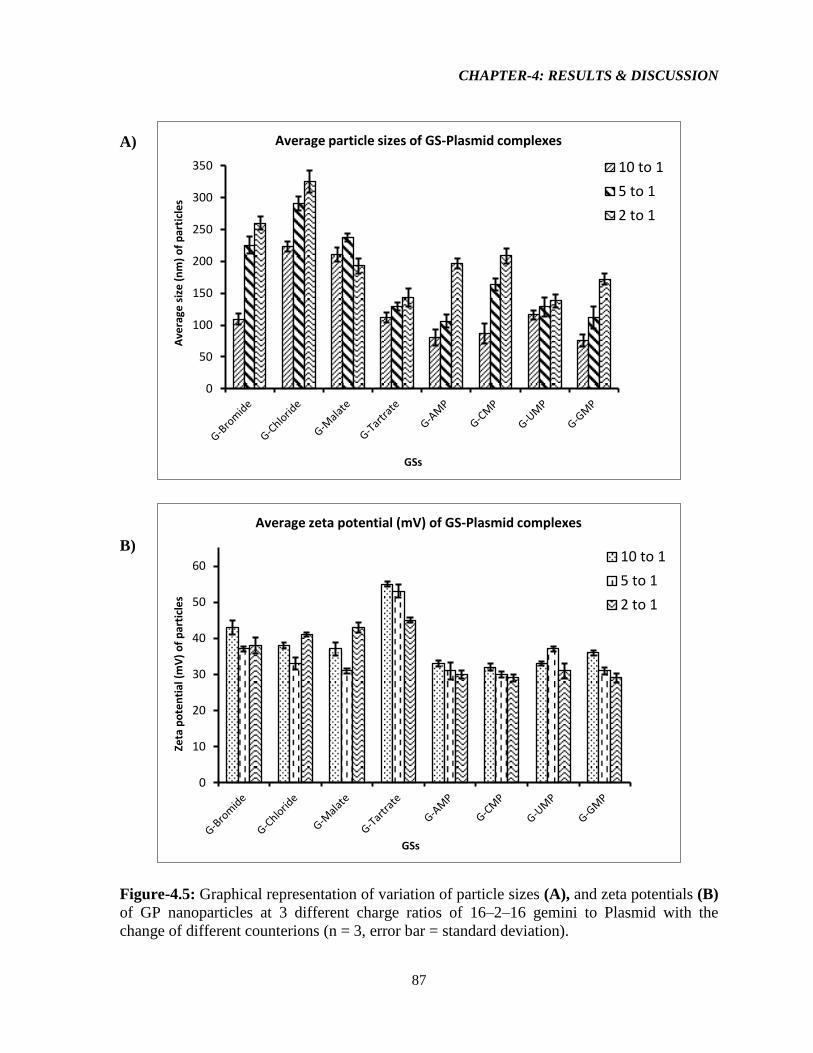
CHAPTER-4: RESULTS & DISCUSSION
87
0
10
20
30
40
50
60
Zeta
po
ten
tial
(m
V)
of
par
ticl
es
GSs
Average zeta potential (mV) of GS-Plasmid complexes
10 to 1
5 to 1
2 to 1
0
50
100
150
200
250
300
350A
vera
ge s
ize
(n
m)
of
par
ticl
es
GSs
Average particle sizes of GS-Plasmid complexes
10 to 1
5 to 1
2 to 1
A)
B)
Figure-4.5: Graphical representation of variation of particle sizes (A), and zeta potentials (B)
of GP nanoparticles at 3 different charge ratios of 16–2–16 gemini to Plasmid with the
change of different counterions (n = 3, error bar = standard deviation).
CHAPTER-4: RESULTS & DISCUSSION
88
4.3.4.2 Size and zeta potential of GDP and GD nanoparticles
Nanoparticles prepared for the actual transfection of our cells were prepared
using DOPE as a helper lipid. As described in the introduction of this thesis, the addition of
DOPE is observed, phenomenalogically to increase the transfection efficiencies of many
cationic lipids. This is thought to be due to the fact that DOPE is known to be a fusogenic
lipid, as well as having a preference for membranes with a high degree of curvature, both of
which tend to be destabilizing effects (antagonistic effects [190]) when DOPE is incorporated
into endosomal membranes. Table-4.7 summarizes the average size, polydispersity index and
zeta potential for the 16-2-16/Plasmid/DOPE (GDP) nanoparticles at three 16-2-16:DNA
charge ratios, with a 16-2-16:DOPE ratio of 2:5, for the various counterions studied. The
column charts in Figure-4.6 illustrate the average sizes and zeta potentials of GDP
nanoparticles at three charge ratios of 16-2-16 : DNA respectively.
From the evaluation of the particle size variations for lipoplexes across different
charge ratios, it is assumed that the varying sizes of the GDP lipoplexes, irrespective of post
incubation time after mixing with DOPE, may be attributed to supercoiled nature of the
pNN9 plasmids. Because, the supercoiled form of DNA had notable effects on the
interactions between DNA and gemini surfactant in terms of counterion release during
lipoplex formation [188, 189]. Literatures suggest that the compact conformation of
supercoiled CCC pDNA inhibit complete counterion displacement as well as altered
gemini/DNA interactions leading to subsequent varying size of aggregates [188, 189].
Overall, the differences in GDP sizes may be attributed to the existing antagonistic
interactions between 16-2-16 gemini and DOPE [190] in combination with incomplete
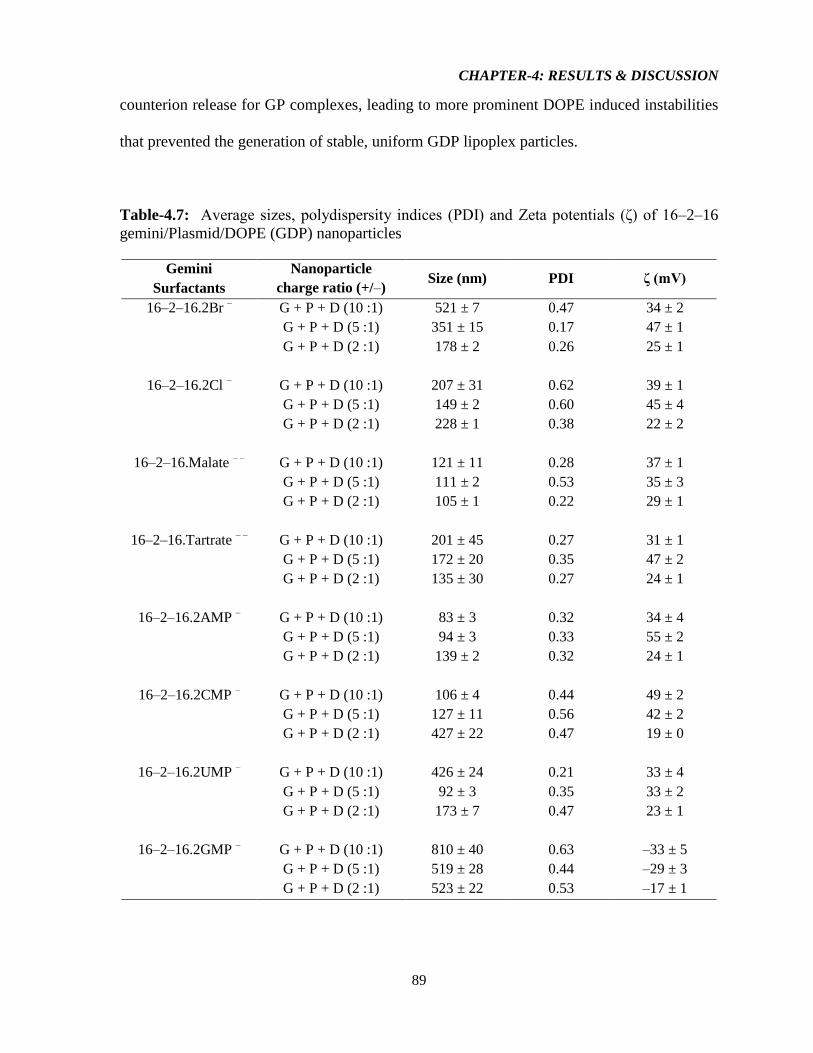
CHAPTER-4: RESULTS & DISCUSSION
89
counterion release for GP complexes, leading to more prominent DOPE induced instabilities
that prevented the generation of stable, uniform GDP lipoplex particles.
Table-4.7: Average sizes, polydispersity indices (PDI) and Zeta potentials (ζ) of 16–2–16
gemini/Plasmid/DOPE (GDP) nanoparticles
Gemini
Surfactants
Nanoparticle
charge ratio (+/–) Size (nm) PDI ζ (mV)
16–2–16.2Br – G + P + D (10 :1) 521 ± 7 0.47 34 ± 2
G + P + D (5 :1) 351 ± 15 0.17 47 ± 1
G + P + D (2 :1) 178 ± 2 0.26 25 ± 1
16–2–16.2Cl – G + P + D (10 :1) 207 ± 31 0.62 39 ± 1
G + P + D (5 :1) 149 ± 2 0.60 45 ± 4
G + P + D (2 :1) 228 ± 1 0.38 22 ± 2
16–2–16.Malate – –
G + P + D (10 :1) 121 ± 11 0.28 37 ± 1
G + P + D (5 :1) 111 ± 2 0.53 35 ± 3
G + P + D (2 :1) 105 ± 1 0.22 29 ± 1
16–2–16.Tartrate – –
G + P + D (10 :1) 201 ± 45 0.27 31 ± 1
G + P + D (5 :1) 172 ± 20 0.35 47 ± 2
G + P + D (2 :1) 135 ± 30 0.27 24 ± 1
16–2–16.2AMP – G + P + D (10 :1) 83 ± 3 0.32 34 ± 4
G + P + D (5 :1) 94 ± 3 0.33 55 ± 2
G + P + D (2 :1) 139 ± 2 0.32 24 ± 1
16–2–16.2CMP – G + P + D (10 :1) 106 ± 4 0.44 49 ± 2
G + P + D (5 :1) 127 ± 11 0.56 42 ± 2
G + P + D (2 :1) 427 ± 22 0.47 19 ± 0
16–2–16.2UMP – G + P + D (10 :1) 426 ± 24 0.21 33 ± 4
G + P + D (5 :1) 92 ± 3 0.35 33 ± 2
G + P + D (2 :1) 173 ± 7 0.47 23 ± 1
16–2–16.2GMP – G + P + D (10 :1) 810 ± 40 0.63 –33 ± 5
G + P + D (5 :1) 519 ± 28 0.44 –29 ± 3
G + P + D (2 :1) 523 ± 22 0.53 –17 ± 1
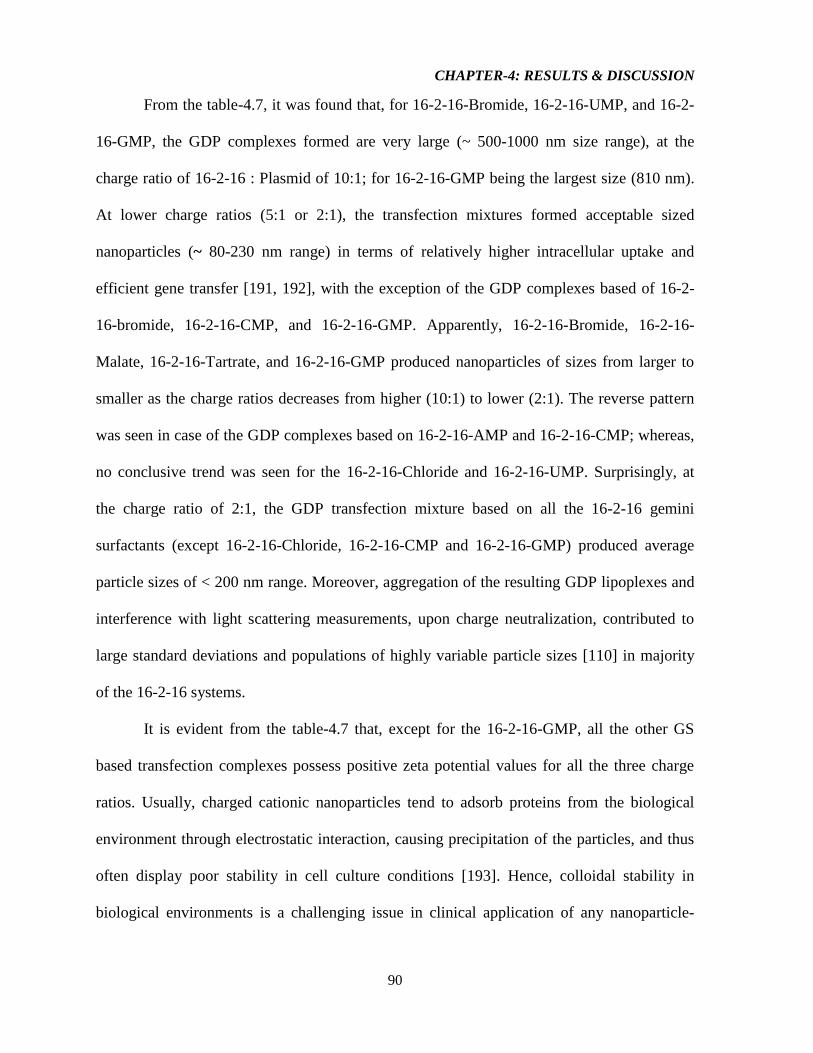
CHAPTER-4: RESULTS & DISCUSSION
90
From the table-4.7, it was found that, for 16-2-16-Bromide, 16-2-16-UMP, and 16-2-
16-GMP, the GDP complexes formed are very large (~ 500-1000 nm size range), at the
charge ratio of 16-2-16 : Plasmid of 10:1; for 16-2-16-GMP being the largest size (810 nm).
At lower charge ratios (5:1 or 2:1), the transfection mixtures formed acceptable sized
nanoparticles (~ 80-230 nm range) in terms of relatively higher intracellular uptake and
efficient gene transfer [191, 192], with the exception of the GDP complexes based of 16-2-
16-bromide, 16-2-16-CMP, and 16-2-16-GMP. Apparently, 16-2-16-Bromide, 16-2-16-
Malate, 16-2-16-Tartrate, and 16-2-16-GMP produced nanoparticles of sizes from larger to
smaller as the charge ratios decreases from higher (10:1) to lower (2:1). The reverse pattern
was seen in case of the GDP complexes based on 16-2-16-AMP and 16-2-16-CMP; whereas,
no conclusive trend was seen for the 16-2-16-Chloride and 16-2-16-UMP. Surprisingly, at
the charge ratio of 2:1, the GDP transfection mixture based on all the 16-2-16 gemini
surfactants (except 16-2-16-Chloride, 16-2-16-CMP and 16-2-16-GMP) produced average
particle sizes of < 200 nm range. Moreover, aggregation of the resulting GDP lipoplexes and
interference with light scattering measurements, upon charge neutralization, contributed to
large standard deviations and populations of highly variable particle sizes [110] in majority
of the 16-2-16 systems.
It is evident from the table-4.7 that, except for the 16-2-16-GMP, all the other GS
based transfection complexes possess positive zeta potential values for all the three charge
ratios. Usually, charged cationic nanoparticles tend to adsorb proteins from the biological
environment through electrostatic interaction, causing precipitation of the particles, and thus
often display poor stability in cell culture conditions [193]. Hence, colloidal stability in
biological environments is a challenging issue in clinical application of any nanoparticle-
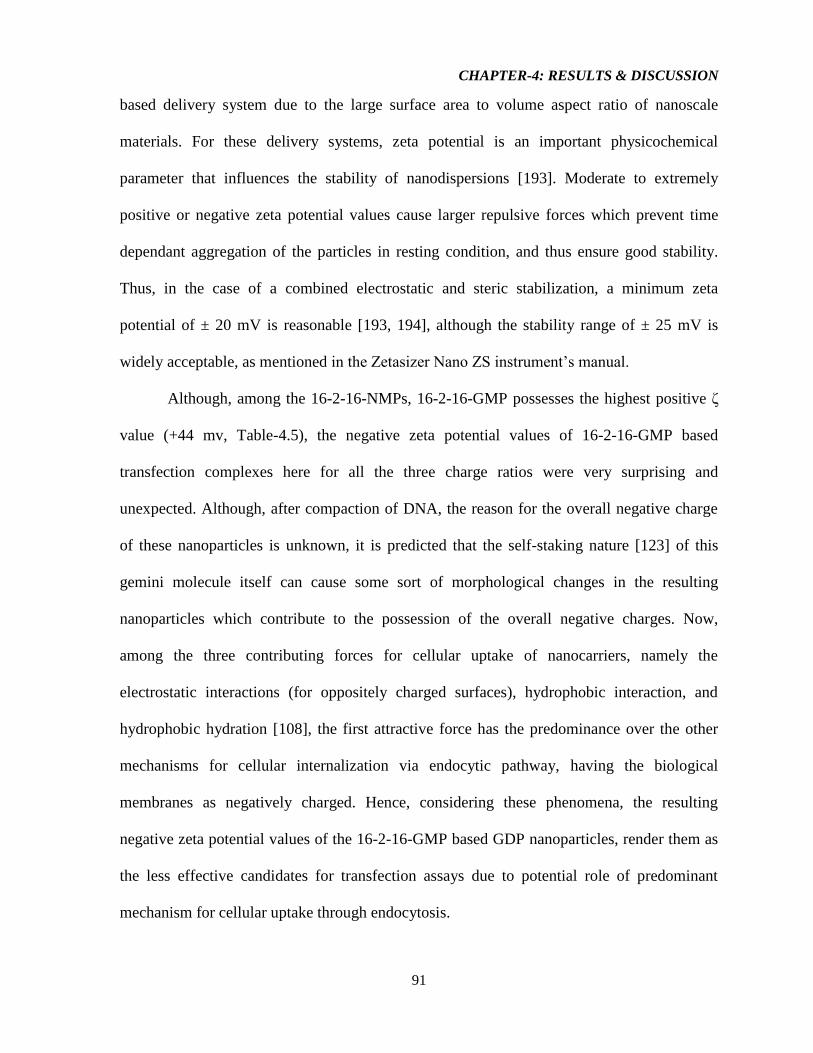
CHAPTER-4: RESULTS & DISCUSSION
91
based delivery system due to the large surface area to volume aspect ratio of nanoscale
materials. For these delivery systems, zeta potential is an important physicochemical
parameter that influences the stability of nanodispersions [193]. Moderate to extremely
positive or negative zeta potential values cause larger repulsive forces which prevent time
dependant aggregation of the particles in resting condition, and thus ensure good stability.
Thus, in the case of a combined electrostatic and steric stabilization, a minimum zeta
potential of ± 20 mV is reasonable [193, 194], although the stability range of ± 25 mV is
widely acceptable, as mentioned in the Zetasizer Nano ZS instrument’s manual.
Although, among the 16-2-16-NMPs, 16-2-16-GMP possesses the highest positive ζ
value (+44 mv, Table-4.5), the negative zeta potential values of 16-2-16-GMP based
transfection complexes here for all the three charge ratios were very surprising and
unexpected. Although, after compaction of DNA, the reason for the overall negative charge
of these nanoparticles is unknown, it is predicted that the self-staking nature [123] of this
gemini molecule itself can cause some sort of morphological changes in the resulting
nanoparticles which contribute to the possession of the overall negative charges. Now,
among the three contributing forces for cellular uptake of nanocarriers, namely the
electrostatic interactions (for oppositely charged surfaces), hydrophobic interaction, and
hydrophobic hydration [108], the first attractive force has the predominance over the other
mechanisms for cellular internalization via endocytic pathway, having the biological
membranes as negatively charged. Hence, considering these phenomena, the resulting
negative zeta potential values of the 16-2-16-GMP based GDP nanoparticles, render them as
the less effective candidates for transfection assays due to potential role of predominant
mechanism for cellular uptake through endocytosis.
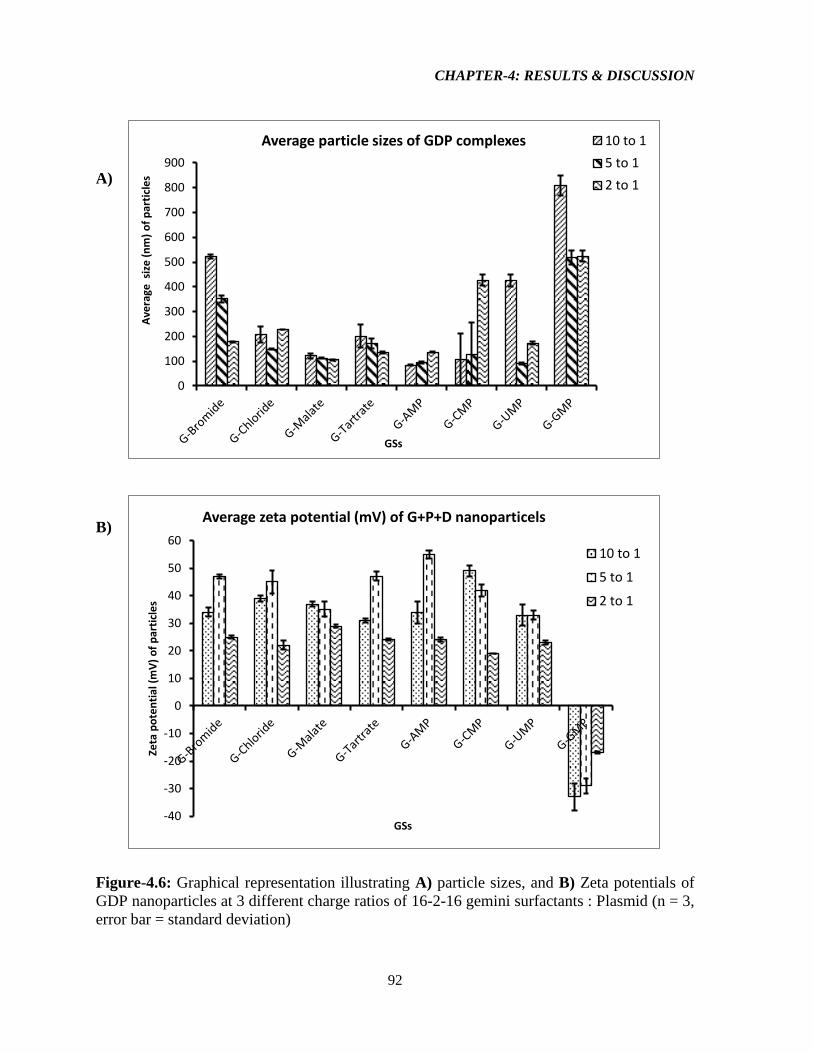
CHAPTER-4: RESULTS & DISCUSSION
92
-40
-30
-20
-10
0
10
20
30
40
50
60
Zeta
po
ten
tial
(m
V)
of
par
ticl
es
GSs
Average zeta potential (mV) of G+P+D nanoparticels
10 to 1
5 to 1
2 to 1
0
100
200
300
400
500
600
700
800
900
Ave
rage
siz
e (
nm
) o
f p
arti
cle
s
GSs
Average particle sizes of GDP complexes 10 to 1
5 to 1
2 to 1
A)
B)
Figure-4.6: Graphical representation illustrating A) particle sizes, and B) Zeta potentials of
GDP nanoparticles at 3 different charge ratios of 16-2-16 gemini surfactants : Plasmid (n = 3,
error bar = standard deviation)
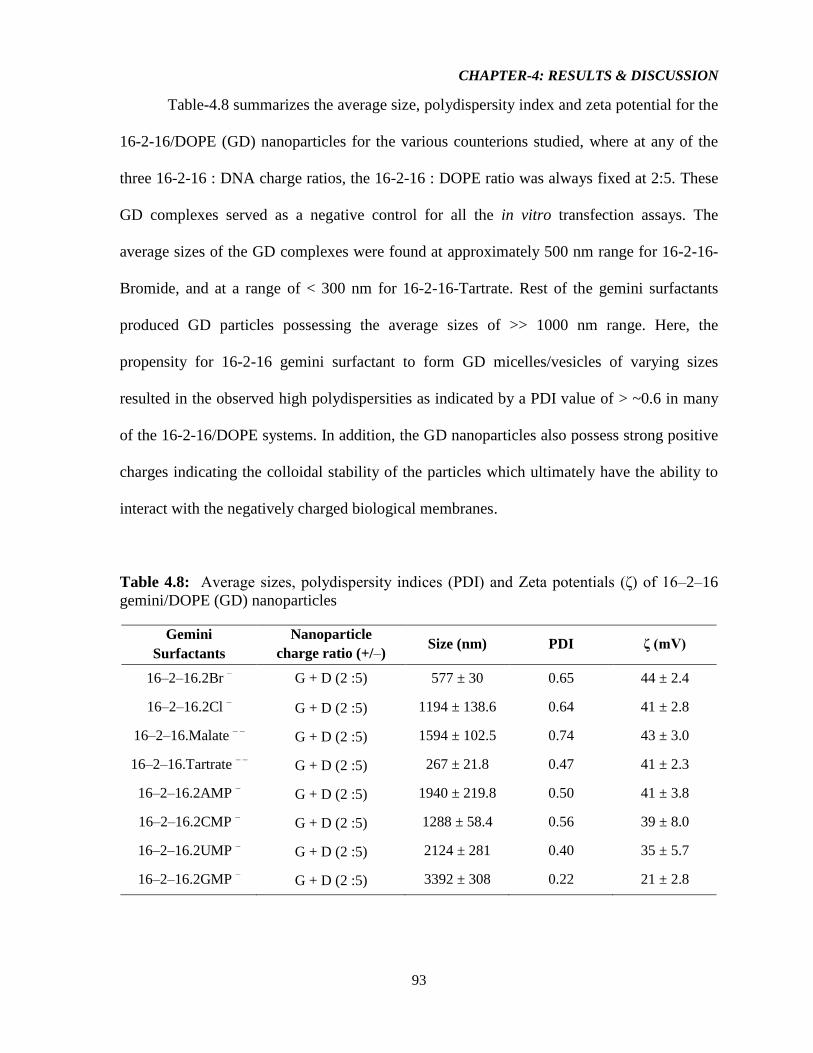
CHAPTER-4: RESULTS & DISCUSSION
93
Table-4.8 summarizes the average size, polydispersity index and zeta potential for the
16-2-16/DOPE (GD) nanoparticles for the various counterions studied, where at any of the
three 16-2-16 : DNA charge ratios, the 16-2-16 : DOPE ratio was always fixed at 2:5. These
GD complexes served as a negative control for all the in vitro transfection assays. The
average sizes of the GD complexes were found at approximately 500 nm range for 16-2-16-
Bromide, and at a range of < 300 nm for 16-2-16-Tartrate. Rest of the gemini surfactants
produced GD particles possessing the average sizes of >> 1000 nm range. Here, the
propensity for 16-2-16 gemini surfactant to form GD micelles/vesicles of varying sizes
resulted in the observed high polydispersities as indicated by a PDI value of > ~0.6 in many
of the 16-2-16/DOPE systems. In addition, the GD nanoparticles also possess strong positive
charges indicating the colloidal stability of the particles which ultimately have the ability to
interact with the negatively charged biological membranes.
Table 4.8: Average sizes, polydispersity indices (PDI) and Zeta potentials (ζ) of 16–2–16
gemini/DOPE (GD) nanoparticles
Gemini
Surfactants
Nanoparticle
charge ratio (+/–) Size (nm) PDI ζ (mV)
16–2–16.2Br – G + D (2 :5) 577 ± 30 0.65 44 ± 2.4
16–2–16.2Cl – G + D (2 :5) 1194 ± 138.6 0.64 41 ± 2.8
16–2–16.Malate – –
G + D (2 :5) 1594 ± 102.5 0.74 43 ± 3.0
16–2–16.Tartrate – –
G + D (2 :5) 267 ± 21.8 0.47 41 ± 2.3
16–2–16.2AMP – G + D (2 :5) 1940 ± 219.8 0.50 41 ± 3.8
16–2–16.2CMP – G + D (2 :5) 1288 ± 58.4 0.56 39 ± 8.0
16–2–16.2UMP – G + D (2 :5) 2124 ± 281 0.40 35 ± 5.7
16–2–16.2GMP – G + D (2 :5) 3392 ± 308 0.22 21 ± 2.8
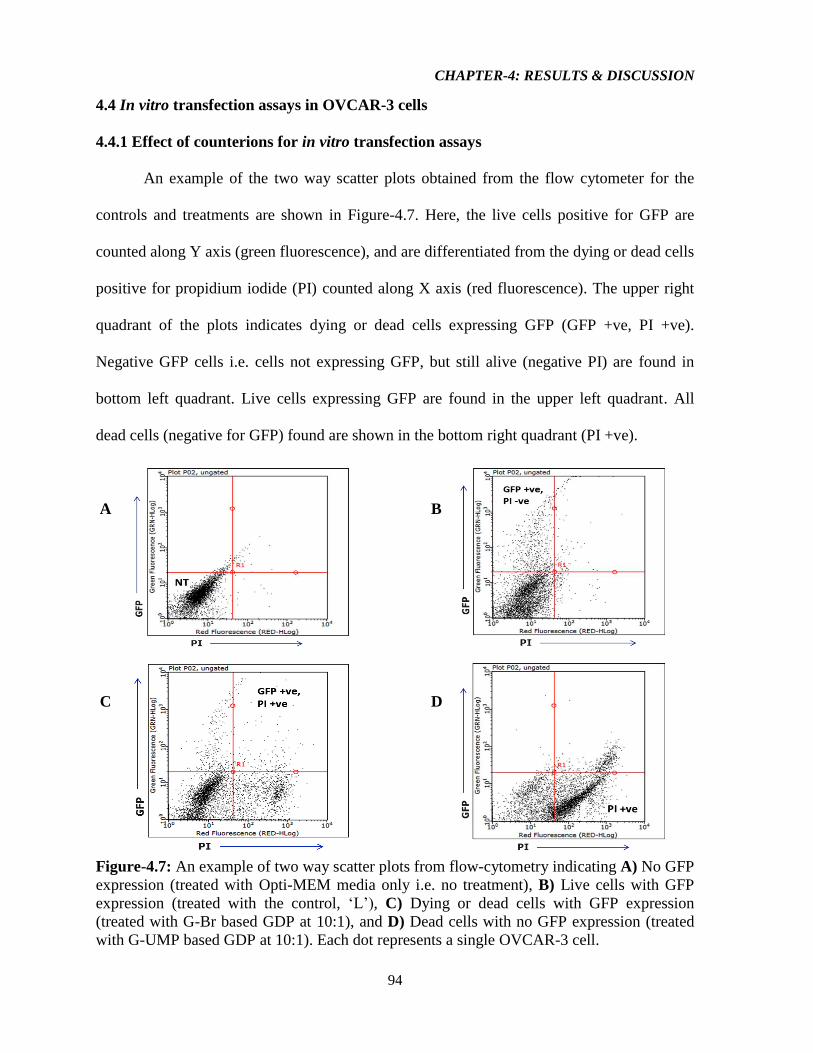
CHAPTER-4: RESULTS & DISCUSSION
94
4.4 In vitro transfection assays in OVCAR-3 cells
4.4.1 Effect of counterions for in vitro transfection assays
An example of the two way scatter plots obtained from the flow cytometer for the
controls and treatments are shown in Figure-4.7. Here, the live cells positive for GFP are
counted along Y axis (green fluorescence), and are differentiated from the dying or dead cells
positive for propidium iodide (PI) counted along X axis (red fluorescence). The upper right
quadrant of the plots indicates dying or dead cells expressing GFP (GFP +ve, PI +ve).
Negative GFP cells i.e. cells not expressing GFP, but still alive (negative PI) are found in
bottom left quadrant. Live cells expressing GFP are found in the upper left quadrant. All
dead cells (negative for GFP) found are shown in the bottom right quadrant (PI +ve).
A B
C D
Figure-4.7: An example of two way scatter plots from flow-cytometry indicating A) No GFP
expression (treated with Opti-MEM media only i.e. no treatment), B) Live cells with GFP
expression (treated with the control, ‘L’), C) Dying or dead cells with GFP expression
(treated with G-Br based GDP at 10:1), and D) Dead cells with no GFP expression (treated
with G-UMP based GDP at 10:1). Each dot represents a single OVCAR-3 cell.
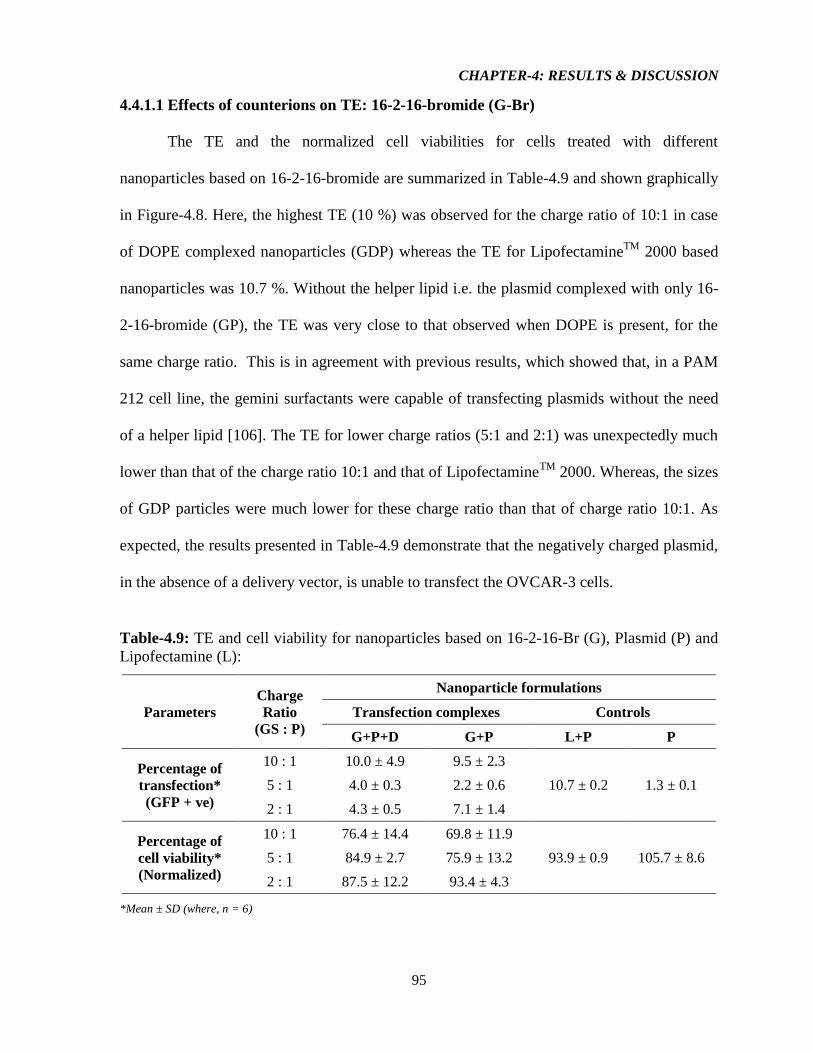
CHAPTER-4: RESULTS & DISCUSSION
95
4.4.1.1 Effects of counterions on TE: 16-2-16-bromide (G-Br)
The TE and the normalized cell viabilities for cells treated with different
nanoparticles based on 16-2-16-bromide are summarized in Table-4.9 and shown graphically
in Figure-4.8. Here, the highest TE (10 %) was observed for the charge ratio of 10:1 in case
of DOPE complexed nanoparticles (GDP) whereas the TE for LipofectamineTM
2000 based
nanoparticles was 10.7 %. Without the helper lipid i.e. the plasmid complexed with only 16-
2-16-bromide (GP), the TE was very close to that observed when DOPE is present, for the
same charge ratio. This is in agreement with previous results, which showed that, in a PAM
212 cell line, the gemini surfactants were capable of transfecting plasmids without the need
of a helper lipid [106]. The TE for lower charge ratios (5:1 and 2:1) was unexpectedly much
lower than that of the charge ratio 10:1 and that of LipofectamineTM
2000. Whereas, the sizes
of GDP particles were much lower for these charge ratio than that of charge ratio 10:1. As
expected, the results presented in Table-4.9 demonstrate that the negatively charged plasmid,
in the absence of a delivery vector, is unable to transfect the OVCAR-3 cells.
Table-4.9: TE and cell viability for nanoparticles based on 16-2-16-Br (G), Plasmid (P) and
Lipofectamine (L):
Parameters
Charge
Ratio
(GS : P)
Nanoparticle formulations
Transfection complexes Controls
G+P+D G+P L+P P
Percentage of
transfection*
(GFP + ve)
10 : 1 10.0 ± 4.9 9.5 ± 2.3
10.7 ± 0.2 1.3 ± 0.1 5 : 1 4.0 ± 0.3 2.2 ± 0.6
2 : 1 4.3 ± 0.5 7.1 ± 1.4
Percentage of
cell viability*
(Normalized)
10 : 1 76.4 ± 14.4 69.8 ± 11.9
93.9 ± 0.9 105.7 ± 8.6 5 : 1 84.9 ± 2.7 75.9 ± 13.2
2 : 1 87.5 ± 12.2 93.4 ± 4.3
*Mean ± SD (where, n = 6)
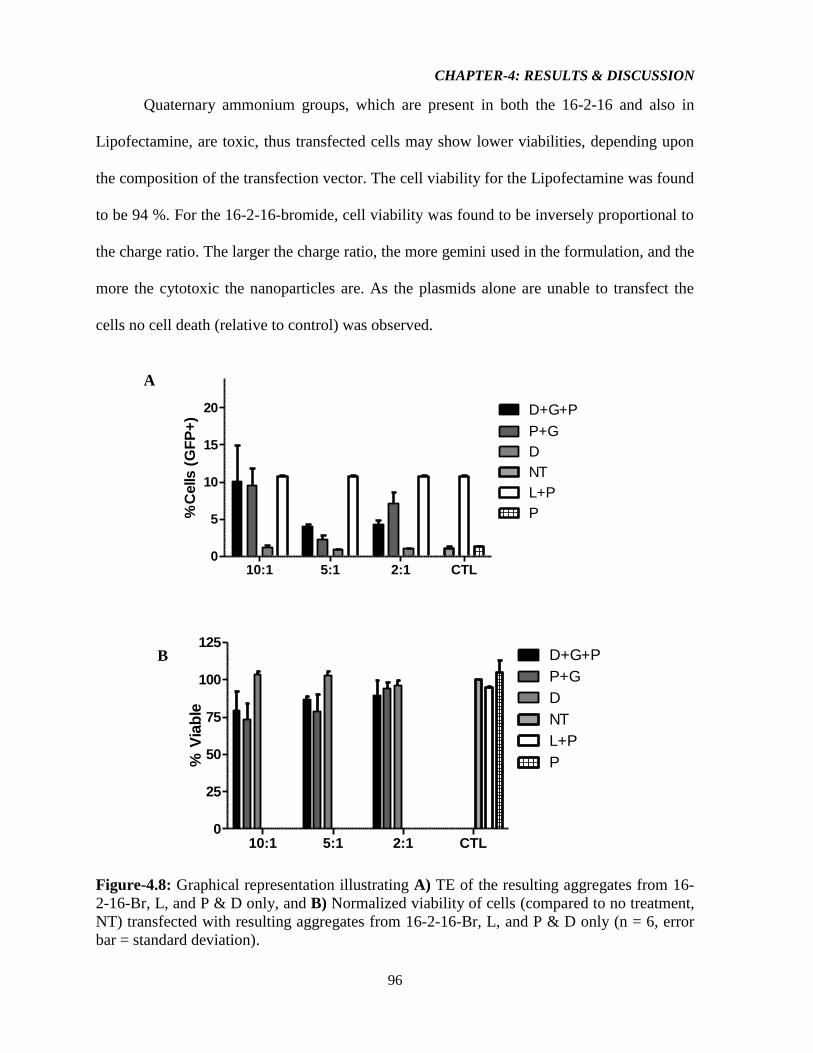
CHAPTER-4: RESULTS & DISCUSSION
96
10:1 5:1 2:1 CTL0
5
10
15
20 D+G+P
P+G
D
NT
L+P
P%C
ells (
GF
P+
)
10:1 5:1 2:1 CTL0
25
50
75
100
125D+G+P
P+G
D
NT
L+P
P% V
iab
le
Quaternary ammonium groups, which are present in both the 16-2-16 and also in
Lipofectamine, are toxic, thus transfected cells may show lower viabilities, depending upon
the composition of the transfection vector. The cell viability for the Lipofectamine was found
to be 94 %. For the 16-2-16-bromide, cell viability was found to be inversely proportional to
the charge ratio. The larger the charge ratio, the more gemini used in the formulation, and the
more the cytotoxic the nanoparticles are. As the plasmids alone are unable to transfect the
cells no cell death (relative to control) was observed.
A
B
Figure-4.8: Graphical representation illustrating A) TE of the resulting aggregates from 16-
2-16-Br, L, and P & D only, and B) Normalized viability of cells (compared to no treatment,
NT) transfected with resulting aggregates from 16-2-16-Br, L, and P & D only (n = 6, error
bar = standard deviation).

CHAPTER-4: RESULTS & DISCUSSION
97
4.4.1.2 Effects of counterions on TE: 16-2-16-chloride (G-Cl)
The TE and the normalized cell viabilities due to treatment with nanoparticles
based on 16-2-16-chloride are summarized in Table-4.10 and shown graphically in Figure-
4.9. The nanoparticles produced by this 16-2-16-Cl in the presence of DOPE helper lipids
(GDP) for the three charge ratios were all within 230 nm range, but the TE was unexpectedly
much lower than for the LipofectamineTM
2000 formulation (12.4 %). The lowest TE found
for the complete 16-2-16-Cl/DOPE/Plasmid (GDP) complex was in case of charge ratio 10:1
where only 1.7 % TE was observed. As the charge ratios were decreased, increased TE was
seen for the GDP complexes but none at a level comparable to the TE for Lipofectamine
treated cells. As for 16-2-16-Cl, nanoparticles formed without the DOPE (GP), exhibited
transfection, but at substantially lower levels than for the complete GDP nanoparticles.
Table-4.10: TE and cell viability by nanoparticles based on 16-2-16-Cl (G), Plasmid (P) and
Lipofectamine (L):
Parameters
Charge
Ratio
(GS : P)
Nanoparticle formulations
Transfection complexes Controls
G+P+D G+P L+P P
Percentage of
transfection*
(GFP + ve)
10 : 1 1.7 ± 0.7 1.9 ± 0.4
12.4 ± 3.8 1.1 ± 0.2 5 : 1 3.7 ± 0.3 2.7 ± 0.0
2 : 1 8.1 ± 1.3 6.2 ± 1.8
Percentage of
cell viability*
(Normalized)
10 : 1 69.9 ± 0.3 60.1 ± 10.9
89.2 ± 2.4 99.7 ± 0.5 5 : 1 90.1 ± 0.6 90.2 ± 2.1
2 : 1 94.8 ± 3.5 96.3 ± 2.9
*Mean ± SD (where, n = 6)
The cell viabilities for OVCAR-3 cells treated with 16-2-16-Cl formulations
were comparable to those observed for Lipofectamine, for charge ratios 5:1 and 2:1. For the
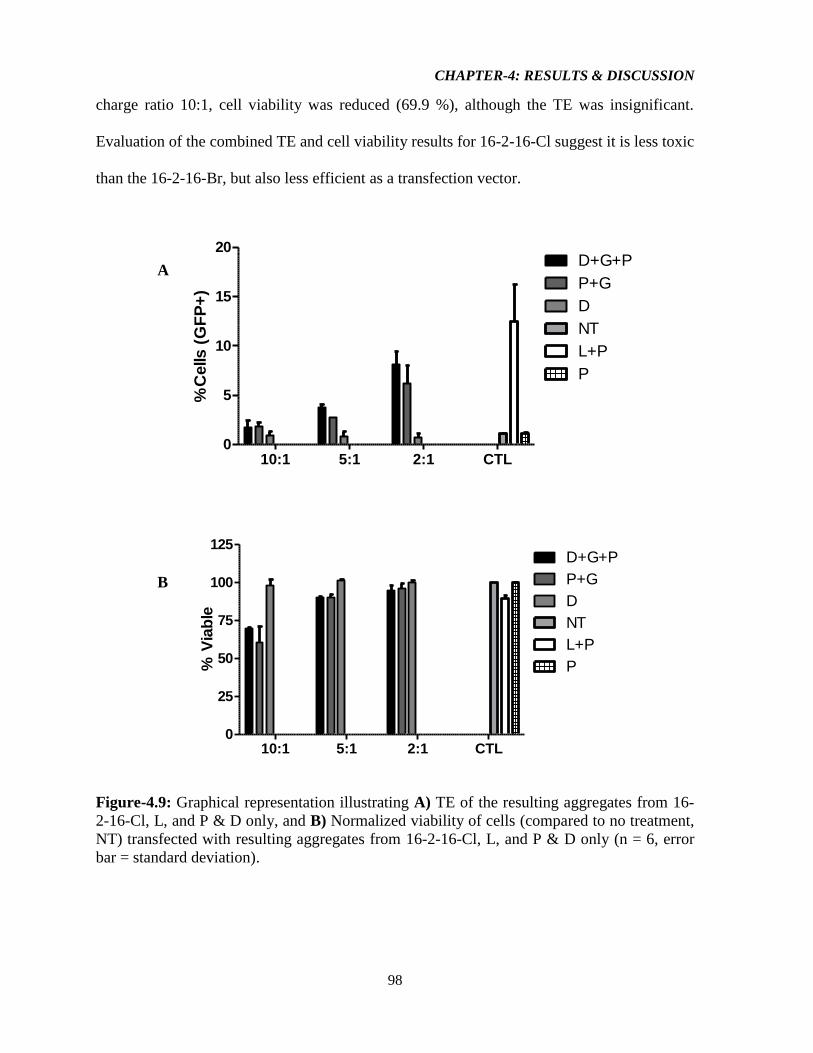
CHAPTER-4: RESULTS & DISCUSSION
98
10:1 5:1 2:1 CTL0
5
10
15
20D+G+P
P+G
D
NT
L+P
P
%C
ells (
GF
P+
)
10:1 5:1 2:1 CTL0
25
50
75
100
125D+G+P
P+G
D
NT
L+P
P% V
iab
le
charge ratio 10:1, cell viability was reduced (69.9 %), although the TE was insignificant.
Evaluation of the combined TE and cell viability results for 16-2-16-Cl suggest it is less toxic
than the 16-2-16-Br, but also less efficient as a transfection vector.
A
B
Figure-4.9: Graphical representation illustrating A) TE of the resulting aggregates from 16-
2-16-Cl, L, and P & D only, and B) Normalized viability of cells (compared to no treatment,
NT) transfected with resulting aggregates from 16-2-16-Cl, L, and P & D only (n = 6, error
bar = standard deviation).
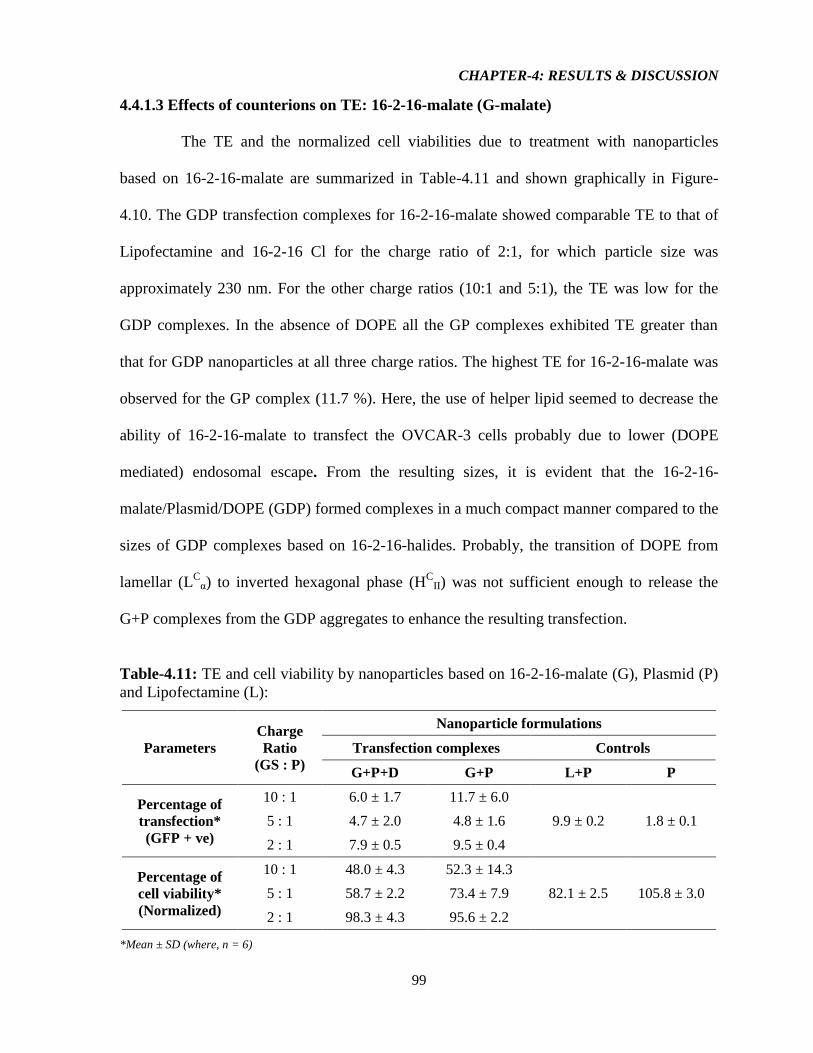
CHAPTER-4: RESULTS & DISCUSSION
99
4.4.1.3 Effects of counterions on TE: 16-2-16-malate (G-malate)
The TE and the normalized cell viabilities due to treatment with nanoparticles
based on 16-2-16-malate are summarized in Table-4.11 and shown graphically in Figure-
4.10. The GDP transfection complexes for 16-2-16-malate showed comparable TE to that of
Lipofectamine and 16-2-16 Cl for the charge ratio of 2:1, for which particle size was
approximately 230 nm. For the other charge ratios (10:1 and 5:1), the TE was low for the
GDP complexes. In the absence of DOPE all the GP complexes exhibited TE greater than
that for GDP nanoparticles at all three charge ratios. The highest TE for 16-2-16-malate was
observed for the GP complex (11.7 %). Here, the use of helper lipid seemed to decrease the
ability of 16-2-16-malate to transfect the OVCAR-3 cells probably due to lower (DOPE
mediated) endosomal escape. From the resulting sizes, it is evident that the 16-2-16-
malate/Plasmid/DOPE (GDP) formed complexes in a much compact manner compared to the
sizes of GDP complexes based on 16-2-16-halides. Probably, the transition of DOPE from
lamellar (LC
α) to inverted hexagonal phase (HC
II) was not sufficient enough to release the
G+P complexes from the GDP aggregates to enhance the resulting transfection.
Table-4.11: TE and cell viability by nanoparticles based on 16-2-16-malate (G), Plasmid (P)
and Lipofectamine (L):
Parameters
Charge
Ratio
(GS : P)
Nanoparticle formulations
Transfection complexes Controls
G+P+D G+P L+P P
Percentage of
transfection*
(GFP + ve)
10 : 1 6.0 ± 1.7 11.7 ± 6.0
9.9 ± 0.2 1.8 ± 0.1 5 : 1 4.7 ± 2.0 4.8 ± 1.6
2 : 1 7.9 ± 0.5 9.5 ± 0.4
Percentage of
cell viability*
(Normalized)
10 : 1 48.0 ± 4.3 52.3 ± 14.3
82.1 ± 2.5 105.8 ± 3.0 5 : 1 58.7 ± 2.2 73.4 ± 7.9
2 : 1 98.3 ± 4.3 95.6 ± 2.2
*Mean ± SD (where, n = 6)
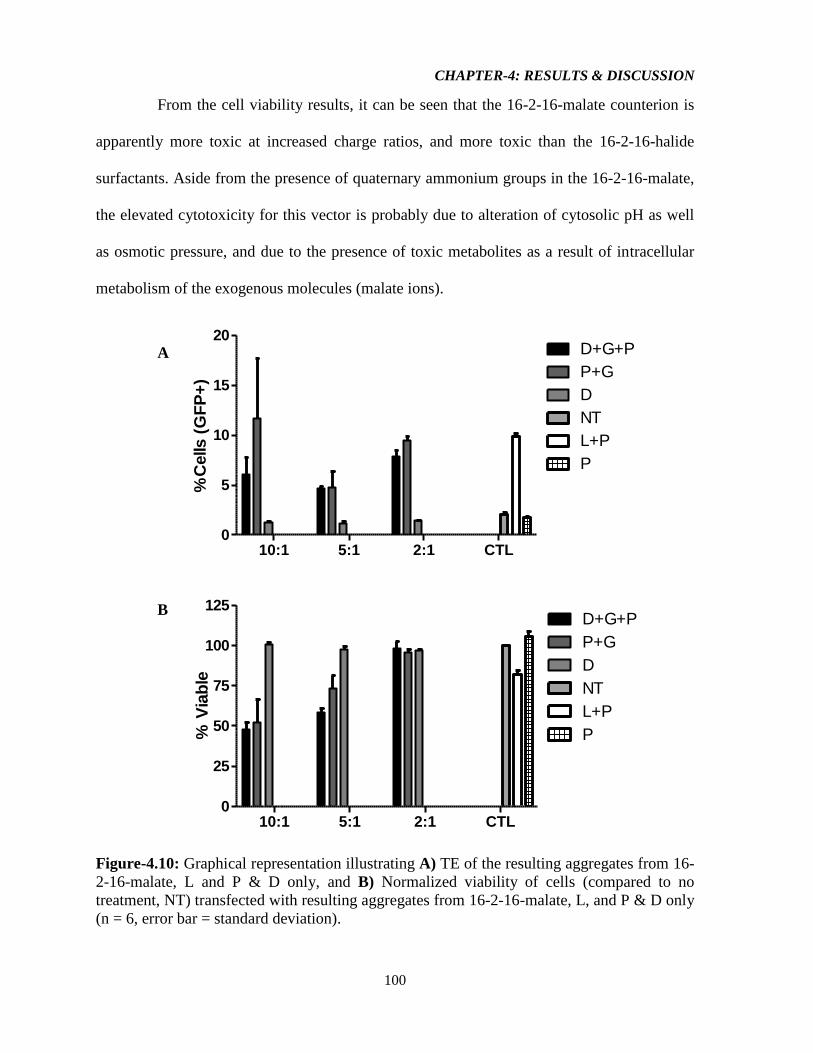
CHAPTER-4: RESULTS & DISCUSSION
100
10:1 5:1 2:1 CTL0
5
10
15
20D+G+P
P+G
D
NT
L+P
P
%C
ells (
GF
P+
)
10:1 5:1 2:1 CTL0
25
50
75
100
125D+G+P
P+G
D
NT
L+P
P% V
iab
le
From the cell viability results, it can be seen that the 16-2-16-malate counterion is
apparently more toxic at increased charge ratios, and more toxic than the 16-2-16-halide
surfactants. Aside from the presence of quaternary ammonium groups in the 16-2-16-malate,
the elevated cytotoxicity for this vector is probably due to alteration of cytosolic pH as well
as osmotic pressure, and due to the presence of toxic metabolites as a result of intracellular
metabolism of the exogenous molecules (malate ions).
A
B
Figure-4.10: Graphical representation illustrating A) TE of the resulting aggregates from 16-
2-16-malate, L and P & D only, and B) Normalized viability of cells (compared to no
treatment, NT) transfected with resulting aggregates from 16-2-16-malate, L, and P & D only
(n = 6, error bar = standard deviation).
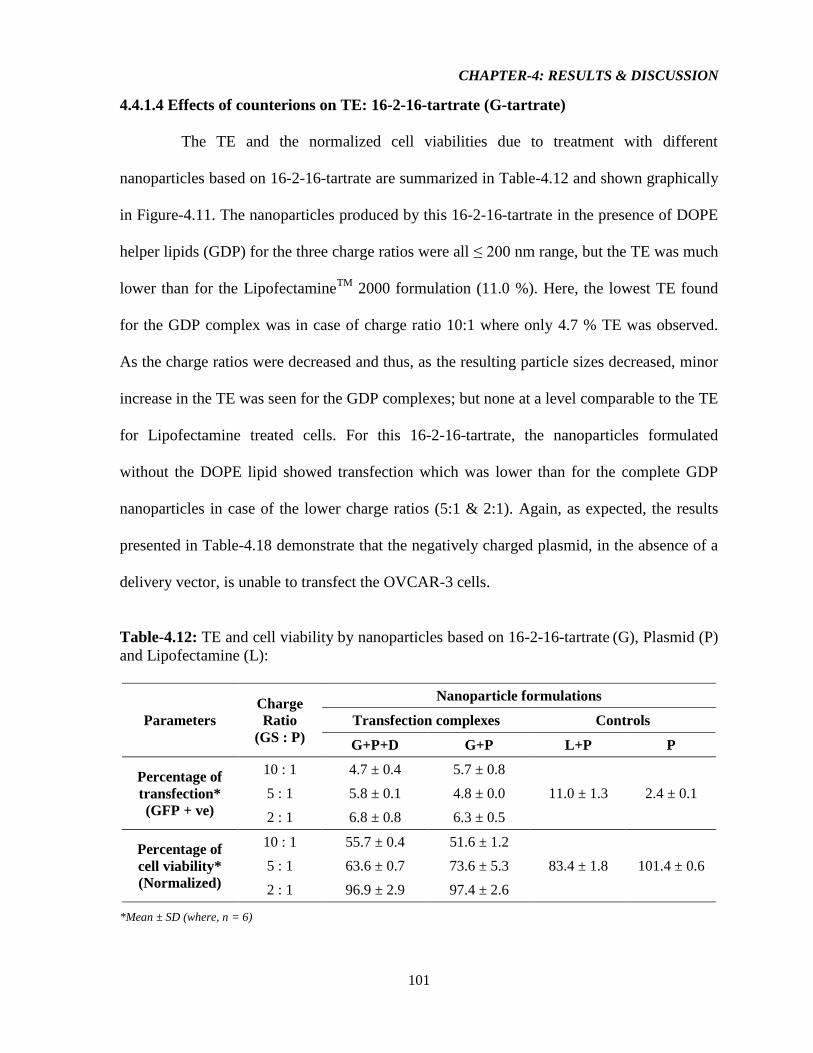
CHAPTER-4: RESULTS & DISCUSSION
101
4.4.1.4 Effects of counterions on TE: 16-2-16-tartrate (G-tartrate)
The TE and the normalized cell viabilities due to treatment with different
nanoparticles based on 16-2-16-tartrate are summarized in Table-4.12 and shown graphically
in Figure-4.11. The nanoparticles produced by this 16-2-16-tartrate in the presence of DOPE
helper lipids (GDP) for the three charge ratios were all ≤ 200 nm range, but the TE was much
lower than for the LipofectamineTM
2000 formulation (11.0 %). Here, the lowest TE found
for the GDP complex was in case of charge ratio 10:1 where only 4.7 % TE was observed.
As the charge ratios were decreased and thus, as the resulting particle sizes decreased, minor
increase in the TE was seen for the GDP complexes; but none at a level comparable to the TE
for Lipofectamine treated cells. For this 16-2-16-tartrate, the nanoparticles formulated
without the DOPE lipid showed transfection which was lower than for the complete GDP
nanoparticles in case of the lower charge ratios (5:1 & 2:1). Again, as expected, the results
presented in Table-4.18 demonstrate that the negatively charged plasmid, in the absence of a
delivery vector, is unable to transfect the OVCAR-3 cells.
Table-4.12: TE and cell viability by nanoparticles based on 16-2-16-tartrate (G), Plasmid (P)
and Lipofectamine (L):
Parameters
Charge
Ratio
(GS : P)
Nanoparticle formulations
Transfection complexes Controls
G+P+D G+P L+P P
Percentage of
transfection*
(GFP + ve)
10 : 1 4.7 ± 0.4 5.7 ± 0.8
11.0 ± 1.3 2.4 ± 0.1 5 : 1 5.8 ± 0.1 4.8 ± 0.0
2 : 1 6.8 ± 0.8 6.3 ± 0.5
Percentage of
cell viability*
(Normalized)
10 : 1 55.7 ± 0.4 51.6 ± 1.2
83.4 ± 1.8 101.4 ± 0.6 5 : 1 63.6 ± 0.7 73.6 ± 5.3
2 : 1 96.9 ± 2.9 97.4 ± 2.6
*Mean ± SD (where, n = 6)
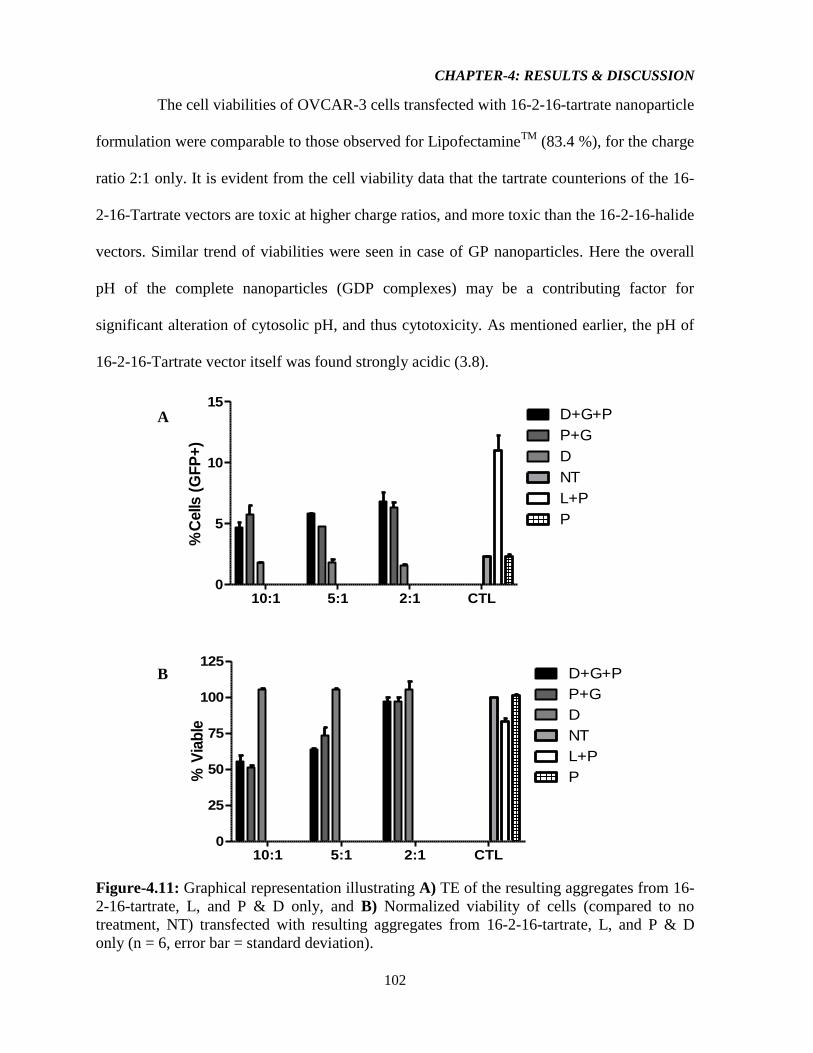
CHAPTER-4: RESULTS & DISCUSSION
102
10:1 5:1 2:1 CTL0
5
10
15D+G+P
P+G
D
NT
L+P
P
%C
ells
(G
FP
+)
10:1 5:1 2:1 CTL0
25
50
75
100
125D+G+P
P+G
D
NT
L+P
P% V
iab
le
The cell viabilities of OVCAR-3 cells transfected with 16-2-16-tartrate nanoparticle
formulation were comparable to those observed for LipofectamineTM
(83.4 %), for the charge
ratio 2:1 only. It is evident from the cell viability data that the tartrate counterions of the 16-
2-16-Tartrate vectors are toxic at higher charge ratios, and more toxic than the 16-2-16-halide
vectors. Similar trend of viabilities were seen in case of GP nanoparticles. Here the overall
pH of the complete nanoparticles (GDP complexes) may be a contributing factor for
significant alteration of cytosolic pH, and thus cytotoxicity. As mentioned earlier, the pH of
16-2-16-Tartrate vector itself was found strongly acidic (3.8).
A
B
Figure-4.11: Graphical representation illustrating A) TE of the resulting aggregates from 16-
2-16-tartrate, L, and P & D only, and B) Normalized viability of cells (compared to no
treatment, NT) transfected with resulting aggregates from 16-2-16-tartrate, L, and P & D
only (n = 6, error bar = standard deviation).
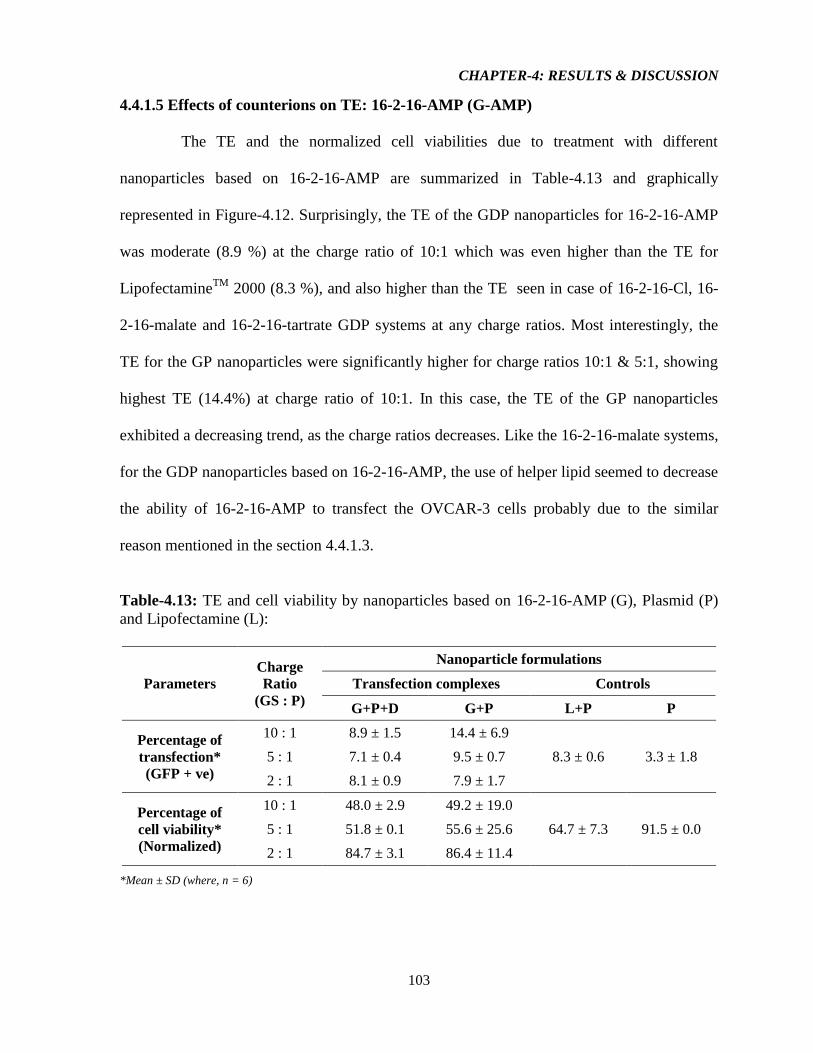
CHAPTER-4: RESULTS & DISCUSSION
103
4.4.1.5 Effects of counterions on TE: 16-2-16-AMP (G-AMP)
The TE and the normalized cell viabilities due to treatment with different
nanoparticles based on 16-2-16-AMP are summarized in Table-4.13 and graphically
represented in Figure-4.12. Surprisingly, the TE of the GDP nanoparticles for 16-2-16-AMP
was moderate (8.9 %) at the charge ratio of 10:1 which was even higher than the TE for
LipofectamineTM
2000 (8.3 %), and also higher than the TE seen in case of 16-2-16-Cl, 16-
2-16-malate and 16-2-16-tartrate GDP systems at any charge ratios. Most interestingly, the
TE for the GP nanoparticles were significantly higher for charge ratios 10:1 & 5:1, showing
highest TE (14.4%) at charge ratio of 10:1. In this case, the TE of the GP nanoparticles
exhibited a decreasing trend, as the charge ratios decreases. Like the 16-2-16-malate systems,
for the GDP nanoparticles based on 16-2-16-AMP, the use of helper lipid seemed to decrease
the ability of 16-2-16-AMP to transfect the OVCAR-3 cells probably due to the similar
reason mentioned in the section 4.4.1.3.
Table-4.13: TE and cell viability by nanoparticles based on 16-2-16-AMP (G), Plasmid (P)
and Lipofectamine (L):
Parameters
Charge
Ratio
(GS : P)
Nanoparticle formulations
Transfection complexes Controls
G+P+D G+P L+P P
Percentage of
transfection*
(GFP + ve)
10 : 1 8.9 ± 1.5 14.4 ± 6.9
8.3 ± 0.6 3.3 ± 1.8 5 : 1 7.1 ± 0.4 9.5 ± 0.7
2 : 1 8.1 ± 0.9 7.9 ± 1.7
Percentage of
cell viability*
(Normalized)
10 : 1 48.0 ± 2.9 49.2 ± 19.0
64.7 ± 7.3 91.5 ± 0.0 5 : 1 51.8 ± 0.1 55.6 ± 25.6
2 : 1 84.7 ± 3.1 86.4 ± 11.4
*Mean ± SD (where, n = 6)
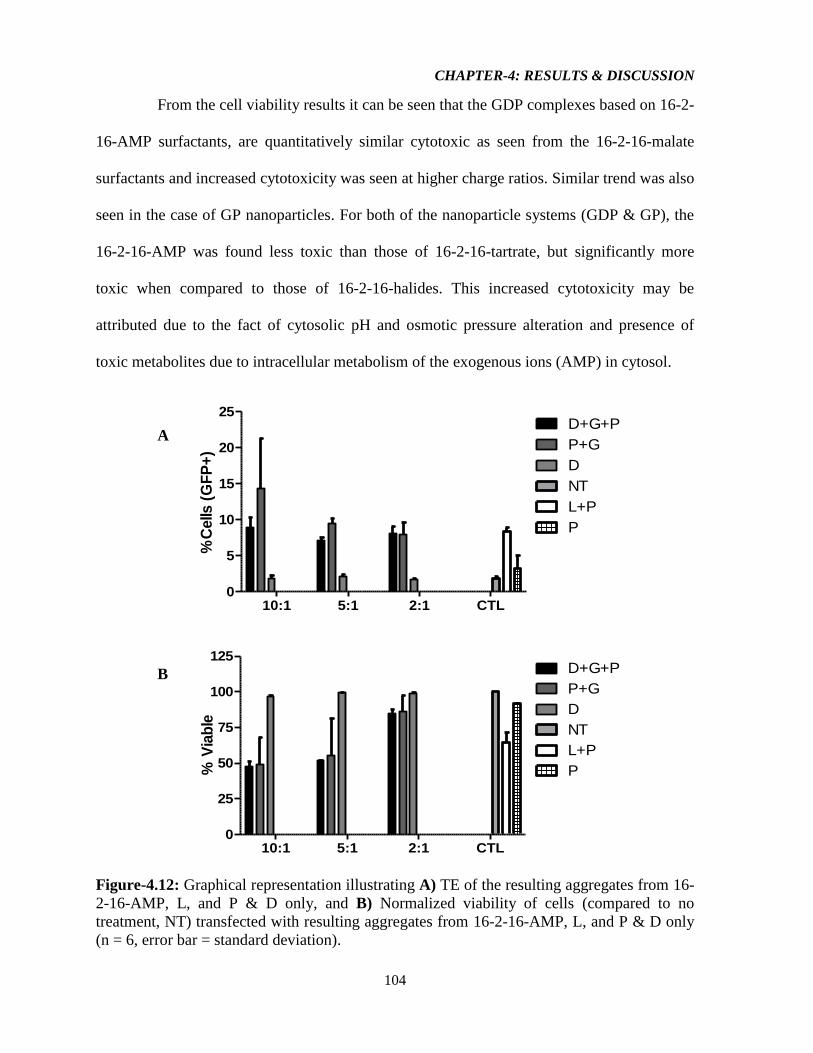
CHAPTER-4: RESULTS & DISCUSSION
104
10:1 5:1 2:1 CTL0
5
10
15
20
25D+G+P
P+G
D
NT
L+P
P
%C
ells
(G
FP
+)
10:1 5:1 2:1 CTL0
25
50
75
100
125D+G+P
P+G
D
NT
L+P
P% V
iab
le
From the cell viability results it can be seen that the GDP complexes based on 16-2-
16-AMP surfactants, are quantitatively similar cytotoxic as seen from the 16-2-16-malate
surfactants and increased cytotoxicity was seen at higher charge ratios. Similar trend was also
seen in the case of GP nanoparticles. For both of the nanoparticle systems (GDP & GP), the
16-2-16-AMP was found less toxic than those of 16-2-16-tartrate, but significantly more
toxic when compared to those of 16-2-16-halides. This increased cytotoxicity may be
attributed due to the fact of cytosolic pH and osmotic pressure alteration and presence of
toxic metabolites due to intracellular metabolism of the exogenous ions (AMP) in cytosol.
A
B
Figure-4.12: Graphical representation illustrating A) TE of the resulting aggregates from 16-
2-16-AMP, L, and P & D only, and B) Normalized viability of cells (compared to no
treatment, NT) transfected with resulting aggregates from 16-2-16-AMP, L, and P & D only
(n = 6, error bar = standard deviation).
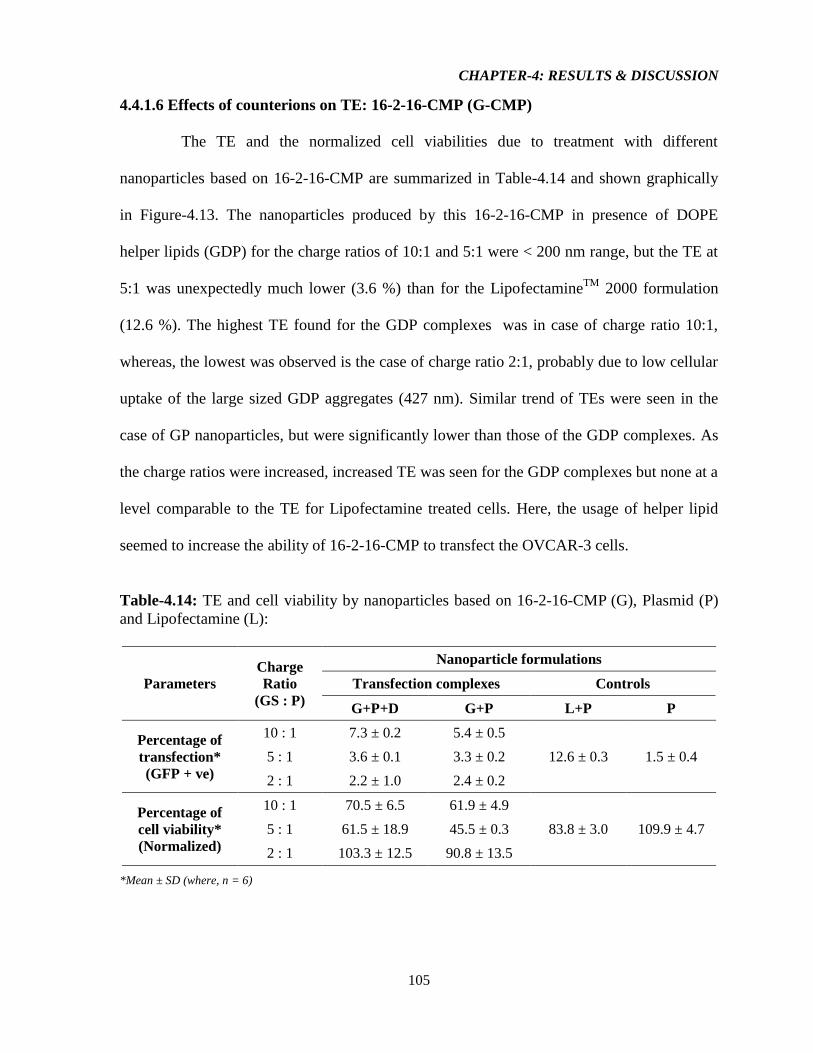
CHAPTER-4: RESULTS & DISCUSSION
105
4.4.1.6 Effects of counterions on TE: 16-2-16-CMP (G-CMP)
The TE and the normalized cell viabilities due to treatment with different
nanoparticles based on 16-2-16-CMP are summarized in Table-4.14 and shown graphically
in Figure-4.13. The nanoparticles produced by this 16-2-16-CMP in presence of DOPE
helper lipids (GDP) for the charge ratios of 10:1 and 5:1 were < 200 nm range, but the TE at
5:1 was unexpectedly much lower (3.6 %) than for the LipofectamineTM
2000 formulation
(12.6 %). The highest TE found for the GDP complexes was in case of charge ratio 10:1,
whereas, the lowest was observed is the case of charge ratio 2:1, probably due to low cellular
uptake of the large sized GDP aggregates (427 nm). Similar trend of TEs were seen in the
case of GP nanoparticles, but were significantly lower than those of the GDP complexes. As
the charge ratios were increased, increased TE was seen for the GDP complexes but none at a
level comparable to the TE for Lipofectamine treated cells. Here, the usage of helper lipid
seemed to increase the ability of 16-2-16-CMP to transfect the OVCAR-3 cells.
Table-4.14: TE and cell viability by nanoparticles based on 16-2-16-CMP (G), Plasmid (P)
and Lipofectamine (L):
Parameters
Charge
Ratio
(GS : P)
Nanoparticle formulations
Transfection complexes Controls
G+P+D G+P L+P P
Percentage of
transfection*
(GFP + ve)
10 : 1 7.3 ± 0.2 5.4 ± 0.5
12.6 ± 0.3 1.5 ± 0.4 5 : 1 3.6 ± 0.1 3.3 ± 0.2
2 : 1 2.2 ± 1.0 2.4 ± 0.2
Percentage of
cell viability*
(Normalized)
10 : 1 70.5 ± 6.5 61.9 ± 4.9
83.8 ± 3.0 109.9 ± 4.7 5 : 1 61.5 ± 18.9 45.5 ± 0.3
2 : 1 103.3 ± 12.5 90.8 ± 13.5
*Mean ± SD (where, n = 6)
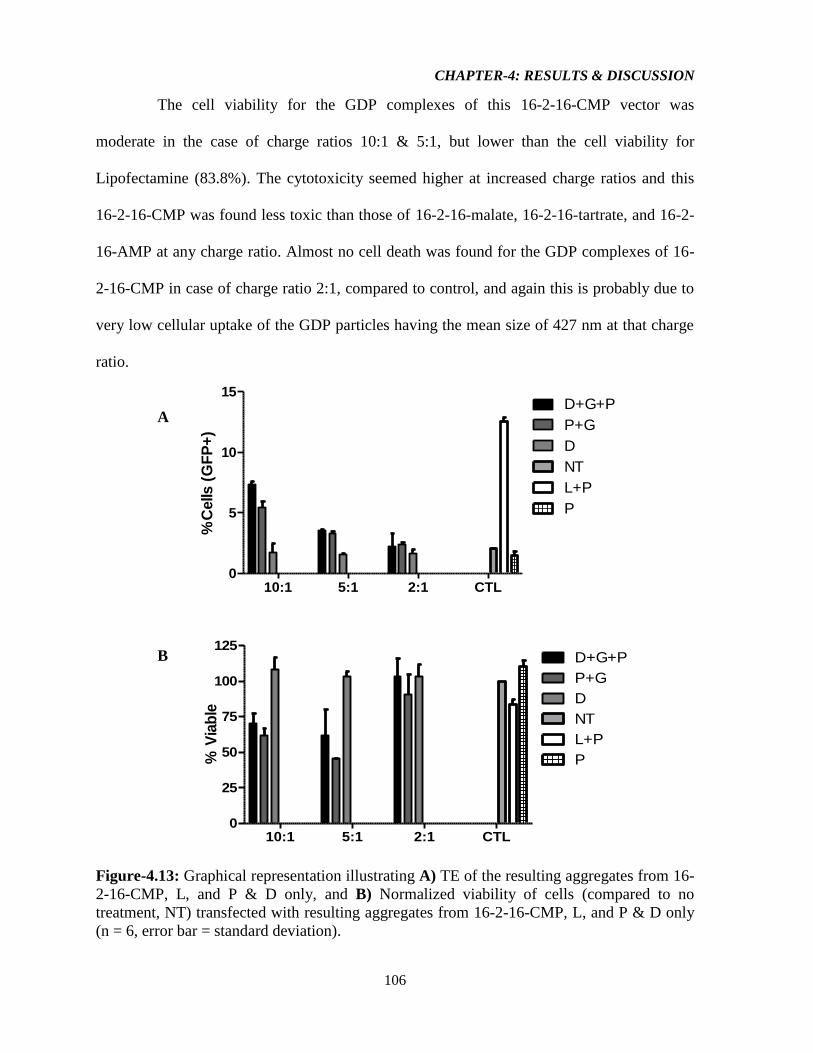
CHAPTER-4: RESULTS & DISCUSSION
106
10:1 5:1 2:1 CTL0
5
10
15D+G+P
P+G
D
NT
L+P
P
%C
ells
(G
FP
+)
10:1 5:1 2:1 CTL0
25
50
75
100
125D+G+P
P+G
D
NT
L+P
P% V
iab
le
The cell viability for the GDP complexes of this 16-2-16-CMP vector was
moderate in the case of charge ratios 10:1 & 5:1, but lower than the cell viability for
Lipofectamine (83.8%). The cytotoxicity seemed higher at increased charge ratios and this
16-2-16-CMP was found less toxic than those of 16-2-16-malate, 16-2-16-tartrate, and 16-2-
16-AMP at any charge ratio. Almost no cell death was found for the GDP complexes of 16-
2-16-CMP in case of charge ratio 2:1, compared to control, and again this is probably due to
very low cellular uptake of the GDP particles having the mean size of 427 nm at that charge
ratio.
A
B
Figure-4.13: Graphical representation illustrating A) TE of the resulting aggregates from 16-
2-16-CMP, L, and P & D only, and B) Normalized viability of cells (compared to no
treatment, NT) transfected with resulting aggregates from 16-2-16-CMP, L, and P & D only
(n = 6, error bar = standard deviation).
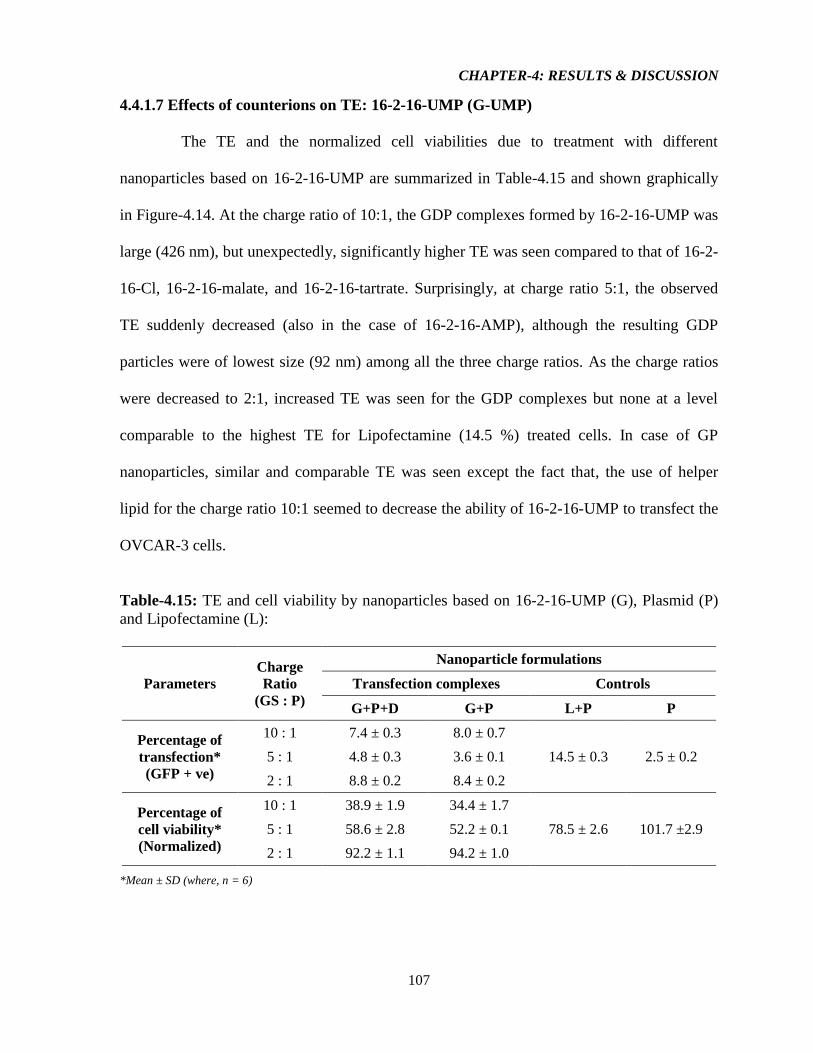
CHAPTER-4: RESULTS & DISCUSSION
107
4.4.1.7 Effects of counterions on TE: 16-2-16-UMP (G-UMP)
The TE and the normalized cell viabilities due to treatment with different
nanoparticles based on 16-2-16-UMP are summarized in Table-4.15 and shown graphically
in Figure-4.14. At the charge ratio of 10:1, the GDP complexes formed by 16-2-16-UMP was
large (426 nm), but unexpectedly, significantly higher TE was seen compared to that of 16-2-
16-Cl, 16-2-16-malate, and 16-2-16-tartrate. Surprisingly, at charge ratio 5:1, the observed
TE suddenly decreased (also in the case of 16-2-16-AMP), although the resulting GDP
particles were of lowest size (92 nm) among all the three charge ratios. As the charge ratios
were decreased to 2:1, increased TE was seen for the GDP complexes but none at a level
comparable to the highest TE for Lipofectamine (14.5 %) treated cells. In case of GP
nanoparticles, similar and comparable TE was seen except the fact that, the use of helper
lipid for the charge ratio 10:1 seemed to decrease the ability of 16-2-16-UMP to transfect the
OVCAR-3 cells.
Table-4.15: TE and cell viability by nanoparticles based on 16-2-16-UMP (G), Plasmid (P)
and Lipofectamine (L):
Parameters
Charge
Ratio
(GS : P)
Nanoparticle formulations
Transfection complexes Controls
G+P+D G+P L+P P
Percentage of
transfection*
(GFP + ve)
10 : 1 7.4 ± 0.3 8.0 ± 0.7
14.5 ± 0.3 2.5 ± 0.2 5 : 1 4.8 ± 0.3 3.6 ± 0.1
2 : 1 8.8 ± 0.2 8.4 ± 0.2
Percentage of
cell viability*
(Normalized)
10 : 1 38.9 ± 1.9 34.4 ± 1.7
78.5 ± 2.6 101.7 ±2.9 5 : 1 58.6 ± 2.8 52.2 ± 0.1
2 : 1 92.2 ± 1.1 94.2 ± 1.0
*Mean ± SD (where, n = 6)
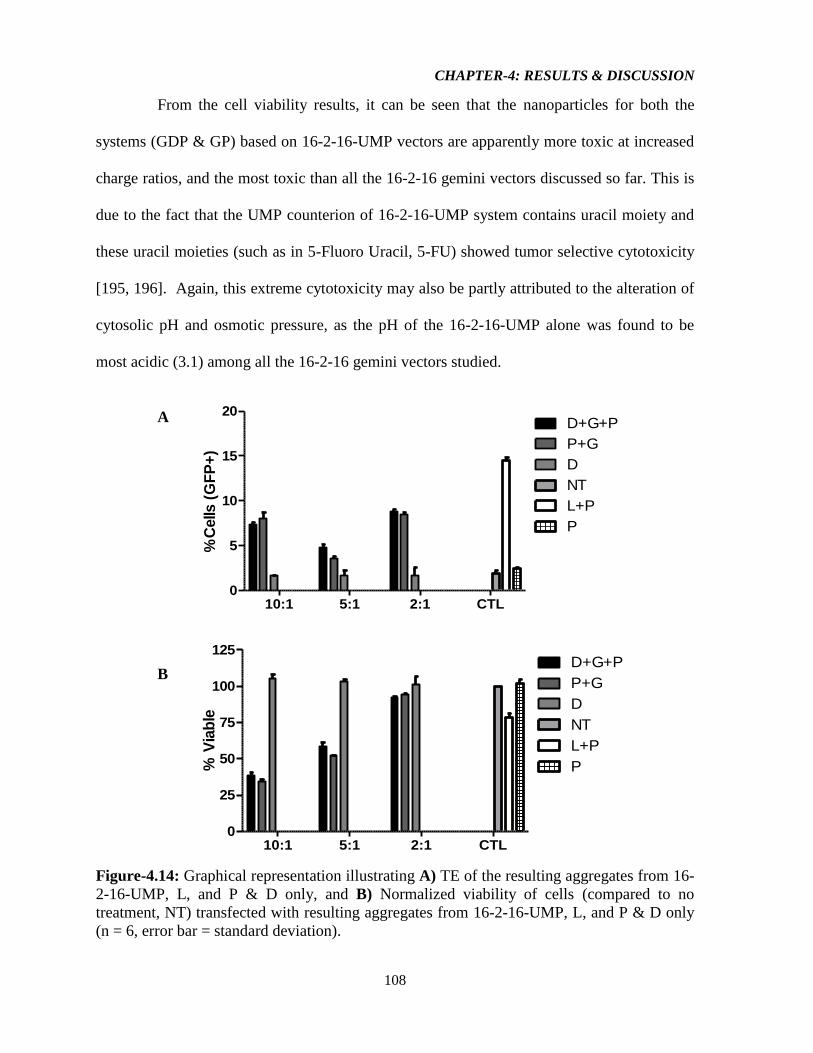
CHAPTER-4: RESULTS & DISCUSSION
108
10:1 5:1 2:1 CTL0
5
10
15
20D+G+P
P+G
D
NT
L+P
P
%C
ells
(G
FP
+)
10:1 5:1 2:1 CTL0
25
50
75
100
125D+G+P
P+G
D
NT
L+P
P% V
iab
le
From the cell viability results, it can be seen that the nanoparticles for both the
systems (GDP & GP) based on 16-2-16-UMP vectors are apparently more toxic at increased
charge ratios, and the most toxic than all the 16-2-16 gemini vectors discussed so far. This is
due to the fact that the UMP counterion of 16-2-16-UMP system contains uracil moiety and
these uracil moieties (such as in 5-Fluoro Uracil, 5-FU) showed tumor selective cytotoxicity
[195, 196]. Again, this extreme cytotoxicity may also be partly attributed to the alteration of
cytosolic pH and osmotic pressure, as the pH of the 16-2-16-UMP alone was found to be
most acidic (3.1) among all the 16-2-16 gemini vectors studied.
A
B
Figure-4.14: Graphical representation illustrating A) TE of the resulting aggregates from 16-
2-16-UMP, L, and P & D only, and B) Normalized viability of cells (compared to no
treatment, NT) transfected with resulting aggregates from 16-2-16-UMP, L, and P & D only
(n = 6, error bar = standard deviation).
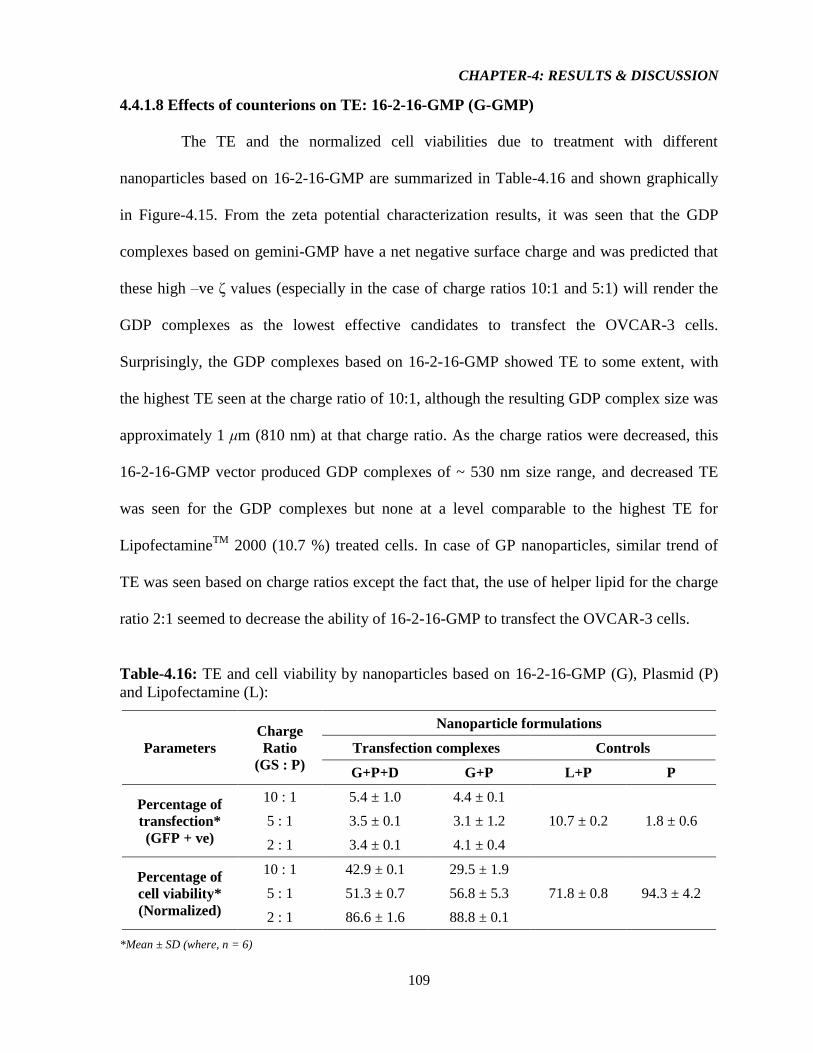
CHAPTER-4: RESULTS & DISCUSSION
109
4.4.1.8 Effects of counterions on TE: 16-2-16-GMP (G-GMP)
The TE and the normalized cell viabilities due to treatment with different
nanoparticles based on 16-2-16-GMP are summarized in Table-4.16 and shown graphically
in Figure-4.15. From the zeta potential characterization results, it was seen that the GDP
complexes based on gemini-GMP have a net negative surface charge and was predicted that
these high –ve ζ values (especially in the case of charge ratios 10:1 and 5:1) will render the
GDP complexes as the lowest effective candidates to transfect the OVCAR-3 cells.
Surprisingly, the GDP complexes based on 16-2-16-GMP showed TE to some extent, with
the highest TE seen at the charge ratio of 10:1, although the resulting GDP complex size was
approximately 1 μm (810 nm) at that charge ratio. As the charge ratios were decreased, this
16-2-16-GMP vector produced GDP complexes of ~ 530 nm size range, and decreased TE
was seen for the GDP complexes but none at a level comparable to the highest TE for
LipofectamineTM
2000 (10.7 %) treated cells. In case of GP nanoparticles, similar trend of
TE was seen based on charge ratios except the fact that, the use of helper lipid for the charge
ratio 2:1 seemed to decrease the ability of 16-2-16-GMP to transfect the OVCAR-3 cells.
Table-4.16: TE and cell viability by nanoparticles based on 16-2-16-GMP (G), Plasmid (P)
and Lipofectamine (L):
Parameters
Charge
Ratio
(GS : P)
Nanoparticle formulations
Transfection complexes Controls
G+P+D G+P L+P P
Percentage of
transfection*
(GFP + ve)
10 : 1 5.4 ± 1.0 4.4 ± 0.1
10.7 ± 0.2 1.8 ± 0.6 5 : 1 3.5 ± 0.1 3.1 ± 1.2
2 : 1 3.4 ± 0.1 4.1 ± 0.4
Percentage of
cell viability*
(Normalized)
10 : 1 42.9 ± 0.1 29.5 ± 1.9
71.8 ± 0.8 94.3 ± 4.2 5 : 1 51.3 ± 0.7 56.8 ± 5.3
2 : 1 86.6 ± 1.6 88.8 ± 0.1
*Mean ± SD (where, n = 6)
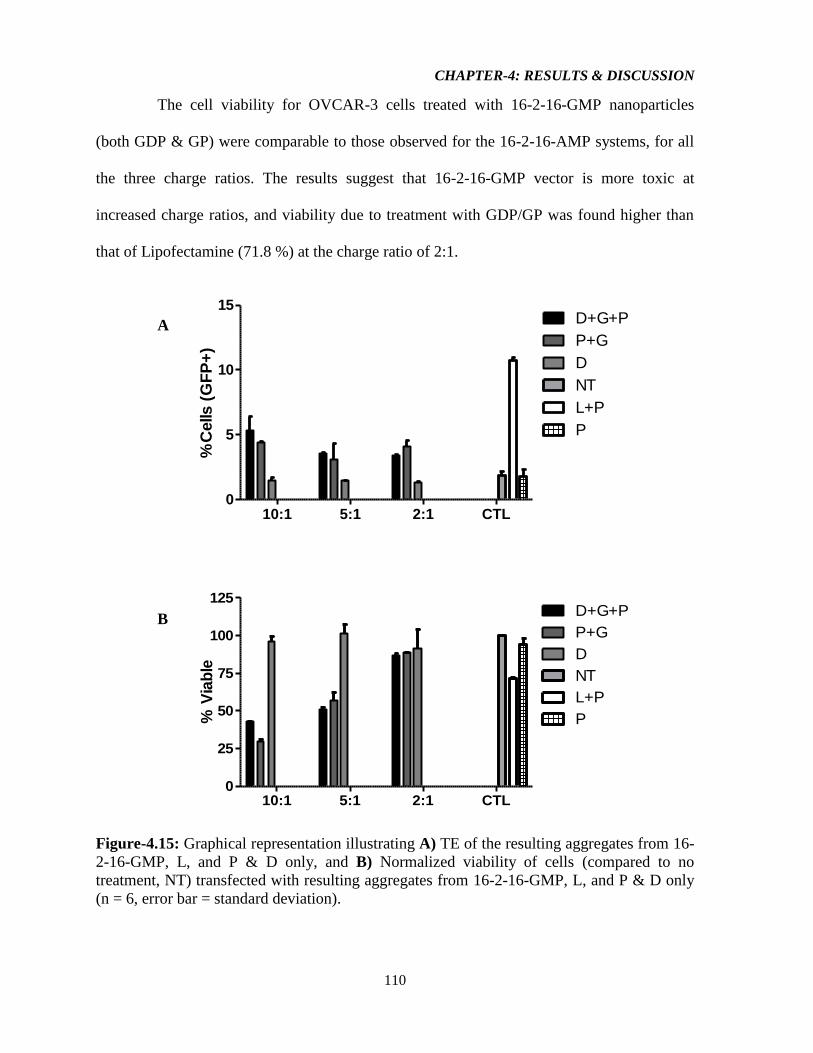
CHAPTER-4: RESULTS & DISCUSSION
110
10:1 5:1 2:1 CTL0
5
10
15D+G+P
P+G
D
NT
L+P
P
%C
ells (
GF
P+
)
10:1 5:1 2:1 CTL0
25
50
75
100
125D+G+P
P+G
D
NT
L+P
P% V
iab
le
The cell viability for OVCAR-3 cells treated with 16-2-16-GMP nanoparticles
(both GDP & GP) were comparable to those observed for the 16-2-16-AMP systems, for all
the three charge ratios. The results suggest that 16-2-16-GMP vector is more toxic at
increased charge ratios, and viability due to treatment with GDP/GP was found higher than
that of Lipofectamine (71.8 %) at the charge ratio of 2:1.
A
B
Figure-4.15: Graphical representation illustrating A) TE of the resulting aggregates from 16-
2-16-GMP, L, and P & D only, and B) Normalized viability of cells (compared to no
treatment, NT) transfected with resulting aggregates from 16-2-16-GMP, L, and P & D only
(n = 6, error bar = standard deviation).
CHAPTER-4: RESULTS & DISCUSSION
111
4.4.2 Summary of the effects of counterions on TE
The following table (Table-4.17) summarizes the transfection efficiencies (TE) and
cell viabilities (%viability) for nanoparticles formed from all eight 16-2-16 surfactants, in
combination with plasmid alone (GP formulations) or plasmid and DOPE (GDP
formulations). Although no generalized relation or pattern is observed, overall, the TE was
found to be moderate at the lowest charge ratio (2:1), as the GDP particle sizes formed from
all the GSs was within nanoparticle range (~500 nm) at that charge ratio. In few cases, the
TE was exceptionally higher at the charge ratio (10:1).
Particle size significantly affects the cellular and tissue uptake of nanoparticles in
non-viral transfection formulations [197]. In one of the studies, Manisha et al. reported that
the polylactic-polyglycolic acid co-polymer (PLGA 50:50) nanoparticles of 100 nm sizes
showed 2.5 fold greater uptake compared to 1 μm particles, and 6 fold higher uptake
compared to 10 μm microparticles in human epithelial colorectal adenocarcinoma (Caco-2)
cell line [198]. Similar trend of results were attained when these formulations of nano- and
microparticles were tested in a rat in situ intestinal loop model. The efficiency of cellular
uptake of 100 nm size particles was seen 15–250 fold greater than larger size (1 and 10 μm)
microparticles [199]. Moreover, Prabha et al. (2002) reported that smaller sized nanoparticles
can give rise to a 27-fold higher TE (analysed by luciferase protein levels) than that of the
larger-sized nanoparticles, in COS-7 cells [197]. But in our study, the impact of particle size
was not that prominent as few of the gemini surfactants, namely 16-2-16-bromide, 16-2-16-
CMP, 16-2-16-UMP, and 16-2-16-GMP formed particles of ~500 nm sizes (for 16-2-16-
GMP, particle sizes was > 500 nm) at either 10:1 or 2:1 charge ratios, while exerting
moderate TE at the charge ratio of 10:1.
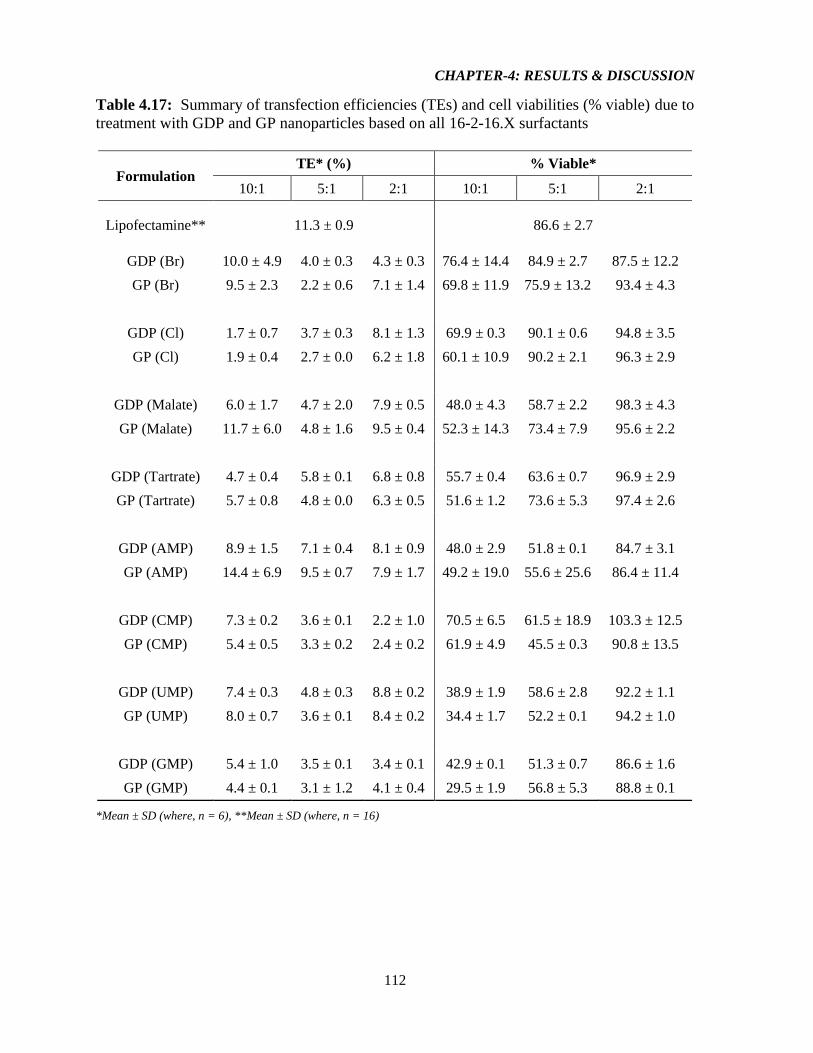
CHAPTER-4: RESULTS & DISCUSSION
112
Table 4.17: Summary of transfection efficiencies (TEs) and cell viabilities (% viable) due to
treatment with GDP and GP nanoparticles based on all 16-2-16.X surfactants
Formulation TE* (%) % Viable*
10:1 5:1 2:1 10:1 5:1 2:1
Lipofectamine** 11.3 ± 0.9 86.6 ± 2.7
GDP (Br) 10.0 ± 4.9 4.0 ± 0.3 4.3 ± 0.3 76.4 ± 14.4 84.9 ± 2.7 87.5 ± 12.2
GP (Br) 9.5 ± 2.3 2.2 ± 0.6 7.1 ± 1.4 69.8 ± 11.9 75.9 ± 13.2 93.4 ± 4.3
GDP (Cl) 1.7 ± 0.7 3.7 ± 0.3 8.1 ± 1.3 69.9 ± 0.3 90.1 ± 0.6 94.8 ± 3.5
GP (Cl) 1.9 ± 0.4 2.7 ± 0.0 6.2 ± 1.8 60.1 ± 10.9 90.2 ± 2.1 96.3 ± 2.9
GDP (Malate) 6.0 ± 1.7 4.7 ± 2.0 7.9 ± 0.5 48.0 ± 4.3 58.7 ± 2.2 98.3 ± 4.3
GP (Malate) 11.7 ± 6.0 4.8 ± 1.6 9.5 ± 0.4 52.3 ± 14.3 73.4 ± 7.9 95.6 ± 2.2
GDP (Tartrate) 4.7 ± 0.4 5.8 ± 0.1 6.8 ± 0.8 55.7 ± 0.4 63.6 ± 0.7 96.9 ± 2.9
GP (Tartrate) 5.7 ± 0.8 4.8 ± 0.0 6.3 ± 0.5 51.6 ± 1.2 73.6 ± 5.3 97.4 ± 2.6
GDP (AMP) 8.9 ± 1.5 7.1 ± 0.4 8.1 ± 0.9 48.0 ± 2.9 51.8 ± 0.1 84.7 ± 3.1
GP (AMP) 14.4 ± 6.9 9.5 ± 0.7 7.9 ± 1.7 49.2 ± 19.0 55.6 ± 25.6 86.4 ± 11.4
GDP (CMP) 7.3 ± 0.2 3.6 ± 0.1 2.2 ± 1.0 70.5 ± 6.5 61.5 ± 18.9 103.3 ± 12.5
GP (CMP) 5.4 ± 0.5 3.3 ± 0.2 2.4 ± 0.2 61.9 ± 4.9 45.5 ± 0.3 90.8 ± 13.5
GDP (UMP) 7.4 ± 0.3 4.8 ± 0.3 8.8 ± 0.2 38.9 ± 1.9 58.6 ± 2.8 92.2 ± 1.1
GP (UMP) 8.0 ± 0.7 3.6 ± 0.1 8.4 ± 0.2 34.4 ± 1.7 52.2 ± 0.1 94.2 ± 1.0
GDP (GMP) 5.4 ± 1.0 3.5 ± 0.1 3.4 ± 0.1 42.9 ± 0.1 51.3 ± 0.7 86.6 ± 1.6
GP (GMP) 4.4 ± 0.1 3.1 ± 1.2 4.1 ± 0.4 29.5 ± 1.9 56.8 ± 5.3 88.8 ± 0.1
*Mean ± SD (where, n = 6), **Mean ± SD (where, n = 16)
CHAPTER-4: RESULTS & DISCUSSION
113
In general, between the 16-2-16-halide, the 16-2-16-bromide showed better TE at
10:1 but, the 16-2-16-chloride showed moderate TE at 2:1. Between the 16-2-16-
carboxylates, the GDP particles of based on both the 16-2-16–tartrate and 16-2-16–malate
showed better TE at 2:1. Lastly, among the 16-2-16-NMPs, the 16-2-16-AMP showed
moderate TE at 10:1 and 2:1; the 16-2-16-CMP showed good TE at 10:1; the 16-2-16-UMP
showed TE at 10:1 and 2:1; and gemini-GMP showed poor TE at 10:1. Except in the cases of
16-2-16-Br, 16-2-16-AMP, 16-2-16-CMP, and 16-2-16-GMP, the TE was found to increase
with the progression of charge ratios from higher (10:1) to lower (2:1). These results were in
agreement with previous reports by Wang at el. [145] where it was reported that TE in
OVCAR-3 cell line decreased with increasing charge ratios.
Besides, irrespective of charge ratios, 16-2-16-halides (bromide) and 16-2-16-NMPs
(except 16-2-16-GMP) are more efficient vectors to transfect OVCAR-3 cells, compared to
the 16-2-16-malate/tartrate vectors. In relation to DOPE, the TE due to GP nanoparticles
were found significantly higher than the TE due to GDP particles of 16-2-16-malate (dGP =
211 nm & dGDP = 121 nm; where d = size/diameter) and 16-2-16-AMP (dGP = 81 nm & dGDP
= 83 nm; where d = size/diameter) at the charge ratio of 10:1, and thus, inferred that the role
of DOPE lipid was ineffectual for both of these cases. As discussed earlier, the probable
reason for this phenomena was during endosomal escape, the release of the GP complexes
from the GDP complexes was not sufficient enough, upon transition of DOPE from lamellar
(LC
α) to inverted hexagonal phase (HC
II).
The GP complexes were found to consistently exhibit low TEs compared to GDP
lipoplexes (except few cases as discussed above) most likely due to their inability to undergo
structural polymorphisms, for endosomal escape and DNA release, in absence of DOPE
CHAPTER-4: RESULTS & DISCUSSION
114
[200]. From our results, it is also evident that, the TE of the LipofectamineTM
2000 (positive
control) was drastically lower than previous reports (11.3 % vs 32.2 %) [94, 145], which may
be attributed to cellular senescence caused by high passage number (12-18), during which
transfections took place. Further studies, using OVCAR-3 as well as other cell lines, may
justify the complete analysis of the differences in TE attained from lipoplexes generated from
16-2-16 gemini systems.
For all the 16-2-16-gemini systems, the normalized cell viability was approximately
95 % on average (compared to control) in the case of charge ratio of 2:1 and more toxicity
was seen as the charge ratios increased in general. Eventually, the evaluation of the combined
TE and cell viability results for all the 16-2-16-gemini surfactants suggest that, irrespective
of charge ratio, the 16-2-16-bromide (halide family of counterion) is the lowest toxic in
nature, but also the most efficient as a transfection vector among the eight 16-2-16-gemini
vectors studied in this project.
The following figures (Figure-4.16 & Figure-4.17) depict the comparative summary
of TE & cell viability due to treatment with (GDP & GP) nanoparticles respectively, based
on all the 16-2-16 series of gemini surfactants with different counterions.
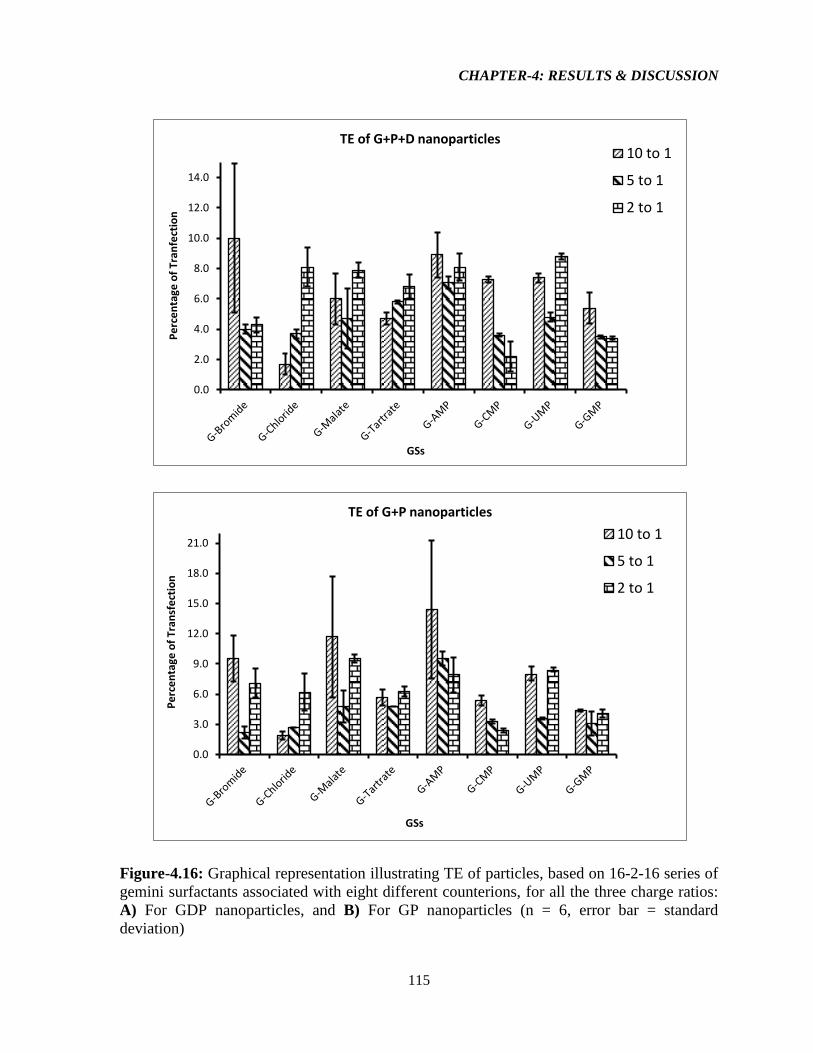
CHAPTER-4: RESULTS & DISCUSSION
115
0.0
2.0
4.0
6.0
8.0
10.0
12.0
14.0P
erc
en
tage
of
Tran
fect
ion
GSs
TE of G+P+D nanoparticles 10 to 1
5 to 1
2 to 1
0.0
3.0
6.0
9.0
12.0
15.0
18.0
21.0
Pe
rce
nta
ge o
f Tr
ansf
ect
ion
GSs
TE of G+P nanoparticles
10 to 1
5 to 1
2 to 1
Figure-4.16: Graphical representation illustrating TE of particles, based on 16-2-16 series of
gemini surfactants associated with eight different counterions, for all the three charge ratios:
A) For GDP nanoparticles, and B) For GP nanoparticles (n = 6, error bar = standard
deviation)
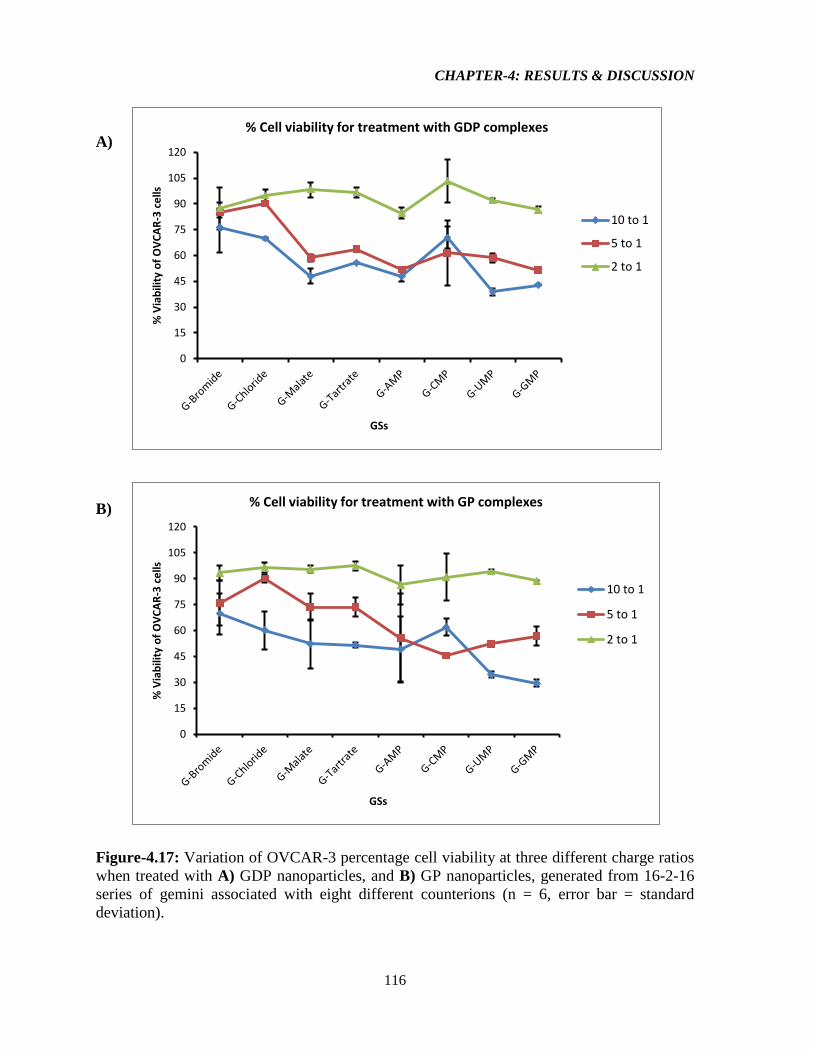
CHAPTER-4: RESULTS & DISCUSSION
116
0
15
30
45
60
75
90
105
120%
Via
bili
ty o
f O
VC
AR
-3 c
ells
GSs
% Cell viability for treatment with GDP complexes
10 to 1
5 to 1
2 to 1
0
15
30
45
60
75
90
105
120
% V
iab
ility
of
OV
CA
R-3
ce
lls
GSs
% Cell viability for treatment with GP complexes
10 to 1
5 to 1
2 to 1
A)
B)
Figure-4.17: Variation of OVCAR-3 percentage cell viability at three different charge ratios
when treated with A) GDP nanoparticles, and B) GP nanoparticles, generated from 16-2-16
series of gemini associated with eight different counterions (n = 6, error bar = standard
deviation).
CHAPTER-5: SUMMARY & FUTURE DIRECTIONS
117
5. Summary and Future Directions
We report the results of the systematic investigation of the effect of associated
counterions on the micellization of a novel series of quaternary ammonium 16-2-16 gemini
surfactants, in aqueous solution. Our focus regarding the solution properties, aggregation,
and micellization of GSs, clearly suggests that ionic hydration, ion polarizability,
hydrophobic interactions, counterion dissociation, and intra/inter-molecular hydrogen bonds
cooperatively influence the micellization process and the propensity of the counterions to
form ion pairs with the oppositely charged head groups of gemini in solution. The results of
our study provide new insight to understand the diversified effects of counterions on the
intriguing properties of these novel and green surfactants “The Gemini”. For all the anions, it
was found that, hydrophilicity, polarizability, and hydration numbers of the ions are the
dominant factors determining micellization.
In summary, the critical micellar concentration (CMC), degree of micellization (α), as
well as degree of binding of counterions to the micelles (β) and other surface properties such
as surface excess concentration (Γmax), surface pressure, and minimum area per molecule
(Amin) at the air/water interface of these bis-cationic dimeric GSs strongly depend on the
associated counterions of the respective gemini. Moreover, from our study it was revealed
that, the counterions have massive impact on the solubilities and the Krafft temperatures of
the individual gemini, mainly due to electrostatic interactions as described earlier. As a part
of unique behavior in solution, counterions also play a role for change in density and
viscosity due to their micellar packing volume and matrix type aggregation in aqueous
solution. Lastly, the foam stability of the gemini is governed by the stable micellar packing in
CHAPTER-5: SUMMARY & FUTURE DIRECTIONS
118
the adsorbed foam lamellae, and the higher the micellar stability, the greater is the foam
stability.
For this project, to investigate the TE we are reporting the transfection ability of 16-2-
16 series of GSs associated with different counterions among which the transfectability of
those GS with organic counterions are being reported for the first time ever. Considering
both the average TE and cytotoxicity, from our investigation it was revealed that the optimal
charge ratio of GSs to DNA for good to moderate transfection was found to be 2:1.
Furthermore, the particle size characterization of the GDP transfection complexes indicates
that particles generated from any of the 16-2-16 gemini surfactants at any charge ratios are
within submicron sized. None of the associated counterions showed significantly better TEs
than that of the commercially available lipid based reagent LipofectamineTM
2000. By
changing the associated counterions, our primary goal was to develop efficient GSs as
transgene delivery vectors for ovarian cancer gene therapy. With the disagreement as we
hypothesized, the change in counterions for GSs as a parameter for vector design did not
enhance the TE in OVCAR-3 cells at all in comparison to that of Lipofectamine (11.3 ± 0.9) ,
but we found moderate transfection ability for few 16-2-16 gemini associated with few
counterions as discussed in the results section. In terms of cytotoxicity, the counterions
seemed well tolerated on average by the cells, eliminating the considerations of effect of
mechanical rigors (such as aggressive handling, unexpected contaminations, pH effects of the
overall transfection complexes) on cytotoxicity. Our results proved and reinforced that
smaller sized particles (i.e. < 200 nm) are not a ‘mandatory’ requirement for transfection in
vitro in OVCAR-3 cell line, and our finding is also consistent with results reported by
Foldvari et al. [201]. However, these micro-sized particles would not be the good candidates
CHAPTER-5: SUMMARY & FUTURE DIRECTIONS
119
for in vivo TE studies, because larger particles may be rapidly degraded by phagocytic cells
and the reticuloendothelial systems (RES) as mentioned in the “Introduction” section.
Although we report the morphology (see “Appendix” section) of the GSs only based
on CPP values, this project could be expanded using TEM or atomic force microscopy
(AFM) imaging to investigate the effect of change in the associated counterions on aggregate
morphology of these novel GSs, considering the importance of micellar morphology. Also,
this study could be expanded to investigate the aggregation number of the resulting micelles
of the GSs as part of important physical characterization data using fluorescence quenching
(FQ) technique.
The interaction between the gemini molecules and DNA is another potential study to
be explored. Since the GSs associated with different counterions are designed for DNA
delivery to be considered as efficient vectors, it would be questionable if the existing
interactions of the cationic GSs and the polyelectrolyte DNA is not studied to reveal how the
solution properties of GSs are moulded by the addition of DNA and also the effect of
changing the counterions on the this GS-DNA interaction. Thus this project could be
expanded to investigate this through the application of experimental tools like the isothermal
titration calorimetry (ITC) for thermodynamic investigations & critical aggregate
concentration (CAC) determination, and Brewster angle microscopy (BAM) for pre-/post
images of the interactions.
In terms of transfection, future studies using animal models should be explored for all
the charge ratios to investigate the actual resulting influence in reality on gene delivery.
Additionally, stability of transfection complexes may be increased by modifying transfection
complexes with the attachment of polyethylene glycol (PEG) to the GSs since no studies
CHAPTER-5: SUMMARY & FUTURE DIRECTIONS
120
involving PEGylation of GSs based DNA delivery have been carried out. Apart from this
PEG conjugation approach, pluronic co-polymer or functionalized pluronics with
biodegradable moieties (such as PAGA i.e. poly-[α-(4-aminobutyl)-L-glycolic acid]) based
gene delivery could also be considered to be studied which has enormous potential for
efficient gene delivery [202]. To battle cancers via gene therapy approach, cell-specific
targeting is one of the crucial considerations which could be a paramount sector for further
research. Thus, another fact to consider for this project in future will be the modification of
GSs by attaching a targeting group (i.e. folate if the treatment is for OCs) which will allow
increased cellular uptake and cell specificity, when transfection studies will be done with
these GSs conjugated with a target ligand both at in vitro and in vivo situations.
BIBLIOGRAPHY
121
Bibliography
[1] F. Ledley, Pharmaceutical Approach to Somatic Gene Therapy, Pharm Res, 13 (1996) 1595-1614.
[2] W.F. Anderson, Human gene therapy, Nature, 392 (Suppl.) (1998) 25-30.
[3] C.Y.M. Hsu, H. Uludağ, Nucleic-acid based gene therapeutics: delivery challenges and modular
design of nonviral gene carriers and expression cassettes to overcome intracellular barriers for
sustained targeted expression, Journal of Drug Targeting, 20 (2012) 301-328.
[4] T. Wirth, N. Parker, S. Ylä-Herttuala, History of gene therapy, Gene, 525 (2013) 162-169.
[5] I.M. Verma, M.D. Weitzman, Gene therapy: twenty-first century medicine, Ann. Rev. Biochem.,
74 (2005) 711-738.
[6] M. Kumar, K. Jinturkar, M.R. Yadav, A. Misra, Gemini Amphiphiles: A Novel Class of Nonviral
Gene Delivery Vectors, Crit Rev Ther Drug Carrier Syst., 27 (2010) 237-278.
[7] S.D. Wettig, R.E. Verrall, M. Foldvari, Gemini surfactants: a new family of building blocks for
non-viral gene delivery systems, Current gene therapy, 8 (2008) 9-23.
[8] S.L. Ginn, I.E. Alexander, M.L. Edelstein, M.R. Abedi, J. Wixon, Gene therapy clinical trials
worldwide to 2012 – an update, J. Gene. Med., 15 (2013) 65-77.
[9] Gene Therapy Clinical Trials worldwide,
http://www.wiley.com/legacy/wileychi/genmed/clinical/, (2014).
[10] D.V. Schaffer, J.T. Koerber, K.-i. Lim, Molecular Engineering of Viral Gene Delivery Vehicles,
Annual Review of Biomedical Engineering, 10 (2008) 169-194.
[11] H. Jia, Gene therapy finds welcoming environment in China, Nature medicine, 12 (2006) 263-
264.
[12] L.M. Bryant, D.M. Christopher, A.R. Giles, C. Hinderer, J.L. Rodriguez, J.B. Smith, E.A.
Traxler, J. Tycko, A.P. Wojno, J.M. Wilson, Lessons learned from the clinical development and
market authorization of Glybera, Human gene therapy. Clinical development, 24 (2013) 55-64.
[13] D. Melchiorri, L. Pani, P. Gasparini, G. Cossu, J. Ancans, J.J. Borg, C. Drai, P. Fiedor, E. Flory,
I. Hudson, H.G. Leufkens, J. Muller-Berghaus, G. Narayanan, B. Neugebauer, J. Pokrotnieks, J.L.
Robert, T. Salmonson, C.K. Schneider, Regulatory evaluation of Glybera in Europe - two
committees, one mission, Nature reviews. Drug discovery, 12 (2013) 719.
[14] C.E. Thomas, A. Ehrhardt, M.A. Kay, Progress and problems with the use of viral vectors for
gene therapy, Nature reviews. Genetics, 4 (2003) 346-358.
[15] M.A. Kay, J.C. Glorioso, L. Naldini, Viral vectors for gene therapy: the art of turning infectious
agents into vehicles of therapeutics, Nature medicine, 7 (2001) 33-40.
[16] L.S. Young, P.F. Searle, D. Onion, V. Mautner, Viral gene therapy strategies: from basic science
to clinical application, The Journal of pathology, 208 (2006) 299-318.
[17] R. Waehler, S.J. Russell, D.T. Curiel, Engineering targeted viral vectors for gene therapy, Nature
reviews. Genetics, 8 (2007) 573-587.
[18] M. Donkuru, I. Badea, S. Wettig, R. Verrall, M. Elsabahy, M. Foldvari, Advancing nonviral gene
delivery: lipid- and surfactant-based nanoparticle design strategies, Nanomedicine (London,
England), 5 (2010) 1103-1127.
[19] M. Al-Dosari, X. Gao, Nonviral Gene Delivery: Principle, Limitations, and Recent Progress,
AAPS J, 11 (2009) 671-681.
BIBLIOGRAPHY
122
[20] M.A. Mintzer, E.E. Simanek, Nonviral Vectors for Gene Delivery, Chem. Rev., 109 (2008) 259-
302.
[21] A. Mountain, Gene therapy: the first decade, Trends in Biotechnology, 18 (2000) 119-128.
[22] J. Douglas, Adenoviral vectors for gene therapy, Mol Biotechnol, 36 (2007) 71-80.
[23] M.A. Kay, State-of-the-art gene-based therapies: the road ahead, Nature reviews. Genetics, 12
(2011) 316-328.
[24] E. Marshall, What to do when clear success comes with an unclear Risk?, Science, 298 (2002)
510-511.
[25] A. Fischer, S. Hacein-Bey-Abina, M. Cavazzana-Calvo, 20 years of gene therapy for SCID,
Nature immunology, 11 (2010) 457-460.
[26] S. Lehrman, Virus treatment questioned after gene therapy death, Nature, 401 (1999) 517-518.
[27] N. Somia, I.M. Verma, Gene therapy: trials and tribulations, Nature reviews. Genetics, 1 (2000)
91-99.
[28] S.E. Raper, N. Chirmule, F.S. Lee, N.A. Wivel, A. Bagg, G.-p. Gao, J.M. Wilson, M.L. Batshaw,
Fatal systemic inflammatory response syndrome in a ornithine transcarbamylase deficient patient
following adenoviral gene transfer, Molecular Genetics and Metabolism, 80 (2003) 148-158.
[29] S.E. Raper, Gene therapy: the good, the bad, and the ugly, Surgery, 137 (2005) 487-492.
[30] J.M. Wilson, Lessons learned from the gene therapy trial for ornithine transcarbamylase
deficiency, Molecular Genetics and Metabolism, 96 (2009) 151-157.
[31] M. Donkuru, I. Badea, S. Wettig, R. Verrall, M. Elsabahy, M. Foldvari, Advancing nonviral gene
delivery: lipid- and surfactant-based nanoparticle design strategies, Nanomedicine, 5 (2010) 1103-
1127.
[32] Y. Seow, M.J. Wood, Biological gene delivery vehicles: beyond viral vectors, Mol Ther, 17
(2009) 767-777.
[33] S.-D. Li, L. Huang, Non-viral is superior to viral gene delivery, J. Control. Release., 123 (2007)
181-183.
[34] B. Dalby, S. Cates, A. Harris, E.C. Ohki, M.L. Tilkins, P.J. Price, V.C. Ciccarone, Advanced
transfection with Lipofectamine 2000 reagent: primary neurons, siRNA, and high-throughput
applications, Methods (San Diego, Calif.), 33 (2004) 95-103.
[35] L.B. Jacobsen, S.A. Calvin, K.E. Colvin, M. Wright, FuGENE 6 Transfection Reagent: the
gentle power, Methods (San Diego, Calif.), 33 (2004) 104-112.
[36] A.S. Arnold, V. Laporte, S. Dumont, A. Appert-Collin, P. Erbacher, G. Coupin, R. Levy, P.
Poindron, J.P. Gies, Comparing reagents for efficient transfection of human primary myoblasts:
FuGENE 6, Effectene and ExGen 500, Fundamental & clinical pharmacology, 20 (2006) 81-89.
[37] H. Pollard, J.S. Remy, G. Loussouarn, S. Demolombe, J.P. Behr, D. Escande, Polyethylenimine
but not cationic lipids promotes transgene delivery to the nucleus in mammalian cells, J Biol Chem,
273 (1998) 7507-7511.
[38] D.J. Glover, H.J. Lipps, D.A. Jans, Towards safe, non-viral therapeutic gene expression in
humans, Nature reviews. Genetics, 6 (2005) 299-310.
[39] M. Ruponen, S. Arkko, A. Urtti, M. Reinisalo, V.P. Ranta, Intracellular DNA release and
elimination correlate poorly with transgene expression after non-viral transfection, Journal of
controlled release : official journal of the Controlled Release Society, 136 (2009) 226-231.
[40] X.-X. Zhang, T.J. McIntosh, M.W. Grinstaff, Functional lipids and lipoplexes for improved gene
delivery, Biochimie, 94 (2012) 42-58.
BIBLIOGRAPHY
123
[41] C. Wang, X. Li, S.D. Wettig, I. Badea, M. Foldvari, R.E. Verrall, Investigation of complexes
formed by interaction of cationic gemini surfactants with deoxyribonucleic acid, Phys. Chem. Chem.
Phys., 9 (2007) 1616-1628.
[42] B.D. Chithrani, A.A. Ghazani, W.C. Chan, Determining the size and shape dependence of gold
nanoparticle uptake into mammalian cells, Nano letters, 6 (2006) 662-668.
[43] M. Breunig, U. Lungwitz, R. Liebl, A. Goepferich, Fluorescence resonance energy transfer:
evaluation of the intracellular stability of polyplexes, European journal of pharmaceutics and
biopharmaceutics : official journal of Arbeitsgemeinschaft fur Pharmazeutische Verfahrenstechnik
e.V, 63 (2006) 156-165.
[44] S.D. Li, L. Huang, Gene therapy progress and prospects: non-viral gene therapy by systemic
delivery, Gene Ther, 13 (2006) 1313-1319.
[45] M.E. Ferrari, D. Rusalov, J. Enas, C.J. Wheeler, Synergy between cationic lipid and co-lipid
determines the macroscopic structure and transfection activity of lipoplexes, Nucleic Acids Research,
30 (2002) 1808-1816.
[46] S. Patil, D. Rhodes, D. Burgess, DNA-based therapeutics and DNA delivery systems: A
comprehensive review, AAPS J, 7 (2005) E61-E77.
[47] M. Mintzer, E. Simanek, Nonviral vectors for gene delivery, Chem Rev, 109 (2008) 259 - 302.
[48] A.J. Kirby, P. Camilleri, J.B. Engberts, M.C. Feiters, R.J. Nolte, O. Soderman, M. Bergsma, P.C.
Bell, M.L. Fielden, C.L. Garcia Rodriguez, P. Guedat, A. Kremer, C. McGregor, C. Perrin, G.
Ronsin, M.C. van Eijk, Gemini surfactants: new synthetic vectors for gene transfection, Angewandte
Chemie (International ed. in English), 42 (2003) 1448-1457.
[49] S.Y. Wong, J.M. Pelet, D. Putnam, Polymer systems for gene delivery—Past, present, and
future, Prog. Polym. Sci., 32 (2007) 799-837.
[50] H. Yin, R.L. Kanasty, A.A. Eltoukhy, A.J. Vegas, J.R. Dorkin, D.G. Anderson, Non-viral
vectors for gene-based therapy, Nature reviews. Genetics, 15 (2014) 541-555.
[51] P.L. Felgner, T.R. Gadek, M. Holm, R. Roman, H.W. Chan, M. Wenz, J.P. Northrop, G.M.
Ringold, M. Danielsen, Lipofection: a highly efficient, lipid-mediated DNA-transfection procedure,
Proc. Natl. Acad. Sci., 84 (1987) 7413-7417.
[52] K. Kasireddy, S.M. Ali, M.U. Ahmad, S. Choudhury, P.-Y. Chien, S. Sheikh, I. Ahmad,
Synthesis of cationic cardiolipin analogues, Bioorganic Chemistry, 33 (2005) 345-362.
[53] R. Srinivas, S. Samanta, A. Chaudhuri, Cationic amphiphiles: promising carriers of genetic
materials in gene therapy, Chemical Society reviews, 38 (2009) 3326-3338.
[54] K. Kasireddy, M.U. Ahmad, S.M. Ali, I. Ahmad, Synthesis of novel cationic cardiolipin
analogues for the optimal delivery of therapeutic agents, Tetrahedron Letters, 45 (2004) 2743-2746.
[55] C. Bombelli, L. Giansanti, P. Luciani, G. Mancini, Gemini surfactant based carriers in gene and
drug delivery, Current medicinal chemistry, 16 (2009) 171-183.
[56] Y.K. Song, F. Liu, S. Chu, D. Liu, Characterization of cationic liposome-mediated gene transfer
in vivo by intravenous administration, Human gene therapy, 8 (1997) 1585-1594.
[57] R. Labas, F. Beilvert, B. Barteau, S. David, R. Chevre, B. Pitard, Nature as a source of
inspiration for cationic lipid synthesis, Genetica, 138 (2010) 153-168.
[58] R. Marty, C.N. N'soukpoé-Kossi, D. Charbonneau, C.M. Weinert, L. Kreplak, H.-A. Tajmir-
Riahi, Structural analysis of DNA complexation with cationic lipids, Nucleic Acids Research, 37
(2009) 849-857.
BIBLIOGRAPHY
124
[59] S. Zhang, Y. Xu, B. Wang, W. Qiao, D. Liu, Z. Li, Cationic compounds used in lipoplexes and
polyplexes for gene delivery, Journal of Controlled Release, 100 (2004) 165-180.
[60] C. Dong, Characterization of Gemini Nanoparticle Assembly by Fluorescence Correlation
Spectroscopy, in: School of Pharmacy, University of Waterloo, Waterloo, Ontario, Canada, 2013, pp.
134.
[61] C. Pichon, L. Billiet, P. Midoux, Chemical vectors for gene delivery: uptake and intracellular
trafficking, Current opinion in biotechnology, 21 (2010) 640-645.
[62] C.M. Wiethoff, C.R. Middaugh, Barriers to nonviral gene delivery, J. Pharm. Sci., 92 (2003)
203-217.
[63] I. Zuhorn, J.F.N. Engberts, D. Hoekstra, Gene delivery by cationic lipid vectors: overcoming
cellular barriers, Eur Biophys J, 36 (2007) 349-362.
[64] L.F. Gottfried, D.A. Dean, Extracellular and Intracellular Barriers to Non-Viral Gene Transfer,
in: Ming Wei, David Good (Eds), Novel Gene Therapy Approaches, InTech, Croatia, 2013, pp. 75-
88.
[65] M. Giacca, Methods for Gene Delivery, in: Gene therapy, Springer Milan, 2010, pp. 47-137.
[66] K. Miyata, N. Nishiyama, K. Kataoka, Rational design of smart supramolecular assemblies for
gene delivery: chemical challenges in the creation of artificial viruses, Chem. Soc. Rev., 41 (2012)
2562-2574.
[67] S. Xiang, H. Tong, Q. Shi, J.C. Fernandes, T. Jin, K. Dai, X. Zhang, Uptake mechanisms of non-
viral gene delivery, J. Control. Release., 158 (2012) 371-378.
[68] C. Scholz, E. Wagner, Therapeutic plasmid DNA versus siRNA delivery: Common and different
tasks for synthetic carriers, J. Control. Release., 161 (2012) 554-565.
[69] F.C. Perez-Martinez, J. Guerra, I. Posadas, V. Cena, Barriers to non-viral vector-mediated gene
delivery in the nervous system, Pharm Res, 28 (2011) 1843-1858.
[70] T. Wang, J.R. Upponi, V.P. Torchilin, Design of multifunctional non-viral gene vectors to
overcome physiological barriers: dilemmas and strategies, Int J Pharm, 427 (2012) 3-20.
[71] M. Elsabahy, A. Nazarali, M. Foldvari, Non-viral nucleic acid delivery: key challenges and
future directions, Curr Drug Deliv, 8 (2011) 235-244.
[72] Y.W. Won, K.S. Lim, Y.H. Kim, Intracellular organelle-targeted non-viral gene delivery
systems, Journal of controlled release : official journal of the Controlled Release Society, 152 (2011)
99-109.
[73] A. Pathak, S. Patnaik, K.C. Gupta, Recent trends in non-viral vector-mediated gene delivery,
Biotechnology journal, 4 (2009) 1559-1572.
[74] M. Ruponen, P. Honkakoski, S. Rönkkö, J. Pelkonen, M. Tammi, A. Urtti, Extracellular and
intracellular barriers in non-viral gene delivery, Journal of Controlled Release, 93 (2003) 213-217.
[75] Z. Rehman, I.S. Zuhorn, D. Hoekstra, How cationic lipids transfer nucleic acids into cells and
across cellular membranes: recent advances, Journal of controlled release : official journal of the
Controlled Release Society, 166 (2013) 46-56.
[76] I. Lentacker, R.E. Vandenbroucke, B. Lucas, J. Demeester, S.C. De Smedt, N.N. Sanders, New
strategies for nucleic acid delivery to conquer cellular and nuclear membranes, Journal of controlled
release : official journal of the Controlled Release Society, 132 (2008) 279-288.
[77] M. Sui, W. Liu, Y. Shen, Nuclear drug delivery for cancer chemotherapy, Journal of controlled
release : official journal of the Controlled Release Society, 155 (2011) 227-236.
BIBLIOGRAPHY
125
[78] E.V. Batrakova, A.V. Kabanov, Pluronic block copolymers: evolution of drug delivery concept
from inert nanocarriers to biological response modifiers, Journal of controlled release : official
journal of the Controlled Release Society, 130 (2008) 98-106.
[79] C.H. Sum, Optimized Production and Purification of LCC DNA Minivectors for Applications in
Gene Therapy and Vaccine Development, in: School of Pharmacy, University of Waterloo,
Waterloo, Ontario, Canada, 2014, pp. 163.
[80] S. Noori, A. Naqvi, W. Ansari, M. Akram, D. Kabir ud, Synthesis and Investigation of Surface
Active Properties of Counterion Coupled Gemini Surfactants, J Surfact Deterg, (2013) 1-9.
[81] M.S. Borse, S. Devi, Importance of head group polarity in controlling aggregation properties of
cationic gemini surfactants, Advances in colloid and interface science, 123-126 (2006) 387-399.
[82] H. Akbaş, A. Elemenli, M. Boz, Aggregation and Thermodynamic Properties of Some Cationic
Gemini Surfactants, J Surfact Deterg, 15 (2012) 33-40.
[83] R. TAMOTO, Chiral Nano/Micro Self-Assemblies of Cationic Surfactants: from dynamic
behavior of supramolecular architectures towards hybrid nanomaterials., in: Biophysical Chemistry,
University of Bordeaux, Bordeaux, France, 2011, pp. 222.
[84] F. Khan, U.S. Siddiqui, I.A. Khan, D. Kabir ud, Physicochemical study of cationic gemini
surfactant butanediyl-1,4-bis(dimethyldodecylammonium bromide) with various counterions in
aqueous solution, Colloids and Surfaces A: Physicochemical and Engineering Aspects, 394 (2012)
46-56.
[85] F.M. Menger, J.S. Keiper, Gemini Surfactants, Angew. Chem. Int. Edit., 39 (2000) 1906-1920.
[86] F.M. Menger, C.A. Littau, Gemini-surfactants: synthesis and properties, Journal of the American
Chemical Society, 113 (1991) 1451-1452.
[87] Y.-p. Zhu, A. Masuyama, M. Okahara, Preparation and surface active properties of amphipathic
compounds with two sulfate groups and two lipophilic alkyl chains, J Am Oil Chem Soc, 67 (1990)
459-463.
[88] K.M. Layn, P.G. Debenedetti, R.K. Prud’homme, A theoretical study of Gemini surfactant phase
behavior, The Journal of Chemical Physics, 109 (1998) 5651-5658.
[89] S.K. Hait, S.P. Moulik, Gemini surfactants: A distinct class of self-assembling molecules, Curr.
Sci., 82 (2002) 1101-1111.
[90] M. Rosen, D. Tracy, Gemini surfactants, J Surfact Deterg, 1 (1998) 547-554.
[91] M. Borse, V. Sharma, V.K. Aswal, P.S. Goyal, S. Devi, Effect of head group polarity and spacer
chain length on the aggregation properties of gemini surfactants in an aquatic environment, Journal of
colloid and interface science, 284 (2005) 282-288.
[92] J.R. Akbar, R. Deubry, D.G. Marangoni, S.D. Wettig, Interactions between gemini and nonionic
pharmaceutical surfactants, Canadian Journal of Chemistry, 88 (2010) 1262-1270.
[93] J.R. Akbar, Pharmaceutical Applications of Gemini Surfactants, in: School of Pharmacy,
University of Waterloo, Waterloo, Ontario, Canada, 2010, pp. 122.
[94] H. Wang, S.D. Wettig, Synthesis and aggregation properties of dissymmetric phytanyl-gemini
surfactants for use as improved DNA transfection vectors, Physical chemistry chemical physics :
PCCP, 13 (2011) 637-642.
[95] F.M. Menger, C.A. Littau, Gemini-surfactants: synthesis and properties, J. Am. Chem. Soc., 113
(1991) 1451-1452.
[96] P. Renouf, C. Mioskowski, L. Lebeau, D. Hebrault, J.-R. Desmurs, Dimeric surfactants: First
synthesis of an asymmetrical gemini compound, Tetrahedron Letters, 39 (1998) 1357-1360.
BIBLIOGRAPHY
126
[97] R. Oda, S. J. Candau, R. Oda, I. Huc, Gemini surfactants, the effect of hydrophobic chain length
and dissymmetry, Chemical Communications, (1997) 2105-2106.
[98] J. Akbar, N. Tavakoli, D. Gerrard Marangoni, S.D. Wettig, Mixed aggregate formation in gemini
surfactant/1,2-dialkyl-sn-glycero-3-phosphoethanolamine systems, Journal of colloid and interface
science, 377 (2012) 237-243.
[99] S.D. Wettig, C. Wang, R.E. Verrall, M. Foldvari, Thermodynamic and aggregation properties of
aza- and imino-substituted gemini surfactants designed for gene delivery, Physical Chemistry
Chemical Physics, 9 (2007) 871-877.
[100] X. Huang, Y. Han, Y. Wang, M. Cao, Y. Wang, Aggregation properties of cationic gemini
surfactants with dihydroxyethylamino headgroups in aqueous solution, Colloids and Surfaces A:
Physicochemical and Engineering Aspects, 325 (2008) 26-32.
[101] A.K. Tiwari, Sonu, S.K. Saha, Aggregation properties and thermodynamics of micellization of
gemini surfactants with diethyl ether spacer in water and water–organic solvent mixed media, The
Journal of Chemical Thermodynamics, 70 (2014) 24-32.
[102] C. Wang, S.D. Wettig, M. Foldvari, R.E. Verrall, Synthesis, Characterization, and Use of
Asymmetric Pyrenyl-Gemini Surfactants as Emissive Components in DNA−Lipoplex Systems,
Langmuir : the ACS journal of surfaces and colloids, 23 (2007) 8995-9001.
[103] M. Donkuru, Non-viral Gene Delivery with pH-sensitive Gemini Nanoparticles: Synthesis of
Gemini Surfactant Building Blocks, Characterization and In-Vitro Screening of Transfection
Efficiency and Toxicity in: Pharmacy and Nutrition, University of Saskatchewan, Saskatoon,
Saskatchewan, Canada, 2008, pp. 205.
[104] M. Hajy Alimohammadi, S. Javadian, H. Gharibi, A.r. Tehrani-Bagha, M.R. Alavijeh, K.
Kakaei, Aggregation behavior and intermicellar interactions of cationic Gemini surfactants: Effects of
alkyl chain, spacer lengths and temperature, The Journal of Chemical Thermodynamics, 44 (2012)
107-115.
[105] X. Pei, Y. You, J. Zhao, Y. Deng, E. Li, Z. Li, Adsorption and aggregation of 2-hydroxyl-
propanediyl-alpha,omega-bis(dimethyldodecyl ammonium bromide) in aqueous solution: effect of
intermolecular hydrogen-bonding, Journal of colloid and interface science, 351 (2010) 457-465.
[106] I. Badea, R. Verrall, M. Baca-Estrada, S. Tikoo, A. Rosenberg, P. Kumar, M. Foldvari, In vivo
cutaneous interferon-gamma gene delivery using novel dicationic (gemini) surfactant-plasmid
complexes, J Gene Med, 7 (2005) 1200-1214.
[107] L. Karlsson, M.C.P. Van Eijk, O. Söderman, Compaction of DNA by gemini surfactants:
Effects of surfactant architecture, Journal of colloid and interface science, 252 (2002) 290-296.
[108] D. Myers, Surfactant Science and Technology, 3rd ed., John Wiley & Sons, Inc. , Hoboken,
New Jersey, 2006.
[109] Z. Raoul, Gemini (Dimeric) Surfactants in Water, in: Gemini Surfactants, CRC Press, 2003.
[110] C. Wang, X. Li, S.D. Wettig, I. Badea, M. Foldvari, R.E. Verrall, Investigation of complexes
formed by interaction of cationic gemini surfactants with deoxyribonucleic acid, Physical chemistry
chemical physics : PCCP, 9 (2007) 1616-1628.
[111] K.K. Ewert, A. Ahmad, H.M. Evans, C.R. Safinya, Cationic lipid-DNA complexes for non-
viral gene therapy: relating supramolecular structures to cellular pathways, Expert opinion on
biological therapy, 5 (2005) 33-53.
BIBLIOGRAPHY
127
[112] A.J. Lin, N.L. Slack, A. Ahmad, C.X. George, C.E. Samuel, C.R. Safinya, Three-Dimensional
Imaging of Lipid Gene-Carriers: Membrane Charge Density Controls Universal Transfection
Behavior in Lamellar Cationic Liposome-DNA Complexes, Biophys. J., 84 (2003) 3307-3316.
[113] I. Badea, Gemini Cationic Surfactant-Based Delivery Systems for Non-Invasive Cutaneous
Gene Therapy, in: College of Pharmacy and Nutrition, University of Saskatchewan, Saskatoon,
Saskatchewan, Canada, 2006, pp. 237.
[114] T. Alejo, M.D. Merchán, M.M. Velázquez, Specific ion effects on the properties of cationic
Gemini surfactant monolayers, Thin Solid Films, 519 (2011) 5689-5695.
[115] D. Yu, X. Huang, M. Deng, Y. Lin, L. Jiang, J. Huang, Y. Wang, Effects of inorganic and
organic salts on aggregation behavior of cationic gemini surfactants, The journal of physical
chemistry. B, 114 (2010) 14955-14964.
[116] N. Jiang, P. Li, Y. Wang, J. Wang, H. Yan, R.K. Thomas, Micellization of Cationic Gemini
Surfactants with Various Counterions and Their Interaction with DNA in Aqueous Solution, J. Phys.
Chem. B, 108 (2004) 15385-15391.
[117] S. Manet, Y. Karpichev, D. Dedovets, R. Oda, Effect of Hofmeister and alkylcarboxylate
anionic counterions on the Krafft temperature and melting temperature of cationic gemini surfactants,
Langmuir : the ACS journal of surfaces and colloids, 29 (2013) 3518-3526.
[118] C. Aimé, S. Manet, T. Satoh, H. Ihara, K.-Y. Park, F. Godde, R. Oda, Self-Assembly of
Nucleoamphiphiles: Investigating Nucleosides Effect and the Mechanism of Micrometric Helix
Formation, Langmuir : the ACS journal of surfaces and colloids, 23 (2007) 12875-12885.
[119] A. Brizard, C. Aimé, T. Labrot, I. Huc, D. Berthier, F. Artzner, B. Desbat, R. Oda, Counterion,
Temperature, and Time Modulation of Nanometric Chiral Ribbons from Gemini-Tartrate
Amphiphiles, Journal of the American Chemical Society, 129 (2007) 3754-3762.
[120] A. Brizard, R.K. Ahmad, R. Oda, Control of nano-micrometric twist and helical ribbon
formation with gemini-oligoalanine via interpeptidic [small beta]-sheet structure formation, Chemical
Communications, (2007) 2275-2277.
[121] Y. Wang, B. Desbat, S. Manet, C. Aime, T. Labrot, R. Oda, Aggregation behaviors of gemini
nucleotide at the air-water interface and in solutions induced by adenine-uracil interaction, Journal of
colloid and interface science, 283 (2005) 555-564.
[122] W. Kunz, P. Lo Nostro, B.W. Ninham, The present state of affairs with Hofmeister effects,
Current Opinion in Colloid & Interface Science, 9 (2004) 1-18.
[123] S. Manet, Y. Karpichev, D. Bassani, R. Kiagus-Ahmad, R. Oda, Counteranion effect on
micellization of cationic gemini surfactants 14-2-14: Hofmeister and other counterions, Langmuir :
the ACS journal of surfaces and colloids, 26 (2010) 10645-10656.
[124] R. Oda, I. Huc, J.-C. Homo, B. Heinrich, M. Schmutz, S. Candau, Elongated Aggregates
Formed by Cationic Gemini Surfactants, Langmuir : the ACS journal of surfaces and colloids, 15
(1999) 2384-2390.
[125] Y. Kim, T. Kim, H. Chung, I. Kwon, S. Jeong, Counterion effects on transfection activity of
cationic lipid emulsion, Biotechnol. Bioprocess Eng., 6 (2001) 279-283.
[126] A.M. Aberle, M.J. Bennett, R.W. Malone, M.H. Nantz, The counterion influence on cationic
lipid-mediated transfection of plasmid DNA, Biochimica et Biophysica Acta (BBA) - Lipids and
Lipid Metabolism, 1299 (1996) 281-283.
[127] S. Franceschi, O. Bordeau, C. Millerioux, E. Perez, P. Vicendo, I. Rico-Lattes, A. Moisand,
Highly Compacted DNA-Polymer Complexes Obtained via New Polynorbornene Polycationic
BIBLIOGRAPHY
128
Latexes with Lactobionate Counterion, Langmuir : the ACS journal of surfaces and colloids, 18
(2002) 1743-1747.
[128] T. Noël, S. Franceschi, E. Perez, P. Vicendo, I. Rico-Lattes, High Compacted DNA−Polymer
Complexes via New Polynorbornene Polycationic Latexes with Acetate Counterion, Langmuir : the
ACS journal of surfaces and colloids, 16 (2000) 8980-8983.
[129] E. Serres, P. Vicendo, E. Perez, T. Noel, I. Rico-Lattes, DNA Condensation and Transfection of
Cells in Culture by a New Polynorbornane Polycationic Polymer, Langmuir : the ACS journal of
surfaces and colloids, 15 (1999) 6956-6960.
[130] S. Asgatay, S. Franceschi-Messant, E. Perez, P. Vicendo, I. Rico-Lattes, E. Phez, M.P. Rols,
Polynorbornene polycationic polymers as gene transfer agents: Influence of the counterion for in vitro
transfection, International Journal of Pharmaceutics, 285 (2004) 121-133.
[131] R. Oda, I. Huc, S.J. Candau, Gemini Surfactants as New, Low Molecular Weight Gelators of
Organic Solvents and Water, Angewandte Chemie International Edition, 37 (1998) 2689-2691.
[132] N. Nafissi, R. Slavcev, Construction and characterization of an in-vivo linear covalently closed
DNA vector production system, Microbial cell factories, 11 (2012) 154.
[133] F.M. Menger, J.S. Keiper, Gemini Surfactants, Angewandte Chemie (International ed. in
English), 39 (2000) 1906-1920.
[134] N. Jiang, P. Li, Y. Wang, J. Wang, H. Yan, R.K. Thomas, Micellization of Cationic Gemini
Surfactants with Various Counterions and Their Interaction with DNA in Aqueous Solution, The
Journal of Physical Chemistry B, 108 (2004) 15385-15391.
[135] J. Aslam, U. Siddiqui, W. Ansari, D. Kabir ud, Micellization Studies of Dicationic Gemini
Surfactants (m-2-m Type) in the Presence of Various Counter- and Co-Ions, J Surfact Deterg, 16
(2013) 693-707.
[136] A. Brizard, D. Berthier, C. Aime, T. Buffeteau, D. Cavagnat, L. Ducasse, I. Huc, R. Oda,
Molecular and supramolecular chirality in gemini-tartrate amphiphiles studied by electronic and
vibrational circular dichroisms, Chirality, 21 Suppl 1 (2009) E153-162.
[137] C. Aime, S. Manet, T. Satoh, H. Ihara, K.Y. Park, F. Godde, R. Oda, Self-assembly of
nucleoamphiphiles: investigating nucleosides effect and the mechanism of micrometric helix
formation, Langmuir : the ACS journal of surfaces and colloids, 23 (2007) 12875-12885.
[138] E. Fisicaro, C. Compari, F. Bacciottini, N. Barbero, G. Viscardi, P. Quagliotto, Is the
counterion responsible for the unusual thermodynamic behaviour of the aqueous solutions of gemini
bispyridinium surfactants?, Colloids and Surfaces A: Physicochemical and Engineering Aspects, 443
(2014) 249-254.
[139] C. Huh, S.G. Mason, A rigorous theory of ring tensiometry, Colloid Polym Sci, 253 (1975)
566-580.
[140] D.N. Furlong, P.A. Freeman, I.M. Metcalfe, L.R. White, Wall effects in du Nouy ring
tensiometry. Theory and experiment, Journal of the Chemical Society, Faraday Transactions 1:
Physical Chemistry in Condensed Phases, 79 (1983) 1701-1719.
[141] P.Y. Lee, J. Costumbrado, C.Y. Hsu, Y.H. Kim, Agarose gel electrophoresis for the separation
of DNA fragments, Journal of visualized experiments : JoVE, (2012).
[142] P.R.R.a.N. Raju, Gel-Electrophoresis and Its Applications (Chapter-2), in: S. Magdeldin (Ed.)
Gel Electrophoresis – Principles and Basics, In Tech, Croatia, 2012.
[143] S. Wettig, I. Badea, M. Donkuru, R. Verrall, M. Foldvari, Structural and transfection properties
of amine-substituted gemini surfactant-based nanoparticles, J Gene Med, 9 (2007) 649 - 658.
BIBLIOGRAPHY
129
[144] A. Laouini, C. Jaafar-Maalej, I. Limayem-Blouza, S. Sfar, C. Charcosset, H. Fessi, Preparation,
Characterization and Applications of Liposomes: State of the Art, Journal of Colloid Science and
Biotechnology, 1 (2012) 147-168.
[145] H. Wang, T. Kaur, N. Tavakoli, J. Joseph, S. Wettig, Transfection and structural properties of
phytanyl substituted gemini surfactant-based vectors for gene delivery, Phys. Chem. Chem. Phys., 15
(2013) 20510-20516.
[146] A.L. Barran-Berdon, S.K. Misra, S. Datta, M. Munoz-Ubeda, P. Kondaiah, E. Junquera, S.
Bhattacharya, E. Aicart, Cationic gemini lipids containing polyoxyethylene spacers as improved
transfecting agents of plasmid DNA in cancer cells, Journal of Materials Chemistry B, 2 (2014) 4640-
4652.
[147] R.N.B. Robert T. Morrison, Organic Chemistry, Sixth Edition, Prentice-Hall Inc., USA, 1992.
[148] H.-P. Lin, C.-P. Kao, C.-Y. Mou, S.-B. Liu, Counterion Effect in Acid Synthesis of
Mesoporous Silica Materials, The Journal of Physical Chemistry B, 104 (2000) 7885-7894.
[149] L. Gaillon, J. Lelièvre, R. Gaboriaud, Counterion Effects in Aqueous Solutions of Cationic
Surfactants: Electromotive Force Measurements and Thermodynamic Model, Journal of colloid and
interface science, 213 (1999) 287-297.
[150] M.M. Knock, C.D. Bain, Effect of Counterion on Monolayers of
Hexadecyltrimethylammonium Halides at the Air−Water Interface, Langmuir : the ACS journal of
surfaces and colloids, 16 (2000) 2857-2865.
[151] L. Abezgauz, K. Kuperkar, P.A. Hassan, O. Ramon, P. Bahadur, D. Danino, Effect of
Hofmeister anions on micellization and micellar growth of the surfactant cetylpyridinium chloride,
Journal of colloid and interface science, 342 (2010) 83-92.
[152] L. Wattebled, A. Laschewsky, Effects of Organic Salt Additives on the Behavior of Dimeric
(“Gemini”) Surfactants in Aqueous Solution, Langmuir : the ACS journal of surfaces and colloids, 23
(2007) 10044-10052.
[153] Y. He, Y. Shang, S. Shao, H. Liu, Y. Hu, Micellization of cationic gemini surfactant and its
interaction with DNA in dilute brine, J. Colloid Interface Sci., 358 (2011) 513-520.
[154] R. Zana, H. Lévy, D. Danino, Y. Talmon, K. Kwetkat, Mixed Micellization of
Cetyltrimethylammonium Bromide and an Anionic Dimeric (Gemini) Surfactant in Aqueous
Solution, Langmuir : the ACS journal of surfaces and colloids, 13 (1997) 402-408.
[155] K. Tsubone, Y. Arakawa, M.J. Rosen, Structural effects on surface and micellar properties of
alkanediyl-α,ω-bis(sodium N-acyl-β-alaninate) gemini surfactants, Journal of colloid and interface
science, 262 (2003) 516-524.
[156] F. Li, M.J. Rosen, S.B. Sulthana, Surface Properties of Cationic Gemini Surfactants and Their
Interaction with Alkylglucoside or -maltoside Surfactants, Langmuir : the ACS journal of surfaces
and colloids, 17 (2001) 1037-1042.
[157] T. Lu, Y. Lan, C. Liu, J. Huang, Y. Wang, Surface properties, aggregation behavior and
micellization thermodynamics of a class of gemini surfactants with ethyl ammonium headgroups,
Journal of colloid and interface science, 377 (2012) 222-230.
[158] M. Akram, S. Yousuf, T. Sarwar, D. Kabir ud, Micellization and interfacial behavior of 16-E2-
16 in presence of inorganic and organic salt counterions, Colloids and Surfaces A: Physicochemical
and Engineering Aspects, 441 (2014) 281-290.
BIBLIOGRAPHY
130
[159] S. Kolay, K.K. Ghosh, P. Quagliotto, Micellization behavior of [C16-12-C16], 2Br− gemini
surfactant in binary aqueous-solvent mixtures, Colloids and Surfaces A: Physicochemical and
Engineering Aspects, 348 (2009) 234-239.
[160] P. Ajmal Koya, D. Kabir ud, K. Ismail, Micellization and Thermodynamic Parameters of
Butanediyl-1,4-bis(tetradecyldimethylammonium Bromide) Gemini Surfactant at Different
Temperatures: Effect of the Addition of 2-Methoxyethanol, J Solution Chem, 41 (2012) 1271-1281.
[161] R. Nagarajan, C.-C. Wang, Theory of Surfactant Aggregation in Water/Ethylene Glycol Mixed
Solvents, Langmuir : the ACS journal of surfaces and colloids, 16 (2000) 5242-5251.
[162] X. Wang, J. Wang, Y. Wang, H. Yan, Salt effect on the complex formation between cationic
gemini surfactant and anionic polyelectrolyte in aqueous solution, Langmuir : the ACS journal of
surfaces and colloids, 20 (2004) 9014-9018.
[163] S.D. Wettig, R.E. Verrall, Thermodynamic Studies of Aqueous m–s–m Gemini Surfactant
Systems, Journal of colloid and interface science, 235 (2001) 310-316.
[164] K.D. Collins, M.W. Washabaugh, The Hofmeister effect and the behaviour of water at
interfaces, Quarterly reviews of biophysics, 18 (1985) 323-422.
[165] N. Vlachy, B. Jagoda-Cwiklik, R. Vácha, D. Touraud, P. Jungwirth, W. Kunz, Hofmeister
series and specific interactions of charged headgroups with aqueous ions, Advances in colloid and
interface science, 146 (2009) 42-47.
[166] Y. Zhang, P.S. Cremer, Interactions between macromolecules and ions: the Hofmeister series,
Current Opinion in Chemical Biology, 10 (2006) 658-663.
[167] A. Renoncourt, N. Vlachy, P. Bauduin, M. Drechsler, D. Touraud, J.M. Verbavatz, M. Dubois,
W. Kunz, B.W. Ninham, Specific Alkali Cation Effects in the Transition from Micelles to Vesicles
through Salt Addition, Langmuir : the ACS journal of surfaces and colloids, 23 (2007) 2376-2381.
[168] B. Thalody, G.G. Warr, The selective binding of anions to gemini and trimeric surfactants at
air/solution interfaces, Aust. J. Chem., 57 (2004) 193-196.
[169] L. Zhou, X. Jiang, Y. Li, Z. Chen, X. Hu, Synthesis and Properties of a Novel Class of Gemini
Pyridinium Surfactants, Langmuir : the ACS journal of surfaces and colloids, 23 (2007) 11404-
11408.
[170] Q. Zhang, Z. Gao, F. Xu, S. Tai, X. Liu, S. Mo, F. Niu, Surface tension and aggregation
properties of novel cationic gemini surfactants with diethylammonium headgroups and a diamido
spacer, Langmuir : the ACS journal of surfaces and colloids, 28 (2012) 11979-11987.
[171] A. Laschewsky, L. Wattebled, M. Arotçaréna, J.-L. Habib-Jiwan, R.H. Rakotoaly, Synthesis
and Properties of Cationic Oligomeric Surfactants, Langmuir : the ACS journal of surfaces and
colloids, 21 (2005) 7170-7179.
[172] S.D. Wettig, X. Li, R.E. Verrall, Thermodynamic and Aggregation Properties of Gemini
Surfactants with Ethoxylated Spacers in Aqueous Solution, Langmuir : the ACS journal of surfaces
and colloids, 19 (2003) 3666-3670.
[173] K.M. Jenkins, S.D. Wettig, R.E. Verrall, Studies of the Aggregation Behavior of Cyclic Gemini
Surfactants, Journal of colloid and interface science, 247 (2002) 456-462.
[174] S.D. Wettig, P. Nowak, R.E. Verrall, Thermodynamic and Aggregation Properties of Gemini
Surfactants with Hydroxyl Substituted Spacers in Aqueous Solution, Langmuir : the ACS journal of
surfaces and colloids, 18 (2002) 5354-5359.
[175] R. Zana, Critical Micellization Concentration of Surfactants in Aqueous Solution and Free
Energy of Micellization, Langmuir : the ACS journal of surfaces and colloids, 12 (1996) 1208-1211.
BIBLIOGRAPHY
131
[176] P. Carpena, J. Aguiar, P. Bernaola-Galván, C. Carnero Ruiz, Problems Associated with the
Treatment of Conductivity−Concentration Data in Surfactant Solutions: Simulations and
Experiments, Langmuir : the ACS journal of surfaces and colloids, 18 (2002) 6054-6058.
[177] D. Tikariha, B. Kumar, N. Singh, K. Ghosh, P. Quagliotto, Micellization Behavior of Cationic
Gemini Surfactants in Aqueous-Ethylene Glycol Solution, J Surfact Deterg, 14 (2011) 555-562.
[178] Q. Zhang, Z. Gao, F. Xu, S. Tai, Effect of hydrocarbon structure of the headgroup on the
thermodynamic properties of micellization of cationic gemini surfactants: An electrical conductivity
study, Journal of colloid and interface science, 371 (2012) 73-81.
[179] R. Zana, M. In, H. Lévy, G. Duportail, Alkanediyl-α,ω-bis(dimethylalkylammonium bromide).
7. Fluorescence Probing Studies of Micelle Micropolarity and Microviscosity, Langmuir : the ACS
journal of surfaces and colloids, 13 (1997) 5552-5557.
[180] X. Li, S.D. Wettig, C. Wang, M. Foldvari, R.E. Verrall, Synthesis and solution properties of
gemini surfactants containing oleyl chains, Physical Chemistry Chemical Physics, 7 (2005) 3172-
3178.
[181] B.L. Bales, M. Benrraou, R. Zana, Krafft Temperature and Micelle Ionization of Aqueous
Solutions of Cesium Dodecyl Sulfate, The Journal of Physical Chemistry B, 106 (2002) 9033-9035.
[182] J. Roy, M.N. Islam, G. Aktaruzzaman, The Effect of NaCl on the Krafft Temperature and
Related Behavior of Cetyltrimethylammonium Bromide in Aqueous Solution, J Surfact Deterg, 17
(2014) 231-242.
[183] C. Vautier-Giongo, B.L. Bales, Estimate of the Ionization Degree of Ionic Micelles Based on
Krafft Temperature Measurements, The Journal of Physical Chemistry B, 107 (2003) 5398-5403.
[184] Z. Chu, Y. Feng, Empirical Correlations between Krafft Temperature and Tail Length for
Amidosulfobetaine Surfactants in the Presence of Inorganic Salt, Langmuir : the ACS journal of
surfaces and colloids, 28 (2011) 1175-1181.
[185] H. Eagle, The effect of environmental pH on the growth of normal and malignant cells, Journal
of Cellular Physiology, 82 (1973) 1-8.
[186] T. Sato, T. Ishii, Y. Okahata, In vitro gene delivery mediated by chitosan. effect of pH, serum,
and molecular mass of chitosan on the transfection efficiency, Biomaterials, 22 (2001) 2075-2080.
[187] A. Colomer, A. Pinazo, M.T. García, M. Mitjans, M.P. Vinardell, M.R. Infante, V. Martínez, L.
Pérez, pH-Sensitive Surfactants from Lysine: Assessment of Their Cytotoxicity and Environmental
Behavior, Langmuir : the ACS journal of surfaces and colloids, 28 (2012) 5900-5912.
[188] M. Munoz-Ubeda, S.K. Misra, A.L. Barran-Berdon, C. Aicart-Ramos, M.B. Sierra, J. Biswas,
P. Kondaiah, E. Junquera, S. Bhattacharya, E. Aicart, Why is less cationic lipid required to prepare
lipoplexes from plasmid DNA than linear DNA in gene therapy?, J Am Chem Soc, 133 (2011)
18014-18017.
[189] M. Muñoz-Úbeda, S.K. Misra, A.L. Barrán-Berdón, S. Datta, C. Aicart-Ramos, P. Castro-
Hartmann, P. Kondaiah, E. Junquera, S. Bhattacharya, E. Aicart, How Does the Spacer Length of
Cationic Gemini Lipids Influence the Lipoplex Formation with Plasmid DNA? Physicochemical and
Biochemical Characterizations and their Relevance in Gene Therapy, Biomacromolecules, 13 (2012)
3926-3937.
[190] J. Akbar, N. Tavakoli, D. Gerrard Marangoni, S.D. Wettig, Mixed aggregate formation in
gemini surfactant/1,2-dialkyl-sn-glycero-3-phosphoethanolamine systems, J. Colloid Interface Sci.,
377 (2012) 237-243.
BIBLIOGRAPHY
132
[191] J. Panyam, V. Labhasetwar, Biodegradable nanoparticles for drug and gene delivery to cells
and tissue, Advanced Drug Delivery Reviews, 64, Supplement (2012) 61-71.
[192] J. Rejman, V. Oberle, I.S. Zuhorn, D. Hoekstra, Size-dependent internalization of particles via
the pathways of clathrin- and caveolae-mediated endocytosis, Biochem J, 377 (2004) 159-169.
[193] S. Honary, F. Zahir, Effect of Zeta Potential on the Properties of Nano-Drug Delivery Systems -
A Review (Part 1), Trop. J. Pharm. Res., 12 (2013) 255-264.
[194] S. Patil, A. Sandberg, E. Heckert, W. Self, S. Seal, Protein adsorption and cellular uptake of
cerium oxide nanoparticles as a function of zeta potential, Biomaterials, 28 (2007) 4600-4607.
[195] A. Eisenthal, K. Eytan, E. Brazowski, G. Gitstein, R. Greenberg, Y. Skornick, Effects of 5-FU
on DNA synthesis and cytotoxicity of human lymphocytes induced by IL-2, TGF-beta3 and PGE2,
Anticancer research, 29 (2009) 3925-3930.
[196] T. Shirasaka, Y. Shimamato, H. Ohshimo, M. Yamaguchi, T. Kato, K. Yonekura, M.
Fukushima, Development of a novel form of an oral 5-fluorouracil derivative (S-1) directed to the
potentiation of the tumor selective cytotoxicity of 5-fluorouracil by two biochemical modulators,
Anti-cancer drugs, 7 (1996) 548-557.
[197] S. Prabha, W.Z. Zhou, J. Panyam, V. Labhasetwar, Size-dependency of nanoparticle-mediated
gene transfection: studies with fractionated nanoparticles, Int J Pharm, 244 (2002) 105-115.
[198] M. Desai, V. Labhasetwar, E. Walter, R. Levy, G. Amidon, The Mechanism of Uptake of
Biodegradable Microparticles in Caco-2 Cells Is Size Dependent, Pharm Res, 14 (1997) 1568-1573.
[199] M. Desai, V. Labhasetwar, G. Amidon, R. Levy, Gastrointestinal Uptake of Biodegradable
Microparticles: Effect of Particle Size, Pharm Res, 13 (1996) 1838-1845.
[200] M. Foldvari, Wettig, S., Badea, I., Verrall, R., Bagonluri, M., Dicationic gemini surfactant gene
delivery complexes contain cubic-lamellar mixed polymorphic phase., NSTI-Nanotech, 2 (2006) 400-
403.
[201] M. Foldvari, I. Badea, S. Wettig, R. Verrall, M. Bagonluri, Structural characterization of novel
gemini non-viral DNA delivery systems for cutaneous gene therapy, J Exp Nanosci, 1 (2006) 165 -
176.
[202] Q. Wang, P. Liu, Y. Sun, H. Wu, X. Li, Y. Duan, Z. Zhang, Pluronic-poly[alpha-(4-
aminobutyl)-1-glycolic acid] polymeric micelle-like nanoparticles as carrier for drug delivery, Journal
of nanoscience and nanotechnology, 14 (2014) 4843-4850.
[203] H. Li, C. Yu, R. Chen, J. Li, J. Li, Novel ionic liquid-type Gemini surfactants: Synthesis,
surface property and antimicrobial activity, Colloids and Surfaces A: Physicochemical and
Engineering Aspects, 395 (2012) 116-124.
[204] A.R. Tehrani-Bagha, K. Holmberg, Cationic Ester-Containing Gemini Surfactants:
Physical−Chemical Properties, Langmuir : the ACS journal of surfaces and colloids, 26 (2010) 9276-
9282.

APPENDIX
133
Appendix
A-1.1: Atomic details and 1H NMR spectral analysis of 1-halohexadecane:
The structure of the 1-halohexadecane (Cetyl halide) is as following –
CH3 – CH2 – (CH2)12 – CH2 – +CH2 – X
–
Atomic details:
Total Carbon, (C) = 16
Total Hydrogen, (H) = 33
Total Halide, (X–) = 1 (X
– = Bromide or Chloride)
C
X
A
E D B
Figure-A-1.1: Assignment of protons in the 1-Halohexadecane structure used in the
interpretation of 1H NMR spectra.
Category / Name of the Proton Total number of proton for that category
A 3
B 2
C 24
D 2
E 2
TOTAL for all category 33 Protons
CDCl3 E D B C A
Figure-A-1.2: Identification of 1H NMR peaks of protons of 1-halohexadecane (in CDCl3)
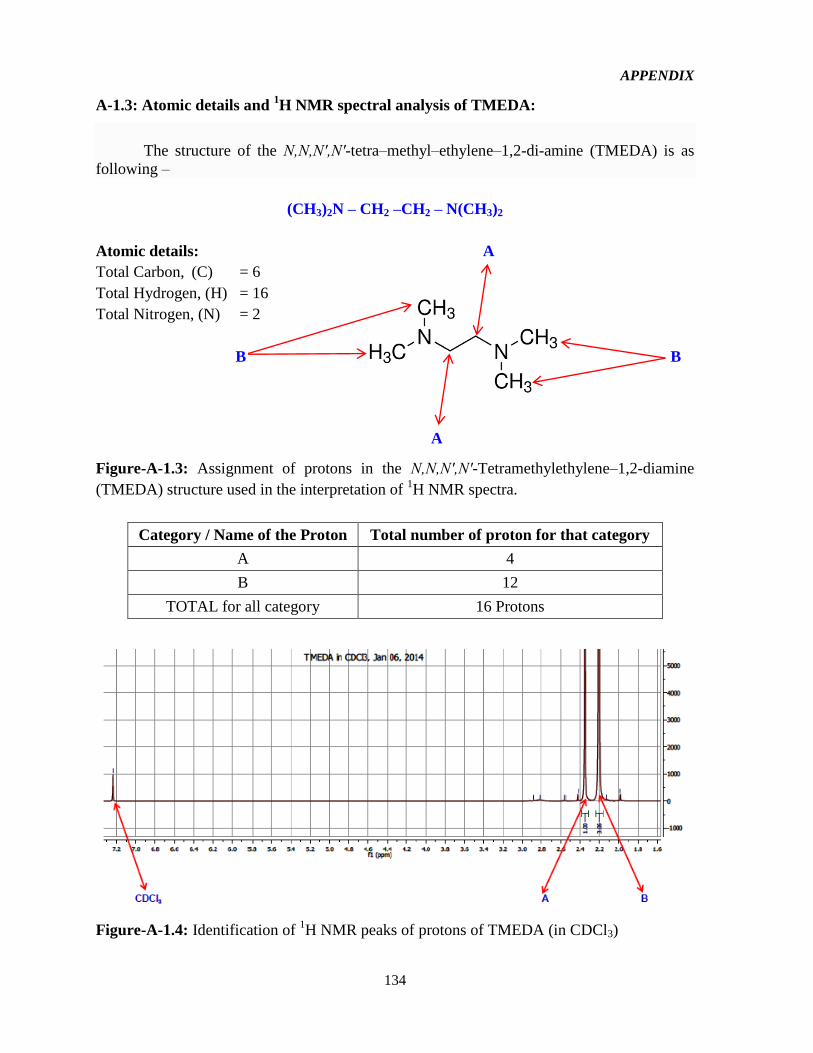
APPENDIX
134
A-1.3: Atomic details and 1H NMR spectral analysis of TMEDA:
The structure of the N,N,N′,N′-tetra–methyl–ethylene–1,2-di-amine (TMEDA) is as
following –
(CH3)2N – CH2 –CH2 – N(CH3)2
Atomic details: A
Total Carbon, (C) = 6
Total Hydrogen, (H) = 16
Total Nitrogen, (N) = 2
B B
A
Figure-A-1.3: Assignment of protons in the N,N,N′,N′-Tetramethylethylene–1,2-diamine
(TMEDA) structure used in the interpretation of 1H NMR spectra.
Category / Name of the Proton Total number of proton for that category
A 4
B 12
TOTAL for all category 16 Protons
Figure-A-1.4: Identification of 1H NMR peaks of protons of TMEDA (in CDCl3)
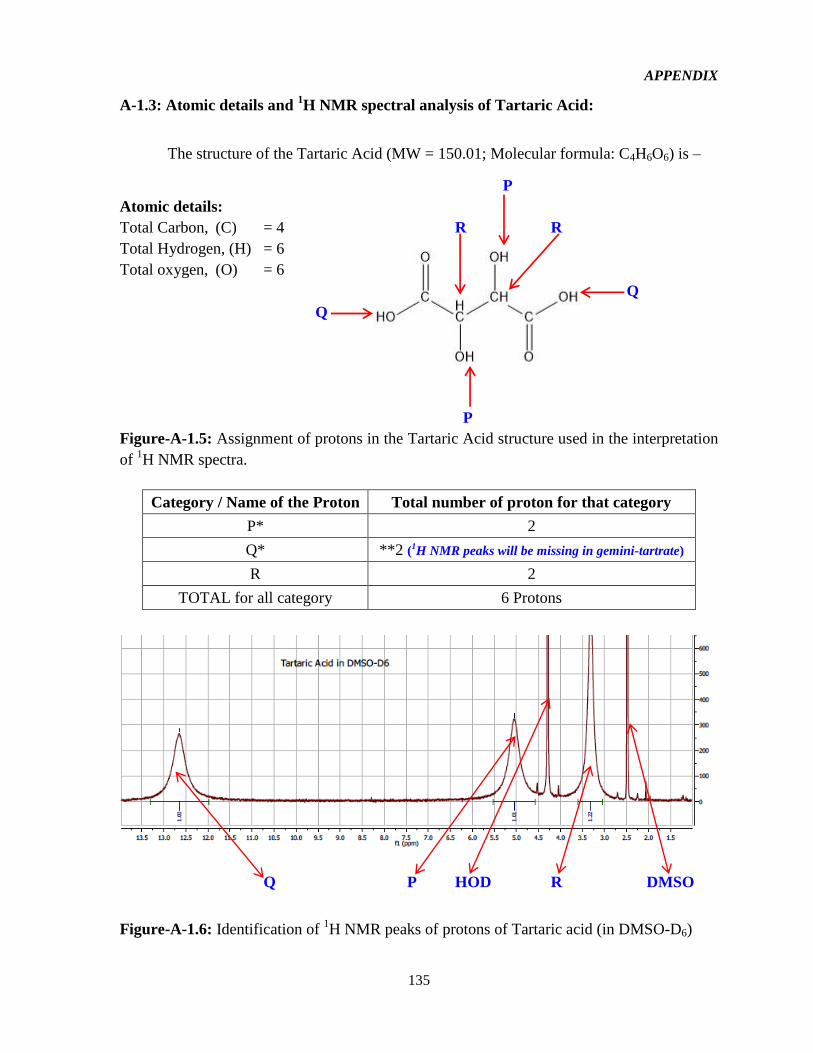
APPENDIX
135
A-1.3: Atomic details and 1H NMR spectral analysis of Tartaric Acid:
The structure of the Tartaric Acid (MW = 150.01; Molecular formula: C4H6O6) is –
P
Atomic details:
Total Carbon, (C) = 4 R R
Total Hydrogen, (H) = 6
Total oxygen, (O) = 6
Q
Q
P
Figure-A-1.5: Assignment of protons in the Tartaric Acid structure used in the interpretation
of 1H NMR spectra.
Category / Name of the Proton Total number of proton for that category
P* 2
Q* **2 (1H NMR peaks will be missing in gemini-tartrate)
R 2
TOTAL for all category 6 Protons
Q P HOD R DMSO
Figure-A-1.6: Identification of 1H NMR peaks of protons of Tartaric acid (in DMSO-D6)
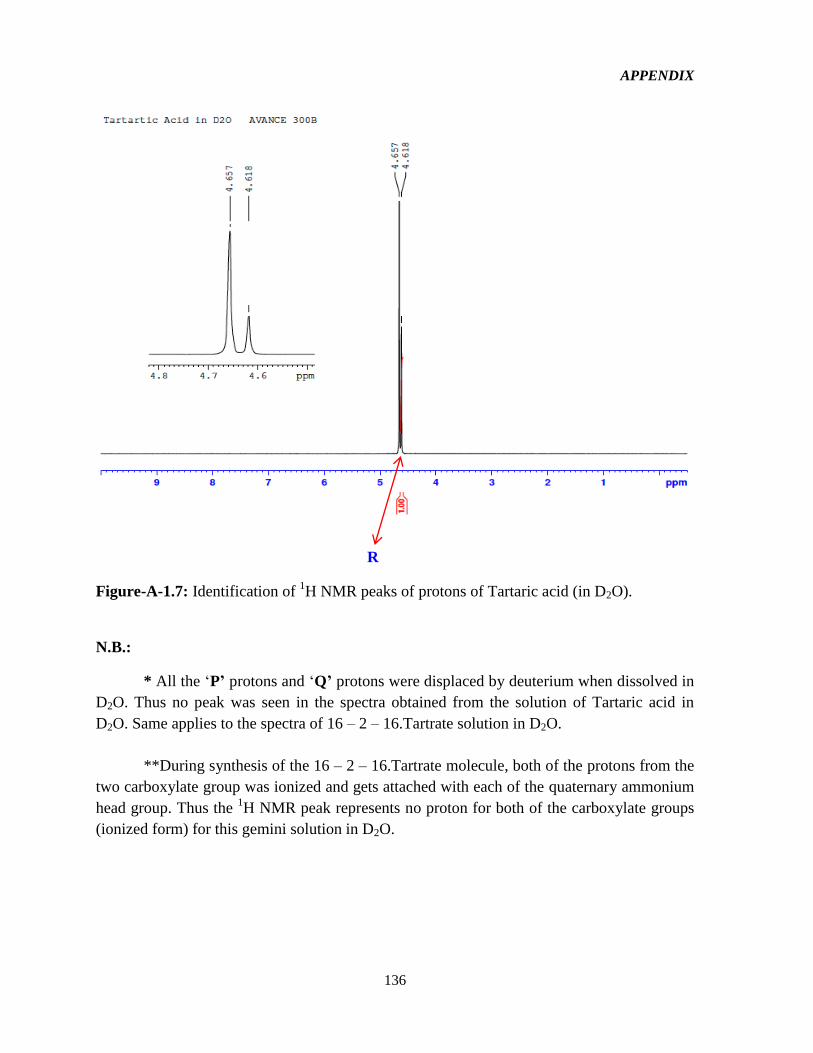
APPENDIX
136
R
Figure-A-1.7: Identification of 1H NMR peaks of protons of Tartaric acid (in D2O).
N.B.:
* All the ‘P’ protons and ‘Q’ protons were displaced by deuterium when dissolved in
D2O. Thus no peak was seen in the spectra obtained from the solution of Tartaric acid in
D2O. Same applies to the spectra of 16 – 2 – 16.Tartrate solution in D2O.
**During synthesis of the 16 – 2 – 16.Tartrate molecule, both of the protons from the
two carboxylate group was ionized and gets attached with each of the quaternary ammonium
head group. Thus the 1H NMR peak represents no proton for both of the carboxylate groups
(ionized form) for this gemini solution in D2O.
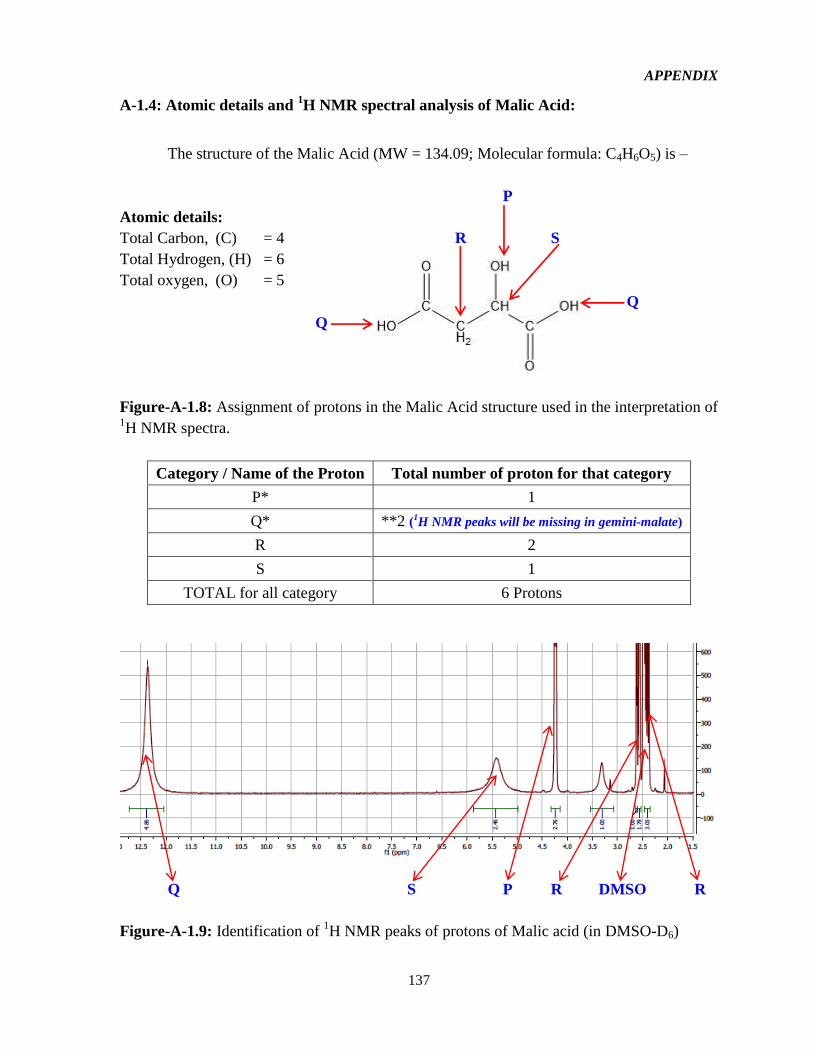
APPENDIX
137
A-1.4: Atomic details and 1H NMR spectral analysis of Malic Acid:
The structure of the Malic Acid (MW = 134.09; Molecular formula: C4H6O5) is –
P
Atomic details:
Total Carbon, (C) = 4 R S
Total Hydrogen, (H) = 6
Total oxygen, (O) = 5
Q
Q
Figure-A-1.8: Assignment of protons in the Malic Acid structure used in the interpretation of 1H NMR spectra.
Category / Name of the Proton Total number of proton for that category
P* 1
Q* **2 (1H NMR peaks will be missing in gemini-malate)
R 2
S 1
TOTAL for all category 6 Protons
Q S P R DMSO R
Figure-A-1.9: Identification of 1H NMR peaks of protons of Malic acid (in DMSO-D6)
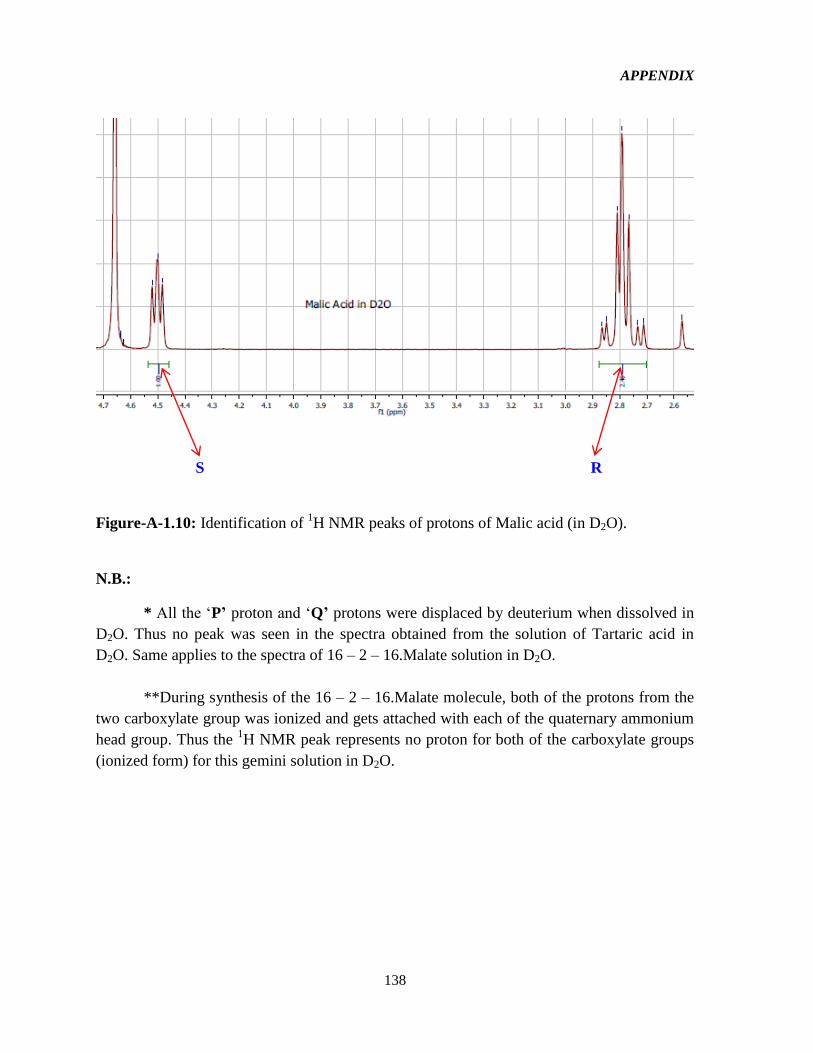
APPENDIX
138
S R
Figure-A-1.10: Identification of 1H NMR peaks of protons of Malic acid (in D2O).
N.B.:
* All the ‘P’ proton and ‘Q’ protons were displaced by deuterium when dissolved in
D2O. Thus no peak was seen in the spectra obtained from the solution of Tartaric acid in
D2O. Same applies to the spectra of 16 – 2 – 16.Malate solution in D2O.
**During synthesis of the 16 – 2 – 16.Malate molecule, both of the protons from the
two carboxylate group was ionized and gets attached with each of the quaternary ammonium
head group. Thus the 1H NMR peak represents no proton for both of the carboxylate groups
(ionized form) for this gemini solution in D2O.
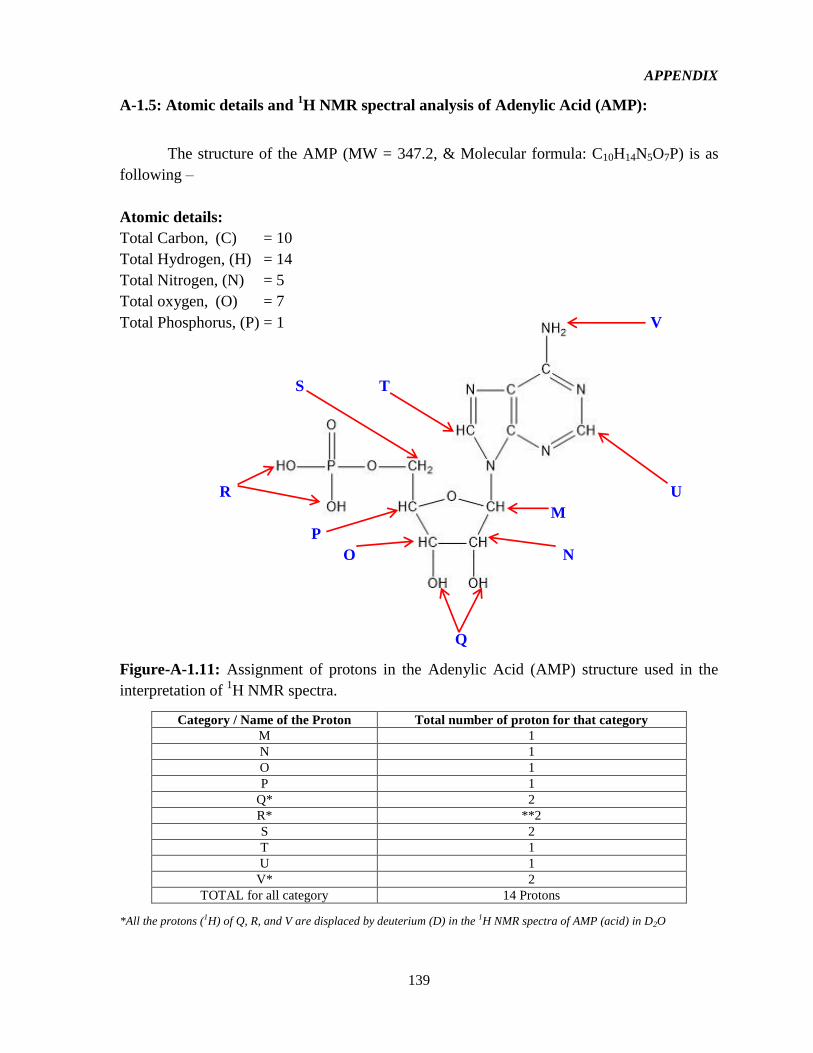
APPENDIX
139
A-1.5: Atomic details and 1H NMR spectral analysis of Adenylic Acid (AMP):
The structure of the AMP (MW = 347.2, & Molecular formula: C10H14N5O7P) is as
following –
Atomic details:
Total Carbon, (C) = 10
Total Hydrogen, (H) = 14
Total Nitrogen, (N) = 5
Total oxygen, (O) = 7
Total Phosphorus, (P) = 1 V
S T
R U
M
P
O N
Q
Figure-A-1.11: Assignment of protons in the Adenylic Acid (AMP) structure used in the
interpretation of 1H NMR spectra.
Category / Name of the Proton Total number of proton for that category
M 1
N 1
O 1
P 1
Q* 2
R* **2
S 2
T 1
U 1
V* 2
TOTAL for all category 14 Protons
*All the protons (1H) of Q, R, and V are displaced by deuterium (D) in the 1H NMR spectra of AMP (acid) in D2O
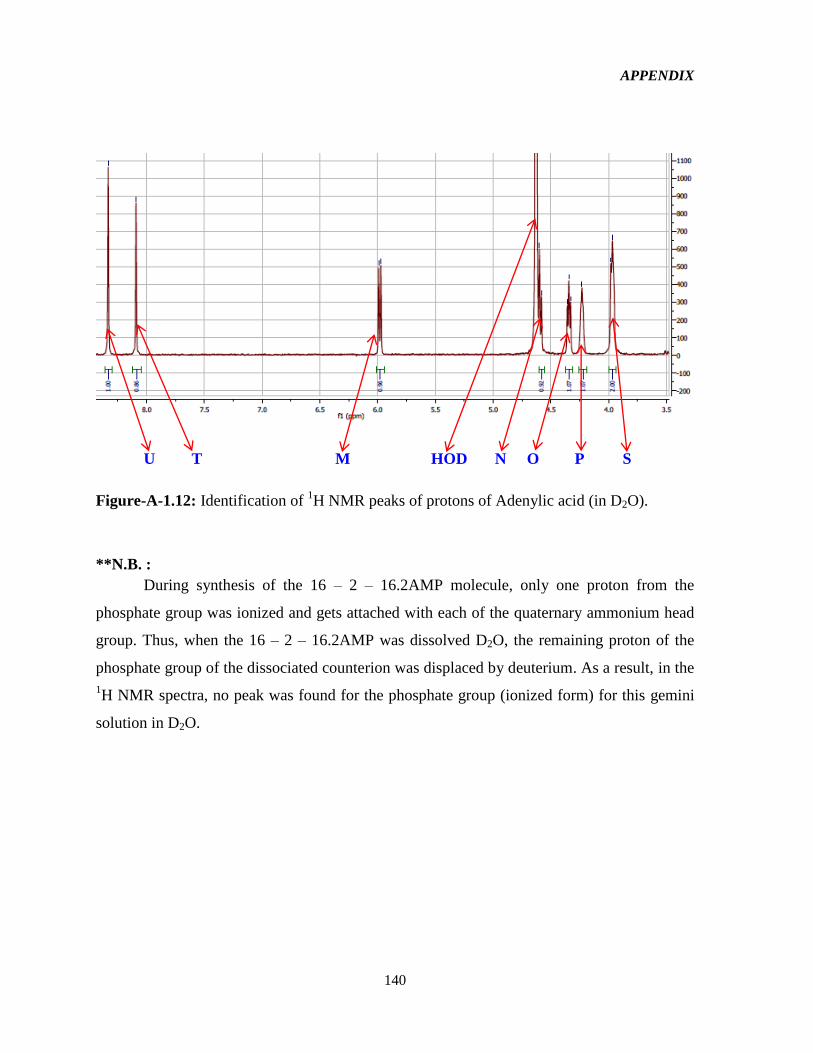
APPENDIX
140
U T M HOD N O P S
Figure-A-1.12: Identification of 1H NMR peaks of protons of Adenylic acid (in D2O).
**N.B. :
During synthesis of the 16 – 2 – 16.2AMP molecule, only one proton from the
phosphate group was ionized and gets attached with each of the quaternary ammonium head
group. Thus, when the 16 – 2 – 16.2AMP was dissolved D2O, the remaining proton of the
phosphate group of the dissociated counterion was displaced by deuterium. As a result, in the
1H NMR spectra, no peak was found for the phosphate group (ionized form) for this gemini
solution in D2O.
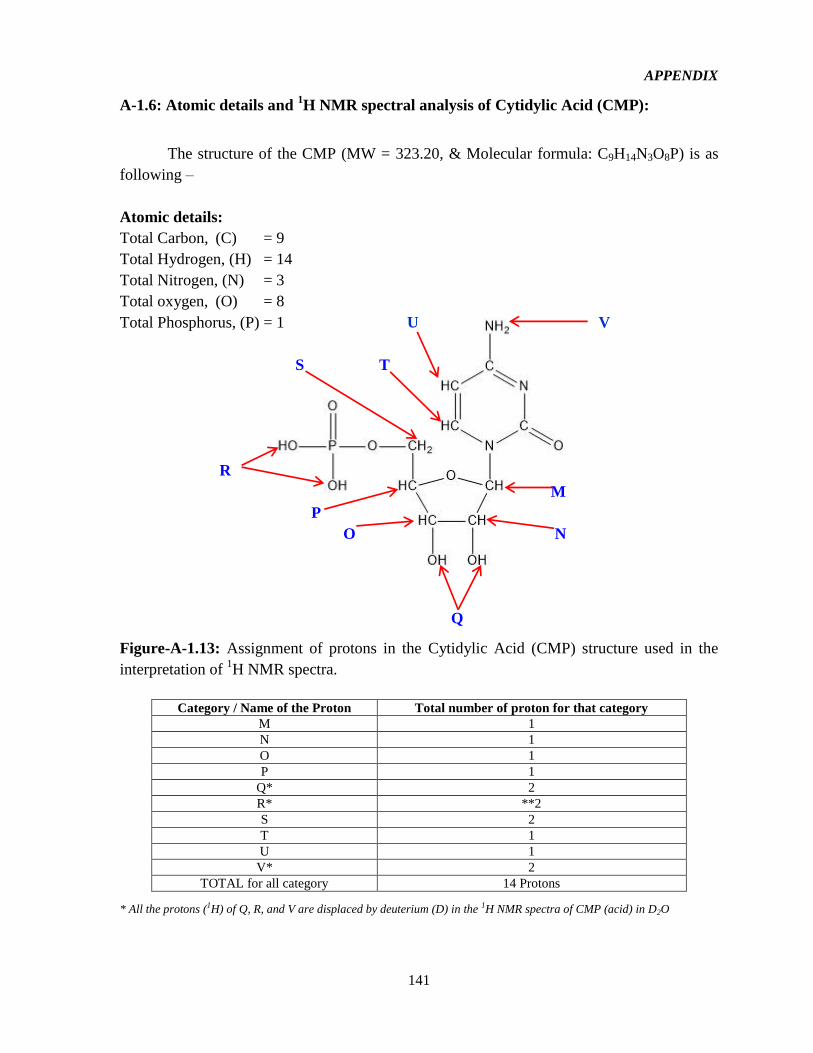
APPENDIX
141
A-1.6: Atomic details and 1H NMR spectral analysis of Cytidylic Acid (CMP):
The structure of the CMP (MW = 323.20, & Molecular formula: C9H14N3O8P) is as
following –
Atomic details:
Total Carbon, (C) = 9
Total Hydrogen, (H) = 14
Total Nitrogen, (N) = 3
Total oxygen, (O) = 8
Total Phosphorus, (P) = 1 U V
S T
R
M
P
O N
Q
Figure-A-1.13: Assignment of protons in the Cytidylic Acid (CMP) structure used in the
interpretation of 1H NMR spectra.
Category / Name of the Proton Total number of proton for that category
M 1
N 1
O 1
P 1
Q* 2
R* **2
S 2
T 1
U 1
V* 2
TOTAL for all category 14 Protons
* All the protons (1H) of Q, R, and V are displaced by deuterium (D) in the 1H NMR spectra of CMP (acid) in D2O
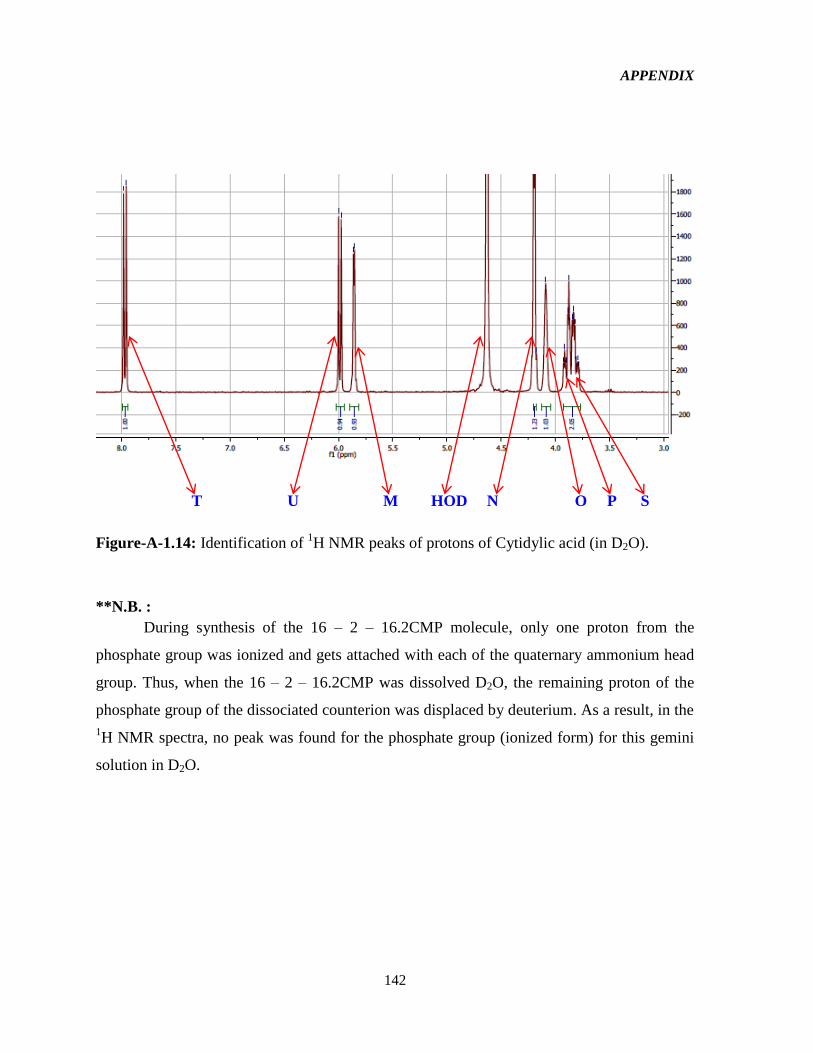
APPENDIX
142
T U M HOD N O P S
Figure-A-1.14: Identification of 1H NMR peaks of protons of Cytidylic acid (in D2O).
**N.B. :
During synthesis of the 16 – 2 – 16.2CMP molecule, only one proton from the
phosphate group was ionized and gets attached with each of the quaternary ammonium head
group. Thus, when the 16 – 2 – 16.2CMP was dissolved D2O, the remaining proton of the
phosphate group of the dissociated counterion was displaced by deuterium. As a result, in the
1H NMR spectra, no peak was found for the phosphate group (ionized form) for this gemini
solution in D2O.
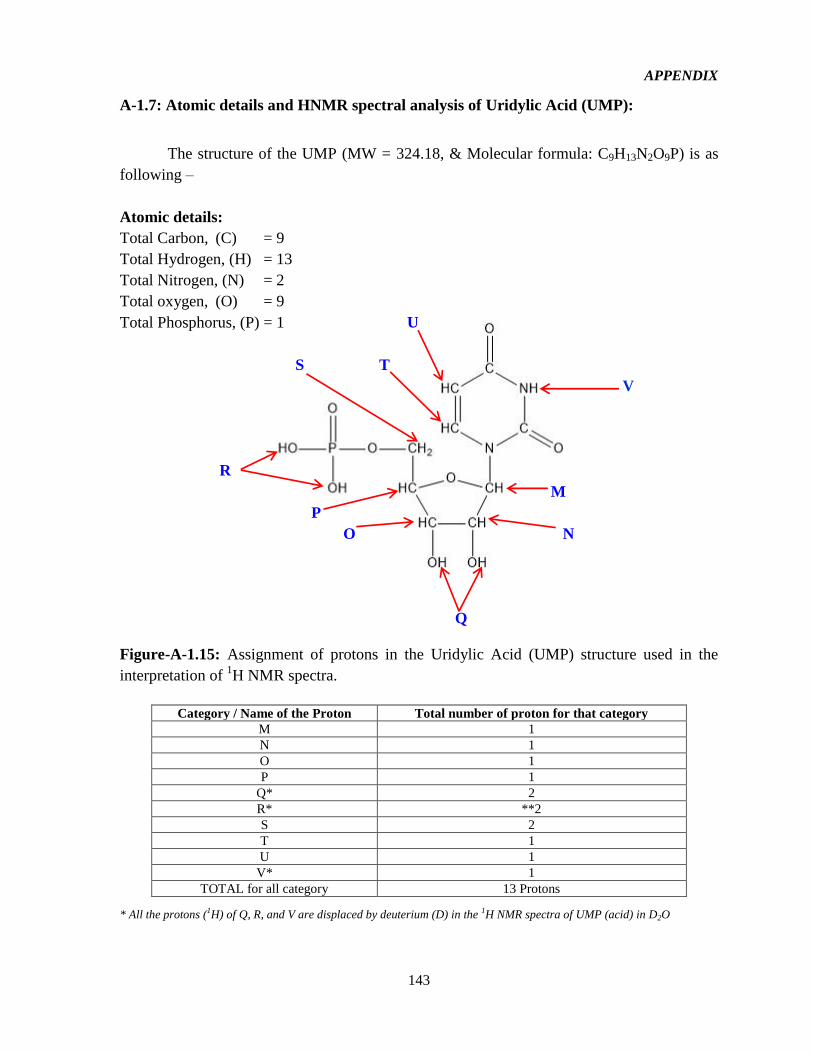
APPENDIX
143
A-1.7: Atomic details and HNMR spectral analysis of Uridylic Acid (UMP):
The structure of the UMP (MW = 324.18, & Molecular formula: C9H13N2O9P) is as
following –
Atomic details:
Total Carbon, (C) = 9
Total Hydrogen, (H) = 13
Total Nitrogen, (N) = 2
Total oxygen, (O) = 9
Total Phosphorus, (P) = 1 U
S T
V
R
M
P
O N
Q
Figure-A-1.15: Assignment of protons in the Uridylic Acid (UMP) structure used in the
interpretation of 1H NMR spectra.
Category / Name of the Proton Total number of proton for that category
M 1
N 1
O 1
P 1
Q* 2
R* **2
S 2
T 1
U 1
V* 1
TOTAL for all category 13 Protons
* All the protons (1H) of Q, R, and V are displaced by deuterium (D) in the 1H NMR spectra of UMP (acid) in D2O
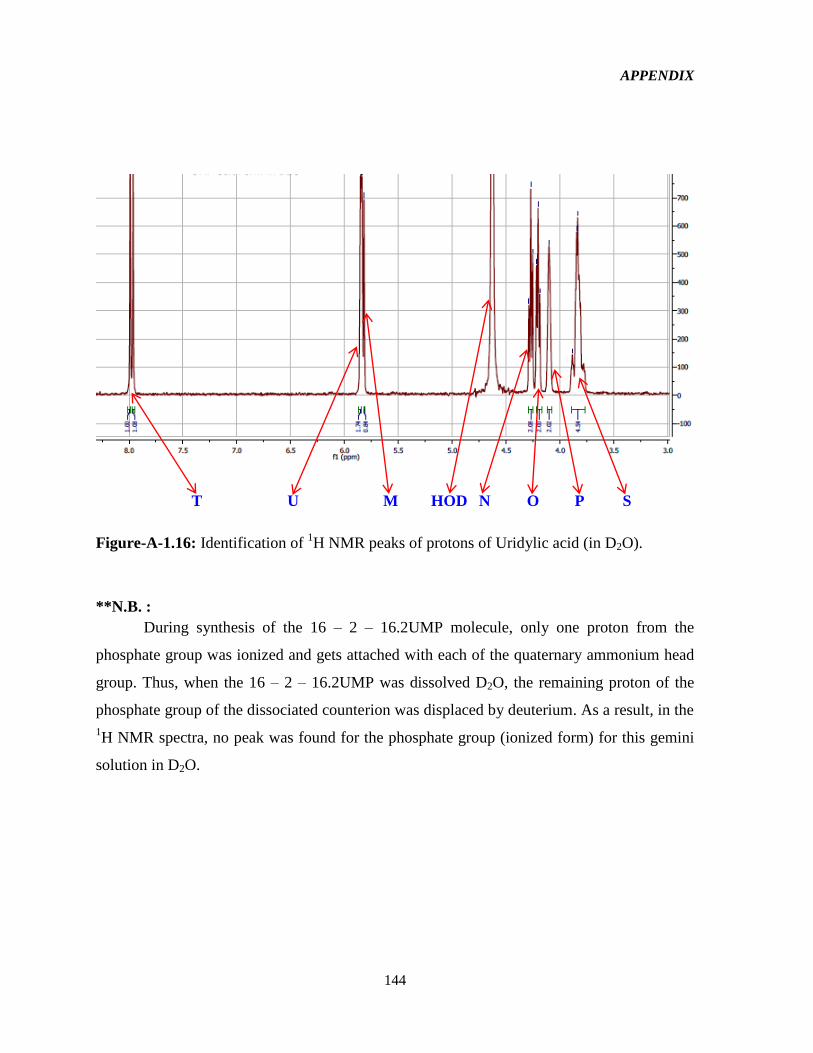
APPENDIX
144
T U M HOD N O P S
Figure-A-1.16: Identification of 1H NMR peaks of protons of Uridylic acid (in D2O).
**N.B. :
During synthesis of the 16 – 2 – 16.2UMP molecule, only one proton from the
phosphate group was ionized and gets attached with each of the quaternary ammonium head
group. Thus, when the 16 – 2 – 16.2UMP was dissolved D2O, the remaining proton of the
phosphate group of the dissociated counterion was displaced by deuterium. As a result, in the
1H NMR spectra, no peak was found for the phosphate group (ionized form) for this gemini
solution in D2O.
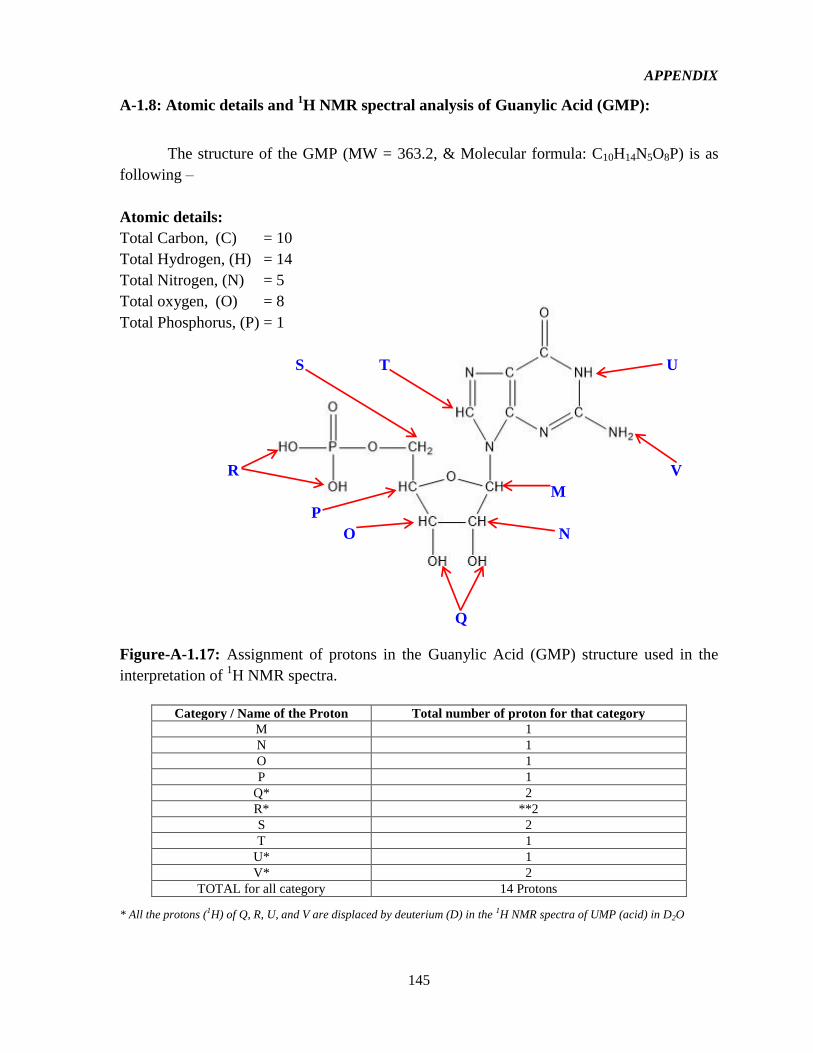
APPENDIX
145
A-1.8: Atomic details and 1H NMR spectral analysis of Guanylic Acid (GMP):
The structure of the GMP (MW = 363.2, & Molecular formula: C10H14N5O8P) is as
following –
Atomic details:
Total Carbon, (C) = 10
Total Hydrogen, (H) = 14
Total Nitrogen, (N) = 5
Total oxygen, (O) = 8
Total Phosphorus, (P) = 1
S T U
R V
M
P
O N
Q
Figure-A-1.17: Assignment of protons in the Guanylic Acid (GMP) structure used in the
interpretation of 1H NMR spectra.
Category / Name of the Proton Total number of proton for that category
M 1
N 1
O 1
P 1
Q* 2
R* **2
S 2
T 1
U* 1
V* 2
TOTAL for all category 14 Protons
* All the protons (1H) of Q, R, U, and V are displaced by deuterium (D) in the 1H NMR spectra of UMP (acid) in D2O
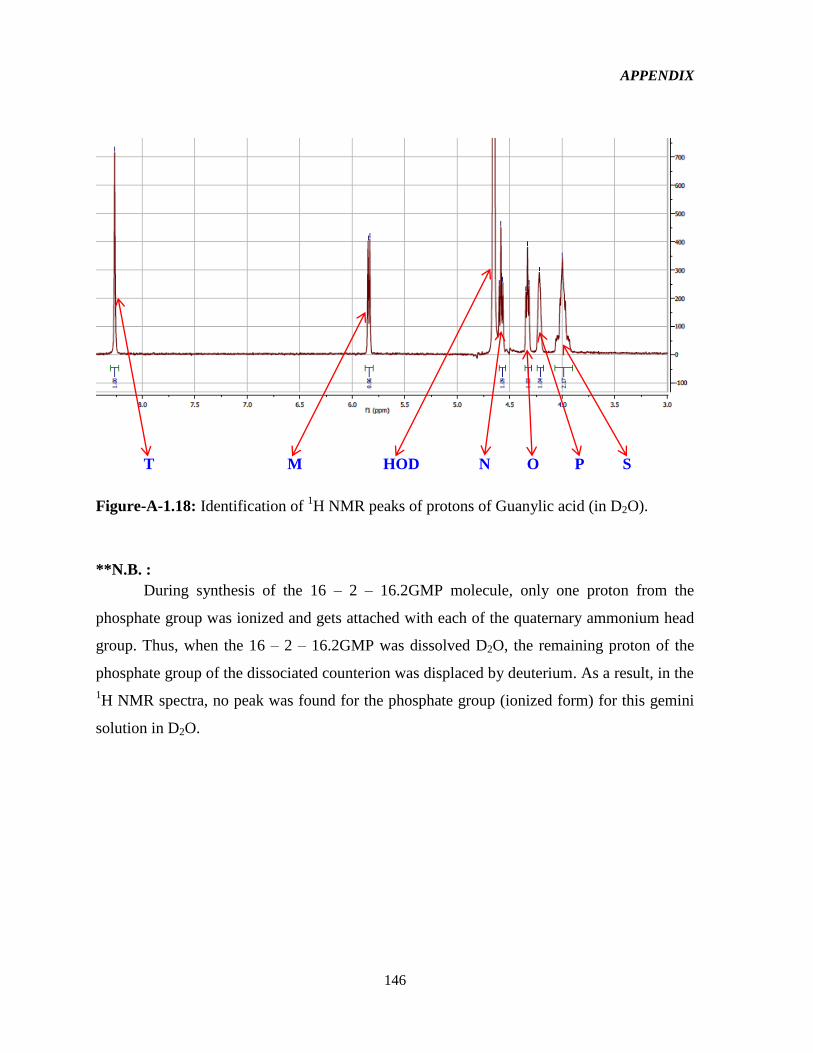
APPENDIX
146
T M HOD N O P S
Figure-A-1.18: Identification of 1H NMR peaks of protons of Guanylic acid (in D2O).
**N.B. :
During synthesis of the 16 – 2 – 16.2GMP molecule, only one proton from the
phosphate group was ionized and gets attached with each of the quaternary ammonium head
group. Thus, when the 16 – 2 – 16.2GMP was dissolved D2O, the remaining proton of the
phosphate group of the dissociated counterion was displaced by deuterium. As a result, in the
1H NMR spectra, no peak was found for the phosphate group (ionized form) for this gemini
solution in D2O.
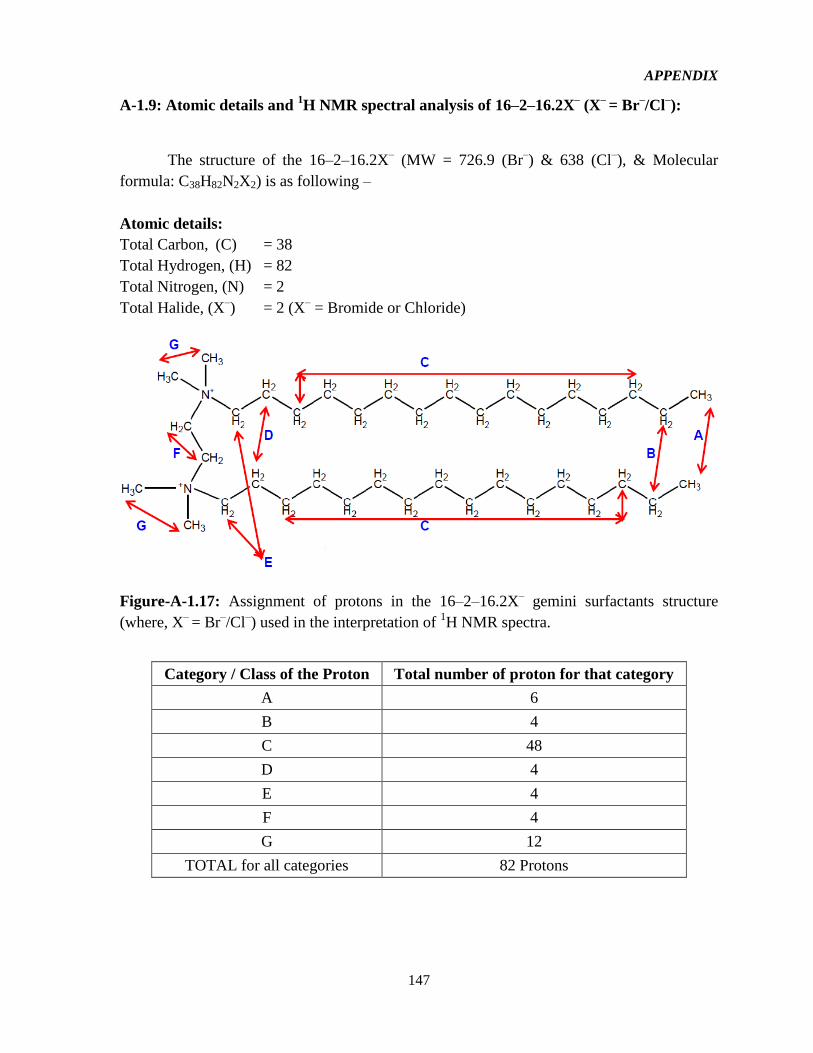
APPENDIX
147
A-1.9: Atomic details and 1H NMR spectral analysis of 16–2–16.2X
– (X
– = Br
–/Cl
–):
The structure of the 16–2–16.2X– (MW = 726.9 (Br
–) & 638 (Cl
–), & Molecular
formula: C38H82N2X2) is as following –
Atomic details:
Total Carbon, (C) = 38
Total Hydrogen, (H) = 82
Total Nitrogen, (N) = 2
Total Halide, (X–) = 2 (X
– = Bromide or Chloride)
Figure-A-1.17: Assignment of protons in the 16–2–16.2X– gemini surfactants structure
(where, X–
= Br–/Cl
–) used in the interpretation of
1H NMR spectra.
Category / Class of the Proton Total number of proton for that category
A 6
B 4
C 48
D 4
E 4
F 4
G 12
TOTAL for all categories 82 Protons
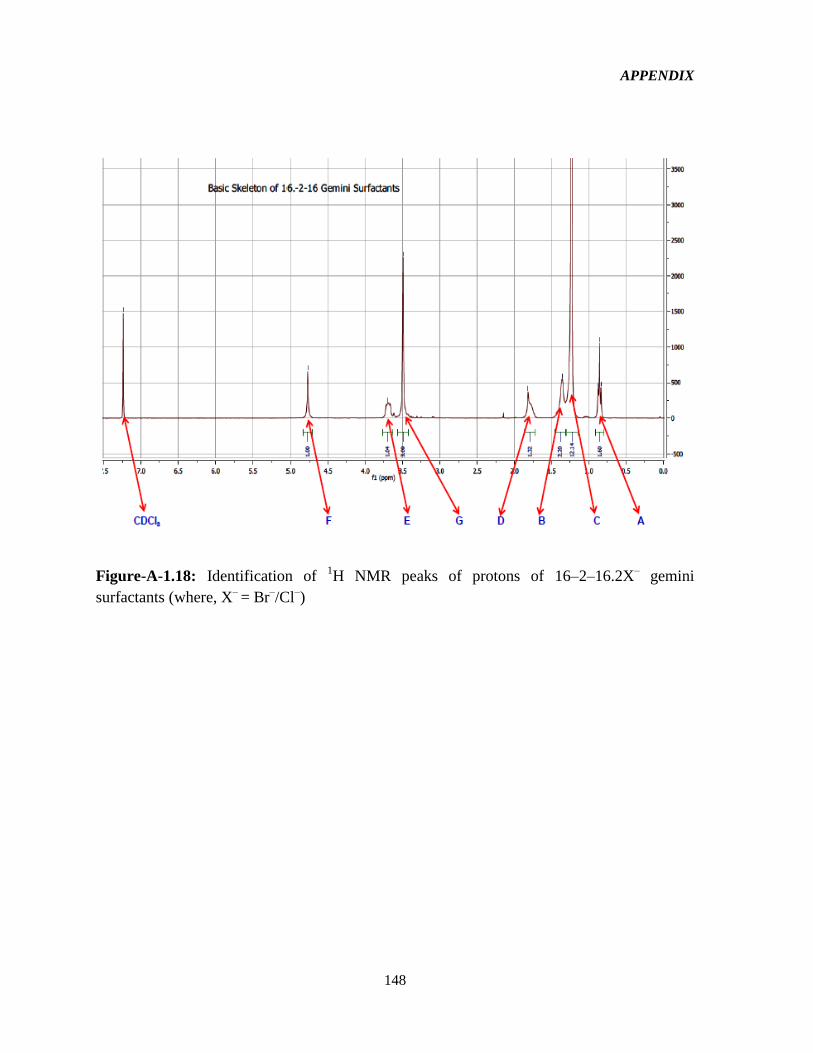
APPENDIX
148
Figure-A-1.18: Identification of 1H NMR peaks of protons of 16–2–16.2X
– gemini
surfactants (where, X–
= Br–/Cl
–)
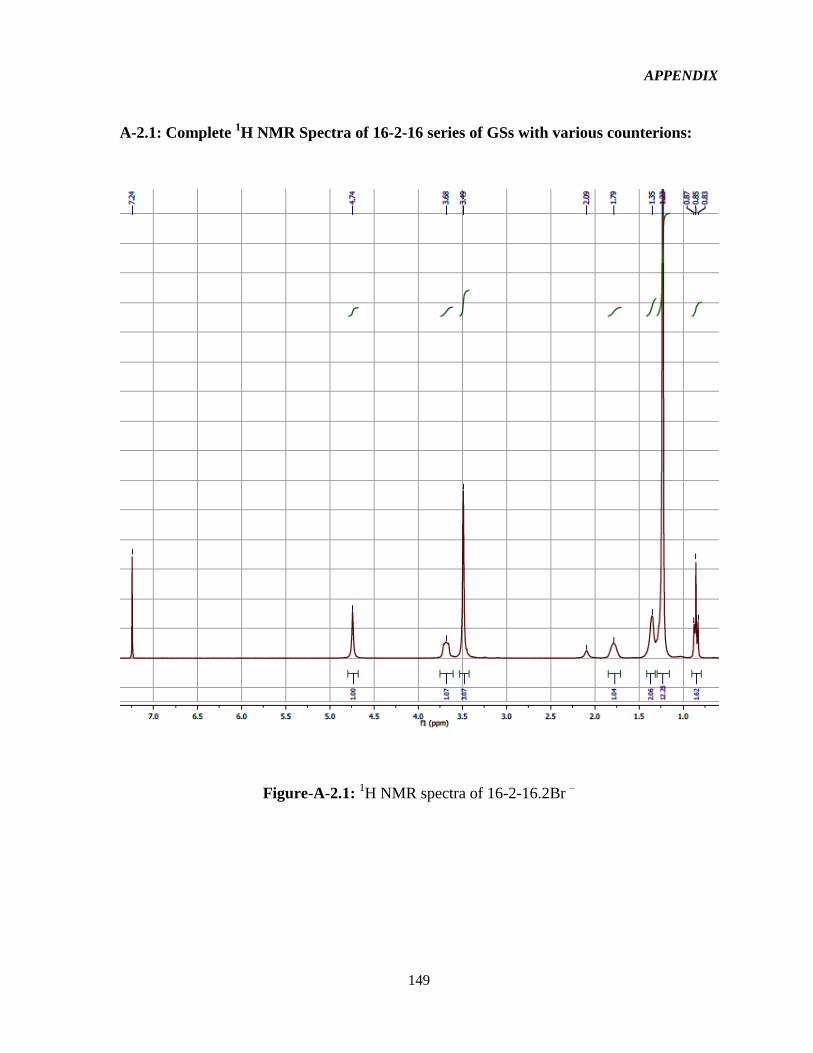
APPENDIX
149
A-2.1: Complete 1H NMR Spectra of 16-2-16 series of GSs with various counterions:
Figure-A-2.1: 1H NMR spectra of 16-2-16.2Br
–
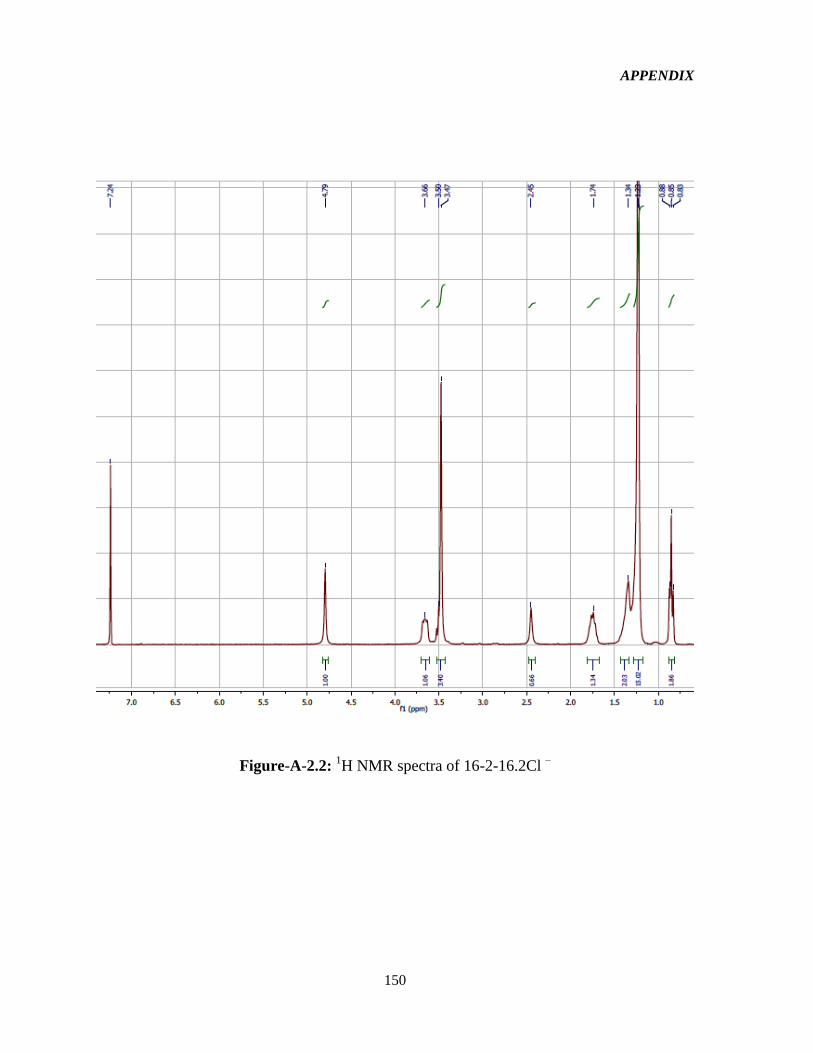
APPENDIX
150
Figure-A-2.2: 1H NMR spectra of 16-2-16.2Cl
–
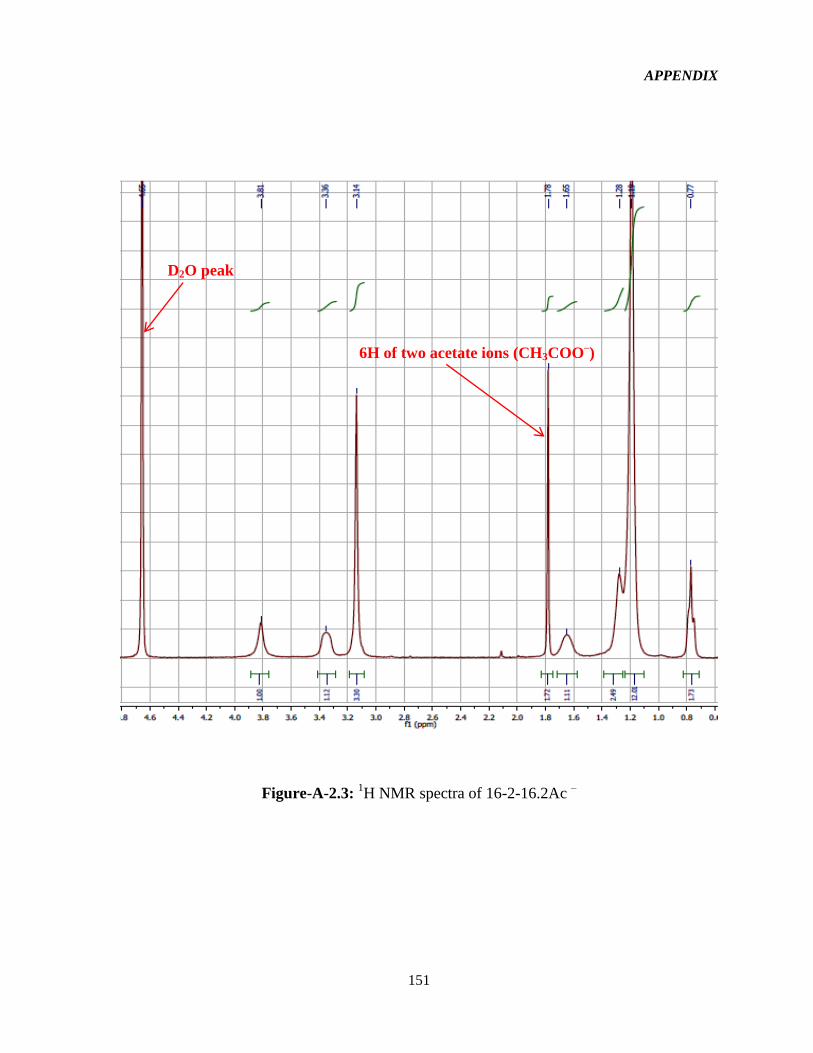
APPENDIX
151
D2O peak
6H of two acetate ions (CH3COO–)
Figure-A-2.3: 1H NMR spectra of 16-2-16.2Ac
–
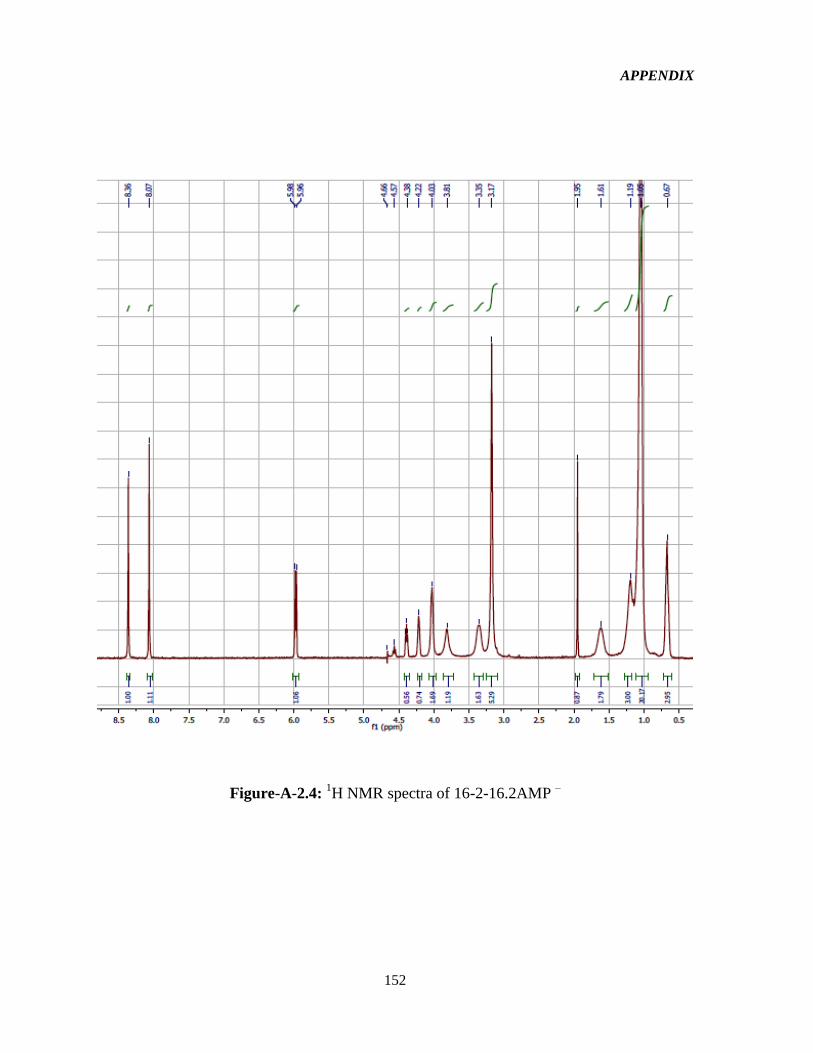
APPENDIX
152
Figure-A-2.4: 1H NMR spectra of 16-2-16.2AMP
–
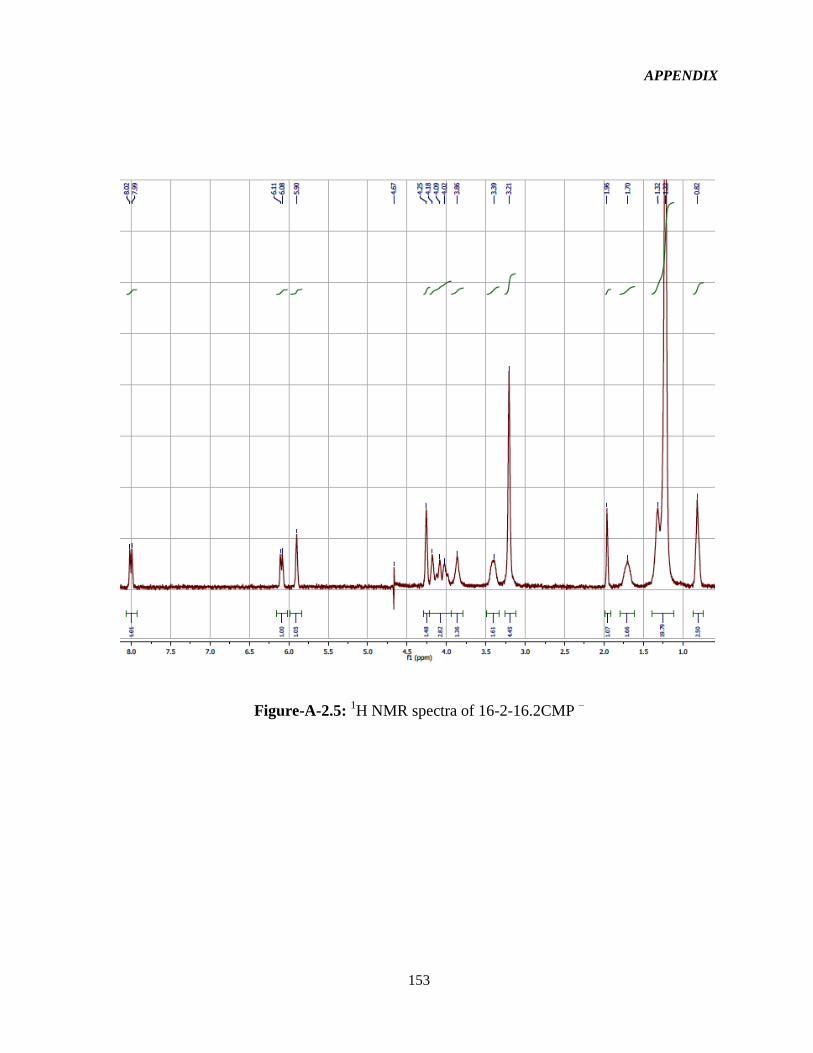
APPENDIX
153
Figure-A-2.5: 1H NMR spectra of 16-2-16.2CMP
–
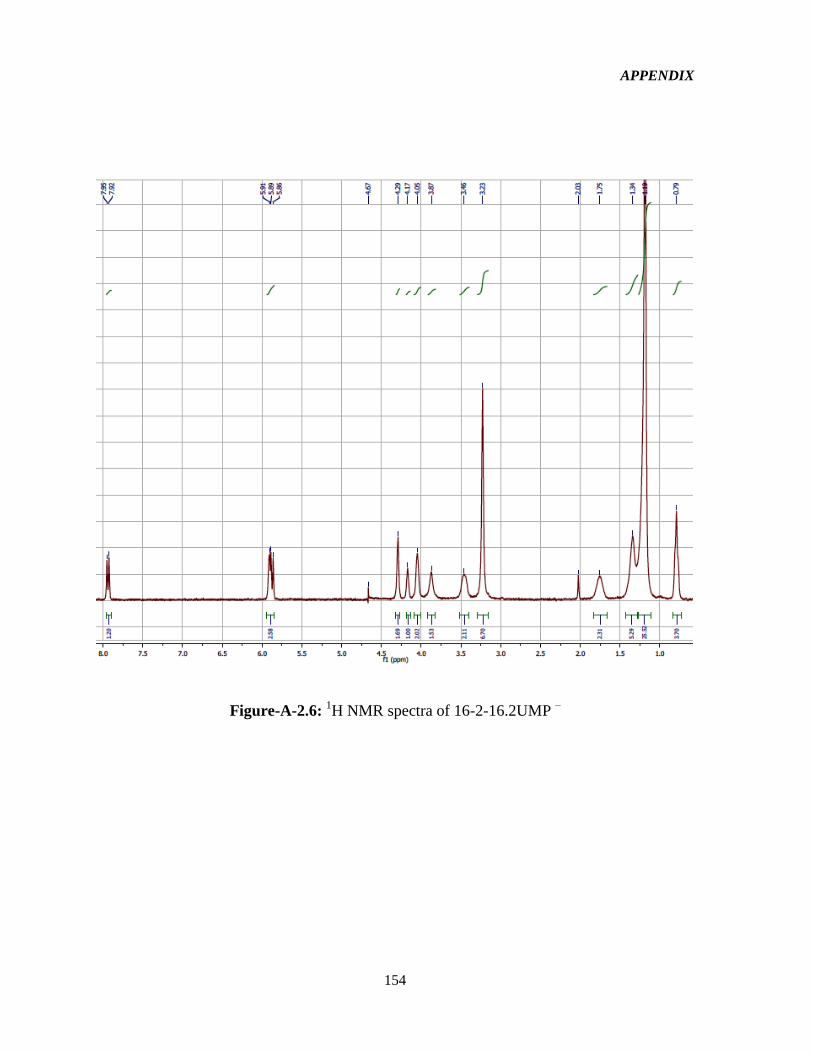
APPENDIX
154
Figure-A-2.6: 1H NMR spectra of 16-2-16.2UMP
–
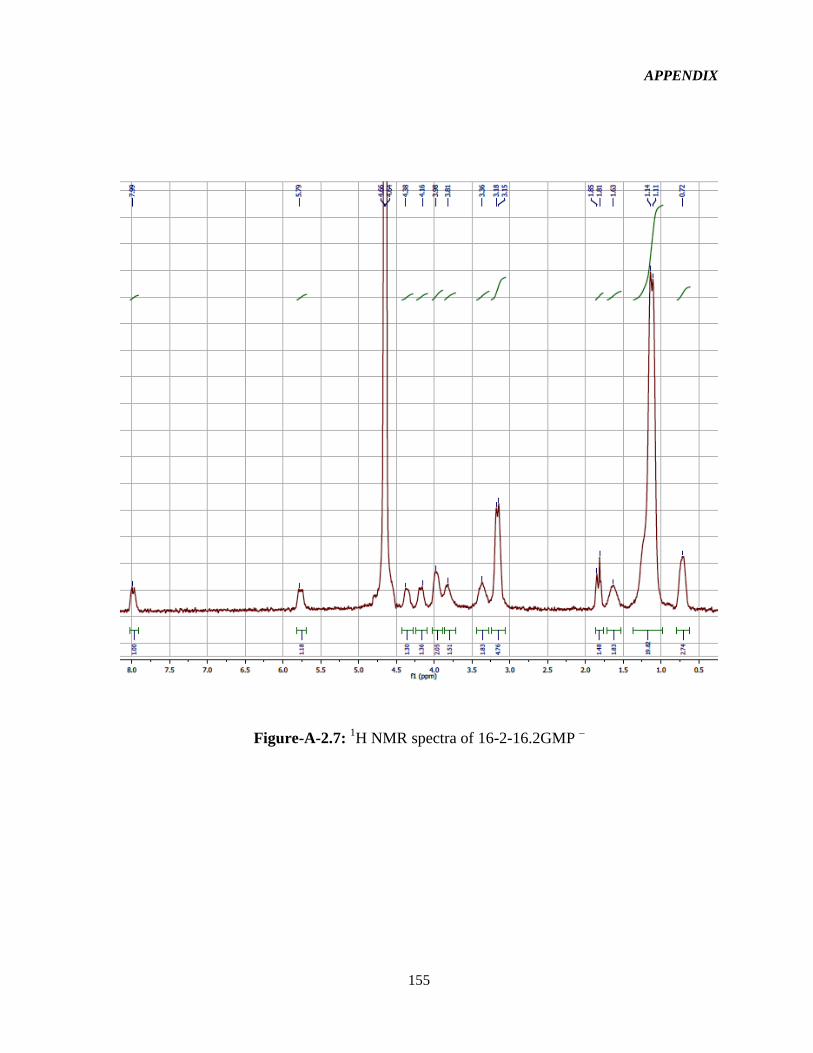
APPENDIX
155
Figure-A-2.7: 1H NMR spectra of 16-2-16.2GMP
–
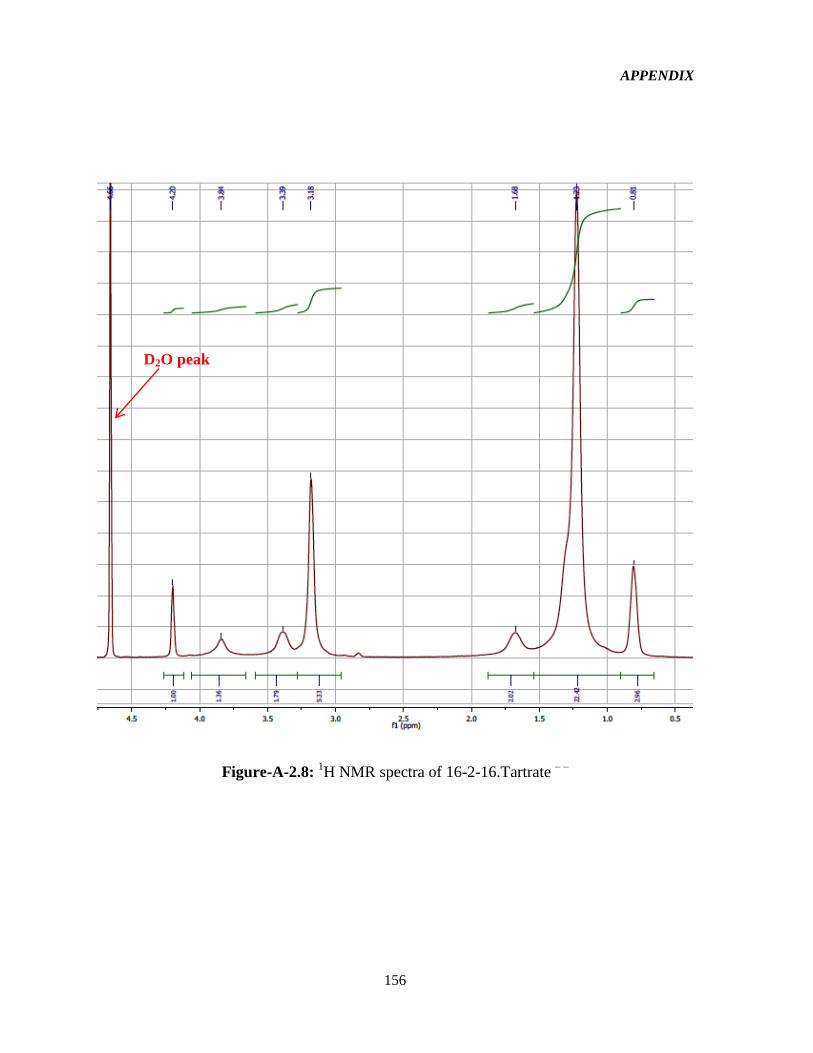
APPENDIX
156
D2O peak
Figure-A-2.8: 1H NMR spectra of 16-2-16.Tartrate
– –
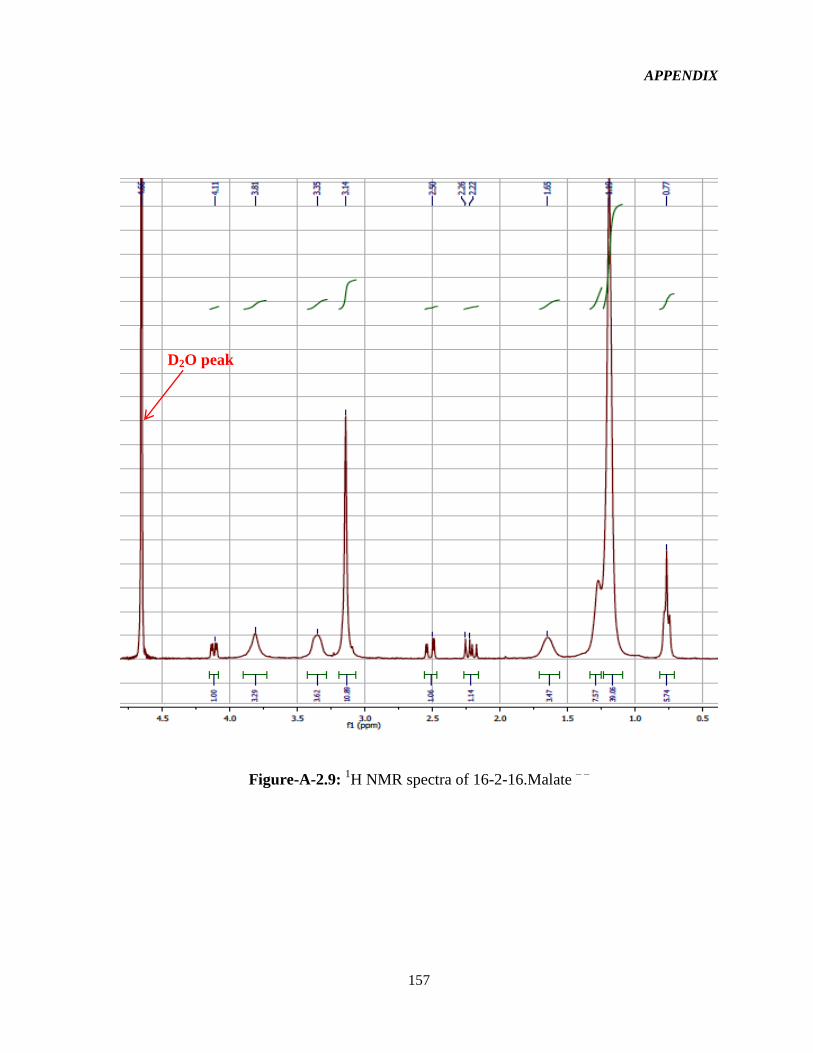
APPENDIX
157
D2O peak
Figure-A-2.9: 1H NMR spectra of 16-2-16.Malate
– –
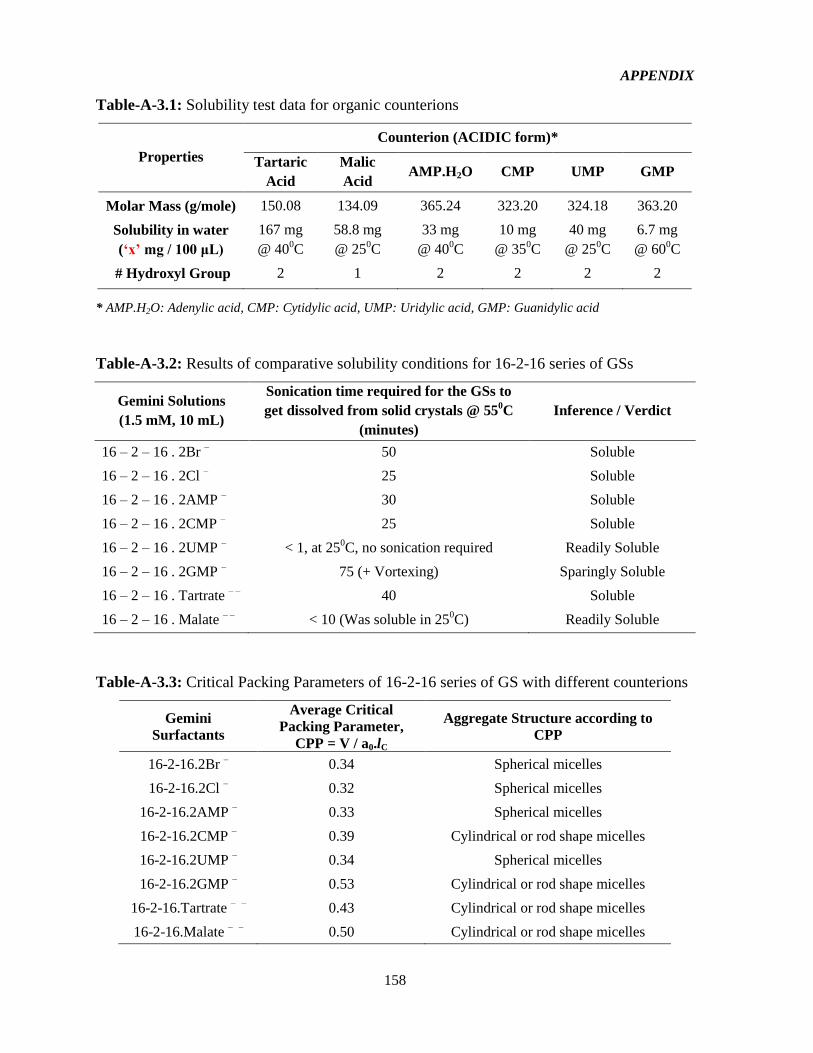
APPENDIX
158
Table-A-3.1: Solubility test data for organic counterions
Properties
Counterion (ACIDIC form)*
Tartaric
Acid
Malic
Acid AMP.H2O CMP UMP GMP
Molar Mass (g/mole) 150.08 134.09 365.24 323.20 324.18 363.20
Solubility in water
(‘x’ mg / 100 μL)
167 mg
@ 400C
58.8 mg
@ 250C
33 mg
@ 400C
10 mg
@ 350C
40 mg
@ 250C
6.7 mg
@ 600C
# Hydroxyl Group 2 1 2 2 2 2
* AMP.H2O: Adenylic acid, CMP: Cytidylic acid, UMP: Uridylic acid, GMP: Guanidylic acid
Table-A-3.2: Results of comparative solubility conditions for 16-2-16 series of GSs
Gemini Solutions
(1.5 mM, 10 mL)
Sonication time required for the GSs to
get dissolved from solid crystals @ 550C
(minutes)
Inference / Verdict
16 – 2 – 16 . 2Br – 50 Soluble
16 – 2 – 16 . 2Cl – 25 Soluble
16 – 2 – 16 . 2AMP – 30 Soluble
16 – 2 – 16 . 2CMP – 25 Soluble
16 – 2 – 16 . 2UMP – < 1, at 25
0C, no sonication required Readily Soluble
16 – 2 – 16 . 2GMP – 75 (+ Vortexing) Sparingly Soluble
16 – 2 – 16 . Tartrate – –
40 Soluble
16 – 2 – 16 . Malate – –
< 10 (Was soluble in 250C) Readily Soluble
Table-A-3.3: Critical Packing Parameters of 16-2-16 series of GS with different counterions
Gemini
Surfactants
Average Critical
Packing Parameter,
CPP = V / a0.lC
Aggregate Structure according to
CPP
16-2-16.2Br – 0.34 Spherical micelles
16-2-16.2Cl – 0.32 Spherical micelles
16-2-16.2AMP – 0.33 Spherical micelles
16-2-16.2CMP – 0.39 Cylindrical or rod shape micelles
16-2-16.2UMP – 0.34 Spherical micelles
16-2-16.2GMP – 0.53 Cylindrical or rod shape micelles
16-2-16.Tartrate – – 0.43 Cylindrical or rod shape micelles
16-2-16.Malate – – 0.50 Cylindrical or rod shape micelles
APPENDIX
159
A-3.4.1 Viscosity measurement
The viscosity of the gemini solutions were measured using a Gilmont Falling ball
viscometer (size #2, GV 2200, Thermo Scientific, USA) at 550C. The temperature was
controlled at a precision of ±0.050C using an immersion circulating water bath (VWR, USA).
Saturated aqueous solutions (~1.5 mM, >> CMC for all surfactants) were prepared,
separately, for each gemini surfactant, by sonication at 550C and the gemini solutions were
inserted in the viscometer assembly along with the stainless steel ball, and the time (in
milliseconds) required for the ball to travel across the start and stop points of the viscometer
was recorded. All viscosity measurements were repeated in triplicate and the average is
reported. Viscosities were calculated according to (Equation-A-3.1) as following:
Viscosity of a liquid (in centipoise units), μ = K(Db – DW) / t A-3.1
Where,
K = Viscometer constant (for viscometer size #2, K = 3.3 was used as provided)
Db = Density of the stainless steel ball (8.02 g/mL)
DW = Density of Milli Q water at experimental temperature (0.98 g/mL @ 550C)
t = Required time (in minutes) for the ball to travel across the start – stop points
A-3.4.2 Foam ability and foam stability measurement
Foamability and foam-stability of the gemini surfactants were studied using a
previously reported method [80, 81, 203, 204]. Twenty milliliters of gemini solution (1.5 mM
>> CMC for all surfactants) at 550C was placed into a calibrated 100 mL graduated cylinder
equipped with a stopper. The solution was shaken in the cylinder uniformly and vigorously
for 10 seconds and the volume of foam produced was recorded at 0 min, 10 min and 20 min.
The initial volume (0 min) of the foam produced was measured as foamability of the
surfactant, while foam stability was determined from the remaining foam at 10 and 20
minutes [204]. All the measurements of foamability and foam stability were repeated in
duplicate for each gemini.
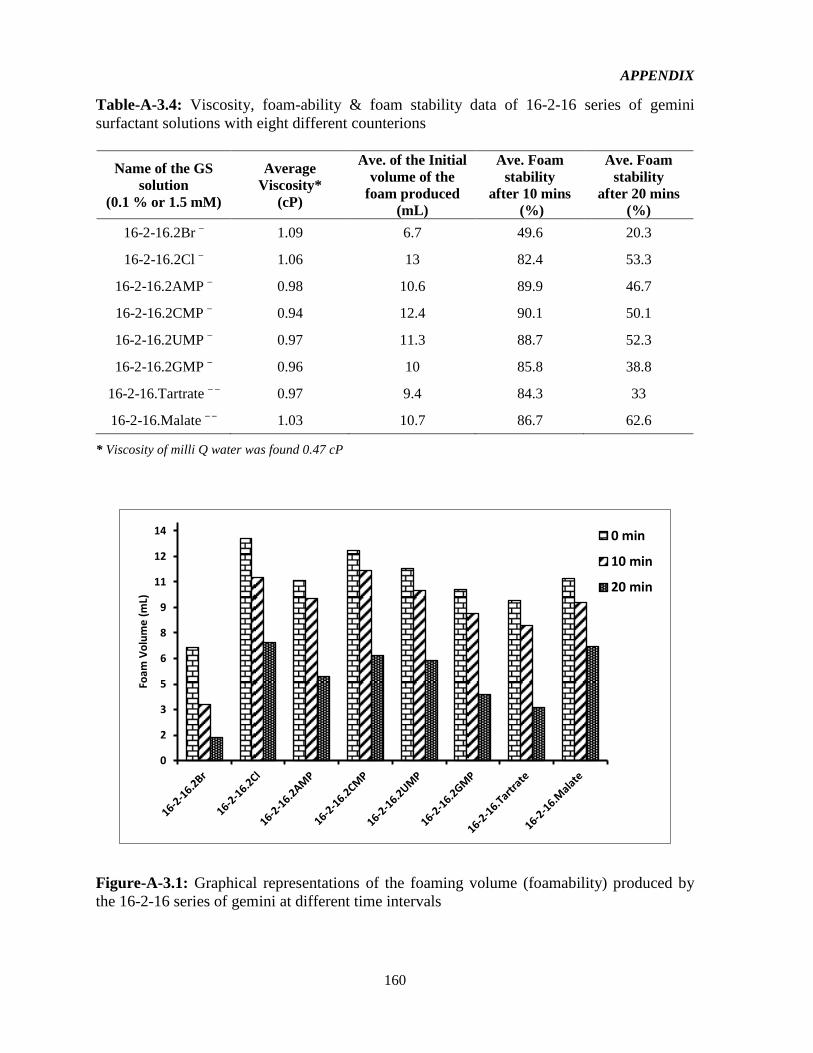
APPENDIX
160
0
2
3
5
6
8
9
11
12
14
Foam
Vo
lum
e (
mL)
0 min
10 min
20 min
Table-A-3.4: Viscosity, foam-ability & foam stability data of 16-2-16 series of gemini
surfactant solutions with eight different counterions
Name of the GS
solution
(0.1 % or 1.5 mM)
Average
Viscosity*
(cP)
Ave. of the Initial
volume of the
foam produced
(mL)
Ave. Foam
stability
after 10 mins
(%)
Ave. Foam
stability
after 20 mins
(%)
16-2-16.2Br – 1.09 6.7 49.6 20.3
16-2-16.2Cl – 1.06 13 82.4 53.3
16-2-16.2AMP – 0.98 10.6 89.9 46.7
16-2-16.2CMP – 0.94 12.4 90.1 50.1
16-2-16.2UMP – 0.97 11.3 88.7 52.3
16-2-16.2GMP – 0.96 10 85.8 38.8
16-2-16.Tartrate – –
0.97 9.4 84.3 33
16-2-16.Malate – –
1.03 10.7 86.7 62.6
* Viscosity of milli Q water was found 0.47 cP
Figure-A-3.1: Graphical representations of the foaming volume (foamability) produced by
the 16-2-16 series of gemini at different time intervals

APPENDIX
161
Table-A-3.5: Recorded values & parameters of all the extractions for pNN9 plasmid
Extraction
Number
Extracted
Sample Extraction Kit Used
Sample conc.
(ng/ μL)
A260/280
(Nano-drop)
Extraction-1
OD600 = 1.66
Sample – 1 E.Z.N.A.® Maxi 179.2 1.81
Sample – 2 E.Z.N.A.® Maxi 193.2 1.83
Extraction-2
OD600 = 1.54
Sample – 1 E.Z.N.A.® Maxi 104.4 1.85
Sample – 2 E.Z.N.A.® Maxi 92.5 1.80
Sample – 3 E.Z.N.A.® Maxi 97.1 1.82
Extraction-3
OD600 = 1.82
Sample – 1 E.Z.N.A.® Endo-Free Maxi 523.3 1.88
Sample – 2 E.Z.N.A.® Endo-Free Maxi 656.1 1.91
Figure-A-3.2: UV image of the agarose gel after AGE for size confirmation of pNN9
plasmid

LETTERS OF COPYRIGHT PERMISSION
161
Letters of copyright permission
1. Copyright permission for Figure-1.3 to reuse/reprint:
LETTERS OF COPYRIGHT PERMISSION
162
LETTERS OF COPYRIGHT PERMISSION
163
2. Copyright permission for Figure-1.9, 1.10 & 1.12 to reuse/reprint:
LETTERS OF COPYRIGHT PERMISSION
164
3. Copyright permission for Figure-1.13 to reuse/reprint:
LETTERS OF COPYRIGHT PERMISSION
165
4. Copyright permission for Figure-1.14 & 1.15 to reuse/reprint:
LETTERS OF COPYRIGHT PERMISSION
166
5. Copyright permission for Figure-1.16 to reuse/reprint:
LETTERS OF COPYRIGHT PERMISSION
167
Related Documents


