Copyright 2002 by the Genetics Society of America Characterization and Effects of the Replicated Flowering Time Gene FLC in Brassica rapa M. Eric Schranz,* Pablo Quijada,* Si-Bum Sung, † Lewis Lukens,* ,1 Richard Amasino † and Thomas C. Osborn* ,2 *Department of Agronomy and † Department of Biochemistry, University of Wisconsin, Madison, Wisconsin 53706 Manuscript received June 12, 2002 Accepted for publication August 26, 2002 ABSTRACT Functional genetic redundancy is widespread in plants and could have an important impact on pheno- typic diversity if the multiple gene copies act in an additive or dosage-dependent manner. We have cloned four Brassica rapa homologs (BrFLC) of the MADS-box flowering-time regulator FLC, located at the top of chromosome 5 of Arabidopsis thaliana. Relative rate tests revealed no evidence for differential rates of evolution and the ratios of nonsynonymous-to-synonymous substitutions suggest BrFLC loci are not under strong purifying selection. BrFLC1, BrFLC2, and BrFLC3 map to genomic regions that are collinear with the top of At5, consistent with a polyploid origin. BrFLC5 maps near a junction of two collinear regions to Arabidopsis, one of which includes an FLC-like gene (AGL31). However, all BrFLC sequences are more closely related to FLC than to AGL31. BrFLC1, BrFLC2, and BrFLC5 cosegregate with flowering-time loci evaluated in populations derived by backcrossing late-flowering alleles from a biennial parent into an annual parent. Two loci segregating in a single backcross population affected flowering in a completely additive manner. Thus, replicated BrFLC genes appear to have a similar function and interact in an additive manner to modulate flowering time. D UPLICATION of genes, as chromosomal blocks, subset of the functions of the single ancestral gene. individually, or by whole genome polyploidization, However, by this mechanism, the retention of function is thought to be a major mechanism for creating new would contribute little to phenotypic diversity. genetic and phenotypic diversity. The impact of paralo- A mechanism by which retention of duplicated gene gous genes on diversification is particularly striking in function could impact phenotypic diversity is if each flowering plants where as many as 70% of species, in- gene copy contributed to the control of the phenotype cluding many of our most important crop plants, show in a dosage-dependent manner. Increases in enzymatic evidence for polyploidy (Masterson 1994). The selec- activity and gene expression are associated with increas- tive advantage of genetic redundancy is not well under- ing ploidy (e.g., Roose and Gottlieb 1980; Guo et al. stood, but having multiple copies of genes could con- 1996), and a study of Hox group 3 genes in mice found tribute to phenotypic diversity through the functional that paralogous loci can act in a dosage-dependent man- divergence of redundant genes. Although examples of ner to affect phenotype (Manley and Capecchi 1997). this have been discovered, many duplicated genes ap- In plants, changes of regulatory genes are believed to pear to retain their original function (see Wendel 2000 be particularly important for the diversification of plant for review). The lower than expected frequency of dupli- phenotypes (Doebley and Lukens 1998; Shepard and cate gene silencing (e.g., Nadeau and Sankoff 1997) Purugganan 2002), and alleles at several key regulatory also suggests that maintenance of duplicated gene func- genes controlling developmental processes are known tion is an important feature in evolution. Force et al. to interact in an additive manner (e.g., Tb1, Lukens and (1999) have hypothesized subfunctionalization as one Doebley 1999; fw2.2, Frary et al. 2000; CO, Koornneef explanation for retention of duplicated gene function— et al. 1991; and FLC, Michaels and Amasino 2000). that is, the accumulation of different mutations in dupli- These additive or dosage-dependent effects at a single cated genes that cause each locus to control only a regulatory locus could be expanded through gene repli- cation if multiple copies of the genes also interacted in an additive or dosage-dependent manner. Sequence data from this article have been deposited with the Brassica species, which include several important EMBL/GenBank Data Libraries under accession nos. AY115672– crops with a wide range of morphologies, are hypothe- AY115678. 1 Present address: Department of Plant Agriculture, University of sized to be ancient polyploid relatives of Arabidopsis thali- Guelph, Guelph, ON N1G 2W1, Canada. ana (Lagercrantz 1998). A major component of the 2 Corresponding author: Department of Agronomy, 1575 Linden Dr., morphological diversity in Brassica species is variation University of Wisconsin, Madison, WI 53706. E-mail: [email protected] in flowering time. In A. thaliana, many genes have been Genetics 162: 1457–1468 (November 2002)

Welcome message from author
This document is posted to help you gain knowledge. Please leave a comment to let me know what you think about it! Share it to your friends and learn new things together.
Transcript
Copyright 2002 by the Genetics Society of America
Characterization and Effects of the Replicated FloweringTime Gene FLC in Brassica rapa
M. Eric Schranz,* Pablo Quijada,* Si-Bum Sung,† Lewis Lukens,*,1
Richard Amasino† and Thomas C. Osborn*,2
*Department of Agronomy and †Department of Biochemistry, University of Wisconsin, Madison, Wisconsin 53706
Manuscript received June 12, 2002Accepted for publication August 26, 2002
ABSTRACTFunctional genetic redundancy is widespread in plants and could have an important impact on pheno-
typic diversity if the multiple gene copies act in an additive or dosage-dependent manner. We have clonedfour Brassica rapa homologs (BrFLC) of the MADS-box flowering-time regulator FLC, located at the topof chromosome 5 of Arabidopsis thaliana. Relative rate tests revealed no evidence for differential rates ofevolution and the ratios of nonsynonymous-to-synonymous substitutions suggest BrFLC loci are not understrong purifying selection. BrFLC1, BrFLC2, and BrFLC3 map to genomic regions that are collinear withthe top of At5, consistent with a polyploid origin. BrFLC5 maps near a junction of two collinear regionsto Arabidopsis, one of which includes an FLC-like gene (AGL31). However, all BrFLC sequences are moreclosely related to FLC than to AGL31. BrFLC1, BrFLC2, and BrFLC5 cosegregate with flowering-time locievaluated in populations derived by backcrossing late-flowering alleles from a biennial parent into anannual parent. Two loci segregating in a single backcross population affected flowering in a completelyadditive manner. Thus, replicated BrFLC genes appear to have a similar function and interact in an additivemanner to modulate flowering time.
DUPLICATION of genes, as chromosomal blocks, subset of the functions of the single ancestral gene.individually, or by whole genome polyploidization, However, by this mechanism, the retention of function
is thought to be a major mechanism for creating new would contribute little to phenotypic diversity.genetic and phenotypic diversity. The impact of paralo- A mechanism by which retention of duplicated genegous genes on diversification is particularly striking in function could impact phenotypic diversity is if eachflowering plants where as many as 70% of species, in- gene copy contributed to the control of the phenotypecluding many of our most important crop plants, show in a dosage-dependent manner. Increases in enzymaticevidence for polyploidy (Masterson 1994). The selec- activity and gene expression are associated with increas-tive advantage of genetic redundancy is not well under- ing ploidy (e.g., Roose and Gottlieb 1980; Guo et al.stood, but having multiple copies of genes could con- 1996), and a study of Hox group 3 genes in mice foundtribute to phenotypic diversity through the functional that paralogous loci can act in a dosage-dependent man-divergence of redundant genes. Although examples of ner to affect phenotype (Manley and Capecchi 1997).this have been discovered, many duplicated genes ap- In plants, changes of regulatory genes are believed topear to retain their original function (see Wendel 2000 be particularly important for the diversification of plantfor review). The lower than expected frequency of dupli- phenotypes (Doebley and Lukens 1998; Shepard andcate gene silencing (e.g., Nadeau and Sankoff 1997) Purugganan 2002), and alleles at several key regulatoryalso suggests that maintenance of duplicated gene func- genes controlling developmental processes are knowntion is an important feature in evolution. Force et al. to interact in an additive manner (e.g., Tb1, Lukens and(1999) have hypothesized subfunctionalization as one Doebley 1999; fw2.2, Frary et al. 2000; CO, Koornneefexplanation for retention of duplicated gene function— et al. 1991; and FLC, Michaels and Amasino 2000).that is, the accumulation of different mutations in dupli- These additive or dosage-dependent effects at a singlecated genes that cause each locus to control only a regulatory locus could be expanded through gene repli-
cation if multiple copies of the genes also interacted inan additive or dosage-dependent manner.
Sequence data from this article have been deposited with the Brassica species, which include several importantEMBL/GenBank Data Libraries under accession nos. AY115672–crops with a wide range of morphologies, are hypothe-AY115678.
1Present address: Department of Plant Agriculture, University of sized to be ancient polyploid relatives of Arabidopsis thali-Guelph, Guelph, ON N1G 2W1, Canada. ana (Lagercrantz 1998). A major component of the
2Corresponding author: Department of Agronomy, 1575 Linden Dr., morphological diversity in Brassica species is variationUniversity of Wisconsin, Madison, WI 53706.E-mail: [email protected] in flowering time. In A. thaliana, many genes have been
Genetics 162: 1457–1468 (November 2002)
1458 M. E. Schranz et al.
identified that control flowering time, but much of the known. This information could provide important newinsight into the evolution of replicated genes.natural variation involves allelic variation at FLOW-
In this study we report on the cloning of four genomicERING LOCUS C (FLC) or at FRIGIDA (FRI), a regulatorFLC genes from the diploid B. rapa (n � 10) and threeof FLC expression (Michaels and Amasino 1999;genes from B. oleracea (n � 9). These genes were com-Sheldon et al. 1999; Johanson et al. 2000). FLC acts in apared to each other and to A. thaliana genes by sequencedosage-dependent manner to delay flowering (Michaelsanalysis and comparative mapping. Phenotypic effectsand Amasino 1999; Sheldon et al. 1999). Alleles thatassociated with the four BrFLC sequences were deter-cause late flowering produce intermediate phenotypesmined by evaluating flowering-time variation in back-when heterozygous with early flowering alleles, andcross populations segregating for FLC loci individuallytransgenic expression of additional FLC genes leads toor in combinations. Our results provide evidence thateven later flowering phenotypes (Michaels and Amas-polyploidy has contributed to phenotypic variation forino 2000). Diploid Brassica species contain three copiesflowering time in B. rapa through replication of FLC, anof the genomic region that corresponds to the top ofimportant regulatory gene that acts in a dosage-dependentchromosome 5 in A. thaliana (At5) where FLC is locatedmanner.(Osborn et al. 1997; Lagercrantz 1998; Parkin et al.
2002). QTL having large effects on flowering time havebeen mapped to these genome regions in Brassica rapa
MATERIALS AND METHODS(Teutonico and Osborn 1994; Osborn et al. 1997),B. napus (Ferreira et al. 1995; Osborn et al. 1997; Cloning and sequence analysis of Brassica FLC genes: Plants
of the biennial B. rapa oilseed cultivar, Per, were grown in aButruille et al. 1999), B. oleracea (Bohuon et al. 1998;growth chamber for 2 weeks under long-day (LD) conditionsLan and Paterson 2000), B. nigra (Lagercrantz et al.(16 hr light:8 hr dark) at 21�. Total RNA was extracted from1996), and B. juncea (Axelsson et al. 2001). Thus, multi- leaves using the TRI reagent (Sigma, St. Louis) as directed
ple copies of a gene homologous to a flowering-time by the manufacturer. First strand of cDNA was synthesizedgene on At5, such as FLC, could contribute to the wide with the SuperScript II reverse transcriptase (Life Science
Technology, Gaithersburg, MD) using the poly(dT)-M13range of variation in flowering time observed in Brassicaprimer (5�-GTA AAA CGA CGG CCA GTC CCT TTT TTTspecies.TTT TTT T-3�). Synthesized first strands of cDNA were used
Axelsson et al. (2001) hypothesized that the QTL as templates to amplify BrFLC cDNA by using the FLC44that they identified in several Brassica species corre- primer (5�-CGG CTT AGA TCT CCG GCG ACT-3�) and the
poly(dT)-M13 primer. The PCR products were cloned intospond to homologs of CO, another flowering-time genepGEM-Teasy vectors (Promega, Madison, WI) and sequencesat the top of At5 that is involved in photoperiod regula-were analyzed. All cDNA corresponded to a single BrFLC gene.tion of flowering (Putterill et al. 1995). Their evidence To isolate additional genomic Brassica FLC genes, conserved
was based on confidence intervals for QTL and map primers were designed by aligning the BrFLC cDNA with A.positions or hypothesized map positions for CO and FLC thaliana FLC cDNA (AF116527; Figure 1a, exon 2 and exon
7 primers) and used for 35 cycles of PCR with genomic DNAhomologs. Kole et al. (2001) provided strong evidencefrom doubled haploid lines of B. rapa (IMB218) and B. oleraceathat VFR2, a flowering-time locus in B. rapa, is allelic to(TO1000). PCR products were excised from the gel, purified
a B. rapa FLC homolog. VFR2 was originally identified using the GFX PCR DNA and gel band isolation kit (Amershamas a QTL in a segregating population derived from an- Biosciences, Piscataway, NJ), and cloned into pGem T-Vectors
(Promega).nual and biennial oilseed B. rapa parents (Osborn etPlasmid inserts were sequenced by ABI PRISM dye termina-al. 1997). However, after backcrossing the late-flowering
tor cycle sequencing ready reaction kit (PE Applied Biosys-allele into the annual parent, the flowering-time effects tems, Foster City, CA). At least two independent clones fromconferred by VFR2 segregated as a single Mendelian separate PCR reactions were sequenced for each locus. Se-locus that mapped 13 cM from a CO homolog but coseg- quencing contigs were assembled using the Sequencher soft-
ware package (GeneCodes, Ann Arbor, MI). After sequenceregated exactly with a FLC homolog (Kole et al. 2001).analysis (see below) locus-specific primers were designed fromThe effect of the late allele was almost completely additivea variable region of exon 4 of the B. rapa sequences (Figure 1a).and was nearly eliminated by 3 weeks of vernalization. FLC sequences from B. rapa (AY115675–AY115678), B. olera-
These data strongly suggest that VFR2 is a B. rapa homolog cea (AY115672–AY115674), and A. thaliana (AF116528) werealigned using the Multiple Alignment Program (Huang 1996)of FLC. Tadege et al. (2001) subsequently reported theand by eye. Exon and intron boundaries were identified bycloning of five FLC homologs (BnFLC1–BnFLC5) fromcomparison to A. thaliana mRNA sequence (AF116527) andthe allopolyploid B. napus (n � 19) by screening a cDNA by checking boundary consensus sequences (Brown et al.
library. Expression of these cDNA with a 35S promoter 1996). The coding sequences for FLC from A. thaliana, B. rapa,in A. thaliana delayed flowering, and the expression of B. oleracea, and B. napus (AY036888–AY036892) and for two
FLC-like genes from A. thaliana, AGL27 (AF312665) andthe five BnFLCs in B. napus was reduced by vernalization.AGL31 (AY052229), were aligned using CLUSTALW (Thomp-Their results are consistent with B. napus having multi-son et al. 1994) with manual adjustments.ple functional homologs of FLC ; however, the total num- Phylogenetic analyses were done using PAUP*, version 4.0
ber and origins of FLC homologs and their effects (Swofford 2000) with both maximum-parsimony and maxi-mum-likelihood methods. For maximum-likelihood analyses,through allelic variation in Brassica species are not
1459Replicated Brassica FLC Genes
the transition:transversion ratio (ts/tv) was set at the default �82 (L. Lukens, F. Zou, D. Lydiate, I. Parkin and T. Osborn,unpublished results).value of 2.0. The base frequencies and the gamma shape
parameter � were both determined empirically from the data. Flowering-time evaluation, QTL mapping, and gene interac-tion analysis: The 78 BC3S1 plants segregating for FR1, theHeuristic searches were done with tree-reconnection branch
swapping. Bootstrap support values (BS) were estimated by 100 BC1S1 plants segregating for FR2, and the 326 F2 plantssegregating for both FR1 and VFR2 (described below) weredoing 10,000 “fast” replicates using the parsimony criterion.
The rate of molecular evolution of the B. rapa FLC genes evaluated for flowering time by counting the number of daysafter sowing to the first open flower (DTF) and the numberwas tested by a relative rate test (Tajima 1993) with A. thaliana
FLC sequence as the out-group, using the MEGA2 software of leaves on the main axis at flowering (LN). Using the linkagemaps constructed for the FR1 and FR2 populations, QTL forpackage (Kumar et al. 2001). Similarly, AGL27 and AGL31
were compared using FLC as an out-group. The method of flowering time were analyzed using QTL Cartographer(Basten et al. 2001) with a 10-cM covariate window for compos-Nei and Gojobori (1986) was used to calculate the number
of synonymous substitutions per synonymous site (dS) and the ite interval mapping (CIM). For both FR1 and FR2 popula-tions, the broad-sense heritability for flowering time was esti-number of nonsynonymous substitutions per nonsynonymous
site (dN) and their ratio (dN/dS) using the codeml program mated from variance components using the average varianceof the parents and the hybrid as an estimate of the environ-in the PAML software package (Yang 2000).
Genetic mapping and map comparisons: Two regions con- mental variance and the variance of the segregating popula-tions as an estimate of the phenotypic variance.taining flowering-time QTL, FR1 and FR2, were mapped using
two backcross populations. The populations were derived from To study the interactions of two putative FLC loci, an F2
population (326 plants) that included both VFR2 (describedtwo recombinant inbred (RI) lines from a previously describedB. rapa population (Kole et al. 1997) created from a cross in Kole et al. 2001) and FR1 in an R500 background was
created by crossing two BC3S1 homozygous plants (fr1/fr1,between Per and R500, an annual sarson. For FR1, an RI line(PQ3) had Per alleles at restriction fragment length polymor- VFR2/VFR2 � FR1/FR1,vfr2/vfr2). The F2 population was
grown in the field under conditions as reported in Kole etphism (RFLP) loci flanking the FR1 region on linkage groupR2 (Osborn et al. 1997) and R500 for RFLP loci flanking al. (2001). The 326 F2 plants were screened by RFLP for VFR2
with the BrFLC1 clone and for FR1 with the BrFLC2 PCRother flowering-time QTL. This line was backcrossed to R500for three generations with selection at each generation for polymorphism. To test the effects of the two putative FLC loci
and their interactions, a two-factor analysis of variance wasplants having Per alleles at marker loci flanking FR1. One BC3
done using Proc MIXED of SAS (Littell et al. 1996) withplant heterozygous at FR1 was self-pollinated and 78 BC3S1
means weighted according to the frequency of individuals inplants were grown in the field, along with 20 replicates ofeach two-locus class.both early (R500) and late (PQ3) parents, under the same
conditions as described by Kole et al. (2001). For FR2, an RIline (IMB1061) was selected that had Per alleles at RFLPmarkers on the linkage group R3 flanking FR2 and that had RESULTSR500 alleles at RFLP markers flanking other known flowering-
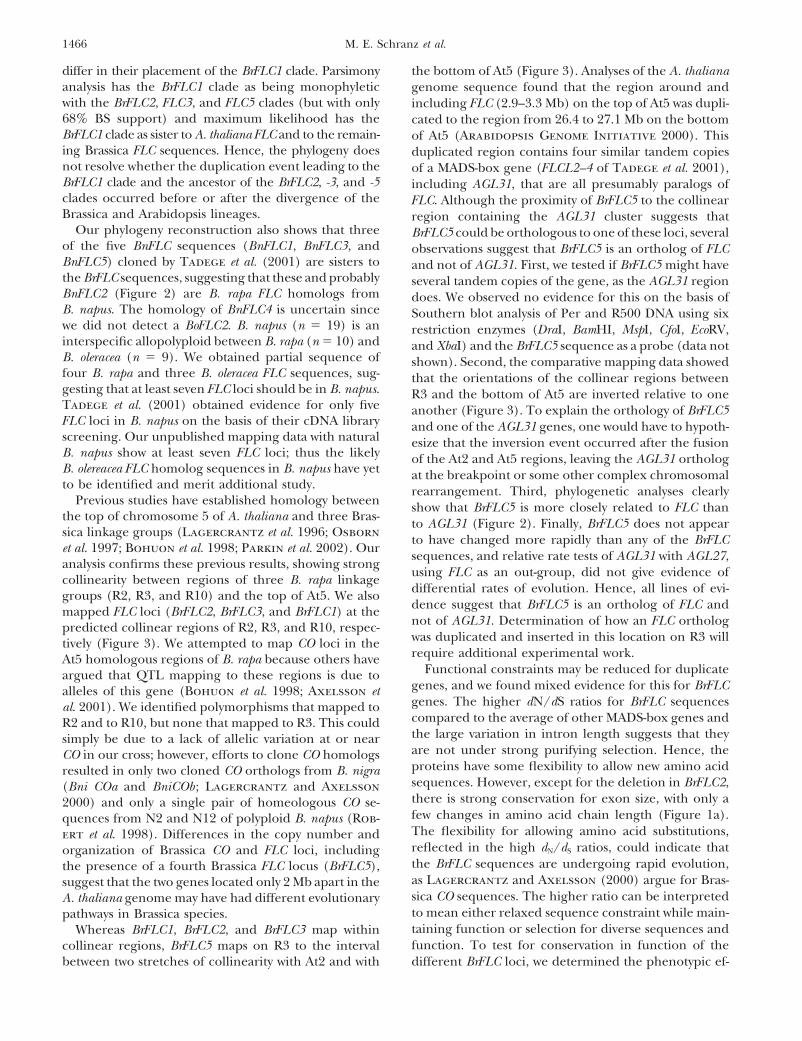
Cloning and analysis of Brassica FLC sequences: Clon-time QTL (Osborn et al. 1997). The RI line was crossed toR500, and a hybrid plant (genetically equivalent to a BC1) was ing and sequence characterization: Five cDNA clones wereselfed. One hundred resulting BC1S1 plants and five replicates analyzed by sequencing. Four of these clones were iden-of the early parent (R500) and the late parent (PQ1050) were tical (BrFLC cDNA1) and contained 896 bp (coding 196grown in a growth chamber under LD conditions at 21�.
amino acids) corresponding to the seven exons of A.Linkage maps for the FR1 and FR2 regions were generatedthaliana FLC with 75% identity (85% for the codingusing RFLP and simple sequence repeat (SSR) marker loci.
DNA was extracted as described in Kidwell and Osborn region). The fifth clone (BrFLC cDNA2) was 100% iden-(1992) and were analyzed for RFLP by Southern blot hybridiza- tical to BrFLC cDNA1 for exons 1–6; the final exon and thetions as described by Teutonico and Osborn (1994). Probes 3�-untranslated region (3�-UTR) were highly divergenthybridized to blots included DNA clones found on linkage
and had no significant homology to any other sequencegroups containing flowering-time QTL (Osborn et al. 1997),in GenBank. This was apparently a splicing variant ofthe four isolated B. rapa FLC genomic clones, and the A.the same gene as BrFLC cDNA1, as explained below.thaliana FLC and CO clones used by Kole et al. (2001). In
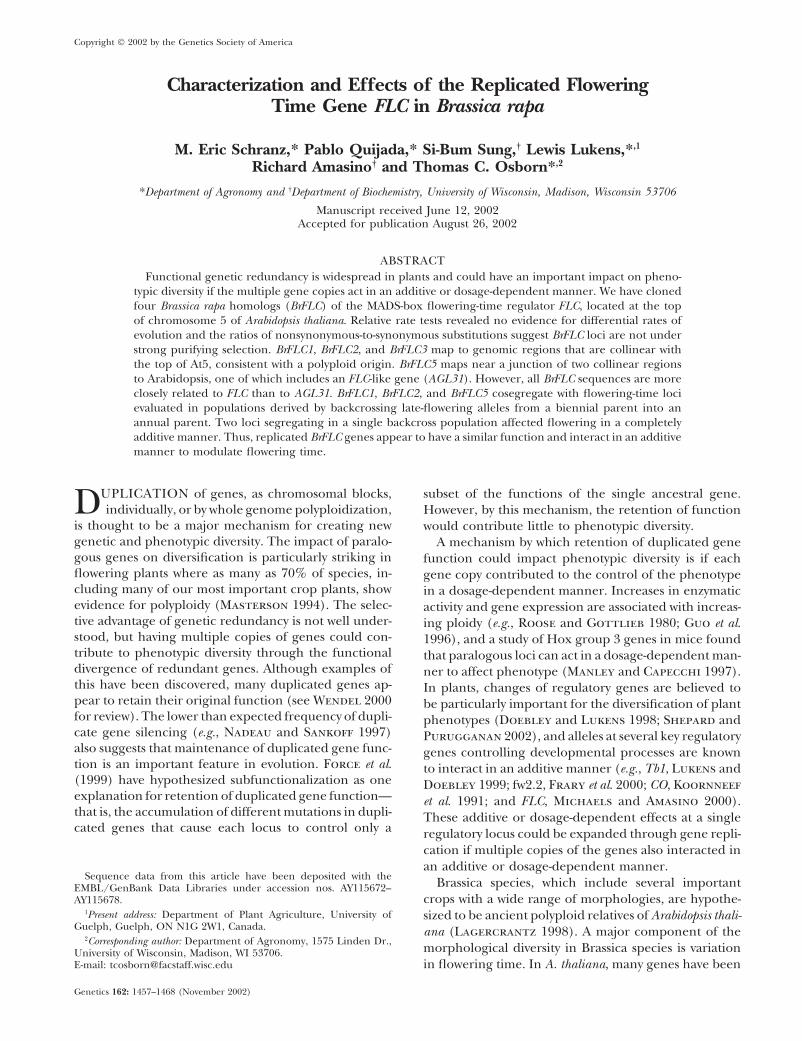
addition, several PCR markers were used. The exon 7 primer Alignment of BrFLC cDNA1 and FLC allowed us towith the exon 4 locus-specific primers for BrFLC2 and BrFLC3 design highly conserved primers in exons 2 and 7 (Fig-(Figure 1a) gave polymorphic PCR products (Figure 1b). Also, ure 1a), and amplification with these primers yieldedseveral SSR markers provided by D. Lydiate (personal com-
three distinct fragments after gel separation (Figuremunication) were used. In total, 14 marker loci per population1b). Cloning and sequencing of these PCR productswere utilized. Linkage maps for the FR1 (R2) and the FR2
(R3) regions were constructed by analyzing segregation data resulted in the identification of four BrFLC genesfrom the two backcross populations using JoinMap 3.0 (CPRO- (BrFLC1, BrFLC2, BrFLC3, and BrFLC5) and three B.DRO, Wageningen). oleracea genes (BoFLC1, BoFLC3, and BoFLC5). LocusBrassica probes used for RFLP analyses in this study (R2
names are based on their similarity to BnFLC cDNAand R3) and in previous studies (R10 � LG8, Kole et al. 2001;sequences reported by Tadege et al. (2001; see below).N2, N3, and N10, Osborn et al. 1997 and Butruille et al.
1999) were sequenced to infer the position of putative homo- Southern blot analysis using FLC as a probe identifiedlogs within the A. thaliana genome. The sequences were com- four prominent restriction fragments in B. rapa (Figurepared to the A. thaliana genomic sequence as provided on 1c). The correspondence between the four FLC restric-February 15, 2001, on the TAIR database (http://www.arabi-
tion fragments and our four cloned BrFLC genes was con-dopsis.org). Sequences were compared by BLASTn analysisfirmed by locus-specific Southern hybridization analyses(Altschul et al. 1997), and putative homology relationships
were established if pairwise comparison BLAST scores were (Figure 1c).
1460 M. E. Schranz et al.
Figure 1.—Cloning and analysis of B. rapa FLC homologs. (a) Summary of genomic structure of the A. thaliana FLC geneshowing sequences of conserved primers from exons 2 and 7 used to clone B. rapa homologs. The chart lists intron and exonsizes (in base pairs) for FLC and the four B. rapa FLC homologs (BrFLC1–BrFLC5) cloned from a rapid-cycling doubled-haploidline of B. rapa (IMB). The nucleic acid alignment revealed a highly variable region of exon 4 used to design gene-specific forwardprimers (sequences underlined). (b) PCR amplification of genomic FLC sequences in IMB and the B. rapa cultivars Per andR500. Conserved primers (exon 2 and exon 7) amplify all four paralogs. Separation of FLC1 and -3 is not seen because of similarlengths (1616 and 1651 bp, respectively). Amplification specificity is shown by using gene-specific forward primers with a conservedexon 7 reverse primer. (c) Southern blot hybridizations of MspI-digested DNA of IMB, R500, and Per hybridized with exon 2through exon 7 genomic probes of FLC and of BrFLC1–BrFLC5. The A. thaliana probe hybridizes to all four Brassica genes,whereas the gene-specific probes show very little cross-hybridization.
1461Replicated Brassica FLC Genes
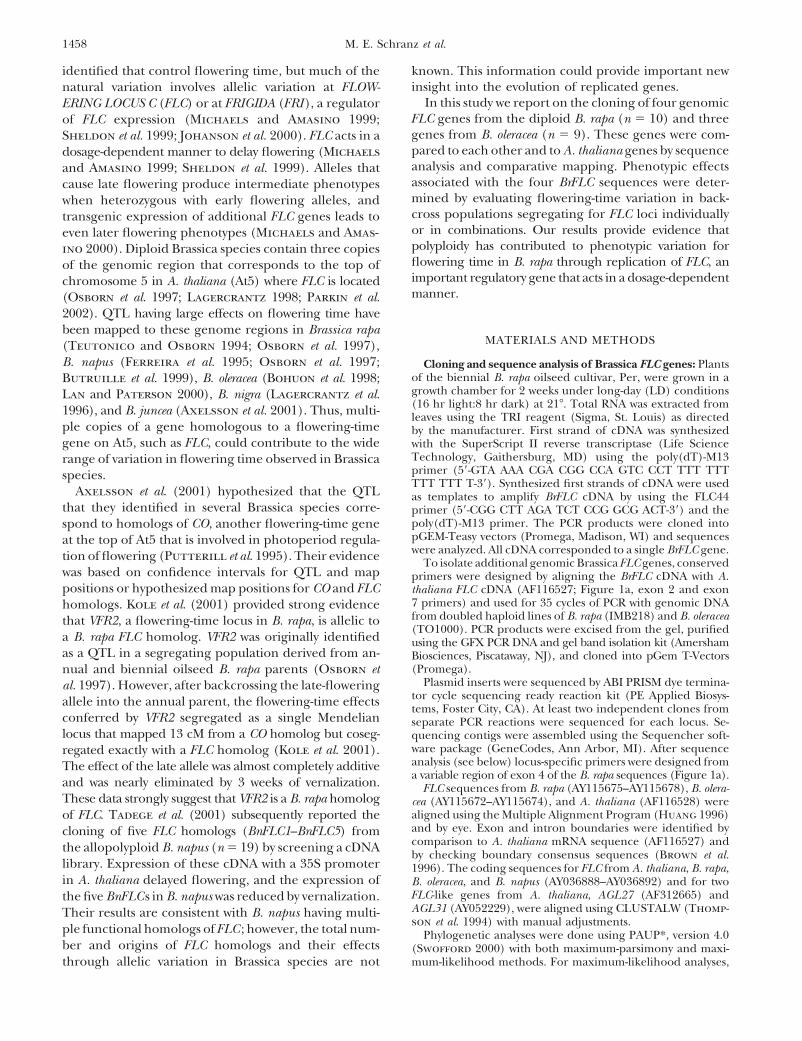
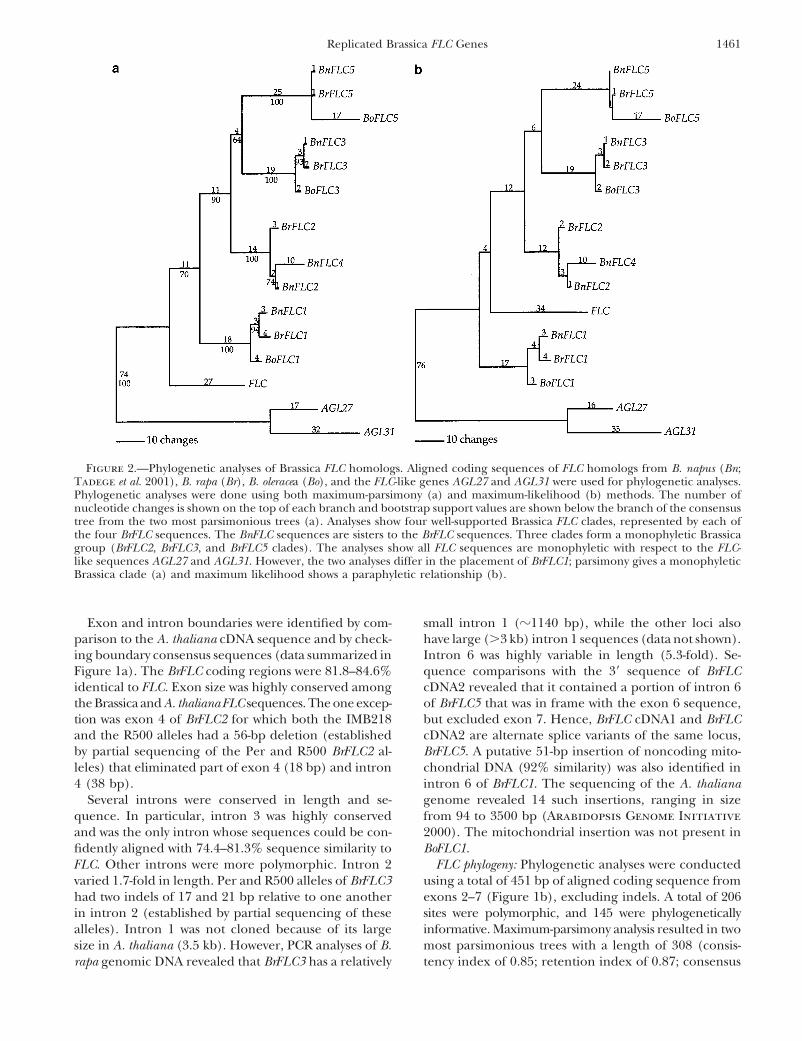
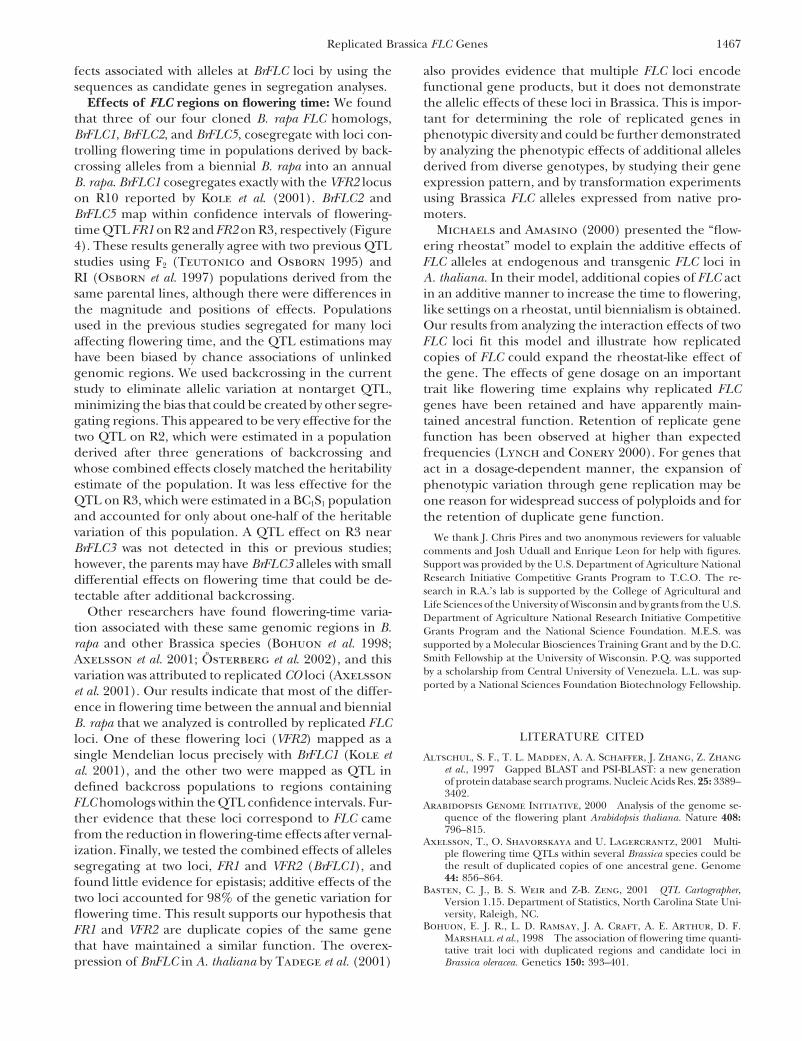
Figure 2.—Phylogenetic analyses of Brassica FLC homologs. Aligned coding sequences of FLC homologs from B. napus (Bn;Tadege et al. 2001), B. rapa (Br), B. oleracea (Bo), and the FLC-like genes AGL27 and AGL31 were used for phylogenetic analyses.Phylogenetic analyses were done using both maximum-parsimony (a) and maximum-likelihood (b) methods. The number ofnucleotide changes is shown on the top of each branch and bootstrap support values are shown below the branch of the consensustree from the two most parsimonious trees (a). Analyses show four well-supported Brassica FLC clades, represented by each ofthe four BrFLC sequences. The BnFLC sequences are sisters to the BrFLC sequences. Three clades form a monophyletic Brassicagroup (BrFLC2, BrFLC3, and BrFLC5 clades). The analyses show all FLC sequences are monophyletic with respect to the FLC-like sequences AGL27 and AGL31. However, the two analyses differ in the placement of BrFLC1; parsimony gives a monophyleticBrassica clade (a) and maximum likelihood shows a paraphyletic relationship (b).
Exon and intron boundaries were identified by com- small intron 1 (�1140 bp), while the other loci alsohave large (�3 kb) intron 1 sequences (data not shown).parison to the A. thaliana cDNA sequence and by check-
ing boundary consensus sequences (data summarized in Intron 6 was highly variable in length (5.3-fold). Se-quence comparisons with the 3� sequence of BrFLCFigure 1a). The BrFLC coding regions were 81.8–84.6%
identical to FLC. Exon size was highly conserved among cDNA2 revealed that it contained a portion of intron 6of BrFLC5 that was in frame with the exon 6 sequence,the Brassica and A. thaliana FLC sequences. The one excep-
tion was exon 4 of BrFLC2 for which both the IMB218 but excluded exon 7. Hence, BrFLC cDNA1 and BrFLCcDNA2 are alternate splice variants of the same locus,and the R500 alleles had a 56-bp deletion (established
by partial sequencing of the Per and R500 BrFLC2 al- BrFLC5. A putative 51-bp insertion of noncoding mito-chondrial DNA (92% similarity) was also identified inleles) that eliminated part of exon 4 (18 bp) and intron
4 (38 bp). intron 6 of BrFLC1. The sequencing of the A. thalianagenome revealed 14 such insertions, ranging in sizeSeveral introns were conserved in length and se-
quence. In particular, intron 3 was highly conserved from 94 to 3500 bp (Arabidopsis Genome Initiative2000). The mitochondrial insertion was not present inand was the only intron whose sequences could be con-
fidently aligned with 74.4–81.3% sequence similarity to BoFLC1.FLC phylogeny: Phylogenetic analyses were conductedFLC. Other introns were more polymorphic. Intron 2
varied 1.7-fold in length. Per and R500 alleles of BrFLC3 using a total of 451 bp of aligned coding sequence fromexons 2–7 (Figure 1b), excluding indels. A total of 206had two indels of 17 and 21 bp relative to one another
in intron 2 (established by partial sequencing of these sites were polymorphic, and 145 were phylogeneticallyinformative. Maximum-parsimony analysis resulted in twoalleles). Intron 1 was not cloned because of its large
size in A. thaliana (3.5 kb). However, PCR analyses of B. most parsimonious trees with a length of 308 (consis-tency index of 0.85; retention index of 0.87; consensusrapa genomic DNA revealed that BrFLC3 has a relatively
1462 M. E. Schranz et al.
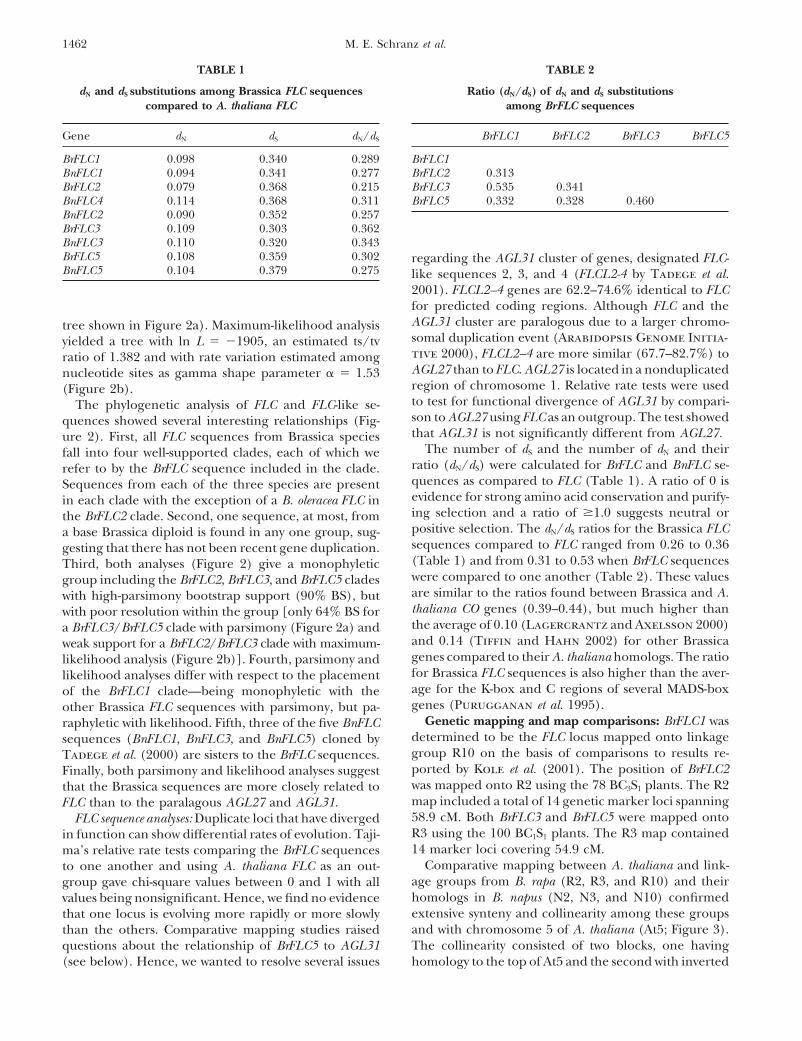
TABLE 2TABLE 1
dN and dS substitutions among Brassica FLC sequences Ratio (dN/dS) of dN and dS substitutionsamong BrFLC sequencescompared to A. thaliana FLC
Gene dN dS dN/dS BrFLC1 BrFLC2 BrFLC3 BrFLC5
BrFLC1BrFLC1 0.098 0.340 0.289BnFLC1 0.094 0.341 0.277 BrFLC2 0.313
BrFLC3 0.535 0.341BrFLC2 0.079 0.368 0.215BnFLC4 0.114 0.368 0.311 BrFLC5 0.332 0.328 0.460BnFLC2 0.090 0.352 0.257BrFLC3 0.109 0.303 0.362BnFLC3 0.110 0.320 0.343BrFLC5 0.108 0.359 0.302 regarding the AGL31 cluster of genes, designated FLC-BnFLC5 0.104 0.379 0.275 like sequences 2, 3, and 4 (FLCL2-4 by Tadege et al.
2001). FLCL2–4 genes are 62.2–74.6% identical to FLCfor predicted coding regions. Although FLC and theAGL31 cluster are paralogous due to a larger chromo-tree shown in Figure 2a). Maximum-likelihood analysissomal duplication event (Arabidopsis Genome Initia-yielded a tree with ln L � �1905, an estimated ts/tvtive 2000), FLCL2–4 are more similar (67.7–82.7%) toratio of 1.382 and with rate variation estimated amongAGL27 than to FLC. AGL27 is located in a nonduplicatednucleotide sites as gamma shape parameter � � 1.53region of chromosome 1. Relative rate tests were used(Figure 2b).to test for functional divergence of AGL31 by compari-The phylogenetic analysis of FLC and FLC-like se-son to AGL27 using FLC as an outgroup. The test showedquences showed several interesting relationships (Fig-that AGL31 is not significantly different from AGL27.ure 2). First, all FLC sequences from Brassica species
The number of dS and the number of dN and theirfall into four well-supported clades, each of which weratio (dN/dS) were calculated for BrFLC and BnFLC se-refer to by the BrFLC sequence included in the clade.quences as compared to FLC (Table 1). A ratio of 0 isSequences from each of the three species are presentevidence for strong amino acid conservation and purify-in each clade with the exception of a B. oleracea FLC ining selection and a ratio of �1.0 suggests neutral orthe BrFLC2 clade. Second, one sequence, at most, frompositive selection. The dN/dS ratios for the Brassica FLCa base Brassica diploid is found in any one group, sug-sequences compared to FLC ranged from 0.26 to 0.36gesting that there has not been recent gene duplication.(Table 1) and from 0.31 to 0.53 when BrFLC sequencesThird, both analyses (Figure 2) give a monophyleticwere compared to one another (Table 2). These valuesgroup including the BrFLC2, BrFLC3, and BrFLC5 cladesare similar to the ratios found between Brassica and A.with high-parsimony bootstrap support (90% BS), butthaliana CO genes (0.39–0.44), but much higher thanwith poor resolution within the group [only 64% BS forthe average of 0.10 (Lagercrantz and Axelsson 2000)a BrFLC3/BrFLC5 clade with parsimony (Figure 2a) andand 0.14 (Tiffin and Hahn 2002) for other Brassicaweak support for a BrFLC2/BrFLC3 clade with maximum-genes compared to their A. thaliana homologs. The ratiolikelihood analysis (Figure 2b)]. Fourth, parsimony andfor Brassica FLC sequences is also higher than the aver-likelihood analyses differ with respect to the placementage for the K-box and C regions of several MADS-boxof the BrFLC1 clade—being monophyletic with thegenes (Purugganan et al. 1995).other Brassica FLC sequences with parsimony, but pa-
Genetic mapping and map comparisons: BrFLC1 wasraphyletic with likelihood. Fifth, three of the five BnFLCdetermined to be the FLC locus mapped onto linkagesequences (BnFLC1, BnFLC3, and BnFLC5) cloned bygroup R10 on the basis of comparisons to results re-Tadege et al. (2000) are sisters to the BrFLC sequences.ported by Kole et al. (2001). The position of BrFLC2Finally, both parsimony and likelihood analyses suggestwas mapped onto R2 using the 78 BC3S1 plants. The R2that the Brassica sequences are more closely related tomap included a total of 14 genetic marker loci spanningFLC than to the paralagous AGL27 and AGL31.58.9 cM. Both BrFLC3 and BrFLC5 were mapped ontoFLC sequence analyses: Duplicate loci that have divergedR3 using the 100 BC1S1 plants. The R3 map containedin function can show differential rates of evolution. Taji-14 marker loci covering 54.9 cM.ma’s relative rate tests comparing the BrFLC sequences
Comparative mapping between A. thaliana and link-to one another and using A. thaliana FLC as an out-age groups from B. rapa (R2, R3, and R10) and theirgroup gave chi-square values between 0 and 1 with allhomologs in B. napus (N2, N3, and N10) confirmedvalues being nonsignificant. Hence, we find no evidenceextensive synteny and collinearity among these groupsthat one locus is evolving more rapidly or more slowlyand with chromosome 5 of A. thaliana (At5; Figure 3).than the others. Comparative mapping studies raisedThe collinearity consisted of two blocks, one havingquestions about the relationship of BrFLC5 to AGL31
(see below). Hence, we wanted to resolve several issues homology to the top of At5 and the second with inverted
1463Replicated Brassica FLC Genes
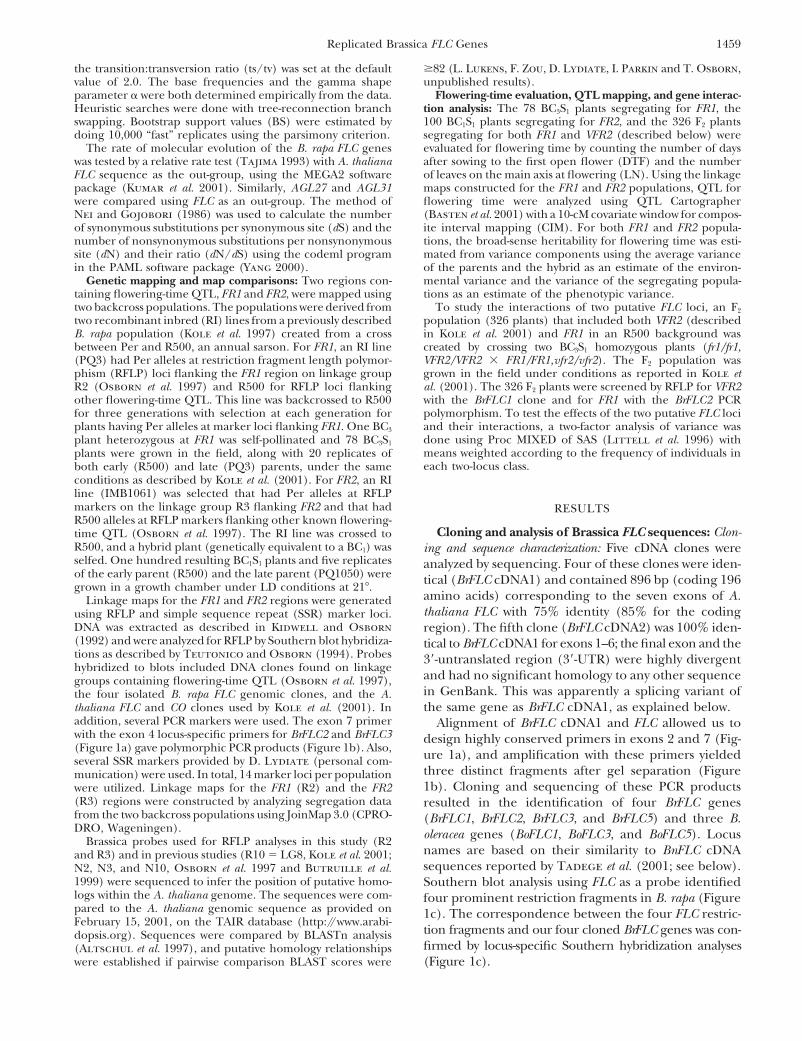
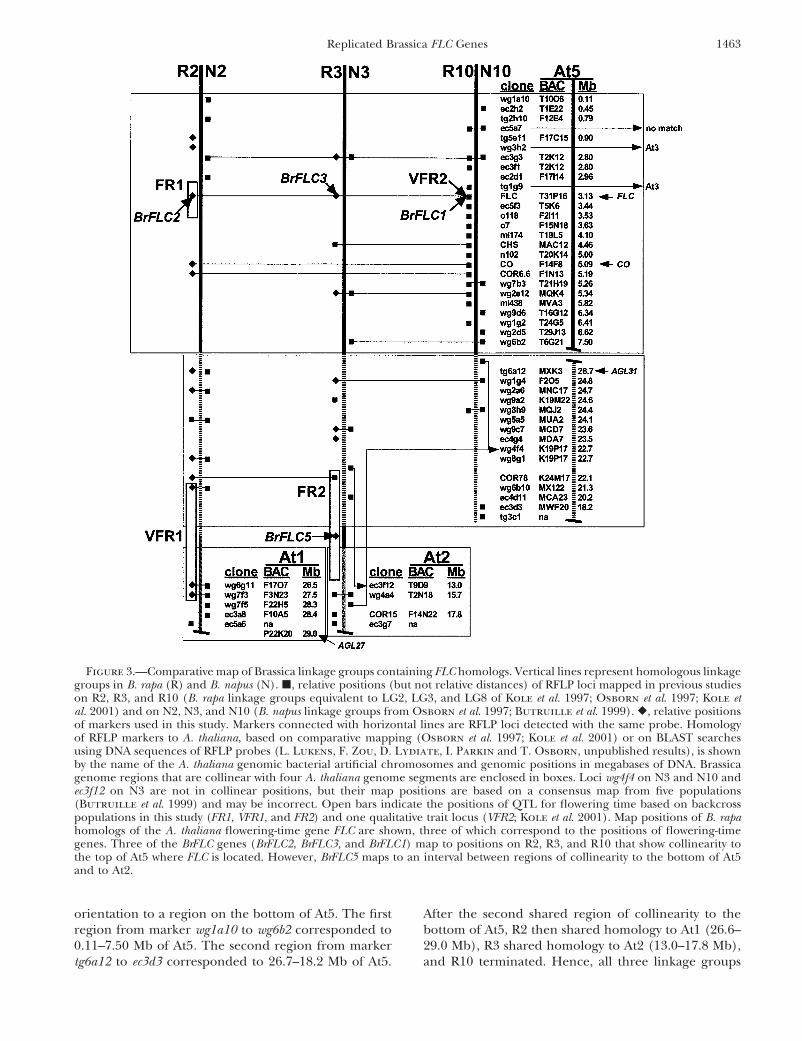
Figure 3.—Comparative map of Brassica linkage groups containing FLC homologs. Vertical lines represent homologous linkagegroups in B. rapa (R) and B. napus (N). �, relative positions (but not relative distances) of RFLP loci mapped in previous studieson R2, R3, and R10 (B. rapa linkage groups equivalent to LG2, LG3, and LG8 of Kole et al. 1997; Osborn et al. 1997; Kole etal. 2001) and on N2, N3, and N10 (B. napus linkage groups from Osborn et al. 1997; Butruille et al. 1999). �, relative positionsof markers used in this study. Markers connected with horizontal lines are RFLP loci detected with the same probe. Homologyof RFLP markers to A. thaliana, based on comparative mapping (Osborn et al. 1997; Kole et al. 2001) or on BLAST searchesusing DNA sequences of RFLP probes (L. Lukens, F. Zou, D. Lydiate, I. Parkin and T. Osborn, unpublished results), is shownby the name of the A. thaliana genomic bacterial artificial chromosomes and genomic positions in megabases of DNA. Brassicagenome regions that are collinear with four A. thaliana genome segments are enclosed in boxes. Loci wg4f4 on N3 and N10 andec3f12 on N3 are not in collinear positions, but their map positions are based on a consensus map from five populations(Butruille et al. 1999) and may be incorrect. Open bars indicate the positions of QTL for flowering time based on backcrosspopulations in this study (FR1, VFR1, and FR2) and one qualitative trait locus (VFR2; Kole et al. 2001). Map positions of B. rapahomologs of the A. thaliana flowering-time gene FLC are shown, three of which correspond to the positions of flowering-timegenes. Three of the BrFLC genes (BrFLC2, BrFLC3, and BrFLC1) map to positions on R2, R3, and R10 that show collinearity tothe top of At5 where FLC is located. However, BrFLC5 maps to an interval between regions of collinearity to the bottom of At5and to At2.
orientation to a region on the bottom of At5. The first After the second shared region of collinearity to thebottom of At5, R2 then shared homology to At1 (26.6–region from marker wg1a10 to wg6b2 corresponded to
0.11–7.50 Mb of At5. The second region from marker 29.0 Mb), R3 shared homology to At2 (13.0–17.8 Mb),and R10 terminated. Hence, all three linkage groupstg6a12 to ec3d3 corresponded to 26.7–18.2 Mb of At5.
1464 M. E. Schranz et al.
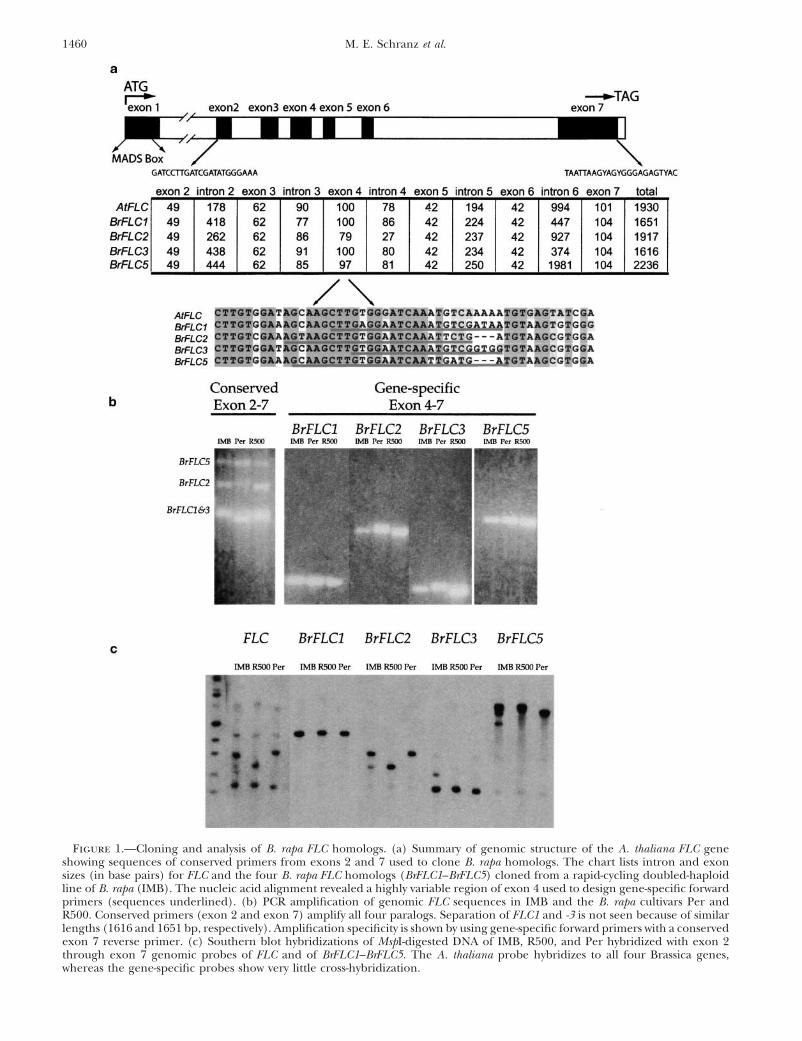
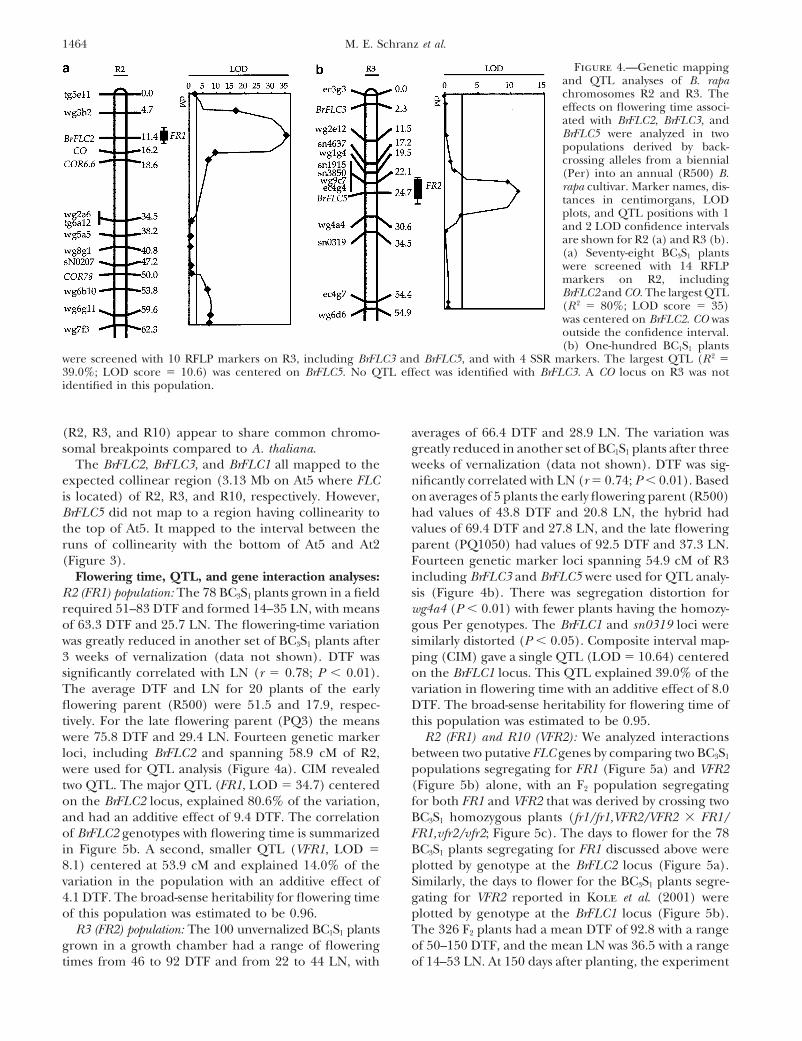
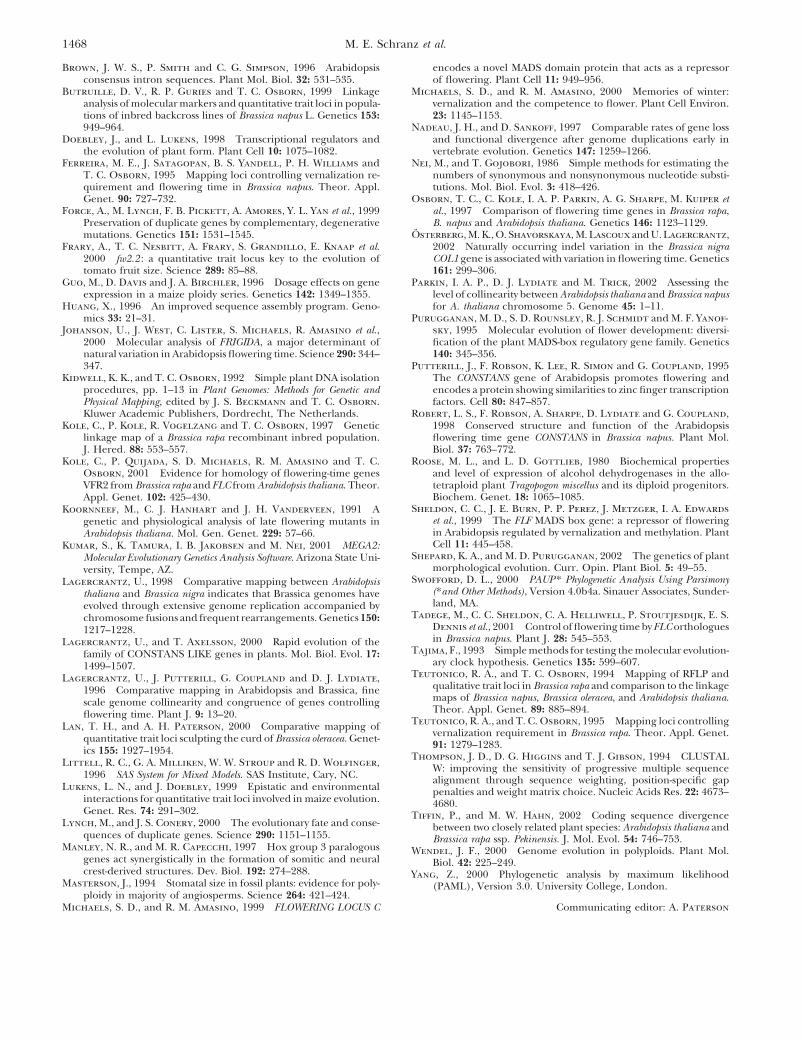
Figure 4.—Genetic mappingand QTL analyses of B. rapachromosomes R2 and R3. Theeffects on flowering time associ-ated with BrFLC2, BrFLC3, andBrFLC5 were analyzed in twopopulations derived by back-crossing alleles from a biennial(Per) into an annual (R500) B.rapa cultivar. Marker names, dis-tances in centimorgans, LODplots, and QTL positions with 1and 2 LOD confidence intervalsare shown for R2 (a) and R3 (b).(a) Seventy-eight BC3S1 plantswere screened with 14 RFLPmarkers on R2, includingBrFLC2 and CO. The largest QTL(R 2 � 80%; LOD score � 35)was centered on BrFLC2. CO wasoutside the confidence interval.(b) One-hundred BC1S1 plants
were screened with 10 RFLP markers on R3, including BrFLC3 and BrFLC5, and with 4 SSR markers. The largest QTL (R 2 �39.0%; LOD score � 10.6) was centered on BrFLC5. No QTL effect was identified with BrFLC3. A CO locus on R3 was notidentified in this population.
(R2, R3, and R10) appear to share common chromo- averages of 66.4 DTF and 28.9 LN. The variation wasgreatly reduced in another set of BC1S1 plants after threesomal breakpoints compared to A. thaliana.
The BrFLC2, BrFLC3, and BrFLC1 all mapped to the weeks of vernalization (data not shown). DTF was sig-nificantly correlated with LN (r � 0.74; P 0.01). Basedexpected collinear region (3.13 Mb on At5 where FLC
is located) of R2, R3, and R10, respectively. However, on averages of 5 plants the early flowering parent (R500)had values of 43.8 DTF and 20.8 LN, the hybrid hadBrFLC5 did not map to a region having collinearity to
the top of At5. It mapped to the interval between the values of 69.4 DTF and 27.8 LN, and the late floweringparent (PQ1050) had values of 92.5 DTF and 37.3 LN.runs of collinearity with the bottom of At5 and At2
(Figure 3). Fourteen genetic marker loci spanning 54.9 cM of R3including BrFLC3 and BrFLC5 were used for QTL analy-Flowering time, QTL, and gene interaction analyses:
R2 (FR1) population: The 78 BC3S1 plants grown in a field sis (Figure 4b). There was segregation distortion forwg4a4 (P 0.01) with fewer plants having the homozy-required 51–83 DTF and formed 14–35 LN, with means
of 63.3 DTF and 25.7 LN. The flowering-time variation gous Per genotypes. The BrFLC1 and sn0319 loci weresimilarly distorted (P 0.05). Composite interval map-was greatly reduced in another set of BC3S1 plants after
3 weeks of vernalization (data not shown). DTF was ping (CIM) gave a single QTL (LOD � 10.64) centeredon the BrFLC1 locus. This QTL explained 39.0% of thesignificantly correlated with LN (r � 0.78; P 0.01).
The average DTF and LN for 20 plants of the early variation in flowering time with an additive effect of 8.0DTF. The broad-sense heritability for flowering time offlowering parent (R500) were 51.5 and 17.9, respec-
tively. For the late flowering parent (PQ3) the means this population was estimated to be 0.95.R2 (FR1) and R10 (VFR2): We analyzed interactionswere 75.8 DTF and 29.4 LN. Fourteen genetic marker
loci, including BrFLC2 and spanning 58.9 cM of R2, between two putative FLC genes by comparing two BC3S1
populations segregating for FR1 (Figure 5a) and VFR2were used for QTL analysis (Figure 4a). CIM revealedtwo QTL. The major QTL (FR1, LOD � 34.7) centered (Figure 5b) alone, with an F2 population segregating
for both FR1 and VFR2 that was derived by crossing twoon the BrFLC2 locus, explained 80.6% of the variation,and had an additive effect of 9.4 DTF. The correlation BC3S1 homozygous plants (fr1/fr1,VFR2/VFR2 � FR1/
FR1,vfr2/vfr2; Figure 5c). The days to flower for the 78of BrFLC2 genotypes with flowering time is summarizedin Figure 5b. A second, smaller QTL (VFR1, LOD � BC3S1 plants segregating for FR1 discussed above were
plotted by genotype at the BrFLC2 locus (Figure 5a).8.1) centered at 53.9 cM and explained 14.0% of thevariation in the population with an additive effect of Similarly, the days to flower for the BC3S1 plants segre-
gating for VFR2 reported in Kole et al. (2001) were4.1 DTF. The broad-sense heritability for flowering timeof this population was estimated to be 0.96. plotted by genotype at the BrFLC1 locus (Figure 5b).
The 326 F2 plants had a mean DTF of 92.8 with a rangeR3 (FR2) population: The 100 unvernalized BC1S1 plantsgrown in a growth chamber had a range of flowering of 50–150 DTF, and the mean LN was 36.5 with a range
of 14–53 LN. At 150 days after planting, the experimenttimes from 46 to 92 DTF and from 22 to 44 LN, with

1465Replicated Brassica FLC Genes
To test the main and interaction effects of two BrFLCloci on flowering time, the F2 data were subjected to atwo-factor analysis of variance. The full genetic modelexplained 87% of the flowering-time variation. Ninety-eight percent of this genetic variation was due to theindividual additive effects of BrFLC1 (72.2%) andBrFLC2 (25.4%), similar to the results for the popula-tions with each gene segregating alone (Figure 5). Dom-inance at BrFLC1 was significant in the F2 population,as were some of the epistatic interactions, but in totalthese nonadditive effects explained only 2.4% of thegenetic variation.
DISCUSSION
Brassica species contain a wide range of morphologi-cal variations that have been selected for use as vegeta-bles, oilseeds, and condiments. The expression of thesevariations may be due, in part, to allelic variation atredundant copies of key regulatory genes controllingdevelopmental processes. Genes that affect phenotypesin a dosage-dependent manner would be particularlyeffective at expanding phenotypic diversity if they con-tained allelic variation at multiple functional copies.Our findings suggest that FLC is such a gene in B. rapa.
Cloning and analysis of Brassica FLC sequences: Us-ing a PCR-based cloning approach, we identified fourFLC homologs from B. rapa (named BrFLC1, BrFLC2,BrFLC3, and BrFLC5; Figure 1) and three B. oleraceahomologs (BoFLC1, BoFLC3, and BoFLC5). Our abilityto accurately identify and distinguish the different ho-mologs was established by locus-specific PCR (Figure1b) and by Southern blot analysis (Figure 1c). SouthernFigure 5.—Genetic effects for late-flowering alleles at FR1blot hybridization with the four individual BrFLC clones(BrFLC2) and VFR2 (BrFLC1). (a) Days to flowering for FR1accounted for all the restriction fragments detected bygenotypes segregating in a BC3S1 population and scored as
BrFLC2 marker classes. R/R, R/P, and P/P are homozygous hybridization with an A. thaliana FLC probe (FigureR500, heterozygous, and homozygous Per genotypes, respec- 1c). We were not able to clone a BoFLC2 sequence, andtively. Error bars represent the 95% confidence interval for Southern blot analysis suggested that this locus does notthe mean flowering time associated with each genotypic class.
exist or is highly diverged in the rapid cycling B. oleracea(b) Days to flowering for VFR2 genotypes segregating in aTO1000 (data not shown). However, additional loci areBC3S1 population and scored for BrFLC1 marker classes, as
reported by Kole et al. (2001). (c) Days to flowering for the likely in B. oleracea, including a tandem duplication ofnine genotypes of FR1 and VFR2 loci segregating in a single BoFLC1 (A. Millar, G. King and N. Salathia, personalpopulation and scored as BFLC1 and BFLC2 marker classes. communication).Each line represents a FR1 genotypic class at the three geno-
Our results using Tajima’s relative rate test do nottypes of VFR2. Data are from an F2 population (326 plants)support the hypothesis of differential rates of evolutionthat included both QTL segregating in an R500 background,
derived from a cross of two BC3S1 homozygous plants of the different Brassica FLC loci. Thus, we assumed(fr1fr1VFR2VFR2 � FR1FR1vfr2vfr2). Additive effects at the that differential rates of evolution would not complicatetwo QTL explain 98% of the genetic variation for flowering our phylogeny reconstructions. Our phylogenetic analy-time, suggesting that these QTL are duplicate copies of the
ses provide several interesting hypotheses for the originssame gene that have retained similar function.of the duplication events giving rise to multiple FLC lociin Brassica. If the duplication events in the Brassicalineage all took place following the divergence from thewas terminated with 18 plants having never flowered.
DNA from all plants was used to genotype at BrFLC1 Arabidopsis lineage, then the Brassica clade would bemonophyletic. Both analyses (Figure 2) give a monophy-and BrFLC2, giving nine genotypic classes. The days to
flower of the 326 F2 plants segregating for both FR1 and letic clade of BrFLC2, FLC3, and FLC5 (but with poorinternal resolution). However, parsimony analysis (Fig-VFR2 were plotted on the basis of genotype at both
BrFLC1 and BrFLC2 (Figure 5c). ure 2a) and the maximum-likelihood analysis (Figure 2b)
1466 M. E. Schranz et al.
differ in their placement of the BrFLC1 clade. Parsimony the bottom of At5 (Figure 3). Analyses of the A. thalianaanalysis has the BrFLC1 clade as being monophyletic genome sequence found that the region around andwith the BrFLC2, FLC3, and FLC5 clades (but with only including FLC (2.9–3.3 Mb) on the top of At5 was dupli-68% BS support) and maximum likelihood has the cated to the region from 26.4 to 27.1 Mb on the bottomBrFLC1 clade as sister to A. thaliana FLC and to the remain- of At5 (Arabidopsis Genome Initiative 2000). Thising Brassica FLC sequences. Hence, the phylogeny does duplicated region contains four similar tandem copiesnot resolve whether the duplication event leading to the of a MADS-box gene (FLCL2–4 of Tadege et al. 2001),BrFLC1 clade and the ancestor of the BrFLC2, -3, and -5 including AGL31, that are all presumably paralogs ofclades occurred before or after the divergence of the FLC. Although the proximity of BrFLC5 to the collinearBrassica and Arabidopsis lineages. region containing the AGL31 cluster suggests that
Our phylogeny reconstruction also shows that three BrFLC5 could be orthologous to one of these loci, severalof the five BnFLC sequences (BnFLC1, BnFLC3, and observations suggest that BrFLC5 is an ortholog of FLCBnFLC5) cloned by Tadege et al. (2001) are sisters to and not of AGL31. First, we tested if BrFLC5 might havethe BrFLC sequences, suggesting that these and probably several tandem copies of the gene, as the AGL31 regionBnFLC2 (Figure 2) are B. rapa FLC homologs from does. We observed no evidence for this on the basis ofB. napus. The homology of BnFLC4 is uncertain since Southern blot analysis of Per and R500 DNA using sixwe did not detect a BoFLC2. B. napus (n � 19) is an restriction enzymes (DraI, BamHI, MspI, CfoI, EcoRV,interspecific allopolyploid between B. rapa (n � 10) and and XbaI) and the BrFLC5 sequence as a probe (data notB. oleracea (n � 9). We obtained partial sequence of shown). Second, the comparative mapping data showedfour B. rapa and three B. oleracea FLC sequences, sug- that the orientations of the collinear regions betweengesting that at least seven FLC loci should be in B. napus. R3 and the bottom of At5 are inverted relative to oneTadege et al. (2001) obtained evidence for only five another (Figure 3). To explain the orthology of BrFLC5FLC loci in B. napus on the basis of their cDNA library and one of the AGL31 genes, one would have to hypoth-screening. Our unpublished mapping data with natural esize that the inversion event occurred after the fusionB. napus show at least seven FLC loci; thus the likely of the At2 and At5 regions, leaving the AGL31 orthologB. olereacea FLC homolog sequences in B. napus have yet at the breakpoint or some other complex chromosomalto be identified and merit additional study. rearrangement. Third, phylogenetic analyses clearly
Previous studies have established homology between show that BrFLC5 is more closely related to FLC thanthe top of chromosome 5 of A. thaliana and three Bras- to AGL31 (Figure 2). Finally, BrFLC5 does not appearsica linkage groups (Lagercrantz et al. 1996; Osborn to have changed more rapidly than any of the BrFLCet al. 1997; Bohuon et al. 1998; Parkin et al. 2002). Our
sequences, and relative rate tests of AGL31 with AGL27,analysis confirms these previous results, showing strong
using FLC as an out-group, did not give evidence ofcollinearity between regions of three B. rapa linkagedifferential rates of evolution. Hence, all lines of evi-groups (R2, R3, and R10) and the top of At5. We alsodence suggest that BrFLC5 is an ortholog of FLC andmapped FLC loci (BrFLC2, BrFLC3, and BrFLC1) at thenot of AGL31. Determination of how an FLC orthologpredicted collinear regions of R2, R3, and R10, respec-was duplicated and inserted in this location on R3 willtively (Figure 3). We attempted to map CO loci in therequire additional experimental work.At5 homologous regions of B. rapa because others have
Functional constraints may be reduced for duplicateargued that QTL mapping to these regions is due togenes, and we found mixed evidence for this for BrFLCalleles of this gene (Bohuon et al. 1998; Axelsson etgenes. The higher dN/dS ratios for BrFLC sequencesal. 2001). We identified polymorphisms that mapped tocompared to the average of other MADS-box genes andR2 and to R10, but none that mapped to R3. This couldthe large variation in intron length suggests that theysimply be due to a lack of allelic variation at or nearare not under strong purifying selection. Hence, theCO in our cross; however, efforts to clone CO homologsproteins have some flexibility to allow new amino acidresulted in only two cloned CO orthologs from B. nigrasequences. However, except for the deletion in BrFLC2,(Bni COa and BniCOb ; Lagercrantz and Axelssonthere is strong conservation for exon size, with only a2000) and only a single pair of homeologous CO se-few changes in amino acid chain length (Figure 1a).quences from N2 and N12 of polyploid B. napus (Rob-The flexibility for allowing amino acid substitutions,ert et al. 1998). Differences in the copy number andreflected in the high dN/dS ratios, could indicate thatorganization of Brassica CO and FLC loci, includingthe BrFLC sequences are undergoing rapid evolution,the presence of a fourth Brassica FLC locus (BrFLC5),as Lagercrantz and Axelsson (2000) argue for Bras-suggest that the two genes located only 2 Mb apart in thesica CO sequences. The higher ratio can be interpretedA. thaliana genome may have had different evolutionaryto mean either relaxed sequence constraint while main-pathways in Brassica species.taining function or selection for diverse sequences andWhereas BrFLC1, BrFLC2, and BrFLC3 map withinfunction. To test for conservation in function of thecollinear regions, BrFLC5 maps on R3 to the interval
between two stretches of collinearity with At2 and with different BrFLC loci, we determined the phenotypic ef-
1467Replicated Brassica FLC Genes
fects associated with alleles at BrFLC loci by using the also provides evidence that multiple FLC loci encodefunctional gene products, but it does not demonstratesequences as candidate genes in segregation analyses.
Effects of FLC regions on flowering time: We found the allelic effects of these loci in Brassica. This is impor-tant for determining the role of replicated genes inthat three of our four cloned B. rapa FLC homologs,
BrFLC1, BrFLC2, and BrFLC5, cosegregate with loci con- phenotypic diversity and could be further demonstratedby analyzing the phenotypic effects of additional allelestrolling flowering time in populations derived by back-
crossing alleles from a biennial B. rapa into an annual derived from diverse genotypes, by studying their geneexpression pattern, and by transformation experimentsB. rapa. BrFLC1 cosegregates exactly with the VFR2 locus
on R10 reported by Kole et al. (2001). BrFLC2 and using Brassica FLC alleles expressed from native pro-moters.BrFLC5 map within confidence intervals of flowering-
time QTL FR1 on R2 and FR2 on R3, respectively (Figure Michaels and Amasino (2000) presented the “flow-ering rheostat” model to explain the additive effects of4). These results generally agree with two previous QTL
studies using F2 (Teutonico and Osborn 1995) and FLC alleles at endogenous and transgenic FLC loci inA. thaliana. In their model, additional copies of FLC actRI (Osborn et al. 1997) populations derived from the
same parental lines, although there were differences in in an additive manner to increase the time to flowering,like settings on a rheostat, until biennialism is obtained.the magnitude and positions of effects. Populations
used in the previous studies segregated for many loci Our results from analyzing the interaction effects of twoFLC loci fit this model and illustrate how replicatedaffecting flowering time, and the QTL estimations may
have been biased by chance associations of unlinked copies of FLC could expand the rheostat-like effect ofthe gene. The effects of gene dosage on an importantgenomic regions. We used backcrossing in the current
study to eliminate allelic variation at nontarget QTL, trait like flowering time explains why replicated FLCgenes have been retained and have apparently main-minimizing the bias that could be created by other segre-
gating regions. This appeared to be very effective for the tained ancestral function. Retention of replicate genefunction has been observed at higher than expectedtwo QTL on R2, which were estimated in a population
derived after three generations of backcrossing and frequencies (Lynch and Conery 2000). For genes thatwhose combined effects closely matched the heritability act in a dosage-dependent manner, the expansion ofestimate of the population. It was less effective for the phenotypic variation through gene replication may beQTL on R3, which were estimated in a BC1S1 population one reason for widespread success of polyploids and forand accounted for only about one-half of the heritable the retention of duplicate gene function.variation of this population. A QTL effect on R3 near We thank J. Chris Pires and two anonymous reviewers for valuableBrFLC3 was not detected in this or previous studies; comments and Josh Uduall and Enrique Leon for help with figures.
Support was provided by the U.S. Department of Agriculture Nationalhowever, the parents may have BrFLC3 alleles with smallResearch Initiative Competitive Grants Program to T.C.O. The re-differential effects on flowering time that could be de-search in R.A.’s lab is supported by the College of Agricultural andtectable after additional backcrossing.Life Sciences of the University of Wisconsin and by grants from the U.S.
Other researchers have found flowering-time varia- Department of Agriculture National Research Initiative Competitivetion associated with these same genomic regions in B. Grants Program and the National Science Foundation. M.E.S. wasrapa and other Brassica species (Bohuon et al. 1998; supported by a Molecular Biosciences Training Grant and by the D.C.
Smith Fellowship at the University of Wisconsin. P.Q. was supportedAxelsson et al. 2001; Osterberg et al. 2002), and thisby a scholarship from Central University of Venezuela. L.L. was sup-variation was attributed to replicated CO loci (Axelssonported by a National Sciences Foundation Biotechnology Fellowship.et al. 2001). Our results indicate that most of the differ-
ence in flowering time between the annual and biennialB. rapa that we analyzed is controlled by replicated FLC
LITERATURE CITEDloci. One of these flowering loci (VFR2) mapped as asingle Mendelian locus precisely with BrFLC1 (Kole et Altschul, S. F., T. L. Madden, A. A. Schaffer, J. Zhang, Z. Zhang
et al., 1997 Gapped BLAST and PSI-BLAST: a new generational. 2001), and the other two were mapped as QTL inof protein database search programs. Nucleic Acids Res. 25: 3389–defined backcross populations to regions containing 3402.
FLC homologs within the QTL confidence intervals. Fur- Arabidopsis Genome Initiative, 2000 Analysis of the genome se-quence of the flowering plant Arabidopsis thaliana. Nature 408:ther evidence that these loci correspond to FLC came796–815.from the reduction in flowering-time effects after vernal-
Axelsson, T., O. Shavorskaya and U. Lagercrantz, 2001 Multi-ization. Finally, we tested the combined effects of alleles ple flowering time QTLs within several Brassica species could be
the result of duplicated copies of one ancestral gene. Genomesegregating at two loci, FR1 and VFR2 (BrFLC1), and44: 856–864.found little evidence for epistasis; additive effects of the
Basten, C. J., B. S. Weir and Z-B. Zeng, 2001 QTL Cartographer,two loci accounted for 98% of the genetic variation for Version 1.15. Department of Statistics, North Carolina State Uni-
versity, Raleigh, NC.flowering time. This result supports our hypothesis thatBohuon, E. J. R., L. D. Ramsay, J. A. Craft, A. E. Arthur, D. F.FR1 and VFR2 are duplicate copies of the same gene
Marshall et al., 1998 The association of flowering time quanti-that have maintained a similar function. The overex- tative trait loci with duplicated regions and candidate loci in
Brassica oleracea. Genetics 150: 393–401.pression of BnFLC in A. thaliana by Tadege et al. (2001)
1468 M. E. Schranz et al.
Brown, J. W. S., P. Smith and C. G. Simpson, 1996 Arabidopsis encodes a novel MADS domain protein that acts as a repressorof flowering. Plant Cell 11: 949–956.consensus intron sequences. Plant Mol. Biol. 32: 531–535.
Butruille, D. V., R. P. Guries and T. C. Osborn, 1999 Linkage Michaels, S. D., and R. M. Amasino, 2000 Memories of winter:vernalization and the competence to flower. Plant Cell Environ.analysis of molecular markers and quantitative trait loci in popula-
tions of inbred backcross lines of Brassica napus L. Genetics 153: 23: 1145–1153.Nadeau, J. H., and D. Sankoff, 1997 Comparable rates of gene loss949–964.
Doebley, J., and L. Lukens, 1998 Transcriptional regulators and and functional divergence after genome duplications early invertebrate evolution. Genetics 147: 1259–1266.the evolution of plant form. Plant Cell 10: 1075–1082.
Ferreira, M. E., J. Satagopan, B. S. Yandell, P. H. Williams and Nei, M., and T. Gojobori, 1986 Simple methods for estimating thenumbers of synonymous and nonsynonymous nucleotide substi-T. C. Osborn, 1995 Mapping loci controlling vernalization re-
quirement and flowering time in Brassica napus. Theor. Appl. tutions. Mol. Biol. Evol. 3: 418–426.Osborn, T. C., C. Kole, I. A. P. Parkin, A. G. Sharpe, M. Kuiper etGenet. 90: 727–732.
Force, A., M. Lynch, F. B. Pickett, A. Amores, Y. L. Yan et al., 1999 al., 1997 Comparison of flowering time genes in Brassica rapa,B. napus and Arabidopsis thaliana. Genetics 146: 1123–1129.Preservation of duplicate genes by complementary, degenerative
mutations. Genetics 151: 1531–1545. Osterberg, M. K., O. Shavorskaya, M. Lascoux and U. Lagercrantz,2002 Naturally occurring indel variation in the Brassica nigraFrary, A., T. C. Nesbitt, A. Frary, S. Grandillo, E. Knaap et al.
2000 fw2.2 : a quantitative trait locus key to the evolution of COL1 gene is associated with variation in flowering time. Genetics161: 299–306.tomato fruit size. Science 289: 85–88.
Guo, M., D. Davis and J. A. Birchler, 1996 Dosage effects on gene Parkin, I. A. P., D. J. Lydiate and M. Trick, 2002 Assessing thelevel of collinearity between Arabidopsis thaliana and Brassica napusexpression in a maize ploidy series. Genetics 142: 1349–1355.
Huang, X., 1996 An improved sequence assembly program. Geno- for A. thaliana chromosome 5. Genome 45: 1–11.Purugganan, M. D., S. D. Rounsley, R. J. Schmidt and M. F. Yanof-mics 33: 21–31.
Johanson, U., J. West, C. Lister, S. Michaels, R. Amasino et al., sky, 1995 Molecular evolution of flower development: diversi-fication of the plant MADS-box regulatory gene family. Genetics2000 Molecular analysis of FRIGIDA, a major determinant of
natural variation in Arabidopsis flowering time. Science 290: 344– 140: 345–356.Putterill, J., F. Robson, K. Lee, R. Simon and G. Coupland, 1995347.
Kidwell, K. K., and T. C. Osborn, 1992 Simple plant DNA isolation The CONSTANS gene of Arabidopsis promotes flowering andencodes a protein showing similarities to zinc finger transcriptionprocedures, pp. 1–13 in Plant Genomes: Methods for Genetic and
Physical Mapping, edited by J. S. Beckmann and T. C. Osborn. factors. Cell 80: 847–857.Robert, L. S., F. Robson, A. Sharpe, D. Lydiate and G. Coupland,Kluwer Academic Publishers, Dordrecht, The Netherlands.
Kole, C., P. Kole, R. Vogelzang and T. C. Osborn, 1997 Genetic 1998 Conserved structure and function of the Arabidopsisflowering time gene CONSTANS in Brassica napus. Plant Mol.linkage map of a Brassica rapa recombinant inbred population.
J. Hered. 88: 553–557. Biol. 37: 763–772.Roose, M. L., and L. D. Gottlieb, 1980 Biochemical propertiesKole, C., P. Quijada, S. D. Michaels, R. M. Amasino and T. C.
Osborn, 2001 Evidence for homology of flowering-time genes and level of expression of alcohol dehydrogenases in the allo-tetraploid plant Tragopogon miscellus and its diploid progenitors.VFR2 from Brassica rapa and FLC from Arabidopsis thaliana. Theor.Biochem. Genet. 18: 1065–1085.Appl. Genet. 102: 425–430.
Sheldon, C. C., J. E. Burn, P. P. Perez, J. Metzger, I. A. EdwardsKoornneef, M., C. J. Hanhart and J. H. Vanderveen, 1991 Aet al., 1999 The FLF MADS box gene: a repressor of floweringgenetic and physiological analysis of late flowering mutants inin Arabidopsis regulated by vernalization and methylation. PlantArabidopsis thaliana. Mol. Gen. Genet. 229: 57–66.Cell 11: 445–458.Kumar, S., K. Tamura, I. B. Jakobsen and M. Nei, 2001 MEGA2:
Shepard, K. A., and M. D. Purugganan, 2002 The genetics of plantMolecular Evolutionary Genetics Analysis Software. Arizona State Uni-morphological evolution. Curr. Opin. Plant Biol. 5: 49–55.versity, Tempe, AZ.
Swofford, D. L., 2000 PAUP* Phylogenetic Analysis Using ParsimonyLagercrantz, U., 1998 Comparative mapping between Arabidopsis(*and Other Methods), Version 4.0b4a. Sinauer Associates, Sunder-thaliana and Brassica nigra indicates that Brassica genomes haveland, MA.evolved through extensive genome replication accompanied by
Tadege, M., C. C. Sheldon, C. A. Helliwell, P. Stoutjesdijk, E. S.chromosome fusions and frequent rearrangements. Genetics 150:Dennis et al., 2001 Control of flowering time by FLC orthologues1217–1228.in Brassica napus. Plant J. 28: 545–553.Lagercrantz, U., and T. Axelsson, 2000 Rapid evolution of the
Tajima, F., 1993 Simple methods for testing the molecular evolution-family of CONSTANS LIKE genes in plants. Mol. Biol. Evol. 17:ary clock hypothesis. Genetics 135: 599–607.1499–1507.
Teutonico, R. A., and T. C. Osborn, 1994 Mapping of RFLP andLagercrantz, U., J. Putterill, G. Coupland and D. J. Lydiate,qualitative trait loci in Brassica rapa and comparison to the linkage1996 Comparative mapping in Arabidopsis and Brassica, finemaps of Brassica napus, Brassica oleracea, and Arabidopsis thaliana.scale genome collinearity and congruence of genes controllingTheor. Appl. Genet. 89: 885–894.flowering time. Plant J. 9: 13–20.
Teutonico, R. A., and T. C. Osborn, 1995 Mapping loci controllingLan, T. H., and A. H. Paterson, 2000 Comparative mapping ofvernalization requirement in Brassica rapa. Theor. Appl. Genet.quantitative trait loci sculpting the curd of Brassica oleracea. Genet- 91: 1279–1283.ics 155: 1927–1954. Thompson, J. D., D. G. Higgins and T. J. Gibson, 1994 CLUSTALLittell, R. C., G. A. Milliken, W. W. Stroup and R. D. Wolfinger, W: improving the sensitivity of progressive multiple sequence
1996 SAS System for Mixed Models. SAS Institute, Cary, NC. alignment through sequence weighting, position-specific gapLukens, L. N., and J. Doebley, 1999 Epistatic and environmental penalties and weight matrix choice. Nucleic Acids Res. 22: 4673–
interactions for quantitative trait loci involved in maize evolution. 4680.Genet. Res. 74: 291–302. Tiffin, P., and M. W. Hahn, 2002 Coding sequence divergence
Lynch, M., and J. S. Conery, 2000 The evolutionary fate and conse- between two closely related plant species: Arabidopsis thaliana andquences of duplicate genes. Science 290: 1151–1155. Brassica rapa ssp. Pekinensis. J. Mol. Evol. 54: 746–753.
Manley, N. R., and M. R. Capecchi, 1997 Hox group 3 paralogous Wendel, J. F., 2000 Genome evolution in polyploids. Plant Mol.genes act synergistically in the formation of somitic and neural Biol. 42: 225–249.crest-derived structures. Dev. Biol. 192: 274–288. Yang, Z., 2000 Phylogenetic analysis by maximum likelihood
Masterson, J., 1994 Stomatal size in fossil plants: evidence for poly- (PAML), Version 3.0. University College, London.ploidy in majority of angiosperms. Science 264: 421–424.
Michaels, S. D., and R. M. Amasino, 1999 FLOWERING LOCUS C Communicating editor: A. Paterson
Related Documents


