Chinese Geographical Science 2006 16(4) 351–358 DOI 10.1007/s11769-006-0351-4 www.springerlink.com Characteristics of Spatial and Temporal Variations of Monthly Mean Surface Air Temperature over Qinghai-Tibet Plateau ZHANG Qianggong 1, 2 , KANG Shichang 1, 3 , YAN Yuping 4 (1. Institute of Tibetan Plateau Research, Chinese Academy of Sciences, Beijing 100085, China; 2. Graduate University of Chinese Academy of Sciences, Beijing 100049, China; 3. Key Laboratory of Cryosphere and Environment, Chinese Academy of Sciences, Lanzhou 730000, China; 4. National Climate Center, Beijing 100081, China) Abstract: The recorded meteorological data of monthly mean surface air temperature from 72 meteorological stations over the Qinghai-Tibet Plateau in the period of 1960–2003 have been analyzed by using Empirical Orthogonal Function (EOF) method, to understand the detailed features of its temporal and spatial variations. The results show that there was a high consistency of the monthly mean surface air temperature, with a secondarily different variation between the north and the south of the plateau. Warming trend has existed at all stations since the 1960s, while the warming rates were different in various zones. The source regions of big rivers had intense warming tendency. June, November and De- cember were the top three fast-warming months since the 1960s; while April, July and September presented dramatic warming tendency during the last decade. Keywords: monthly mean surface air temperature; climatic variation; EOF analysis; Qinghai-Tibet Plateau 1 Introduction The Qinghai-Tibet Plateau, known as the highest plateau with the most complex topography in the world, covers an area of more than 200km 2 , with a mean elevation of more than 4000m a.s.l. (Ye and Gao, 1979). Surrounded by the Earth’s highest mountains, such as the Himalayas, Pamir, Kunlun Mountains, the plateau plays a significant role in climate change in China even in the world, thus attracted great attention of researchers. Up to now, many achievements have been gained by previous research works. Lin and Zhao (1996) indicated that surface air temperature (SAT) in the Qinghai-Tibet Plateau tended to increase in the last decades, and the climate is becoming much warmer now. Cai et al. (2003) indicated that SAT field of the plateau is highly consistent with spatial scale. Li Lin et al. (2003) also suggested that the mean, maxi- mum, and minimum SAT of the plateau exhibit identical spatial characteristics, with different variations in the north-south and west-east directions, and great landforms, especially major mountain ranges have great influences on the SAT spatial distribution. Recent works concen- trated on seasonal variation of SAT also showed that, SATs in summer and winter converge immediately and the convergence speed is faster in summer than in winter (Li et al., 2000). Wei et al. (2003) pointed out that warming trend was universal over the Qinghai-Tibet Plateau and those cooling phenomena were only ob- served in few stations in the period of 1962-1999; in summer and winter (October–May), warming rate was 0.02–0.03℃/yr in most of stations, while in the flood season (June–September), 0.01–0.02℃/yr, which was 0.01℃/yr lower than that of the former. Ma and Li (2003), Liu and Chen (2000) also proved this fact that SAT is increasing faster in spring and winter than in summer. Previous studies focused on the SAT trend for the whole Qinghai-Tibet Plateau and seasonal SAT varia- tions. However, few attentions have been paid to the spatial and temporal variations of monthly mean surface air temperature (MMSAT) in the plateau. Further un- derstanding of the monthly air temperature can provide more knowledge of the modern climate change in the plateau. In this paper, the recorded meteorological data of MMSAT from 72 meteorological stations over the Received date: 2006-07-10; accpted date: 2006-10-09 Foundation item: Under the auspices of the National Natural Science Foundation of China (No. 40401054, No. 40121101), Hundred Talents Program of Chinese Academy of Sciences, President Foundation of Chinese Academy of Sciences, Knowledge Innovation Program of Chinese Academy of Sciences (No. KZCX3-SW-339), National Basic Research Program of China (No. 2005CB422004) Biography: ZHANG Qianggong (1982–), male, a native of Nanyang of Henan Province, master candidate, specialized in snow/ice chemistry and climate change. E-mail: [email protected]

Welcome message from author
This document is posted to help you gain knowledge. Please leave a comment to let me know what you think about it! Share it to your friends and learn new things together.
Transcript
Chinese Geographical Science 2006 16(4) 351–358 DOI 10.1007/s11769-006-0351-4 www.springerlink.com
Characteristics of Spatial and Temporal Variations of Monthly Mean Surface Air Temperature over Qinghai-Tibet Plateau
ZHANG Qianggong1, 2, KANG Shichang1, 3, YAN Yuping4
(1. Institute of Tibetan Plateau Research, Chinese Academy of Sciences, Beijing 100085, China; 2. Graduate University of Chinese Academy of Sciences, Beijing 100049, China; 3. Key Laboratory of Cryosphere and Environment, Chinese Academy of Sciences, Lanzhou 730000, China; 4. National Climate Center, Beijing 100081, China)
Abstract: The recorded meteorological data of monthly mean surface air temperature from 72 meteorological stations over the Qinghai-Tibet Plateau in the period of 1960–2003 have been analyzed by using Empirical Orthogonal Function (EOF) method, to understand the detailed features of its temporal and spatial variations. The results show that there was a high consistency of the monthly mean surface air temperature, with a secondarily different variation between the north and the south of the plateau. Warming trend has existed at all stations since the 1960s, while the warming rates were different in various zones. The source regions of big rivers had intense warming tendency. June, November and De-cember were the top three fast-warming months since the 1960s; while April, July and September presented dramatic warming tendency during the last decade. Keywords: monthly mean surface air temperature; climatic variation; EOF analysis; Qinghai-Tibet Plateau
1 Introduction The Qinghai-Tibet Plateau, known as the highest plateau with the most complex topography in the world, covers an area of more than 200km2, with a mean elevation of more than 4000m a.s.l. (Ye and Gao, 1979). Surrounded by the Earth’s highest mountains, such as the Himalayas, Pamir, Kunlun Mountains, the plateau plays a significant role in climate change in China even in the world, thus attracted great attention of researchers. Up to now, many achievements have been gained by previous research works. Lin and Zhao (1996) indicated that surface air temperature (SAT) in the Qinghai-Tibet Plateau tended to increase in the last decades, and the climate is becoming much warmer now. Cai et al. (2003) indicated that SAT field of the plateau is highly consistent with spatial scale. Li Lin et al. (2003) also suggested that the mean, maxi-mum, and minimum SAT of the plateau exhibit identical spatial characteristics, with different variations in the north-south and west-east directions, and great landforms, especially major mountain ranges have great influences on the SAT spatial distribution. Recent works concen-
trated on seasonal variation of SAT also showed that, SATs in summer and winter converge immediately and the convergence speed is faster in summer than in winter (Li et al., 2000). Wei et al. (2003) pointed out that warming trend was universal over the Qinghai-Tibet Plateau and those cooling phenomena were only ob-served in few stations in the period of 1962-1999; in summer and winter (October–May), warming rate was 0.02–0.03℃/yr in most of stations, while in the flood season (June–September), 0.01–0.02℃/yr, which was 0.01℃/yr lower than that of the former. Ma and Li (2003), Liu and Chen (2000) also proved this fact that SAT is increasing faster in spring and winter than in summer.
Previous studies focused on the SAT trend for the whole Qinghai-Tibet Plateau and seasonal SAT varia-tions. However, few attentions have been paid to the spatial and temporal variations of monthly mean surface air temperature (MMSAT) in the plateau. Further un-derstanding of the monthly air temperature can provide more knowledge of the modern climate change in the plateau. In this paper, the recorded meteorological data of MMSAT from 72 meteorological stations over the
Received date: 2006-07-10; accpted date: 2006-10-09 Foundation item: Under the auspices of the National Natural Science Foundation of China (No. 40401054, No. 40121101), Hundred
Talents Program of Chinese Academy of Sciences, President Foundation of Chinese Academy of Sciences, Knowledge Innovation Program of Chinese Academy of Sciences (No. KZCX3-SW-339), National Basic Research Program of China (No. 2005CB422004)
Biography: ZHANG Qianggong (1982–), male, a native of Nanyang of Henan Province, master candidate, specialized in snow/ice chemistry and climate change. E-mail: [email protected]
ZHANG Qianggong, KANG Shichang, YAN Yuping
352
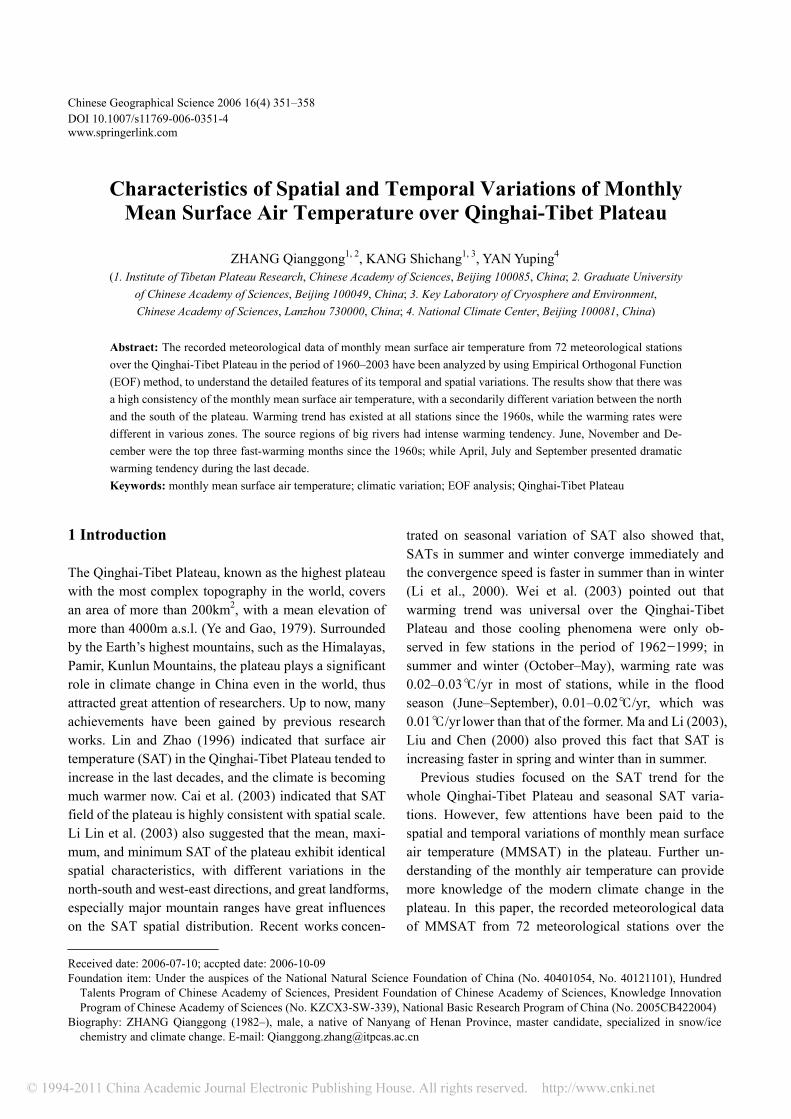
Qinghai-Tibet Plateau in the period of 1960–2003 were analyzed by using Empirical Orthogonal Function (EOF) method, to understand the detailed features of its tem-poral and spatial variations. 2 Materials and Methods Most meteorological stations in the Qinghai-Tibet Pla-teau were not established until the early 1950s, and some stations were moved or removed during the last few decades. Here, 72 meteorological stations (Fig. 1) were chosen according to the boundary of the plateau dis-cussed by Zhang et al. (2002), in which the extension of the Qinghai-Tibet Plateau was measured according to the elevation and topographical construction, all stations are higher than 2000m a.s.l. in elevation, including 21 sta-tions in Tibet, 26 in Qinghai, 21 in Sichuan, 3 in Yunnan and 1 in Gansu. Data from these stations were consecu-tive from 1960 to 2003, with very few absences in one or two stations and several months. Firstly these few miss-ing or clearly erroneous records of individual stations were replaced with estimated values from multiple re-gression relationships established among a few neighboring and highly correlated stations (α<0.01). This method has been applied by Wei et al. (2003) and Liu and Chen (2000), and was proved to be effective, and in-spection of the data showed that these were generally of good quality. Then EOF was performed on the normal-ized data set, and annual mean temperature was evaluated simultaneously.
3 Results and Discussion 3.1 Annual mean surface air temperature Table 1 presents variances (%) of the top ten loading components for annual mean surface air temperature based on EOF analysis. From Table 1 we can see that, the first EOF component contributes 63.8% to the total vari-ance, indicating that the convergence of temperature in the Qinghai-Tibet Plateau is fast though there exist extensive and complex terrains. The top three loading components account for more than 80% of the total variance, and oth-ers account for no more than 3%, respectively. The top ten loading components interpret 92.1% of the total variance of temperature field of the plateau.
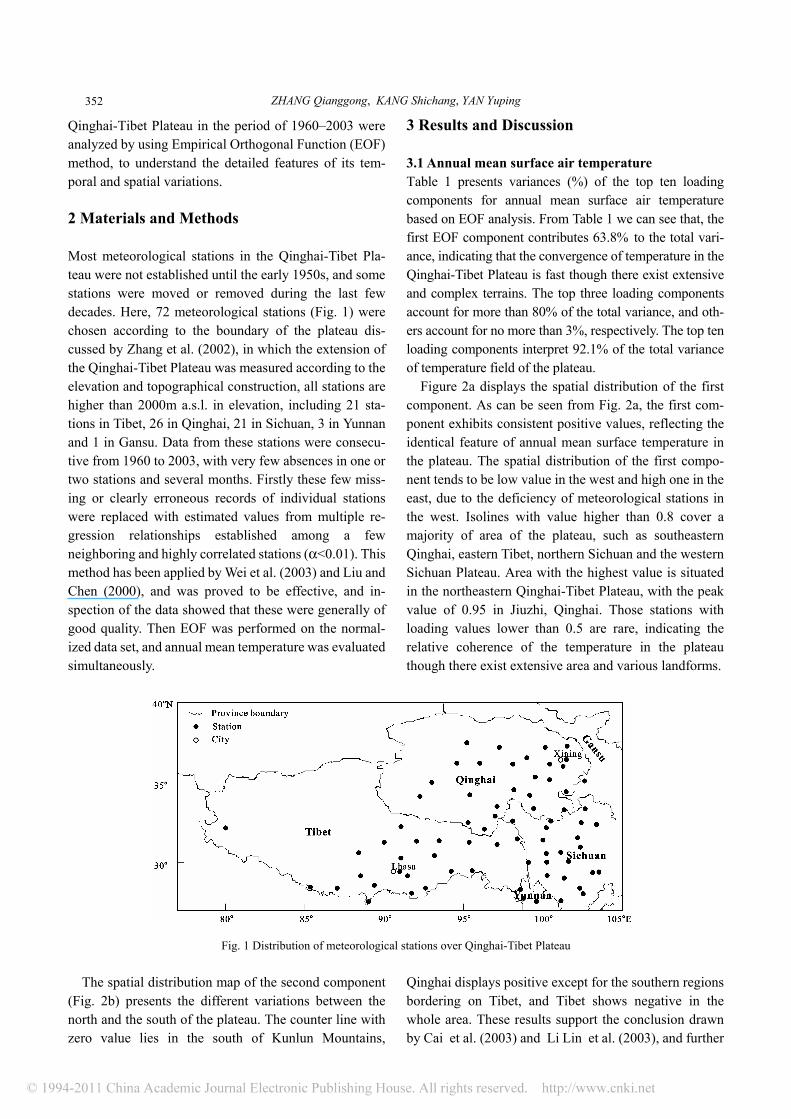
Figure 2a displays the spatial distribution of the first component. As can be seen from Fig. 2a, the first com-ponent exhibits consistent positive values, reflecting the identical feature of annual mean surface temperature in the plateau. The spatial distribution of the first compo-nent tends to be low value in the west and high one in the east, due to the deficiency of meteorological stations in the west. Isolines with value higher than 0.8 cover a majority of area of the plateau, such as southeastern Qinghai, eastern Tibet, northern Sichuan and the western Sichuan Plateau. Area with the highest value is situated in the northeastern Qinghai-Tibet Plateau, with the peak value of 0.95 in Jiuzhi, Qinghai. Those stations with loading values lower than 0.5 are rare, indicating the relative coherence of the temperature in the plateau though there exist extensive area and various landforms.
Fig. 1 Distribution of meteorological stations over Qinghai-Tibet Plateau
The spatial distribution map of the second component (Fig. 2b) presents the different variations between the north and the south of the plateau. The counter line with zero value lies in the south of Kunlun Mountains,
Qinghai displays positive except for the southern regions bordering on Tibet, and Tibet shows negative in the whole area. These results support the conclusion drawn by Cai et al. (2003) and Li Lin et al. (2003), and further
Characteristics of Spatial and Temporal Variations of Monthly Mean Surface Air Temperature over Qinghai-Tibet Plateau
353
Table 1 Variance percentage of EOF components for annual SAT over Qinghai-Tibet Plateau (%)
1 2 3 4 5 6 7 8 9 10
Variance 63.8 10.6 6.6 2.8 2.4 1.8 1.7 1.3 1.0 0.9 Accumulation 63.8 74.4 81.0 83.8 86.2 88.0 89.7 91.0 92.0 92.9
Fig. 2 First (a) and second (b) EOF components for annual SAT over Qinghai-Tibet Plateau
confirm a primary feature of great consistency, with secondarily different variations between the north and the south for the plateau. The spatial distribution map of the third component (not shown) reflects the different variations between the east and the west, namely “positive in the east while negative in the west”. It is uncertain to confirm this spa-tial feature owing to relative fewer stations in the west (only 8 stations in the east of 90°E ), but interestingly, the detailed spatial pattern obviously shows that those posi-tive high-value areas are almost just the high-value cov-ered area in the first component distribution map, such as the southeastern Qinghai, northern Sichuan and the western Sichuan Plateau, indicating the great represen-tative of these areas for the climate in the plateau and relative difference in the dominant regions and others.
Notably, 22 stations in the source regions of rivers are situated in the high-value area of the first component distribution map without exception, among which 10 stations have the values higher than 0.9, reflecting the intensive warming trend in these regions. For the reasons
of frangible and sensitive environment in the source regions of the Changjiang (Yangtze) River, and intensive response to the climate changes, such as glacier retreat, permafrost degradation, wetland dryness, and lake shrinking (Yang et al., 2004), it deserves the special at-tention to be paid to these unusual warming regions.
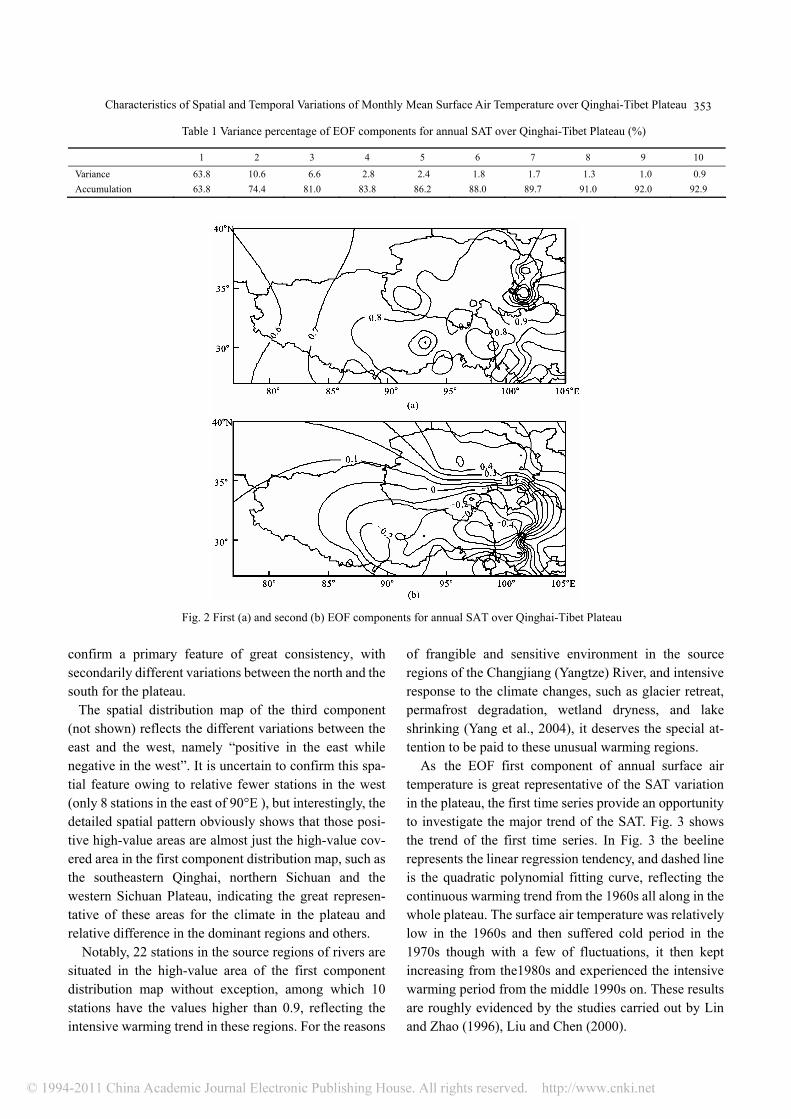
As the EOF first component of annual surface air temperature is great representative of the SAT variation in the plateau, the first time series provide an opportunity to investigate the major trend of the SAT. Fig. 3 shows the trend of the first time series. In Fig. 3 the beeline represents the linear regression tendency, and dashed line is the quadratic polynomial fitting curve, reflecting the continuous warming trend from the 1960s all along in the whole plateau. The surface air temperature was relatively low in the 1960s and then suffered cold period in the 1970s though with a few of fluctuations, it then kept increasing from the1980s and experienced the intensive warming period from the middle 1990s on. These results are roughly evidenced by the studies carried out by Lin and Zhao (1996), Liu and Chen (2000).
ZHANG Qianggong, KANG Shichang, YAN Yuping
354
Y-axis refers to time proxy without dimension Fig. 3 Variation of the first EOF time series for the annual
mean air temperature over Qinghai-Tibet Plateau
3.2 EOF analysis of MMSAT Table 2 summarized the variances (%) results of EOF analysis on MMSAT. Results show that the MMSAT converges immediately, the first EOF component for each month contributes more than 50% of the total variance except for few months, indicating the significant coherence of MMSAT variations. The first EOF com-ponent accounts for the highest variances in February and April, but relatively low in summer and winter, which possibly reflects the complexity of the temperature field in the warmest and coldest seasons.
Table 2 Variance of EOF component of MMSAT in Qinghai-Tibet Plateau (%)
1 2 3 4 5 6 7 8 9 10 January 51.5 15.9 5.2 4.4 3.5 2.5 1.9 1.7 1.6 1.4 Feburary 64.7 13.4 4.1 3.1 2.3 1.7 1.5 1.2 0.9 0.9 March 56.5 22.2 4.6 2.9 2.5 1.6 1.3 1.1 0.9 0.8 April 64.3 13.5 6.0 3.3 2.0 1.7 1.3 1.0 0.9 0.7 May 52.7 15.0 10.7 4.0 3.5 2.2 2.0 1.4 1.1 0.9 June 57.3 12.6 7.3 4.5 4.1 2.3 1.8 1.4 1.1 0.9 July 53.7 12.7 8.8 5.1 3.2 2.7 1.8 1.6 1.4 1.1 August 53.6 12.4 9.8 4.7 3.0 2.9 1.7 1.5 1.2 1.0 September 61.4 10.2 8.3 3.5 2.8 1.8 1.7 1.4 1.1 0.9 October 59.4 13.7 6.6 4.5 2.7 1.9 1.6 1.5 1.0 0.9 November 49.2 19.9 6.7 4.6 2.4 2.2 2.0 1.6 1.3 1.2 December 45.7 18.0 6.1 4.7 3.4 2.5 2.3 2.0 1.7 1.5
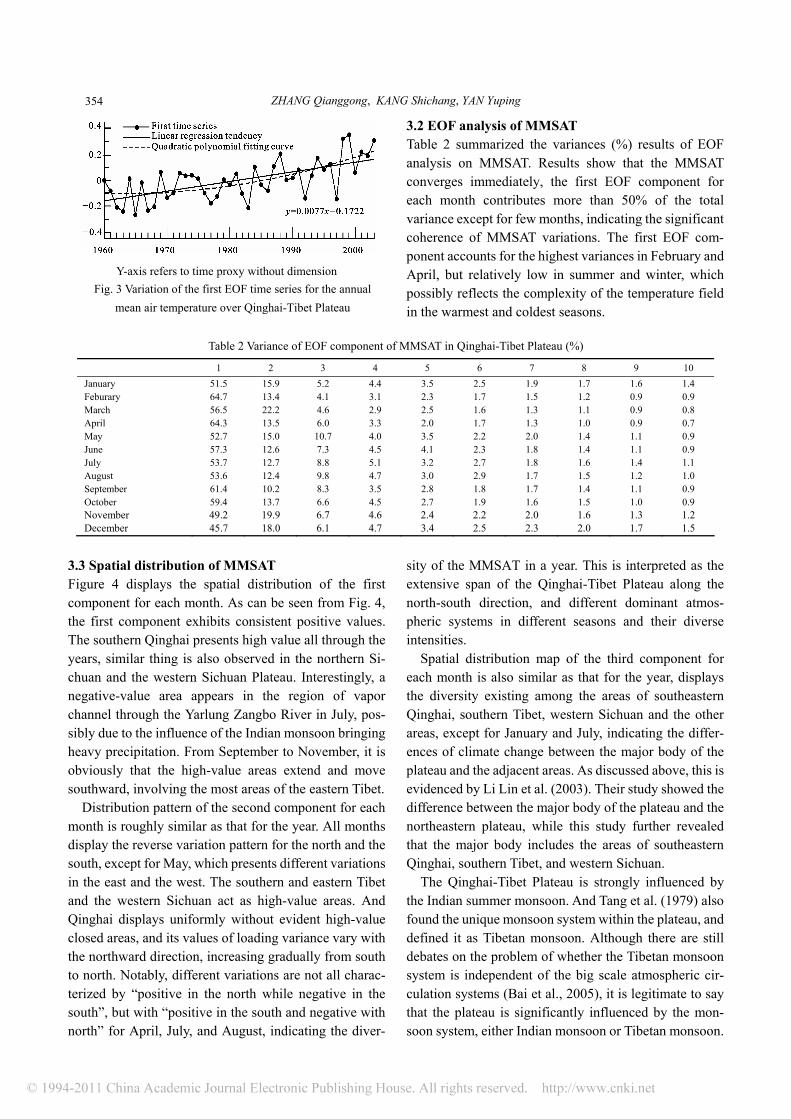
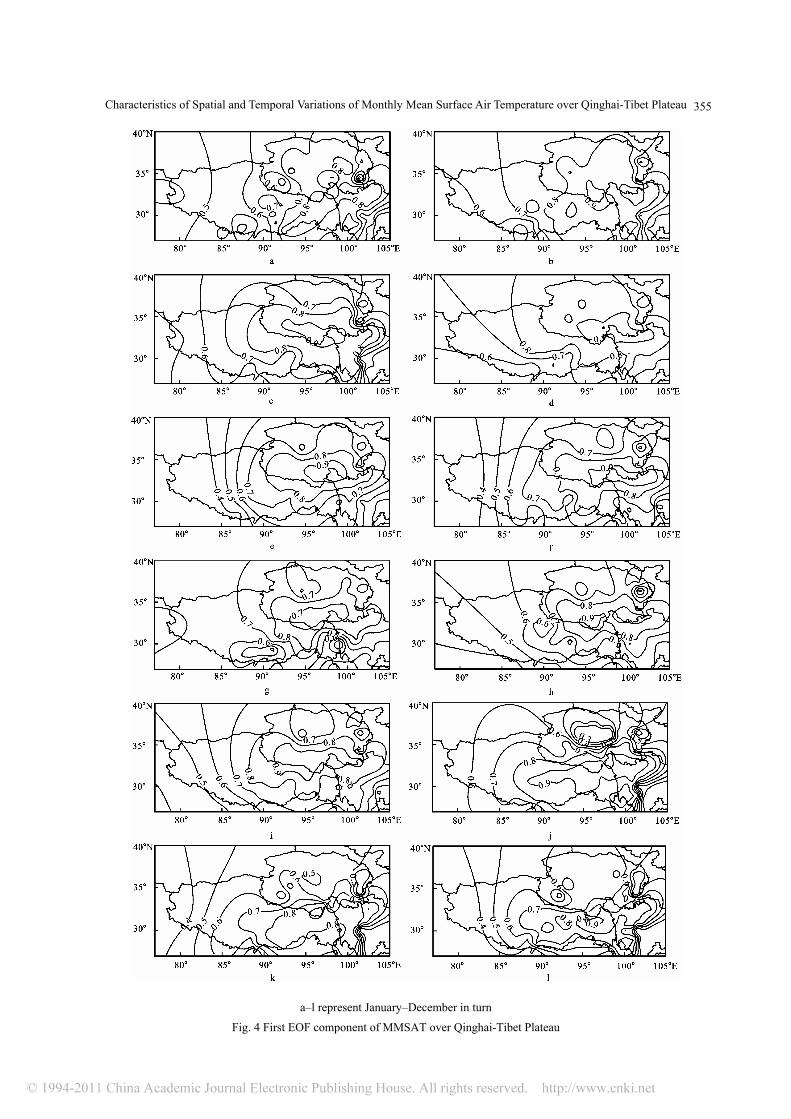
3.3 Spatial distribution of MMSAT Figure 4 displays the spatial distribution of the first component for each month. As can be seen from Fig. 4, the first component exhibits consistent positive values. The southern Qinghai presents high value all through the years, similar thing is also observed in the northern Si-chuan and the western Sichuan Plateau. Interestingly, a negative-value area appears in the region of vapor channel through the Yarlung Zangbo River in July, pos-sibly due to the influence of the Indian monsoon bringing heavy precipitation. From September to November, it is obviously that the high-value areas extend and move southward, involving the most areas of the eastern Tibet.
Distribution pattern of the second component for each month is roughly similar as that for the year. All months display the reverse variation pattern for the north and the south, except for May, which presents different variations in the east and the west. The southern and eastern Tibet and the western Sichuan act as high-value areas. And Qinghai displays uniformly without evident high-value closed areas, and its values of loading variance vary with the northward direction, increasing gradually from south to north. Notably, different variations are not all charac-terized by “positive in the north while negative in the south”, but with “positive in the south and negative with north” for April, July, and August, indicating the diver-
sity of the MMSAT in a year. This is interpreted as the extensive span of the Qinghai-Tibet Plateau along the north-south direction, and different dominant atmos-pheric systems in different seasons and their diverse intensities.
Spatial distribution map of the third component for each month is also similar as that for the year, displays the diversity existing among the areas of southeastern Qinghai, southern Tibet, western Sichuan and the other areas, except for January and July, indicating the differ-ences of climate change between the major body of the plateau and the adjacent areas. As discussed above, this is evidenced by Li Lin et al. (2003). Their study showed the difference between the major body of the plateau and the northeastern plateau, while this study further revealed that the major body includes the areas of southeastern Qinghai, southern Tibet, and western Sichuan.
The Qinghai-Tibet Plateau is strongly influenced by the Indian summer monsoon. And Tang et al. (1979) also found the unique monsoon system within the plateau, and defined it as Tibetan monsoon. Although there are still debates on the problem of whether the Tibetan monsoon system is independent of the big scale atmospheric cir-culation systems (Bai et al., 2005), it is legitimate to say that the plateau is significantly influenced by the mon-soon system, either Indian monsoon or Tibetan monsoon.
Characteristics of Spatial and Temporal Variations of Monthly Mean Surface Air Temperature over Qinghai-Tibet Plateau
355
a–l represent January–December in turn
Fig. 4 First EOF component of MMSAT over Qinghai-Tibet Plateau
ZHANG Qianggong, KANG Shichang, YAN Yuping
356
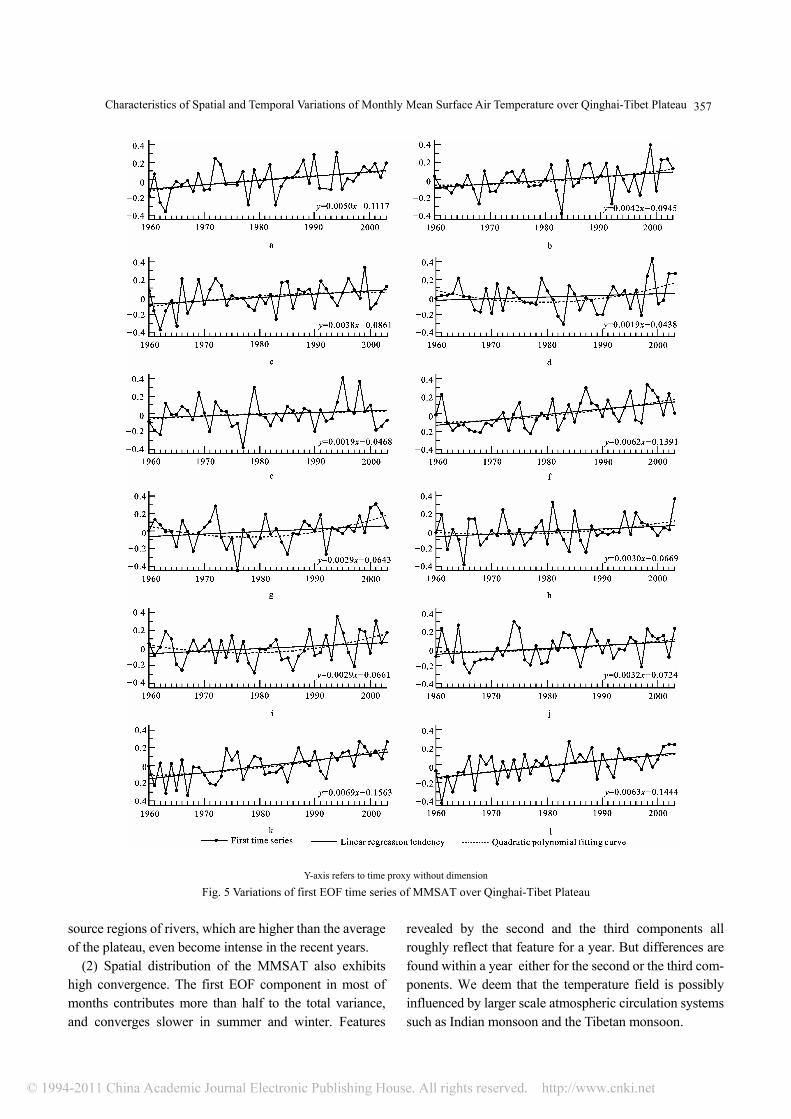
As discussed above, the first component is highly inter-pretive of the warming trend for the whole plateau, and the secondary feature is characterized by the reverse variation pattern for the north and the south, possibly due to the impact of summer Indian monsoon, controlling most southern area of the plateau. The reason for the feature revealed by the third component is probably at-tributed to the major body controlled by the Tibetan monsoon. In all, large scale monsoon system is possibly the major attribution of the MMSAT in Qinghai-Tibet Plateau, its strength and controlling extension possibly have great impacts on the climate change in the plateau. 3.4 First time series for each month Figure 5 presents the first time series curve, linear re-gression tendency (beeline), and the quadratic polyno-mial fitting curve (dashed line) for each month. We can see that the MMSAT of each month increases at different rates, among them, January, February, March, June, November, and December exhibit relatively high warm-ing trend, indicating higher warming rates in winter. The quadratic polynomial fitting curves clearly reveal the basic variation tendency of the MMSAT for each month, i.e., “high-low-high”, especially for April, July, and September, reflecting the intense warming trend in the recent periods for these three months. As discussed above, it has long been perceived that the surface air temperature increases faster in spring and winter than in summer. This study suggests that the warming trend not only results from the continuous warming in winter season, but also attributes to other seasons, thus calls more emphases on considering these top-warming months when forecasting the climate change in the plateau.
It has long been perceived that there was a cooling trend in Sichuan basin and its surrounding areas and the trend was still continuing (Ren et al., 2005). Our study shows that the first time series displays warming ten-dency for every month, though many stations in Sichuan are involved in this study, suggesting the uniform char-acteristics of the MMSAT. The selected stations are all above 2000m a.s.l, and cooling trend only exists in those area with low elevation as discussed in previous works. Though complicated reasons are under investigating, the coherent warming trend in major body of the plateau indicating the different variation of the MMSAT between this unique region and its nearby areas, especially be-tween the areas with high elevation and those lower areas. The warming trend was also evidenced by Li Chuan et al. (2003), and Liu and Chen (2000), they indicated that in
the southwestern plateau there was only a weak warming trend, and there was also an increase in warming rate with the elevation in the plateau and its surrounding areas. In all, within the major body of the plateau, warming trend is manifest at different rates in different areas.
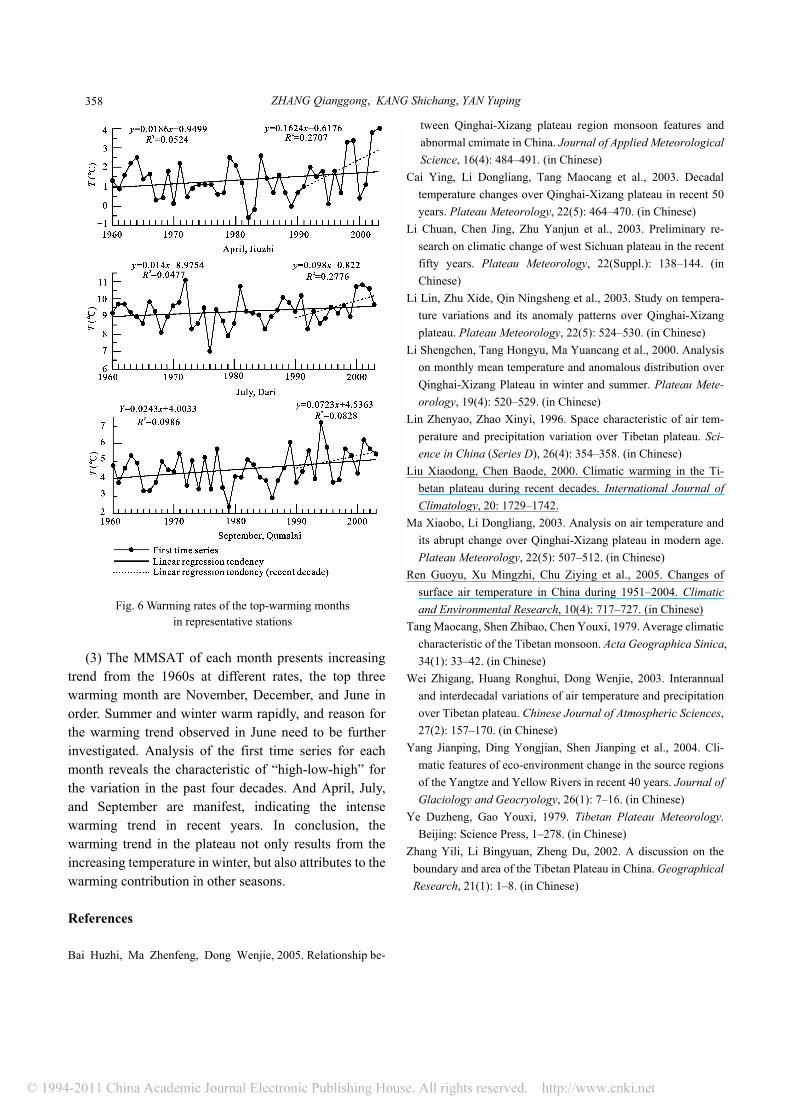
In order to further understand the top-warming months, data from representative stations such as Jiuzhi (April), Dari (July), and Qumalai (September) are chosen to evaluate the warming rates. Results show that warming rates since the 1990s are much higher than those since the 1960s (Fig. 6). Warming rates in recent decade are 0.16℃/yr for Jiuzhi, 0.098℃/yr for Dari, and 0.072℃/yr for Qumalai respectively, which are far greater than those from the 1960s, respectively. We have to note that these three stations are all located in the source regions of rivers, which further supports the conclusion that these regions exhibit unusual warming trend in recent years. It seems that warming in spring and summer contributes more to the whole warming trend than that of winter (Yang et al., 2004).
4 Conclusions The recorded meteorological data of MMSAT from 72 meteorological stations over the Qinghai-Tibet Plateau in the period of 1960–2003 have been analyzed by using Empirical Orthogonal Function (EOF) method, to un-derstand the detailed features of its spatial and temporal variations. Following conclusions are drawn from the study.
(1) The annual mean surface air temperature is highly consistent on spatial scale. EOF analysis showed that, the first EOF component contributes 63.8% to the total vari-ance, indicating the coherence of the annual mean surface air temperature in the plateau though there exists extensive and complex terrain. The second component displays the reverse variation pattern for the north and the south, pos-sibly due to the influence of Indian monsoon in different areas. The features revealed by the third component is characterized by the diversity existing between the major body of the plateau and the nearby areas, including southeastern Qinghai, southern Tibet, and western Sichuan and the other areas. The first time series shows the con-tinuous warming trend from the 1960s. The surface air temperature was relatively low in the 1960s and then suf-fered cold period in the 1970s though with a few of fluc-tuations. It then kept increasing from the1980s, and ex-perienced the intensive warming period from the middle 1990s on. Unusual warming trends are observed in the
Characteristics of Spatial and Temporal Variations of Monthly Mean Surface Air Temperature over Qinghai-Tibet Plateau
357
Y-axis refers to time proxy without dimension
Fig. 5 Variations of first EOF time series of MMSAT over Qinghai-Tibet Plateau
source regions of rivers, which are higher than the average of the plateau, even become intense in the recent years.
(2) Spatial distribution of the MMSAT also exhibits high convergence. The first EOF component in most of months contributes more than half to the total variance, and converges slower in summer and winter. Features
revealed by the second and the third components all roughly reflect that feature for a year. But differences are found within a year either for the second or the third com- ponents. We deem that the temperature field is possibly influenced by larger scale atmospheric circulation systems such as Indian monsoon and the Tibetan monsoon.
ZHANG Qianggong, KANG Shichang, YAN Yuping
358
Fig. 6 Warming rates of the top-warming months
in representative stations (3) The MMSAT of each month presents increasing
trend from the 1960s at different rates, the top three warming month are November, December, and June in order. Summer and winter warm rapidly, and reason for the warming trend observed in June need to be further investigated. Analysis of the first time series for each month reveals the characteristic of “high-low-high” for the variation in the past four decades. And April, July, and September are manifest, indicating the intense warming trend in recent years. In conclusion, the warming trend in the plateau not only results from the increasing temperature in winter, but also attributes to the warming contribution in other seasons.
References
Bai Huzhi, Ma Zhenfeng, Dong Wenjie, 2005. Relationship be-
tween Qinghai-Xizang plateau region monsoon features and abnormal cmimate in China. Journal of Applied Meteorological Science, 16(4): 484–491. (in Chinese)
Cai Ying, Li Dongliang, Tang Maocang et al., 2003. Decadal temperature changes over Qinghai-Xizang plateau in recent 50 years. Plateau Meteorology, 22(5): 464–470. (in Chinese)
Li Chuan, Chen Jing, Zhu Yanjun et al., 2003. Preliminary re-search on climatic change of west Sichuan plateau in the recent fifty years. Plateau Meteorology, 22(Suppl.): 138–144. (in Chinese)
Li Lin, Zhu Xide, Qin Ningsheng et al., 2003. Study on tempera-ture variations and its anomaly patterns over Qinghai-Xizang plateau. Plateau Meteorology, 22(5): 524–530. (in Chinese)
Li Shengchen, Tang Hongyu, Ma Yuancang et al., 2000. Analysis on monthly mean temperature and anomalous distribution over Qinghai-Xizang Plateau in winter and summer. Plateau Mete-orology, 19(4): 520–529. (in Chinese)
Lin Zhenyao, Zhao Xinyi, 1996. Space characteristic of air tem-perature and precipitation variation over Tibetan plateau. Sci-ence in China (Series D), 26(4): 354–358. (in Chinese)
Liu Xiaodong, Chen Baode, 2000. Climatic warming in the Ti-betan plateau during recent decades. International Journal of Climatology, 20: 1729–1742.
Ma Xiaobo, Li Dongliang, 2003. Analysis on air temperature and its abrupt change over Qinghai-Xizang plateau in modern age. Plateau Meteorology, 22(5): 507–512. (in Chinese)
Ren Guoyu, Xu Mingzhi, Chu Ziying et al., 2005. Changes of surface air temperature in China during 1951–2004. Climatic and Environmental Research, 10(4): 717–727. (in Chinese)
Tang Maocang, Shen Zhibao, Chen Youxi, 1979. Average climatic characteristic of the Tibetan monsoon. Acta Geographica Sinica, 34(1): 33–42. (in Chinese)
Wei Zhigang, Huang Ronghui, Dong Wenjie, 2003. Interannual and interdecadal variations of air temperature and precipitation over Tibetan plateau. Chinese Journal of Atmospheric Sciences, 27(2): 157–170. (in Chinese)
Yang Jianping, Ding Yongjian, Shen Jianping et al., 2004. Cli-matic features of eco-environment change in the source regions of the Yangtze and Yellow Rivers in recent 40 years. Journal of Glaciology and Geocryology, 26(1): 7–16. (in Chinese)
Ye Duzheng, Gao Youxi, 1979. Tibetan Plateau Meteorology. Beijing: Science Press, 1–278. (in Chinese)
Zhang Yili, Li Bingyuan, Zheng Du, 2002. A discussion on the boundary and area of the Tibetan Plateau in China. Geographical Research, 21(1): 1–8. (in Chinese)
Related Documents