Chapter 5 CHARACTERISTICS OF EMPLOYMENT IN GROWING AND DECLINING €NDUSTRIES A. INTRODUCTION Structural change in the economy takes place con- tinually. Its effects are varied and numerous, involving for example the composition of the labour force, hiring and dismissal practices, the role of unions, patterns of company ownership by multinationals or by governments, and the impact of new international trading patterns and new technologies. This chapter examines just one aspect of this broad subject, changes in the distribution of employment across industries and their labour market implications. An immediate concern with structural change is the process of adjustment. Employmcnt decline in one sector may generate redundancies, while growth in another sector may run ahead of education and training provision, leading to shortages of appropriate skills or creating upward pressures on wages. Patterns of change may improve employment prospects and earnings for some groups of workers, while worsening those for others. Aside from questions of adjustment, structural change has a longer-term significance in changing the character of work and production. One concern in this area is that growth of employment in the service sector may be increasing the numbcrs of low-paid or unstable jobs in the economy or be leading to increased polarisation between professional and low- skill jobs. Section B of this chapter presents a preliminary examination of some of these issues. However, many issues are not precisely defined, and this chapter also aims to map the landscape of sectoral differences empirically, comparing a range of labour market var- iables across sectors experiencing employment growth and decline. It has not been possible to examine each variable in depth, or to make use of all the existing data sources, but the characteristics examined rep- resent a sample of the kinds of information that are available. Section C first examines trends in sectoral employment growth, and Sections D and E study, at the detailed level of up to 57 sectors, such topics as : sex and age composition of the workforce ; the fre- quency of “non-standard” forms of working such as part-time work and work on temporary contracts ; and the “instability” of jobs as measured by rates of entry to and exit from work. Sections F, G and H use statistics at the more aggregate ISIC l-digit (9- sector) level to bring in the further topics of job tenures, establishment sizes, earnings and educational attainment. Finally, Section I brings together the find- ings, and comments on policy under headings of sec- toral patterns of employment growth ; job loss and older workers ; sectoral differences in female employ- ment; sectoral trends in job quality; and sectoral disparities in education. B. ISSUES IN SECTORAL GROWTH AND DECLINE 1. The adjustment process Even for sectors in employment decline, voluntary job quits and retirements normally exceed net job loss rates by a considerable margin. Only a proportion of all exits from employment are involuntary, and some redundancies arise in static and growing as well as in declining sectors. Although trends in employ- ment by sector do not identify at all precisely the areas where people are “thrown out of jobs” - more targeted studies, identifying establishment closures as in OECD (1987a), may approximate this concept more closely - they are an important factor. The United States has conducted special surveys to identify “displaced workers”, defined as workers who had lost a job with over three years’ job tenure due to establishment or enterprise closures or lay- offs not followed by recall [Horvath (1987)l. On this basis, worker displacements averaged slightly over 1 million {approximately 2 per cent of the total 161

Welcome message from author
This document is posted to help you gain knowledge. Please leave a comment to let me know what you think about it! Share it to your friends and learn new things together.
Transcript
Chapter 5
CHARACTERISTICS OF EMPLOYMENT IN GROWING AND DECLINING €NDUSTRIES
A. INTRODUCTION
Structural change in the economy takes place con- tinually. Its effects are varied and numerous, involving for example the composition of the labour force, hiring and dismissal practices, the role of unions, patterns of company ownership by multinationals or by governments, and the impact of new international trading patterns and new technologies. This chapter examines just one aspect of this broad subject, changes in the distribution of employment across industries and their labour market implications.
An immediate concern with structural change is the process of adjustment. Employmcnt decline in one sector may generate redundancies, while growth in another sector may run ahead of education and training provision, leading to shortages of appropriate skills or creating upward pressures on wages. Patterns of change may improve employment prospects and earnings for some groups of workers, while worsening those for others.
Aside from questions of adjustment, structural change has a longer-term significance in changing the character of work and production. One concern in this area is that growth of employment in the service sector may be increasing the numbcrs of low-paid or unstable jobs in the economy or be leading to increased polarisation between professional and low- skill jobs.
Section B of this chapter presents a preliminary examination of some of these issues. However, many issues are not precisely defined, and this chapter also aims to map the landscape of sectoral differences empirically, comparing a range of labour market var- iables across sectors experiencing employment growth and decline. It has not been possible to examine each variable in depth, or to make use of all the existing data sources, but the characteristics examined rep- resent a sample of the kinds of information that are available. Section C first examines trends in sectoral employment growth, and Sections D and E study, at
the detailed level of up to 57 sectors, such topics as : sex and age composition of the workforce ; the fre- quency of “non-standard” forms of working such as part-time work and work on temporary contracts ; and the “instability” of jobs as measured by rates of entry to and exit from work. Sections F, G and H use statistics at the more aggregate ISIC l-digit (9- sector) level to bring in the further topics of job tenures, establishment sizes, earnings and educational attainment. Finally, Section I brings together the find- ings, and comments on policy under headings of sec- toral patterns of employment growth ; job loss and older workers ; sectoral differences in female employ- ment; sectoral trends in job quality; and sectoral disparities in education.
B. ISSUES IN SECTORAL GROWTH AND DECLINE
1. The adjustment process
Even for sectors in employment decline, voluntary job quits and retirements normally exceed net job loss rates by a considerable margin. Only a proportion of all exits from employment are involuntary, and some redundancies arise in static and growing as well as in declining sectors. Although trends in employ- ment by sector do not identify at all precisely the areas where people are “thrown out of jobs” - more targeted studies, identifying establishment closures as in OECD (1987a), may approximate this concept more closely - they are an important factor.
The United States has conducted special surveys to identify “displaced workers”, defined as workers who had lost a job with over three years’ job tenure due to establishment or enterprise closures or lay- offs not followed by recall [Horvath (1987)l. On this basis, worker displacements averaged slightly over 1 million {approximately 2 per cent of the total
161
employed with tenures over three years) per year, over the 1979-85 pcriod. Hamerrnesh (19859, who favours a more restrictive definition of displacement, gives evidence that displacement rates have been higher in the 1980s than previously. About half these displaced workers had lost jobs in the manufaciuring sector, which accounts for only one-fifth of total employment, and relatively few had lost jobs from growing service sectors. Workers displaced from man- ufacturing jobs had a lower probability of bcing subsequently re-employed, especially without an earnings reduction. Thus, sectoral employment trends probably affect re-employment prospects of workers once jobs are lost.
Growth patterns affect men and women and younger and older workers differentially. A sector where employment declines steadily must experience age imbalance of some kind. If it does not hire rel- atively young workers, or retire older workers rela- tively early, it will have a relatively old workforce. Although the external labour market is examined here, growth and decline may also affect internal labour markets - for example, promotion prospects are likely to be good in an industry that is growing rapidly through new hires.
Sector growth patterns affect the demand for skills, and indeed forecasts of labour demand by occupation are often based upon forecasts of employment by sector, on the assumption of a fixed distribution of occupations within sectors.
2. The dual economy and “new jobs”
The United States, in particular, has a tradition of debate concerning industry/occupation growth pat- terns. Dual labour market models emerged in large part from research into local labour market structures and the causes of poverty. Thus Piore (1971) distin- guished a primary labour market with &&high wages, good working conditions, employment stability and job security, equity and due process in the adminis- tration of work rules, and chances for advancement” from a secondary market with jobs that “invohe low wages, poor working conditions, considerable varia- bility in employment, harsh and often arbitrary dis- cipline, little opportunity to advance”. Debate over the evidence for the existence of labour market seg- mentation of this kind continues [Heckman and Sedlacek (1985) ; Tope1 and Murphy (1987) ; Dickens and Lang (1988)l.
A more recent question in the United States debate has been whether “new jobs” are “good” or “bad”. In terms of labour market segmentation concepts, this question may be tantamount to asking whether
the primary sector (which has often been defined in industry terms) has shrunk relative to the secondary sector.
Statements about “new jobs” always require close reading, bccause there is no established method of identifying new jobs. Often, statements are derived from classifications of employment statistics. Thus, if total employment has increased, one researcher, observing that employment of full-time workers has been static, may claim that all the new jobs were part- time. However, a second researcher might note that employment in jobs paying under $30 000 per year has been static, and claim that all new jobs paid over $30 000. Both statistics can be accurate even if no part-time jobs paying over $30 000 have been created, or indeed ever existed’. Apparent contradictions of this kind have to be resolved by closer attention to the exact procedure that has been followed in arriving at each statistic, rather than by purely factual research.
Unambiguous statements about characteristics of “new jobs” could be made if surveys provided some way of distinguishing “employees in a new job” from others. The nearest approach to such a concept in current surveys is probably “employees who have joined their current employer within the last year”. Nevertheless this does not capture well the concept of “new job”. It is not easy to devise questions -whether for employers or employees -that would determine whether a particular job existed a year ago. If such questions could bc devised, sectors with rel- atively slow employment growth might be found to have high rates of new job creation2.
In the absence of direct data on “new jobs”, one of the main topics in this debate has been the trend in the distribution of earnings3. Earnings inequality in the United States, as measured by the Gini coef- ficient for year-round full-time male workers, changed little between 1958 and 1977, though a trend increase is found either if self-employed workers are excluded, or if part-year and part-time workers are included [Henle and Ryscavage (1980)l. More recent statis- tical analyses show, according to Loveman and Tilly (1988), that earnings inequality increased between 1978 and 1985. Because average real wages (per person) have changed little since 1973, the wid- ening of the earnings distribution implies an increase in the number of workers whose earnings fall below a relatively low threshold level of real earnings4. This is the main basis for claims that many of the new jobs have been “bad”.
Under the simple real wage definition as used by some American authors, there is little doubt that in most other OECD countries the number of “bad jobs’’ declined during the 1970s. Real earnings grew,
162

and judged by such indicators as occupational differ- entials, there was often a trend towards a more equal distribution of these carnings [OECD (19X7a)l. In the 1980s, equalisation in earnings distributions slowed and sornctimes reversed. This, together with near-zero real wage growth, may have implied an increase in the proportion of jobs that were low-paid. However, with the more recent resumption of real wage growth, the number of low-paid jobs (other than part-time jobs) in most OECD countries must again be falling rather generally.
has been unimportant in the United Kingdom, but a dominant factor in Japan, reflecting its high initial level ; Manufacturing dominates the relatively declining sectors. Slight growth in Japan and a very rapid fall in the United Kingdom over 1979-87 were probably relatcd to spccific exchange rate con- ditions ; Other industry sectors6 have experienced relative employment decline, but with variation across countries, and generally not as rapidly as has manufacturing. Mining and quarrying, and elec- tricity, gas and water, are too small to be very significant in the overall picture ;
- There are large variations within service sectors, with growth fast in finance, insurance, real cstate C. PATTERNS OF GROWTH AND DECLINE
1. Empirical experience of eniployment trends by sector
While employment growth rates differ by only a few percentage points between relatively growing and dcclining sectors, they result in substantial changcs in the composition of employment over long periods. Thus, for every 10 goods-producing jobs in the United States thcrc were 15 service-producing jobs in 1Y59 but 26 in 1984, resulting from a rate of increase in the ratio of service-producing to goods-producing jobs that averaged just 2.2 per cent per year [Kutscher and Personick (1986)]5.
Table 5.1 shows changes in sectoral employment shares, 1979-87 and 1973-87, at the ISIC 1-digit level for six major economies. This presentation in terms of sectoral shares in total employment brings out similarities in patterns of change across countries. Where total employment has grown substantially, sectoral growth in absolute terms may differ signifi- cantly from growth in share terms: in the United States, the 2 per cent per year fall in the share of manufacturing in total employment since 1973 is due almost entirely to the substantial growth in total employment, the absolute numbers currently cmploycd in manufacturing bcing close to their 1973 level.
Table 5.1 illustratcs several points : - Employment in agriculture has been declining
on average at nearly 3 per cent per year, as a sharc of total employment, Thc proportional rate of decline has generally been fastest in countries where the level of agricultural employment is high. On average, agriculture has contributed over one-third as much to the loss of employment share among relatively dcclining sectors as man- ufacturing. In these terms agricultural decline
and business services, considerable in commu- nity, social and personal services, and positive, but generaIly below 1 per cent per year in share terms, in wholesale and retail trade. Transport and communication have on average expericnccd slight relative decline. Community, social and personal scrvices are dominant among growing sectors, owing to their size, now over one-quarter of total employment.
The broad lines of change in employment com- position over 1979 to 1987 were similar to those from 1973 to 1979. At an annual rate, for the six-country average, agricultural decline slowed while employ- ment growth in finance, insurance, real estate and business services accelerated. The sum of absolute changes in sector shares increased, but only slightly. Change in the United States has been no faster - in fact, has been somewhat slower- than for some other OECD countries. This observation casts some doubt on the idea that there is a causal link between the exceptional U.S. employment performance in the 1980s and shifts in its industry structure of employ- ment.
Experience over the long term suggests that the share of industry in total employment follows an inverse U pattern throughout the process of economic development. The OECD-arca share of industry in total employment rose during the 1960s, reached a peak in 1969, and declined sharply only after 1973 [OECD Lubour Force Statistics (Part I, Tablc 7)]. In line with this pattern, over 1973 to 1987 countries with lower levels of GDP per capita have experienced relatively slight declines in industry’s share in total employment, and indeed Greece and Turkey expe- rienced increases.
While a 1-digit industry analysis reveals some gen- eral trends, it is crude. Table 5.2 examines employ- ment trends in greater detail, using the general indus- trial classification of economic activities within the
163

Table 5.1. Changes in the structure of employment by ISIC 1-digit industry, 1973 to 1987, six major economies
United Japan France Germany Kingdom Average' Unikd States Canada
Industry's share in total employrncnt, 1987 Per cent
ISIC industryh
1. 2. 3. 4. 5. 6 . 7. 8. 9.
1. 2. 3. 4. 5. 6. 7. 8. 9.
1. 2. 3. 4. 5 . 6. 7. 8. 9.
1. 2. 3. 4. 5. 6. 7. 8. 9.
Agriculture Mining and quarrying Manufacturing Electricity, gas and water Construction Trade, restaurants Transport, communication FIREB Other services Total employment, 000s
Agriculture Mining and quarrying Manufacturing Electricity, gas and water Construction Trade, restaurants Transport, communication FIREB Other services
Agriculture Mining and quarrying Manufacturing Electricity, gas and water Construction Trade, restaurants Transport, communication FlREB Other services
4.9 3.0 8.3 1.5 0.7 0.1
17.1 18.6 24.2 1 .o 1.1 0.5 5.7 6.6 9.1
23.6 22.2 23.2 6.6 5 .4 5.9
10.5 11.1 7.4 29.1 31.2 21.2
11 954 112441 58 870
7.1 5.2 0.5 1.2
22.1 31.9 1.0 0.9 7.2 6.4
16.9 15.1 6.5 6.1 8.6 6.8
30.1 26.3 20 988 25 456
2.4 5.1 0.8 0.8
21.9 22.6 1.2 1.0 6.3 6.9
20.5 20.3 6.1 6.1
10.6 9.2 30.2 28.0
24 676 . . Change in industry's share in total employment, 1979 to 1987
Percentage points
-0.8 -0.5 -2.9 -1.9 -0.7 -0.3 -1.2 -0.1 -0.2 -0.1 -0.2 -0.1 -0.6 -0.2 -2.8 -4.1 0.2 -4.0 -2.6 -7.6 -3.5 -0.1 -0.0 -0.1 0.1 0.0 -0.2 -0.1 -0.5 0.1 -0.7 -1.4 -1.1 -0.0 -0.6
1.2 0.7 0.8 0.9 -0.0 1.7 0.9 -1.0 -0.4 -0.5 0.3 0.0 -0.2 -0.3
1.5 2.6
2.8 1.5
1.8 1.9
1.4 4.7
1.1 3.3
. ..
3.5 2.0 3.7 2.9
Change in industry's share in total employment, 1973 to 1987d Percentage points
-1.7 -1.2 -5.1 -4.2 -2.1 -0.6 -2.5 0.2 -0.0 -0.1 -0.4 -0.3 -0.7 -0.2
-4.9 -6.1 -3.3 -6.1 -4.8 -10.4 -5.9 -0.1 -0.0 -Il.1 0.2 0.1 -0.2 -0.0 -0.5 0.1 0.2 -2.4 -2.1 -0.8 -0.9
2.3 1.1 2.5 1.3 0.4 2.4 1.7 -. ~~
-1.1 -0.4 -0.5 0. il -0.0 -0.3 -0.3 3.0 3.8 2.6 2.7 1.9 4.3 3.0 2.8 2.1 3.9 8.3 6.9 6.4 5.2
Annual growth rate uf industry's share in total employment, 1973 to 1987T Per cent
Agrjculture Mining and quarrying Manufacturing Electricity, gas and water Construction Trade, restaurants Transport, communication FIREB Other services
-2.1 0.8
-1.8 -0.8 -0.6
0.7 -1.1
2.4 0.7
-2.3 -0.3 -2.0 -0.1
0.1 0.4
-0.5 3.1 0.7
-3.4 -4.2 -0.9 -1.5
0.1 0.8 -0.6
3.1 1.5
-3.2 -4.3 -1.7
1.7 -2.0
0.6 0.7 2.7 2.3
-2.4 -1.4 -1.0
1.2 -2.0
-0.0 2.4 2.2
0.2
-1.5 -2.8 -4.1 -1.7 -2.7 -1.7 -1.4 -0.2 -0.8 -0.9
-0.4 -0.3 3.8 2.9 1.7 1.5
0.9 0.6
Q ) Unweighted average across the countries. b) More complete titles by S I C 1-digit induslry are: 1, agriculture, hunting, forestry and fishing; 6, wholesale and retail trade, restaurants and hotels;
7, transport, storage and communication; 9, community, social and personal services. Canada, sanitary services are included in ISIC 4; Japan, hotels are included in group 9.
c) Finance, insurance, real estate and business services. d) For Canada, for ISIC 6, 8 and 9, affected by statistical breaks between 1974 and 1975. figures shown are changes 1973-74 and 1975-87, grossed up by
the factor 14/13. A small correction, proportional to the 1987 industry share, was applied to maintain the total change in shares at zero. A statistical break in Japan, 1975 to 1976, was treated simi[arly.
e) Annual average growth rates. Source: OECD, Labour Force Statistics.
164

Table 5.2, Changes in employment structure across 57 industries in seven EEC countries: employees only"
Average share Countrics for Average Average
employment has since 1977 in share ratc of 1986 Declined Grown 1977-86 share
(per cent) (numhed') (percentage points) (per cent)
in total whichsharc changc annual growth
NACE Industry
Agriculture, etc. 01 Agriculture and hunting 02 Forestry 03 Fishing
Energy and water 1112 Mining of coal, coke ovens 13 Extraction of oil and natural gas 14 Oil refining 15 Nuclear fuels 1617 Electricity, gas and water supply
Non-energy mining, chemicals Mining and preparation of metal ores 21
22 Production of metals 2324 Mineral mining and products 2526 Chemical and man-made fibres
Metal manufacturing, engineering
1.84 4 3 -0.32 0.14 5 2 -0.01 0.20 6 1 0.00
-1.8 -1.0
0.2
0.47 5 1 -0.15 -3.1 0.07 2 4 0.03 5.4 0.13 7 -0.04 -2.7 0.03 2 4 0.01 3.9 1.02 3 4 0.01 0.1
0.04 5 1 -0.01 0.99 7 -0.57 1.25 7 -0.43 1.89 6 1 -0.14
-2.0 -4.9 -3.2 -0.8
31 32 33
Metal manufacture, except as below Mechanical engineering Office and data processing machinery Electrical engineering Motor vehicles Other means of transport Instrument engineering
Other manufacturing industries Food, drink and tobacco Tcxtilc Leather Footwear and clothing Timber and wooden furniture Paper, printing and publishing Rubber and plastics Other manufacturing
2.47 2.37 0.23
-0.59 -0.28
-0.28 -0.18 -0.33 -0.05
0.55
-2.3 1 6
-1.2 3.0
~~
34 35
2.62 1.52 0.94
1 4
2
-1.1 -1.2 -3.3 -1.4
36 37 0.38
4142 43 44 45 46 47 48 49
3.34 1.27
5 7
2 -0.26 -0.58 -0.04 -0.54 -0.35 -0.12 -0.02 -0.06
-2.29
-0.8 -4.1 -3.1 -3.8 -2.7 -0.6 -0.2 -1.0
-3.4
0.13 1.30 1.25 2.01 0.96 0.59
6.21
1
3 1
5 Building and civil engineering
Trade, hotels, catering and repairs
Dealing in scrap and waste 61 Wholesale distribution 62 63 Agcnts 6465 Retail distribution 66 Hotels and catering 67 Repair of consumer goods and vehicles
4.74 0.11 0.25 7.32 2.63 1.08
5 3 2
-0.19 0.01
-0.01 -0.07
0.50 -0.04
-0.4 1.4
-0.5 4
5
-0.1 2.3
-0.5
Transport and communication Railways l . l t 5 Other land transport 1.87 1 Inland water transport 0.04 Sea transport and coastal shipping 0.25 6 Air transport 0.32 2 Supporting services to transport 0.40 4 Travel agents 0.72 Communication 2.16 2
-0.16 0.06
-0.01 -0.11
0.03 -0.03
0.08 0.18
-1.5 0.4
-3.3 -3.8
1.3 -0.7
1.2 1.0
71 72 73 74 75 76 77 79
Banking, insurance, business services, renting
81 Banking and finance 2.68 1 6 0.30 82 Insurance 0.92 1 6 0.08 83 Real estate and business services 4.34 7 1.44 84 Renting and hiring of movables 0.21 2 5 0.03 85 Letting of real estate 0.29 4 2 -0.00
1.3 1.0 4.6 1.6
-0.2
165

Table 5.2 (Continued). Changes in employment structure across 57 industries in seven EEC countries: employees only"
Avrragc share Countries for Average Average
empluyrricnt has since 19777 in share rate of 19Xh Declined tirown 1977-86 share
(per cent) (number") (percentage points) (per cent)
in total which share change annual growth
Other services 91 Public administration and defence 8.95 1 6 1.00 1.3 92 Sanitary 1.44 7 0.31 2.7 93 Education 7.48 1 6 1.24 2.0 94 Research and dcvclopment 0.37 2 5 0.06 1.8 95 Health and veterinary 5.74 7 1.38 3.1 96 Other public services 4.82 7 1.07 2.8 97 Recreational and cultural 1.40 7 0.29 2.6
99 Domestic service 1.74 4 2 0.07 0.4 00 Diplomatic and international
a)
b) Source: See Annex 5.A.
98 Personal 0.76 5 2 -0.03 -0.4
representation, allied armed forces 0.19 1 3 0.07 4.7 Countries are Belgium, Denmark, France, Germany, the Netherlands, Spain and the United Kingdom. The figures shown are partly estimated and the underlying data are not wholly comparable: see Annex 5.A. Countries where employment in the industry was zero throughout appear in neither column.
European Communities (NACE) implemented at a 57-sector level of detail for seven countries over 1977- 86. The figures relate to employees only, which has the effect of sharply reducing the measured share of agriculture in employment. The main points are :
Employment in the coal and iron and steel sectors has declined sharply ; Though a few industry sectors have shown rapid growth, notably oil and gas extraction, the nuclear fuels industry, and office and data-pro- cessing equipment, they are too small to have much effect on thc overall pattern of declining employment. Food, drink and tobacco, and paper and publishing sectors have declined only slightly, and metal and clothing have declined rapidly. Building and civil engineering has also declined (which is not always the case for con- struction in Table 5.1) ; Electricity, gas and water has had a static employ- ment share ; Because growth in air transport has not been enough to offset declines in railway and sea trans- port, employment in transport declined overall. However, employment in communications increased ; Neither personal nor domestic services have experienced significant growth in employment shares. The main areas of growth in private sector services have been hotels and catering, banking and finance, and above all real estate and business services ; Sectors that (in European countries) represent largely government-financed employment have
grown significantly. The sum of all positive changes in employment share 1977-86 shown in Table 5.2 is 8.30 percentage points. Public administration, defence, sanitary services, edu- cation and health (NACE 91-95) alone account for 3.93 percentage points of this increase.
Many of the detailed patterns shown in the NACE data of Table 5.2 also are exhibited by the United States, 1969-84 [Kutscher and Personick (1986)]. Among the similarities are the above-average employ- ment performance of electrical, office and data-pro- cessing, and printing and publishing sectors within manufacturing, and of restaurants, hotels, business services and medical services. Howevcr, the sharp losses in miniiig and construction in EEC cuuntrics contrast with slight gains in employmcnt (since 1973) in the United States.
For many countries, government has been one of the fastest growing areas of employment, at least in certain periods. Table 5.3 shows year-on-year changes in employment in production of government services and in the whole economy. In EEC countries, government employment grew as much as 3 percent- age points per year more rapidly than total employ- ment over 1971-79 and slowed sharply over 1979-86, though its growth remained significantly faster than for total employment. Cyclical swings, although almost as large in government as in the rest of the economy, have different timing : troughs in total employment growth in 1975 and 1981-82 were fol- lowed by troughs in government employment growth around 1977 and 1984. This lag probably reflects explicit budgetary decisions (taken in reaction to
166

Table 5.3. Annual growth rates of employment in production of government services and the total economy
United Other Northern Kingdom EEC" Europe Germany Japan United
Statcs Growrh rate of cmptoyment in production of government services
Pcr cent
1971 1972
-0.2 0.2 1.4
2.6 2.9 3.7
4.3 5.0 3.3 3.7 2.4 1.6 0.7 2.3
2.8 3.4 2.9
5.6 5.4 2.8
5.2 4.8 4.5 1973
1974 1.9 2.0 0.1 1.1 2.2
3.3 2.4 0.9 1.2
0.2 6.0 2.0
-0.8 0.3
3.2 5.0 4.4 5.1 3.9 4.5
1975 1976
4.3 3.3
1977 1978 1979 1980 1981
3.1 3.9 2 .0
1.6 1.4
1.3 2.2
2.6 1.5 1.7
1.7 -0.6
4.3 2.7 2.3
3.0 3.9
-0.3 -0.2
0.6 1.4 1.7
1.1 0.6 0.3 0.2
-1.4 0.4 0.2
-0.6 -1.0
0.5 0.2 0.3 0.6 0.5
3.4 1.9 2.4 2.4 2.0 0.7 . .
1982 1983
0.7 0.8 0.3
1.7 -0.0 -0.1 1984
1985 1.2 0.9 1.5 . . 1986
1987 1.3 1.6
1.0 1.1
Averages: 1971-79 1980-87
1.1 1.0
2.3 0.4
2.9 1.0
2.1 -0.0
4.0 1.3
4.6 2.4
Growth rate of total employment Per cent
1971 1972 1973 1974 1975 1976 1977 1978 1979 1980 1981
0.0 2.3 4.3
0.7 0.6 0.5 -0.2 2.3 0.7
-0.4 -1.3 -0.2 -2.8
0.8 4 . 8 1.2 -0.2 1.0 0.6
-0.9 -0.1
2.3 0.3
-0.4 -0.8
0.1 0.6
0.7 0.4 0.9 0.4
-1.1 0.4 0.3 0.6
-0.0 0.6 0.9 1.3 0.6 0.1
-0.0
1.5 -1.7
2.6 3.6 4.7 0.2
1.4 2.0 0.5
3.2 0.5 0.8
i.0 1.4 0.7 1.1
1.5 -0.3 -3.9
1.2 0.1
0.8 -0.7 0.8 -1.7
-1.6 -1.1 -0.9
0.6 1.6 1.8 I t
-1.1 1.1 4.4 2.3
-1.8 -1.3
1.9
0.0 -0.2
0.8 1.1 0.8 ..
1.7 -1.5 0.5 0.1 0.7 0.7 1985
I986 1987
I .b 0.4 1.5
1.7 2.7
0.9 1.0
1.0 0.7
Averages: 1971-79 2.3 0.8 -0.2 0.3 0.4 0.6 1980-87 1.5 0.9 -0.0 -0.2 0.1 0.7 a) Other EEC refers to the average of Belgium, Denmark and the Netherlands. b) Northern Europe refers to the average of Finland, Norway and Sweden. Source: OECD National Accounfs, Volume 11, Table 15.
budget deficits, which typically emerge during a reces- sion) rather than an automatic link between govcrn- ments’ revenues and their employment expenditures.
2. The interaction between employment, productiv- ity and output
Systematic trends in employment patterns reflect variations across sectors in productivity growth and in the price and income elasticities of demand for their products. In a simplified model of the economy where labour is the only input to production, wages are uniform across the economy, and prices are deter- mined by cost, sectoral employment growth can be modelled in terms of the following parameters :
Y = growth rate of total output E = growth rate of total employment ll = growth rate of labour productivity
yi = growth rate of output of sector i ei = growth rate of employment in sector i ri = growth rate of labour productivity in sector
pi = growth rate of output price in sector i.
Demand Qi for the product of sector i is determined by a function relating per capita consumption to per capita income
(Qi/L) = ai (Q/L)ei (Pi)-#i
where Q is total output, L total employment, Pi the price of product i, ei the income elasticity of demand and -c$+ the price elasticity of demand for sector i. This function implies that
(= Y - E)
i (= yi - ei)
yi - E = ITOi - pi+.
In such a rnodcl the growth rate of rcal wages is equal to the growth rate of overall productivity, II, in all sectors. Then the growth rate of relative prices in sector i is determined by this wage growth less sectoral productivity growth
pi = rI - xi,
the growth rate of output is determined by income and price growth, and the corresponding elasticities of demand
yi = E -t rI8i - (rI - ni> (pi ,
and the growth rate of employment is determined by output and productivity trends
ei = yi - ni = E + Il (€Ii - (pi) + ni ((pi - 1).
Thus, aggregate productivity growth promotes reI- ative employment growth in sectors where the product faces a high income elasticity of demand. Individual
sector productivity growth affects employment growth positively in sectors facing high price elasticities of demand, and negatively in sectors with low price elasticities of demand.
Although labour is the dominant factor in produc- tion, variations in capital utilisation may also be important, and in a more detailed modcl, employmcnt trends will also depend upon the share of capital in output, the price of capital, and the labour- or capital- saving nature of technological progress.
Traditionally, economists have regarded income and price clasticities and technological progress as economic constants, and to the extent that this assumption is correct, the direction and speed of changes in sectoral employment structure may be relatively immutable.
Baumol (1967) pointed out that the share in national expenditure and employment of sectors hav- ing both low productivity growth and low price elas- ticities of demand is likely to increase over time. As this share increases, in the absence of other changes the economy’s average productivity growth rate must fall. One concern about the service sector growth has indeed been that it may fit this pattern, and thereby have unfavourable consequences for the economy’s overall rate of productivity growth. Empirically Baumol etal. (1985), studying the United States, 1947- 76, confirmed that relative productivity and relative output prices are inversely related. They found that growth rates of output in constant prices were similar across the broad average of high productivity-growth and low productivity-growth sectors, with the con- sequence that the low productivity-growth scctors have increased their share in total employment.
Separately from the impact of productivity growth on relative prices, other dcmand changes, including those arising from the intcraction of real income growth with patterns of income elasticities, are impor- tant and these customarily affect employment and output growth in the same direction. Consequently there is an overall positive correlation across sectors between employment and output growth’. Chart 5.1 shows this correlation for 1973-86 growth rates in France at the 35-sector levcl. Despite thc correlation, industry contains fivc of thc ten fastest-growing sec- tors in output terms, compared with just one in employment terms. Thus, the generalisation that industry is declining while services are growing would be much less accurate if output rather than employ- ment were considered.
3. Likely future employment trends
Manufacturing employment is more cyclically var- iable than is service employment, and the 1973-87
168
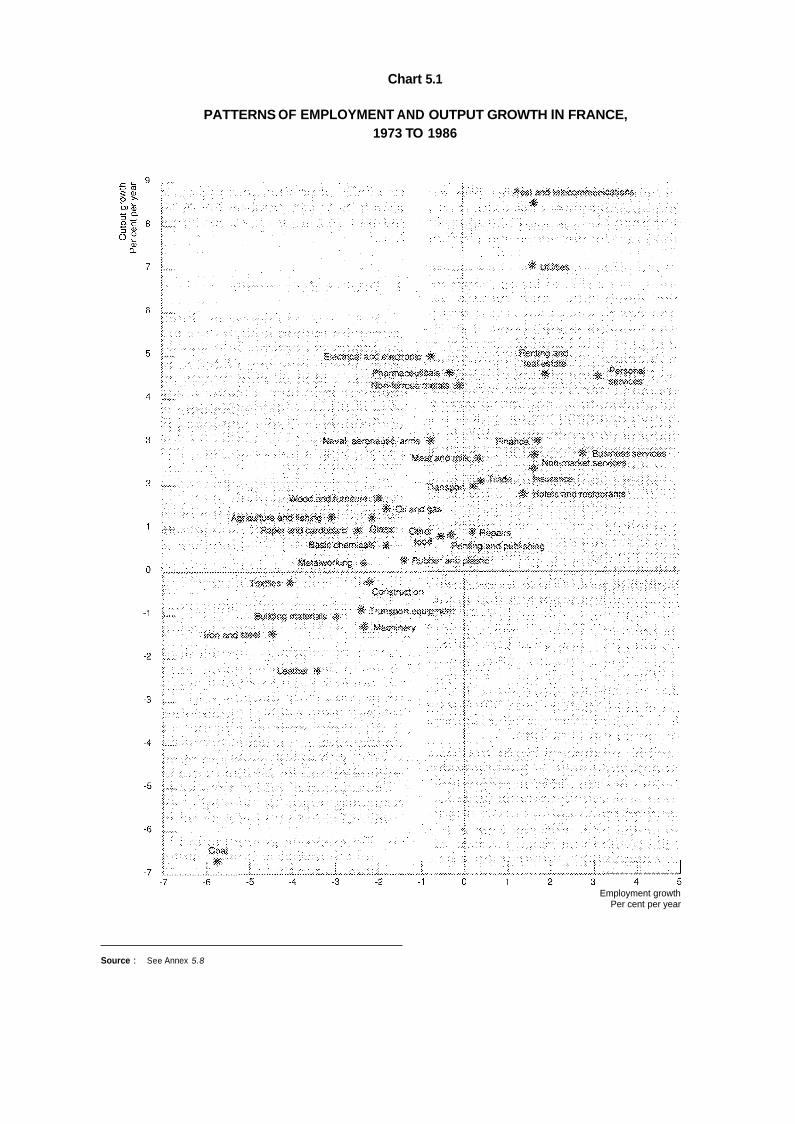
Chart 5.1
PATTERNS OF EMPLOYMENT AND OUTPUT GROWTH IN FRANCE, 1973 TO 1986
Employment growth Per cent per year
Source : See Annex 5.8

period experienced two sharp recessions, which raiscd the OECD unemployment rate from around 3 to around 8 per ccnt. To the extent that recessions in the short or medium term secm unlikely to bc as severe, future manuhcturing employment growth will be more buoyant. In the United States, the rapid dccline of manufacturing in the earlier 1980s was partly a temporary response to a high exchangc rate, and some observers have emphasized the importance of manufacturing rather than services in employment recoverys.
Whilc thc labour-intcnsive nature of government service activity may lead to continuing pressure for employment growth there, actual outcomes will depend upon how far governments strive to contain expenditures, or accept growth of costs. If private sector employment growth continues strong, as in 1987 and 1988, many European countries may show lower growth in government services employment, in share terms, than in thc 1970s or early 1980s. Agri- cultural employment decline may slow as previous falls bring levels in a number of countries closer to a sustainablc equilibrium. Furthermore, in many coun- tries an important part of employment growth in services has been in part-time jobs. The growth of part-time working could be expected to slow, given that a reduction in the growth of the female labour force is projected [OECD (1988a, p.37)], and in some countries female rates of part-time working are approaching saturation levels.
In some detailed sectors where specific factors have operated in the recent past, change may also slow. Examples would be : iron and steel, textiles, and (in Europe) mining, which may now have more sustain- able levels of employment ; office machinery and data- processing equipment production, where the pace of innovation may slow ; banking and finance, where some of the growth has reflected one-off liberalisation of financial regulations ; and business services, whose growth may have reflected responses to tighter reg- ulation of employment practices in the 1970s (leading firms to hive off some activities) and to sharp increases in company profitability in the 1980s.
Thus, several considerations suggest that future changcs in employment structure could be somewhat slower. On the other hand, further movements of the industry share in total employment along the inverse- U curve described above could even involve an accel- eration of change. Thus, underlying forces of pro- ductivity growth and induced changes in demand may help to drive structural change at rates similar to those experienced in recent years.
Employment has fallen in morc sectors of the ccon- omy in Europe than in North America, simply because aggregate employment growth has been slower in
Europe. When total employment is static, structural change makcs employment decline in some sectors incvitablc. In this way, slow labour forcc growth in a context of rapid structural change may tend to create a pool of unemployed with obsolcte skills, and thereby incrcasc unemployment, rather than reduce it. Across the OECD, labour forcc growth is projected to slow down from the rates experienced in the last decade, and this in itself may increase some adjustment prob- lcms.
4. Definition of characteristics
This sub-section explains how the characteristics of growing and declining industries have been defined for purposes of tabulations in Sections D, E and F below. Sectors have been defined as growing or declining in terms of trends in their employment rathcr than thcir output or anothcr variable9, and in terms of changes in their employment share rather than their absolute level of employment. Changes in employment share have been measured as changes over the medium term - here, from 1973, 1977 or 1979 to 1986 or 1987.
Characteristics of growing and declining sectors are then measured as averages of individual sector char- acteristics weighted by changes (DS,) in the sectoral shares in total employment. Thus characteristics C,, C, for growing and declining sectors are defined as
C, = X,DS,/ZDS, summed over DS, > 0 C, = ZC,DS, / ZDS, summed over DS, < 0
These expressions can be written in the form
C, = ZC,DS,/ZDSi = Xis, (DSJS,) /ZSi(DSi/Si)
showing that weighting by changes in shares is equiv- alent to weighting simultaneously by both sector size and growth in sector employment share, This pro- cedure avoids giving substantial weight to the small differencc bctwcen slight growth and slight declinelo. In this chapter, where this procedure is applied to quantities such as “the female share in employment in 1985”, growing and declining sector statistics arc weighted averages for the sectors concerned.
Characteristics of “middle” sectors were defined by constructing weights for “growing”, “middle” and “declining” sectors according to the following rules :
The weights for growing and declining sectors are a normalisation (a simple multiple) of the share changes DS,. Sectors whosc share in employment has declined have a zero value in the weights for growing sectors, and vice versa.
i)
ii)
I70

iii)
i V )
The fastest-growing and fastcst-dcclining sector each has a zero value in the weights defining. “middle” growth sectors. The “growing”, “middle” and “declining” weights together sum to the sector sharcs in total employment Si.
Together these conditions define unique non-neg- ative weights for “growing”, “middle” and “declining” sectors consistent with whole-economy characteris- tics, when these are defined by aggregating sectors using the weights Si.
To allow more detailed examination of patterns, some tables in this chapter give figures for growing, middle and declining industry sectors and growing, middle and declining service sectors. These figures are calculated by expressing the detailed sectors’ employment as a share of total industry employment or total service employment, and then proceeding as for the whole economy analyses.
Within this definitional framework, variations in the estimated characteristics of growing and declining sectors can arise as a result of the use of more or less detailed industrial classifications, of employee or total employment data for employment shares, and of dif- ferent time periods for estimating changes in these shares. Also, in interpreting such numbers as the all- sector average of the proportion of women who work part-time, it should be notcd that averaging uses weights based on sectors’ employment, not sectors’ female employmcnt.
5. The effect of employment growth on certain employment characteristics
Certain characteristics of a sector’s employed labour force may bc expected to depend directly upon its employment growth history. It is known that :
By definition, growing sectors have a higher net hiring rate (hires minus separations plus, in North America, recalls minus lay-offs) than do declining sectors ; Even though some entrants to employment are older than are some exits from employment - in particular, mothers recommencing work are, on average, older than mothers who leave work to care for children - individuals entering employment must have an average age well below that of individuals leaving employment, if the average age of the employed labour force is not to rise” ; Net entrants to employment are disproportion- ately women (the share of women in total employment has risen almost everywhere).
These points suggest that, othcr things being given, growing sectors will bc characterised by high shares of youth and women’z, and low sharcs of oldcr work- ers. Similarly, in growing scctors a low proportion of employment would have long job tenures.
These patterns could provide an indirect explana- tion of other features of employment. One example is that the educational qualifications of youth are generally higher than for older workers. If growing sectors have a higher share of youth, they are likely to have a relatively well-educated workforce. Simi- larly, earnings generally rise with job tenure. If declin- ing sectors have longer job tenures, they are likely to pay higher average wages. When such mechanisms operate, it does not necessarily follow that the econ- omy as a whole is moving in the direction of the characteristics of the growing sectors.
Employment growth and decline may promote a range of other differences. In respect of job turnover, for example, it could be argued that sectoral decline will generate poor working conditions and thereby increase labour turnover, or that it will encourage employees to hold on to existing jobs and thereby reduce turnover. However, because theoretical rea- soning on such topics is speculative, they are studied here primarily on an empirical basis.
D. THE EUROPEAN COMMUNITY LABOUR FORCE SUKVEYS’3
In this section, the European Community’s labour force surveys are used to examine several character- istics of employment across growing and declining sectors for Belgium, Dcnmark, France, Germany, thc Nctherlands, and the Unitcd Kingdom.
1. Rates of growth
Table 5.4 shows growth rates of growing and declin- ing sectors, weighted as described in Section C. Growing sectors grew, on the average for the six countries, at a rate of 3 112 per cent per year, and declining sectors declined at approximately the same rate. This implies that, over the 1977-86 period used to estimate the growth rates, the employment shares of growing sectors nearly doubled relative to those of declining sectors. Table 5.4 also shows statistics for growing and declining sectors within industry and within services. For these calculations, growth and decline were defined in terms of a sector’s share in total industry or total service employment, respec- tively.
171
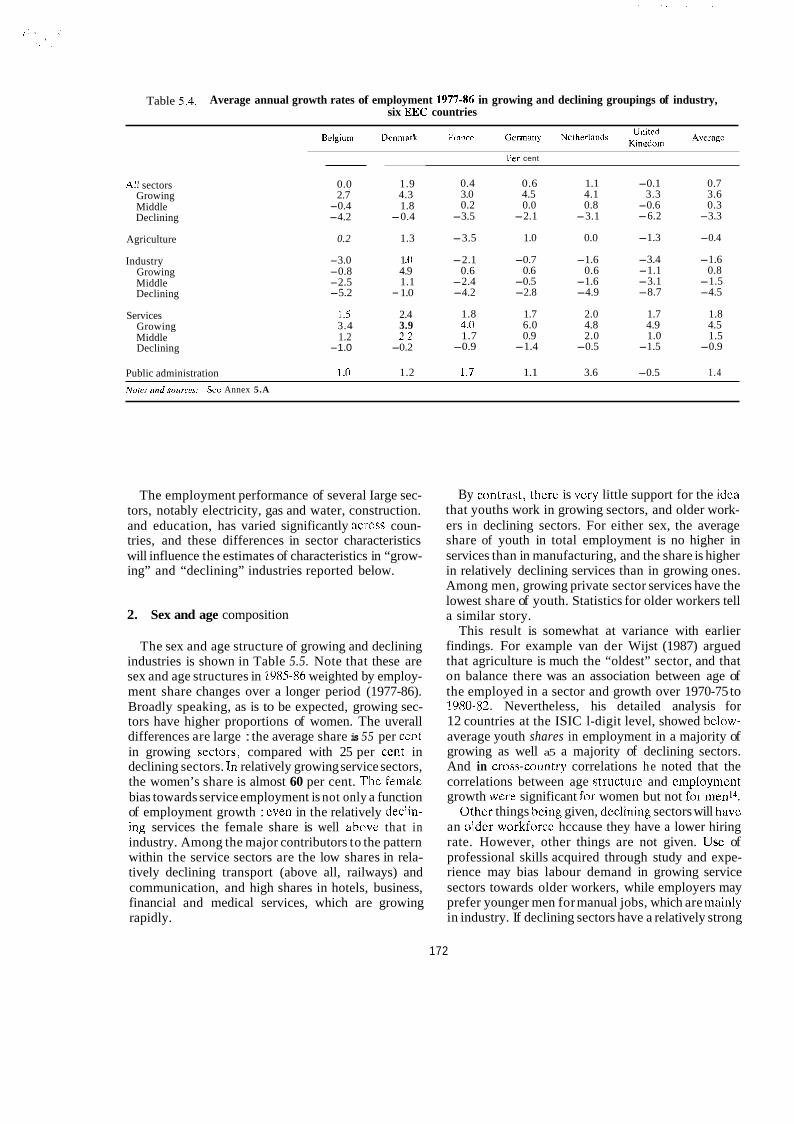
Table 5.4. Average annual growth rates of employment 1977-86 in growing and declining groupings of industry, six EEC countries
Avciagc LlllltCd Kinndom
B~‘1gium Lknnlar l , [ - nncc Germariy Ncthrrlatld\
A11 sectors Growing Middle Declining
Agriculture
Industry Growing Middle Declining
Services Growing Middle Declining
Public administration
0.0 2.7
-0.4 -4.2
0.2
-3.0 -0.8 -2.5 -5.2
1.5 3.4 1.2
-1.0
1 .D
1.9 4.3 1.8
-0.4
1.3
1 .o 4.9 1.1
- 1.0
2.4 3.9 2.2
-0.2
1.2
Per cent
0.4 0.6 1.1 -0.1 0.7 3.0 4.5 4.1 3.3 3.6 0.2 0.0 0.8 -0.6 0.3
-3.5 -2.1 -3.1 -6.2 -3.3
-3.5 1.0 0.0 -1.3 -0.4
-2.1 -0.7 -1.6 -3.4 -1.6 0.6 0.6 0.6 -1.1 0.8
-2.4 -0.5 -1.6 -3.1 -1.5 -4.2 -2.8 -4.9 -8.7 -4.5
1.8 1.7 2.0 1.7 1.8 4.0 6.0 4.8 4.9 4.5 1.7 0.9 2.0 1.0 1.5
-0.9 -1.4 -0.5 -1.5 -0.9
1.7 1.1 3.6 -0.5 1.4 Nules and SOUI.CEX See Annex 5.A
The employment performance of several Iarge sec- tors, notably electricity, gas and water, construction. and education, has varied significantly across coun- tries, and these differences in sector characteristics will influence the estimates of characteristics in “grow- ing” and “declining” industries reported below.
2. Sex and age composition
The sex and age structure of growing and declining industries is shown in Table 5.5. Note that these are sex and age structures in 1985-86 weighted by employ- ment share changes over a longer period (1977-86). Broadly speaking, as is to be expected, growing sec- tors have higher proportions of women. The uverall differences are large : the average share is 55 per ccnt in growing scctors, compared with 25 per ccnt in declining sectors. In relatively growing service sectors, the women’s share is almost 60 per cent. The female bias towards service employment is not only a function of employment growth : cven in the relatively dedin- ing services the female share is well above that in industry. Among the major contributors to the pattern within the service sectors are the low shares in rela- tively declining transport (above all, railways) and communication, and high shares in hotels, business, financial and medical services, which are growing rapidly.
By cuntrasl, therc is very little support for the idca that youths work in growing sectors, and older work- ers in declining sectors. For either sex, the average share of youth in total employment is no higher in services than in manufacturing, and the share is higher in relatively declining services than in growing ones. Among men, growing private sector services have the lowest share of youth. Statistics for older workers tell a similar story.
This result is somewhat at variance with earlier findings. For example van der Wijst (1987) argued that agriculture is much the “oldest” sector, and that on balance there was an association between age of the employed in a sector and growth over 1970-75 to 1980-82. Nevertheless, his detailed analysis for 12 countries at the ISIC l-digit level, showed below- average youth shares in employment in a majority of growing as well a5 a majority of declining sectors. And in cruss-country correlations he noted that the correlations between age structurc and cinployment growth were significant loor women but not for m d 4 .
Othcr things hcing given, dcclining sectors will have an oldcr workforcc hccause they have a lower hiring rate. However, other things are not given. USC of professional skills acquired through study and expe- rience may bias labour demand in growing service sectors towards older workers, while employers may prefer younger men for manual jobs, which are mainly in industry. If declining sectors have a relatively strong
172

Table 5.5. The 1985-86 sex and age cornpusition of employment in growing and dcclining industries, six EEC countries
Bclgium Dcnm'irk Frarlce Germany Neiherlarlds ~ ~ ~ ~ t ~ ~ ~ , Average
All sectors Growing Middle Declining
Agriculture
Industry Growing Middle Declining
Services Growing Middle Declining
Public adrninistration
37.8 47.3 43.1 39.3 35.0 44.3 41.1 53.3 63.1 55.3 57.8 42.7 57.3 54.9 34.0 46.8 41.9 36.2 35.0 42.2 39.5 18.9 33.0 24.1 32.5 16.7 23.0 24.7
14.4 17.4 21.2 33.7 11.7 26.9 20.9
19.0 25.3 25.0 25.3 14.1 25.0 22.3 19.9 25.6 29.0 26.3 16.8 23.0 23.4 20.0 26.0 24.5 24.2 13.2 26.0 22.3 16.3 21.9 23.5 30.5 17.5 19.7 21.6
49.7 58.3 53.8 53.6 46.7 56.0 53.0 56.9 68.0 62.3 68.6 43.7 58.4 59.7 48.7 57.5 53.3 49.8 49.4 55.8 52.4 33.6 41.7 35.4 48.0 33.9 45.5 41.3
30.5 50.5 47.8 34.7 24.6 37.5 37.6
2. Sliorc of yuuih (a@ undcr 2 5 ) in cmploymcnt Pcr c m t
All sectors Growing Middle Declining
Agriculturc
Industry Growing Middle Declining
Services Growing Middle Declining
Public administration
Men
13.4 22.0 14.4 17.8 14.5 21.4 17.3 11.8 13.8 1.2.4 14.4 11.4 21.b 14.2 13.7 22.5 14.5 18.4 14.9 21 .s 17.6 15.3 26.3 11.3 17.4 16.3 1o.s 18.2
32.9 47.5 22.1 39.5 30.3 31.3 33.9
15.0 23.5 14.3 19.2 13.9 20. I 15.3 16.5 15.3 23.8 14.3 19.4 14.9 23.8 13.5 20.3
12.6 21.5 14.9 16.3 11.6 12.4 12.3 12.6 12.9 22.7 15.1 18.5 14.6 31.5 17.9 13.0
1.5.6 20.1 13.6 19.1 16.1 20.7 15.2 18.3
13.9 22.5 12.3 21.6 13.4 22.7 18.3 22.3
ls.O 16.4 18.3 17.6
17.0 13.8 17.5 19.6
11.9 11.2 10.3 16.0 11.6 16.1 13.4
Women
All sectors Growing Middle Declining
Agriculture
Industry Growing Middle Declining
Set-viccs Growing Middlc Dcclining
Pihlic adrninistration
20.0 23.6 17.4 21.5 31.0 24.2 23.5 17.9 16.1 16.0 27.4 27.8 23.2 21.4 20.5 23.9 17.7 24.1 31.3 24.4 23.6 21.6 29.0 16.3 23.0 34.5 25.6 25.0
27.8 47.0 23.3 37.3 32.0 18.0 30.9
22.5 28.9 16.6 24.0 34.2 25.4 25.3 24.7 27.0 18.6 23.4 32.1 24.8 25.2 22.8 29.3 16.4 24.0 34.8 25.6 25.5 21.2 27.7 14.2 24.3 32.9 24.4 24.1
19.1 22.1 18.4 25.5 29.5 23.5 23.0 18.1 14.4 16.3 20.2 27.9 23.4 2'1 .h 19.3 23.0 18.4 25.2 2x.3 23.4 22.9 22.5 32.7 22.1 22.0 3h.9 26.4 27.1
17.2 1 1 . 1 13.9 20.6 31.1 26.3 20.0

Tablc 5.5 (Coniinued). The 1985-86 sex and age composition of employment in growing and declining industries, six EEC countries
Bclgiuni Denmark t’rance Germany Ncthcrliinils $$:Ii Avcragc
3. Share of (diler workers (aged 55 and over) in employrrient
All qectors Growing Middle Decliriirig
Agriculture
Industry Growing Middle Declining
Growing Middle Declining
Services
Per cent
Mcn
8.6 12.3 7.4 10.6 8.4 14.2 10.2 8.9 14.1 x . l 10.1 8.6 14.4 10.7 8.7 12.1 7.3 10.5 8.4 14.1 10.2 6.8 11.8 6.1 11.6 8.1 15.5 10.0
9.2 12.7 10.9 10.1 8.5 17.9 11.6
6.6 10.5 5 3 10.1 8.5 14.6 9.4 7.6 9.1 5.7 10.4 9.2 14.3 9.4 6.5 10.6 5.9 10.0 8.3 14.4 9.3 6.4 10.1 5.6 11.0 8.8 16.6 9.8
9.2 12.6 8.2 10.2 8.4 14.3 10.5 8.6 15.4 9.2 9.8 8.7 14.6 11.0 9.3 12.2 8.1 9.8 8.5 14.2 10.3
10.5 11.9 8.4 12.5 7.6 14.3 10.9
Public administration 11.7 15.0 8.1 13.1 8.4 11.7 11.4
Ail sectors Growing Middle Declining
~ ~
3.7 9.4 6.9 8.0 4.2 11.0 7.2 3.8 11.1 7.4 7.8 4.5 11.3 7.6 3.7 9.2 6.9 8.1 4.2 10.9 7.2 2.6 8.8 6.3 8.1 3.4 11.4 6.8
Agriculturc 8.1 14.1 12.8 6.5 14.9 10. I
Industry {;rowing Middlc Declining
Services Growing Middle Dcclining
2.5 6.7 5.5 7.6 3.6 10.0 6.0 2.8 9.1 4.9 7.3 4. I 9.1 6.2 2 5 6.6 5.5 7.8 3.6 Y .8 6.0 2.5 6.2 6.1 7.7 3.4 13.0 6.5
3.9 10.4 7.4 7.8 4.3 11.2 7.5 3.5 11.1 7.1 7.5 4.6 11.4 7.5 4.1 10.4 7.4 7.7 4.4 11.2 7.5 4.6 10.5 7.3 8.5 3.3 10.8 7.5
Public administration 5.1 11.1 8.9 9.8 4.8 11.9 8.6 Notes nnd .so~~rces: See Annex 5 .A.
I74

inccntive to avoid ageing of their workforce. they may achieve this through concentrating new hircs upon younger staff, persuading some older workers to leave through early retirement schemes, or declaring clo- sures of complete plants to allow more new hires. Employment by age patterns observed in 1985-84 seetiis to reflect some heavy cuts of this kind that occurred during recession years in the early 1980s.
Older workers have a relatively high incidence of long-term unemployment and a low probability of re- employment [OECD (1988a, Tables 2.10, 2.14)]. Unemployment rates for those whose last job was in manufacturing are higher than (and in some countries double) the unemployment rates of those whose last job was in the growing service sectors. These factors indicate that the employment prospects for the older worker who has lost a job in a declining sector can be poor. Thus, it appears that employers in declining sectors in EEC countries have been able largely to resolve their internal problems of age imbalance, but at the cost of leaving society with a problem of older- worker unemployment.
3. Non-standard forms of employment
This section examines patterns of self-employment ~
temporary work, and part-time work15. Each form of work has typical problems : earnings in sclf-crnploy- mcnt arc crratic, temporary work is insecure, and part-time work is low-paid. Thcsc forms all gencrally offer lowcr levels of social security coverage and of other employment rights than do pcrmancnt full-timc jobs, but at the same time offer more flexible working arrangements that ~riay bc apprcciatcd by cinploycrs, employees, or both.
Table 5.6 shows that self-employment is not uniquely associated with sectoral growth or decline. In broad terms, it is morc coininon i n thc dcclining agricultural and the glowing service sectors than it is in industry. It is relativcly high in the faqtcst-dcclining parts of industry but also, for men in Germany, the Netherlands and the United Kingdom. in thc fastcst- growing service sectors. An examination of the data for Germany, where this pattern has been clearest, shows high rates of male self-employment in such declining industries as footwear, clothing and leather, timber and furnishing, and building, as well as in such growing services as hotels, real estate, and business and medical services.
Temporary employment, as reported in Table 5.6, is in some countries mainly a measure of job char- acteristics but in others may reflect, in part, employ- ees’ personal preferences [OECD (1987a)j. Its inci- dence seems to correlate consistently with employ- ment growth. It is higher in services than in industry,
and higher in the faster growing subsectors of industry and services.
Part-time work is mainly done by women. For both sexes, it is more common in serviccs than in industry, and also is more common in declining industries and in growing services than in sectors with an intcrmc- diate employmcnt pcrformance.
In summary, except for womcn in sclf-crnployment , all three forms of non-standard working examined here are more common in growing than in declining sectors. Thus, sectoral growth patterns are indeed tending to promote working arrangements that are more flexible, but more precarious.
4. Measures of entries to and exits from employment
Table 5.7 shows measures of turnover between employment and non-employment - that is, the pro- portions of employees who were employed in the current year but not in the previous year (entrants), or vice versa (exits). This type of flow covers only a proportion of the job turnover recorded by establish- ment surveys. It does not cover movements in and out of employment that take place within the year, nor does it include direct changes from one employer to another. However, flows in and out of employment are arguably a particularly important component of all turnover, and this type of data has the advantage lor (he present study of being available for all scctors of the economy.
Unsurprisingly, nct critry rates (thc diffcrcncc between entrant and exit rates as delined here) are higher in the fastcr growing sectors. However, cntrant and exit rates themselves do not always follow growth patterns. Somc dcclining scctors - dctailcd statistics show these to be leather, clothing, timber and fur- niture, retail trade and domestic service - have rel- atively high entry rates, especially for women, while some growing sectors such as hotels and “other” pub- lic services have high exit rates, especially for men. Growing and declining sectors have similar overall turnover rates (as measured by the sum of entrant and exit rates) and for women growing sectors even have somewhat lower turnover rates. Comparisons of net changes with turnover rates show that some- what lower entry rates alone would be enough to absorb most employment declines at the sectoral level, so in this sense employment declines need not necessarily generate involuntary job lossl6.
5. Job search by employees
Overall, only about 2 per cent of all employees report that they are searching for another job because
175

Table 5.6. Non-standard forms of working in EEC countries
All sectors Growing Middle Declining
Agriculture
Industry Growing Middle Declining
Growing Middle Declining
Services
Public administration
All sectors Growing Middle Declining
Agriculture
Industry Growing Middle Declining
Growing Middle Declining
Services
Public administration
All sectors Growing Middle Declining
Agriculture
Industry Growing Middle Declining
Growing Middle Declining
Services
Public administration
Belgium Llenmark Fraocc Germany Netherlands ~ ~ ~ ~ ~ , , Avrragc
Per cent 1. Sharc of sclf-cmploymmt m total employment
Men
15.2 18.1 14.5 14.1
85.4
9.4 5.7 7.1
16.0
20.7 20.7 20.6 23.3
0.3
10.6 7.7
10.9 11.1
59.3
7.9 4.9 7.9 9.2
11.6 ~~
7.6 12.3 14.4
0.0
12.4 11.6 12.5 14.3
76.8
8.3 5.8 8.6 9.5
15.2 15.9 14.9 19.4
0.1
11.3 19.4 9.9 8.1
65.9
5.8 3.3 5.6 8.8
18.0 24.0 17.4 11.4
0.0
10.0 11.0 10.1 6.9
63.8
3.6 1.1
6.0
13.1 16.7 12.4 13.8
0.0
3.8
13.6 18.5 12.8 6.8
52.1
8.6 7.9 9.4 2.9
17.1 21.9 15.9 14.0
0.6
12.2 14.4 11.8 10.2
67.2
7.3 4.8 7.1 8.7
15.9 17.8 15.6 16.1
0.2
12.2 9.6 10.0 6.2 8.5 5.8 8 .-I 11.4 3.5 5.2 6.6 8.1 7.1 7.0 12.3 9.9 10.6 6.2 8.4 5.7 8.8 15.4 13 6 15.8 5.9 11.1 2.9 10 8
86.2 65.3 82. I 73.9 78.8 34.1 70.2
10.1 12.3 9.9 4.4 6.7 3.6 7.8 5.3 4.0 6.7 2.2 1.5 3.5 3.9 7.0 11.5 10.2 4.3 7.3 3.9 7.4
19.0 19 .s 11.8 7.2 9.9 1.5 11.5
15.1 7.7 9.8 7.9 8.8 7.0 9.4 12.4 3.2 5.3 6.1 12.9 8.3 8.0 153 8.3 10.1 9.0 7.6 6.7 9.5 21.0 11.7 14.8 5.5 11.8 6.3 11.8
0.1 0.0 0.1 0.0 0.0 0.3 0.1 ~~
2. Share of temporary workers (other than self-employed) in total employment Per cent
Men
4.6 6.6 4.1 2.3
0.9
2.5 3.0 2.8 2.0
4.7 7.0 4.3 2.7
8.9
10.2 11.3 10.1 9.4
6.6
8.8 ~~
7,l 8.6
10.0
10.6 12.0 10.4 8.6
13.1
4.8 5.8 4.7 3.4
1.5
4.1 4.4 4.1 3.4
5.3 6.1 5.3 3.8
5.1
8.9 9.6 8.8 8.3
6.4
7.3 6.5 7.6 7.1
9.0 9.5 8.7 9.8
14.4
5.4 5.9 5.4 4.5
2.5
5 .0 4.6 5.2 4.1
5.9 6.2 6.3 3.6
3.8
4.3 5.8 4.0 1.8
2.8
2.3 2.5 2.3 1.3
5.3 6.J. 5.1 4.3
5.0
~
6.3 7.5 6.2 4.9
3.5
5.0 4.7 5.1 4.7
6.8 7.8 6.7 5.4
8.4
176

Table 5.6 (Continued). Non-standard forms of working in EEC countries
Belgium Dciiniark France Germany Netherlands ~ ~ ~ ~ , ” , , Avcragc
2. Share of temporary workcrs {other than self-employed) in total employment Per cent Women
All sectors Growing Middle Declining
Ayriculturc
Industry Growing Middle Declining
Services Growing Middle Declining
Public administration
10.2 10.7 4.9 9.6 9.7 6.4 8.6 12.8 11.5 5.8 11.6 10.6 7.3 9.9 9.9 10.6 4.8 9.3 9.6 6.3 8.4 3.5 10.4 3.3 8.9 9.1 4.4 6.6
0.0 7.9 2.8 4.9 2.9 13.9 5.4
4.9 8.8 4.1 8.3 10.2 4.9 6.9 8.0 10.5 5.6 8.4 10.2 5.2 8.0 5.4 9.0 3.9 8.3 10.2 4.9 7.0 2.6 7.3 3.0 7.9 10.3 3.9 5.8
11.8 11.5 5.2 11.0 9.4 7.1 9.3 12.4 11.6 5.9 12.8 10.2 7.4 10.0 11.6 11.4 5.1 10.4 9.9 7.1 9.3 9.9 13.0 4.1 10.8 6.1 6.4 8.4
17.6 11.9 5.7 9.3 11.2 5.1 10.1
3. Share of part-time workers [other than self-employed and temporary) in total employment Per cent
All sectors Growing Middle Declining
Agriculture
Industry Growing Middle Declining
Services Growing Middle Declining
Public administration
Men
1.3 8. I 2.9 2.2 7.0 3.2 4.1 2.0 10.3 3.8 2.5 8.5 4.2 5.2 ~~
1.2 8.0 2.9 2. I 7.1 3.0 4.0 0.6 6.3 1.2 2.3 2.7 1.5 2.4
0.6 5.0 i.4 2.2 2.1 2.3 2.2
0.5 3.4 I .2 1.4 3.1 1.5 1.8 0.5 2.8 1.4 1.3 4.0 1.4 1.9 0.5 3.7 1.2 1.4 3.1 1.5 1.9 0.4 2.3 0.9 1.3 2.1 1 .s 1.4
1.9 11.4 4.1 2.8 9.6 4.3 5.7 2.3 11.4 4.3 2.7 x.4 4.4 5.6 2.0 11.4 4. I 2.6 10.7 4.3 5.8 1.5 10.9 3.9 4.0 4.6 4.1 4.8
0.4 1.9 2.6 2.5 2.1 1.8 1.9
All sectors Growing Middle Declining
Agriculture
Industry Growing Middle Declining
Growing Middle Declining
Services
Womcn
15.3 33.7 17.0 25.2 37.5 32.5 26.8 18.9 39.1 19.1 25.9 38.3 38.6 30.0 .. .
14.6 33.4 16.8 25.0 37.7 31.5 26.5 10.0 30.5 11.9 25.9 32.8 23.2 22.4
1.9 13.1 4.8 7.6 12.7 27.0 11.2
8.9 24.5 11.4 21.7 32.1 24.2 20.4 8.5 22.0 11.5 18.5 28.9 23.3 18.8 8.4 24.6 11.4 21.5 32.5 24.5 20.5 10.1 25.0 12.1 25.3 34.6 23.0 21.7
18.8 39.0 19.8 28.3 41.4 38.7 31.0 18.8 41.4 20.2 26.2 37.2 39.1 30.5 18.8 38.8 19.6 28.8 43.4 38.8 31.4 16.5 35.0 22.4 29.3 33.5 33.2 28.3
Public administration 16.0 31.1 21.6 26.9 31.2 19.7 24.4 Notes and sources: See Annex 5.A.

TabIe 5.7. Entries to and exits from employment in EEC countries
Belgium Denmark Francc Gcrmany Nethcrlands Kingdom Average United
1. Persons not in emolovment one vear earlier. as a aercentaee of current emolovment
All sectors Growing Middle Declining
Agriculture
Industry Growing Middle Declining
Services Growing Middle Declining
Public administration
Men
6.1 8.4 7.9 3 .0 5.7 8.1 6.5 6.9 8.0 8.4 3.3 5.2 10.4 7.0 6.0 8.3 7.8 3 .O 5.8 7.8 6.4 6.2 9.0 6.3 2.6 6.1 5.5 6.0
9.9
5.6 4.7 5.4 6.6
6.8 7.6 6.7 6.1
4.4
14.8 10.6 6.2 8.0 11.6
7.7 6.1 2.8 6.3 5.9 7.3 5.8 2.6 5.5 5.8 7.6 6.1 2.8 6.5 6.1 8.5 5.5 2.7 6.0 4.9
8.9 9.4 3.2 5.8 9.6 8.1 9.5 3.2 6.4 11.8 8.9 9.3 3.3 5.7 9.0
10.3 10.0 2.6 5.8 7.8
5.3 4.9 3.8 2.8 6.3
10.2
5.7 5.3 5.7 5.7
7.3 7.8 7.1 7.1
4.6
All sectors Growing Middle Declining
Agriculture
Industry Growing Middle Declining
Growing Middle Declining
Services
Public administration
Women
9.4 10.7 9.4 3.8 9.7 9.4 9.5 9.3 4.1 8.0 9.5 10.8 9.5 3.8 9.8 8.2 113 8 3 3.6 11.7
22.3 22.6 16.5 8.1 9.2
7.9 12.0 7.9 3.8 11.3 8.6 10.5 7.7 4.2 10.2 7.7 11.9 8.0 3.7 11.3 8.3 12.4 7.9 3.3 12.3
10.4 10.2 10.5 4.0 9.3 9.9 9.6 9.9 4.3 8.5
10.4 10.3 10.5 3.9 9.2 12.2 11.9 12.0 4.0 10.9
8.3 7.3 7.6 3 .O 6.8
11.5 9.1 13.0 8.9 11.2 9.1 9.8 9.0
12.4 15.2
10.1 8.8 9.9 8.5
10.3 8.8 8.9 8.8
12.6 9.5 13.9 9.3 12.3 9.4 12.1 10.5
8.6 6.9
178

Table 5.7 (Continued). Entries to and exits from employment in EEC countries
Belgjium Dcnmark France Gerniany Netherlands z:$tm Average
as a oeroentaee uf current emDlovment 2. Persuns empluyed une year ago and not currently employed.
All sectors Growing Middle Declining
Agriculture
Industry Growing Middle Declining
Services Growing Middle Declining
Public administration
4.9 4.5 4.9 6.6
6.6
5.6 4.3 5.1 7.4
4.8 4.5 4.8 5 .O
4.0
8.1 7.2 s.i 9.5
15.7
9.3 6.8 9.1 10.8
7.8 7.2 7.8 8.6
5.4
7.7 6.7 7.8 9.3
13.1
8.2 6.3 8.4 9.6
7.6 7.0 7.6 8.9
5.3
5.9 6.9 5.8 5.3
6.1
4.8 3.6 4.8 5.8
4.8 6.6 4.3 4.3
14.9
3.7 2.8 3.7 5.6
5.2
4.7 2.6 5.0 6.3
3.4 3.1 3.4 4.0
2.2
6.1 6.1 6.1 6.1
6.4
6.6 6.1 6.7 6.4
5.9 6.1 5.9 5.9
4.9
6.1 5.7 6.1 1.1
8.8
6.5 4.9 6.5 7.7
5.1 5.7 5.6 6.1
6.1
All sectors Growing Middle Declining
Agriculture
Industry Growing Middle Declining
Services Growing Middle Declining
Public administration
Women
6.3 12.7 8.5 5.1 5.3 8.8 7.8 5.4 10.6 7.0 5.8 5.2 8.1 7.0 6.6 12.9 8.7 4.9 5.4 8.8 7.9 7.3 13.0 10.3 5.9 5.6 10.6 8.8
20.0 49.5 14.4 6.1 5.5 8.8 17.4
6.9 12.9 9.5 4.8 5.0 10.1 8.2 6.4 13.4 8.3 4.1 3.8 9.3 1.5 6.5 13.1 9.6 4.6 5.2 10.1 8.2 7.6 11.4 9.9 5.9 5.5 10.9 8.5
6.4 11.8 8.4 5.8 5.7 8.3 1.7 5.8 10.0 7.2 6.6 5.9 7.9 7.2 6.4 12.0 8.4 5.3 5.7 8.3 7,7 8.4 13.8 10.6 6.4 5.9 8.5 9.0
4.4 8.6 4.9 3.8 3.6 6.9 5.4 Notes and sources: Sec Annex 5.A.

Table 5.8. Job search by employees in EEC countries
Belgiuni Denmark b'rance Germany Netherlands ~~~~~ Average
Individuals searching for a new job hecause the current job is cunsidercd insecure or transitional. as a percentage of total einploynieiit
All sectors Growing Middle Declining
Agriculture
Industry Growing Middle Declining
Growing Middle Declining
Services
Public administration
Men
2.9 1.4 2.5 1.2 3.6 4.1 1.9 2.8 1.6 4.0 2.7 1.4 2.4 1.1 3.5 1.5 1.3 2.3 1.1 2.9
2.4 2.0 2.8 2.6 3.7
1.5 i.0 2.3 0.8 3.0 1.3 0.5 1.9 0.7 2.1 1.4 0.8 2.3 0.8 3.0 1.6 2.0 2.1 0.9 2.9
3.7 1.5 2.7 1.5 4.0 4.3 2.2 3.2 1.8 4.6 3.5 1.5 2.7 1.3 4.1 2.2 0.9 2.4 1.7 2.1
2.2 2.8 2.0 1.5
1.6
2.3 2.8 2.2 1.8
2.5
1.5 1.7 1.5 1.4
1.7 1.8
1.6 1.5
2.5 3.3 2.3 2.0
2.6 3.2 2.6 2.0
2.8 1.1 1.9 1.2 2.4 2.2 1.9
All sectors Growing Middle Declining
Agriciil t lire
Industry Growing Middle Declining
Services Growing Middle Declining
Womcn
4.7 5.6 4.5 2.5
9.5
2.3 2.8 2.2 2.4
5.4 5.7 5.3 5.8
2.0 2.1 2.1 2.0
2.9
1.7 1 .L 1.8 1.5
2.1 2.3 2.0 2.2
3.2 3.3 3.1 2.8
5.6
2.8 3.2 2.7 2.4
3.3 3.4 3.3 3.3
1.4 1.4 1.4 1.4
2.2
I .2 1.1 1. .2 1.5
1.5 1.5 1.5 1.5
4.1 3.9 4.1 4.3
8.2
4.6 4.9 4.6 4.8
3.9 4.2 4.0 3.1
J .5 1.6 1.6 1.3
1.9
1 .s 1.6 1.5 1.1
1.7 1.5 1.7 1.6
2.8 3.0 2.8 2.3
5 .O
2.3 2.5 2.3 2.3
3.0 3.1 3.0 2.9
Public administration 6.9 2.5 3.1 1.1 2.7 1.3 2.9 Notes and sources: See Annex 5.A.
they consider their current job insecure or transi- tional. Such job search might be expected to be higher in declining sectors than in growing ones. However, with one exception - for men in declining industrial sectors - comparisons in Table 5.8 show that job search is more common among employees in growing than in declining sectors. As temporary jobs also appear more common in growing sectors, this is per- haps evidence that insecurity leading to job search depends upon the individual's personal situation rather than on the sectoral aggregate employment trend, but it could also be evidence that individuals
E. MORE ON NON-STANDARD EMPLOYMENT AND JOB TURNOVER
To supplement the previous section, more detailed data on some employment characteristics, with cor- responding data on employment growth, have been gathercd for France, Japan and the United Statcs.
1. Non-standard forms of employment in France and Japan
in growing industries perceive more opportunities for advancement and promotion through job changing.
Table 5.9 shows, for France, incidences of self- employment, employment in the family business, and

Table 5.9. Nm-standard forms of working, France, 1985-86
Annual growth in
employment 1973-86
(per miu)
Total
All sectors Growing Middle Declining
Agriculture
Industry Growing Middle Declining
Market services Growing Middle Declining
Non-market services
All sectors Growing Middle Declining
Agriculture
Industry Growing Middle Declining
Market services Growing Middle Declining
Non-market services
-0.1 2.1
-0.4 -2.8
-3.1
-1.8 -0.0 -2.0 -3.6
1.6 3.0 1.2 0.3
1.7
Total
-0.1 2.1
-0.4 -2.8
-3.1
-1.8 -0.0 -2.0 -3.6
1.6 3.0 1.2 0.3
1.7 Source: See Annex 5.B
Percenlages of total industry employnicnt in each type of nun-sttandxrd rmployment
Calf. Limited Trainee duraiion
17.0 1.0 0.6 0.9 0.4 1.5 15.1 0.3 0.6 0.6 0.6 1.4 16.3 1.1 0.6 1.2 0.4 1.5 27.3 2.8 0.8 0.7 0.2 1.5
72.2 9.5 0.0 0.3 0.1 0.8
8.9 0.1 1.0 1.2 0.3 1.9
21.4 0.7 0.6 1.3 0.5 1.9 26.5 0.3 1.0 0.4 0.8 2.0 17.4 1 .o 0.5 1.8 0.4 1.9 20.5 0.9 0.4 1.5 0.3 1.8
0.3 0.0 0.1 0.0 0.3 0.4
Women
5.9 5.1 5.8 8.2
22.6
2.2 1 .O 2.5 1.9
8,3 7.6 8.4 9.1
0.1
10.0 2.5
11.9 25.6
68.1
8.6 3.8
10.2 4.8
5.8 2.4 7.1 8.8
0.0
0.6 0.4 0.6 0.6
0.0
1.0 1.6 1 .o 0.6
0.5 0.6 0.4 0.3
0 . 1
0.4 0.5 0.4 0.3
0.0
0.5 0.8 0.4 0.4
0.8 0.9 0.6 0.9
0.0
0.3 0.5 0.3 0.3
0.2
0.3 0.4 0.3 0.4
0.5 0.6 0.4 0.3
0.4
1.9 1.7 2.1 1.8
1.1
2.2 2.5 2.2 2.0
2.4 2.0 2.6 2.7
0.8
four types of non-standard employee statuses : agency temporary work, apprenticeship, training and work on contracts of limited duration. In France, as in several other European countries, agency temporary work and apprenticeships are traditional features of the private sector employment systems, while the last two categories are linked to government action in the labour market. Trainee employment is subsidised, mainly through exempting the employer from pay- ment of social security contributions. Contracts of limited duration are a particular legal form allowing employers to circumvent some of the provisions of employment protection legislation. These latter forms of employment are now numerically more important
than agency or temporary work, following rapid growth in recent years17.
In 1985-86, agency temporary workers were used in industry more than in services. Within services, they were mainly in business services, while appren- tices were found in building and some manufacturing sectors, and self-employment mainly in retail trade, hotels and garages. Employment under limited dura- tion contracts was slightly higher in services than in industry, but the distribution across sectors was rel- atively even.
Table 5.10 shows measures of non-standard work- ing relevant to the Japanese labour market. The level of self-employment in industry is high, compared to
181
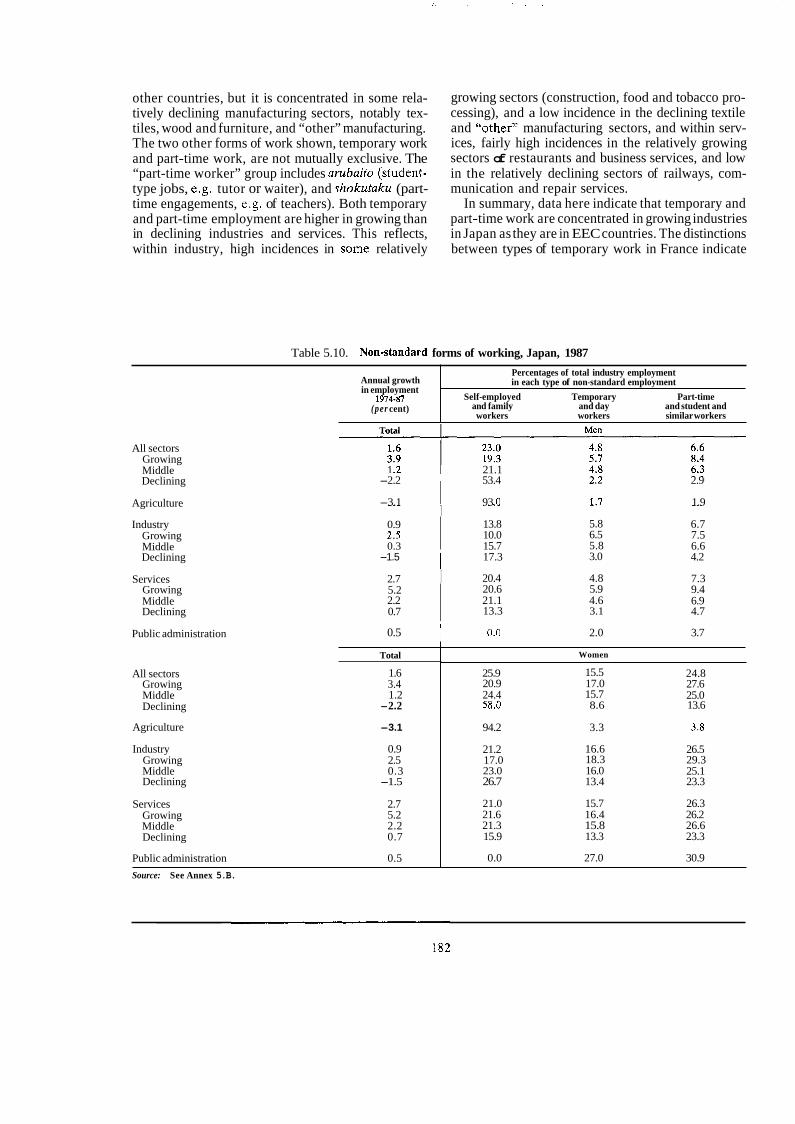
other countries, but it is concentrated in some rela- tively declining manufacturing sectors, notably tex- tiles, wood and furniture, and “other” manufacturing. The two other forms of work shown, temporary work and part-time work, are not mutually exclusive. The “part-time worker” group includes arubaifo (student- type jobs, e.g. tutor or waiter), and shakutuku (part- time engagements, e.g. of teachers). Both temporary and part-time employment are higher in growing than in declining industries and services. This reflects, within industry, high incidences in some relatively
Annual growth in employment
1974-87 (per cent)
growing sectors (construction, food and tobacco pro- cessing), and a low incidence in the declining textile and “other” manufacturing sectors, and within serv- ices, fairly high incidences in the relatively growing sectors of restaurants and business services, and low in the relatively declining sectors of railways, com- munication and repair services.
In summary, data here indicate that temporary and part-time work are concentrated in growing industries in Japan as they are in EEC countries. The distinctions between types of temporary work in France indicate
Percentages of total industry employment in each type of non-standard employment
Part-time Self-employed Temporary and family and day and student and workers workers similar workers
Table 5.10. Non-standard forms of working, Japan, 1987
All sectors Growing Middle Declining
Agriculture
Industry Growing Middle Declining
Services Growing Middle Declining
Public administration
All sectors Growing Middle Declining
Total
21.1 -2.2 53.4 2.9
-3.1 93 .O 1.9
0.9 2.5 0.3
-1.5 I 2.7 I 5.2 2.2 0.7
13.8 10.0 15.7 17.3
5.8 6.5 5.8 3.0
20.4 4.8 20.6 5.9 21.1 4.6 13.3 3.1
0.5 I 0.0 2.0 3.7
Total
1.6 3.4 1.2
-2.2
Source: See Annex 5.B.
6.7 7.5 6.6 4.2
7.3 9.4 6.9 4.7
Agriculture -3.1
Industry 0.9
Middle 0.3 Growing 2.5
Declining -1.5
Services Growing Middle Declining
2.7 5.2 2.2 0.7
Public administration 0.5
Women
25.9 20.9 24.4
15.5 17.0 15.7
24.8 27.6 25.0
58.0 8.6 13.6
94.2 3.3 3.8
21.2 17.0 23.0
16.6 18.3 16.0
26.5 29.3 25.1
26.7 13.4 23.3
21.0 15.7 26.3 21.6 16.4 26.2 21.3 15.8 26.6 15.9 13.3 23.3
0.0 27.0 30.9

that the concentration in growing industries concerps trainees more than apprentices, agency temporary workers or workers with limited duration contracts.
2. Entries to and exits from employment in France and the United States
The concept of entries to and exits from employ- ment used here refers, as in Section D, to individuals who, compared with one year earlier, had changed employment status - from employed to unemployed or not-in-the-labour-force, or vice versa - and not to changes in employer or industry of employment.
Table 5.11 shows for France that, for men, these entries are most often into growing sectors and exits are from declining sectors, as might be expected. However, the findings for women seem surprising. Entries by women are, if anything, somewhat more common in declining industries than in growing ones. This seems to be explained principally by high female rates of entry into textiles and wholesale and retail food trade, which are relatively declining. Entry rates into some of the fastest-growing services, such as banking, finance and insurance, have been relatively low.
The age distribution of male entrants tells a similar story : the three fastest growing French service sectors
Table 5.11. Indicators of employment turnover, France, 1985-86
Annual growth in
employment 1973-86
(uer cent)
Total
All sectors -0.1
Middle -0.4 Declining -2.8
Agriculture -3.1
Growing 2.1
Industry Growing Middle Declining
Market services Growing Middle Declining
-1.8 -0.0 -2.0 -3.6
1.6 3 .O 1.2 0.3
Non-market services 1.7
All sectors Growing Middle Declining
Total
-0.1 2.1
-0.4 -2.8
Agriculture -3.1
Industry Growing Middle Declining
Market services Growing Middle Declining
-1.8 -0.0 -2.0 -3.6
1.6 3.0 1.2 0.3
Non-market services 1.7 a) Youth aged under 25. Source: See Annex 5.B.
Percentaees of emdovees
Job tenure, years Below 1 Over 10
Change in employment Youth" status since previous year share in Entered Left entries
Men
7.1 7.7 6.8 6.1
7.3
5.8 5.3 6.1 4.8
8.0 8.3 8.0 7.5
6.8
6.7 5.9 7.0 7.8
5.6
7.9 5.8 8.3 8.9
6.8 6.3 6.8 7.5
4.9
56.0 53.7 57.9 53.5
38.2
61.6 65.4 61.1 58.2
52.8 45.6 57.3 55.9
60.7
12.6 13.4 12.2 11.1
13.9
10.2 9.0
10.7 8.6
15.3 15.6 15.5 14.6
9.5
43.6 41.3 44.7 46.9
40.9
48.5 49.3 41.9 51.9
36.7 33.3 38.8 38.1
52.1
Women
10.1 8.7 41.6 12.8 38.6 9.9 7.4 47.3 13.1 38.2
10.4 9.3 39.8 12.7 38.8 10.4 10.3 31.5 11.9 39.2
12.4 9.3 11.0 17 .O 27.9
9.6 10.2 40.8 10.4 43.5 7.7 8.3 50.5 10.3 45.8
10.3 10.7 38.2 10.7 42.7 8.1 10.1 44.1 8.6 45.8
10.4 8.4 45.3 14.3 33.9 9.9 7.1 48.0 13.6 33.9
10.4 8.8 46.0 14.6 34.8 11.3 9.4 40.1 14.5 32.3
9.6 7.0 45.8 11.9 44.7
183
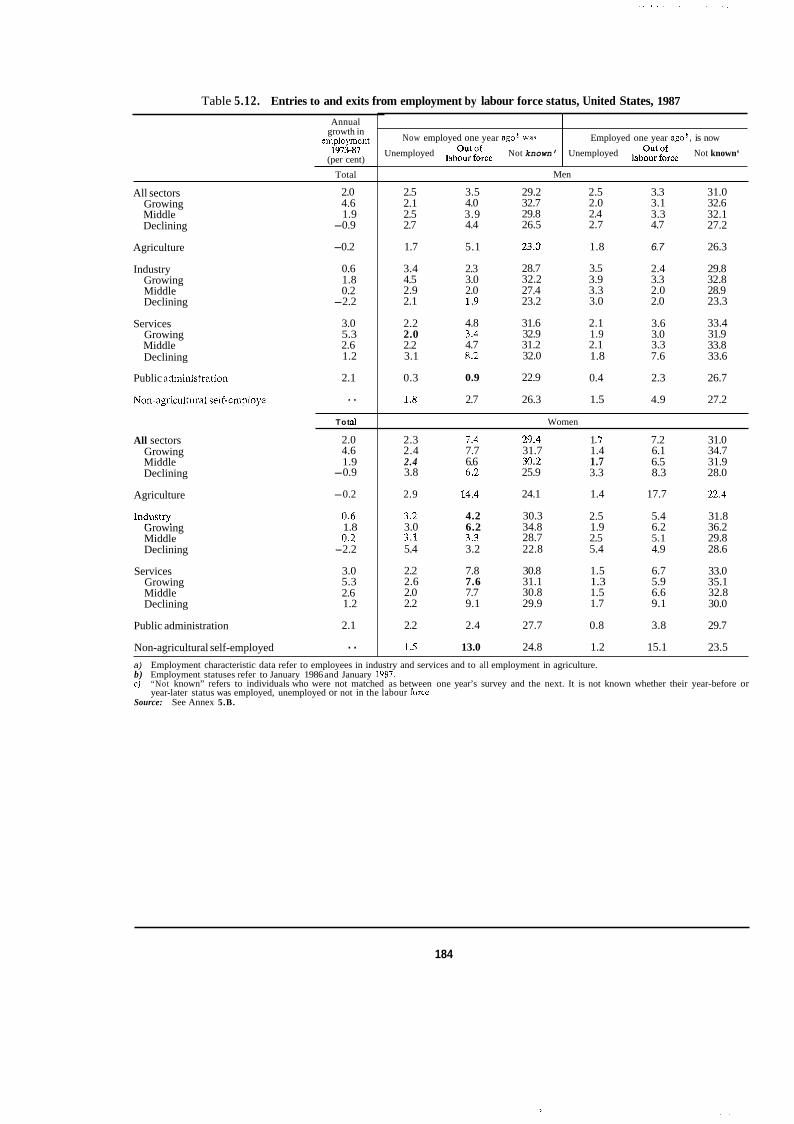
Table 5.12. Entries to and exits from employment by labour force status, United States, 1987
Now employed one year agob was
Unemployed Not known’
Annual growth in
employmcnt 1973-87
(per cent)
Total
Employed one year agob, is now
Unemployed lab($~~rce Not known‘
All sectors Growing Middle Declining
Agriculture
Industry Growing Middle Declining
Services Growing Middle Declining
Public administration
Non-agricultural self-employe
All sectors Growing Middle Declining
Agriculture
Industry Growing Middle Declining
Growing Middle Declining
Services
Public administration
Non-agricultural self-employed
2.0 4.6 1.9
-0.9
-0.2
0.6 1.8 0.2
-2.2
3.0 5.3 2.6 1.2
2.1
. . Tot a1
2.0 4.6 1.9
-0.9
-0.2
0.6 1.8 0.2
-2.2
3.0 5.3 2.6 1.2
2.1
..
Men
2.5 2.1 2.5 2.7
1.7
3.4 4.5 2.9 2.1
2.2 2.0 2.2 3.1
0.3
1.8
3.5 4.0 3.9 4.4
5.1
2.3 3.0 2.0 1.9
4.8 3.4 4.7 8.2
0.9
2.7
29.2 32.7 29.8 26.5
23.0
28.7 32.2 27.4 23.2
31.6 32.9 31.2 32.0
22.9
26.3
2.5 2.0 2.4 2.7
1.8
3.5 3.9 3.3 3.0
2.1 1.9 2.1 1.8
0.4
1.5
3.3 3.1 3.3 4.7
6.7
2.4 3.3 2.0 2.0
3.6 3.0 3.3 7.6
2.3
4.9
31.0 32.6 32.1 27.2
26.3
29.8 32.8 28.9 23.3
33.4 31.9 33.8 33.6
26.7
27.2
Women
2.3 7.4 29.4 1 .I 7.2 31.0 2.4 7.7 31.7 1.4 6.1 34.7 2.4 6.6 30.2 1.7 6.5 31.9 3.8 6.2 25.9 3.3 8.3 28.0
2.9 14.4 24.1 1.4 17.7 22.4
3.2 4.2 30.3 2.5 5.4 31.8 3.0 6.2 34.8 1.9 6.2 36.2 3.1 3.3 28.7 2.5 5.1 29.8 5.4 3.2 22.8 5.4 4.9 28.6
2.2 7.8 30.8 1.5 6.7 33.0 2.6 7.6 31.1 1.3 5.9 35.1 2.0 7.7 30.8 1.5 6.6 32.8 2.2 9.1 29.9 1.7 9.1 30.0
2.2 2.4 27.7 0.8 3.8 29.7
2.5 13.0 24.8 1.2 15.1 23.5 a) Employment characteristic data refer to employees in industry and services and to all employment in agriculture. b) Employment statuses refer to January 1986 and January 1987. c) “Not known” refers to individuals who were not matched as between one year’s survey and the next. It is not known whether their year-before or
year-later status was employed, unemployed or not in the labour form. Source: See Annex 5.B.
184
(business services, personal serviccs, and renting and letting) were the only sectors apart from agriculture to have youth shares in new entries of 40 per cent or below. This illustrates part of the mechanism that keeps the average age of workers in growing sectors fairly high. Preferences of employers in growing serv- ices for somewhat older workers could therefore be an element in youth employment problems.
United States data are shown in Table 5.12. They divide the non-employed into the unemployed and the not-in-the-labour-force. Also shown are individ- uals whose employment change is not known (no match between successive surveys), where there is some presumption that changes in employment status may have been relatively frequent. There is a sharp contrast between industry and services : rates of entry to and exit from unemployment are higher for industry than for services, while rates of entry to or exit from out-of-the-labour-force are higher for services than for industry. Also remarkable are the low overall entry-to-employment rates in growing market serv- ices, notably banking and finance, health, and social and other professional services. It is the relatively declining service sectors that have high entry rates. This is in line with experience for women in Europe shown in Table 5.7.
F. JOB TENURE BY INDUSTRY
In this section one of the most widely available indicators of employment stability, job tenure, is examined for seven countries, including Australia, Canada and Finland.
Statistics on job tenure, as collected by labour force surveys, are not a direct measure of job longevity. They relate to incomplete spells (the time between the start of an employment and the survey date, rather than the end of the employment). Reported average tenures are averages across the stock of employment at a point in time : because the probability of leaving declines with the tenurc already elapsed, (completed) tenures on this basis would exceed the expected (com- pleted) tenure of a new hire [OECD (1984)l. Because “jobs” are different from employment spells, it is clear that a given job may be taken up successively by several persons : low job tenures in a sector need not necessarily indicate that the jobs themselves are short-lived.
Chart 5.2 presents observed average job tenures by approximate ISIC level-1 sector. Overall, average tenures vary considerably, with Japan and France showing the longest tenures, the United States and
Australia the shortest. Relativc tcnures by industry arc similar for men and for women, even though the sex differences in average tcnures are much greater in some countries (over 5 years in Japan) than in others (under 1 year in France). Although on average service sectors have lower tenures than do industry sectors, tenures are not a simple function of past employment growth patterns. The longest tenures are generally in electricity, gas and water, mining and quarrying, and transport and communication, and the shortest are in wholesale and retail trade : yet these are not sectors with particularly rapid employment growth or decline. Industry characteristics other than growth, such as large establishment sizes in mining and quarrying, and electricity, gas and water, seem to be the dominant influences.
Table 5.13 shows the proportion of employees with tenure over 10 years, including averages for growing and declining industries. Only in the United States and (for women) in Australia are long tenures sig- nificantly more frequent in declining sectors. Main (1981) suggests a correction that may be applied to data of this kind to standardize the impact of growth. Allowing for the fact that growing sectors were smaller ten years ago than at present, Table 5.13 suggests that in most countries growing sectors have a higher expectation of long stays (the proportion of employees at a point in time who are still employees ten years later) than do declining sectors.
Table 5.14 shows tenures under 1 year. Tenures under 1 year are equivalent to new hires by employers during the preceding year (excluding employment spells which ended before the survey date), and like other data on hiring may be quite sensitive to the employment situation of the industry over the par- ticular year under study. In an attempt to give a more balanced overall picture, Table 5.14 also shows sum- mary statistics for outflows, computed using the iden- tity :
E, - Et-* = inflows - outflows
where E, - E,+, is employment change over the year, and inflows and outflows both exclude employment spells that both started and ended within the year. The estimates of outflows, based upon tenure data and estimated employment changes, indicate that in the United States and Australia, and in Canada for women only, both outflows and inflows are greater in the growing sectors. In other countries, outflows are highest in declining sectors, and inflows highest in growing sectors.
In time-series turnover statistics, separations from employment as well as hires are usually procyclical : opportunities for voluntary job change are greater when there is considerable net employment growth,
185

Chart 5.2
AVERAGE JOB TENURE BY APPROXIMATE lSlC INDUSTRY, 1986 a
MEN
Average tenure (years) 18 16 14 12 10 8 6 4 2 0 ........... , ................................................... . . . . . " .........
ELECTRICITY GAS AND WATER
MINING
TRANSPORT AND COMMUNICATIONS
MANUFACTURING
OTHER SERVICES
CONSTRUCTION
FlREB
TRADE
Japan 1 7 Canada
France Australia
United Kingdom United States
.. . -.
WOMEN
0 2 4 6 8 10 12 14 16 18 ......... ,_ .................. ._ ................... - ........... ., ................................
a. See Table 5.13. For Australia, the United Kingdom and France, average tenures are estimated from grouped data using mid-points of closed intervals and assuming an average of 27.5 years for tenures 20 years and over [cf. OECD (1984a, Table 31)] ; for France, an average of 20 years was assumed for tenures 10 years and over. Since actual tenures in these ranges vary, sex and industry differences in tenures may be understated for these countries.
b. Finance insurance, real estate and business services
Source : See Table 5.13.

Table 5.13. Employees' with tenures over ten years by approximate ISIC industry
Canada United States Japan Men Women Men Women Men Women Approximate ISIC major division
Australia Men Women
Agriculture Mining and quarrying Manufacturing Electricity, gas and water Construction Trade, restaurants, hotels Transport, communication FIREB Other services
All industries Self-employed
Growing industries" Declining industriese
31.6 20.4 45.0 17.6
28.0 18.7 34.7 23.5
20.7 26.1 I 42.1 38.3 31.6 16.0 33.4 19.4
31.2 21.3 44.4 28.4
26.0 18.3 39.5 28.6
38.7 21.5 39.1 26.8 48.0 22.7 I 44.7 40.6 19.5 22.0 24.4 20.6 19.2 12.2 I 21.2 13.2 42.5 29.1 38.5 28.6
24.9 33.1 23.9 23.6 39.8
Per cent of total
50.8 41.6 63.0 45.5 57.2 28.8 ~~
70.3 28.6 56.8 37.4 47.3 22.5 58.1 39.3 56.5 22.7 52.2 33.8
54.4 29.1 76.6 50.4
53.0 28.1 59.0 36.8
nployees by industrj an
48.3 49.2 27.5 9.9 28.7 17.0 49.7 24.4 26.7 28.9 17.3 9.9 40.1 16.1 24.9 11.8 30.8 16.9
29.5 16.3 . . ..
28.8 15.1 32.3 22.9
France Men Women I 40.8 26.3 55.9 60.9 52.9 46.6 55.9 54.7 37.5 28.6 32.3 27.7 55.6 47.0 41.0 40.3 48.2 42.0
46.6 40.5 57.8 58.1
45.6 40.7 46.3 37.4
38.1 26.3 49.8 14.5 39.3 22.5 58.5 34.4 29.9 21.6 20.9 14.5 47.5 26.7 29.8 17.0 44.7 26.4
37.5 21.7 .. .. 35.5 21.1 39.8 22.5
32.5
49.7
25.7 30.8 51.7 36.1 36.9
39.6
C
C
. . 37.3 36.6
~~~
a) Tenure data for the United States and for Australia include thc self-employed tenures for agriculture are relatively long for these countries because tenures for self-cmployed arc much longer than for employees. b) Some industly classifications are approximate. United States, sanitaryservices are included under electricity, gas and water instead of other services. Japan, business services are included under other services,
Australia, hotels and restaurants are in other services. United Kingdom, non-energy mining is included under manufacturing (metal industries). Data in the French NAP classification were regrouped to ISIC using an algorithm supplied by INSEE.
c) Mining and quarrying, and electricity. gas and water have been grouped under manufacturing. d ) Finance, insurance, real estate and business services. e) Growing and declining sector averagcs are weighted by 1973-87 change in share of total employment as shown in Table 5.1. Sources: Canada: Labour Force Survey. 1986 annual average, special tabulation. United States: Currcnt Population Survey, January 1987, unpublished tables. Japan: Employment Status Survey, 1987. Australia:
Labour Force Survey, February 1987 supplementary survey, unpublished tables. France: EnquEte sur f'emploi, 1986, unpublished tables. United Kingdom: 1986 Labour Force Survey, special tabulation. Finland: Labour Forcc Survey, Autumn 19%, special tabulation.
03

Canada United States Approximate ISIC major division Men Women Men Women
Agriculture Mining and quarrying Manufacturing Electricity, gas and water Construction Trade, restaurants, hotels Transport, communication FIREB Other services
A11 industries Self-employed
Japan Australia France United Kingdom Finland Men Women Men Women Men Women Men Women Bothsexes
Growing industries' Declining industries'
Growing industries' 21.8 ' 26.7 00 Declining industries< 23.9 22.1 -
I
25.5 29.7 6.6 14.6 20.4 24.1 10.3 10.7 14.0 la.6 19.6 18.8 24.2 8.6 19.5 19.5 19.1 14.0 16.0 16.0 23.5 26.0
43.0 21.5 15.8 18.1 26.4 10.2 18.2 13.2 43.5 27.1 34.3 33.2 40.5 1 35 .O 18.0 22.2 21.3
25.9 37.0 14.6
24. I 17.1 24.7 16.7 34.0 44.0 24.9 35.6 29.0
32.3 26.4
Per ceni of total Emplovees with tenures under one ye
nployees by industry a1
8.9 14.2 6.8 18.2 7.4 14.3 3.9 10.2 8.4 13.5
12.0 21.9 7.8 15.3 7.1 18.9 8.7 15.2
8.7 16.9 3.0 10.3
13.9 13.6 18.3 27.8 20.9 25.3 15.8 29.3 25.3 20.9 29.1 34.8 16.9 24.5 27.1 33.2 22.7 27.8
22.7 28.9 . . . . Inflows'
;ex
14.0 23.0 5.9 5.1 9.4 9.5 5.8 9.4
15.7 14.6 18.6 17.6 6.7 7.3
13.9 14.2 11.4 12.5
11.9 12.8 6.8 7.8
16.8 24.0 6.4 26.3
13.0 21 .o 4.7 12.1
18.9 23.9 24.8 30.0 9.9 16.6
20.3 21.4 10.8 18.6
14.8 u.2
25.0
12.1
29.0 21.2 10.5 21.1 21.4
18.6
C
C
..
34.5 24.6
25.4 24.4 28.0
9.3 18.3 8.2 14.3
24.1 29.6 12.3 13.2 16.5 20.6 23.7 I 11.9 14.6 1 13.0

The results for the United States and Australia could reflect a similar pattern across industries - growth itself motivating the turnover in growing industries - as much as intrinsic characteristics of sectoral activity.
G . ESTABLISHMENT SIZES AND EARNINGS BY INDUSTRY
Establishment size is an important factor in working life. While small establishments may offer more involvement and room for individual initiative, in several measurable respects they offer relatively poor working conditions. Most typically, small establish- ments correspond to small enterprises, which are often exempt from certain types of employment leg- islation, and appear to pay lower wages with fewer fringe benefits than do larger enterprises [see OECD (1985a, Tables 31 and 32)]. And despite the publicity often given to closures of large industrial establishments, closure rates for small establishments are in fact several times higher, suggesting that de fact0 at least their employees have less job securityls.
Earnings, as noted early in this chapter, are a central criterion used by some authors in character- ising job quality and/or distinguishing industrics along segmented labour market lines.
Limitations of data make industry differences in establishment sizes and earnings distribution rela- tively difficult to study. Among thc sourccs uscd in this scction, thc United Kingdom earnings data are based on questionnaires to employers, French and Japanese earnings and establishment size data on a combined employerhax survey, German establish- ment size data on social security records, and only U.S. earnings data on a household survey. As with the job tenure data in Section F, the information in this section is presented in terms of “approximate ISIC” sector classifications, reflecting the country- or survey-specific nature of the sector classifications implemented in the sources.
Distributions of employment by establishment size, shown in Table 5.15, indicate strong variations across sectors : in France and Germany, the proportion of employees in establishments with over 1 000 employ- ees varies from 2 or 3 to over 40 per cent. The fol- lowing points may be noted : - In France, the highest frequencies of employment
in large establishments are found in mining and quarrying, and electricity, gas and water. In all three countries, enterprise sizes in manufacturing are also well above average ;
Small establishments are common in construc- tion, wholesale and retail trade, restaurants and hotels. Community, social and personal services have establishment sizes below the all-sector average, but the differences are not great ; Evidence concerning the other service sectors is mixed : in Germany establishments in transport and communication and financial and business services are smaller than average, but in Japan the reverse is the case.
Table 5.15 reports some sector sub-items for Ger- many, to illustrate some of the variability that is hidden at the ISIC l-digit sector level. Within man- ufacturing, very large establishments are common in primary goods and investment goods industries, but uncommon in consumer goods sectors. Large estab- lishments in the business service sector are, perhaps not surprisingly, rare, contrasting with the finance, insurance and real estate sector with which it is grouped under ISIC. Thus, the loss of detail at the I-digit level of analysis appears to be a serious limi- tation.
Because of differences in detailed definition, data in Table 5.15 do not match the sectoral growth data in Table 5.1 very closely. However, an approximate estimate bascd on combining the two tables indicates that in Germany and Japan in growing sectors, about one-quarter of employment is in very small establish- ments, and in declining sectors the proportion is about one-eighth. France shows a rather smaller difference in the same direction,
In theory, the relationship between earnings and employment could go in either direction : if earnings vary exogenously and labour demand is sensitive to costs, high earnings will cause sectoral employment decline ; but if demand varies exogenously and wages are sensitive to demand, sectoral employment growth will drive up earnings.
The incidences of short employment spells and of part-time working differ sharply across sectors, and are major determinants of average earnings per employee. Here, in order to concentrate attention on pay for similar levels of working hours, only distri- butions for full-year (or for the United Kingdom, workers with pay for the pay period not affected by absence) and full-time workers are presented.
Table 5.16 shows that frequencies of earning below a given low or above a given high amount (around the bottom and top decile level of earnings, respec- tively) are several times higher in some sectors than in others. Among the patterns are :
- In France, low earnings are rare in mining, quar- rying and electricity, gas and water ;
189

Table 5.15. Distribution of employees by size of establishment and approximate ISIC industry
lo00 and above l t W 9 100-999
Per cent of tntal emdovment in the industrv
Below 10 Approximate ISIC major divisiun’
France 1982: private and semi-public sectors 2. Mining and quarrying 3. Manufacturing 4. Electricity, gas and water 5. Construction 6. Trade, restaurants 7. Transport, communication 8. FIREBb 9. Other services
All sectors
Germany 1987: private sector 3. Manufacturing
Primary goods Investment goods Consumer goods
5. Construction 6. Trade, restaurants 7. Transport, communication 8. FIREBb
Credit and real estate Business services
9. Other services
5.1 8.0 1.3
28.6 35.6 10.8 20.1 15.8
17.7
8.4 - 5.2 6.4
16.2 24.6 27.3 19.9 22.0 12.0 31.0 27.1
21.7 24.1 28.0 42.6 8.3 47.1
44.6 23.5 42.6 18.7 36.9 35.7 33.8 31.8 28.9 32.3
32.8 32.1
23.9 18.3 21.2 35.8 52.3 43.5 40.4 36.4 31.6 40.6 26.9
35.6 33.6 33.7 41.7 21.3 25.5 23.3 29.0 35.9 22.8 31.5
49.1 21.4 43.4 3.3 3.0
16.6 14.3 23.1
17.4
32.1 42.9 38.7 6.4 1.8 3 . i
16.4 12.6 20.5 5.6
14.5
All sectors 17.6 31.4 31.2 19.8
Japan 1986 private sector 1 t2. Agriculture, mining 3+4. (see above) 5. Construction 6. Trade. restaurants 7. Transport, communication 8. FIREBO 9. Other services
34.3 11.5 33.6 30.4 4.6
19.1 25.9
40.3 33.4 47.0 37.8 31.2 24.3 38.0
19.0 33.5 13.6 21.5 39.5 25.7 28.5
6.5 21.6 5.8
10.3 24.7 30.9 7.6
All sectors 21.4 36.1 27.5 15.1
a) Exact national industrial classifications vary. France, allocations to ISIC were made using an algorithm supplied by INSEE. Japan, some other semi-public industries are included with transport and communication, and approximate iSlC 8 does not include business services. Germany, restaurants and hotels are included with approximate ISIC 9 rather than S I C 6.
b) Finance, insurance, real estate and business services. Sources: France: “Les salaires dans I’industrie, le commerce et les services, annBe de base 1982”. INSEE (1987). Archives et Documents, No. 212. Japan:
“Survey of Wages and Salaries in Private Firms 1986“, National Tax Administration Agency. Germany: data supplied by the Federal Labour Office from the registers of the social insurance scheme.
190
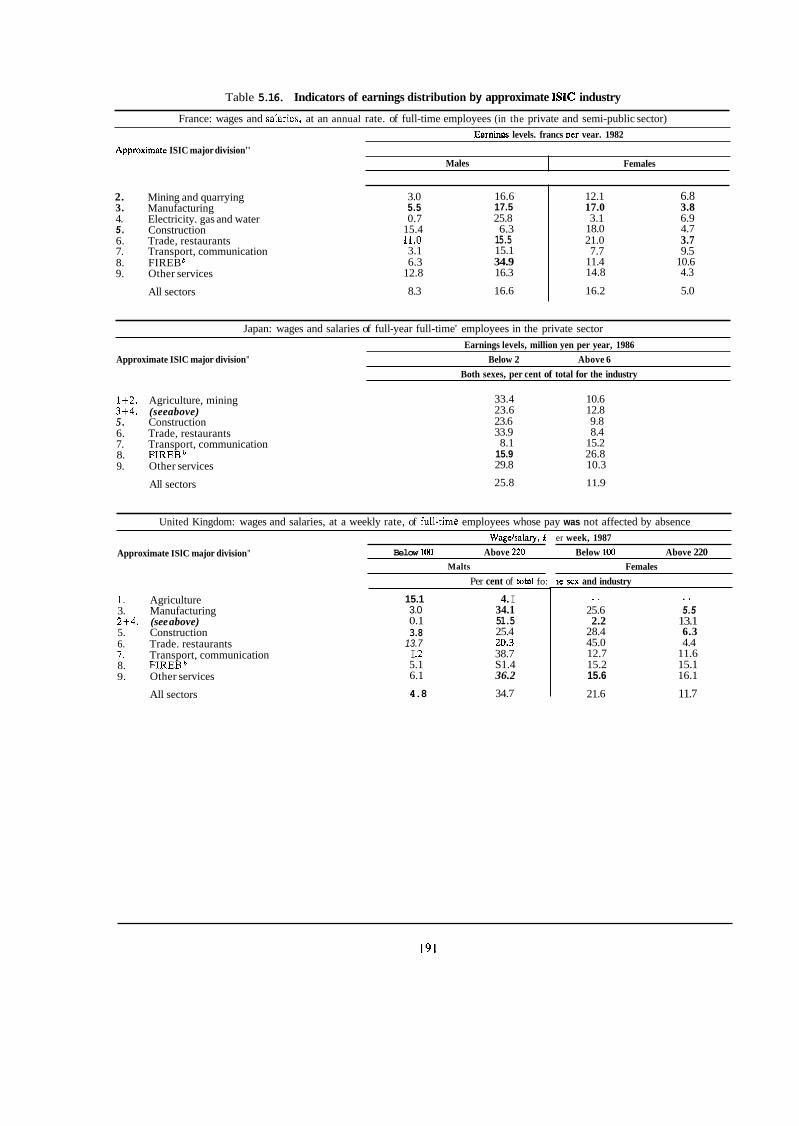
Table 5.16. Indicators of earnings distribution by approximate ISlC industry
Males
~~~~~
France: wages and salarics, at an annual rate. of full-time employees (in the private and semi-public sector) EarninPs levels. francs aer vear. 1982
Females Approxirnilte ISIC major division''
2. 3. 4. 5 . 6. 7. 8. 9.
Mining and quarrying Manufacturing Electricity. gas and water Construction Trade, restaurants Transport, communication FIREB Other services
All sectors
3.0 5.5 0.7
15.4 11.0 3.1 6.3
12.8
8.3
16.6 17.5 25.8 6.3 15.5 15.1 34.9 16.3
16.6
12.1 6.8 17.0 3.8 3.1 6.9
18.0 4.7 21.0 3.7 7.7 9.5
11.4 10.6 14.8 4.3
16.2 5.0
Japan: wages and salaries of full-year full-time' employees in the private sector Earnings levels, million yen per year, 1986
Both sexes, per cent of total for the industry Approximate ISlC major division" Below 2 Above 6
1+2. Agriculture, mining 3+4. (seeabove) 5 . Construction 6. Trade, restaurants 7. Transport, communication 8. FIREBb 9. Other services
All sectors
33.4 10.6 23.6 12.8 23.6 9.8 33.9 8.4 8.1 15.2
15.9 26.8 29.8 10.3
25.8 11.9
United Kingdom: wages and salaries, at a weekly rate, of fuI1-rime employees whose pay was not affected by absence
Approximate ISlC major division"
Wagelsalary, f Below 100 Above 220
1. Agriculture 3. Manufacturing 2+4. (see above) 5. Construction 6. Trade. restaurants 7. Transport, communication 8. FIREBb 9. Other services
All sectors
Malts
Per cent of tutal fo:
15.1 4. I 3.0 34.1 0.1 51.5 3.8
13.7 I .2
25.4 20.3 38.7
5.1 S1.4 6.1 36.2
4.8 34.7
er week, 1987 Below 100 Above 220
Females ie sex and industry
.. . I
25.6 5.5 2.2 13.1
28.4 6.3 45.0 4.4 12.7 11.6 15.2 15.1 15.6 16.1
21.6 11.7
191

Males
--. 7. Transport, communication 8. FIREBb
Femalcs
9. Other services
1. Agriculture 43.6 6.0 2. Mining and quarrying 2.1 27.2 3. Manufacturing 4.3 20.6 4. Electricity, gas and water 1.9 24.7 5. Construction 7.5 14.4 6. Trade. restaurants 12.2 14.4
3.1 7.0 8.6
57.1 0.0 1.0 18.6
15.3 3.3 4.2 3.8
11.0 4.7 32.6 1.5
19.6 6.0 30.2 1 9.5 20.7 15.7
Non-agricultural self-employed workers 21.0 21.5
All employment 9.2 18.8
5.7 25.0 2.9
52.4 5.0
18.0 6.2
The incidence of low earnings is on average lower in manufacturing than in the all-sector average for men, but higher for women ; Earnings in construction are relatively low, with the difference particularly marked for men in France ; Earnings are low in trade, restaurants and hotels, and relatively high in the transport, communi- cation, and finance, insurance, real estate and business services sectors ; In finance, as well as in the community, social and personal services sector, the distribution of earnings is relatively unequal : in the latter, pro- portions of employees with low earnings and proportions with high earnings may both be above the all-sector average.
These patterns give a rather mixed picture as regards the general level of pay in growing as com- pared with declining sectors. Among declining sec- tors, agriculture has a high incidence of low earnings but manufacturing does not, at least for men. Among growing sectors, trade, restaurants and hotcls have low pay, and finance relatively high pay. Approximate estimates based upon combining Table 5.16 with Table 5.1 suggest for males, and for Japan in data not broken down by sex, that the proportions of non- agricultural employees with low earnings and with high earnings are both higher in growing sectors than in the rest of the economy. That is, for males the
growing sectors of the economy do not have signifi- cantly different average earnings, but they do have a more unequal distribution of earnings. For women, by contrast, the estimates suggest that the proportion with low earnings in growing sectors is consistently below the all-economy average. Thus, for women, earnings are overalI higher in the growing sectors of the economy. This male/female difference is in line with earlierfindings [OECD (1988a, Table C.3)], that the ratio of female’ to male earnings is lower in man- ufacturing than elsewhere.
These results contrast with some claims made in the United States that pay is lower in growing sectors. It is clear that results are sensitive to differences in definition and measurement procedureslg. Another complication is that occupational analysis shows a clear shift in employment structure towards higher- paying occupations [McMahon and Tschettcr (1 986)]. This reflects a general shift towards non-manual and especially professional occupations, at the expense of lower-paid manual occupations, which is a long-term and probably worldwide trend20. This illustrates again that the industry trends cannot lead to unambiguous statements about ‘hew jobs”. Of course, a shift towards more skilled jobs may lead to hardship if labour force skills are not upgraded equally rapidly : occupational unemployment rates [OECD (1987a, Chart 3.5)] are a more direct indicator for problems of this kind.
192

H. EDUCATIONAL ATTAINMENT BY INDUSTKY
The importance of education and training for the labour market experience and aggregate economic performance is widcly recognised. However, in ana- lysis and policy formation in this area it is important to take sectoral variation into account. These varia- tions are documented here by drawing further on the data base analysed in Chapter 2 of this Employmeat Outlook.
Table 5.17 shows proportions of the employed labour force having a relatively low level (below sec- ondary school, and without vocational qualifications) and a relatively high level (university first degree or above) of educational attainment, by approximate ISIC industry. The data are not closely comparable across countries. Also, the data concentrate upon the overall levels of attainment, and do not show some important qualitative differences. In some sectors and some countries, experience gained during early years of work is recognised in terms of a formal (appren- ticeship) qualification. Employees with apprentice- ship qualifications are classified separately, and this affects the numbers reported at the lower attainment levels in Table 5.17. With these provisos, notable findings are : - Industry differences are large. The proportion of
those who havc complcted neither secondary education nor a vocational stream of education is usually four or more timcs higher in agriculture than in finance, insurance and real estate. Thc proportion educated to univcrsity degree level in agriculture is usually ten or more times lower than in community, social and personal services ;
- Educational attainment levels are relatively low in construction, intermediate in manufacturing and wholesale and retail trade, and fairly high in electricity, gas and water. The relative position of some sectors varies significantly according to which of the indicators in Table 5.17 is exam- ined : mining - almost certainly due to the role of skilled engineering in the scctor -has a fairly large proportion with university level education, as well as a large workforce without secondary education, while transport and communication have fairly low proportions at either extreme ;
- The sectors with the best educated labour force, by some distance, are finance, insurance, real estate and business services (ISIC 8) and com- munity, social and personal services (ISIC 9). Finance, insurance and real estate, as well as public administration (for the countries where separate statistics are available), have particu- larly low employment shares of those with below-
secondary education, probably associated with the mainly officeiadministrativc nature of the work in these sectors. Community, social and personal services, which include education itself, have particularly high rates of university-level crnployment ;
- Variations in thc rclativc position of the sectors from country to country sccm rathcr small. One perhaps significant difference is that in Austria, Spain and Japan the proportion of university graduates in agriculture is several times lower than in any other sector. In Canada, Sweden, the United Kingdom and the United States how- ever this is not the case. This contrast may reflect the rapidity of the post-war decline in agricultural employment in the former countries, which has led to agriculture being largely staffed by older generations, amongst whom very few entered university. Another area of difference is in man- ufacturing, where the incidence of university lev- els of attainment is in four countries less than half the all-sector average, but in the United States and Japan is close to the all-sector average.
In general, this chapter has examined only recent cmployrnent characteristics. However, in this case an analysis of changes through time is possible : parts iij and ivj of Table 5.17 show growth rates for the employment shares discussed above. The sectoral var- iability of rcported growth in educational attainment in some countries, notably Spain, may reflect the sensitivity of change estimates to sampling error or to procedural differences between surveys conducted at widely separate dates. Overall, scctoral differences in growth rates have not been large enough to change significantly the relative sectoral distribution of the low-level and univcrsity-level workforce. However, improvements have been faster than average in agri- culture and slawcr than average in the two most highly educated service sectors, indicating some equalisation in the distribution of the least and most educated parts of the labour force over the last 10 or 15 years.
Use of educated labour might be considered, like job tenures or establishment sizes, a reflection of a sector’s production technology. However, earlier results have shown little correlation between job ten- ures and sectoral employment growth, and a rather weak correlation between small establishment sizes and sectoral employment growth : educational attain- ment by sector shows a clearer correlation, because attainment levels in the declining agriculture and man- ufacturing sectors are below average, while levels in the growing service sectors ISIC 8 and 9 are much above. This pattern appears to reflect systematic hir- ing practices in these sectors : it is not simply a func- tion of sectoral age structure because, according to
193

Table 5.17. Proportion of the employed labour Forcea having less than secondary (A) and university (E) levels of educational attainment b , by approximate ISIC industry
ij Proportion of the labour force with less than secondary (Level A) educational attainment, 1987 United United
Kinedomd States" Approximate ISIC major &visionc Austria Canada Japan Spain Sweden Germany
1. 2. 3. 4.
8. 9.
5. 6. 7.
Agriculture Mining and quarrying Manufacturing Electricity, gas and water Construction Trade, restaurants Transport, communication FIREB Other services
Other services, private Public administration
All industries'
68.0 49.1 38.8 37.8 33.1 31.4 14.1 30.1 36.0 29.4 23.8 29.1 24.39 11.2 9.2 24.2 17.6
18.4 13.6
31.4 23.8
50.6 65.9 85.0 67.5 74.7 32.9 29.9 47.1 70.4 56.2 16.2 26.9 32.1 61.1 50.1f 57.5 20.6 14.3 12.1 51.9 42.6 23.8 43.7 73.7 46.2 46.6 25.0 23.7 23.4 58.0 52.7 71.9 21.6 19.5 27.9 62.7 51.5 62.5 11.69 11.3 9.5 16.6 31.1 49.8 5.3 16,3 17.2 40.2 35.5 46.9 11.9
18.7 12.8 7.3 5.7
22.5 29.2 58.6 44.1 56.2 16.4
ii) Change in the relative proportion of the labour force with less than secondary (Level A) educational attainmenti Per cent ver vear. between wars below
1. 2. 3. 4. 5. 7. 6.
8. 9.
First date Second date
Agriculture Mining and quarrying Manufacturing Electricity, gas and water Construction Trade. restaurants Transport, communication FIREB Other services
All industries
1971 1981
-12.0 -4.4 -2.3 -3.1 -2.1 -2.4 -3.3 - 1.6 -3.3
-4.1
1975 1987
-5.5 -4.6 -5.6
-5.2 -5.3 -5.5 -4.5 -4.6
-5.4
1978 1974 1987 1987
-5.1 -6.0 -1.6 -9.4 -2.8 -7.3 -1.8 -10.4 -1.9 -6.6 -2.0 -6.6 -2.3 -6.6 -2.9 -6.3 -2.2 -6.8
-2.9 -7.3
1977 1987
-16.3 -11.3 -10.0 -8.3 -11.0 -9.6 -8.5 -7.2 -8.4
-10.1
1971 1987
-11.7
-7.3
-6.7 -6.8 -5.6 -5.6 -5.0
-6.7
1981 1987
-5.2 -5.3 -4.0 -8.3 -1.9 -3.8 -3.2 -3.4 -3.2
-3.5
1972 1987
-6.3 -7.4 -5.6
-5.6 -4.3 -7.6 -5.8 -5.5
-5.6
iii) Proportions of the labour force with university (Level E) educational attainment, 1987
1. Agriculture 2. Mining and quarrying 3. Manufacturing 4. Electricity, gas and water 5. Construction 6. Trade, restaurants 7. Transport, communication 8. FIREB 9. Other services
Other services, private Public administration
* , , . . .
Per cent
0.2 4.2 0.7 1.1 0.3 2.1 5.5 10.3 1.4 10.7 2.1 10.3 2.5 5.4 23.5 1.8 8.4 2.7 11.7 2.3 4.9 10.4 18.1 3.7 2.9 16.7 5.2 19.2 1.1 3.8 1.2 9.0 0.9 2.2 8.5 9.0 2.0 6.6 2.2 12.7 1.8 4.8 5.6 12.9 1.4 8.2 1.4 8.6 3.0 4.2 7.0 17.8
11.6 17.6 8.4 27.1 17.0 17.4 24.6 29.6 19.4 24.8 14.8 24.9 13.4 19.8 33.1 34.8
25.1 24.3 35.4 23.0 29.0 31.3
6 7 14 7 6.3 14.5 5.0 11.1 17.0 23.4

iv) Chanae in the relative proportion of the labour force with university (Level E) educational attainmentk
1. 2. 3. 4. 5. 6. 7. 8. 9.
First date Second date
Agriculture Mining and quarrying Manufacturing Electricity, gas and water Construction Trade, restaurants Transport, communication FIREB Other senices
All industries
1971 1981
4. I 4.2 3.0 2.4 1.2 0.6 2.0
-1.5 4.1
4.7
1975 1987
7.0 4.2 5.1
4.4 5.2 5.1 5.1 2.7
4 .O
Per cent oer vear. between vears below
1978 1974 1977 1987 1987 1987
9.9 2.4 6.9 1.7 6.2 5.2 5.1 3.1
-0.3
2.5
4.0 5.6 3.7
4.1 2.8 6.0
3.6 3.6 3.4 -1.1 3.2 5.1 2.8 13.0 4.0 5.4 3.4 3.8
4.3 7.0
1971 1981 1987 1987
7.2 2.4 7.6
6.7 4.7 9.4
4.5 4.7 6.2 2.7 9.0 0.3 5.3 3.6 2.9 2.0
5.1 3.5
1972 1987
7.5 4.2 5.8
4.4 4.4 6.9 3.7 2.4
4.0 ~ ~~~~~ ~ ~~~ ~ ~
n) Statistics refer to the employed labour force only, except in Sweden and in parts ii) and ivj in Austria. where statistics refer to the whole labour force (including unemployed by industry of last job or similar criteria). They include all age groups, by contrast with statistics given in Chapter 2 which refer to ages 20 and above (Level A) and 25 and above (Level E).
b) The less-than-secondary (A) and university (E) levels of attainment are defined in Chapter 2, Section C.1. and are not closely comparable across countries owing to differences in national educational systems. c) The industry classifications used by some countries do not correspond closely with the S I C . Canada, restaurants and hotels are included in approximate ISIC 9. United Kingdom, approximate ISIC 2 refers
to metal ore and mineral mining plus chemicals and man-made fibres and metal manufacturing, and 4 includes energy extraction. United States, business and repair services are included in approximate ISIC 9. d) Proportions exclude individuals with educational attainment level unreported. e) Data refer to 1988. fl Refers to ISIC 2-4 inclusive. g) Approximate ISIC 7 includes utilities (ISIC 4). h) Finance, insurance, real estate and business services. i) Statistics for all industries may include individuals with industry attachment unreported. j ) Earlier notes still apply. Per cent per year changes d a t e to the ratio of those with Level A educational attainment to those with higher levels. For Austria, changes between the 1971 and 1981 censuses are
shown, while the 1987 figures shown in parts ij and iii) are from the Mikrozensus. k) Earlier notes still apply. Per cent per year changes relate to the ratio of those with Level E educational attainment to those without. For Japan, bccause data available for 1974 were aggregated, the changes
shown relate to educational attainment Levels D and E combined. I
u3 ~h Sources: As Chapter 2.

the evidence given in Section D.2, the workforce in these growing service sectors is not in fact younger than averagc. The correlation with employment growth might, perhaps, be more mixed if a finer industry distinction were used - for example, sep- arating the fast-growing restaurant and hotel sectors from the wholesale and retail trade sectors - but on present evidence, one of the most marked character- istics of growing relative to declining industries seems to be their use of a relatively well-educated labour force.
I. SUMMARY DISCUSSION AND CONCLUSIONS
This section brings together some of the results of this study under thematic headings, with observations on areas of policy concern.
Some factors suggest that the rate of change in sectoral employment structure could slow in the future. Agricultural employment may dcclinc morc slowly because it has reached more sustainable levels. If heavy recessions as in 1974-75 and 1981-82 can be avoided, private employment growth may keep up with employment in government, and cyclical influ- ences on manufacturing employment may be more favourable. Nevertheless, historical experience and cross-country comparisons suggest that the share of industry in total employment approximately follows an inverse U pattern : typically the decline accelerates after the peak level has been passed. Hence it seems likely that change will continue fairly rapid.
A projected slowing of labour force growth through to the year 2000 and beyond, combined with contin- uing structural change, implies that more, rather than fewer, sectors are likely to experience falls in their total employment in the future. Thus, more rather than fewer sectors may find it difficult to maintain long-term job security.
1. Job loss and older workers 1. Sectoral patterns of employment growth
Sectoral employment trends in the richer OECD countries are well chardcterised by the shift from manufacturing to services. Sectors with intermediate levels of opportunity for economies of scale of mass production - such as mining, construction, transport and communication - have had intermediate employment performances. In addition, employment trends in agriculture and government have been of central importance in the pattern of change for some countries and some time-periods. At the detailed level, among industries with the lowest growth rates of employment have been metal, clothing and textiles, and among services with the fastest growth rates have been hotels and restaurants, business services and medical services.
Longer-term trends in sectoral structure are deter- mined largely by real income growth, sectoral pro- ductivity growth, and their interactions with price and income clasticities of demand for sectors’ outputs. Consequently, at the broad level the pattern of growth and decline tends to bc similar across countries having similar levels of development. Although manufactur- ing decline has been a particular issue in the United States, the rate of structural change there has in fact been similar to that in other major economies. This casts some doubt upon the idea that there is a causal link between relatively rapid aggregate employment growth in the United States, and the shift of its employment towards service sectors.
Sectors in employment decline need not necessarily generate involuntary job loss : rates of voluntary quits and retircrnent normally exceed employment dccline by a considerable margin. However, when cutting back employment, companies may not be satisfied with the pattern of voluntary quits from the point of view of the age and skill profile in their labour force ; minor sectors or particular years may experience rates of net job loss that exceed possible natural wastage ; and individual companies may fail or cut back employ- ment in particular plants or particular functions. These factors generate job losses throughout the economy.
Although problems arising from job loss cannot be identified precisely using data on sectoral employment trends, special surveys in thc United States dcsigned to identify “displaced workers” have been reasonably successful, and indicate that worker displacement has tended to be concentrated in sectors with employment decline. Similar surveys could prove useful in Euro- pean countries, where adjustment problems in certain important rcspects arc likely to be more severc.
Given that much employment decline takes place without creating labour market problems, policy needs to encourage the flexibility within the firm and the external labour market that can facilitate such adjustment. Where problems remain, assistance needs to be targeted appropriately.
One perhaps surprising finding here has been that, at least for 1985-86 across the six EEC countries
196

studied, declining scctors are not characterised by an older workforce than are growing sectors. Because manual work is most suitable for younger men, and is concentratcd in industry, declining sectors may have a structural need for a relatively young workforce. Prior to 1969, while the OECD industry share in total employment was still rising, it was relativeIy easy to maintain a young age distribution in industry through new hires, but with the later turnaround to declines in industry employment, age imbalance became a greater problem. Through its pattern of job losses and new hires, the business sector has largely suc- ceeded in solving this problem, but at the cost of leaving unemployed some older workers with obsolete skills. There is also some evidence that the youth share of new entries into employment is particularly low in the fastest-growing service sectors. Hence demands by the most rapidly growing sectors for workers with age, education, or experience, and by the declining sectors for younger workers, could be one factor making it difficult for youths to find and keep jobs.
Patterns of growth imply that some workers who start as manuals in declining industries will need to switch into other, mainly non-manual, sectors in mid- dle age. Hence growth patterns point to the need for measures to facilitate changes between sectors in mid- career. Given concern about unemployment of indi- viduals with obsolete skills, and the public costs of tackling this problem, policy should encourage busi- nesses to plan for the future of their older workers, both through redeployment within the company and through assistance after redundancy that goes beyond making lump-sum payments.
3. Sectoral differences in female employment
Large and continuing dissimilarities exist between male and female patterns of employment by sector [OECD (1988a, Note B of the Technical Annex)]. However, the concentration of womcn’s employment is in growing sectors : on average for EEC countries, women account for over half of employment in serv- ices and in growing sectors generally, compared with a quarter of cmployment in industry and in declining sectors. Hence the pattern of sectoral dissimilarity is likely to help rather than hinder employment and career prospects for women. Earnings prospects for women in servicc sectors, where they are already heavily represented, also appear to be better than in industry.
Occupational dissimilarities, by contrast, are clearly unfavourable to women, in that women are heavily under-represented in the higher-paying and relatively fast-growing non-manual occupations. This suggests
that policies to reduce dissimilarity in employment patterns will do most to assist womcn’s employment and earnings prospects if they conccntrate upon changing non-manual occupational patterns, rather than on persuading women to move into manual occupations or industrial sectors.
Patterns of self-employment differ between men and women, with rates of self-employment in the EEC countries studied here being twice as high for men as for women in growing sectors, but almost the same in declining sectors. This difference reflects dispro- portionately male self-employment in the growing medical, real estate and business service sectors. The quality of self-employment work is very variable, and it may be particularly important for women that meas- ures to promote self-employment pay close attention to the prospects offered in various fields, and avoid some areas of self-employment that offer low pay and long hours of work without good prospects of longer- term improvements.
4. Sectoral influences on job quality
Table 5.1 shows an average historical differential of over 3 per cent per year between employment growth in the large manufacturing and community, social and personal services sectors. This is fast enough nearly to double the ratio of these service jobs to manufacturing jobs in the economy over twenty years. Hence in the medium term, to the extent that employment characteristics differ between grow- ing and declining sectors, sectoral employment struc- ture may lead to change in the character of work itself.
Several indicators examined have suggested that employment in growing sectors is more unstable than in declining sectors. This is true only in an average sense, with many exceptions. Non-standard forms of working - self-employment, temporary work, and part-time work - are in EEC countries more com- mon in growing than in declining sectors, except for women in self-employment. Female part-time work, though it reaches a peak in growing scctors, is still common in declining sectors. Looked at in detail, some of the most rapidly declining industries, such as leathcr and clothing, have relatively high ratcs of self-employment and part-time work.
Short-term job turnover, as measured by entries to and exits from employment and by short job tenures, is in the United States and Australia clearly higher in growing sectors. However, in Europe turnover shows little overall difference between growing and declining sectors : for women, turnover tends even to be higher in declining sectors.
197

In three European countries examined, the pro- portion of the workforce having job tenures over 10 years is similar in growing and declining sectors. This seems significant because, given the relatively smaller size of growing sectors ten years previously, it implies that the probability of staying ten years in the same job is higher in growing than in declining sectors. Thus by this criterion jobs in growing sectors appear relatively stable.
Although part-time and short-term jobs are fre- quently considered to be of lower quality than full- time jobs, they remain a minority of all jobs and may be responding to wishes of a certain minority of work- ers who appreciate the flexibility they offer. In the United States, relatively high rates of entries to and exits from work in the service sector reflect high Bows in and out of the labour force, rather than between employment and unemployment, which suggests that the service sector may be responding to the prefer- ences of some groups, such as students, for shorter- term jobs.
Earnings are arguably a more definite indicator of job quality. Average earnings on a full-time basis appear to be higher in growing than in declining sectors for women, and about the same in both sectors for men. However, services include both high- and low-paid sectors. The earnings distribution for men, averaged across growing industries, shows relatively great inequality : growing industries have a relatively high share of the economy’s low earnings (as well as of high earnings).
Thus earnings statistics suggest that one of the biggest challenges created by growth of service employment may relate to the very variety of the sector, rather than to its characteristics in the sense of statistical averages. Evidence that a high proportion of jobs in growing sectors can be long-term as well as short-term supports this impression. Earnings ine- quality is often regarded as in itself a policy problem, and measures to raise the earnings capacity, and if necessary support the incomes, of low-paid workers could help to ensure that this variety in the service sectors becomes a strength rather than a social problem.
This chapter has made extensive use of information from labour force surveys, which cover the whole economy. Following a long historical tradition, many more specialised labour market statistics cover only manufacturing, and often only permanent or full-time workers. In areas where employment is growing - for services compared with manufacturing, but also for part-time compared with full-time work, irregular work, and perhaps for self-employment compared with dependent employment - the availability of statistics for earnings, hours of work, and even simple
employment totals by detailed industry and occupa- tion is often poor. Where possible, existing surveys should be extended, and new surveys should plan from the outset to include services, if their statistics are not to relate only to a progressively smaller pro- portion of the workforce.
For readers whose interest is in “new jobs”, this chapter has given a “health warning” : there is no agreed definition of a “new job”, and hence no agreed basis for assessing whether new jobs are good or bad. Statements about new jobs may refer for example to sectors where employment has grown, occupations where employment has grown, establishments where employment has grown, or portions of the earnings distribution where employment has grown. Results can be heavily dependent upon the procedure chosen.
5, Sectoral disparities in educational attainment
Educational attainment levels are lowest in agri- culture, which is experiencing employment decline, and are much the highest in the fastest-growing sectors of the economy - finance, business, and community, social and personal services. Employment at thc high- est level (university) is in many countries remarkably concentrated in these service sectors. Thus, educa- tional attainment, of all the characteristics studied here, is probably the most closely correlated with sectoral employment trends. The links between edu- cation and occupation are also strong, and both links should be taken into account in interpreting results given in Chapter 2.
The rapidity of employment growth in sectors with an educated labour force reflects the importance of education in modern economies. Earlier post-war expansion of educational provision, together with gradual retirement of earlier generations of workers, have improved educational attainment levels during the post-war period, but in the longer term further increases in provision will be needed to drive contin- uing improvements in attainment.
The unevenness of educational attainment patterns across sectors may itself be a cause for concern. It concentrates workers with low attainment levels in relatively declining sectors. It leaves the manufactur- ing sector, with its particularly important role in pro- ductivity growth and international competitiveness, relatively underskjlled, and at worst can confine highly-educated workers to enclaves in a restricted range of services, where their benefit to the economy as a whole may be limited, In Japan, channels encour- aging graduates into manufacturing are well-estab- lished, and it seems possiblc that many other countries could benefit from strengthening such links.
198
6. The limits of sectoral trend analysis
This chapter has focused attention on growing and declining industries. Yet characteristics of employ- ment could also be examined for growing and declin- ing occupational or age groups, or in terms of the impact of such factors as the world economic cycle, national tax structure or regulatory changes. Because many factors are at work, the difference between growing and declining industries does not necessarily indicate where the economy as a whole is headed, or the areas where adjustment problems are most severe. Hence, it is important to consider other aspects of
structural change, and study topics of particular inter- est in greater detail, whencvcr possible.
Variations by sector in the incidence of self-employ- ment and part-time employment, in establishrncnt sizes, and in earnings and educational structure seem large and thereby worthy of study. Yet these factors all influence each other, and each is influenced by sector-specific production technology and trends in product demand. Because the consequences of growth and decline of industries are complex, it is important to try not only to understand the processes, which may be too blurred to be described in terms of neat generalisations or models, but also to monitor the outcomes closely.
NOTES
1.
2.
3.
4.
5 .
Changes in employment cross-classified by a job char- acteristic do not isolate new jobs, because jobs are at all times being lost as well as created. Also, many employment characteristics of interest can change for continuing jobs. Table 4.9 of OECD (1987~) shows cmployrnent gains and losses in expanding establishments, new estab- lishments, contracting establishments and closing cstablishrnents by 14 sectors in Canada, France, and Germany 1978/79-3 984, Rates of gross cmployment gain are not closely correlated with net change - for example, the growing financc, insurance and real estate sector had a below-average ratc of gain, while the declining construction sector had an above-average rate. The link between earnings distribution and employ- ment trends in the “good and bad jobs” literature seems to be a presentational device. The trend in distribution of employment by real earnings level is largely a function of inflation and wage change pat- terns, which affect existing jobs independently of whether total employment is growing or declining. According to Loveman and Tilly (1988) changes in the industrial structure of employment had little to do with the increase in earnings inequality in the 1980s. Despite the slight decline after 1973 in real average earnings in the United States, there was an increase in real total compensation (which includes non-wage benefits) and in average real household incomes (due to increases in earners per household). For every 10 hours worked in goods-producing sectors in the United States, 14.3 hours were worked in serv- ice-producing sectors in 1959, and 23 in 1984, indi-
6.
7 .
8.
9.
cating that most of the shift to services remains even in employment data that allow for change in working hours and frequency of part-time work. Exccpt in some general phrases such as “growing and declining industries”, this chapter uses “sector” as a generic term, “industry” to refer to the total of mining and quarrying, manufacturing, electricity, gas and water, and construction, and “services” to refer to all secmrs other than agriculture and industry. Data for growth in output and employment by SGC- tor, 1970 to 1985, were taken from Meyer-zu- Schlochtern (1988). The correlation coefficients between output growth and employment growth across sectors ranged between 0.31 (Japan) and 0.74 (United Kingdom) : coefficients for sectors within industry and private service separately were nearly the same. Countries studied were Sweden and the United States (18 sectors), Canada, France, Japan and the United Kingdom (17 sectors) and Italy (16 sectors). Rones (1986) concluded that New England, the U.S. region with the most dramatic unemployment improvement in the previous decade, “provides clear evidence that an area can key its growth to the man- ufacturing sector if its industries are innovative” and Business Week announced “Manufacturing : the key to growth” (11th January 1987). Analysis of growth and decline on an output basis is more complicated than is analysis on an employment basis. This is because real output is measured at the relative price of an arbitrarily-chosen date, and changes in real output are only one factor affecting output structure at current prices.
I99
10. The method here is closely related to the traditional technique of “shift share” analysis. This typically decomposes an observed economy-wide change into two components, one of which is the average of the industry characteristics weighted by the change in industry employment shares. Here, the positive and negative components of this change are being sepa- rated and re-normalized. Costrell (1988) applies this method in estimating wages in growing and declining industries.
11. In a steady state, the labour force L is constant, and the number of entries per year E equals the number of exits per year X. If the average age of the labour force is to remain constant, the difference between the age of exits YX and the age of entries YE, plus the age increase for those continuing in the labour force must sum to zero, i s .
16.
17.
E(YE - YX) + (L - E) = 0 or (YX - YE) = (L - E)/E.
As will be seen later, on a year-on-year basis turnover rates (E/L or XIL) ate about 7 per cent per year, consistent with a continuing age difference of 13 years between entries and exits in a steady state.
12. Jaffe (1967), while recognising other factors, argued that the age composition of a sector is largcly a function of past rates of growth.
13. The variables discussed in this section were specified by Bernard Casey.
14. Another study by Jacobs, Kohli and Rein (1987) of sector age structures in 1970-71 and 1980-82 for Ger- many, the Netherlands and Sweden finds that older- worker employment shares in service sectors in 1970- 71 were often higher than for manufacturing sectors, and fell more rapidly up to 1980-82. The authors conclude that “early exit (from the labour force by older workers) is not a phenomenon of certain sectors facing specific economic problems.. . the employment share of older workers is also decreasing in growing branches”.
time and temporary work, see OECD (1986a, Tables 16 to 18; 1987a, Tables 1.4, 1.5 and 1.8).
18.
19.
15. For further information on self-employment, part- 20.
Hakirn (198s) studies a 25 per cent increase in self- employment over 1981-86 in Britain, noting that this growth has left its industrial, occupational and regional distribution little changed. Casey and Creigh (1988) and Casey (1988) discuss many issues, including those of definition and measurement, in relation to self- employment and temporary employment, respec- tively. Annual rates of job gain and loss are slightly above 10 per cent [OECD (1987a, Table 4.1)] as computed from changes in establishment employment, and over 20 per cent for individual employee accession and separations [OECD (1986b, Table 11.3)], indicating that job losses are much higher than changes in sectoral employment structure alone would require. In March 1987, there were 478 000 employees with limited-duration contracts and 344 000 trainees in France -increases since 1982 of 56 per cent and 360 per Cent respectively. OECD (1986b, p. 114 ff) describes the importance of several types of flexible employment in Japan, and reports a rapid growth of agency temporary working in the United States over 1963-77, though Abraham (1988) calculated that in 1985 these agency workers accounted for only 0.6 per cent of total employment. Table 4.14 of OECD (1987~) shows employment shares in small establishments (fewer than 20 employees) and large establishments (500 or more employees) for all establishments and for those which were closed down. Relative to large establishments, employeesin small establishments experienced closure frequencies approximately 3 times higher in France, 5 times higher in Sweden, and 10 times higher in Ger- many. Costrell (1988) found for the United States that aver- age annual compensation in sectors declining over 1981-87 was 32 per cent lower than in growing sectors. The statistics in Table 5.16 differ because they exclude part-time earnings, separate female from male employment, and exclude non-wage payments by employers. The employment shifts between 1972 and 1978 reported in OECD (19870, Table 3.4) for five EEC countries are all towards higher-earning occupations.
200
Annex 5.A
GROWTH AND CHARACTERISTICS OF EMPLOYMENT IN EEC COUNTRIES
Data on employment by NACE sector over 1977 to 1986, summarised in Tables 5.2 and 5.4 are from published sources. For Tables 5.5 to 5.8, this information on employ- ment growth has been combined with information on char- acteristics of employment in 1985 and 1986 supplied to the Secretariat by EUROSTAT in the form of special tabula- tions from the EEC labour force surveys.
1. Employment trends 1977 to 1986
Statistics for employees in employment in the EURO- STAT publication Employment and Unemployment 1988 are supplied to the EEC by its member countries, and are based upon a varicty of sources, generally administrative- based or employer surveys. Owing to statistical breaks and omissions in the published data, some estimation was nec- essary before the data could be used. After initial exami- nation, data for the seven countries summarised in Table 5.2 were retained. Estimation of employment trends took place in steps, using the data for all years 1977 to 1986, as follows :
4
ii)
iii)
Inconsistencies in the data were handled either by inferring the error and correcting it or by assuming that a statistical break had occurred. Employment in 2-digit sectors where data were missing was estimated by subtraction of the non-missing 2-digit industries from 1-digit level employment totals. If the resulting employment related to a group of sectors, it was allo- cated proportionately to national data for another year if possible, but otherwise according to the distribution of employrncnt within this group of sectors in other countries (for the year conccrncd, correcting for sta- tistical breaks as below). Employment for 1986 in Denmark and 1977 in the United Kingdom was estimated by applying to 1985 or 1978 respectively the average growth rate of employ- ment over the available years of data (not including 1980-81 for Denmark, the year of a statistical break), and then applying a correction factor to satisfy adding- up constraints. This method was also applied to NACE group-9 industries for 1978 in the United Kingdom. In respect of statistical breaks between 1980 to 1981 in Denmark and 1983 to 1984 in the Netherlands, estimates of earlier data on the later basis were made by assuming that changes in employment share in the year of the break were equal to the average changes for years not affected by the break.
Only a small proportion of sectors in a given country were affected by estimation methods as described at i ) above : the most significant instance of estimation was in France, where two-digit employment within group 9, in the partly-estimated data as used in Chapter 5, is an appor- tionment of the group total according to the distribution in the other countries. For detailed information by country, readers are referred to the source.
There are some indications that the industrial classifica- tion may not be applied consistently through time. For example, 1985-86 growth in employment is reported as 18 per cent in NACE 91 (public administration and def- ence) in the Netherlands ; 19 per cent in NACE 92 (sanitary services) in Germany ; and 20 per cent in NACE 93 (cdu- cation) in Belgium. These changes seem implausibly high. There are also indications that the NACE industrial clas- sification is not applied consistently across countries. Reported employment in NACE 99 (personal services) is about 170 000 in Belgium and 370 000 in Spain, but only 2 800 in the United Kingdom and 100 to 200 in Denmark, a contrast that seems too great to be plausible. These considcrations, as wcU as thc cstirnated nature of some of the data as actually used, suggest that the figures given in Tables 5.4 to 5.8 should be seen as approximatc only.
2. Data on employment characteristics, 1985 and 1986
The following notes describe the variables tabulated in
Table 5.5, part 1 : share of women in employment, data relate to total employment (including self-employed). Parts 2 and 3 : shares of youth and older workers in dependent employment, data relate to employees only (exclude self-employed). Table 5.6, part 1 : self-employment, including family workers, as a percentage of total employment. Part 2 : temporary workers in dependent employment as a per- centage of total employment [questions determining “temporary worker” status differ by country, as described in OECD (1987a, p. 35)]. Part 3 : part-time workers who are neither self-employed, nor temporary workers, as a percentage of total employment.
Table 5.7, part 1, entries : individuals who are currently in dependent employment and one year earlier were not employed (not employees, self-employed, nor in military
Tables 5.5 to 5.8 in more detail.
20 I
or community service), as a percentage of total current dependent employment. Part 2, exits : individuals who are on lay-off or have no employment currently, and who were in dependent employment one year earlier, as a percentage of dependent employment in the current year. Table 5.8, individuals searching for a new job : individ- uals who arc in dependent employment and searching for a new job because of risk or certainty of loss or termination of the current job, or because the current job is considered transitional, as a proportion of total dependent employment.
3. Integration of the data sources
Weighted averages of the variables described above were computed using changes in employment shares 1977-86 and levels of the shares in 1986 as weights, as described in Section C.4. Tables 5.4 to 5.8 use groupings of data as follows :
Agriculture : NACE 0 Industry : Services :
Public administration :
NACE 1 to 5, inclusive. NACE 6 to 9, excluding NACE 91 and 00. NACE 91 and 00 (includes dip- lomatic representation and armed forces).
Statistics relating to growing, middle and declining indus- try or service sectors are based upon sectors’ 1977 and 1986 shares in NACE 1-5 or in NACE 6-9 (less 91 and 00) employment respectively. Two possible defects of the weighting method used here
are : - Because the weights relate to dependent employment,
they give little significance to the characteristics of agriculture, and this is especially relevant to statistics for declining sectors ;
- The publications used to calculate weights and the labour force survey data used to measure employment characteristics give discrepant original data concerning 1986 employee employment by sector. For the 30 or so largest of the 57 sectors shown in Table 5.2, dis- crepancies between the two sources were, with some exceptions, generally less than 20 per cent. Larger dis- crepancies were somewhat more frequent among the smaller sectors.
Data in Tables 5.5 to 5.8 arc simple averages of results from 1985 and 1986 labour force surveys : this averaging over two surveys reduces the IikeIy importance of sampling errors. Although the analysis in principle used the 57 sectors shown in Table 5.2, certain sectors were omitted andlor aggregated with others, or had zero reported employment. Thc actual numbers of industries used were 57 in France and Germany, 55 in the United Kingdom, 53 in Belgium, 52 in Denmark, and 49 in thc Netherlands.
202

Annex 5. B
GROWTH AND CHARACTERISTICS OF EMPLOYMENT IN FRANCE, JAPAN AND THE UNITED STATES
Readers are referred to Section (2.4 for a general descrip- tion of the methods used for Tables 5.9 to 5.12.
Employment growth and shares of employment in non- standard work are both based on employment including the self-employed. The analysis used a total of 39 sectors.
France United Swes
For Tables 5.9 and 5.11, data on employment growth by sector were taken from the Annuaire Stutistique, 1981 (Table 2.01-3), 1984 and 1988 (Table C.01-4). The change in employment share by sector 1973-79 was computed from the first two sources, 1979-86 from the third. Information on employment characteristics was supplicd by INSEE and is described in Annexe 2 of the EnquPte sur I’Empbi (Col- lections de I’INSEE, 114D). The analysis used a total of 38 sectors. Tables show simple avcrages of results from the 1985 and 1986 surveys.
Japan
For Table 5.10, data on employment characteristics and total employment were taken from the Employment Status Survey, All Japan, 1987, Table 5 and 1974, Table 3.
For Table 5.12, changes in employment sharcs over 1973- 82 and 1983-87 were calculated from Labour Force Statistics Derived from the Current Population Survey : A Databook, Vol l., BLS Bulletin 2096 (September 1982), and Employ- ment and Earnings, January 1983, 1984 and 1988. Some reaggregations wcre made in 1973-82 data to bring their industrial classjfication closer to that used after 1982. Changes in shares 1982-83 were also calculated from the Current Population Survey data for agriculture, but the pattern within non-agricultural sectors was estimated from establishment survey data relating to employees, reported in Employment and Earnings, January 1985, Information on changes in labour force status between 1986 and 1987 was supplied as a special tabulation from the Current Pop- ulation Survey by the Bureau of Labor Statistics. The ana- lysis used a total of 44 industries.
203

. / ,

Note A
PUBLIC EXPENDITURE ON LABOUR MARKET PROGRAMMES
Chapter 3 of last year’s Employment Outlook reviewed the projles of labour market budgets in OECD countries. Table A. 1 provides updated information on public spending in the main programme categories. Data are available for 23 countries, and the four years 1985 to 1988. For some countries the 1987 figures have been slightly revised.
For the interpretation of these figures it is essential to keep in mind the methods, concepts and definitions explained and discussed in Chapter 3 of last year’s Employment Outlook, pp. 86-88, and the Annex to that chapter.
Main developments
In most respects, 1988 expenditure exhibited the same patterns as in 1985. As a proportion of GDP, total spending fell slightly in a majority of countries. This fall, usually concerning active measures as well as income maintenance, was largely a consequence of improve- ments in the labour market situation. The opposite - higher spending on both kinds of programmes - occurred only in Denmark, New Zealand (data here are
limited) and Norway, countries where unemployment rose during 1988.
Income maintenance typically accounts for more public outlays than do all active programmes combined. In only four countries - Greece, Italy, Portugal and Sweden - did the active programmes in 1988 account for more than half of total labour market spending. Italy and Portugal strongly increased their spending on active programmes, encouraged by the European Social Fund which primarily supports training and youth pro- grammes in the European Community’s less affluent regions. In both countries, the increase in “active” spending was also facilitated by reductions in unemploy- ment compensation sxpenditures.
Some shift of resources from income maintenance towards more active programmes also took place in Finland, Japan, the Netherlands and Spain. Only Sweden combined a decline in active measures with an increase in unempioyment benefit spending (more gen- erous benefits).
Among the active programmes, adult training domi- nates in many countries, and its importance has tended to increase. Direct job creation, by contrast, showed a decline; several such schemes were abolished during the period 1985 to 1988.
205

Table A. l . Public expenditure on labour market programmes in 1985-1988 as a percentage of GDP
Australia” 1985 1986 1987 1988
Employment services and administration 0.12 0.11 0.11 0.10
Labour market training (adults) 0.03 0.04 0.04 0.05 Special youth measure: ~ 0.05 0.05 0.06 0.06 Direct job creation and
employment subsidies 0.20 0.15 0.10 0.06 Measures for the disabled 0.03 0.03 0.03 0.03 Subtotal : “active” measures 0.43 0.38 0.33 0.30
Unemployment compensation 1.32 1.32 1.14 1.03 Early retirement for
labour market reasons - - - - Subtotal : Income maintenance 1.32 1.32 1.14 1.03
GRAND TOTAL 1.74 1.71 1.47 1.33
Finland
Employment services and administration 0.07 0.09 0.09 0.09
Labour market training (adults) 0.27 0.27 0.26 0.27 Special youth measures 0.03 0.03 0.02 0.03 Direct job creation and
employment subsidies 0.42 0.41 0.42 0.41 Measures for the disabled 0.09 0.09 0.09 0.11 Subtotal : “active” measures 0.88 0.88 0.88 0.90
Unemployment compensation 0.87 0.98 0.93 0.82 Early retirement for
labour market reasons 0.46 0.56 0.61 0.60 Subtotal : Income maintenance 1.33 1.54 1.55 1.42
GRAND TOTAL 2.21 2.42 2.43 2.32
Italv
Employment services and administration
Labour market training (adults) Special youth measures Direct job creation and
employment subsidies Measures for the disabled Subtotal : “active” measures
Unemployment compensation Early retirement for
Subtotal : Income maintenance labour market reasons
G R A N D TOTAT
0.08 0.10 0.08 0.06 0.02 0.01 0.32 0.53 0.59
- - - - - -
0.45 0.65 0.68
0.75 0.65 0.49
0.28 0.30 0.32 1.04 0.95 0.81
1.49 1.59 1.49
-
0.08 0.03 0.78
- -
0.90
0.40
0.33 0.72
1.61
Austria 1985 1986 1987 1988
0.11 0.11 0.11 0.11 0.09 0.11 0.13 0.07 0.03 0.03 0.03 0.01
0.03 0.05 0.06 0.03 0.03 0.03 0.04 0.04 0.29 0.33 0.36 0.26
0.83 0.87 0.94 0.89
0.13 0.14 0.17 0.16 0.96 1.01 1.11 1.05
1.25 1.33 1.47 1.31
France
0.13 0.13 0.13 . . 0.25 0.27 0.28 . . 0.17 0.23 0.31 . .
0.06 0.05 0.04 . . 0.05 0.05 0.05 . . 0.66 0.74 0.81 . . 1.20 1.25 1.32 . . 1.24 1.08 0.94 . . 2.44 2.33 2.26 . . 3.10 3.07 3.07 . .
. . . . 0.03 0.03
.. . . 0.03 0.03 . . . . - -
. . . . 0.10 0.13 ’ . ’ . 0.01 0.01 . . . . 0.17 0.20
. . . . 0.41 0.39
. . . . - -
. . . . 0.41 0.39
. . . . 0.58 0.58
Belgium
1985 1986 1987 1988
0.17 0.17 0.17 0.18 0.11 0.12 0.13 0.14 . ’ . . 0.02 0.02
0.85 0.90 0.76 0.68 0.15 0.15 0.16 0.18 1.28 1.34 1.24 1.20
2.51 2.42 2.39 2.20
0.85 0.83 0.80 0.80 3.37 3.25 3.19 3.01
4.64 4.58 4.42 4.21
Germany
0.21 0.22 0.23 0.23 0.20 0.24 0.30 0.32 0.05 0.05 0.06 0.05
0.17 0.19 0.21 0.22 0.19 0.20 0.22 0.23 0.82 0.91 1.00 1.05
1.41 1.31 1.34 1.33
0.01 0.01 0.02 0.02 1.41 1.33 1.35 1.35
2.23 2.24 2.36 2.41
Luxembourg
0.04 0.05 0.05 . . - 0.03 0.02 ..
0.11 0.08 0.10 . .
0.13 0.07 0.07 . . 0.29 0.28 0.28 . . 0.57 0.51 0.51 . . 0.31 0.29 0.31 . . 0.74 0.66 0.74 . . 1.05 0.95 1.06 .. 1.62 1.46 1.57 ’ .
Canada“ 1985 1986 1987 1988
0.24 0.24 0.22 0.20 0.23 0.24 0.21 0.20 0.14 0.12 0.10 0.10
0.02 0.02 0.02 0.02
0.63 0.62 0.55 0.52
1.87 1.86 1.65 1.59
- - - -
- - - -
1.87 1.86 1.65 1.59
2.50 2.48 2.20 2.11
Greece
0.06 0.06 0.07 0.07 0.14 0.15 0.20 0.12 0.04 0.05 0.04 0.04
0.08 0.11 0.17 0.20 0.01 0.02 0.03 0.02 0.34 0.40 0.51 0.45
0.44 0.46 0.41 0.39
- - - -
0.44 0.46 0.41 0.39
0.78 0.85 0.92 0.83
Netherlands
0.08 0.08 0.07 0.09 0.20 0.20 0.21 0.21 0.03 0.05 0.05 0.08
0.07 0.10 0.08 0.06 0.74 0.70 0.70 0.69 1.11 1.13 1.11 1.13
3.04 2.98 2.81 2.69
- - - - 3.04 2.98 2.81 2.69
4.15 4.11 3.92 3.82
Denmark 1985 1986 1987 1988
. ‘ 0.10 0.11 0.11
. . 0.49 0.48 0.51
. . 0.23 0.24 0.24
. . 0.01 0.02 0.03
. . 0.25 0.27 0.30
. . 1.08 1.11 1.19
. . 2.66 2.70 3.04
. . 1.26 1.26 1.30
. . 3.92 3.96 4.34
. . 5.01 5.07 5.53
Ireland
0.15 0.15 0.17 0.15 0.66 0.60 0.55 0.52 0.47 0.44 0.50 0.43
0.18 0.33 0.32 0.30
1.46 1.52 1.54 1.40
3.72 3.76 3.62 3.42
- - - -
- - - - 3.72 3.76 3.62 3.42
5.18 5.28 5.16 4.83
New Zealand”
0.05 0.07 0.07 0.08 0.09 0.24 0.45 0.50
- - 0.01
0.62 0.35 0.10 0.21 0.01 0.02 0.02 0.01 0.78 0.67 0.64 0.82
0.65 0.87 1.06 . .
-
- - - .. 0.65 0.87 1.06 .. 1.42 1.54 1.70 . .

Norwav Port u pal Soain Sweden” Switzerland
Employment services and administration 0.12 0.13 0.12 0.11
Labour market training (adults) 0.11 0.10 0.07 0.07 Special youth measures 0.05 0.05 0.02 0.03 Direct job creation and
employment subsidies 0.21 0.06 0.01 0.02 Measures for the disabled 0.18 0.20 0.18 0.19 Subtotal : “active” measures 0.67 0.53 0.40 0.42
Unemployment compensation 0.50 0.38 0.36 0.51 Early retirement for
labour market reasons - - - -
Subtotal : Income maintenance 0.50 0.38 0.36 0.51
GRAND TOTAL 1.17 0.91 0.76 0.93
Turkev
Employment services and administration
Labour market training (adults) Special youth measures Direct job creation and
employment subsidies Measures for the disabled Subtotal : “active” measures
w 0 4 Unemployment compensation
Early retirement for labour market reasons
Subtotal : Income maintenance
GRAND TOTAL
. .
. .
. .
. . ..
. .
. .
. .
..
. *
0.01 0.02 0.01 0.02 0.04 0.03 0.04 0.06 0.04
0.07 0.07 0.05 0.01 - - 0.15 0.18 0.14
0.15 0.18 0.14
4) The data refer to the following fiscal years : the United States, year to :
. ’ 0.08 0.09 0.11
. ’ 0.19 0.17 0.26
. ’ 0.04 0.08 0.11
. 0.04 0.10 0.13
.. 0.04 0.02 0.02
. 0.39 0.46 0.64
’ . 0.41 0.37 0.32
. . - - -
.. 0.41 0.37 0.32
.. 0.80 0.84 0.96
United Kingdom’
0.14 0.15 0.15 0.14 0.09 0.10 0.11 0.14 0.25 0.25 0.26 0.25
0.22 0.31 0.30 0.20 0.O4 0.04 0.03 0.03 0.73 0.86 0.85 0.77
1.97 1.93 1.82 1.73
0.05 0.03 0.02 0.01
2.03 1.96 1.84 1.74
2.76 2.81 2.68 2.50
0.10 - -
0.26
0.36
2.89
3.03 2.92
3.28
-
-
0.08 0.08 0.09 0.07 0.10 0.12 0.15 0.19 0.16
0.41 0.38 0.40 0.01 0.01 0.01 0.71 0.75 0.78
2.57 2.47 2.33
0.01 0.04 0.03 2.58 2.51 2.36
3.29 3.26 3.14
United States“
. .
. .
. .
. .
. .
..
..
..
..
. .
0.07 0.07 0.06 0.11 0.11 0.11 0.03 0.03 0.03
0.02 0.01 0.01 0.03 0.03 0.03 0.27 0.25 0.25
0.57 0.52 0.44
0.57 0.52 0.44
0.84 0.77 0.69 September: Canada, Japan, New Zealand and the United King
0.25 0.26 0.23 0.20 0.50 0.51 0.55 0.51 0.21 0.17 0.12 0.13
0.42 0.32 0.24 0.20 0.73 0.77 0.77 0.75 2.12 2.03 1.90 1.79
0.67 0.72 0.66 0.70
0.12 0.12 0.11 0.10 0.80 0.84 0.77 0.80
2.91 2.86 2.67 2.59
0.08 0.07 0.07 0.07 0.01 0.01 0.01 0.01 - - - -
- - - -
0.08 0.W 0.09 0.09 0.17 0.17 0.16 0.16
0.28 0.23 0.23 0.19
- - - -
0.28 0.23 0.23 0.19
0.45 0.40 0.44 0.36
m, year from 1 April ; Australia and Sweden. year from 1 July. . . Data not available. - Nil or less than 0.005 per cent of GDP, or not possible to separate from other expenditure. Expenditure as a proportion of Gross Domestic Product (GDP) has becn calculated on the basis of GDP at current matkct priccs, according to OECD estimates. Source : See OECD, Employment Outlook, 1988, Chapter 3.

Related Documents