University of Huddersfield Repository Muo, Ugonnaya E. Characterising Vibro-Acoustic Signals of a Reciprocating Compressor for Condition Monitoring Original Citation Muo, Ugonnaya E. (2018) Characterising Vibro-Acoustic Signals of a Reciprocating Compressor for Condition Monitoring. Doctoral thesis, University of Huddersfield. This version is available at http://eprints.hud.ac.uk/id/eprint/34964/ The University Repository is a digital collection of the research output of the University, available on Open Access. Copyright and Moral Rights for the items on this site are retained by the individual author and/or other copyright owners. Users may access full items free of charge; copies of full text items generally can be reproduced, displayed or performed and given to third parties in any format or medium for personal research or study, educational or not-for-profit purposes without prior permission or charge, provided: • The authors, title and full bibliographic details is credited in any copy; • A hyperlink and/or URL is included for the original metadata page; and • The content is not changed in any way. For more information, including our policy and submission procedure, please contact the Repository Team at: [email protected]. http://eprints.hud.ac.uk/

Welcome message from author
This document is posted to help you gain knowledge. Please leave a comment to let me know what you think about it! Share it to your friends and learn new things together.
Transcript

University of Huddersfield Repository
Muo, Ugonnaya E.
Characterising VibroAcoustic Signals of a Reciprocating Compressor for Condition Monitoring
Original Citation
Muo, Ugonnaya E. (2018) Characterising VibroAcoustic Signals of a Reciprocating Compressor for Condition Monitoring. Doctoral thesis, University of Huddersfield.
This version is available at http://eprints.hud.ac.uk/id/eprint/34964/
The University Repository is a digital collection of the research output of theUniversity, available on Open Access. Copyright and Moral Rights for the itemson this site are retained by the individual author and/or other copyright owners.Users may access full items free of charge; copies of full text items generallycan be reproduced, displayed or performed and given to third parties in anyformat or medium for personal research or study, educational or notforprofitpurposes without prior permission or charge, provided:
• The authors, title and full bibliographic details is credited in any copy;• A hyperlink and/or URL is included for the original metadata page; and• The content is not changed in any way.
For more information, including our policy and submission procedure, pleasecontact the Repository Team at: [email protected].
http://eprints.hud.ac.uk/
CHARACTERISING VIBRO-
ACOUSTIC SIGNALS OF A
RECIPROCATING COMPRESSOR
FOR CONDITION MONITORING
Ugonnaya Enyinnaya Muo
A thesis submitted to the University of Huddersfield in partial fulfilment of the requirements
for the degree of
Doctor of Philosophy
Department of Mechanical Engineering
School of Computing and Engineering
The University of Huddersfield
September 2018
CHARACTERISING VIBRO-ACOUSTIC SIGNALS OF A RECIPROCATING
COMPRESSOR FOR CONDITION MONITORING
2 DEGREE OF DOCTOR OF PHILOSOPHY (PHD)
COPYRIGHT
i. The author of this thesis (including any appendices and/or schedules to this thesis) owns
any copyright in it (the “Copyright”) and she has given The University of Huddersfield
the right to use such copyright for any administrative, promotional, educational and/or
teaching purposes.
ii. Copies of this thesis, either in full or in extracts, may be made only in accordance with
the regulations of the University Library. Details of these regulations may be obtained
from the Librarian. This page must form part of any such copies made.
iii. The ownership of any patents, designs, trademarks and any and all other intellectual
property rights except for the Copyright (the “Intellectual Property Rights”) and any
reproductions of copyright works, for example graphs and tables (“Reproductions”),
which may be described in this thesis, may not be owned by the author and may be
owned by third parties. Such Intellectual Property Rights and Reproductions cannot and
must not be made available for use without the prior written permission of the owner
(s) of the relevant Intellectual Property Rights and/or Reproductions
CHARACTERISING VIBRO-ACOUSTIC SIGNALS OF A RECIPROCATING
COMPRESSOR FOR CONDITION MONITORING
3 DEGREE OF DOCTOR OF PHILOSOPHY (PHD)
ABSTRACT
Machine monitoring in industries such as chemical process plants, petroleum refineries and
pulp and paper industries has significantly increased over the years, mainly because of the
economic impact associated with the breakdown of a piece of equipment. With downtime
sometimes costing up to 100,000 USD a day (Wachel, N.D), industrial organisations have made
it mandatory to put in place systems for monitoring the condition of critical machines used for
production purposes to prevent unforeseen machine breakdown. Reciprocating compressors
are one of the widely used compressor types in diverse fields of application particularly in the
oil and gas industry or chemical industry. In these industries, reciprocating compressors are
mainly used to deliver high-pressure gas from one location to another. Due to the importance
of these machines in delivering high-pressured air and sometimes toxic gases safely, their
reliability has gained widespread interest over the years.
To improve reciprocating compressor operational performance and reliability, this research
focuses on investigating the characteristics of vibro-acoustic signals from a reciprocating
compressor based on a comprehensive analysis of non-intrusive vibration measurement and
discharge gas oscillations (pulsations). This study will provide more knowledge on using two
techniques (vibration and gas pulsations) for online monitoring and diagnosing of reciprocating
compressor faults. Other monitoring techniques such as in-cylinder pressure, instantaneous
angular speed (IAS), airborne acoustic as well as vibration are previously reported in literature,
however, it is believed that no information for condition monitoring of discharge gas pulsation
of a reciprocating compressor has been explored.
To fulfil this study, in-depth modelling and an extensive experimental evaluation for different
and combined faults common to reciprocating compressor systems are explored for a wide
discharge pressure range to better understand the vibro-acoustic sources. Three common faults
including discharge valve leakage, intercooler leakage, discharge pipeline leakage and two
combined faults: discharge valve leakage and intercooler leakage, discharge valve leakage and
discharge pipeline leakage under various discharge pressures are studied in this thesis. The
simulation of compressor performance with and without faults for several discharge pressures
were in good agreements with the corresponding experimental evaluations, and was used to
understand the compressor dynamics. Furthermore, a preliminary study on the effectiveness of
conventional methods such as time-domain and frequency-domain analysis of both vibration
and gas pulsation measurements were investigated. Results show that, these traditional

CHARACTERISING VIBRO-ACOUSTIC SIGNALS OF A RECIPROCATING
COMPRESSOR FOR CONDITION MONITORING
4 DEGREE OF DOCTOR OF PHILOSOPHY (PHD)
methods were insufficient in revealing fault characteristics in the vibration signal due to the
usual noise contamination and nonstationary nature of the signal. Although, with the gas
pulsation signal, waveform patterns and resonant frequencies varied with faults at several
discharge pressures, nevertheless, effective band pass filtering needed to identify the best
frequency band that can represent the characteristic behaviour of gas pulsation signals proofed
difficult and time consuming.
Amongst several advanced signal-processing approaches reviewed such as wavelet transform,
time synchronous average, Hilbert transform, and empirical mode decomposition; wavelet
packet transform is regarded as the most powerful tool to describe gas pulsation and vibration
fault signals in different frequency bands. A combination of wavelet packet transform (WPT)
and Hilbert transform (envelope analysis) is proposed to achieve optimal and effective band
pass filtering for resonance band identification in gas pulsation signals, and WPTs de-noising
property, which can effectively reduce excessive noise revealing key transient features in
vibration signals.
Optimal band selection for vibration signal was achieved using entropy computation. The band
with the highest entropy was used to reconstruct the signal and the envelope of the new
vibration signal was used for classification. The fundamental frequency and its harmonics were
used as a tool for fault classification. All fault conditions were clearly separated using the
fundamental frequency and its third (3X) harmonic.
Regarding gas pulsation signals, the optimal band was selected by computing the root mean
square (RMS) values of all eight enveloped band signals for several discharge pressures and
faults. The band with the best RMS separation trend was selected for further classification
using two main diagnostic features: the kurtosis and entropy of optimal band. The plot of
kurtosis against entropy as a diagnostic tool showed good valve fault classification across a
wide discharge pressure range.
Although the analysis of vibration signal using the proposed methods gave more reliable results
for reciprocating compressor fault detection and diagnosis compared to the gas pulsation
results, analysis of gas pulsation signals gave a better result on the optimal frequency band
selection that can represent the behaviour of reciprocating compressor (RC) valve fault.
Therefore, it can be deduced that analysis of the RC vibration signal together with the gas

CHARACTERISING VIBRO-ACOUSTIC SIGNALS OF A RECIPROCATING
COMPRESSOR FOR CONDITION MONITORING
5 DEGREE OF DOCTOR OF PHILOSOPHY (PHD)
pulsation signal has a promising potential to be used for condition monitoring and fault
diagnostics of reciprocating compressors online.

CHARACTERISING VIBRO-ACOUSTIC SIGNALS OF A RECIPROCATING
COMPRESSOR FOR CONDITION MONITORING
6 DEGREE OF DOCTOR OF PHILOSOPHY (PHD)
DECLARATION
This dissertation is submitted for the degree of Doctor of Philosophy at the University of
Huddersfield. I declare that the work in this dissertation was carried out in accordance with the
Regulations of the University of Huddersfield. This work is original except where
acknowledgement and references are made to the previous work. This dissertation has not been
submitted for a degree, diploma or other qualification at any other university.
(UGONNAYA ENYINNAYA MUO)

CHARACTERISING VIBRO-ACOUSTIC SIGNALS OF A RECIPROCATING
COMPRESSOR FOR CONDITION MONITORING
7 DEGREE OF DOCTOR OF PHILOSOPHY (PHD)
DEDICATION
I dedicate this thesis to my parents Sir and Lady Enyinnaya Ogbulafor for their unconditional
love and support particularly my father who has always encouraged me to work hard and chase
my dreams.

CHARACTERISING VIBRO-ACOUSTIC SIGNALS OF A RECIPROCATING
COMPRESSOR FOR CONDITION MONITORING
8 DEGREE OF DOCTOR OF PHILOSOPHY (PHD)
ACKNOWLEDGEMENT
I would give all the praise and glory to the almighty God who has given me good health,
wisdom, knowledge, and strength to carry on throughout this research period.
My propound gratitude goes to my supervisory team, which comprises the director of studies
Prof. Andrew David Ball and Dr Fengshou Gu. For the excellent support, motivation,
encouragement, advice, guidance and supervision from the beginning to the very end of my
PhD studies. Their constant direction and generous contributions towards this research were of
great help and was very much appreciated all through my four years of studies. I would also
like to appreciate the University of Huddersfield for sponsoring my doctoral degree.
I would like to appreciate my parents Sir and Lady Enyinnaya Ogbulafor for their
encouragement, prayers and support all through the period of my research.
Most of all I would like to appreciate my wonderful and handsome husband Ifeanyichukwu
Muo for his patience, love, and his wholehearted support all through the years of my research.
I cannot forget my princess Daluchi Muo and precious son Jidechi Muo whom is currently
growing in me, mummy loves you both so much. Furthermore, my sincere gratitude goes to
my sisters (Onyinyechi Okpe and Dr. Ezinwa Uzukwu), brother (Odinakachi Ogbulafor)
and special aunty (Ijeoma Oji) for their unflagging love and prayers throughout my studies.
Finally, to my all my friends at the Centre for Efficiency and Performance Engineering
(CEPE) research group Dr. Misan, Osama, Naima, Zainab, Yuandong and others I want to
say a big thank you for their input and friendship.

CHARACTERISING VIBRO-ACOUSTIC SIGNALS OF A RECIPROCATING
COMPRESSOR FOR CONDITION MONITORING
9 DEGREE OF DOCTOR OF PHILOSOPHY (PHD)
PUBLICATIONS
Zainab Mones, Guojin Feng, Muo Ugonnaya, Fengshou Gu, Andrew David Ball
(2016) Performance evaluation of wireless MEMS accelerometer for reciprocating
compressor condition monitoring. In: International Conference on Power
Transmissions 2016 (ICPT 2016), Chongqing, P.R. China, 27–30 October 2016
Muo Ugonnaya, Zainab Mones, Guojin Feng, Fengshou Gu, Andrew David Ball
(2017) Application of Wavelet Packet Transform and Envelope Analysis to Non-
stationary Vibration Signals For Fault Diagnosis of a Reciprocating Compressor. In:
Conference: First World Congress on condition monitoring, London, 13-16 June, 2017
- BINDT
Muo Ugonnaya, Madamedon Misan, Ball Andrew and Gu Fengshou (2017) Wavelet
Packet Analysis and Empirical Mode Decomposition for the Fault Diagnosis of
Reciprocating Compressors. In: 23rd International Conference on Automation &
Computing, 7-8 September 2017 Huddersfield
CHARACTERISING VIBRO-ACOUSTIC SIGNALS OF A RECIPROCATING
COMPRESSOR FOR CONDITION MONITORING
10 DEGREE OF DOCTOR OF PHILOSOPHY (PHD)
TABLE OF CONTENTS
ABSTRACT ............................................................................................................................... 3
DECLARATION ....................................................................................................................... 6
DEDICATION ........................................................................................................................... 7
ACKNOWLEDGEMENT ......................................................................................................... 8
PUBLICATIONS ....................................................................................................................... 9
TABLE OF CONTENTS ......................................................................................................... 10
LIST OF FIGURES ................................................................................................................. 17
LIST OF TABLES ................................................................................................................... 23
LIST OF ABBREVIATIONS .................................................................................................. 25
LIST OF NOTATIONS ........................................................................................................... 27
CHAPTER ONE ...................................................................................................................... 30
1 INTRODUCTION ............................................................................................................ 30
1.1 Background and Research Motivation ...................................................................... 31
1.2 Relevance of Monitoring Machinery ........................................................................ 32
1.3 Problem Statements ................................................................................................... 35
1.4 Research Aim ............................................................................................................ 35
1.5 Research Objectives .................................................................................................. 35
1.6 Thesis Outline ........................................................................................................... 36
CHAPTER TWO ..................................................................................................................... 38
2 RECIPROCATING COMPRESSORS AND COMMON FAILURE MODES .............. 38
2.1 Introduction ............................................................................................................... 39
2.2 Compressor Types ..................................................................................................... 39
2.2.1 Dynamic Compressors ....................................................................................... 40
2.2.2 Ejectors .............................................................................................................. 42
2.2.3 Rotary Positive Displacement Compressors ...................................................... 42
2.2.4 Reciprocating Piston Compressors .................................................................... 45

CHARACTERISING VIBRO-ACOUSTIC SIGNALS OF A RECIPROCATING
COMPRESSOR FOR CONDITION MONITORING
11 DEGREE OF DOCTOR OF PHILOSOPHY (PHD)
2.2.4.1 Operating Principle of a Reciprocating Compressor ......................................... 46
2.3 Typical Compressor Application .............................................................................. 47
2.4 Compressor Problems ............................................................................................... 49
2.5 Reciprocating Compressor Components ................................................................... 50
2.5.1 Compressor Valves ............................................................................................ 50
2.5.2 Elements of a Compressor Valve ....................................................................... 53
2.5.3 Compressor Cylinder ......................................................................................... 54
2.5.4 Compressor Cylinder Liner................................................................................ 54
2.5.5 Compressor Crankshaft ...................................................................................... 54
2.5.6 Compressor Piston ............................................................................................. 54
2.5.7 Compressor Bearings ......................................................................................... 55
CHAPTER THREE ................................................................................................................. 56
3 REVIEW OF CONDITION-BASED MONITORING (CBM)........................................ 56
3.1 Introduction ............................................................................................................... 57
3.2 Visual Inspection ....................................................................................................... 57
3.3 Cylinder Pressure Monitoring ................................................................................... 57
3.4 Instantaneous Angular Speed .................................................................................... 59
3.5 Airborne Acoustics .................................................................................................... 60
3.6 Vibration Monitoring ................................................................................................ 62
3.7 Signal Processing for Machine Monitoring .............................................................. 63
3.7.1 Time Domain ..................................................................................................... 64
3.7.2 Frequency Domain Analysis .............................................................................. 67
3.7.3 Time-Frequency Domain Analysis .................................................................... 68
3.8 Summary ................................................................................................................... 70
CHAPTER FOUR .................................................................................................................... 71
4 DESIGN AND CONSTRUCTION OF TEST-RIG FACILITY ...................................... 71
4.1 Introduction ............................................................................................................... 72

CHARACTERISING VIBRO-ACOUSTIC SIGNALS OF A RECIPROCATING
COMPRESSOR FOR CONDITION MONITORING
12 DEGREE OF DOCTOR OF PHILOSOPHY (PHD)
4.2 Test Rig Facility ........................................................................................................ 72
4.2.1 The Broom Wade TS-9 Reciprocating Compressor .......................................... 72
4.3 Measurement Instruments ......................................................................................... 74
4.3.1 Accelerometers .................................................................................................. 75
4.3.2 In-Cylinder Pressure Sensor .............................................................................. 76
4.3.3 Airborne Acoustic Sensor .................................................................................. 77
4.3.4 Static Pressure Sensor ........................................................................................ 78
4.3.5 Temperature Sensors .......................................................................................... 78
4.3.6 Shaft Encoder ..................................................................................................... 79
4.4 Data Acquisition System (DAQ)............................................................................... 80
4.4.1 Software: LabWindows TM/CVI Version 5.5 ................................................... 81
4.5 Data Measurement Practice ....................................................................................... 82
4.6 Fault Seeding ............................................................................................................. 83
4.6.1 Valve Leakage Simulation ................................................................................. 84
4.6.2 Intercooler Leakage Simulation ......................................................................... 84
4.7 Repeatability of Measured Signals ............................................................................ 85
4.7.1 Baseline .............................................................................................................. 85
4.7.2 Discharge Valve Leakage .................................................................................. 93
4.7.3 Intercooler Leakage ......................................................................................... 101
4.7.4 Summary .......................................................................................................... 109
CHAPTER FIVE ................................................................................................................... 110
5 DYNAMIC MODELLING OF A DOUBLE-STAGE, SINGLE-ACTING
RECIPROCATING COMPRESSOR .................................................................................... 110
5.1 Introduction ............................................................................................................. 111
5.2 A Brief Review of Previous Reciprocating Compressor Modelling ....................... 112
5.3 Crankshaft Dynamic Model –Piston Kinematics .................................................... 113
5.3.1 Mechanism of Crank shaft and Connecting Rod ............................................. 113
CHARACTERISING VIBRO-ACOUSTIC SIGNALS OF A RECIPROCATING
COMPRESSOR FOR CONDITION MONITORING
13 DEGREE OF DOCTOR OF PHILOSOPHY (PHD)
5.4 Cylinder Volume ..................................................................................................... 117
5.5 Equation of Motion ................................................................................................. 118
5.5.1 Calculating the Torques ................................................................................... 118
5.6 Cylinder Pressure Models ....................................................................................... 120
5.7 Mass Flow Models .................................................................................................. 121
5.7.1 Suction Mass Flow Model ............................................................................... 121
5.7.2 Discharge Mass Flow Model ........................................................................... 122
5.8 Valve Dynamics ...................................................................................................... 123
5.8.1 Suction Valve Motion ...................................................................................... 124
5.8.2 Discharge Valve Motion .................................................................................. 125
5.9 Discharge Plenum Pressure ..................................................................................... 125
5.10 Fault Simulation ...................................................................................................... 127
5.10.1 Second Stage Discharge Valve Leakage .......................................................... 127
5.10.2 Intercooler leakage ........................................................................................... 128
CHAPTER SIX ...................................................................................................................... 129
6 MODEL VALIDATION ................................................................................................ 129
6.1 Introduction ............................................................................................................. 130
6.2 Model Analysis ....................................................................................................... 130
6.2.1 Physical Parameters and Constants .................................................................. 130
6.3 Healthy Simulation Results ..................................................................................... 132
6.3.1 In-Cylinder Pressure Signal ............................................................................. 132
6.3.2 Valve Displacement and Vibration Signals ..................................................... 134
6.3.3 Discharge Chamber Pressure ........................................................................... 135
6.4 Discharge Valve Fault Simulation Results.............................................................. 136
6.4.1 In-Cylinder Pressure Fault Signal .................................................................... 136
6.4.2 Valve Displacement and Vibration Fault Signals ............................................ 139
6.5 Intercooler Fault Simulation Results ....................................................................... 142

CHARACTERISING VIBRO-ACOUSTIC SIGNALS OF A RECIPROCATING
COMPRESSOR FOR CONDITION MONITORING
14 DEGREE OF DOCTOR OF PHILOSOPHY (PHD)
6.5.1 In-Cylinder Pressure Fault Signal .................................................................... 142
6.5.2 Valve Displacement and Vibration Fault Signals ............................................ 144
6.6 Discharge Chamber Fault Simulation Results ........................................................ 146
CHAPTER SEVEN ............................................................................................................... 149
7 CHARACTERISTICS OF VIBRATION SIGNALS FROM A RECIPROCATING
COMPRESSOR ..................................................................................................................... 149
7.1 Introduction ............................................................................................................. 150
7.2 Time Domain Analysis of Vibration Signal ............................................................ 151
7.2.1 RMS ................................................................................................................. 154
7.2.2 Kurtosis ............................................................................................................ 155
7.3 Frequency Domain Analysis ................................................................................... 157
7.4 Summary ................................................................................................................. 161
CHAPTER EIGHT ................................................................................................................ 163
8 CHARACTERISTICS OF DISCHARGE GAS PULSATION FROM A
RECIPROCATING COMPRESSOR .................................................................................... 163
8.1 Experimental Setup ................................................................................................. 164
8.1.1 Test Procedure ................................................................................................. 164
8.2 Time Domain Analysis............................................................................................ 165
8.2.1 Gas Pulsation Time Domain Waveform for Fault Cases ................................. 167
8.3 Conventional Statistical Measures from Time Domain Signal ............................... 170
8.3.1 Probability Density Function ........................................................................... 170
8.3.2 Root Mean Square and Kurtosis ...................................................................... 172
8.4 Frequency Domain Analysis ................................................................................... 173
CHAPTER NINE ................................................................................................................... 179
9 ANALYSIS OF VIBRATION SIGNAL USING WAVELET PACKET TRANSFORM
WITH ENVELOPE ANALYSIS ........................................................................................... 179
9.1 Theoretical Background of Wavelet Transform...................................................... 180
CHARACTERISING VIBRO-ACOUSTIC SIGNALS OF A RECIPROCATING
COMPRESSOR FOR CONDITION MONITORING
15 DEGREE OF DOCTOR OF PHILOSOPHY (PHD)
9.1.1 Continuous Wavelet Transform (CWT) .......................................................... 180
9.1.2 Discrete Wavelet Transform (DWT) ............................................................... 180
9.1.3 Wavelet Packet Transform (WPT) ................................................................... 181
9.2 Selecting Mother Wavelet ....................................................................................... 183
9.3 Envelope Analysis ................................................................................................... 184
9.4 Experimental Setup ................................................................................................. 185
9.5 Test Procedure ......................................................................................................... 185
9.6 Results and Discussion ............................................................................................ 186
9.6.1 Traditional Time Domain and Frequency Domain Analysis ........................... 186
9.6.2 Wavelet Packet Transform and Wavelet Packet Energy ................................. 187
9.6.3 Fault Classification Using Harmonic Changes ................................................ 191
9.7 Conclusions ............................................................................................................. 191
CHAPTER TEN..................................................................................................................... 193
10 ANALYSIS OF DISCHARGE GAS PULSATIONS USING WAVELET PACKET
TRANSFORM WITH ENVELOPE ANALYSIS ................................................................. 193
10.1 Gas Pulsation Source and Resonance Assessment .................................................. 194
10.1.1 Simplified Resonance Assessment of the System ........................................... 195
10.1.2 Gas Pulsation Propagation Simulation............................................................. 199
10.2 Application of Wavelet Packet Transform .............................................................. 200
10.2.1 Selection of Base Wavelet ............................................................................... 201
10.3 Proposed Methodology ........................................................................................... 203
10.4 Experimental Results and Discussion ..................................................................... 205
10.4.1 WPT Analysis of the Discharge Chamber Gas Pulsations .............................. 207
10.4.2 Envelope Analysis and Feature Extraction of Discharge Chamber Gas Pulsations
210
10.4.3 Fault Classification using Statistical Features ................................................. 212
10.5 Conclusion ............................................................................................................... 214

CHARACTERISING VIBRO-ACOUSTIC SIGNALS OF A RECIPROCATING
COMPRESSOR FOR CONDITION MONITORING
16 DEGREE OF DOCTOR OF PHILOSOPHY (PHD)
CHAPTER ELEVEN ............................................................................................................. 215
11 CONCLUSIONS AND RECOMMENDATIONS FOR FURTHER WORK ............ 215
11.1 Review of Thesis Objectives and Achievement ...................................................... 216
11.2 Conclusion on Condition Monitoring of Vibro-acoustic Signals from a Reciprocating
Compressor......................................................................................................................... 218
11.3 Contribution to Knowledge ..................................................................................... 221
11.4 Recommendation for Future Work ......................................................................... 222
12 APPENDIX 1 .............................................................................................................. 223
REFERENCES ...................................................................................................................... 225

CHARACTERISING VIBRO-ACOUSTIC SIGNALS OF A RECIPROCATING
COMPRESSOR FOR CONDITION MONITORING
17 DEGREE OF DOCTOR OF PHILOSOPHY (PHD)
LIST OF FIGURES
Figure 1.1: Primary causes of unscheduled reciprocating compressor shutdown ................... 31
Figure 1.2: Prognost compressor system failure mode survey 2009 ....................................... 32
Figure 1.3: Classification of Maintenance Strategies (Williams, Davies, & Drake, 1994) ..... 33
Figure 2.1: Compressor Classification ..................................................................................... 40
Figure 2.2: A Centrifugal Compressor (Boyce, 2009) ............................................................. 41
Figure 2.3: An Axial Compressor (Giampaolo, 2010) ............................................................ 41
Figure 2.4: Typical Ejector (Brown, 2005) .............................................................................. 42
Figure 2.5: Schematics of a typical sliding vane compressor (Cipollone, 2016) .................... 43
Figure 2.6: Helical Lobe compressor (Ormer, 2002) ............................................................... 44
Figure 2.7: A typical Liquid Ring Compressor (Al-Qattan, 2007) .......................................... 44
Figure 2.8: Cross-section of a typical single-acting reciprocating compressor (Al-Qattan, 2007)
.................................................................................................................................................. 45
Figure 2.9: Single-acting compression steps of a compressor cylinder b) Actual P-V diagram
of single stage compression cycle ............................................................................................ 47
Figure 2.10: Compressor types and their application range based on pressure and flow (Brown,
2005) ........................................................................................................................................ 49
Figure 2.11: Channel Valve (Forsthoffer, 2017, p. 119) ......................................................... 52
Figure 2.12: Plate Valve (Forsthoffer, 2017, p. 120) ............................................................... 52
Figure 2.13: Actual plate valve used for this research ............................................................. 53
Figure 3.1: Pressure measurement from a two stage reciprocating compressor ...................... 58
Figure 3.2: One cycle of IAS measurement from a reciprocating compressor ........................ 60
Figure 3.3: Simplified waveform parameters of airborne acoustic signal (Yan, et al., 2015) . 62
Figure 3.4: Vibration signal from a two stage reciprocating compressor ................................ 63
Figure 3.5: Signal Processing Techniques ............................................................................... 64
Figure 4.1: Pictorial representation of two- stage reciprocating compressor (Broom Wade TS9)
.................................................................................................................................................. 73
Figure 4.2: Schematic Diagram of the test rig system ............................................................. 74
Figure 4.3: Vibration measurement flow chat ......................................................................... 75
Figure 4.4: Dynamic-pressure measurement flow chat ........................................................... 76
Figure 4.5: Acoustic Pressure measurement flow chat ............................................................ 77
Figure 4.6: Static tank-pressure flow chat ............................................................................... 78
Figure 4.7: K type, Cr-Al thermocouple installation and temperature monitoring process .... 79
CHARACTERISING VIBRO-ACOUSTIC SIGNALS OF A RECIPROCATING
COMPRESSOR FOR CONDITION MONITORING
18 DEGREE OF DOCTOR OF PHILOSOPHY (PHD)
Figure 4.8: Optical Pulse Shaft Encoder and data collection flow chat ................................... 80
Figure 4.9a) Front and b) rear view panel of the CED Power1401 DAC ................................ 80
Figure 4.12: Second stage value plate a) with leakage and b) without leakage ....................... 84
Figure 4.13: intercooler leak simulation .................................................................................. 84
Figure 4.14: Repeated in-cylinder waveforms at several discharge pressures ........................ 86
Figure 4.15: Interaction plot of RMS and several discharge pressures for pressure signals ... 87
Figure 4.16: repeated airborne acoustic wave signals at several discharge pressures ............. 89
Figure 4.17: Interaction plots of RMS and several discharge pressure for airborne acoustic
signals ...................................................................................................................................... 90
Figure 4.18: Repeated vibration signals at several discharge pressures .................................. 92
Figure 4.19: Interaction plots of RMS and several discharge pressures for vibration signals. 93
Figure 4.20: Repeated in-cylinder pressure waveforms at several discharge pressure ............ 94
Figure 4.21: Interaction plots of the RMS values for several discharge pressures and repeated
pressure signals ........................................................................................................................ 95
Figure 4.22: Repeated airborne acoustic waveforms at several discharge pressures .............. 97
Figure 4.23: Interaction plots of the RMS values for several discharge pressures and repeated
airborne acoustic signals .......................................................................................................... 98
Figure 4.24: repeated vibration signals at several discharge pressures ................................... 99
Figure 4.25: Interaction plots of the RMS values for several discharge pressures and repeated
vibration signals ..................................................................................................................... 100
Figure 4.26: Repeated pressure signals at several discharge pressures ................................. 102
Figure 4.27: Interaction plots of RMS values for several discharge pressures and repeated
pressure signals ...................................................................................................................... 103
Figure 4.28: Repeated airborne acoustic signals at several discharge pressures ................... 104
Figure 4.29: Interaction plots of the RMS values for several discharge pressures and repeated
airborne acoustic signals ........................................................................................................ 105
Figure 4.30: Repeated vibration signals at several discharge pressures ................................ 107
Figure 4.31: Interaction plots of the RMS values for several discharge pressures and repeated
vibration signals ..................................................................................................................... 108
Figure 5.1: Complete Reciprocating Compressor Model ...................................................... 112
Figure 5.2: Piston Mechanism of a Reciprocating Compressor with Acting Forces ............. 115
Figure 5.3: Simplified Model of the V-shaped double-stage Reciprocating Compressor (Elhaj
M. A., 2005) ........................................................................................................................... 116

CHARACTERISING VIBRO-ACOUSTIC SIGNALS OF A RECIPROCATING
COMPRESSOR FOR CONDITION MONITORING
19 DEGREE OF DOCTOR OF PHILOSOPHY (PHD)
Figure 5.4: Torque applied to a Shaft .................................................................................... 119
Figure 5.5: Single Degree of Motion of a Reciprocating Compressor Valve (Elhaj M. A., 2005)
................................................................................................................................................ 123
Figure 5.6: Discharge plenum and piping system .................................................................. 127
Figure 6.1: Predicted healthy pressure signals at different tank pressures: a) first stage b) second
stage ....................................................................................................................................... 132
Figure 6.2: Experimental healthy pressure signals at different tank pressures: a) first stage b)
second stage ........................................................................................................................... 133
Figure 6.3: Predicted and measured in-cylinder pressure signals at 0.827 MPa (120psi) first
stage and second stage ........................................................................................................... 133
Figure 6.4: Predicted suction and discharge valve motions for first stage cylinder at 0.827 MPa
(120 psi) ................................................................................................................................. 134
Figure 6.5: Predicted suction and discharge valve motions for second stage cylinder at 0.827
MPa (120 psi) ......................................................................................................................... 134
Figure 6.6: Measured vibration signals at 0.827 MPa (120psi) for a) first stage cylinder and b)
second stage cylinder ............................................................................................................. 135
Figure 6.7: Predicted plot of in-cylinder, cavity one, and cavity two pressure at discharge period
................................................................................................................................................ 136
Figure 6.8: A) Cavity one B) Cavity two pressure predictions at different tank pressures ... 136
Figure 6.9: Predicted and experimental second stage discharge valve fault waveforms for first
and second stage in-cylinder pressure at 0.823 MPa ............................................................. 137
Figure 6.10: Predicted and experimental first stage in-cylinder pressure waveforms for healthy
and DVL-fault conditions ...................................................................................................... 138
Figure 6.11: Predicted and experimental second stage in-cylinder pressure waveforms for
healthy and DVL-fault conditions ......................................................................................... 138
Figure 6.12: First stage valve displacement comparison of healthy and valve leakage fault
predictions .............................................................................................................................. 139
Figure 6.13: Measured first stage vibration signals for healthy and discharge valve fault
conditions ............................................................................................................................... 140
Figure 6.14: Second stage valve displacement comparison of healthy and valve leakage fault
predictions .............................................................................................................................. 141
Figure 6.15: Measured second stage vibration signals for healthy and discharge valve fault
conditions ............................................................................................................................... 141

CHARACTERISING VIBRO-ACOUSTIC SIGNALS OF A RECIPROCATING
COMPRESSOR FOR CONDITION MONITORING
20 DEGREE OF DOCTOR OF PHILOSOPHY (PHD)
figure 6.16: Predicted and experimental intercooler leakage trends for first and second stage
in-cylinder pressure at 0.823 MPa ......................................................................................... 142
figure 6.17: Predicted and experimental first stage in-cylinder pressure waveforms for healthy
and ICL-fault conditions ........................................................................................................ 143
figure 6.18: Predicted and experimental second stage in-cylinder pressure waveforms for
healthy and ICL-fault conditions ........................................................................................... 143
figure 6.19: first stage valve displacement comparison of healthy and intercooler fault
predictions .............................................................................................................................. 144
figure 6.20: Measured first stage vibration signals for healthy and intercooler fault conditions
................................................................................................................................................ 144
figure 6.21: Second stage valve displacement comparison of healthy and intercooler fault
predictions .............................................................................................................................. 145
Figure 6.22: Measured second stage vibration signals for healthy and intercooler fault
conditions ............................................................................................................................... 146
Figure 7.1: Measured vibration signal at 0.82 MPa a) first cylinder, and b) second cylinder
................................................................................................................................................ 150
Figure 7.2: First stage vibration signatures over a wide pressure range under normal (healthy)
compressor condition ............................................................................................................. 152
Figure 7.3: Second stage vibration signatures over a wide pressure range under normal
(healthy) compressor condition .............................................................................................. 152
Figure 7.4: Healthy and faulty vibration signatures from first stage cylinder head at 0.82MPa
................................................................................................................................................ 153
Figure 7.5: Healthy and faulty vibration signatures from second stage cylinder head at 0.82MPa
................................................................................................................................................ 153
Figure 7.6: First and second stage vibration rms values for several tank pressures .............. 154
Figure 7.7: Healthy and faulty first stage vibration RMS values at several tank pressures .. 155
Figure 7.8: Healthy and faulty second stage vibration RMS values for several tank pressures
................................................................................................................................................ 155
Figure 7.9: Kurtosis values for first and second stage vibration signals at several tank pressures
................................................................................................................................................ 156
Figure 7.10: Healthy and faulty kurtosis results for first stage vibration signals at several tank
pressures ................................................................................................................................. 156
CHARACTERISING VIBRO-ACOUSTIC SIGNALS OF A RECIPROCATING
COMPRESSOR FOR CONDITION MONITORING
21 DEGREE OF DOCTOR OF PHILOSOPHY (PHD)
Figure 7.11: Healthy and faulty kurtosis results for second stage vibration signals at several
tank pressures ......................................................................................................................... 157
Figure 7.12: One sided vibration spectra for healthy a) first stage and b) second stage vibration
measurements at 0.82MPa ..................................................................................................... 158
Figure 7.13 : Healthy first stag vibration spectra for several tank pressures ......................... 159
Figure 7.14: Healthy second stage vibration spectra for several tank pressures ................... 159
Figure 7.15: Waterfall plots of first stage vibration spectrum for healthy and all fault cases
................................................................................................................................................ 160
Figure 7.16: Waterfall plots of second stage vibration spectrum for healthy and all fault cases
................................................................................................................................................ 161
Figure 8.1: a) Experimental test rig setup of the reciprocating compressor b) high-pressure
cylinder with sensor installations, c) schematic of acoustic sensor installation .................... 165
Figure 8.2: Healthy a) time domain of gas pulsation signal, b) gas pulsation and In-cylinder
waveforms, identifying the four compressor processes. ........................................................ 166
Figure 8.3: One cycle waveform of gas pulsation signals at several tank pressures ............. 167
figure 8.4: gas pulsation wave comparing normal and fault conditions at several discharge
pressures ................................................................................................................................. 168
Figure 8.5: PDF curve of normal (BL) gas pulsation signal for different DPs ...................... 171
Figure 8.6: PDF fault comparison curves for gas pulsation signals at several DPs............... 171
Figure 8.7: Comparison of healthy and fault PDF peaks for several discharge pressures..... 172
Figure 8.8: RMS of gas pulsation signal against fault cases at several discharge pressures . 172
Figure 8.9: Kurtosis of gas pulsation signal against several discharge pressures for all cases
................................................................................................................................................ 173
Figure 8.10: Sound pressure level of gas pulsation signals under normal condition (BL) for
several discharge pressures .................................................................................................... 174
Figure 8.11: Waterfall plot of healthy and fault frequency spectrum at several discharge
pressures ................................................................................................................................. 175
Figure 8.12: 1/3 octave band spectra of healthy and all fault cases at several discharge pressures
................................................................................................................................................ 175
Figure 8.13: Healthy and fault comparison of octave band power of five resonances at several
tank pressures ......................................................................................................................... 177
Figure 9.1: Three levels discrete wavelet decomposition tree ............................................... 181
Figure 9.2: Illustration of three level wavelet packet transform decomposition tree ............ 183

CHARACTERISING VIBRO-ACOUSTIC SIGNALS OF A RECIPROCATING
COMPRESSOR FOR CONDITION MONITORING
22 DEGREE OF DOCTOR OF PHILOSOPHY (PHD)
Figure 10.1: Gas pulsations waves from the discharge chamber of a healthy R.C at 0.827MPa
................................................................................................................................................ 194
Figure 10.2: Sources of reciprocating compressor gas pulsations ......................................... 195
Figure 10.3: a) Mode shape of half wave response b) Mode shape of quarter wave response
................................................................................................................................................ 196
Figure 10.4: Simplified model of the discharge chamber and storage tank pipe configuration
with dimensions in [mm] ....................................................................................................... 197
Figure 10.5: Speed of sound in gas for several discharge pressures of the RC ..................... 197
figure 10.6: Flow chart for fault diagnosis using gas pulsation signal .................................. 205
Figure 10.7 a) Time domain and b) frequency domain analysis of gas pulsation signal at
0.827mpa ................................................................................................................................ 206
Figure 10.8: Acoustic resonances for several tank pressures under normal conditions ........ 207
Figure 10.9: Spectrogram of healthy and faulty gas pulsation signals at 0.827MPa ............. 208
Figure 10.10: Reconstructed terminal node waveforms and corresponding spectrum for gas
pulsation signal at 0.827mpa.................................................................................................. 210
Figure 10.11: RMS of all terminal nodes for all conditions and tank pressures .................... 211
Figure 10.12: Envelope and B) Envelope Spectrum of terminal node 4 for all conditions at
0.827MPa ............................................................................................................................... 211
Figure 10.13: envelope and b) envelope spectrum of terminal node 6 for all conditions at
0.827MPa ............................................................................................................................... 212
Figure 10.14: Fault classification using entropy against kurtosis plot of terminal node 4
enveloped signal..................................................................................................................... 213
Figure 10.15: Fault classification using entropy against kurtosis plot of terminal node 6
enveloped signal..................................................................................................................... 214
Figure 11.1: Characteristics of vibro-acoustic signals from a reciprocating compressor ...... 221

CHARACTERISING VIBRO-ACOUSTIC SIGNALS OF A RECIPROCATING
COMPRESSOR FOR CONDITION MONITORING
23 DEGREE OF DOCTOR OF PHILOSOPHY (PHD)
LIST OF TABLES
Table 2.1: Compressor Applications........................................................................................ 48
Table 2.2: Compressor Valves (Brown, 2005; O'Neill, 1993) ................................................. 50
Table 4.1: Accelerometer specifications .................................................................................. 75
Table 4.2: In-cylinder Pressure Sensor Technical Specifications ............................................ 76
Table 4.3: Analysis of variance for repeatability of pressure signals ...................................... 86
Table 4.4: Analysis of variance for several discharge pressures ............................................. 87
Table 4.5: Correlation coefficient and probability level of baseline test pressure signals ...... 88
Table 4.6: Analysis of variance for repeatability of airborne acoustic signals ........................ 90
Table 4.7: Analysis of variance for several discharge pressures ............................................. 90
Table 4.8: Correlation coefficient and probability level of baseline test airborne acoustic wave
signals ...................................................................................................................................... 91
Table 4.9: Analysis of variance for repeatability of vibration signals ..................................... 92
Table 4.10: Analysis of variance for several discharge pressure ............................................. 92
Table 4.11: Correlation coefficient and probability level of baseline test vibration signals ... 93
Table 4.12: Analysis of variance for repeatability of in-cylinder pressure signal under discharge
valve fault condition ................................................................................................................ 95
Table 4.13: Analysis of variance for several discharge pressures under discharge valve fault
condition .................................................................................................................................. 95
Table 4.14: Correlation coefficient and probability level of baseline test pressure signals .... 96
Table 4.15: Analysis of variance for repeatability of airborne acoustic signals under discharge
valve fault condition ................................................................................................................ 97
Table 4.16: Analysis of variance for several discharge pressures under discharge valve fault
condition .................................................................................................................................. 98
Table 4.17: Correlation coefficient and probability level of discharge valve leakage test
airborne acoustic signals .......................................................................................................... 98
Table 4.18: Analysis of variance for repeatability of vibration signals under discharge valve
fault condition ........................................................................................................................ 100
Table 4.19: Analysis of variance for several discharge pressures under discharge valve fault
condition ................................................................................................................................ 100
Table 4.20: Correlation coefficient and probability level of discharge valve leakage test
vibration signals ..................................................................................................................... 101

CHARACTERISING VIBRO-ACOUSTIC SIGNALS OF A RECIPROCATING
COMPRESSOR FOR CONDITION MONITORING
24 DEGREE OF DOCTOR OF PHILOSOPHY (PHD)
Table 4.21: Analysis of variance for repeatability of in-cylinder pressure signals under
intercooler fault condition ...................................................................................................... 102
Table 4.22: Analysis of variance for several discharge presures under intercooler fault
condition ................................................................................................................................ 102
Table 4.23: Correlation coefficient and probability level of intercooler leakage test of pressure
signals .................................................................................................................................... 103
Table 4.24: Analysis of variance for repeatability of airborne acoustic signals under intercooler
fault condition ........................................................................................................................ 104
Table 4.25: Analysis of variance for several discharge pressures under intercooler fault
condition ................................................................................................................................ 105
Table 4.26: Correlation coefficient and probability level of intercooler leakage test of airborne
acoustic wave signals ............................................................................................................. 106
Table 4.27: analysis of variance for repeatability of vibration signals under intercooler fault
condition ................................................................................................................................ 107
Table 4.28: Analysis of variance for several discharge pressures under intercooler fault
conditions ............................................................................................................................... 107
Table 4.29: Correlation coefficient and probability level of intercooler leakage test of vibration
signals .................................................................................................................................... 108
Table 6.1: Physical parameters of the two-stage reciprocating compressor (Broom Wade, 1964;
Comp Air UK Ltd, 2002) ....................................................................................................... 130
Table 10.1: Acoustic natural frequency and harmonics of the discharge pipe ...................... 198
Table 10.2: Helmholtz resonant frequencies of the RC at several tank pressures ................. 199
Table 10.3: Real-valued quantitative measures for optimal base wavelet selection .............. 203
Table 10.4: frequency range for each terminal node under 4092 Hz sampling frequency in gray
code sequence ........................................................................................................................ 205
Table 10.5: Summarised differences between healthy and all faulty spectrograms .............. 208
Table 12.1: Failure Modes of Positive Displacement Rotary Compressors .......................... 223
Table 12.2: Failure Modes of Reciprocating Positive Displacement Compressors ............... 224
CHARACTERISING VIBRO-ACOUSTIC SIGNALS OF A RECIPROCATING
COMPRESSOR FOR CONDITION MONITORING
25 DEGREE OF DOCTOR OF PHILOSOPHY (PHD)
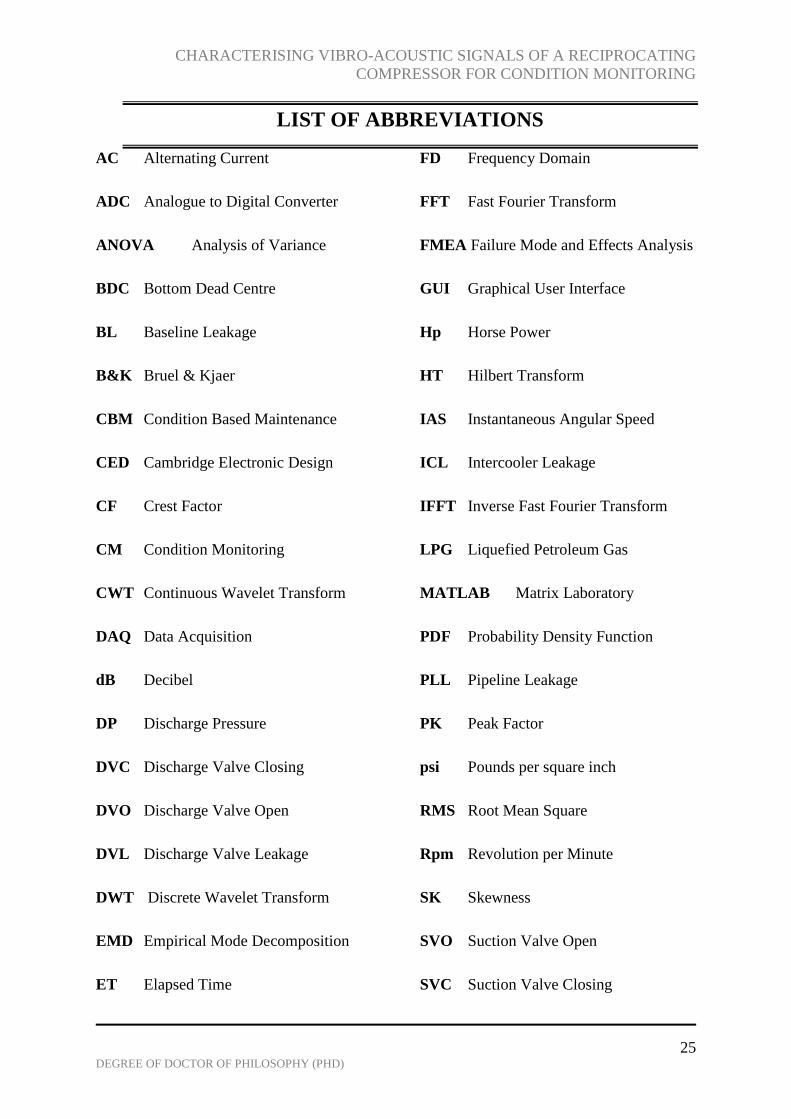
LIST OF ABBREVIATIONS
AC Alternating Current
ADC Analogue to Digital Converter
ANOVA Analysis of Variance
BDC Bottom Dead Centre
BL Baseline Leakage
B&K Bruel & Kjaer
CBM Condition Based Maintenance
CED Cambridge Electronic Design
CF Crest Factor
CM Condition Monitoring
CWT Continuous Wavelet Transform
DAQ Data Acquisition
dB Decibel
DP Discharge Pressure
DVC Discharge Valve Closing
DVO Discharge Valve Open
DVL Discharge Valve Leakage
DWT Discrete Wavelet Transform
EMD Empirical Mode Decomposition
ET Elapsed Time
FD Frequency Domain
FFT Fast Fourier Transform
FMEA Failure Mode and Effects Analysis
GUI Graphical User Interface
Hp Horse Power
HT Hilbert Transform
IAS Instantaneous Angular Speed
ICL Intercooler Leakage
IFFT Inverse Fast Fourier Transform
LPG Liquefied Petroleum Gas
MATLAB Matrix Laboratory
PDF Probability Density Function
PLL Pipeline Leakage
PK Peak Factor
psi Pounds per square inch
RMS Root Mean Square
Rpm Revolution per Minute
SK Skewness
SVO Suction Valve Open
SVC Suction Valve Closing

CHARACTERISING VIBRO-ACOUSTIC SIGNALS OF A RECIPROCATING
COMPRESSOR FOR CONDITION MONITORING
26 DEGREE OF DOCTOR OF PHILOSOPHY (PHD)
SNR Signal to Noise Ratio
TDC Top Dead Centre
UK United Kingdom
US United States
USD United States Dollar
USSR Union of Soviet Socialist Republic
WPT Wavelet Packet Transform
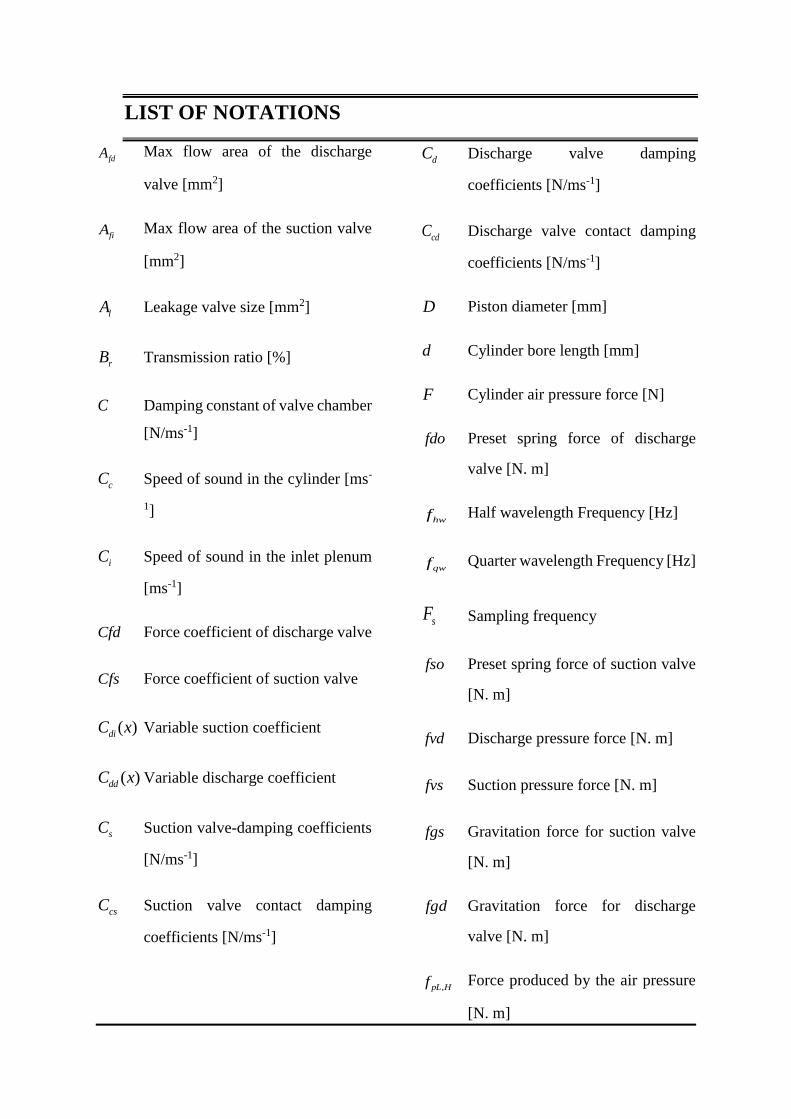
LIST OF NOTATIONS
fdA Max flow area of the discharge
valve [mm2]
fiA Max flow area of the suction valve
[mm2]
lA Leakage valve size [mm2]
rB Transmission ratio [%]
C Damping constant of valve chamber
[N/ms-1]
cC Speed of sound in the cylinder [ms-
1]
iC Speed of sound in the inlet plenum
[ms-1]
Cfd Force coefficient of discharge valve
Cfs Force coefficient of suction valve
( )diC x Variable suction coefficient
( )ddC x Variable discharge coefficient
sC Suction valve-damping coefficients
[N/ms-1]
csC Suction valve contact damping
coefficients [N/ms-1]
dC Discharge valve damping
coefficients [N/ms-1]
cdC Discharge valve contact damping
coefficients [N/ms-1]
D Piston diameter [mm]
d Cylinder bore length [mm]
F Cylinder air pressure force [N]
fdo Preset spring force of discharge
valve [N. m]
hwf Half wavelength Frequency [Hz]
qwf Quarter wavelength Frequency [Hz]
sF Sampling frequency
fso Preset spring force of suction valve
[N. m]
fvd Discharge pressure force [N. m]
fvs Suction pressure force [N. m]
fgs Gravitation force for suction valve
[N. m]
fgd Gravitation force for discharge
valve [N. m]
,pL Hf Force produced by the air pressure
[N. m]

CHARACTERISING VIBRO-ACOUSTIC SIGNALS OF A RECIPROCATING
COMPRESSOR FOR CONDITION MONITORING
28 DEGREE OF DOCTOR OF PHILOSOPHY (PHD)
,mL Hf Force produced by the inertial force
of reciprocating mass [N. m]
g Earth’s gravitational field strength
[9.8 N kg-1
]
k Valve spring stiffness [Nm-1
]
J Moment of inertia. [kg.m2
]
l Connecting rod length [mm].
recm Reciprocating inertial mass [g]
crm Connecting rod mass [g]
pm Piston mass [g]
platem Mass of valve plate [g]
springm Mass of valve spring [g]
vim
Mass flow rate through the inlet
valve [kgs-1
]
vdm
Mass flow rate through the
discharge valve [kgs-1
]
ldm
Mass flow rate through the leakage
discharge valve [kgs-1
]
lsm
Mass flow rate through the leakage
suction valve [kgs-1
]
m Mass of air inside cylinder [g]
vm Mass of the valve plate plus one-
third of the spring mass [g]
wp Motor power [W]
cp Cylinder air pressure [psi]
cp
Variable cylinder pressure [psi]
ip Suction pressure [psi]
dP Discharge pressure [psi]
r Crank radius [m]
Sc Cylinder cross - sectional area [m2
]
pS Piston area [m2
]
Sv Valve slot area for a single channel
[m2
]
Spc Compressor speed [Hz]
iT Atmosphere temperature [Co
]
cT Cylinder absolute air temperature
[K]
( )T t Temperature of air inside the
cylinder [Co
]
mT Driving torque [N. m]

CHARACTERISING VIBRO-ACOUSTIC SIGNALS OF A RECIPROCATING
COMPRESSOR FOR CONDITION MONITORING
29 DEGREE OF DOCTOR OF PHILOSOPHY (PHD)
,L HpmT Torque produced by cylinder air
pressure and piston mass [N.m]
,fL HT Friction torque [N.m]
v
Variable cylinders volume [m3
]
cov Cylinders clearance volume [m3
]
cv Cylinder volume [m3
]
IAS of the crankshaft [rad/sec]
v Valve unit frequency
n Natural frequency of the valve unit
[Hz]
s The motor speed in [rad/sec]
maxx Max. valve plate displacement
[mm]
maxxs Suction valve max. lift [mm]
maxxd Discharge valve max. lift [mm]
vx Valve plate displacement [mm]
vx
Valve speed [ms-1
]
vx
Valve acceleration [m.sec-2
]
px Piston displacement [mm]
px
Vertical piston speed [ms-1
]
px
Vertical piston acceleration [m.sec-
2
]
Crank angle [deg]
Damping ratio of the valve unit.
Ratio of specific heats (1.4 for air)
c Density of the air in the cylinder
[kg/m3
]
i Density of the air in the plenum
[kg/m3
]
Wavelength

CHARACTERISING VIBRO-ACOUSTIC SIGNALS OF A RECIPROCATING
COMPRESSOR FOR CONDITION MONITORING
30 DEGREE OF DOCTOR OF PHILOSOPHY (PHD)
CHAPTER ONE
1 INTRODUCTION
This chapter presents a general introduction to condition monitoring of machines by outlining
the relevance of monitoring machines, monitoring strategies available in industry. Finally, the
aims and objectives of this research are given, and the chapter ends by describing the layout
of the thesis.

CHARACTERISING VIBRO-ACOUSTIC SIGNALS OF A RECIPROCATING
COMPRESSOR FOR CONDITION MONITORING
31 DEGREE OF DOCTOR OF PHILOSOPHY (PHD)
1.1 Background and Research Motivation
Reciprocating piston compressors are one of the most common equipment that makes up
process plants in several industries including oil and gas refineries, petrochemical industries,
chemical plant industries, and many more (Grib & Zhukov, 2001). Compressed air or gases are
used throughout production operations, and up to 90 percent of compressed air is lost either in
the form of reusable heat, friction, misuse or noise (US Department of Energy, 2003). Also,
research has shown that reciprocating compressors are not reliable enough because of the
constant collision of mechanical parts, which increase noise levels, cause vibrations, and
intensifying degradation of significant machine components (Grib & Zhukov, 2001), (Zheng,
2005). Therefore, it is vital that compressors are carefully monitored and maintained to improve
its efficiency in industrial plants.
Monitoring is not restricted to only compressors; it has become exceedingly relevant to know
the condition of all major machines, because machine components have reduced service life
when subjected to process effects, defected, and are overused. Figure 1.1 highlights the
percentage of maintenance costs for several compressor components according to results from
a worldwide questionnaire by (Leonard, 1996).
36%
18%9%
7%
7%
7%
5%
1%7%
3% Valves
Pressure Packing
Process Problems
Piston Rings
Piston Rider bands
Piston Rods
Cylinder Lube Systems
Piping
Unloaders
Other
FIGURE 1.1: PRIMARY CAUSES OF UNSCHEDULED RECIPROCATING COMPRESSOR
SHUTDOWN
Findings from the worldwide questionnaire, which involved ten countries including: United
States, France, Germany, Canada, United Kingdom, China, Singapore, Belgium, Norway,
Kuwait and the United Arab Emirates, revealed back in the 90s that compressor valves cost the

CHARACTERISING VIBRO-ACOUSTIC SIGNALS OF A RECIPROCATING
COMPRESSOR FOR CONDITION MONITORING
32 DEGREE OF DOCTOR OF PHILOSOPHY (PHD)
most in maintenance because they are actually the heart of the machine and are always
subjected to high-pressured air.
A more recent survey carried out by Prognost in 2009 also showed that valve failures are one
of the leading causes of unscheduled compressor shutdown (Daniel, 2014). The study was
based on records of 524 compressor damages from 72 different plants (see Figure 1.2 below).
FIGURE 1.2: PROGNOST COMPRESSOR SYSTEM FAILURE MODE SURVEY 2009
Managers, engineers, maintenance personnel and even manufacturers are increasingly
becoming interested in both the historical and present state of machinery in their industries
because the condition of a machine has significant cost effect on the business with regards to
maintenance and fault development. According to the investigation by Leonard, one of the
factors, which increase reciprocating compressors’ reliability, in hydrogen, services, for
instance, is an unscheduled shutdown of reciprocating compressors. It was revealed that an
unplanned shutdown of reciprocating compressors results in up to USD 100,000 per day in lost
production revenue (Leonard, 1996). Therefore, there is a need to increase the reliability of
reciprocating compressors to ensure continuous operation without unscheduled shutdown.
1.2 Relevance of Monitoring Machinery
Maintenance is a word closely associated with monitoring, and the reason is that machines can
either fail early (shortly after installation) or later (within or after its lifespan expectancy).
0
5
10
15
20
25
PE
RC
EN
TA
GE
COMPRESSOR COMPONENTS

CHARACTERISING VIBRO-ACOUSTIC SIGNALS OF A RECIPROCATING
COMPRESSOR FOR CONDITION MONITORING
33 DEGREE OF DOCTOR OF PHILOSOPHY (PHD)
Therefore, industrial professionals and maintenance specialists have realised from experience
and years of research, that active monitoring of machines allow for the prediction of the
inevitable maintenance requirement of a machine, which goes a long way in enabling its
reliability (Williams, Davies, & Drake, 1994). The performance of any machine would
deteriorate over time because of the effects on operating conditions (load, harsh environment,
human errors, etc.), and the cost of maintenance is a major setback for managers in industry.
However, studies have shown that the cost of machine failure or breakdown dramatically
outweighs the cost of machine maintenance (Pascual, Meruane, & Rey, 2008); (Komonen,
2002); (Komonen, 1998).
To reduce the cost of unscheduled maintenance resulting from failed key machine components,
an effective maintenance strategy is required, which ensures a satisfactory level of machine
reliability is achieved throughout its service life. The primary focus of this study is to use
vibration and gas pulsation measurements for condition monitoring of reciprocating
compressors; however, a brief discussion on maintenance strategies is presented to introduce
condition based monitoring/maintenance (CBM).
Corrective maintenance, emergency maintenance, preventive maintenance scheduled
maintenance, and condition-based maintenance are some of the widely implemented
maintenance practices used in industries (Williams, Davies, & Drake, 1994). These
maintenance strategies are classified into two main categories: planned maintenance and
unplanned maintenance. Figure 1.3 gives a detailed outline of the two main classes of
maintenance strategies.
FIGURE 1.3: CLASSIFICATION OF MAINTENANCE STRATEGIES (WILLIAMS, DAVIES, &
DRAKE, 1994)

CHARACTERISING VIBRO-ACOUSTIC SIGNALS OF A RECIPROCATING
COMPRESSOR FOR CONDITION MONITORING
34 DEGREE OF DOCTOR OF PHILOSOPHY (PHD)
These are all good maintenance practices; however, one or two of these strategies have proven
to be more effective and have greater economic advantage over the others. Preferences can be
made depending on the size of the equipment being maintained. Unplanned maintenance
strategy, which is applied when a failure has already occurred, would be most suitable if the
equipment in question is significantly small and the cost of replacement is frugal, with the
exception of this, it would be economically unwise to adopt this strategy for large and
expensive equipment. Preventive and conditioned based maintenance under planned
maintenance strategies are most commonly adopted in industries that use large and very
expensive hi-tech equipment. This is because the cost of replacing the entire unit in the event
of a problem or even the cost of shutting down the system to detect and diagnose a problem
that has no monitoring history would have a great effect on the productivity of the business as
a whole (Bentley, 1993). Already business owners and machine manufacturers have taken to
condition based monitoring as a viable technique for early detection and diagnosis of machine
faults. Early detection of faults and potential problems have proven to result in the following:
Improved plant performance
Machine reliability
Prevents unpredicted shutdown
Improves Operating efficiency of the machine, and
Reduced maintenance cost
(Bentley, 1993)
Condition-based maintenance (CBM) also known as on-condition maintenance involves
regular or continuous monitoring of the machine to detect particular components within the
system that develop faults for appropriate actions to be taken immediately (depending on the
degree of effect the problem could cause) to prevent failure or total process shutdown.
Condition-based monitoring ensures maintenance action is taken only when the normal
operating state of monitored machines change due to a developing fault. Some of the widely
adopted condition based monitoring techniques for machine monitoring are:
Wear debris analysis
Visual inspection
Lubrication analysis
Vibration based monitoring

CHARACTERISING VIBRO-ACOUSTIC SIGNALS OF A RECIPROCATING
COMPRESSOR FOR CONDITION MONITORING
35 DEGREE OF DOCTOR OF PHILOSOPHY (PHD)
Airborne acoustic monitoring
Gas Pulsation monitoring
Current monitoring
(Rao, 1998; Williams, Davies, & Drake, 1994)
This study focuses particularly on the employment of vibration and gas pulsation monitoring
to determine the condition of a reciprocating compressor. Detailed discussion on key condition
monitoring techniques are presented in Chapter three of this thesis.
1.3 Problem Statements
Although several monitoring techniques are available, there are still gaps in the efficiency and
effectiveness of some of these available techniques to accurately detect faults, and lead to the
prevention of an unplanned shutdown of the reciprocating compressors. These gaps are extant
because of the harsh and inevitable operating conditions these machines are subjected to in
industrial settings. Therefore, there is a call for researchers to investigate and source new and
improved ways of monitoring to improve the efficiency of these industrial machines exposed
to ineluctable harsh working conditions.
1.4 Research Aim
To determine the characteristics of faults detected using vibro-acoustic signals from a two-
stage single acting reciprocating compressor. This would lead to the discovery of the
characteristics and effectiveness of gas pulsation signals and vibration signals for condition
monitoring purposes.
1.5 Research Objectives
One: To set up a comprehensive reciprocating compressor test rig, and to develop experimental
procedures for condition monitoring of the two-stage reciprocating compressor. This will allow
condition monitoring using gas pulsation and vibration sensors, and will allow specific
compressor faults to be seeded into the compressor: valve leakage, intercooler leakage, and
pipeline discharge leakage.
Two: To review various condition based monitoring techniques presently adopted in industry,
and to assess the performance of crucial monitoring techniques suitable for early fault
detection.
CHARACTERISING VIBRO-ACOUSTIC SIGNALS OF A RECIPROCATING
COMPRESSOR FOR CONDITION MONITORING
36 DEGREE OF DOCTOR OF PHILOSOPHY (PHD)
Three: To develop a mathematical model of the two-stage reciprocating compressor, which
includes the gas pulsation behaviour to aid in understanding the physical properties of the
reciprocating compressor.
Four: To validate the mathematical model developed by correlating measured and simulated
results.
Five: To determine the characteristics of gas pulsation and vibration measurements from the
reciprocating compressor using traditional signal processing methods.
Six: To analyse and examine the nonstationary vibration and gas pulsation signatures by the
application of advanced signal processing techniques, such as Hilbert transform based
convolution and wavelet packet transform.
Seven: To provide guidelines for future research in this field based on the investigations
conducted.
1.6 Thesis Outline
Chapter 1: The motivation and background of this research work are presented in this chapter.
Also, a brief discussion on maintenance strategies, which leads to the introduction of machinery
condition monitoring, is given, and finally the aims, objectives and thesis outline are presented.
Chapter 2: This chapter reviews several compressor types and their typical applications. Then
the failure mode and effects analysis (FMEA) of the compressor types discussed is presented
following some detailed discussion on crucial reciprocating compressor components.
Chapter 3: This chapter surveys the literature on signal processing techniques used for
condition monitoring of machines such as reciprocating compressors. Relevant methods are
discussed briefly to help understand the results presented in Chapters 7 to 10.
Chapter 4: This chapter describes the test rig and supporting facilities, which includes all
transducers used for the experiment, the hardware (data acquisition system) and software
(MATLAB) used for data processing. Finally, common reciprocating compressor faults seeded
on the machine are described.
Chapter 5: The mathematical model of the reciprocating compressor developed and modified
is presented in this chapter. The model gives the In-cylinder pressure, valve dynamics and
CHARACTERISING VIBRO-ACOUSTIC SIGNALS OF A RECIPROCATING
COMPRESSOR FOR CONDITION MONITORING
37 DEGREE OF DOCTOR OF PHILOSOPHY (PHD)
discharge chamber waves of the reciprocating compressor. The experimental signatures are
used to validate the model predictions.
Chapter 6: This chapter verifies the accuracy of the developed model by comparing in-cylinder
pressure, valve displacement and gas pulsations (at the discharge chamber) predictions with
trends from the experimental study under normal conditions. More so, the prediction trends for
the fault simulations are also compared with experimental fault measurements.
Chapter 7: To investigate the characteristics of vibration signals from the reciprocating
compressor cylinder heads, traditional signal processing techniques such as time domain and
frequency domain methods are explored in this chapter.
Chapter 8: This chapter investigates the characteristics of second-stage gas pulsation signals
from the discharge chamber of the reciprocating compressor by applying traditional signal
processing techniques such as time domain and frequency domain methods. In addition, the
effectiveness of these techniques are investigated when three common reciprocating
compressor faults are present (valve leakage, intercooler leakage and discharge pipeline
leakage).
Chapter 9: This chapter presents the analysis of vibration signal using advanced signal
processing technique wavelet packet transform for detecting two common reciprocating
compressor faults (valve leakage and intercooler leakage) including the effects of the two faults
combined.
Chapter 10: This chapter presents the analysis of gas pulsation signal using advanced signal
processing technique wavelet packet transform for detecting common reciprocating
compressor faults (valve leakage, intercooler leakage, and discharge pipeline leakage)
including the effects of valve leakage and discharge leakage simultaneously.
Chapter 11: In this chapter, the research objectives and achievements are reviewed.
Furthermore, a summary of the novel features and contribution to knowledge regarding this
research are detailed, and finally, recommendations for future work are presented.
CHARACTERISING VIBRO-ACOUSTIC SIGNALS OF A RECIPROCATING
COMPRESSOR FOR CONDITION MONITORING
38 DEGREE OF DOCTOR OF PHILOSOPHY (PHD)
CHAPTER TWO
2 RECIPROCATING COMPRESSORS AND COMMON
FAILURE MODES
This chapter briefly reviews different types of compressors and their applications. Then the
operating principles of reciprocating compressors are presented for single-stage and double-
stage compressors. Failure mode and effects analysis (FMEA) of the positive displacement
type compressors are carried out, and finally, key components of the reciprocating piston
compressors are reviewed.
CHARACTERISING VIBRO-ACOUSTIC SIGNALS OF A RECIPROCATING
COMPRESSOR FOR CONDITION MONITORING
39 DEGREE OF DOCTOR OF PHILOSOPHY (PHD)
2.1 Introduction
Compressors are used to move gases or other fluids with pressures as low as 35psi (pound per
square inch) from one location to a different location at an increased pressure of about 65000
psi in extreme cases (Heinz & John, 1996). These machines are one of the oldest and most
popular devices widely used in refineries, chemical plants, and oil production facilities.
Compressor history dates as far back as the 1850s and was very popular for its design simplicity
and ability to provide very high pressures under variable loading.
The following sections give a brief overview of several compressor types (see Figure 2.1) to
provide an elementary understanding of all compressor concepts and their functions. The
ability to identify and understand several compressor types and their application can
significantly reduce the extra cost accrued from unplanned maintenance, or compressor failure
(Robison & Beaty, N.d).
2.2 Compressor Types
Compressors vary in sizes, operation mechanism and application range (power requirement,
stage requirement, pressure ratios etc.). Based on the compression mode, compressors can be
subdivided into two primary modes or types namely:
• Intermittent – Meaning that compression takes place in cycles or phases and
compression can only continue after a cycle is completed.
• Continuous – This means that compression of the gas is not interrupted at any time until
the whole process is completed.
These two modes of compression, intermittent and continuous are further grouped into positive
displacement and dynamic compressors. The positive displacement compressor types have the
needed volume of gas enclosed in a space and displaced at a higher pressure, mechanically
changing the volume of the enclosed gas. On the other hand, the dynamic compressors make
use of a rotating element to continuously move gas in and out of the device (Brown, 2005).
Figure 2.1 presents a brief listing of different types of compressors classified according to the
compression modes discussed.

CHARACTERISING VIBRO-ACOUSTIC SIGNALS OF A RECIPROCATING
COMPRESSOR FOR CONDITION MONITORING
40 DEGREE OF DOCTOR OF PHILOSOPHY (PHD)
FIGURE 2.1: COMPRESSOR CLASSIFICATION
2.2.1 Dynamic Compressors
Dynamic compressors are of the continuous flow class; they mainly transport suction fluid into
a diffuser through a high-velocity steam jet (Boyce, 2009). The two main types of dynamic
compressors are briefly described in the following subsections (2.2.1.1 and 2.2.1.2).
2.2.1.1 Centrifugal Compressors
A centrifugal compressor is a dynamic machine that typically functions using impellers
continuously accelerating gas through a diffuser and out of the compressor chamber. As seen
in Figure 2.2, the diffuser consists mainly of vanes, which are tangential to the impeller. These
type of compressors use three acting forces – centrifugal, aerodynamic, and change in velocity
to produce an increased discharge pressure higher than the initial suction gas pressure.
Centrifugal compressors are mainly used in petrochemical industries because of their smooth
operation process and high reliability compared to other compressor types (Boyce, 2009).
COMPRESSORS
INTERMITTENT CONTINUOUS
POSITIVE DISPLACEMENT EJECTORS DYNAMIC
Axial
Centrifugal
Mixed Flow Radial
ROTARYRECIPROCATING PISTON
Reciprocating Diaphragm Straight Lobe
Helical Lobe
Liquid Piston
Sliding Vane

CHARACTERISING VIBRO-ACOUSTIC SIGNALS OF A RECIPROCATING
COMPRESSOR FOR CONDITION MONITORING
41 DEGREE OF DOCTOR OF PHILOSOPHY (PHD)
FIGURE 2.2: A CENTRIFUGAL COMPRESSOR (BOYCE, 2009)
2.2.1.2 Axial Compressors
The axial compressor, like the centrifugal counterpart, is a dynamic machine mostly used in
large gas turbines. Compression is achieved by applying inertia forces through rotors to
increase the speed of the fluid. The fluid is diffused by another row of stationary blades called
stator, to increase fluid pressure (Boyce, 2009); (Giampaolo, 2010). Figure 2.3 shows a typical
schematic of the axial compressor. The axial compressors are usually of higher efficiency, but
when it comes to large operating region and cost, the centrifugal type is preferred.
FIGURE 2.3: AN AXIAL COMPRESSOR (GIAMPAOLO, 2010)
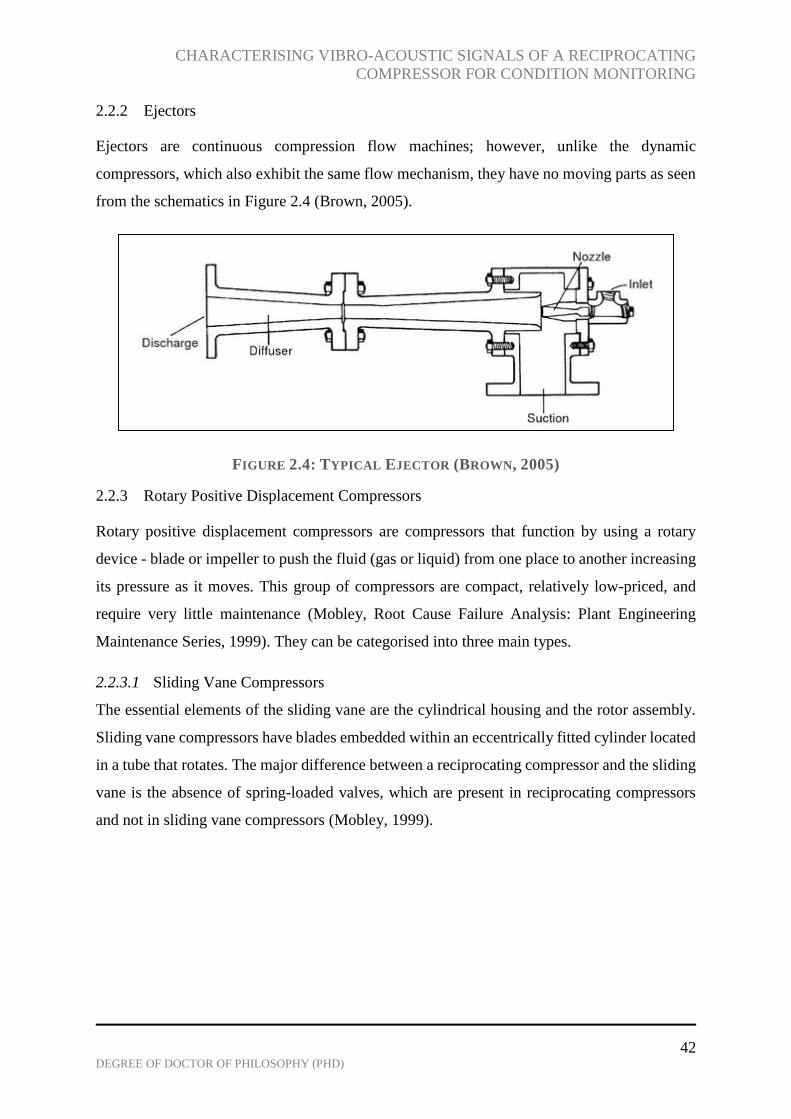
CHARACTERISING VIBRO-ACOUSTIC SIGNALS OF A RECIPROCATING
COMPRESSOR FOR CONDITION MONITORING
42 DEGREE OF DOCTOR OF PHILOSOPHY (PHD)
2.2.2 Ejectors
Ejectors are continuous compression flow machines; however, unlike the dynamic
compressors, which also exhibit the same flow mechanism, they have no moving parts as seen
from the schematics in Figure 2.4 (Brown, 2005).
FIGURE 2.4: TYPICAL EJECTOR (BROWN, 2005)
2.2.3 Rotary Positive Displacement Compressors
Rotary positive displacement compressors are compressors that function by using a rotary
device - blade or impeller to push the fluid (gas or liquid) from one place to another increasing
its pressure as it moves. This group of compressors are compact, relatively low-priced, and
require very little maintenance (Mobley, Root Cause Failure Analysis: Plant Engineering
Maintenance Series, 1999). They can be categorised into three main types.
2.2.3.1 Sliding Vane Compressors
The essential elements of the sliding vane are the cylindrical housing and the rotor assembly.
Sliding vane compressors have blades embedded within an eccentrically fitted cylinder located
in a tube that rotates. The major difference between a reciprocating compressor and the sliding
vane is the absence of spring-loaded valves, which are present in reciprocating compressors
and not in sliding vane compressors (Mobley, 1999).
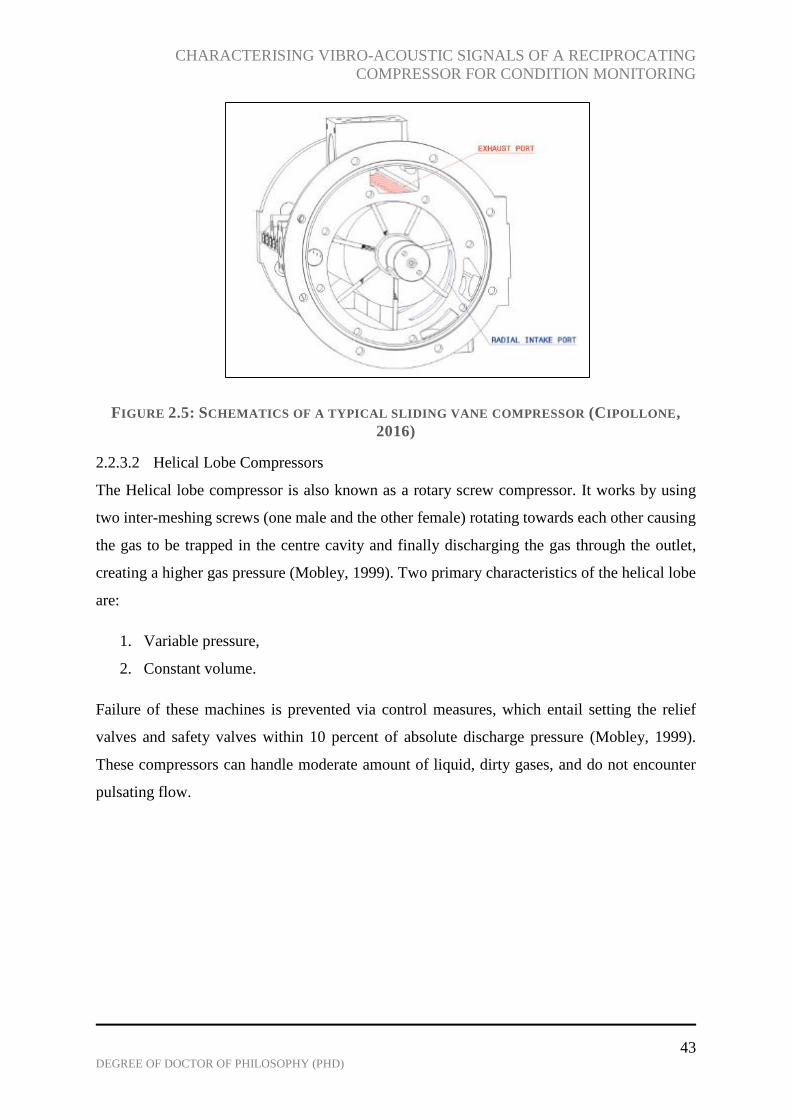
CHARACTERISING VIBRO-ACOUSTIC SIGNALS OF A RECIPROCATING
COMPRESSOR FOR CONDITION MONITORING
43 DEGREE OF DOCTOR OF PHILOSOPHY (PHD)
FIGURE 2.5: SCHEMATICS OF A TYPICAL SLIDING VANE COMPRESSOR (CIPOLLONE,
2016)
2.2.3.2 Helical Lobe Compressors
The Helical lobe compressor is also known as a rotary screw compressor. It works by using
two inter-meshing screws (one male and the other female) rotating towards each other causing
the gas to be trapped in the centre cavity and finally discharging the gas through the outlet,
creating a higher gas pressure (Mobley, 1999). Two primary characteristics of the helical lobe
are:
1. Variable pressure,
2. Constant volume.
Failure of these machines is prevented via control measures, which entail setting the relief
valves and safety valves within 10 percent of absolute discharge pressure (Mobley, 1999).
These compressors can handle moderate amount of liquid, dirty gases, and do not encounter
pulsating flow.

CHARACTERISING VIBRO-ACOUSTIC SIGNALS OF A RECIPROCATING
COMPRESSOR FOR CONDITION MONITORING
44 DEGREE OF DOCTOR OF PHILOSOPHY (PHD)
FIGURE 2.6: HELICAL LOBE COMPRESSOR (ORMER, 2002)
2.2.3.3 Liquid-Seal Ring Compressors
The liquid ring is also called liquid-piston and consist of a rotor with several forward-turned
blades, rotating about the middle cone, which has suction and discharge ports as seen in Figure
2.7. The liquid ring though similar to sliding vane type differs from the sliding vane compressor
as both liquid and gas are introduced to the chamber for compression; the liquid is separated
from the compressed gas with the aid of a conventional baffle or a centrifugal separator
(Mobley, 1999).
FIGURE 2.7: A TYPICAL LIQUID RING COMPRESSOR (AL-QATTAN, 2007)
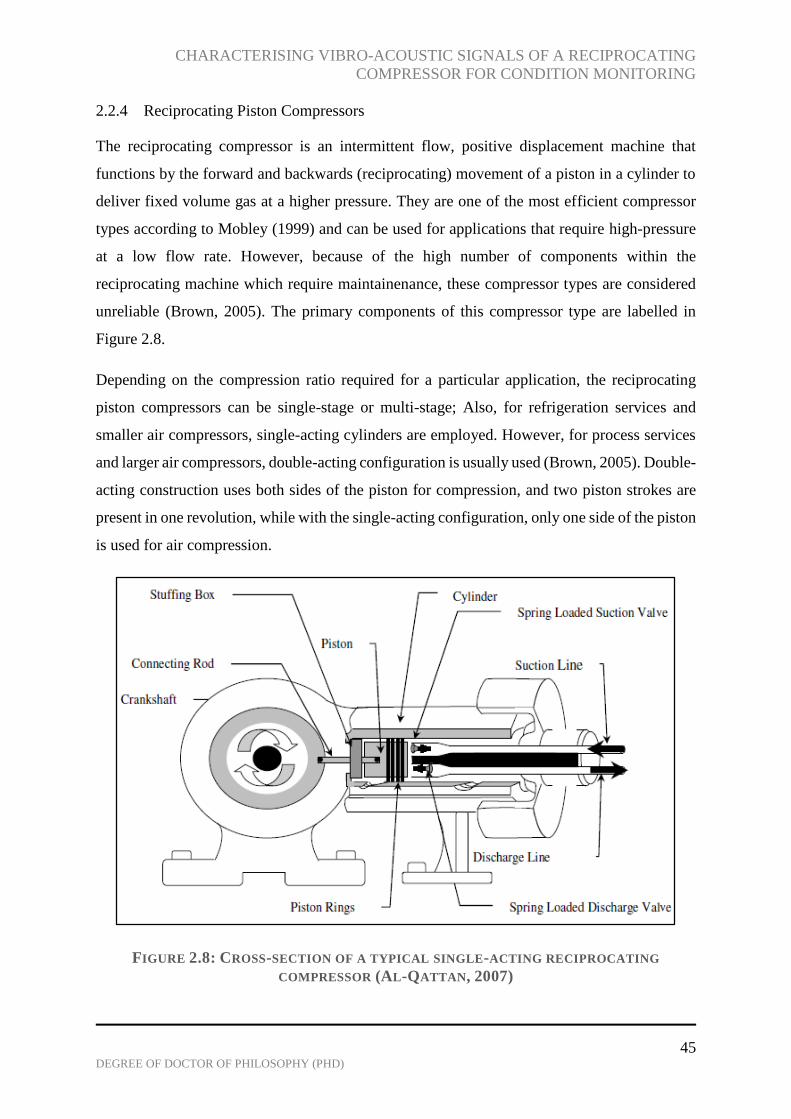
CHARACTERISING VIBRO-ACOUSTIC SIGNALS OF A RECIPROCATING
COMPRESSOR FOR CONDITION MONITORING
45 DEGREE OF DOCTOR OF PHILOSOPHY (PHD)
2.2.4 Reciprocating Piston Compressors
The reciprocating compressor is an intermittent flow, positive displacement machine that
functions by the forward and backwards (reciprocating) movement of a piston in a cylinder to
deliver fixed volume gas at a higher pressure. They are one of the most efficient compressor
types according to Mobley (1999) and can be used for applications that require high-pressure
at a low flow rate. However, because of the high number of components within the
reciprocating machine which require maintainenance, these compressor types are considered
unreliable (Brown, 2005). The primary components of this compressor type are labelled in
Figure 2.8.
Depending on the compression ratio required for a particular application, the reciprocating
piston compressors can be single-stage or multi-stage; Also, for refrigeration services and
smaller air compressors, single-acting cylinders are employed. However, for process services
and larger air compressors, double-acting configuration is usually used (Brown, 2005). Double-
acting construction uses both sides of the piston for compression, and two piston strokes are
present in one revolution, while with the single-acting configuration, only one side of the piston
is used for air compression.
FIGURE 2.8: CROSS-SECTION OF A TYPICAL SINGLE-ACTING RECIPROCATING
COMPRESSOR (AL-QATTAN, 2007)
CHARACTERISING VIBRO-ACOUSTIC SIGNALS OF A RECIPROCATING
COMPRESSOR FOR CONDITION MONITORING
46 DEGREE OF DOCTOR OF PHILOSOPHY (PHD)
2.2.4.1 Operating Principle of a Reciprocating Compressor
Figure 2.9a illustrates the piston movement and valve behaviour of a reciprocating compressor,
and Figure 2.9b shows an actual pressure-volume diagram for one compression cycle for a
single-acting reciprocating compressor. The typical operating principle of a single-acting,
single-stage reciprocating compressor often begins with both suction and discharge valves
closed, then the piston travelling in the opposite direction from the cylinder head causing a
pressure drop in the cylinder, which opens the suction valve allowing gas to enter into the
cylinder. This process is illustrated in Figure 2.9a POSITION A. Once the pressure in the
cylinder is equal to the suction-line pressure, the suction valve closes, and by this time or crank
angle, the piston is at bottom dead centre (BDC) as seen in POSITION B. The crankshaft
rotation causes the piston to move in the reverse direction travelling back towards the cylinder
head at top dead centre (TDC), compressing the suctioned gas and increasing the cylinder
pressure (POSITION C). The discharge valve opens as soon as the valve spring force is
overcome and the cylinder pressure is higher than the discharge-line pressure; this takes place
in POSITION D of Figure 2.9a. The discharge valve closes when the gas is equal to volumetric
clearance, which is when the piston reaches TDC. This process is repeated as the piston moves
back towards the BDC of the cylinder because of crankshaft movement (Arnold & Stewart,
1999); (Brown, 2005). These compression steps are illustrated in the p-v diagram (see Figure
2.9b), which helps to identify the condition of the reciprocating compressor at each process of
the compressor cycle.
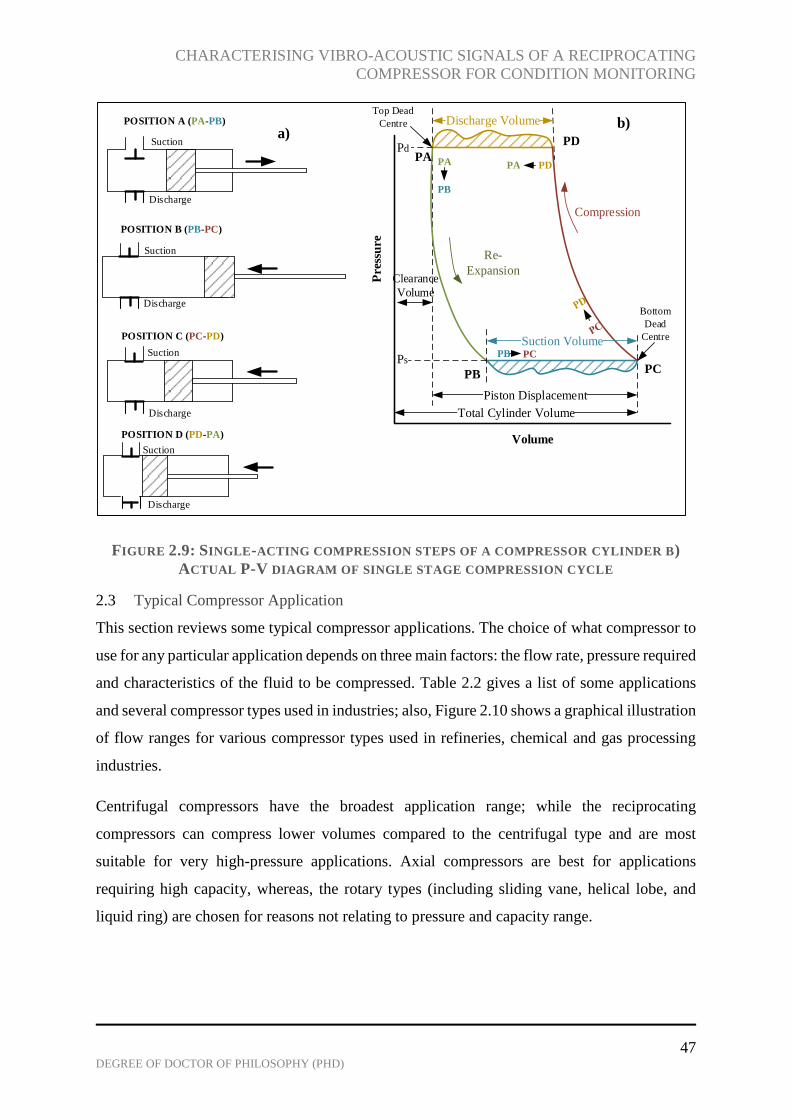
CHARACTERISING VIBRO-ACOUSTIC SIGNALS OF A RECIPROCATING
COMPRESSOR FOR CONDITION MONITORING
47 DEGREE OF DOCTOR OF PHILOSOPHY (PHD)
FIGURE 2.9: SINGLE-ACTING COMPRESSION STEPS OF A COMPRESSOR CYLINDER B)
ACTUAL P-V DIAGRAM OF SINGLE STAGE COMPRESSION CYCLE
2.3 Typical Compressor Application
This section reviews some typical compressor applications. The choice of what compressor to
use for any particular application depends on three main factors: the flow rate, pressure required
and characteristics of the fluid to be compressed. Table 2.2 gives a list of some applications
and several compressor types used in industries; also, Figure 2.10 shows a graphical illustration
of flow ranges for various compressor types used in refineries, chemical and gas processing
industries.
Centrifugal compressors have the broadest application range; while the reciprocating
compressors can compress lower volumes compared to the centrifugal type and are most
suitable for very high-pressure applications. Axial compressors are best for applications
requiring high capacity, whereas, the rotary types (including sliding vane, helical lobe, and
liquid ring) are chosen for reasons not relating to pressure and capacity range.
Compression
Suction Volume
Discharge Volume
Re-
Expansion
Piston Displacement
Top Dead
Centre
Bottom
Dead
Centre
Volume
Pre
ssu
re
Clearance
Volume
Total Cylinder Volume
Ps
Pd
PB
PA
PCPB
PA PDPA
PB PC
PD
b)
Suction
Discharge
POSITION B (PB-PC)
Suction
Discharge
POSITION C (PC-PD)
Suction
Discharge
POSITION D (PD-PA)
Suction
Discharge
POSITION A (PA-PB)
a)
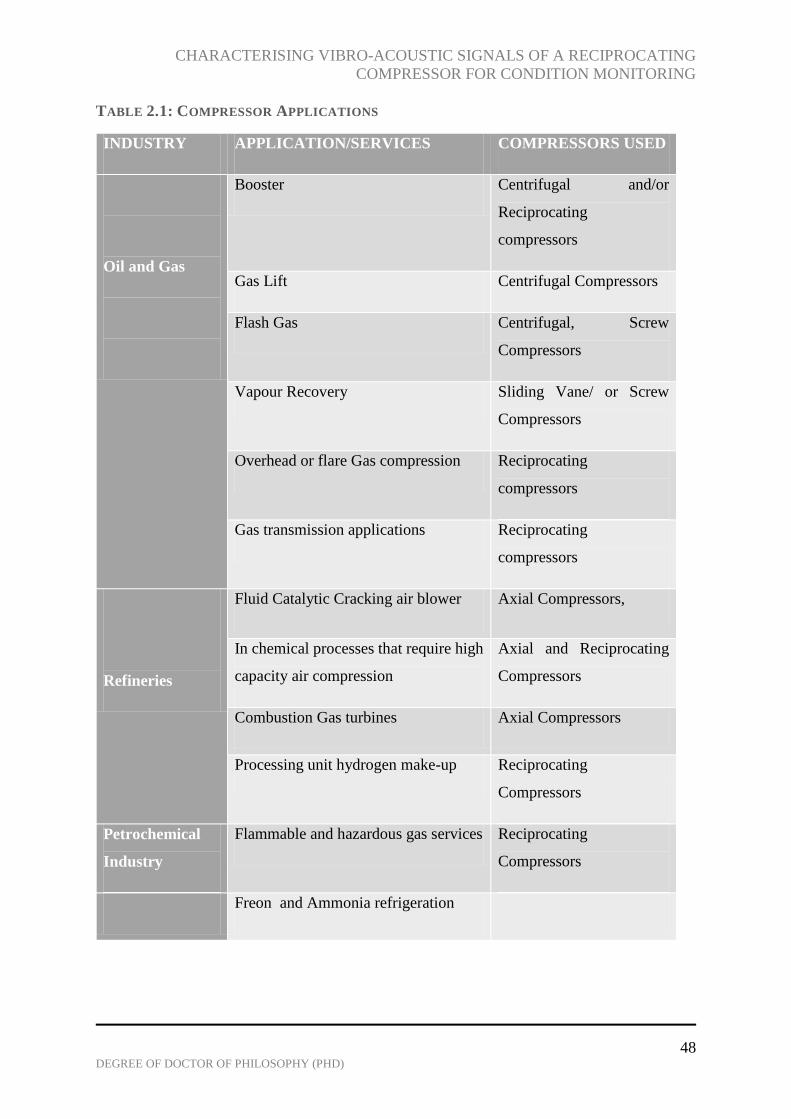
CHARACTERISING VIBRO-ACOUSTIC SIGNALS OF A RECIPROCATING
COMPRESSOR FOR CONDITION MONITORING
48 DEGREE OF DOCTOR OF PHILOSOPHY (PHD)
TABLE 2.1: COMPRESSOR APPLICATIONS
INDUSTRY APPLICATION/SERVICES COMPRESSORS USED
Oil and Gas
Booster Centrifugal and/or
Reciprocating
compressors
Gas Lift Centrifugal Compressors
Flash Gas Centrifugal, Screw
Compressors
Vapour Recovery Sliding Vane/ or Screw
Compressors
Overhead or flare Gas compression Reciprocating
compressors
Gas transmission applications Reciprocating
compressors
Refineries
Fluid Catalytic Cracking air blower Axial Compressors,
In chemical processes that require high
capacity air compression
Axial and Reciprocating
Compressors
Combustion Gas turbines Axial Compressors
Processing unit hydrogen make-up Reciprocating
Compressors
Petrochemical
Industry
Flammable and hazardous gas services Reciprocating
Compressors
Freon and Ammonia refrigeration
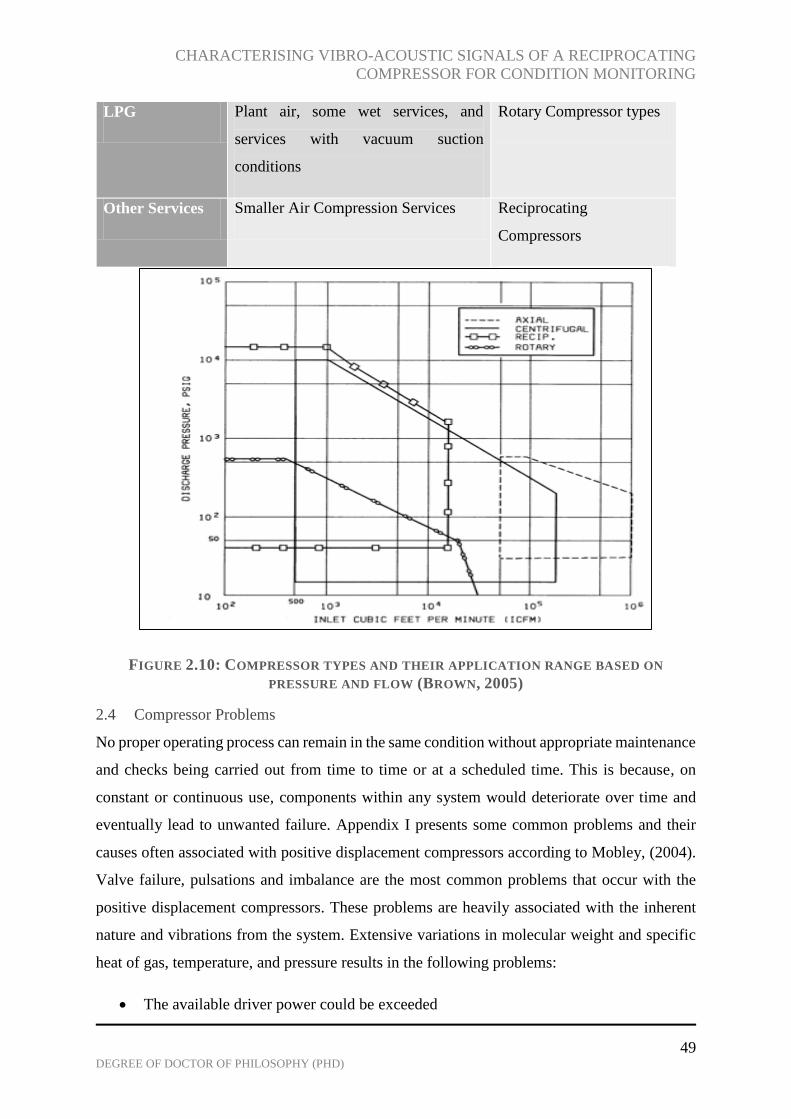
CHARACTERISING VIBRO-ACOUSTIC SIGNALS OF A RECIPROCATING
COMPRESSOR FOR CONDITION MONITORING
49 DEGREE OF DOCTOR OF PHILOSOPHY (PHD)
LPG Plant air, some wet services, and
services with vacuum suction
conditions
Rotary Compressor types
Other Services Smaller Air Compression Services Reciprocating
Compressors
FIGURE 2.10: COMPRESSOR TYPES AND THEIR APPLICATION RANGE BASED ON
PRESSURE AND FLOW (BROWN, 2005)
2.4 Compressor Problems
No proper operating process can remain in the same condition without appropriate maintenance
and checks being carried out from time to time or at a scheduled time. This is because, on
constant or continuous use, components within any system would deteriorate over time and
eventually lead to unwanted failure. Appendix I presents some common problems and their
causes often associated with positive displacement compressors according to Mobley, (2004).
Valve failure, pulsations and imbalance are the most common problems that occur with the
positive displacement compressors. These problems are heavily associated with the inherent
nature and vibrations from the system. Extensive variations in molecular weight and specific
heat of gas, temperature, and pressure results in the following problems:
The available driver power could be exceeded

CHARACTERISING VIBRO-ACOUSTIC SIGNALS OF A RECIPROCATING
COMPRESSOR FOR CONDITION MONITORING
50 DEGREE OF DOCTOR OF PHILOSOPHY (PHD)
Failure to meet the required throughput.
The required discharge pressure will not be achieved and the inability to achieve the
desired discharge pressure would cause the operation to shut down
(Giampaolo, 2010)
2.5 Reciprocating Compressor Components
2.5.1 Compressor Valves
The compressor valves also known as check valves, are used to control the inlet (suction) flow
and discharge flow of gas within the compressor cylinder. They are known to be the key
component in a reciprocating compressor because valve fault would directly affect the
efficiency (capacity and horsepower) and reliability of the compressor (Hanlon, 2001).
The opening and closing of check valves are due to the differential pressure of the substance
being compressed; however, in certain conditions, the springs could be used in addition to the
differential pressure of the gas to aid opening and closing. The valve displacement must be
large enough to allow the required amount of gas into the system for every revolution of the
crankshaft. Compressor efficiency would increase with smaller valve displacement because
less energy will be needed to open the valve. Furthermore, a lower valve displacement would
result in smaller impact velocities of the valve body on its seat, reducing fatigue, noise, and
failure of valves. Table 2.5 outlines common valve types used in compressors.
TABLE 2.2: COMPRESSOR VALVES (BROWN, 2005; O'NEILL, 1993)
VALVES DESCRIPTION ADVANTAGES
Poppet
valves
These valves are commonly used
for low compression ratio and low
speed compressors.
They are sturdy and have a high
resistance level.
They are tolerant to rust, dirt etc.
Poppet valves made of polymer is
used for systems with higher
compression ratios

CHARACTERISING VIBRO-ACOUSTIC SIGNALS OF A RECIPROCATING
COMPRESSOR FOR CONDITION MONITORING
51 DEGREE OF DOCTOR OF PHILOSOPHY (PHD)
Mini-
poppet
Valves
They are common poppet valves with a much smaller poppet and valve
seat hole, used mostly for high compression ratio compressors.
Reed
valves
Sufficient pressure from the gas in
the appropriate direction
overcomes the spring force of the
reed and causes it to bend allowing
gas flow.
They are used in high-performance
two-stroke engines.
These valve types are very flexible,
allowing both suction, and discharge
valves to be incorporated into one
valve plate.
Channel
valve
These valves have a series of
straight slots in the valve body for
gas to pass through. They are
generally applied to industrial air
machines
They are durable
Concentric
Ring
Valves
These valves are made up of one or
more relatively narrow rings
arranged concentrically about the
centreline of the valves
They are commonly used valves in
air and gas compressors.
It has a high tolerance for impacts.
Ported
Plate
valves
They are similar to concentric ring
valves, but the rings of the ported
plate valves are joined into a single
element
Easy to control flow because the
valve has a single element; impact
on the valve is reduced due to the
single element
Feather
Valve
These valves are mostly applied to
industrial air machines and are
made up of rectangular elements
Poppet valves, ring valves, and plate valves, rectangular element (feather, channel and reed
valves) are four common valve configurations used in reciprocating compressors (Arnold &

CHARACTERISING VIBRO-ACOUSTIC SIGNALS OF A RECIPROCATING
COMPRESSOR FOR CONDITION MONITORING
52 DEGREE OF DOCTOR OF PHILOSOPHY (PHD)
Stewart, 1999; Brown 2005). Some of the valves described above are seen in Figures 2.11 and
2.12.
FIGURE 2.11: CHANNEL VALVE (FORSTHOFFER, 2017, P. 119)
FIGURE 2.12: PLATE VALVE (FORSTHOFFER, 2017, P. 120)

CHARACTERISING VIBRO-ACOUSTIC SIGNALS OF A RECIPROCATING
COMPRESSOR FOR CONDITION MONITORING
53 DEGREE OF DOCTOR OF PHILOSOPHY (PHD)
FIGURE 2.13: ACTUAL PLATE VALVE USED FOR THIS RESEARCH
2.5.2 Elements of a Compressor Valve
Four essential components of a compressor valve are: valve seat, sealing element(s), lift
constraint (guard), and spring(s). To calculate the dynamics of a valve, the difference in
pressure across the force area of the valve plate Av; the springing of the valve and the
contribution made by the viscous forces during the initial stages of the valve opening are three
factors to be considered together with the resulting force in the equation (2.1) below:
¨
1 2 1 v v v v adhm x p p A k x l F (0.1)
Where:
𝑚𝑣 = Mass of Valve plates
𝑘 𝑎𝑛𝑑 𝑙1 = the stiffness of springing and initial deflection of the springs
𝑝1 𝑎𝑛𝑑 𝑝2 = pressure in front of the valve and pressure behind the valve respectively
𝐹𝑎𝑑ℎ = adhesion force and is determined by the equation
3
˙
1 vadh
v
xF f
x (0.2)
The type of compressor valve used in this study is the annular ring valve See Figure 2.13. This
valve consist of concentric rings held against ring springs. These annular ring valves are
CHARACTERISING VIBRO-ACOUSTIC SIGNALS OF A RECIPROCATING
COMPRESSOR FOR CONDITION MONITORING
54 DEGREE OF DOCTOR OF PHILOSOPHY (PHD)
suitable for corrosive environments, also, its design allows for easy fitting and removal of valve
components for maintenance purposes.
2.5.3 Compressor Cylinder
The compressor cylinder is a vessel used to keep the gas during compression (SPE
International, 2013; Arnold & Stewart, 1999). As mentioned above, the cylinder can be either
single or double acting type.
It is also worth mentioning that according to the reports from SPE International (2013), the
maximum allowable working pressure (MAWP) for any cylinder should be at least 10% higher
than the design discharge pressure or a minimum of 25 psi.
2.5.4 Compressor Cylinder Liner
These are usually included in the cylinder composition to make the cylinders last longer, and
these liners can be easily replaced if damaged as a result of heat or piston action.
However, one disadvantage of having these liners is that they increase the clearance between
the valve and piston thereby lowering the capacity and efficiency of the cylinder.
2.5.5 Compressor Crankshaft
The crankshaft revolves around the centre of the frame, causing the crosshead connected to the
rod to rotate. The piston rod and piston is driven by the linear reciprocating motion of the
crankshaft (Arnold & Stewart, 1999; SPE International, 2013). (Arnold & Stewart, 1999)
Material specification for compressor crankshafts:
o For large compressors (above 150 to 200 horsepower) – forges steel crankshafts
o For medium size compressors – cast crankshafts
2.5.6 Compressor Piston
The piston prevents the gas from spreading through to unwanted areas within the cylinder, and
is situated at the end of the piston rod. Aluminium and cast iron are two common lightweight
materials that the piston is made of and damages to the piston are prevented by using wear
bands and piston rings (SPE International, 2013; Arnold & Stewart, 1999).
CHARACTERISING VIBRO-ACOUSTIC SIGNALS OF A RECIPROCATING
COMPRESSOR FOR CONDITION MONITORING
55 DEGREE OF DOCTOR OF PHILOSOPHY (PHD)
2.5.7 Compressor Bearings
Bearings are located in several areas within the reciprocating compressor system. For instance,
the main bearing is located between the crankshaft and frame (Arnold & Stewart, 1999).
Bearings are mainly used to tightly secure the crankshaft, connecting rod, and crosshead within
the compressor frame to ensure proper positioning.

CHARACTERISING VIBRO-ACOUSTIC SIGNALS OF A RECIPROCATING
COMPRESSOR FOR CONDITION MONITORING
56 DEGREE OF DOCTOR OF PHILOSOPHY (PHD)
CHAPTER THREE
3 REVIEW OF CONDITION-BASED MONITORING (CBM)
This chapter presents a critical review of common machine monitoring methods and techniques
applicable to reciprocating compressors and their limitations. The second part of this chapter
reviews possible statistical parameters and features for fault detection of industrial machinery.
CHARACTERISING VIBRO-ACOUSTIC SIGNALS OF A RECIPROCATING
COMPRESSOR FOR CONDITION MONITORING
57 DEGREE OF DOCTOR OF PHILOSOPHY (PHD)
3.1 Introduction
Condition monitoring is a practice that has been in existence since the late 70s; In a general
sense of understanding, condition based monitoring or maintenance (CBM) can be seen as
practices that enable long term reliability and sustainability of assets (Scott, 2011). Various
components within a machinery have limited lifespans, and frequent use may cause these
components to wear before reaching its service life. There is a need to assess the condition of
process machinery to prevent unexpected failures, which can disrupt industrial operations. By
consistent monitoring of measurable parameters, changes that result from the continuous use
of machines are detected and 10 to 20% catastrophic failures in unmonitored reciprocating
compressors can be prevented according to finding by Schultheis, Lickteig, and Parchewsky
(2007).
Machine monitoring and diagnostics allow for early detection of faults, and these faults can
develop into severe problems if not managed in time. Monitoring also allows for effective
analysis of information retrieved from measuring instruments to give an appropriate diagnosis
of system-generated issues. Furthermore, production capacity, product quality, and the
effectiveness of production plants can be massively improved by implementing an effective
monitoring system (Rao B. K., 1998). Some of the most popular techniques suitable for
condition monitoring of reciprocating compressors include visual inspection, cylinder pressure
monitoring, instantaneous angular speed, air-borne acoustic (gas pulsation) monitoring, and
vibration monitoring are briefly discussed.
3.2 Visual Inspection
Visual inspection is one of the simplest and oldest traditional condition monitoring techniques;
it requires the human senses such as sight, touch, and sound to detect abnormalities on the
reciprocating compressor. It is cost effective but requires the assessor to have basic knowledge
or some experience on condition monitoring of the machine for an accurate assessment. Visual
inspection is often used for detection of cracks, corrosion, excessive noise, excess leakage and
heavy vibrations. However, this technique is usually supported by other monitoring techniques
for a reliable and valid assessment.
3.3 Cylinder Pressure Monitoring
Cylinder pressure monitoring is an effective way to determine the overall condition of a
reciprocating compressor. Valuable information on the compressor capacity and power, piston
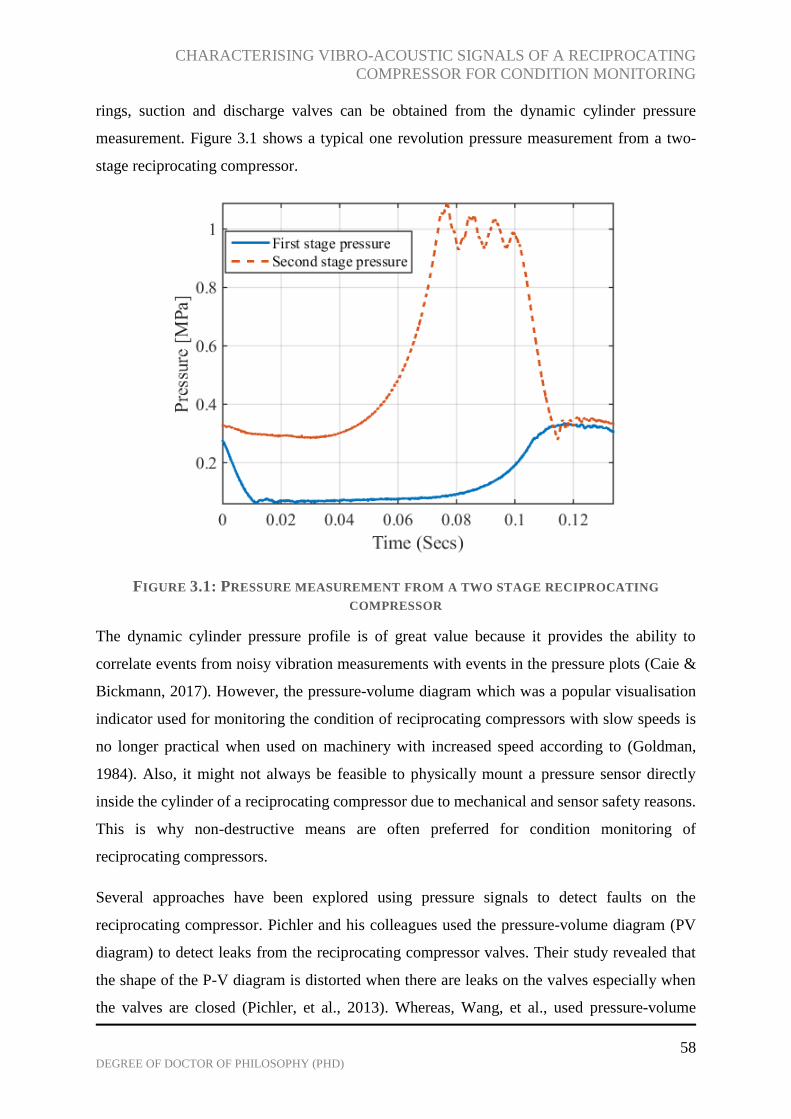
CHARACTERISING VIBRO-ACOUSTIC SIGNALS OF A RECIPROCATING
COMPRESSOR FOR CONDITION MONITORING
58 DEGREE OF DOCTOR OF PHILOSOPHY (PHD)
rings, suction and discharge valves can be obtained from the dynamic cylinder pressure
measurement. Figure 3.1 shows a typical one revolution pressure measurement from a two-
stage reciprocating compressor.
FIGURE 3.1: PRESSURE MEASUREMENT FROM A TWO STAGE RECIPROCATING
COMPRESSOR
The dynamic cylinder pressure profile is of great value because it provides the ability to
correlate events from noisy vibration measurements with events in the pressure plots (Caie &
Bickmann, 2017). However, the pressure-volume diagram which was a popular visualisation
indicator used for monitoring the condition of reciprocating compressors with slow speeds is
no longer practical when used on machinery with increased speed according to (Goldman,
1984). Also, it might not always be feasible to physically mount a pressure sensor directly
inside the cylinder of a reciprocating compressor due to mechanical and sensor safety reasons.
This is why non-destructive means are often preferred for condition monitoring of
reciprocating compressors.
Several approaches have been explored using pressure signals to detect faults on the
reciprocating compressor. Pichler and his colleagues used the pressure-volume diagram (PV
diagram) to detect leaks from the reciprocating compressor valves. Their study revealed that
the shape of the P-V diagram is distorted when there are leaks on the valves especially when
the valves are closed (Pichler, et al., 2013). Whereas, Wang, et al., used pressure-volume

CHARACTERISING VIBRO-ACOUSTIC SIGNALS OF A RECIPROCATING
COMPRESSOR FOR CONDITION MONITORING
59 DEGREE OF DOCTOR OF PHILOSOPHY (PHD)
diagram together with a support vector machine (SVM) for fault diagnosis of reciprocating
compressor valves (Wang, Song, Zhang, & Li, 2010). Elhaj, et al. developed the numerical
simulation of a two-stage reciprocating compressor to show the effects of several operating
conditions and fault conditions on the pressure and instantaneous angular speed (IAS)
waveform. The simulation study showed that the two techniques used can show waveform
fluctuations, which can be used to identify different valve faults on the suction and discharge
valve plates. Although the pressure measurements presented clear detection features, it was
acknowledged that this technique was difficult to implement due to its intrusive installation
means (Elhaj, et al., 2008).
3.4 Instantaneous Angular Speed
The instantaneous angular speed (IAS) measurement is also an effective method for condition
monitoring of reciprocating compressors, mostly because the speed contains relevant
information about the cylinder pressure and has been successfully employed in fault detection
of valve leakage and worn valve spring on the reciprocating compressor (Elhaj, et al., 2008);
(Al-Qattan, Al-Juwayhel, Elhaj, Ball, & Gu, 2009). To apply this method, an encoder fitted to
the crankshaft of the flywheel is required to measure the angular speed at any instant in radians
per second or revolution per second. Processing of the encoder signal is done by counting the
number of pulses in a given period and measuring the elapsed time for one cycle of the encoder
signal (Li, et al., 2005).
Machine monitoring via IAS measurement has been studied widely in recent years because
IAS signals have less noise contamination and are closely related to the machine dynamics
compared to other traditional methods such as vibration and airborne acoustics, and it is less
intrusive than monitoring using pressure measurement. Figure 3.2 shows a typical one
revolution IAS signal from a reciprocating compressor under normal operating condition.
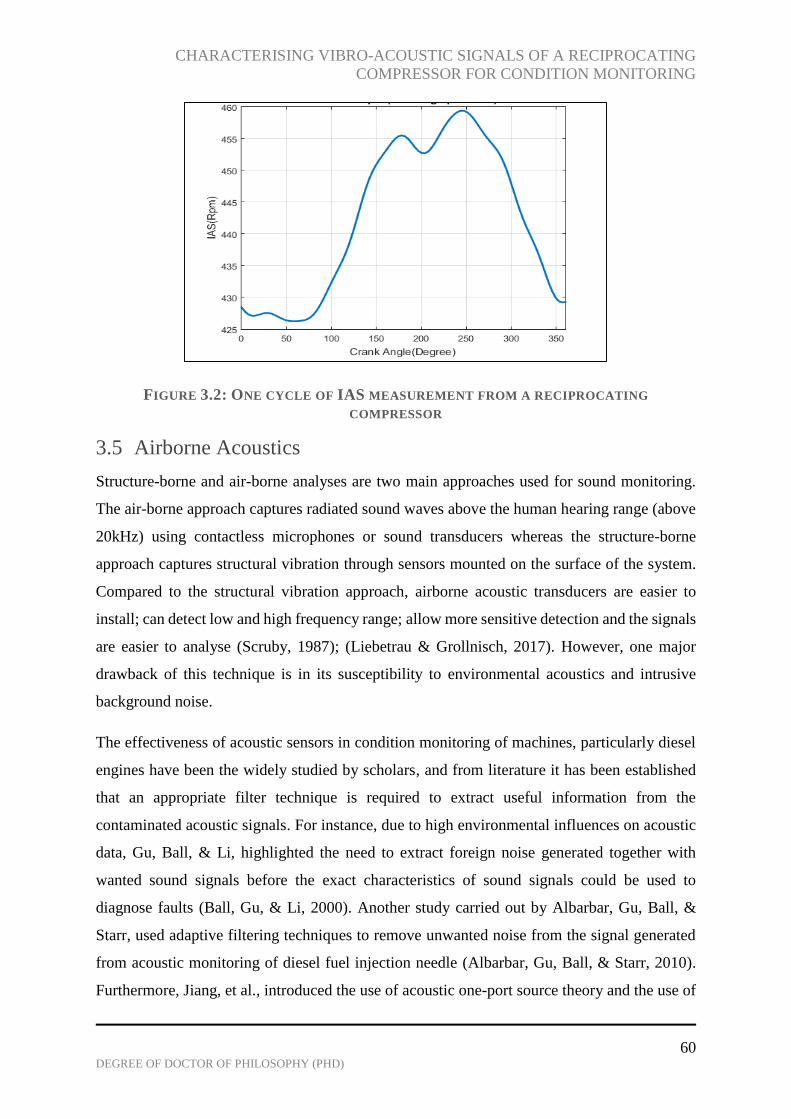
CHARACTERISING VIBRO-ACOUSTIC SIGNALS OF A RECIPROCATING
COMPRESSOR FOR CONDITION MONITORING
60 DEGREE OF DOCTOR OF PHILOSOPHY (PHD)
FIGURE 3.2: ONE CYCLE OF IAS MEASUREMENT FROM A RECIPROCATING
COMPRESSOR
3.5 Airborne Acoustics
Structure-borne and air-borne analyses are two main approaches used for sound monitoring.
The air-borne approach captures radiated sound waves above the human hearing range (above
20kHz) using contactless microphones or sound transducers whereas the structure-borne
approach captures structural vibration through sensors mounted on the surface of the system.
Compared to the structural vibration approach, airborne acoustic transducers are easier to
install; can detect low and high frequency range; allow more sensitive detection and the signals
are easier to analyse (Scruby, 1987); (Liebetrau & Grollnisch, 2017). However, one major
drawback of this technique is in its susceptibility to environmental acoustics and intrusive
background noise.
The effectiveness of acoustic sensors in condition monitoring of machines, particularly diesel
engines have been the widely studied by scholars, and from literature it has been established
that an appropriate filter technique is required to extract useful information from the
contaminated acoustic signals. For instance, due to high environmental influences on acoustic
data, Gu, Ball, & Li, highlighted the need to extract foreign noise generated together with
wanted sound signals before the exact characteristics of sound signals could be used to
diagnose faults (Ball, Gu, & Li, 2000). Another study carried out by Albarbar, Gu, Ball, &
Starr, used adaptive filtering techniques to remove unwanted noise from the signal generated
from acoustic monitoring of diesel fuel injection needle (Albarbar, Gu, Ball, & Starr, 2010).
Furthermore, Jiang, et al., introduced the use of acoustic one-port source theory and the use of
CHARACTERISING VIBRO-ACOUSTIC SIGNALS OF A RECIPROCATING
COMPRESSOR FOR CONDITION MONITORING
61 DEGREE OF DOCTOR OF PHILOSOPHY (PHD)
exhaust acoustic measurements to effectively monitor diesel engine combustion. Their research
showed that despite the harsh operating conditions these machines function under, a two-load
acoustic method could accurately detect and diagnose abnormalities caused by faults (Jiang, et
al., 2008). The acoustic condition monitoring of diesel has gained massive attraction over the
years; however little work has been performed on RC noise characteristics or the use of gas
pulsation from the reciprocating compressor for early fault detection.
Several studies by (Brablik J. , 1972), (Stiaccini, Galoppi, Ferrari, & Ferrara, 2016), (Zhou,
Kim, & Soedel, 2001), and (Zhan, Cheng, & Quanke, 2015) exist on modelling philosophies
to accurately predict pulsations on reciprocating compressors. Furthermore, Pan and Jones
investigated airborne sound transmission in a spherically shaped reciprocating compressor,
using simulation predictions and experimental results to understand the relationship between
gas pulsations inside the cavity and noise radiation from the compressor (Pan & Jones, 1999).
Glen and Eugen focused on the use of acoustic signals to predict pressure and mass fluctuations
from a reciprocating compressor (Glen & Eugene, 1989). As a result of Glen and Eugen’s
investigations, they concluded that vibration analysis is not very sensitive to high –frequency
noise emitted by fluid mechanical motion. Salah et al. proposed an automatic diagnosis of
reciprocating valve condition by adopting support vector machine based on acoustic emission
(AE) parameters. Their generated model could accurately diagnose valve condition in a single-
stage reciprocating compressor (Salah, Hui, Hee, & Salman, 2018). The AE signal together
with simulated valve motion was used by Wang and his colleagues to diagnose reciprocating
compressor valve faults including valve leakage, valve flutter, delayed closing, and improper
valve lift (Wang, Gao, Zheng, & Peng, 2015). Their technique has an advantage of distinctly
extracting valve fault features without applying complex signal processing techniques.
The amplitude of a sound wave is expressed as sound intensity or sound pressure level. The
total acoustic power emitted by the sound source is given by the Sound power, which is defined
as the power per unit area per unit time of the sound wave ( 2Watt / m ). The sound pressure
level (SPL) is calculated as per Equation (3.1) and expressed in decibels (dB).
1020logref
pSPL
p
(3.1)
Where p is the root mean square amplitude of the pressure wave and refp is the reference
sound pressure (Mohanty, 2015).

CHARACTERISING VIBRO-ACOUSTIC SIGNALS OF A RECIPROCATING
COMPRESSOR FOR CONDITION MONITORING
62 DEGREE OF DOCTOR OF PHILOSOPHY (PHD)
Analysing emitted sound waves from the reciprocating compressor allows for the detection of
system defects such as leak detection, crack detection, and provides access to the general
condition of the machine. Under normal operating conditions, most machines emit consistent
sound patterns, but with the development of component defects, regular patterns are distorted.
Figure 3.3 gives a typical airborne acoustic waveform with key characteristic features
according to Yan, et al., 2015.
FIGURE 3.3: SIMPLIFIED WAVEFORM PARAMETERS OF AIRBORNE ACOUSTIC SIGNAL
(YAN, ET AL., 2015)
3.6 Vibration Monitoring
Vibration signals from a machine contains vital information needed to determine and predict
the condition of the machine. Vibration-based techniques are the most common and widely
established monitoring technique used in industries (Gu, Li, Ball, & Leung, 2000). This is
because almost all machines vibrate, and these vibrations can be measured easily and
interpreted to determine the state of a machine. Imbalances in forces acting in the upwards,
downwards, or side to side direction of the mechanical system prevent a smooth flow of energy
thereby causing the system to vibrate. Factors such as overload due to stress on a machine, little
or no maintenance of mechanical components, and lifespan exhaustion of mechanical parts can
cause mechanical systems to vibrate excessively. The vibration levels can be monitored using
appropriate sensors and microphones can be used to detect noise levels resulting from excessive
machine vibration.
The characteristic features of vibrations from a reciprocating compressor are very complicated
because they include excitations from valve impacts, time-varying properties, and non-
stationary responses, which make it difficult to adequately analyse the vibration signal and

CHARACTERISING VIBRO-ACOUSTIC SIGNALS OF A RECIPROCATING
COMPRESSOR FOR CONDITION MONITORING
63 DEGREE OF DOCTOR OF PHILOSOPHY (PHD)
diagnose faults (Geng, Jin, & Hull, 2003). A typical vibration signal from a two-stage
reciprocating compressor is presented in Figure 3.4.
The interpretation of vibration data from the reciprocating compressor is one area that has
attracted lots of research attention. For instance, Gu & Ball experts in machine condition
monitoring conducted a study using smooth pseudo-Wigner–Ville distribution to interpret
vibration data from reciprocating compressors (Gu & Ball, 1995). Naid, Gu, & Ball more
recently, carried out a study introducing the use of kurtosis to develop a diagnostic method for
differentiating valve leakage, intercooler leakage and loose drive belt on a reciprocating
compressor after proofing that the conventional bispectrum is not so effective in analysing
amplitude modulation current signals (Naid, Gu, & Ball, 2007). Some studies suggest that
vibration monitoring together with other monitoring techniques should be used to give a full
monitoring condition of reciprocating machinery (Rao B. K., 1998); (Dong, 2012).
FIGURE 3.4: VIBRATION SIGNAL FROM A TWO STAGE RECIPROCATING COMPRESSOR
Several approaches have been implemented by analysing vibration signals for fault diagnosis.
However, fault diagnosis of compressor valves based on the vibration and acoustic emission
signals is considered more efficient because it can be accomplished non-intrusively (Wang,
Xue, Jia, & Peng, 2015).
3.7 Signal Processing for Machine Monitoring

CHARACTERISING VIBRO-ACOUSTIC SIGNALS OF A RECIPROCATING
COMPRESSOR FOR CONDITION MONITORING
64 DEGREE OF DOCTOR OF PHILOSOPHY (PHD)
Data collected from measuring instruments used for condition monitoring needs to be analysed
and interpreted to reveal critical information and machine characteristics (Smith, 1999).
Effective condition monitoring of machines often depends on the use of an appreciate signal
processing method or a combination of two or more methods. There are three most popular
methods used for signal processing, and they include:
Time domain analysis
Frequency domain analysis
Time-frequency analysis
(Norton & Karczub, 2003).
Figure 3.5 shows a list of some common signal processing methods used for condition
monitoring.
FIGURE 3.5: SIGNAL PROCESSING TECHNIQUES
3.7.1 Time Domain
Time domain signal representation contains useful information for understanding machine
condition, and the signal is represented as a function of time, which is a plot of the amplitude
against time. Characteristic features of a signal in the form of statistical methods such as root
mean square (RMS), the peak value (PK), crest factor (CF), kurtosis (KT), skewness (SK),
probability density, and variances are used to summarise the data obtained and to draw suitable
Time Domian
• Statistical Parameters
• Synchronous Average
• Empirical Mode Decomposition
• Entropy Spectrum
Frequency Domain
• Statistical Parameters
• Discrete Fourier Transform
• Fast Fourier Transform
Time-frequency Domain
• Wigner Distribution
• Short time Fourier Transform
• Wavelet Transform
CHARACTERISING VIBRO-ACOUSTIC SIGNALS OF A RECIPROCATING
COMPRESSOR FOR CONDITION MONITORING
65 DEGREE OF DOCTOR OF PHILOSOPHY (PHD)
conclusions. Some of these techniques would be used when analysing the vibration and gas
pulsation signals collected from the Broom Wade TS9 reciprocating compressor in chapters
seven and eight.
The two most widely used statistical parameters are the root mean square (RMS), which is a
measure of the signals strength or power. The peak value describes the maximum absolute
value of a signal.
3.7.1.1 RMS
RMS is used to evaluate the overall condition of the machine and to track general fault
progression rather than early incipient fault (Zhu, Nostrand, Spiegel, & Morton, 2014). For a
set of data, 1 2 3, , ,..., ,N rmsX X X X X is defined as (Zhu, Nostrand, Spiegel, & Morton, 2014):
2
1
1 N
rms i
i
X XN
(3.2)
Where, rmsX is the root mean square value of the data set X at every instant i , and N is the
number of data points.
3.7.1.2 Peak Value
For a set of data, 1 2 3, , ,..., ,NX X X X the peak value (PK) is expressed as (Zhu, Nostrand,
Spiegel, & Morton, 2014):
max( )PKX X (3.3)
where, X is the absolute value.
3.7.1.3 Crest Factor (CF)
Creak factor (CF) is another common statistical feature used in time domain analysis to
determine the repeated impulses of a signal; it is the measure of the number and sharpness of
the peaks of a signal. CF is expressed as the ratio of the peak value ( PKX ) to the RMS value (
rmsX ) of the time domain waveform (Zhu, Nostrand, Spiegel, & Morton, 2014):
PK
rms
XCF
X (3.4)
CHARACTERISING VIBRO-ACOUSTIC SIGNALS OF A RECIPROCATING
COMPRESSOR FOR CONDITION MONITORING
66 DEGREE OF DOCTOR OF PHILOSOPHY (PHD)
The crest factor is used in condition monitoring to detect changes in signal pattern due to
impulsive vibration sources. A high crest factor value is an indication of possible component
deterioration.
3.7.1.4 Skewness
Skewness (SK) is a measure of the lack of symmetry in the data distribution, and this is
expressed in the following equation:
3
1
31
N
i
iK
X X
SN S
(3.5)
Where, X is the mean of the data set 1 2 3, , ,..., ,NX X X X and S is the standard deviation of the
distribution given as:
2
1
N
i
i
X X
SN
(3.6)
A time series is positively skewed (right tail) with a positive SK value, if it has many small
values and a few large values, while a negative SK value signifying a negatively skewed (left
tail) time series is obtained when a lot of large values and a few small values are present (Zhu,
Nostrand, Spiegel, & Morton, 2014).
3.7.1.5 Kurtosis
Kurtosis describes how sharp (peaked) or flat the distribution is. Kurtosis value is given by the
following equation (Raharjo, 2013):
4
1
41
N
i
iT
X X
KN S
(3.7)
A negative kurtosis value indicates that the distribution is flatter than the Gaussian, while a
positive value means its distribution is more peaked than a Gaussian (Raharjo, 2013).
3.7.1.6 Probability Density Function
Sharma and Parey used the improved RMS probability density function and entropy
measurement to detect gear faults with initial and advanced cracks for different speed profiles.

CHARACTERISING VIBRO-ACOUSTIC SIGNALS OF A RECIPROCATING
COMPRESSOR FOR CONDITION MONITORING
67 DEGREE OF DOCTOR OF PHILOSOPHY (PHD)
They found that initial cracks were detectable using percentage increase in entropy values for
RMS PDF compared to advanced cracks (Sharma & Parey, 2016). Experiments by Zhuang and
his colleagues revealed that the probability density method based on Parzen window was able
to detect motor air gap eccentricity and ball cage broken bearing faults on vibration signals
(Zhuanga, Li, & Wei, 2012). Toyota, Niho, Chen, & Komura proposed a new method based
on rotating angle density function of vibration signal and its normalised power density function
because of the drawbacks of PDF analysis in time-domain and frequency-domain, which are
insensitivity of signal pulse phase shifting and small local change in amplitude (Toyota, Niho,
Chen, & Komura, 2001)
A study conducted by Yang, Hwang, Kim, and Chit tan suggests that not all features extracted
from time domain are useful for effective detection and diagnosis of reciprocating compressor
faults (Yang, Hwang, Kim, & Chit Tan, 2005). Some advanced time domain signal processing
techniques using dynamic time warping (Zhen, Alibarbar, Zhou, Gu, & Ball, 2011), empirical
mode decomposition (EMD) (Muo, Madamedon, Gu, & Ball, 2017), (Yongbo, Xu, Wei, &
Huang, 2014), and entropy spectrum (Ogbulafor, Guojin, Mones, Gu, & Ball, 2017) amongst
others have been proposed because they are suitable for processing nonlinear and non-
stationary time series of reciprocating compresssor signals.
3.7.2 Frequency Domain Analysis
Frequency domain analysis is another technique for signal processing; it represents signal data
in the form of a spectrum. Spectrum analysis is a measure of signal amplitude as a function of
frequency. In many machineries, especially rotating types, components within the system have
a specific operating frequency, which is related to the dynamics of its operation and can be
used for condition monitoring purposes (Rao S. S., 2004); (Thobiani, 2011); (Robinson, 1990).
This technique is prevalent in analysing vibration response. The most basic frequency domain
tool is the Fast Fourier Transform (FFT), which enables the conversion of the time domain
signal to frequency domain or spectrum. The central concept of frequency domain analysis is
either to look at the entire spectrum, or to closely analyse specific frequency components
(Jardine, Lin, & Banjevic, 2005), (Dong, 2012).
Frequency domain analysis has several advantages in machine condition monitoring and
decades of practical applications have confirmed the effectiveness of this technique in
identifying frequency components, which indicate the development of certain faults (Albarbar,

CHARACTERISING VIBRO-ACOUSTIC SIGNALS OF A RECIPROCATING
COMPRESSOR FOR CONDITION MONITORING
68 DEGREE OF DOCTOR OF PHILOSOPHY (PHD)
Elhaji, Gu, & Ball, 2004); (Elhaji, Gu, Shi, & Ball, 2001); (Bradley, Ball, & Gu, 2000);
(Staszewski W. , 1994); (Yesilyurt, 1997); (Braun, 1986); (Collacott, 1977).
However, some limitations such as aliasing, spectral leakage and picket-fence affect its
practical application and lead to errors in spectrum estimation (Dong, 2012). Moreover, in
reality, signals from rotating machinery are often non-stationary, that is, the spectra vary with
time and the FFT cannot depict the changes in signals that have time-varying features (Goyal
& Pabla, 2016).
3.7.3 Time-Frequency Domain Analysis
The limitations of time domain and frequency domain analysis has caused the application of
time-frequency analysis. Frequency spectrum analysis is unable to diagnose faults from non-
stationary waveform signals accurately and can only represent the signals’ energy in one-
dimensional function (frequency), whilst time domain waveform only presents the signals time
information. Therefore, the time-frequency domain analysis, which shows signal information
in two-dimensional functions (time and frequency) has been exploited and found useful for
fault diagnosing. Particularly, with non-stationary signals. There are several time-frequency
techniques used in analysing non-stationary signals for condition monitoring purposes.
However, three of the most popular methods according to Jardine, Lin, & Banjevic (2005) are
the short-time Fourier transform (STFT) also known as spectrograms, Wigner-Ville
distribution (WVD) and wavelet transform (WT).
3.7.3.1 Short-Time Fourier Transform (STFT)
STFT works by dividing the whole waveform signal into segments with short-time window
and applying Fourier transform to each segment. The problem with this technique come about
when acquiring a more accurate frequency resolution because the window size used along the
time axis of the signal does not always coincide with the stationary timescales for non-
stationary signals with fast changes in dynamics (Jardine, Lin, & Banjevic, 2005). In other
words, to get an accurate time representation, the frequency resolution would have to be less
precise, and for an accurate frequency representation the reverse is the case, this is known as
the uncertainty principle.
3.7.3.2 Wigner-Ville Distribution (WVD)
WVD was created to solve the uncertainty principle problem associated with the short-time
Fourier transform by giving excellent resolutions in both domains. This technique has proven
CHARACTERISING VIBRO-ACOUSTIC SIGNALS OF A RECIPROCATING
COMPRESSOR FOR CONDITION MONITORING
69 DEGREE OF DOCTOR OF PHILOSOPHY (PHD)
successful in many studies, for instance, it was applied by (Wu & Chiang, 2009), to analyse
non-stationary sound emission signals combined with the probability neural network for fault
diagnosis of an internal combustion engine. They concluded that their proposed approach could
improve the cost of the fault diagnosis system and reduce mistaken recognition. Then
Staszewski and Worden investigated the characteristics of gearbox vibration signals and found
that the Wigner-Ville distribution is capable of detecting local tooth faults in spur gears
(Staszewski & Worden, 1997). A more recent study carried out by Albarbar et al., successfully
extracted non-stationary air-borne acoustic features from a diesel engine by using the Wigner-
Ville distribution technique (Albarbar, Gu, Ball, & Starr, 2010). However, the drawback of
Wigner-Ville distribution according to Jardine, Lin, & Banjevic (2005), is in the interference
terms (generation of spurious frequency not contained in the initial signal) formed by the
transformation itself, although, improved transforms such as Choi-Williams distribution can
be applied to counter these interference terms.
3.7.3.3 Wavelet Transform (WT)
Jean Morlet introduced wavelets in 1982 to achieve the best balance between time resolution
and frequency resolution. However, wavelet transform only became very popular in condition
monitoring of non-stationary signals in the last fifteen years (Loutas & Kostopoulos, 2017).
Unlike other time-frequency techniques that use complex cosines and sine functions to graph
the signal into a two-dimensional function, wavelet transform consists of a family of simple
time functions that are dilated and shifted independently to represent the signal in both time
and frequency domain (Goyal & Pabla, 2016).
There are several ways of calculating the wavelet transform of a signal, but the three common
methods are the continuous wavelet transform (CWT), the discrete wavelet transform (DWT)
and the wavelet packet transform (WPT). Wavelet transform has been used extensively in
several fields such as biomedical engineering (Manea, Mihaela, & Mutihac, 2018),
transportation engineering, mechanical engineering (Ogbulafor, Guojin, Mones, Gu, & Ball,
2017), (Kumar, Srinivasa, Sriram, & Vijay, 2014), (Peng & Chu, 2004), power engineering
(Gursoy, Yilmaz, & Ustun, 2018), image processing (Khan, 2018) and many more. It has the
advantages of noise elimination, data compression and it is computationally very efficient.
Irrespective of some of the problems associated with the wavelet transform, it is currently one
of the best available technique for analysing non-stationary signals. In this research work,

CHARACTERISING VIBRO-ACOUSTIC SIGNALS OF A RECIPROCATING
COMPRESSOR FOR CONDITION MONITORING
70 DEGREE OF DOCTOR OF PHILOSOPHY (PHD)
wavelet packet transform is employed to determine the characteristics of vibration and gas
pulsation signals for condition monitoring of the reciprocating compressor.
3.8 Summary
The increasing demand for quality products, machine sustainability, and improved human
safety have created a requirement for more revealing diagnostic information from machines
through condition monitoring and signal processing techniques. A wide range of novel
monitoring techniques has been investigated by several scholars, with some proving more
successful than others. Analysis of vibration signals from mechanical systems has proven to be
the most widely used and most promising due to its non-intrusive nature and the rich signal
information.
Therefore, a combination of two or more signal processing techniques have been strongly
encouraged to accurately determine the characteristics of vibro-acoustic signals generated from
a two-stage reciprocating compressor for condition monitoring purposes.
CHARACTERISING VIBRO-ACOUSTIC SIGNALS OF A RECIPROCATING
COMPRESSOR FOR CONDITION MONITORING
71 DEGREE OF DOCTOR OF PHILOSOPHY (PHD)
CHAPTER FOUR
4 DESIGN AND CONSTRUCTION OF TEST-RIG FACILITY
This chapter presents the design and construction of the test rig used to carry out all
experiments including measurement parameters associated with condition monitoring of the
double-stage, single-acting reciprocating compressor. Details of relevant transducers and
data acquisition system used to carry out this study is also described within this chapter. First
a detailed setup description of the two-stage reciprocating compressor is presented, followed
by brief descriptions and specifications of the measurement instruments and data acquisition
system used for the entire study. Also, the manner in which data is collected and processed is
described, and finally fault simulation strategies are described and repeatability analysis of
signals for healthy and fault conditions are presented.

CHARACTERISING VIBRO-ACOUSTIC SIGNALS OF A RECIPROCATING
COMPRESSOR FOR CONDITION MONITORING
72 DEGREE OF DOCTOR OF PHILOSOPHY (PHD)
4.1 Introduction
This chapter is aimed at developing a reciprocating compressor test rig suitable for the
investigation of condition monitoring signatures such as pressure, vibration, instantaneous
speed and the newly investigated pressure pulsation waves in the discharge chamber, which
will be used to ascertain the working condition and investigated fault conditions on the two-
stage reciprocating compressor. Furthermore, relevant experimental signatures are used to
verify the improved mathematical model presented in chapter five of th36is study. A
reciprocating compressor was chosen as the test machine because of its long-standing relevance
in several industries, particularly in the oil and gas sector and chemical production industries.
Advances in condition monitoring of such machines would help in maintenance cost reduction
and further prolong the life of the machine.
First, a detailed description of the test rig and specifications are given. Secondly, each
measurement instrumentation used to collect relevant data is described; the data acquisition
system and measurement practice are explained. Finally, the common reciprocating
compressor faults investigated are described, and the repeatability of signals used for this
research study are analysed.
4.2 Test Rig Facility
4.2.1 The Broom Wade TS-9 Reciprocating Compressor
The experiment is carried out on a previously existing two-stage single acting reciprocating
compressor identified as the Broom Wade TS9 in Figure 4.1 below. This machine was used to
provide compressed air for the School of Computing and Engineering at the University of
Huddersfield. It has proven suitable for condition monitoring purposes over the years as it
allows for practical investigations and measurement of real-life working conditions and faults
applicable to many industrial fields to be effectively implemented.
The V-shaped reciprocating compressor is made up of two cylinders positioned at an angle of
90° to each other giving it the V-shape (see Figure 4.1 and 4.2). These cylinders are tailored to
deliver compressed air between 1 bar (0.1 MPa) to 8.3 bar (0.83 MPa) to a 13.8 bar (1.38MPa)
capacity storage tank. An intercooler coil connecting the first-stage cylinder (after discharge)
to the second-stage cylinder (before suction) is used to cool down the temperature of the gas
from the first stage for improved compressor efficiency. The compressor is powered by a
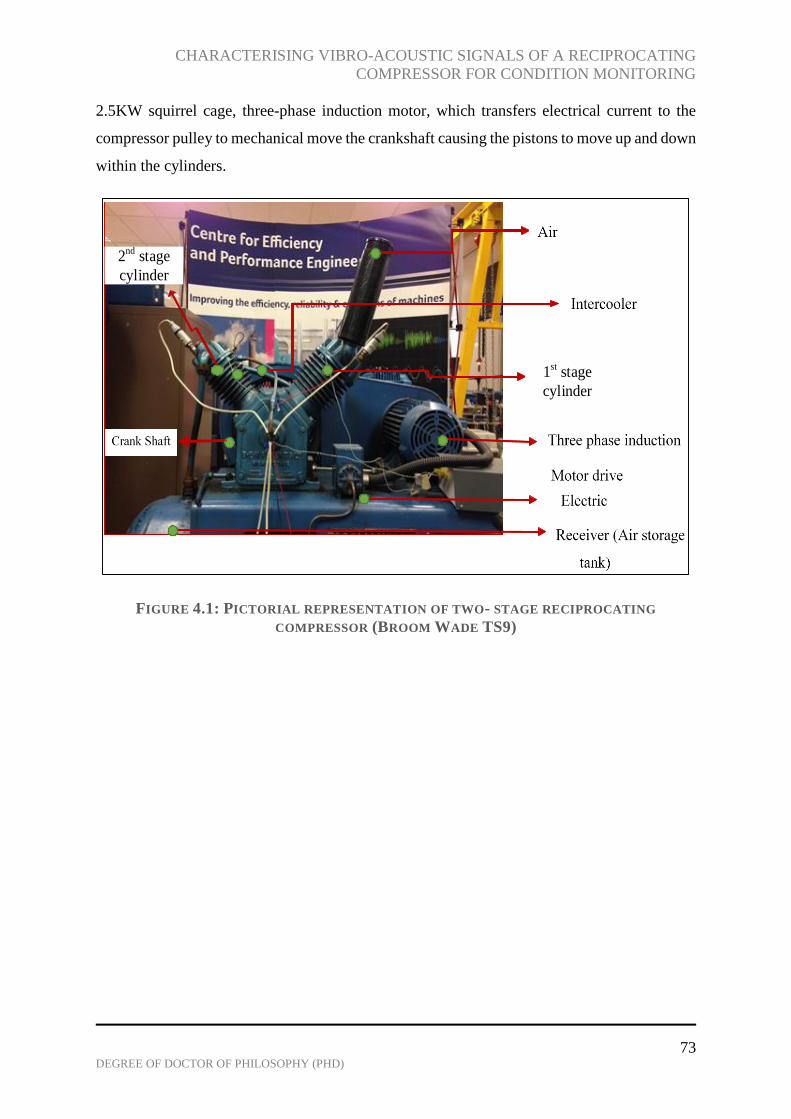
CHARACTERISING VIBRO-ACOUSTIC SIGNALS OF A RECIPROCATING
COMPRESSOR FOR CONDITION MONITORING
73 DEGREE OF DOCTOR OF PHILOSOPHY (PHD)
2.5KW squirrel cage, three-phase induction motor, which transfers electrical current to the
compressor pulley to mechanical move the crankshaft causing the pistons to move up and down
within the cylinders.
FIGURE 4.1: PICTORIAL REPRESENTATION OF TWO- STAGE RECIPROCATING
COMPRESSOR (BROOM WADE TS9)
2nd stage
cylinder
1st stage
cylinder

CHARACTERISING VIBRO-ACOUSTIC SIGNALS OF A RECIPROCATING
COMPRESSOR FOR CONDITION MONITORING
74 DEGREE OF DOCTOR OF PHILOSOPHY (PHD)
FIGURE 4.2: SCHEMATIC DIAGRAM OF THE TEST RIG SYSTEM
4.3 Measurement Instruments
A variety of sensors including accelerometers, pressure transducers, thermocouples and an
angular speed encoder were fitted on specific areas of the reciprocating compressor system to
enable data collection for experimental purposes. The main parameters to be investigated for
this study are vibration and airborne acoustics (acoustic wave propagation), however, other
Electrical Power
Panel
Flywheel
AIR RECEIVER TANK
Air Filter
Low-Pressure
Cylinder
High-Pressure
Cylinder
Intercooler
Coil Static Pressure
Gauage
Computer
Air Release Pipe
Chanel 0: Low pressure transducer
Chanel 1: High pressure transducer
Chanel 2: Low vibration transducer
Chanel 3: High vibration transducer
Chanel 4:ADC input
Chanel 5: Encoder sensor
Chanel 6: Temperature sensor
Chanel 7: Tank pressure transducer
Data Acquisition System

CHARACTERISING VIBRO-ACOUSTIC SIGNALS OF A RECIPROCATING
COMPRESSOR FOR CONDITION MONITORING
75 DEGREE OF DOCTOR OF PHILOSOPHY (PHD)
parameters such as temperature, pressure and shaft speed are obtained to support the vibration
and airborne acoustic measurements; and also gives an added understanding of the dynamic
system of the reciprocating compressor.
4.3.1 Accelerometers
Two accelerometers, Bruel & Kjaer type 4384 mounted on the surface of each cylinder head
of the reciprocating compressor are used to detect surface vibrations. These piezoelectric
transducers are robust and suitable for most applications including rough industrial field
conditions. The specifications for the accelerometers used are listed in Table 4.1.
The accelerometer is attached by bonding a screw-threaded brass stud with ceramic cement to
the compressor casing; Figure 4.3 shows the configuration and data processing flow diagram
for obtaining raw vibration signals from the reciprocating compressor. Piezoelectric
accelerometers are known for their high output impedance and weak signals (Barber, 1992),
therefore, a charge amplifier is used to reduce the impedance value and amplify the signal.
FIGURE 4.3: VIBRATION MEASUREMENT FLOW CHAT
TABLE 4.1: ACCELEROMETER SPECIFICATIONS
Features Specifications
Type TD-5-2
Accelerometer Installation
Charge
AmplifierData Acquisition System
Online Vibration Data Collection
and Storage
Processed Vibration Data Using MatLab

CHARACTERISING VIBRO-ACOUSTIC SIGNALS OF A RECIPROCATING
COMPRESSOR FOR CONDITION MONITORING
76 DEGREE OF DOCTOR OF PHILOSOPHY (PHD)
Frequency range 15kHz
Acceleration 2000 ms-2
Temperature range Up to 150°C
Sensitivity 45mv/ms2
4.3.2 In-Cylinder Pressure Sensor
For In-cylinder pressure measurement, a pressure transducer is installed on the head of each
cylinder by drilling a small duct for the sensor to be fitted as seen in Figure 4.4. The GEMS
type 2200 strain gauge pressure transducers with an output of 100mV for full pressure range
were chosen because of their low cost, and temperature compatibility features. Furthermore,
no amplification of the collected pressure signal was required, so the sensors are directly
connected to the data acquisition system for signal processing as seen in the flow diagram
below. Other specifications of the pressure transducer are listed in Table 4.2.
FIGURE 4.4: DYNAMIC-PRESSURE MEASUREMENT FLOW CHAT
TABLE 4.2: IN-CYLINDER PRESSURE SENSOR TECHNICAL SPECIFICATIONS
Features Specifications
Type GEMS type 2200 strain gauge
In-cylinder Pressure
Transducer
Data Acquisition System
Online Raw Pressure Data Collection
and Storage
Processed In-cylinder Pressure Data
Using MatLab

CHARACTERISING VIBRO-ACOUSTIC SIGNALS OF A RECIPROCATING
COMPRESSOR FOR CONDITION MONITORING
77 DEGREE OF DOCTOR OF PHILOSOPHY (PHD)
Output 100mV
Power supply 10Vdc
Pressure range 4Mpa (600psi)
Frequency limit 4kHz
4.3.3 Airborne Acoustic Sensor
Acoustic Pressure waves at the discharge chamber of the second stage cylinder are obtained by
means of a CY-YD-212 piezoelectric pressure transducer. This sensor is placed within an
adaptor with a small duct fitted on the head of the valve chamber allowing air to travel from
the chamber just after the valve to the sensor. The CY-YD-212 piezoelectric pressure
transducer is small-sized, lightweight and particularly suitable for testing cylinder pipeline
pressure & explosion pressure and has a wide frequency response range of over 100 kHz.
Figure 4.5 shows the flow diagram for acoustic discharge pressure-wave signal collection and
sensor installation on the compressor.
FIGURE 4.5: ACOUSTIC PRESSURE MEASUREMENT FLOW CHAT
Acoustic Pressure
Transducer Installation
Data Acquisition
System
Online Raw Acoustic Pressure Data
Collection and Storage
Processed Acoustic Pressure Data Using MatLab
Piezoelectric
Pressure
Transducer
Adaptor housing
for acoustic
pressure sensor
Charge
Amplifier

CHARACTERISING VIBRO-ACOUSTIC SIGNALS OF A RECIPROCATING
COMPRESSOR FOR CONDITION MONITORING
78 DEGREE OF DOCTOR OF PHILOSOPHY (PHD)
4.3.4 Static Pressure Sensor
A Gem type PS20000 static pressure sensor used to trigger data collection at pre-set pressures
and to automatically switch the motor off at cut-off pressure is installed on the air storage tank
(see Figure 4.6). Its operating range is from 0 to 1.35MPa (200Psi), with a maximum output of
100mV when the supply voltage is 15V; operating temperature range is between –20°C to
+105°C. Knowing the pressure delivered to the storage tank allows the efficiency of the
compressor to be calculated.
FIGURE 4.6: STATIC TANK-PRESSURE FLOW CHAT
4.3.5 Temperature Sensors
The K-type thermocouples with a linear response of -20°C to 220°C are used to measure the
temperature readings of the discharge pressure for both cylinders. These thermocouples have
the following advantages: fast response time, affordable cost, wide industry application range,
relative accuracy and durability. The thermocouple is made up of two metal wires connected
in one end known as the measurement junction, and the other end of each of the wires is
connected to the reference junction, which has the same wire type on a PCB (Printed Circuit
Board) and is connected to the DAQ. Figure 4.7 shows the thermocouple installation on the
cylinder and the data monitoring processes to ensure safe machine condition.
Charge
Amplifier
Gem (PS20000) Static Pressure
Sensor Installation
Online Tank Pressure
Sensor Output at 51.91 psi

CHARACTERISING VIBRO-ACOUSTIC SIGNALS OF A RECIPROCATING
COMPRESSOR FOR CONDITION MONITORING
79 DEGREE OF DOCTOR OF PHILOSOPHY (PHD)
FIGURE 4.7: K TYPE, CR-AL THERMOCOUPLE INSTALLATION AND TEMPERATURE
MONITORING PROCESS
4.3.6 Shaft Encoder
Encoders are sensors used to measure the angular speed of a rotating device; for the purpose
of this study, the optical pulse high-resolution shaft encoder, which produces a pulse for a unit
of angular distance when the crankshaft rotates is fitted as seen in Figure 4.9 through a spindle
adapter attached to the compressor crankshaft end. The encoder converts the rotary
displacement of the crankshaft into 360 equally spaced pulse signals per revolution. The TDC
trigger marker in Figure 4.8 represents the start of every revolution. The encoder is directly
connected to the computer via the data acquisition system hence; no amplification of the
measured instantaneous speed signal (IAS) is needed.
K-type Thermocouple Wire
Installation
Low Pressure Cylinder
Discharge Temperature
High Pressure Cylinder
Discharge Temperature
Data Acquisition System
K- type thermocouple and
printed circuit board
support
Online Thermocouple Digital Output
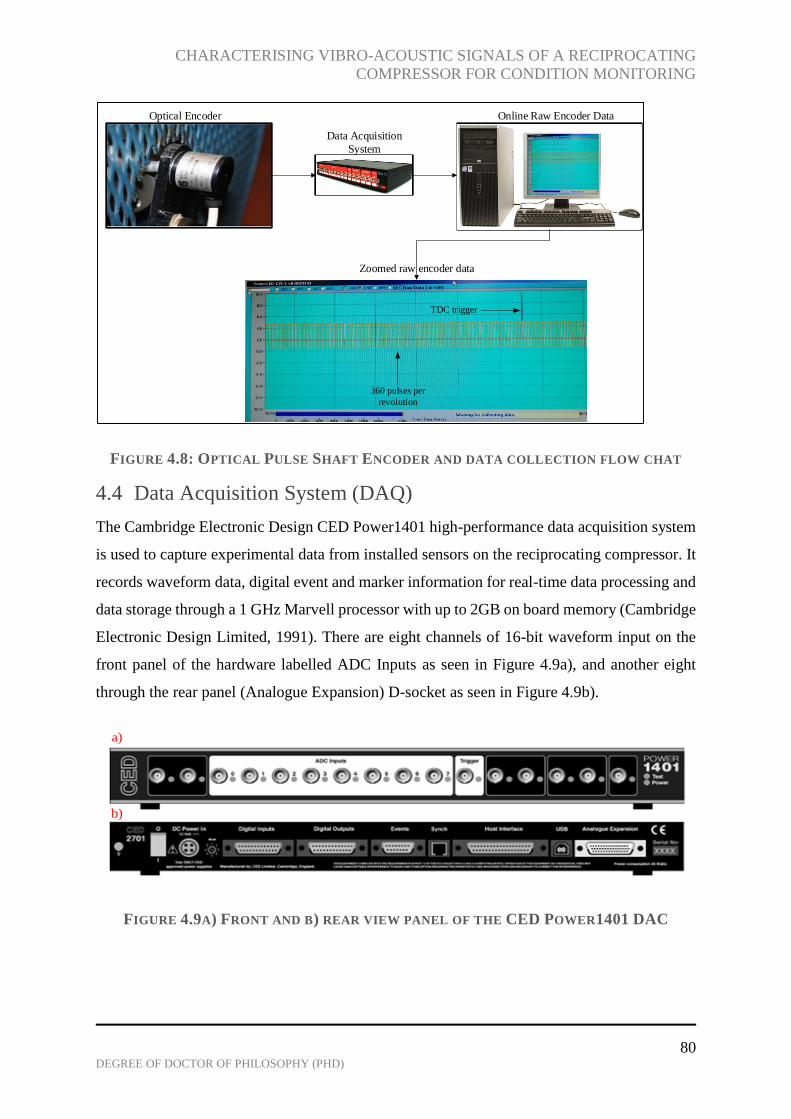
CHARACTERISING VIBRO-ACOUSTIC SIGNALS OF A RECIPROCATING
COMPRESSOR FOR CONDITION MONITORING
80 DEGREE OF DOCTOR OF PHILOSOPHY (PHD)
FIGURE 4.8: OPTICAL PULSE SHAFT ENCODER AND DATA COLLECTION FLOW CHAT
4.4 Data Acquisition System (DAQ)
The Cambridge Electronic Design CED Power1401 high-performance data acquisition system
is used to capture experimental data from installed sensors on the reciprocating compressor. It
records waveform data, digital event and marker information for real-time data processing and
data storage through a 1 GHz Marvell processor with up to 2GB on board memory (Cambridge
Electronic Design Limited, 1991). There are eight channels of 16-bit waveform input on the
front panel of the hardware labelled ADC Inputs as seen in Figure 4.9a), and another eight
through the rear panel (Analogue Expansion) D-socket as seen in Figure 4.9b).
FIGURE 4.9A) FRONT AND B) REAR VIEW PANEL OF THE CED POWER1401 DAC
Data Acquisition
System
Online Raw Encoder DataOptical Encoder
360 pulses per
revolution
TDC trigger
Zoomed raw encoder data
a)
b)

CHARACTERISING VIBRO-ACOUSTIC SIGNALS OF A RECIPROCATING
COMPRESSOR FOR CONDITION MONITORING
81 DEGREE OF DOCTOR OF PHILOSOPHY (PHD)
4.4.1 Software: LabWindows TM/CVI Version 5.5
The data acquisition software is a National Instruments Lab Windows TM/CVI Version 5.5. It
is an interactive development environment written in the programming language C (National
Instrument Company, 2003). This program includes data acquisition, analysis, user interface
and a large set of run-time libraries for instrument control. Compared to other programming
software’s, the Lab Windows TM/CVI provides an inbuilt graphical user interface (GUI) editor
which contains many measurement specific features that allow easy C based programming.
The Data Acquisition software enables multiple channels of dynamic data (e.g. IAS, vibration,
dynamic, pressure, motor current, sound and temperature) to be acquired simultaneously at
different rates and data lengths. Also, the sampling frequency and sample data length are
manually adjusted to ensure an optimal dataset is collected for subsequent off-line analysis.
Figure 4.10 below presents the configuration-setting panel of the software and Figure 4.11
displays the data acquisition process.
FIGURE 4.10: LAB WINDOWS TM/CVI CONFIGURATION SETTING PANEL SCREEN
The maximum sampling frequency is set at 49019Hz to obtain high frequencies associated with
transient events such as valve impacts; the data length is set at 64,722 samples per 1.3203
seconds. The following equation calculates the time duration:
(sec ) (number of samples) (sampling frequency)t onds Nsamples Fs (4.1)

CHARACTERISING VIBRO-ACOUSTIC SIGNALS OF A RECIPROCATING
COMPRESSOR FOR CONDITION MONITORING
82 DEGREE OF DOCTOR OF PHILOSOPHY (PHD)
FIGURE 4.11: DATA ACQUISITION PROCESS
Numerical values of monitored parameters including temperature, compressor speed, tank
pressure etc. are displayed in the data acquisition panel for compressor monitoring. A trigger
signal is used to automatically set the start time of data collection when the piston is at top dead
centre (TDC), this ensures that data is collected at the same crank position every time for
accurate time domain averaging of data segment during analysis. Data files were saved in
binary format and analysed offline using MATLAB, which provides an easy platform for data
analysis.
4.5 Data Measurement Practice
A standard test procedure was developed and followed to ensure proper and safe measurement
practice. The procedures are as follows:
First, the machine is checked to determine its safety status
Then all wires and connections are traced to ensure proper connections
The drain valve connected to the receiver is closed after the compressed air has been
released.
The monitor and central processing unit are switched on together with the data
acquisition unit.
The data acquisition software application is opened on the monitor
The CED setup tab/icon is clicked taking the user to the configuration channel and
sampling rate page where the user checks that all channels are checked/on; and also
ensures that the Trigger E4, if off is clicked on.
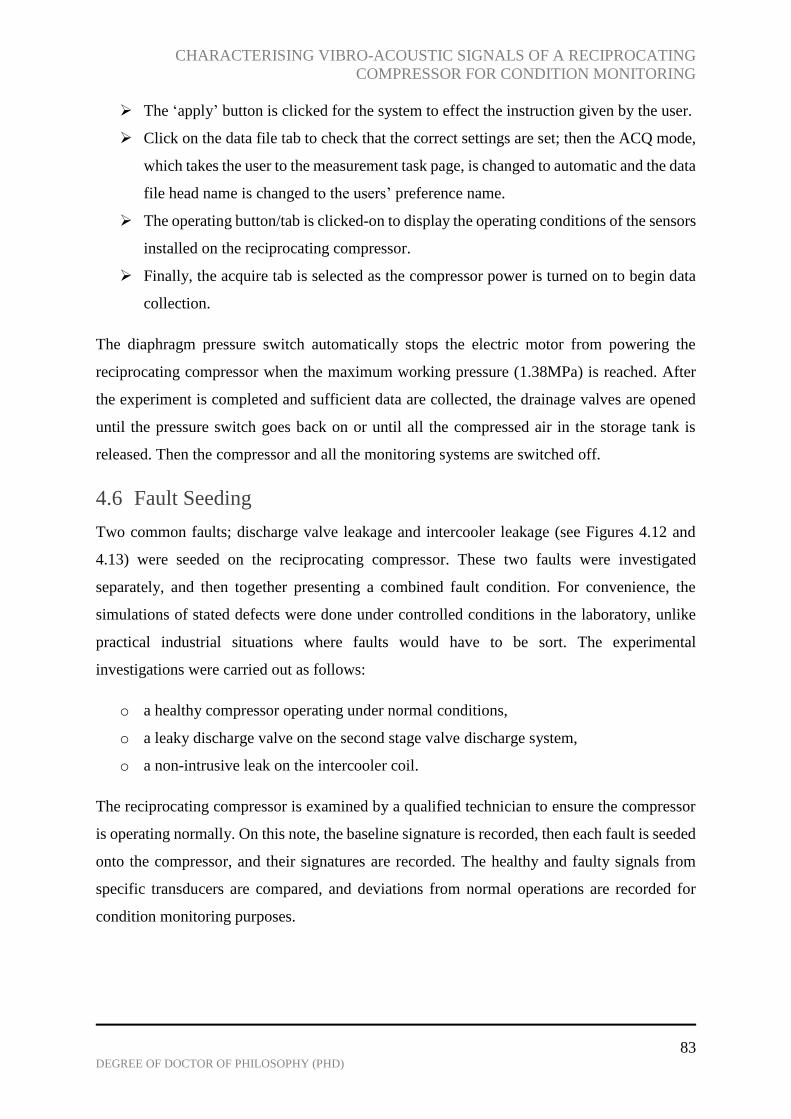
CHARACTERISING VIBRO-ACOUSTIC SIGNALS OF A RECIPROCATING
COMPRESSOR FOR CONDITION MONITORING
83 DEGREE OF DOCTOR OF PHILOSOPHY (PHD)
The ‘apply’ button is clicked for the system to effect the instruction given by the user.
Click on the data file tab to check that the correct settings are set; then the ACQ mode,
which takes the user to the measurement task page, is changed to automatic and the data
file head name is changed to the users’ preference name.
The operating button/tab is clicked-on to display the operating conditions of the sensors
installed on the reciprocating compressor.
Finally, the acquire tab is selected as the compressor power is turned on to begin data
collection.
The diaphragm pressure switch automatically stops the electric motor from powering the
reciprocating compressor when the maximum working pressure (1.38MPa) is reached. After
the experiment is completed and sufficient data are collected, the drainage valves are opened
until the pressure switch goes back on or until all the compressed air in the storage tank is
released. Then the compressor and all the monitoring systems are switched off.
4.6 Fault Seeding
Two common faults; discharge valve leakage and intercooler leakage (see Figures 4.12 and
4.13) were seeded on the reciprocating compressor. These two faults were investigated
separately, and then together presenting a combined fault condition. For convenience, the
simulations of stated defects were done under controlled conditions in the laboratory, unlike
practical industrial situations where faults would have to be sort. The experimental
investigations were carried out as follows:
o a healthy compressor operating under normal conditions,
o a leaky discharge valve on the second stage valve discharge system,
o a non-intrusive leak on the intercooler coil.
The reciprocating compressor is examined by a qualified technician to ensure the compressor
is operating normally. On this note, the baseline signature is recorded, then each fault is seeded
onto the compressor, and their signatures are recorded. The healthy and faulty signals from
specific transducers are compared, and deviations from normal operations are recorded for
condition monitoring purposes.
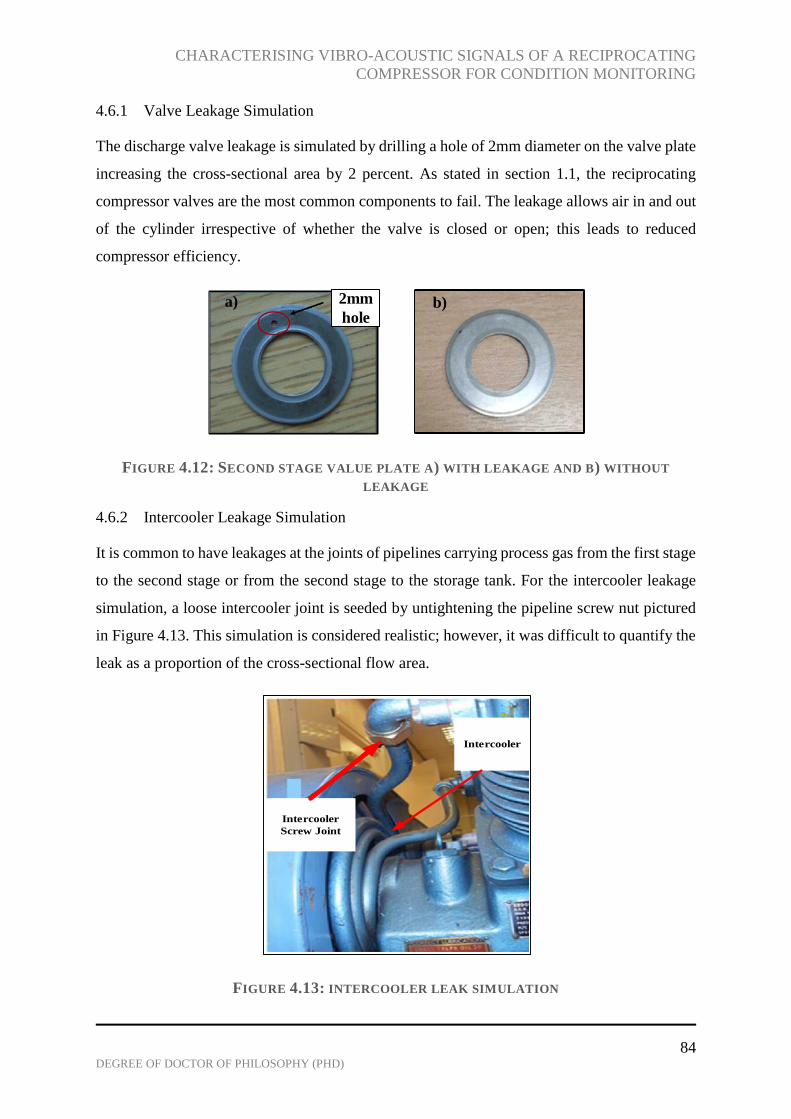
CHARACTERISING VIBRO-ACOUSTIC SIGNALS OF A RECIPROCATING
COMPRESSOR FOR CONDITION MONITORING
84 DEGREE OF DOCTOR OF PHILOSOPHY (PHD)
4.6.1 Valve Leakage Simulation
The discharge valve leakage is simulated by drilling a hole of 2mm diameter on the valve plate
increasing the cross-sectional area by 2 percent. As stated in section 1.1, the reciprocating
compressor valves are the most common components to fail. The leakage allows air in and out
of the cylinder irrespective of whether the valve is closed or open; this leads to reduced
compressor efficiency.
FIGURE 4.12: SECOND STAGE VALUE PLATE A) WITH LEAKAGE AND B) WITHOUT
LEAKAGE
4.6.2 Intercooler Leakage Simulation
It is common to have leakages at the joints of pipelines carrying process gas from the first stage
to the second stage or from the second stage to the storage tank. For the intercooler leakage
simulation, a loose intercooler joint is seeded by untightening the pipeline screw nut pictured
in Figure 4.13. This simulation is considered realistic; however, it was difficult to quantify the
leak as a proportion of the cross-sectional flow area.
FIGURE 4.13: INTERCOOLER LEAK SIMULATION
2mm
holea) b)
Intercooler
Screw Joint
Intercooler
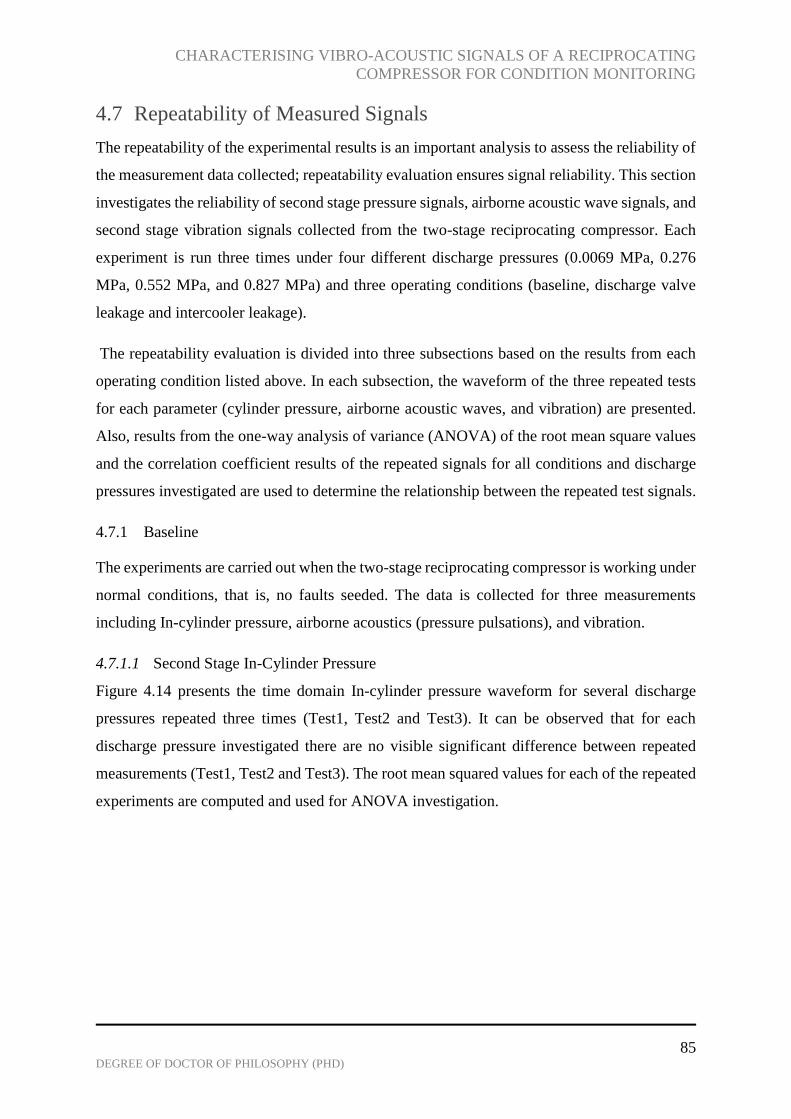
CHARACTERISING VIBRO-ACOUSTIC SIGNALS OF A RECIPROCATING
COMPRESSOR FOR CONDITION MONITORING
85 DEGREE OF DOCTOR OF PHILOSOPHY (PHD)
4.7 Repeatability of Measured Signals
The repeatability of the experimental results is an important analysis to assess the reliability of
the measurement data collected; repeatability evaluation ensures signal reliability. This section
investigates the reliability of second stage pressure signals, airborne acoustic wave signals, and
second stage vibration signals collected from the two-stage reciprocating compressor. Each
experiment is run three times under four different discharge pressures (0.0069 MPa, 0.276
MPa, 0.552 MPa, and 0.827 MPa) and three operating conditions (baseline, discharge valve
leakage and intercooler leakage).
The repeatability evaluation is divided into three subsections based on the results from each
operating condition listed above. In each subsection, the waveform of the three repeated tests
for each parameter (cylinder pressure, airborne acoustic waves, and vibration) are presented.
Also, results from the one-way analysis of variance (ANOVA) of the root mean square values
and the correlation coefficient results of the repeated signals for all conditions and discharge
pressures investigated are used to determine the relationship between the repeated test signals.
4.7.1 Baseline
The experiments are carried out when the two-stage reciprocating compressor is working under
normal conditions, that is, no faults seeded. The data is collected for three measurements
including In-cylinder pressure, airborne acoustics (pressure pulsations), and vibration.
4.7.1.1 Second Stage In-Cylinder Pressure
Figure 4.14 presents the time domain In-cylinder pressure waveform for several discharge
pressures repeated three times (Test1, Test2 and Test3). It can be observed that for each
discharge pressure investigated there are no visible significant difference between repeated
measurements (Test1, Test2 and Test3). The root mean squared values for each of the repeated
experiments are computed and used for ANOVA investigation.

CHARACTERISING VIBRO-ACOUSTIC SIGNALS OF A RECIPROCATING
COMPRESSOR FOR CONDITION MONITORING
86 DEGREE OF DOCTOR OF PHILOSOPHY (PHD)
FIGURE 4.14: REPEATED IN-CYLINDER WAVEFORMS AT SEVERAL DISCHARGE
PRESSURES
The One-way ANOVA null hypothesis states that all means are equal and analysis was done
specifying 95 per cent level of confidence, which is 5 per cent level of significance. From Table
4.3, the P-value of the ANOVA of repeated pressure tests is higher than 0.05, so the null
hypothesis is accepted. However, the ANOVA table for several discharge pressures in Table
4.4 shows that the P-value is less than 0.05; therefore, we reject the null hypothesis because at
least one of the group is different. Figure 4.15 presents the interaction plots for repeated tests
and several discharge pressures. An increasing linear trend is observed with increasing
discharge pressures; also, it can be seen that the differences between means of several discharge
pressures are significantly different with ph_BL4 (0.83 MPa) having the highest means value.
On the other hand, the differences in mean values of the repeated pressure tests are not so
different for each discharge pressure case.
TABLE 4.3: ANALYSIS OF VARIANCE FOR REPEATABILITY OF PRESSURE SIGNALS
Source Degrees of
Freedom(DF)
Adjusted (Adj)
Sum Squares
Adjusted (Adj)
Mean Squares
F-Value P-Value
a) b)
c) d)

CHARACTERISING VIBRO-ACOUSTIC SIGNALS OF A RECIPROCATING
COMPRESSOR FOR CONDITION MONITORING
87 DEGREE OF DOCTOR OF PHILOSOPHY (PHD)
Repeated
Pressure
Tests
2 0.000291 0.000145 0.00 0.997
Error 9 0.500024 0.055558
Total 11 0.500315
TABLE 4.4: ANALYSIS OF VARIANCE FOR SEVERAL DISCHARGE PRESSURES
Source DF Adj Sum Squares Adj Mean Squares F-Value P-Value
Discharge Pressure 3 0.499992 0.166664 4134.90 0.000
Error 8 0.000322 0.000040
Total 11 0.500315
FIGURE 4.15: INTERACTION PLOT OF RMS AND SEVERAL DISCHARGE PRESSURES FOR
PRESSURE SIGNALS
The Pearson correlation coefficient is computed as an additional statistical analysis to
determine the strength of the similarity between the three test signals (Test1, Test2, and Test3)
within several discharge pressures. The strength of the correlation coefficient is given by r,
which ranges from -1 to +1. Large r values means there is a strong relationship between the
signals while small r values indicates little to no relationship between signals. The significance
of the relationship is expressed in probability levels p. A small p level usually less than 5%

CHARACTERISING VIBRO-ACOUSTIC SIGNALS OF A RECIPROCATING
COMPRESSOR FOR CONDITION MONITORING
88 DEGREE OF DOCTOR OF PHILOSOPHY (PHD)
means the relationship is statistically significant while a large p level (greater than 5%) means
the correlation r is not statistically significant.
The Pearson correlation coefficient r is given as (Maurice, Kendall, & Alan, 1961):
1
1,
1
rN
i A i B
ir A B
A BA B
N
(4.2)
, ,
, ,
A A A Br
B A B B
(4.3)
where ,A B and ,A B are the mean and standard deviation of &A B , respectively, rN is the
number of pairs of the variables and A B .
TABLE 4.5: CORRELATION COEFFICIENT AND PROBABILITY LEVEL OF BASELINE TEST
PRESSURE SIGNALS
0.007MPa 0.276MPa 0.552MPa 0.83MPa
Test 1 1 1 1 1
Test 2 0.9489 0.9988 0.9999 0.9996
Test 3 0.9443 0.9983 0.9999 0.9973
Test 1 1 1 1 1
Test 2 0 0 0 0
Test 3 0 0 0 0
Baseline
Correlation Coefficients r
Probability Level p
Table 4.5 shows the correlation coefficients and the probability level of the baseline second-
stage pressure test signals (Test1, Test2, and Test3) for several discharge pressures. For a
particular discharge pressure say 0.007MPa, the r and p values are computed to establish the
relationship between the repeated test signals (Test1, Test2, and Test3). It can be concluded
that the test signals within each discharge pressure condition are very similar since the
correlation coefficient values r are close to 1 and the p values are less than 0.05. This tells us
that there is a strong linear relationship between the repeated test signals.
4.7.1.2 Airborne Acoustic (pressure pulsation) Waves
Figure 4.16 presents the time domain airborne acoustic waves in the cavity of the second-stage
cylinder at discharge pressures mentioned earlier. The experiment is repeated three times

CHARACTERISING VIBRO-ACOUSTIC SIGNALS OF A RECIPROCATING
COMPRESSOR FOR CONDITION MONITORING
89 DEGREE OF DOCTOR OF PHILOSOPHY (PHD)
(Test1, Test2, and Test3), and no significant statistical differences can be seen between
repeated tests for each discharge pressure investigated.
Table 4.6 presents the ANOVA summary for repeatability of airborne acoustic signals. The P-
value is higher than 0.05, so the null hypothesis is accepted, and the P-value for variances
between discharge pressures less than 0.05, therefore, the null hypothesis is rejected because
at least one of the group is different. The interaction plot is presented in Figure 4.17, and it can
be seen clearly from the top right subplot that means of the higher discharge pressures AA_BL3
and AA_BL4 (0.552 MPa and 0.827 MPa) are different. The variances between the lower
discharge pressures AA_BL1 and AA_BL2 (0.0069 MPa and 0.276 MPa) are not statistically
significant enough.
FIGURE 4.16: REPEATED AIRBORNE ACOUSTIC WAVE SIGNALS AT SEVERAL DISCHARGE
PRESSURES
Baseline
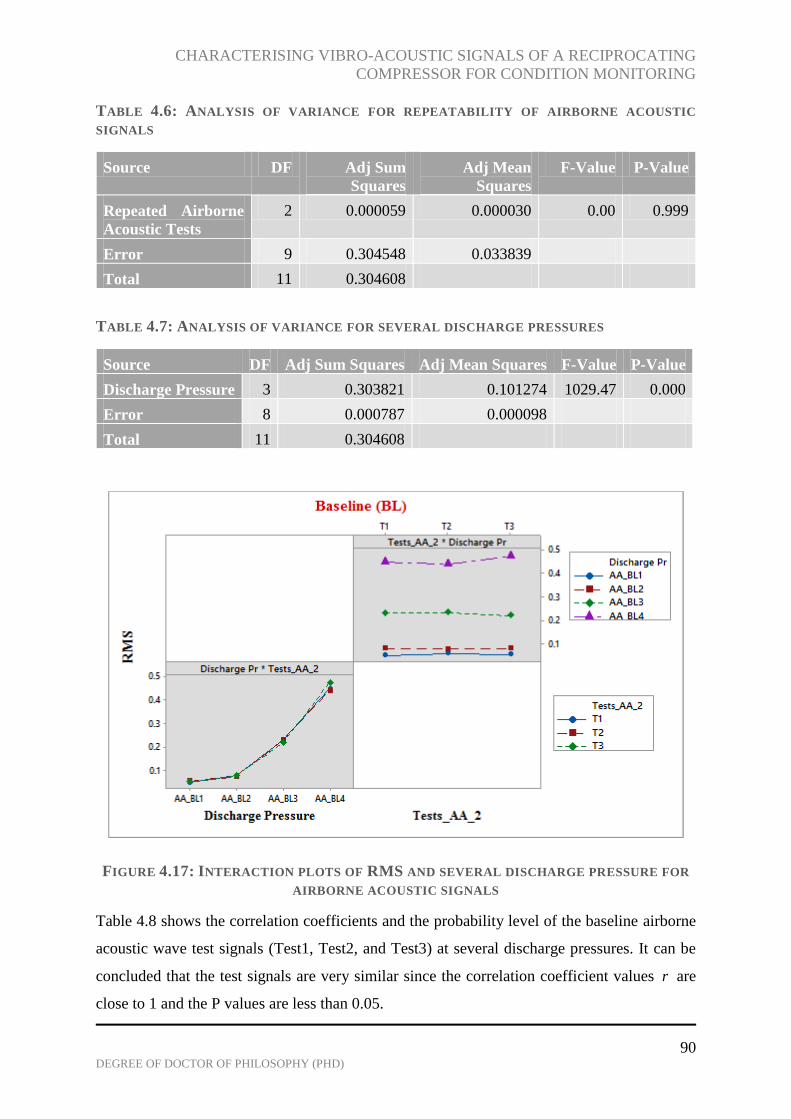
CHARACTERISING VIBRO-ACOUSTIC SIGNALS OF A RECIPROCATING
COMPRESSOR FOR CONDITION MONITORING
90 DEGREE OF DOCTOR OF PHILOSOPHY (PHD)
TABLE 4.6: ANALYSIS OF VARIANCE FOR REPEATABILITY OF AIRBORNE ACOUSTIC
SIGNALS
Source DF Adj Sum
Squares
Adj Mean
Squares
F-Value P-Value
Repeated Airborne
Acoustic Tests
2 0.000059 0.000030 0.00 0.999
Error 9 0.304548 0.033839
Total 11 0.304608
TABLE 4.7: ANALYSIS OF VARIANCE FOR SEVERAL DISCHARGE PRESSURES
Source DF Adj Sum Squares Adj Mean Squares F-Value P-Value
Discharge Pressure 3 0.303821 0.101274 1029.47 0.000
Error 8 0.000787 0.000098
Total 11 0.304608
FIGURE 4.17: INTERACTION PLOTS OF RMS AND SEVERAL DISCHARGE PRESSURE FOR
AIRBORNE ACOUSTIC SIGNALS
Table 4.8 shows the correlation coefficients and the probability level of the baseline airborne
acoustic wave test signals (Test1, Test2, and Test3) at several discharge pressures. It can be
concluded that the test signals are very similar since the correlation coefficient values r are
close to 1 and the P values are less than 0.05.

CHARACTERISING VIBRO-ACOUSTIC SIGNALS OF A RECIPROCATING
COMPRESSOR FOR CONDITION MONITORING
91 DEGREE OF DOCTOR OF PHILOSOPHY (PHD)
TABLE 4.8: CORRELATION COEFFICIENT AND PROBABILITY LEVEL OF BASELINE TEST
AIRBORNE ACOUSTIC WAVE SIGNALS
0.007MPa 0.276MPa 0.552MPa 0.83MPa
Test 1 1 1 1 1
Test 2 0.7825 0.9666 0.9866 0.9614
Test 3 0.7569 0.9325 0.9771 0.7903
Test 1 1 1 1 1
Test 2 0 0 0 0
Test 3 0 0 0 0
Correlation Coefficients r
Baseline
Probability Level p
4.7.1.3 Second Stage Vibration
Figure 4.18 presents the time-domain vibration signals from the second-stage cylinder at
discharge pressures 0.0069 MPa, 0.276 MPa, 0.552 MPa, and 0.827 MPa. The baseline
experiment is repeated three times (Test1, Test2 and Test3) to determine the reliability of the
vibration signal. It can be observed that, for each discharge pressure investigated, there are no
significant statistical differences between repeated measurements (Test1, Test2 and Test3);
however, reliable analysis of the signal is required to prove this.
The one-way ANOVA is used to verify findings. Table 4.9 presents the ANOVA summary for
repeatability of vibration signals. The P-value is higher than 0.05, so the null hypothesis is
accepted, and the P-value for variances between discharge-pressures is less than 0.05 (see Table
4.8); therefore, the null hypothesis is rejected because at least one of the discharge pressure
RMS value is different. The interaction plot is presented in Figure 4.19, and a random trend
can be seen in the RMS values at several discharge pressures, and although there is a slight
difference in the RMS values of repeated signals at Vh-BL4 (0.827 MPa), the variances are not
statistically significant enough as seen in the top right subplot.
The correlation coefficients and the probability level of the baseline vibration test signals
(Test1, Test2, and Test3) at several discharge pressures are presented in Table 4.11. From the
results, there is inconclusive evidence about the significance of the relationship between the
vibration test signals at certain discharge pressures (0.007MPa and 0.552MPa) as their p values
are greater than the significance level of 0.05.

CHARACTERISING VIBRO-ACOUSTIC SIGNALS OF A RECIPROCATING
COMPRESSOR FOR CONDITION MONITORING
92 DEGREE OF DOCTOR OF PHILOSOPHY (PHD)
FIGURE 4.18: REPEATED VIBRATION SIGNALS AT SEVERAL DISCHARGE PRESSURES
TABLE 4.9: ANALYSIS OF VARIANCE FOR REPEATABILITY OF VIBRATION SIGNALS
Source DF Adj Sum
Squares
Adj Mean
Squares
F-Value P-Value
Repeated Vibration
Tests
2 0.000167 0.000083 0.06 0.946
Error 9 0.013463 0.001496
Total 11 0.013630
TABLE 4.10: ANALYSIS OF VARIANCE FOR SEVERAL DISCHARGE PRESSURE
Source DF Adj Sum Squares Adj Mean Squares F-Value P-Value
Discharge pressure 3 0.013060 0.004353 61.06 0.000
Error 8 0.000570 0.000071
Total 11 0.013630
a) b)
c) d)
Baseline

CHARACTERISING VIBRO-ACOUSTIC SIGNALS OF A RECIPROCATING
COMPRESSOR FOR CONDITION MONITORING
93 DEGREE OF DOCTOR OF PHILOSOPHY (PHD)
FIGURE 4.19: INTERACTION PLOTS OF RMS AND SEVERAL DISCHARGE PRESSURES FOR
VIBRATION SIGNALS
TABLE 4.11: CORRELATION COEFFICIENT AND PROBABILITY LEVEL OF BASELINE TEST
VIBRATION SIGNALS
0.007MPa 0.276MPa 0.552MPa 0.83MPa
Test 1 1 1 1 1
Test 2 -0.0036 0.0595 0.0064 0.00463
Test 3 -0.0039 -0.0098 -0.0118 0.00547
Test 1 1 1 1 1
Test 2 0.4649 0 0.2007 0
Test 3 0.4356 0.0486 0.0179 0
Correlation Coefficients r
Baseline
Probability Level p
4.7.2 Discharge Valve Leakage
The experiments are carried out when there is a discharge valve leakage seeded on the two-
stage reciprocating compressor. The data is collected for three measurements including In-
cylinder pressure, airborne acoustics, and vibration.
4.7.2.1 Second Stage In-Cylinder Pressure
Figure 4.20 presents the time domain In-cylinder pressure waveform for several discharge
pressures under the discharge valve fault condition. The experiment is repeated three times

CHARACTERISING VIBRO-ACOUSTIC SIGNALS OF A RECIPROCATING
COMPRESSOR FOR CONDITION MONITORING
94 DEGREE OF DOCTOR OF PHILOSOPHY (PHD)
(Test1, Test2 and Test3) to analyse the repeatability of the signal. Some slight variations are
observed in the waveform representation during the discharge process. However, an analysis
of variance (ANOVA) of the repeated tests for each discharge pressure is computed for robust
conclusions.
Table 4.12 presents the ANOVA summary for repeatability of In-cylinder pressure signals. The
P-value is higher than 0.05, which means there is no significant statistical difference in the
repeated tests, so the null hypothesis is accepted. The P-value for variances between discharge
pressures is less than 0.05, which implies that the RMS values of the discharge pressures are
significantly different (see Figure 4.21).
FIGURE 4.20: REPEATED IN-CYLINDER PRESSURE WAVEFORMS AT SEVERAL
DISCHARGE PRESSURE
Discharge Valve Leakage Fault

CHARACTERISING VIBRO-ACOUSTIC SIGNALS OF A RECIPROCATING
COMPRESSOR FOR CONDITION MONITORING
95 DEGREE OF DOCTOR OF PHILOSOPHY (PHD)
TABLE 4.12: ANALYSIS OF VARIANCE FOR REPEATABILITY OF IN-CYLINDER PRESSURE
SIGNAL UNDER DISCHARGE VALVE FAULT CONDITION
Source DF Adj Sum
Squares
Adj Mean
Squares
F-Value P-
Value
Repeated (DVL)
Pressure Tests
2 0.000291 0.000145 0.00 0.997
Error 9 0.500024 0.055558
Total 11 0.500315
TABLE 4.13: ANALYSIS OF VARIANCE FOR SEVERAL DISCHARGE PRESSURES UNDER
DISCHARGE VALVE FAULT CONDITION
Source DF Adj Sum
Squares
Adj Mean
Squares
F-Value P-Value
Discharge Pressure 3 0.556493 0.185498 1181.82 0.000
Error 8 0.001256 0.000157
Total 11 0.557749
FIGURE 4.21: INTERACTION PLOTS OF THE RMS VALUES FOR SEVERAL DISCHARGE
PRESSURES AND REPEATED PRESSURE SIGNALS
Table 4.14 shows the correlation coefficients and the probability level of the discharge valve
leakage fault test signals (Test1, Test2, and Test3) at several discharge pressures. It can be

CHARACTERISING VIBRO-ACOUSTIC SIGNALS OF A RECIPROCATING
COMPRESSOR FOR CONDITION MONITORING
96 DEGREE OF DOCTOR OF PHILOSOPHY (PHD)
concluded from the results that the test signals are very similar since the correlation coefficient
values of Test 2 and 3 are close to 1 and the P values are less than 0.05.
TABLE 4.14: CORRELATION COEFFICIENT AND PROBABILITY LEVEL OF BASELINE TEST
PRESSURE SIGNALS
0.007MPa 0.276MPa 0.552MPa 0.83MPa
Test 1 1 1 1 1
Test 2 0.8959 0.9957 0.9991 0.9978
Test 3 0.8647 0.9807 0.9955 0.9975
Test 1 1 1 1 1
Test 2 0 0 0 0
Test 3 0 0 0 0
Discharge Valve Leakage (DVL)
Probability Level p
Correlation Coefficients r
4.7.2.2 Airborne Acoustic Waves
Figure 4.22 presents the time domain airborne acoustic waves in the cavity of the second-stage
cylinder for several discharge pressures under leaking discharge valve condition. The
experiment is repeated three times (Test1, Test2, and Test3), and from the subplots, it is quite
difficult to see the differences between the three repeated tests for all discharge pressure cases.
Again, the ANOVA test is computed and the summary of the investigations are presented in
Tables 4.15 and 4.16.
Table 4.15 shows a P-value higher than 0.05, which means there are no significant differences
in the repeated tests, so the null hypothesis is accepted. The P-value for variances between
discharge pressures is less than 0.05, which implies that the RMS values of the discharge
pressures are significantly different (see Table 4.16).
The RMS interaction plots between several discharge pressures and the repeated airborne
acoustic signals are presented in Figure 4.23. The RMS values of the discharge pressure subplot
show an increasing linear trend as the discharge pressure increases (AA_DVL1, AA_DVL2,
AA_DVL3, and AA_DVL4, which represents 0.0069 MPa, 0.276 MPa, 0.552 MPa and 0.827
MPa respectively). The variances between the RMS values of the repeated signals show no
significant statistical difference (see the top right subplot).
Table 4.17 shows the correlation coefficients and the probability level of the discharge valve
leakage airborne acoustic wave test signals (Test1, Test2, and Test3) at several discharge

CHARACTERISING VIBRO-ACOUSTIC SIGNALS OF A RECIPROCATING
COMPRESSOR FOR CONDITION MONITORING
97 DEGREE OF DOCTOR OF PHILOSOPHY (PHD)
pressures. It can be concluded that the test signals are very similar since the correlation
coefficient values r are close to 1 and the P values are less than 0.05.
FIGURE 4.22: REPEATED AIRBORNE ACOUSTIC WAVEFORMS AT SEVERAL DISCHARGE
PRESSURES
TABLE 4.15: ANALYSIS OF VARIANCE FOR REPEATABILITY OF AIRBORNE ACOUSTIC
SIGNALS UNDER DISCHARGE VALVE FAULT CONDITION
Source DF Adj Sum
Squares
Adj Mean
Squares
F-Value P-Value
Repeated (DVL)
Airborne Acoustic Tests
2 0.000127 0.000064 0.01 0.990
Error 9 0.057223 0.006358
Total 11 0.057350
Discharge Valve Leakage Fault

CHARACTERISING VIBRO-ACOUSTIC SIGNALS OF A RECIPROCATING
COMPRESSOR FOR CONDITION MONITORING
98 DEGREE OF DOCTOR OF PHILOSOPHY (PHD)
TABLE 4.16: ANALYSIS OF VARIANCE FOR SEVERAL DISCHARGE PRESSURES UNDER
DISCHARGE VALVE FAULT CONDITION
Source DF Adj Sum
Squares
Adj Mean
Squares
F-Value P-Value
Discharge Pressure 3 0.054272 0.018091 47.02 0.000
Error 8 0.003078 0.000385
Total 11 0.057350
FIGURE 4.23: INTERACTION PLOTS OF THE RMS VALUES FOR SEVERAL DISCHARGE
PRESSURES AND REPEATED AIRBORNE ACOUSTIC SIGNALS
TABLE 4.17: CORRELATION COEFFICIENT AND PROBABILITY LEVEL OF DISCHARGE
VALVE LEAKAGE TEST AIRBORNE ACOUSTIC SIGNALS
0.007MPa 0.276MPa 0.552MPa 0.83MPa
Test 1 1 1 1 1
Test 2 0.6669 0.8145 0.9394 0.7875
Test 3 0.5179 0.4776 0.7708 0.7861
Test 1 1 1 1 1
Test 2 0 0 0 0
Test 3 0 0 0 0
Correlation Coefficients r
Discharge Valve Leakage (DVL)
Probability Level p
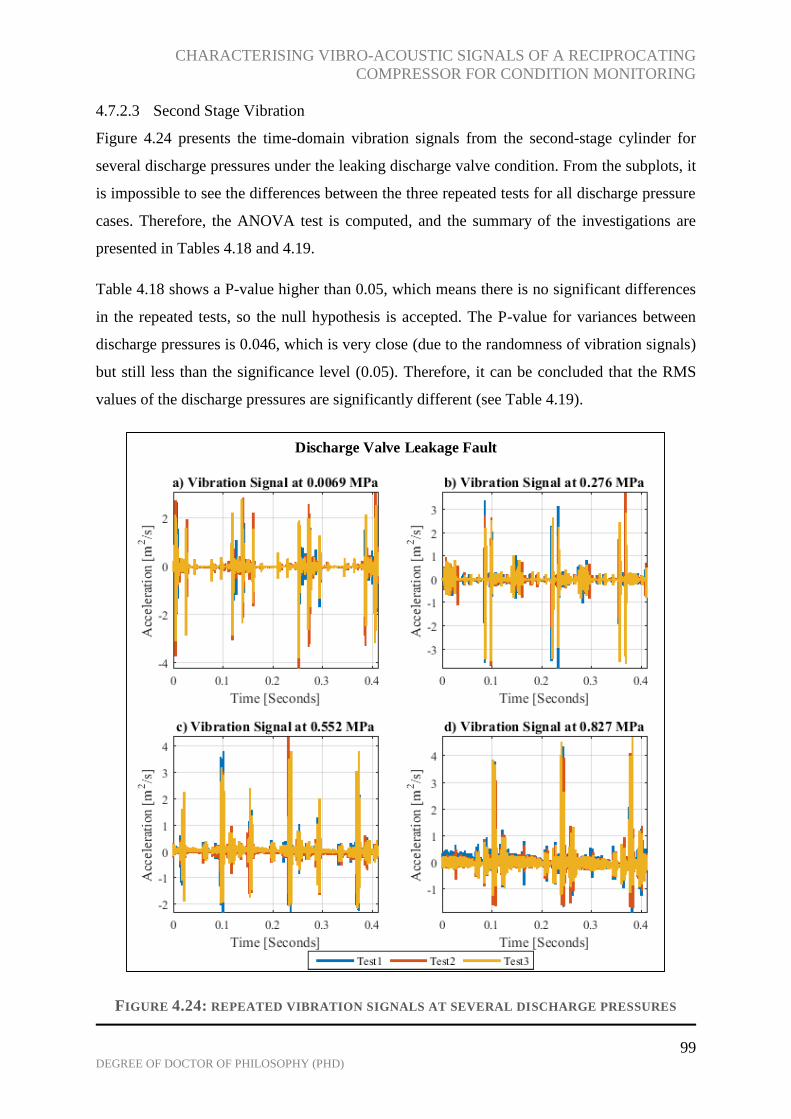
CHARACTERISING VIBRO-ACOUSTIC SIGNALS OF A RECIPROCATING
COMPRESSOR FOR CONDITION MONITORING
99 DEGREE OF DOCTOR OF PHILOSOPHY (PHD)
4.7.2.3 Second Stage Vibration
Figure 4.24 presents the time-domain vibration signals from the second-stage cylinder for
several discharge pressures under the leaking discharge valve condition. From the subplots, it
is impossible to see the differences between the three repeated tests for all discharge pressure
cases. Therefore, the ANOVA test is computed, and the summary of the investigations are
presented in Tables 4.18 and 4.19.
Table 4.18 shows a P-value higher than 0.05, which means there is no significant differences
in the repeated tests, so the null hypothesis is accepted. The P-value for variances between
discharge pressures is 0.046, which is very close (due to the randomness of vibration signals)
but still less than the significance level (0.05). Therefore, it can be concluded that the RMS
values of the discharge pressures are significantly different (see Table 4.19).
FIGURE 4.24: REPEATED VIBRATION SIGNALS AT SEVERAL DISCHARGE PRESSURES
Discharge Valve Leakage Fault
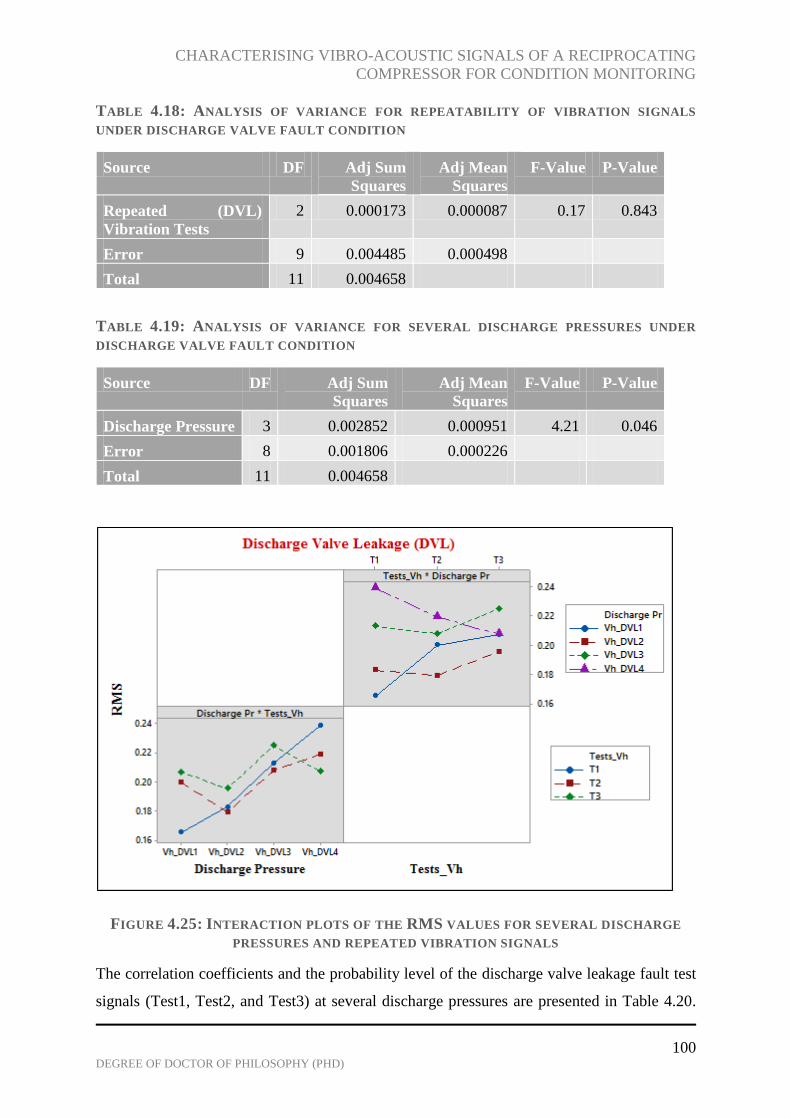
CHARACTERISING VIBRO-ACOUSTIC SIGNALS OF A RECIPROCATING
COMPRESSOR FOR CONDITION MONITORING
100 DEGREE OF DOCTOR OF PHILOSOPHY (PHD)
TABLE 4.18: ANALYSIS OF VARIANCE FOR REPEATABILITY OF VIBRATION SIGNALS
UNDER DISCHARGE VALVE FAULT CONDITION
Source DF Adj Sum
Squares
Adj Mean
Squares
F-Value P-Value
Repeated (DVL)
Vibration Tests
2 0.000173 0.000087 0.17 0.843
Error 9 0.004485 0.000498
Total 11 0.004658
TABLE 4.19: ANALYSIS OF VARIANCE FOR SEVERAL DISCHARGE PRESSURES UNDER
DISCHARGE VALVE FAULT CONDITION
Source DF Adj Sum
Squares
Adj Mean
Squares
F-Value P-Value
Discharge Pressure 3 0.002852 0.000951 4.21 0.046
Error 8 0.001806 0.000226
Total 11 0.004658
FIGURE 4.25: INTERACTION PLOTS OF THE RMS VALUES FOR SEVERAL DISCHARGE
PRESSURES AND REPEATED VIBRATION SIGNALS
The correlation coefficients and the probability level of the discharge valve leakage fault test
signals (Test1, Test2, and Test3) at several discharge pressures are presented in Table 4.20.
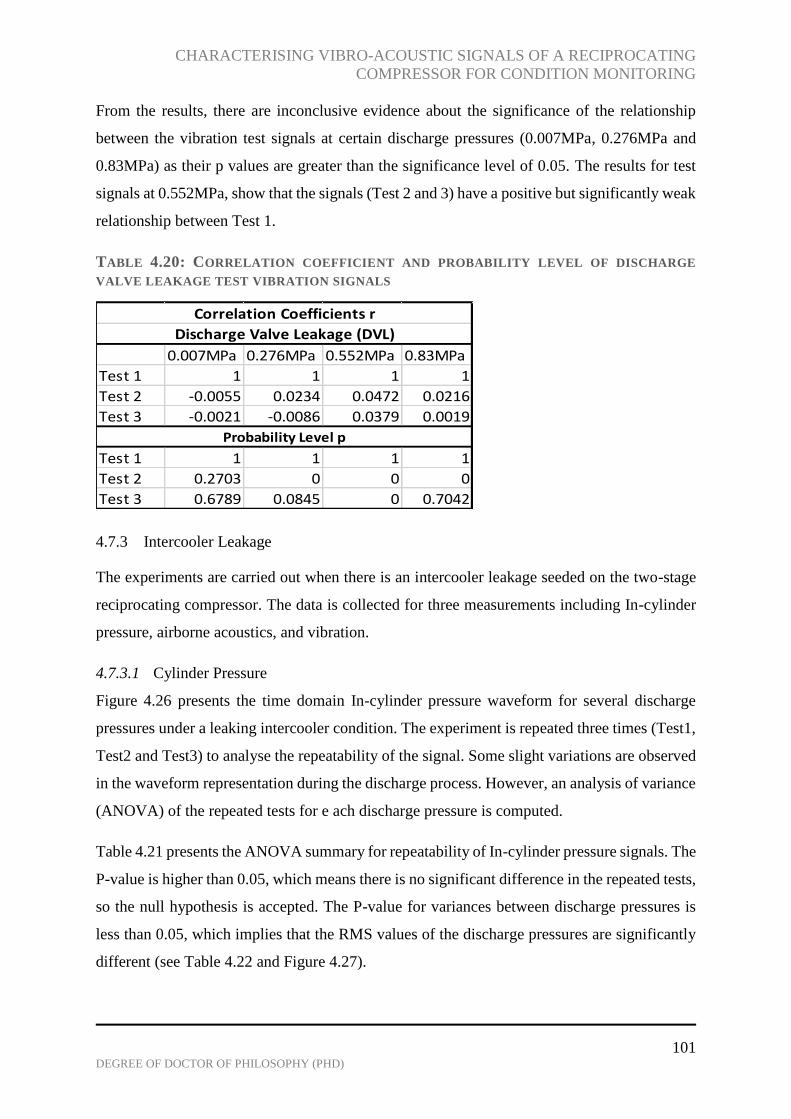
CHARACTERISING VIBRO-ACOUSTIC SIGNALS OF A RECIPROCATING
COMPRESSOR FOR CONDITION MONITORING
101 DEGREE OF DOCTOR OF PHILOSOPHY (PHD)
From the results, there are inconclusive evidence about the significance of the relationship
between the vibration test signals at certain discharge pressures (0.007MPa, 0.276MPa and
0.83MPa) as their p values are greater than the significance level of 0.05. The results for test
signals at 0.552MPa, show that the signals (Test 2 and 3) have a positive but significantly weak
relationship between Test 1.
TABLE 4.20: CORRELATION COEFFICIENT AND PROBABILITY LEVEL OF DISCHARGE
VALVE LEAKAGE TEST VIBRATION SIGNALS
0.007MPa 0.276MPa 0.552MPa 0.83MPa
Test 1 1 1 1 1
Test 2 -0.0055 0.0234 0.0472 0.0216
Test 3 -0.0021 -0.0086 0.0379 0.0019
Test 1 1 1 1 1
Test 2 0.2703 0 0 0
Test 3 0.6789 0.0845 0 0.7042
Correlation Coefficients r
Discharge Valve Leakage (DVL)
Probability Level p
4.7.3 Intercooler Leakage
The experiments are carried out when there is an intercooler leakage seeded on the two-stage
reciprocating compressor. The data is collected for three measurements including In-cylinder
pressure, airborne acoustics, and vibration.
4.7.3.1 Cylinder Pressure
Figure 4.26 presents the time domain In-cylinder pressure waveform for several discharge
pressures under a leaking intercooler condition. The experiment is repeated three times (Test1,
Test2 and Test3) to analyse the repeatability of the signal. Some slight variations are observed
in the waveform representation during the discharge process. However, an analysis of variance
(ANOVA) of the repeated tests for e ach discharge pressure is computed.
Table 4.21 presents the ANOVA summary for repeatability of In-cylinder pressure signals. The
P-value is higher than 0.05, which means there is no significant difference in the repeated tests,
so the null hypothesis is accepted. The P-value for variances between discharge pressures is
less than 0.05, which implies that the RMS values of the discharge pressures are significantly
different (see Table 4.22 and Figure 4.27).

CHARACTERISING VIBRO-ACOUSTIC SIGNALS OF A RECIPROCATING
COMPRESSOR FOR CONDITION MONITORING
102 DEGREE OF DOCTOR OF PHILOSOPHY (PHD)
FIGURE 4.26: REPEATED PRESSURE SIGNALS AT SEVERAL DISCHARGE PRESSURES
TABLE 4.21: ANALYSIS OF VARIANCE FOR REPEATABILITY OF IN-CYLINDER PRESSURE
SIGNALS UNDER INTERCOOLER FAULT CONDITION
Source DF Adj Sum
Squares
Adj Mean
Squares
F-Value P-Value
Repeated (ICL)
Pressure Tests
2 0.000554 0.000277 0.00 0.995
Error 9 0.498331 0.055370
Total 11 0.498885
TABLE 4.22: ANALYSIS OF VARIANCE FOR SEVERAL DISCHARGE PRESURES UNDER
INTERCOOLER FAULT CONDITION
Source DF Adj Sum
Squares
Adj Mean
Squares
F-Value P-Value
Discharge Pressure 3 0.498327 0.166109 2382.41 0.000
Error 8 0.000558 0.000070
Total 11 0.498885
a) b)
c) d)
Intercooler leakage Fault
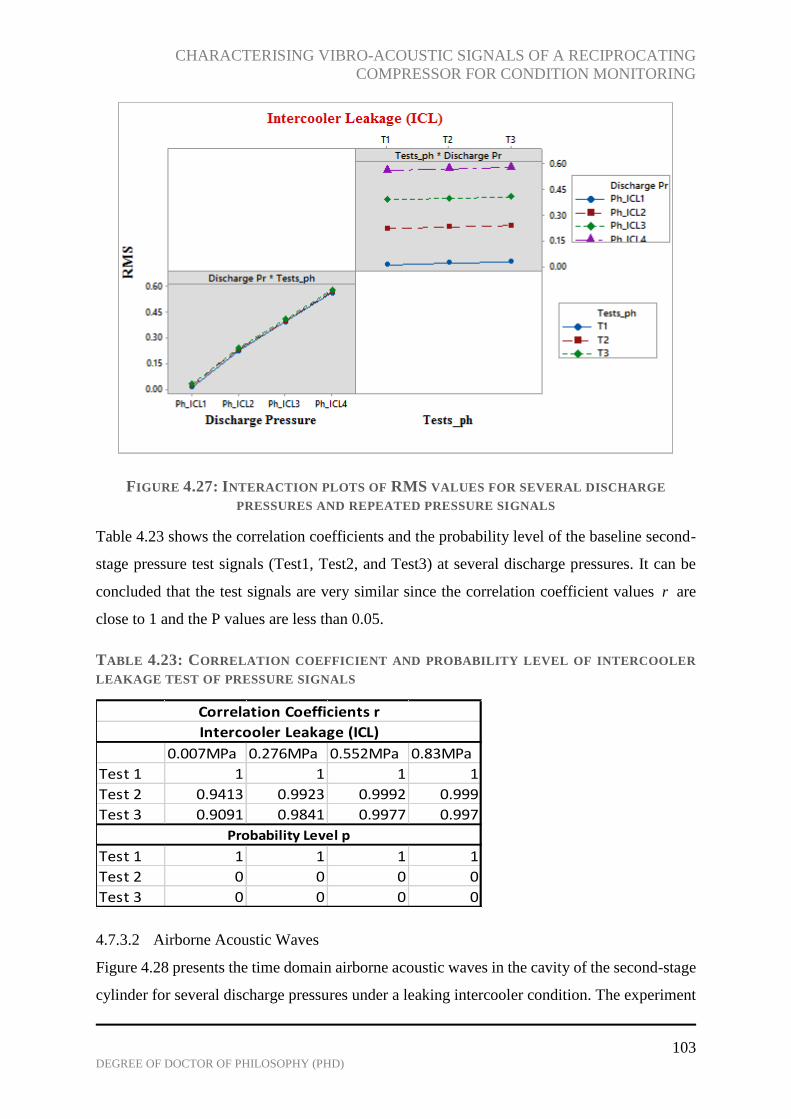
CHARACTERISING VIBRO-ACOUSTIC SIGNALS OF A RECIPROCATING
COMPRESSOR FOR CONDITION MONITORING
103 DEGREE OF DOCTOR OF PHILOSOPHY (PHD)
FIGURE 4.27: INTERACTION PLOTS OF RMS VALUES FOR SEVERAL DISCHARGE
PRESSURES AND REPEATED PRESSURE SIGNALS
Table 4.23 shows the correlation coefficients and the probability level of the baseline second-
stage pressure test signals (Test1, Test2, and Test3) at several discharge pressures. It can be
concluded that the test signals are very similar since the correlation coefficient values r are
close to 1 and the P values are less than 0.05.
TABLE 4.23: CORRELATION COEFFICIENT AND PROBABILITY LEVEL OF INTERCOOLER
LEAKAGE TEST OF PRESSURE SIGNALS
0.007MPa 0.276MPa 0.552MPa 0.83MPa
Test 1 1 1 1 1
Test 2 0.9413 0.9923 0.9992 0.999
Test 3 0.9091 0.9841 0.9977 0.997
Test 1 1 1 1 1
Test 2 0 0 0 0
Test 3 0 0 0 0
Correlation Coefficients r
Intercooler Leakage (ICL)
Probability Level p
4.7.3.2 Airborne Acoustic Waves
Figure 4.28 presents the time domain airborne acoustic waves in the cavity of the second-stage
cylinder for several discharge pressures under a leaking intercooler condition. The experiment

CHARACTERISING VIBRO-ACOUSTIC SIGNALS OF A RECIPROCATING
COMPRESSOR FOR CONDITION MONITORING
104 DEGREE OF DOCTOR OF PHILOSOPHY (PHD)
is repeated three times (Test1, Test2, and Test3). From the subplots, it is difficult to see the
differences between the repeated tests in all discharge pressure cases. Again, the ANOVA test
is computed, and the summary of the investigations are presented in Tables 4.24 and 4.25.
From the two tables it can be concluded that there are no significant statistical differences in
the repeated tests, and the RMS values of the discharge pressures are significantly different.
The interaction plots in Figure 4.29 show the differences.
FIGURE 4.28: REPEATED AIRBORNE ACOUSTIC SIGNALS AT SEVERAL DISCHARGE
PRESSURES
TABLE 4.24: ANALYSIS OF VARIANCE FOR REPEATABILITY OF AIRBORNE ACOUSTIC
SIGNALS UNDER INTERCOOLER FAULT CONDITION
Source DF Adj Sum
Squares
Adj Mean
Squares
F-Value P-Value
Repeated (ICL)
Airborne Acoustic Tests
2 0.000030 0.000015 0.00 1.000
Intercooler Leakage Fault
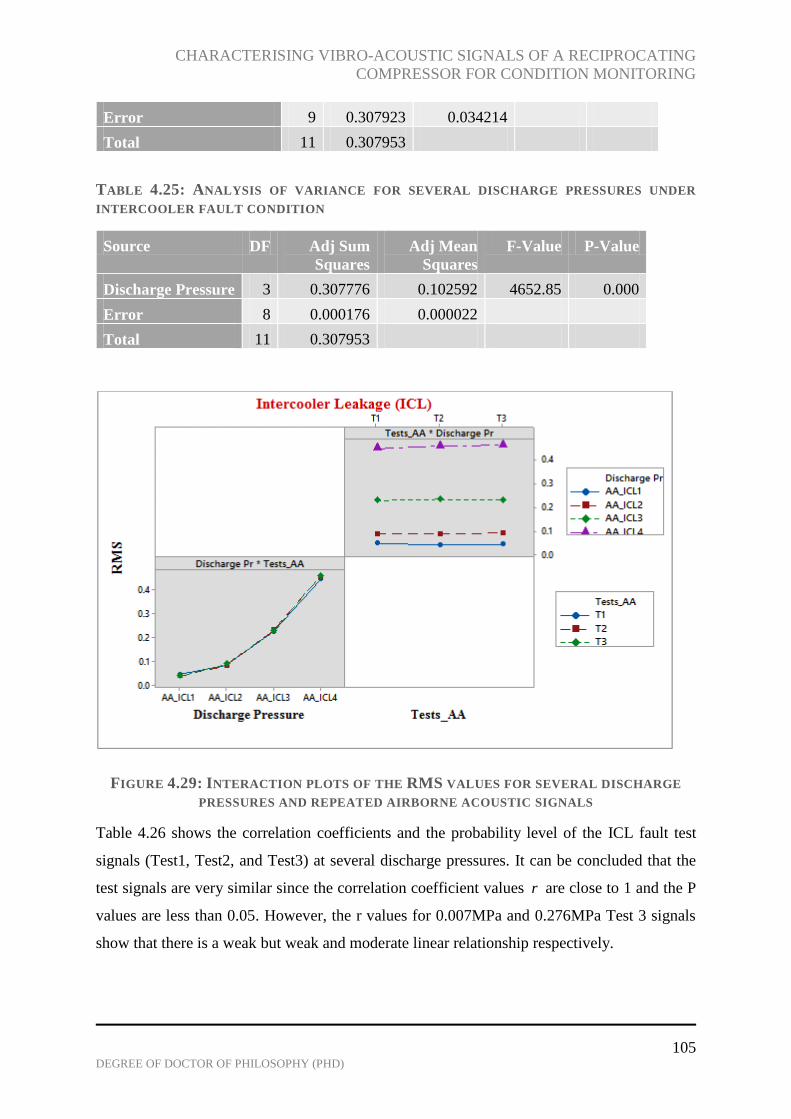
CHARACTERISING VIBRO-ACOUSTIC SIGNALS OF A RECIPROCATING
COMPRESSOR FOR CONDITION MONITORING
105 DEGREE OF DOCTOR OF PHILOSOPHY (PHD)
Error 9 0.307923 0.034214
Total 11 0.307953
TABLE 4.25: ANALYSIS OF VARIANCE FOR SEVERAL DISCHARGE PRESSURES UNDER
INTERCOOLER FAULT CONDITION
Source DF Adj Sum
Squares
Adj Mean
Squares
F-Value P-Value
Discharge Pressure 3 0.307776 0.102592 4652.85 0.000
Error 8 0.000176 0.000022
Total 11 0.307953
FIGURE 4.29: INTERACTION PLOTS OF THE RMS VALUES FOR SEVERAL DISCHARGE
PRESSURES AND REPEATED AIRBORNE ACOUSTIC SIGNALS
Table 4.26 shows the correlation coefficients and the probability level of the ICL fault test
signals (Test1, Test2, and Test3) at several discharge pressures. It can be concluded that the
test signals are very similar since the correlation coefficient values r are close to 1 and the P
values are less than 0.05. However, the r values for 0.007MPa and 0.276MPa Test 3 signals
show that there is a weak but weak and moderate linear relationship respectively.

CHARACTERISING VIBRO-ACOUSTIC SIGNALS OF A RECIPROCATING
COMPRESSOR FOR CONDITION MONITORING
106 DEGREE OF DOCTOR OF PHILOSOPHY (PHD)
TABLE 4.26: CORRELATION COEFFICIENT AND PROBABILITY LEVEL OF INTERCOOLER
LEAKAGE TEST OF AIRBORNE ACOUSTIC WAVE SIGNALS
0.007MPa 0.276MPa 0.552MPa 0.83MPa
Test 1 1 1 1 1
Test 2 0.6113 0.7705 0.9452 0.9933
Test 3 0.1846 0.5009 0.8156 0.7886
Test 1 1 1 1 1
Test 2 0 0 0 0
Test 3 0 0 0 0
Correlation Coefficients r
Intercooler Leakage (ICL)
Probability Level p
4.7.3.3 Surface Vibration
Figure 4.30 presents the time-domain vibration signals from the second-stage cylinder for
several discharge pressures under a leaking intercooler condition. Again, it is difficult to assess
the repeatability of the signal by merely observing the signatures. Therefore, the ANOVA test
is computed, and the summary of the investigations are presented in Tables 4.26 and 4.27.
From the two tables, it can be concluded that there are no significant differences in the repeated
tests since the P-value is higher than 0.05 and the RMS values of the discharge pressures are
significantly different as the P-value is zero. The interaction plot in Figure 4.31 shows the
relationship between the RMS values of the repeated tests and all discharge pressures
investigated.
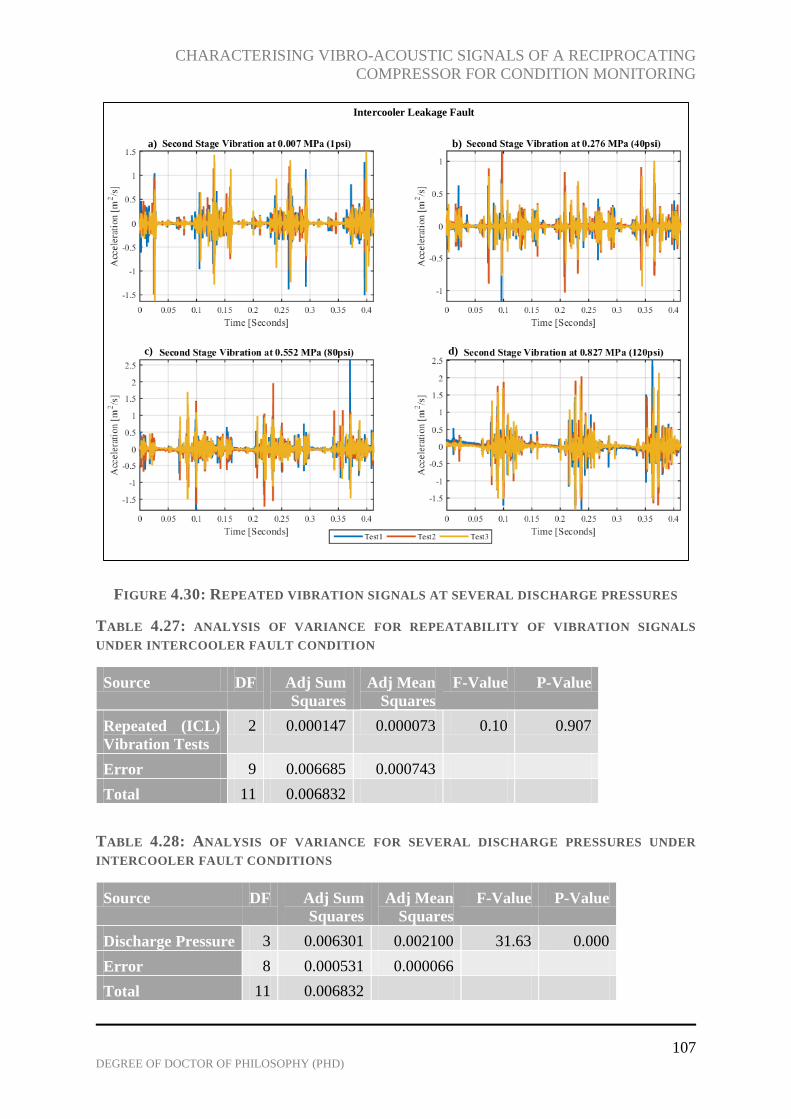
CHARACTERISING VIBRO-ACOUSTIC SIGNALS OF A RECIPROCATING
COMPRESSOR FOR CONDITION MONITORING
107 DEGREE OF DOCTOR OF PHILOSOPHY (PHD)
FIGURE 4.30: REPEATED VIBRATION SIGNALS AT SEVERAL DISCHARGE PRESSURES
TABLE 4.27: ANALYSIS OF VARIANCE FOR REPEATABILITY OF VIBRATION SIGNALS
UNDER INTERCOOLER FAULT CONDITION
Source DF Adj Sum
Squares
Adj Mean
Squares
F-Value P-Value
Repeated (ICL)
Vibration Tests
2 0.000147 0.000073 0.10 0.907
Error 9 0.006685 0.000743
Total 11 0.006832
TABLE 4.28: ANALYSIS OF VARIANCE FOR SEVERAL DISCHARGE PRESSURES UNDER
INTERCOOLER FAULT CONDITIONS
Source DF Adj Sum
Squares
Adj Mean
Squares
F-Value P-Value
Discharge Pressure 3 0.006301 0.002100 31.63 0.000
Error 8 0.000531 0.000066
Total 11 0.006832
Intercooler Leakage Fault
a) b)
c) d)

CHARACTERISING VIBRO-ACOUSTIC SIGNALS OF A RECIPROCATING
COMPRESSOR FOR CONDITION MONITORING
108 DEGREE OF DOCTOR OF PHILOSOPHY (PHD)
FIGURE 4.31: INTERACTION PLOTS OF THE RMS VALUES FOR SEVERAL DISCHARGE
PRESSURES AND REPEATED VIBRATION SIGNALS
Table 4.29 shows the correlation coefficients and the probability level of the ICL fault vibration
test signals (Test1, Test2, and Test3) at several discharge pressures. It can be concluded from
the results that there are inconclusive evidence about the significance of the relationship
between the vibration test signals at all discharge pressures except those whose r values are
written in red.
TABLE 4.29: CORRELATION COEFFICIENT AND PROBABILITY LEVEL OF INTERCOOLER
LEAKAGE TEST OF VIBRATION SIGNALS
0.007MPa 0.276MPa 0.552MPa 0.83MPa
Test 1 1 1 1 1
Test 2 -0.0074 0.0041 -0.0195 0.0236
Test 3 0.0031 -0.0029 0.0033 0.0215
Test 1 1 1 1 1
Test 2 0.1354 0.4047 0.0001 0
Test 3 0.538 0.563 0.5012 0
Correlation Coefficients r
Intercooler Leakage (ICL)
Probability Level p

CHARACTERISING VIBRO-ACOUSTIC SIGNALS OF A RECIPROCATING
COMPRESSOR FOR CONDITION MONITORING
109 DEGREE OF DOCTOR OF PHILOSOPHY (PHD)
4.7.4 Summary
To ensure that correct results are obtained every time an experiment is run, the repeatability of
the signals for the three measurement signals including In-cylinder pressure, airborne acoustics
(pressure pulsations), and surface vibration under healthy and fault conditions for several
discharge pressures are analysed.
One-way analysis of variance (ANOVA) is used to check if the differences in RMS values of
repeated signals and several discharge pressures are significantly substantial. Findings showed
that there were no significant changes in the RMS values of the repeated signals for all
measurements and conditions. In addition, the differences in RMS values of several discharge
pressures were investigated for all measurements and conditions. The P-values were zero,
strongly indicating that there is at least one or two discharge pressure signals are different as
expected.

CHARACTERISING VIBRO-ACOUSTIC SIGNALS OF A RECIPROCATING
COMPRESSOR FOR CONDITION MONITORING
110 DEGREE OF DOCTOR OF PHILOSOPHY (PHD)
CHAPTER FIVE
5 DYNAMIC MODELLING OF A DOUBLE-STAGE,
SINGLE-ACTING RECIPROCATING COMPRESSOR
The chapter presents various mathematical models developed for the simulation of the double-
stage, single-acting reciprocating compressor used for this research. A number of physical
processes including: mechanical, thermal, flow and electric-magnetic processes involved with
the compressor have been redeveloped to fully understand the dynamics of the machine and
corresponding fault models are developed simultaneously. The model developed based on the
first principles consists of three main equations: crankshaft motion, two cylinder pressure
equations and, four valve motion equations. In addition, the second-stage discharge chamber
pressure is incorporated into the model.
CHARACTERISING VIBRO-ACOUSTIC SIGNALS OF A RECIPROCATING
COMPRESSOR FOR CONDITION MONITORING
111 DEGREE OF DOCTOR OF PHILOSOPHY (PHD)
5.1 Introduction
The main principle of the reciprocating compressors’ operation is the conversion of mechanical
rotational motion of the crankshaft into linear motion. The crankshaft is powered by an
electrical motor, which translates this motion by means of the connection rod to linear motion
as illustrated in Figure 5.1. The connecting rod moves the piston linearly within the cylinder
bore to deliver the desired high-pressure air. The piston proceeds downwards from top dead
centre (TDC) to bottom dead centre (BDC), pressure decreases, and the suction valve opens by
means of pressure difference over the valve head. Furthermore, just as the piston reaches BDC
and starts to return to TDC, air in the cylinder is compressed. Once the in-cylinder pressure is
greater than the plenum pressure (pressure after the valve), the valve is forced open allowing
high-pressure air out of the cylinder. The process described above forms the foundation for the
model simulation of in-cylinder pressure, discharge chamber pressure and vibration of the
cylinders.
Reciprocating compressors are high priced and complicated machines, and understanding the
dynamic process is paramount for design modification, and fault prediction. Modelling of the
reciprocating compressor has received a great deal of research attention over the years. Much
of this fame is attributed to the prospects of numerical models being used for real time
applications such as machine condition and fault diagnostics. In addition, some underlying
benefits include improved machine efficiency, reduced maintenance cost and improved
machine reliability.
This chapter describes the developed mathematical model of several distinct but interactive
components of the reciprocating compressor such as the crank mechanism, the cylinder, and
the valve and discharge systems of double-stage single-acting reciprocating compressor and
effects of specific faults on the compressor. This model has previously been developed by
fellow scholar Elhaj Mohamed in 2005 (Elhaj M. A., 2005), however, as an addition, the
discharge chamber (plenum) is incorporated into the already existing model to simulate the
effects of gas pulsations on the system.
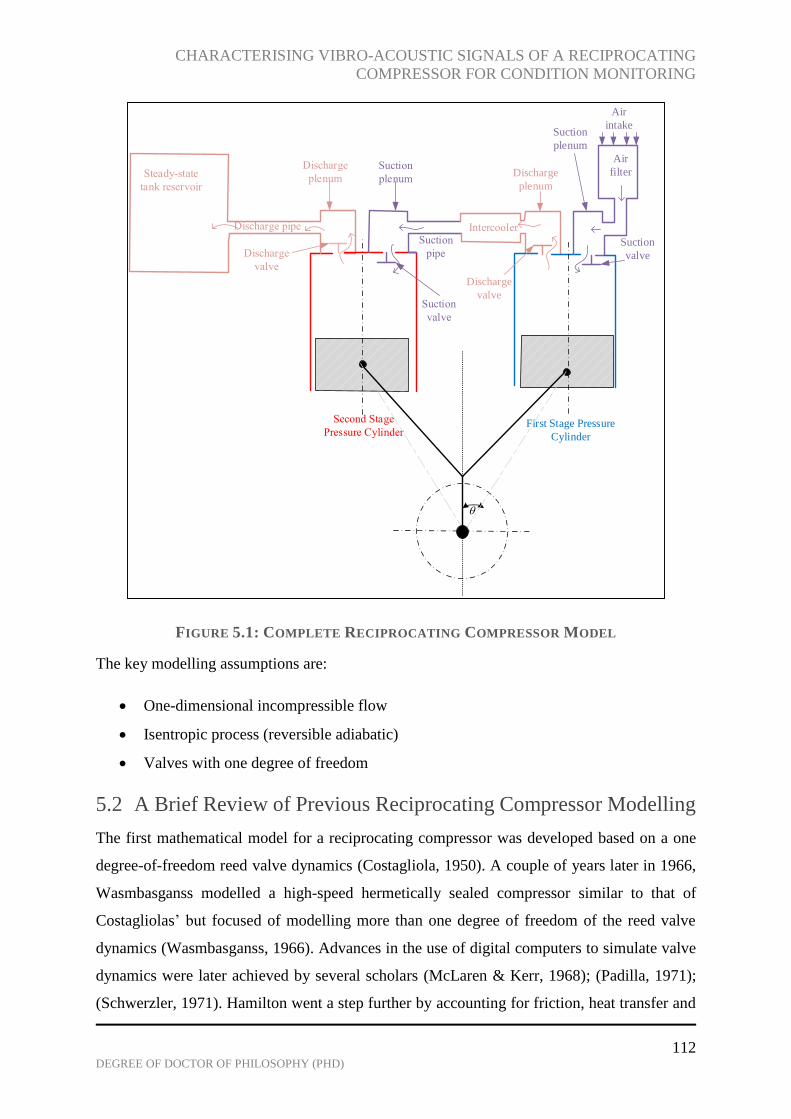
CHARACTERISING VIBRO-ACOUSTIC SIGNALS OF A RECIPROCATING
COMPRESSOR FOR CONDITION MONITORING
112 DEGREE OF DOCTOR OF PHILOSOPHY (PHD)
FIGURE 5.1: COMPLETE RECIPROCATING COMPRESSOR MODEL
The key modelling assumptions are:
One-dimensional incompressible flow
Isentropic process (reversible adiabatic)
Valves with one degree of freedom
5.2 A Brief Review of Previous Reciprocating Compressor Modelling
The first mathematical model for a reciprocating compressor was developed based on a one
degree-of-freedom reed valve dynamics (Costagliola, 1950). A couple of years later in 1966,
Wasmbasganss modelled a high-speed hermetically sealed compressor similar to that of
Costagliolas’ but focused of modelling more than one degree of freedom of the reed valve
dynamics (Wasmbasganss, 1966). Advances in the use of digital computers to simulate valve
dynamics were later achieved by several scholars (McLaren & Kerr, 1968); (Padilla, 1971);
(Schwerzler, 1971). Hamilton went a step further by accounting for friction, heat transfer and
Air
filter
First Stage Pressure
Cylinder
Air
intake
Discharge
plenum
Discharge
valve
Suction
valve
Suction
plenum

CHARACTERISING VIBRO-ACOUSTIC SIGNALS OF A RECIPROCATING
COMPRESSOR FOR CONDITION MONITORING
113 DEGREE OF DOCTOR OF PHILOSOPHY (PHD)
real gas properties to obtain a better representation of the model (Hamilton, 1974). The main
objectives of these studies were to develop a mathematical model, which would help in
understanding the working principles of the compressor for appropriate design changes to be
implemented for improved machine performance.
Various faults were incorporated into the compressor model by Manepatil, Yadava, and Nakra
to determine their effects on parameters such as pressure signals for performance monitoring
(Manepatil, Yadava, & Nakra, 2000). Furthermore, Liang, Gu and Ball developed a procedure
for detecting and diagnosing valve faults by analysing the analytically modelled valve impacts
(Liang, Gu, & Ball, 1996).
For a while, the modelling trend for reciprocating compressors was based on simulating the
cylinder processes without accounting for discharge/suction system and line oscillations. Singh
suggests that both cylinder process and discharge or suction systems of the reciprocating
compressor should be modelled together to account for the strong interaction mechanisms
between them (Singh, 1975). He also strongly suggests that for an accurate prediction of
pressure distribution, mass flow rate and valve responses, the line pulsations should be included
in the computer simulation. This is because the valves interact strongly with the suction and
discharge flows, and the valve dynamics and mass flow rates are heavily dependent on the
pressure differentials across the cylinder and the discharge chamber (Singh, 1975); (Maclaren
, Kerr, Tramschek, & Sanjines, 1974).
Brablik was one of the first to couple compressor and piping models; based on his findings, he
advised that the cylinder thermodynamics, valve flow and fluid motion in the lines should be
simulated concurrently for precise and realistic pulsation predications (Brablik J. , 1969);
(Brablik J. , 1972).
A complete model of the reciprocating compressor as seen in Figure 6.1, which includes the
discharge chamber and piping system are incorporated into the compressor model to determine
their influence on the valve system.
5.3 Crankshaft Dynamic Model –Piston Kinematics
5.3.1 Mechanism of Crank shaft and Connecting Rod
The schematic diagram of a typical piston-cylinder mechanism of a reciprocating compressor
with indications of forces acting on it is given in Figure 5.2. The piston inside the cylinder
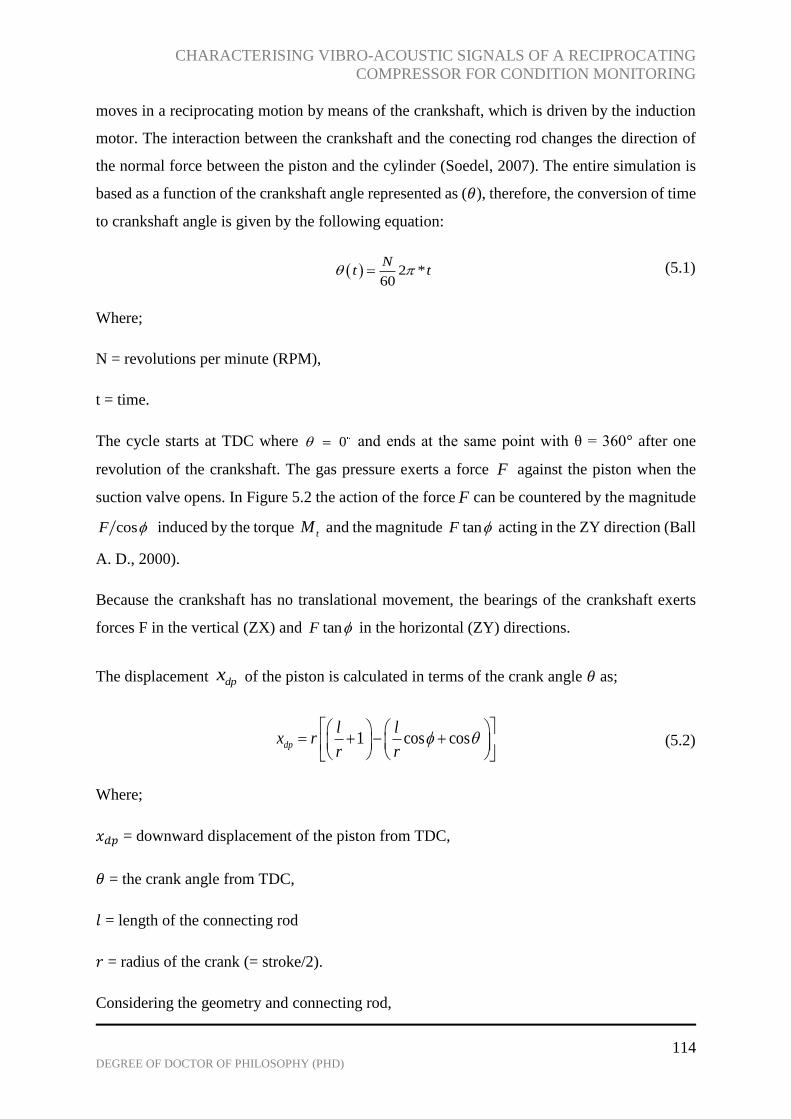
CHARACTERISING VIBRO-ACOUSTIC SIGNALS OF A RECIPROCATING
COMPRESSOR FOR CONDITION MONITORING
114 DEGREE OF DOCTOR OF PHILOSOPHY (PHD)
moves in a reciprocating motion by means of the crankshaft, which is driven by the induction
motor. The interaction between the crankshaft and the conecting rod changes the direction of
the normal force between the piston and the cylinder (Soedel, 2007). The entire simulation is
based as a function of the crankshaft angle represented as (𝜃), therefore, the conversion of time
to crankshaft angle is given by the following equation:
2 * 60
Nt t (5.1)
Where;
N = revolutions per minute (RPM),
t = time.
The cycle starts at TDC where 0 and ends at the same point with θ = 360° after one
revolution of the crankshaft. The gas pressure exerts a force F against the piston when the
suction valve opens. In Figure 5.2 the action of the force F can be countered by the magnitude
cosF induced by the torque tM and the magnitude tanF acting in the ZY direction (Ball
A. D., 2000).
Because the crankshaft has no translational movement, the bearings of the crankshaft exerts
forces F in the vertical (ZX) and tanF in the horizontal (ZY) directions.
The displacement dpx of the piston is calculated in terms of the crank angle 𝜃 as;
1 cos cos dp
l lx r
r r
(5.2)
Where;
𝑥𝑑𝑝 = downward displacement of the piston from TDC,
𝜃 = the crank angle from TDC,
𝑙 = length of the connecting rod
𝑟 = radius of the crank (= stroke/2).
Considering the geometry and connecting rod,

CHARACTERISING VIBRO-ACOUSTIC SIGNALS OF A RECIPROCATING
COMPRESSOR FOR CONDITION MONITORING
115 DEGREE OF DOCTOR OF PHILOSOPHY (PHD)
l sin rsin (5.3)
sin sin r
l (5.4)
Letl
nr
,
2
2
2
sincos 1 sin 1
n
(5.5)
2 21cos sinn
n (5.6)
FIGURE 5.2: PISTON MECHANISM OF A RECIPROCATING COMPRESSOR WITH ACTING
FORCES
Substituting Equation. (5.6) into Equation. (5.2), gives
2 2sin cos 1 dpx r nn
(5.7)
Equation (5.7) is then differentiated to obtain the expressions for velocity and the acceleration
of the piston in Equation (5.8 and 5.9).
sin 2
sin 2
dpx rn
(5.8)
xdp
x
y
Z
cosF
tanF
cosF
FF
tanF
lr
BDC TDC

CHARACTERISING VIBRO-ACOUSTIC SIGNALS OF A RECIPROCATING
COMPRESSOR FOR CONDITION MONITORING
116 DEGREE OF DOCTOR OF PHILOSOPHY (PHD)
Assuming (𝑟2
𝑙2 ) 𝑠𝑖𝑛2𝜃 ≪ 1 then the expression for the acceleration may be written as:
¨
2 2 dp
cosx r cos
n
(5.9)
The model equations given above is for a single-stage reciprocating compressor, however, this
experimental study is based on a two-stage single acting reciprocating compressor and the
mathematical model for this is given as:
22
21 sin
dpL
l lx r cos
r r
(5.10)
22
21 sin
2 2dpH
l lx r cos
r r
(5.11)
Where;
𝑥𝑑𝑝𝐿 is the piston displacement for the first cylinder (stage) and 𝑥𝑑𝑝𝐻 represents piston
displacement for the second cylinder (stage).
FIGURE 5.3: SIMPLIFIED MODEL OF THE V-SHAPED DOUBLE-STAGE RECIPROCATING
COMPRESSOR (ELHAJ M. A., 2005)
dpL
x
dpH
x

CHARACTERISING VIBRO-ACOUSTIC SIGNALS OF A RECIPROCATING
COMPRESSOR FOR CONDITION MONITORING
117 DEGREE OF DOCTOR OF PHILOSOPHY (PHD)
The velocity �̇�𝑑𝑝𝐿,𝐻 and acceleration �̈�𝑑𝑝𝐿,𝐻 of the first and second stage pressure cylinders are
given after differentiation as: -
sin 2
2
dpLx r sinn
(5.12)
sin 2( )
2 2 2
dpHx r sinn
(5.13)
2 2 dpL
rr cos cosx
l
(5.14)
¨
2 2 2 2
dpH
rx r cos cos
l
(5.15)
The configuration of the Broom Wade TS-9 compressor is such that, the displacement of the
piston in the second stage leads the displacement of the first stage by 𝜋 2⁄ . Which is why 𝜋 2⁄ is
added in all the equations concerning second stage pressure cylinder.
The systems of equations given above allows for the evaluation of the piston displacement,
crank angle acceleration, angular velocity and crank angle position. The cylinder volume is
then calculated based on the crank angle position and the piston displacement.
5.4 Cylinder Volume
The volume of a cylinder is the area of one side of the cylinder multiplied by its height. This is
expressed mathematically by the equation below:
2 cylV r h (5.16)
Where r is the radius and h is the height of the cylinder.
The volume of the first and second cylinders is determined using the equation below:
, , , ,cL H coL H pL H dpL Hv t s x (5.17)
Where;

CHARACTERISING VIBRO-ACOUSTIC SIGNALS OF A RECIPROCATING
COMPRESSOR FOR CONDITION MONITORING
118 DEGREE OF DOCTOR OF PHILOSOPHY (PHD)
𝑣𝑐𝑜𝐿,𝐻 is the clearance volume for both first and second stage respectively in 𝑚3, 𝑠𝑝𝐿,𝐻 =
𝜋
4𝐷 𝐿,𝐻
2 is the cross sectional area of the piston in [𝑚3], �̇�𝑑𝑝𝐿,𝐻 is the piston displacement in [𝑚],
and 𝐷𝐿,𝐻is the piston diameter for first and second stages also in [𝑚] (Jiangming & Weirong,
2012); (Elhaj M. A., 2005).
Substituting the equation for displacement given in equation 5.10 and 5.11, the total volume of
the cylinder for first and second stage becomes:
2
2
2 1 sin cL coL pL
l lv t s r cos
r r
(5.18)
2
2
2 1 sin
2 2c H co H p H
l lv t s r cos
r r
(5.19)
5.5 Equation of Motion
According to the model given above, the equation of crank motion is derived from Newton’s
second law as:
, ,
¨
L H L Hm pm fJ T T T (5.20)
The crankshaft angle 𝜃 is a function of time 𝑡, 𝐽 is the equivalent inertial moment of the
compressor system. 𝑇𝑚 is the driving torque from the electric motor and would be described
further shortly; 𝑇𝑝𝑚𝐿,𝐻is the resultant torque due to air pressure inside the cylinder and the
unbalanced inertial force of the piston and the connecting rod of both first and second stage
(Elhaj M. A., 2005). 𝑇𝑓𝐿,𝐻 is the friction torque of the two pressure cylinders.
5.5.1 Calculating the Torques
Torque is a force applied to the shaft of a compressor system causing it to rotate about the axis
of the arm length. The torque is mathematically defined as the cross product of the force vector
𝐹 and the position vector 𝑟 (Danielson, 2003).

CHARACTERISING VIBRO-ACOUSTIC SIGNALS OF A RECIPROCATING
COMPRESSOR FOR CONDITION MONITORING
119 DEGREE OF DOCTOR OF PHILOSOPHY (PHD)
FIGURE 5.4: TORQUE APPLIED TO A SHAFT
The torque generated by the gas pressure in both cylinders is a result of the vertical unbalanced
inertial force on the two-stage compressor and the driving load torque of the power unit device.
The driving torque from the torque, which is used to calculate the equation of motion, is given
as:
wm r
s
PT B
(5.21)
Where 𝑃𝑤 is the motor power in watts, 𝐵𝑟 is the transmission ratio = 3, and 𝜔𝑠 is the motor
speed in rad/sec. The resultant torque due to air pressure inside the cylinder 𝑇𝑝𝑚𝐿,𝐻(𝑡) is
expressed as the effective radius of the crankshaft 𝑅𝑒𝐿 & 𝑅𝑒𝐻 for first and second stage
respectively, multiplied by the force produced by the air pressure in both cylinders 𝑓𝑝𝐿 𝑎𝑛𝑑 𝑓𝑝𝐻,
plus inertial force of the reciprocating mass 𝑓𝑚𝐿 𝑎𝑛𝑑 𝑓𝑚𝐻. This expression is presented in
equation (5.22) below (Elhaj M. A., 2005):
, , , ,
L Hpm pL H mL H L HT f f Re (5.22)
sin
LRe rcos
sin cos cos sinr
cos
cos sinr sin r
cos
(5.23)
sin sin
r
l
(5.24)
Therefore, substituting 𝑠𝑖𝑛∅ into equation (5.23) gives:
2 L
r cos sinRe r sin
l cos
(5.25)
r
F
ω

CHARACTERISING VIBRO-ACOUSTIC SIGNALS OF A RECIPROCATING
COMPRESSOR FOR CONDITION MONITORING
120 DEGREE OF DOCTOR OF PHILOSOPHY (PHD)
2 2
2
2
2 / 1
2L
r rRe r sin sin sin
l l (5.26)
The effective crankshaft radius for the second stage pressure cylinder is given as:
2 2
2
2
sin 2 / 1
2 2 2 2H
r rRe r sin sin
l l
(5.27)
Also, the forces produced by the air pressure in both cylinders can be expressed as equation
(5.28)
, , , pL H cL H cL Hf p s (5.28)
Where 𝑠𝑐𝐿,𝐻 = 0.25𝜋𝑑𝐿,𝐻2 is the cross-sectional area for the first and second stage cylinders
and 𝑑𝐿,𝐻 is the bore diameter for both cylinders. Then finally, the force produced by the vertical
inertial force for both cylinders becomes:
¨
, , , mL H recL H dpL Hf m x (5.29)
The reciprocating inertial mass of both stages 𝑚𝑟𝑒𝑐𝐿 and 𝑚𝑟𝑒𝑐𝐻 are calculated from the
equation below:
, , , 0.5recL H pL H crL Hm m m (5.30)
Where 𝑚𝑝𝐿 𝑎𝑛𝑑 𝑚𝑝𝐻 are the piston mass of both first and second stage cylinders; 𝑚𝑐𝑟𝐿 𝑎𝑛𝑑
𝑚𝑐𝑟𝐻 are the connecting rod mass for both cylinders.
5.6 Cylinder Pressure Models
Filtered gas (in this case air), enters the first stage (low) cylinder through the suction port and
into the suction chamber as seen in the complete model description in Figure 5.1. As the piston
moves back up to TDC, it starts to compress the collected air until the pressure of the air is
greater than the intercooler pressure just outside the discharge valve causing the air to discharge
into the intercooler pipe/coil. As the air passes through the intercooler, heat is lost. The cooled
air enters the second stage (high) cylinder and the process is repeated for the second stage
cylinder, but the compressed air is discharged at a higher pressure into the air receiver tank.

CHARACTERISING VIBRO-ACOUSTIC SIGNALS OF A RECIPROCATING
COMPRESSOR FOR CONDITION MONITORING
121 DEGREE OF DOCTOR OF PHILOSOPHY (PHD)
The first law of thermodynamics is used to derive the equation of instantaneous cylinder
pressure in both cylinders as.
2 2
, , , , , ,
,
,
1 dLcL H iL H viL H vdL H cL H cL H
cL H
Hp c m c m p v
(5.31)
Where;
�̇�𝑣𝑖𝐿,𝐻 𝑎𝑛𝑑 �̇�𝑣𝑑𝐿,𝐻 are the inlet and discharge flow through the valves respectively, the specific
heat ratio for air 𝛾 is 1.4, 𝑐𝑖𝑙,ℎ = √(𝛾𝑅𝑇𝑖𝐿,𝐻) is the speed of sound in the inlet plenum, and
𝑐𝑑𝐿,𝐻 = √(𝛾𝑅𝑇𝑑𝐿,𝐻) is the speed of sound in the cylinder, 𝑅 is the gas constant at
287𝑚2𝑠−2𝐾−1 for air. The absolute temperature of the gas in the cylinder is calculated using
the following equation:
1
,
, ,
,
cL H
cL H iL H
iL H
pT T
p
(5.32)
𝑝𝑐𝐿,𝐻 𝑎𝑛𝑑 𝑝𝑖𝐿,𝐻 represents the internal cylinder pressure and the inlet pressure respectively,
and 𝑇𝑖𝐿,𝐻 is the average absolute temperature of the inlet air (atmospheric temperature℃ +
273Κ).
5.7 Mass Flow Models
Mass flow through the suction and discharge valves are represented by �̇�𝑣𝑖𝐿,𝐻 𝑎𝑛𝑑 �̇�𝑣𝑑𝐿,𝐻
respectively. In order to avoid any confusions, the mass flow models are presented in two parts.
First, the expression for suction mass flow model would be given in subsection 5.7.1, then the
discharge mass flow model in subsection 5.7.2.
5.7.1 Suction Mass Flow Model
The mass flow rate (�̇�𝑣𝑖𝐿,𝐻) of air through the suction valve is mathematically expressed as:
,
, , , ,
, ,
2 .
cL H
viL H iL H diL H fiL H e
iL H cL H
m c AP P
(5.33)
Where;
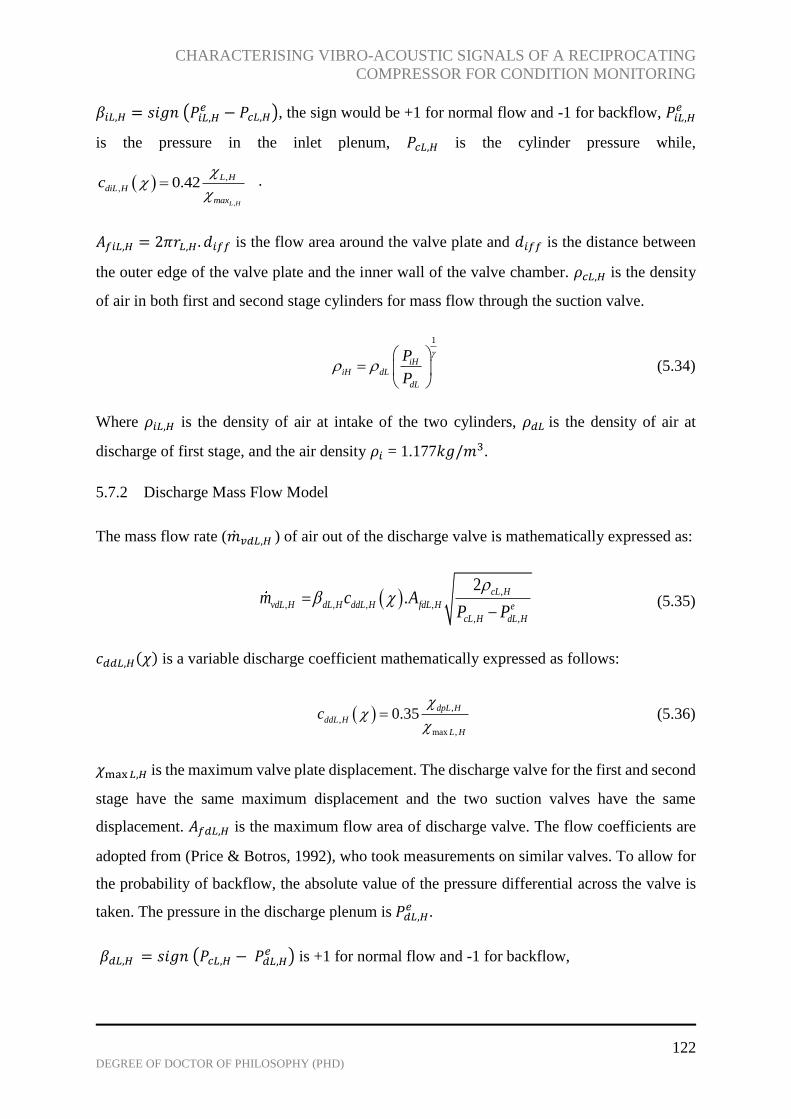
CHARACTERISING VIBRO-ACOUSTIC SIGNALS OF A RECIPROCATING
COMPRESSOR FOR CONDITION MONITORING
122 DEGREE OF DOCTOR OF PHILOSOPHY (PHD)
𝛽𝑖𝐿,𝐻 = 𝑠𝑖𝑔𝑛 (𝑃𝑖𝐿,𝐻𝑒 − 𝑃𝑐𝐿,𝐻), the sign would be +1 for normal flow and -1 for backflow, 𝑃𝑖𝐿,𝐻
𝑒
is the pressure in the inlet plenum, 𝑃𝑐𝐿,𝐻 is the cylinder pressure while,
,
,
, 0.42
L H
L H
diL H
max
c
.
𝐴𝑓𝑖𝐿,𝐻 = 2𝜋𝑟𝐿,𝐻. 𝑑𝑖𝑓𝑓 is the flow area around the valve plate and 𝑑𝑖𝑓𝑓 is the distance between
the outer edge of the valve plate and the inner wall of the valve chamber. 𝜌𝑐𝐿,𝐻 is the density
of air in both first and second stage cylinders for mass flow through the suction valve.
1
iHiH dL
dL
P
P
(5.34)
Where 𝜌𝑖𝐿,𝐻 is the density of air at intake of the two cylinders, 𝜌𝑑𝐿 is the density of air at
discharge of first stage, and the air density 𝜌𝑖 = 1.177𝑘𝑔/𝑚3.
5.7.2 Discharge Mass Flow Model
The mass flow rate (�̇�𝑣𝑑𝐿,𝐻 ) of air out of the discharge valve is mathematically expressed as:
,
, , , ,
, ,
2 .
cL H
vdL H dL H ddL H fdL H e
cL H dL H
m c AP P
(5.35)
𝑐𝑑𝑑𝐿,𝐻(𝜒) is a variable discharge coefficient mathematically expressed as follows:
,
,
max ,
0.35 dpL H
ddL H
L H
c
(5.36)
𝜒max 𝐿,𝐻 is the maximum valve plate displacement. The discharge valve for the first and second
stage have the same maximum displacement and the two suction valves have the same
displacement. 𝐴𝑓𝑑𝐿,𝐻 is the maximum flow area of discharge valve. The flow coefficients are
adopted from (Price & Botros, 1992), who took measurements on similar valves. To allow for
the probability of backflow, the absolute value of the pressure differential across the valve is
taken. The pressure in the discharge plenum is 𝑃𝑑𝐿,𝐻𝑒 .
𝛽𝑑𝐿,𝐻 = 𝑠𝑖𝑔𝑛 (𝑃𝑐𝐿,𝐻 − 𝑃𝑑𝐿,𝐻𝑒 ) is +1 for normal flow and -1 for backflow,

CHARACTERISING VIBRO-ACOUSTIC SIGNALS OF A RECIPROCATING
COMPRESSOR FOR CONDITION MONITORING
123 DEGREE OF DOCTOR OF PHILOSOPHY (PHD)
1
,
, ,
,
cL H
cL H iL H
iL H
P
P
(5.37)
Here 𝜌 𝑐𝐿,𝐻 is the density of air in the cylinders and 𝜌𝑖𝐿,𝐻 is the density of air in the plenum.
1
,
, ,
,
dL H
dL H iL H
iL H
P
P
(5.38)
In Equation (5.38), 𝜌 𝑑𝐿,𝐻 is the density of air in the discharge valves while 𝜌𝑖𝐿,𝐻 is the density
of air in the suction valves.
5.8 Valve Dynamics
This section covers the equations for the dynamic behaviour of the suction and discharge valves
of the Broom Wade TS9 reciprocating compressor used for this experimental study. Each valve
is made up of a valve plate, spring and a pneumatic chamber. Figure (5.5) shows the motion of
the valve plate as a single-degree-of-freedom, and is therefore modelled in this section as a
simple mass, spring and damper system.
FIGURE 5.5: SINGLE DEGREE OF MOTION OF A RECIPROCATING COMPRESSOR VALVE
(ELHAJ M. A., 2005)
The suction and discharge mass flow rates are functions of the distance between valve plate
and seating (valve lift). Forces acting on the valve plate causes it to move up and down. These
forces result from three contributing factors: The spring, the pressure difference across the
valve, and resistance forces in the initial stages of valve opening. Due to the numerous
equations for both suction and discharge valve motion equation, this section would be sectioned

CHARACTERISING VIBRO-ACOUSTIC SIGNALS OF A RECIPROCATING
COMPRESSOR FOR CONDITION MONITORING
124 DEGREE OF DOCTOR OF PHILOSOPHY (PHD)
in two; one to describe the equations and expressions for suction valve motion and the second
for discharge valve motion to prevent any confusions.
5.8.1 Suction Valve Motion
The equation of motion of the suction valve is based on Newton’s second law:
¨
, ,, , , , , vsL H vsL HvsL H sL H vsL H vsL H vsL Hm x k xc x f
(5.39)
The equation of motion for suction valve changes slightly when the valve plate is in contact
with the valve seats causing the valve to be completely open or closed. This is represented in
equation (5.40) below as:
¨
, ,, , , , , vsL H vsL HvsL H csL H csL H vsL H vsL Hm xkx fxc
(5.40)
Where;
,
,
,
,
,
valve plate mass (see equation 5.39),
c damping coefficient,
c damping coefficient when valve is fully open/closed,
k non-linear spring stiffness,
k contact stiffness when v
vsL H
sL H
csL H
vsL H
csL H
m
alve is fully open/closed,
The valve acceleration, velocity and displacement are denoted as �̈�𝑣𝑠𝑙,ℎ , �̇�𝑣𝑠𝑙,ℎ and
𝜒𝑣𝑠𝐿,𝐻 respectively; ∑ 𝑓𝑣𝑠𝐿,𝐻 is sum of all the forces acting on the valve plate. For simplicity,
the subscripts L, H representing first, and second stages would be omitted from this point on
ward. However, the equations that would be described are applicable to both stages.
,
1 3vs d plate springm m m (5.41)
, , ,
2 s d v s d v s dc k m (5.42)
Where 𝜉 is the damping ratio of the valve unit, and is calculated as follows:
2 1 2
n
(5.43)
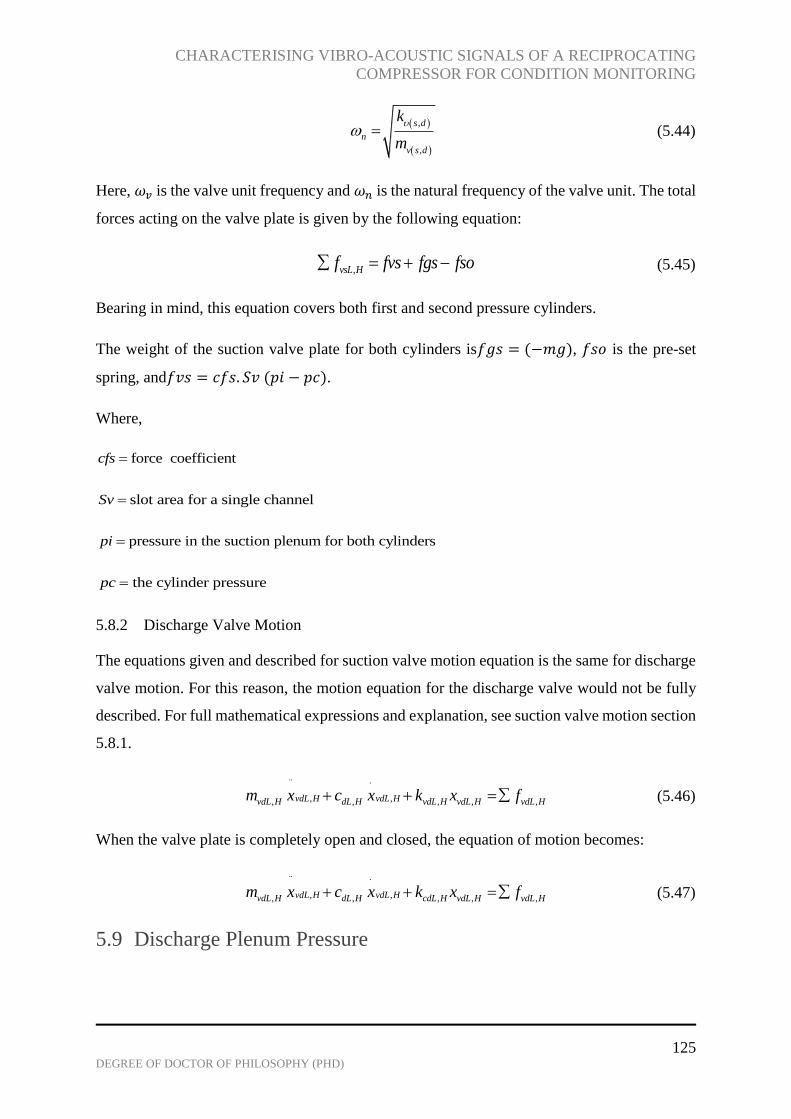
CHARACTERISING VIBRO-ACOUSTIC SIGNALS OF A RECIPROCATING
COMPRESSOR FOR CONDITION MONITORING
125 DEGREE OF DOCTOR OF PHILOSOPHY (PHD)
,
,
s d
n
v s d
k
m
(5.44)
Here, 𝜔𝑣 is the valve unit frequency and 𝜔𝑛 is the natural frequency of the valve unit. The total
forces acting on the valve plate is given by the following equation:
, vsL Hf fvs fgs fso (5.45)
Bearing in mind, this equation covers both first and second pressure cylinders.
The weight of the suction valve plate for both cylinders is𝑓𝑔𝑠 = (−𝑚𝑔), 𝑓𝑠𝑜 is the pre-set
spring, and𝑓𝑣𝑠 = 𝑐𝑓𝑠. 𝑆𝑣 (𝑝𝑖 − 𝑝𝑐).
Where,
force coefficientcfs
slot area for a single channelSv
pressure in the suction plenum for both cylinderspi
the cylinder pressurepc
5.8.2 Discharge Valve Motion
The equations given and described for suction valve motion equation is the same for discharge
valve motion. For this reason, the motion equation for the discharge valve would not be fully
described. For full mathematical expressions and explanation, see suction valve motion section
5.8.1.
¨
, ,, , , , , vdL H vdL HvdL H dL H vdL H vdL H vdL Hxm c k fx x
(5.46)
When the valve plate is completely open and closed, the equation of motion becomes:
¨
, ,, , , , , vdL H vdL HvdL H dL H cdL H vdL H vdL Hxm c k fx x
(5.47)
5.9 Discharge Plenum Pressure

CHARACTERISING VIBRO-ACOUSTIC SIGNALS OF A RECIPROCATING
COMPRESSOR FOR CONDITION MONITORING
126 DEGREE OF DOCTOR OF PHILOSOPHY (PHD)
In this study, the discharge plenum pressure for only the second-stage cylinder is simulated and
experimentally investigated. The discharge plenum is made up of two cavities as seen in Figure
5.6. The pressure in these cavities are given as:
2 2
1 1 1
2
2 1
1
1 1 cv vdH cv vdHH cv cv
cv
p cc m cc p x cvm r
(5.48)
2
2 2 1 1
2
2
1 vdHvdH cv pcv cv d cv p
cv
p A cc mx x c mA
(5.49)
Where,
1,2cv Hv is the volume of cavity one and two chambers;
1cvm is the mass flow rate of cavity one;
2cvA is the cross-sectional area of cavity two chamber;
2
1,2cvcc is the speed of sound in cavity one and two chambers;
1,2cvp is the initial pressure in cavity one and two;
1cv r is the radius of cavity one;
pc is the speed of sound in the pipeline;
pm
is the mass flow in the pipeline.

CHARACTERISING VIBRO-ACOUSTIC SIGNALS OF A RECIPROCATING
COMPRESSOR FOR CONDITION MONITORING
127 DEGREE OF DOCTOR OF PHILOSOPHY (PHD)
FIGURE 5.6: DISCHARGE PLENUM AND PIPING SYSTEM
5.10 Fault Simulation
Second-stage discharge valve leakage and intercooler leakage are the two main faults simulated
in this study. The simulation if accurately done should predict the signatures for the above
faults when examined experimentally.
5.10.1 Second Stage Discharge Valve Leakage
Leaking discharge valves are modelled as an added flow through an orifice in-line with the
usual valve flow. The mass flow rate of the discharge leakage is �̇�𝑣𝑖𝐿,𝐻 > 0 when the discharge
plenum pressure ( )e
dHp is greater than the cylinder pressure (p )cH , That is during expansion,
suction, and compression. Equation 5.50 was used to determine the mass flow rate for gas flow
through the discharge valve orifice.
2 . dH
vdH dH dH lk e
dH cH
m c AP P
(5.50)
Where; 𝐴𝑙𝑘 is the size of leakage on the discharge valve and 𝑐𝑑𝐻(𝜒) is a variable discharge
coefficient. 𝑃𝑑𝐻 𝑒 is the pressure in the discharge plenum and 𝛽𝑖𝐿,𝐻 = 𝑠𝑖𝑔𝑛 (𝑃𝑖𝐿,𝐻
𝑒 − 𝑃𝑐𝐿,𝐻).
Steady-state tank
reservoir
PipeLine
Cavity
One
Cavity
Two
Second-stage
Cylinder
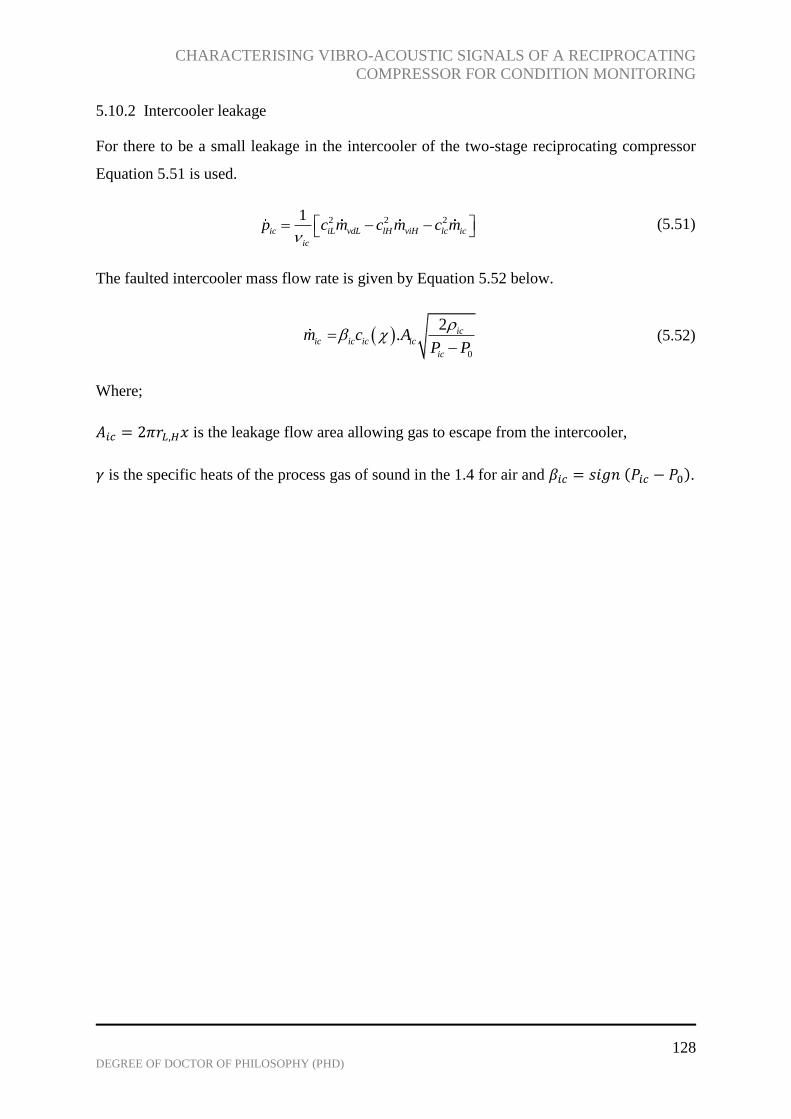
CHARACTERISING VIBRO-ACOUSTIC SIGNALS OF A RECIPROCATING
COMPRESSOR FOR CONDITION MONITORING
128 DEGREE OF DOCTOR OF PHILOSOPHY (PHD)
5.10.2 Intercooler leakage
For there to be a small leakage in the intercooler of the two-stage reciprocating compressor
Equation 5.51 is used.
2 2 21 ic iL vdL lH viH lc ic
ic
p c m c m c m
(5.51)
The faulted intercooler mass flow rate is given by Equation 5.52 below.
0
2 . ic
ic ic ic ic
ic
m c AP P
(5.52)
Where;
𝐴𝑖𝑐 = 2𝜋𝑟𝐿,𝐻𝑥 is the leakage flow area allowing gas to escape from the intercooler,
𝛾 is the specific heats of the process gas of sound in the 1.4 for air and 𝛽𝑖𝑐 = 𝑠𝑖𝑔𝑛 (𝑃𝑖𝑐 − 𝑃0).

CHARACTERISING VIBRO-ACOUSTIC SIGNALS OF A RECIPROCATING
COMPRESSOR FOR CONDITION MONITORING
129 DEGREE OF DOCTOR OF PHILOSOPHY (PHD)
CHAPTER SIX
6 MODEL VALIDATION
This chapter verifies the accuracy of the models developed in chapter five using several
parameters including in-cylinder pressure, valve motion, and discharge chamber pressure of
a healthy two-stage reciprocating compressor. The mathematical equations are solved
numerically in MATLAB programming environment and the predicted results are compared
with the corresponding results from the experimental measurements. More so, the prediction
trends of the two fault simulations, second-stage discharge valve leakage and intercooler
leakage are also compared with corresponding experimental fault measurements. The
prediction and measurement trends show good agreement, which means the model and fault
simulations are accurate and can be used for further simulation studies.
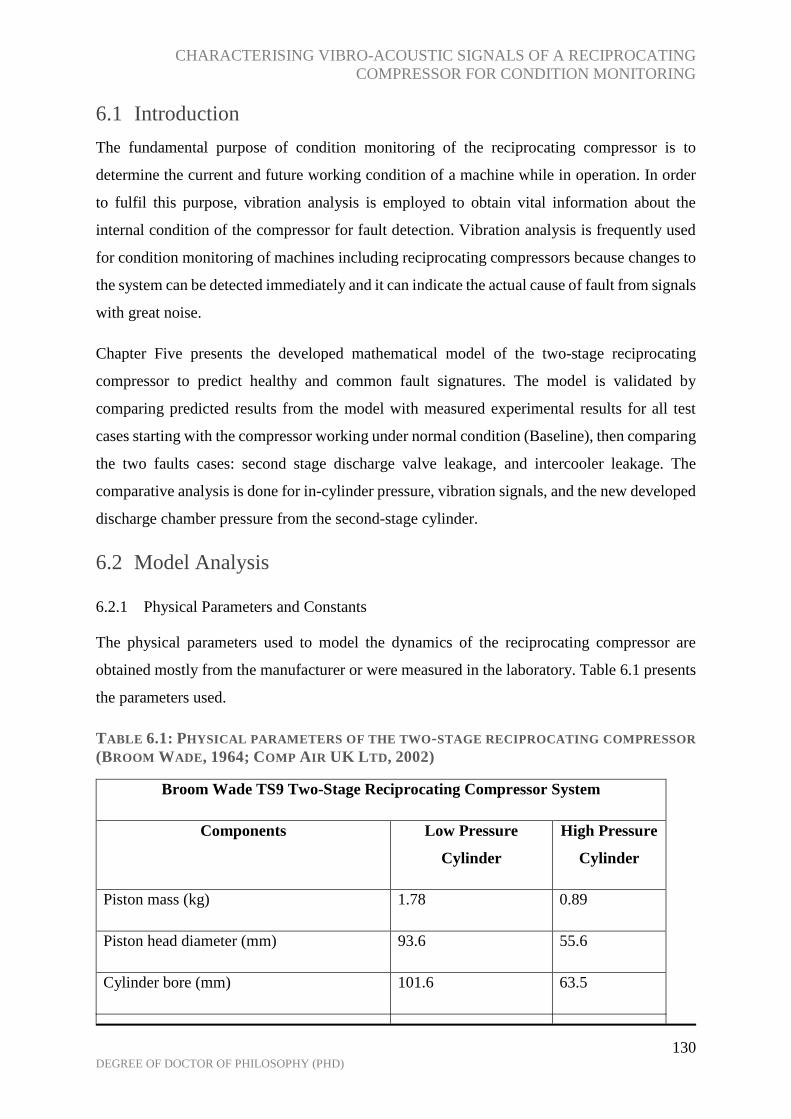
CHARACTERISING VIBRO-ACOUSTIC SIGNALS OF A RECIPROCATING
COMPRESSOR FOR CONDITION MONITORING
130 DEGREE OF DOCTOR OF PHILOSOPHY (PHD)
6.1 Introduction
The fundamental purpose of condition monitoring of the reciprocating compressor is to
determine the current and future working condition of a machine while in operation. In order
to fulfil this purpose, vibration analysis is employed to obtain vital information about the
internal condition of the compressor for fault detection. Vibration analysis is frequently used
for condition monitoring of machines including reciprocating compressors because changes to
the system can be detected immediately and it can indicate the actual cause of fault from signals
with great noise.
Chapter Five presents the developed mathematical model of the two-stage reciprocating
compressor to predict healthy and common fault signatures. The model is validated by
comparing predicted results from the model with measured experimental results for all test
cases starting with the compressor working under normal condition (Baseline), then comparing
the two faults cases: second stage discharge valve leakage, and intercooler leakage. The
comparative analysis is done for in-cylinder pressure, vibration signals, and the new developed
discharge chamber pressure from the second-stage cylinder.
6.2 Model Analysis
6.2.1 Physical Parameters and Constants
The physical parameters used to model the dynamics of the reciprocating compressor are
obtained mostly from the manufacturer or were measured in the laboratory. Table 6.1 presents
the parameters used.
TABLE 6.1: PHYSICAL PARAMETERS OF THE TWO-STAGE RECIPROCATING COMPRESSOR
(BROOM WADE, 1964; COMP AIR UK LTD, 2002)
Broom Wade TS9 Two-Stage Reciprocating Compressor System
Components Low Pressure
Cylinder
High Pressure
Cylinder
Piston mass (kg) 1.78 0.89
Piston head diameter (mm) 93.6 55.6
Cylinder bore (mm) 101.6 63.5
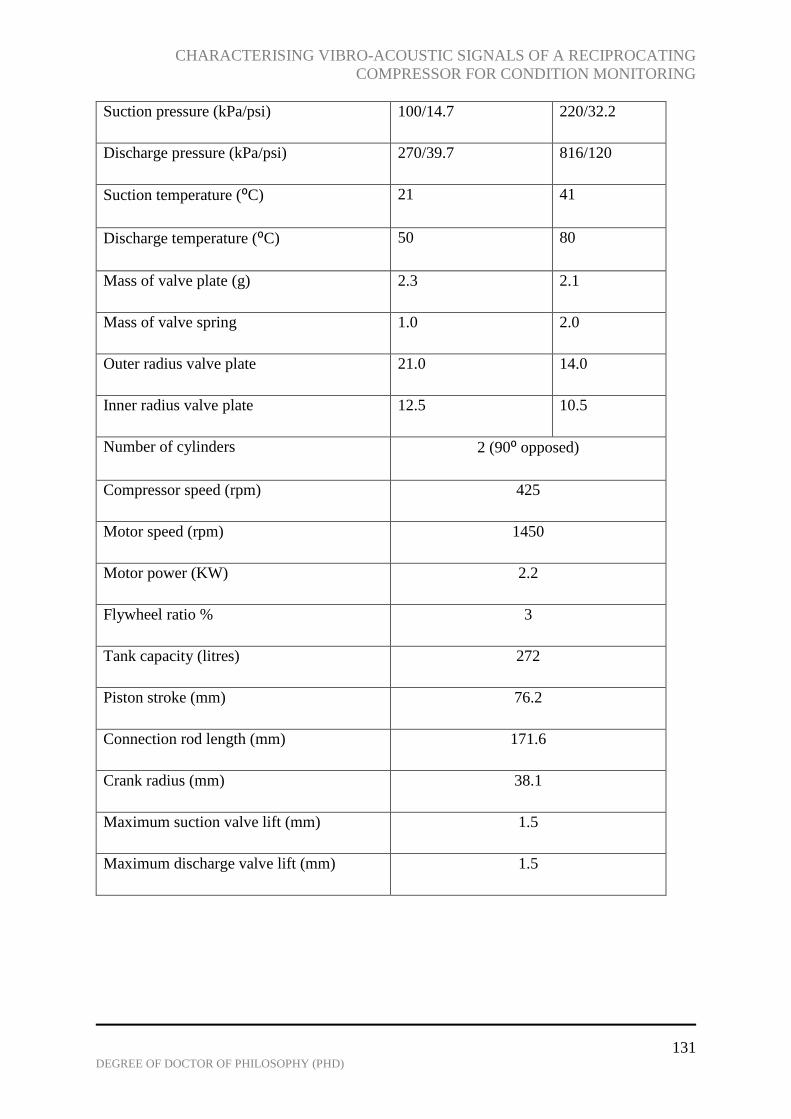
CHARACTERISING VIBRO-ACOUSTIC SIGNALS OF A RECIPROCATING
COMPRESSOR FOR CONDITION MONITORING
131 DEGREE OF DOCTOR OF PHILOSOPHY (PHD)
Suction pressure (kPa/psi) 100/14.7 220/32.2
Discharge pressure (kPa/psi) 270/39.7 816/120
Suction temperature (⁰C) 21 41
Discharge temperature (⁰C) 50 80
Mass of valve plate (g) 2.3 2.1
Mass of valve spring 1.0 2.0
Outer radius valve plate 21.0 14.0
Inner radius valve plate 12.5 10.5
Number of cylinders 2 (90⁰ opposed)
Compressor speed (rpm) 425
Motor speed (rpm) 1450
Motor power (KW) 2.2
Flywheel ratio % 3
Tank capacity (litres) 272
Piston stroke (mm) 76.2
Connection rod length (mm) 171.6
Crank radius (mm) 38.1
Maximum suction valve lift (mm) 1.5
Maximum discharge valve lift (mm) 1.5

CHARACTERISING VIBRO-ACOUSTIC SIGNALS OF A RECIPROCATING
COMPRESSOR FOR CONDITION MONITORING
132 DEGREE OF DOCTOR OF PHILOSOPHY (PHD)
6.3 Healthy Simulation Results
6.3.1 In-Cylinder Pressure Signal
Figure 6.1 shows the predicted in-cylinder pressure readings from the model at different tank
pressures 0.138MPa, 0.276MPa, 0.552MPa, and 0.837MPa (20, 40, 80, and 120 Psi
respectiveely) for first stage and second stage.
FIGURE 6.1: PREDICTED HEALTHY PRESSURE SIGNALS AT DIFFERENT TANK
PRESSURES: A) FIRST STAGE B) SECOND STAGE
From Figure 6.1 above, the in-cylinder pressure increases as the load increases for both first
stage and second stage. This is in accordance with the findings of experimentally measured
healthy in-cylinder pressure signals for the same tank pressure levels in Figure 6.2 below.
A comparative representation of the predicted and measured healthy in-cylinder pressure
waveforms of first and second stage tank pressure at 0.827 MPa (120 Psi) is given in Figure
6.3 for validation purposes. It can be seen that the degree of discrepancy between the predicted
and measured results are minimal in both stages. The minor discrepancies can be attributed to
the age of the compressor and inability to contact the (terminated) manufacturing company for
verification of some of the compressor parameters used for modelling.
The close match between the predicted and measured waveforms is an indication that the model
is reliable and accurately represents the compressor dynamics.
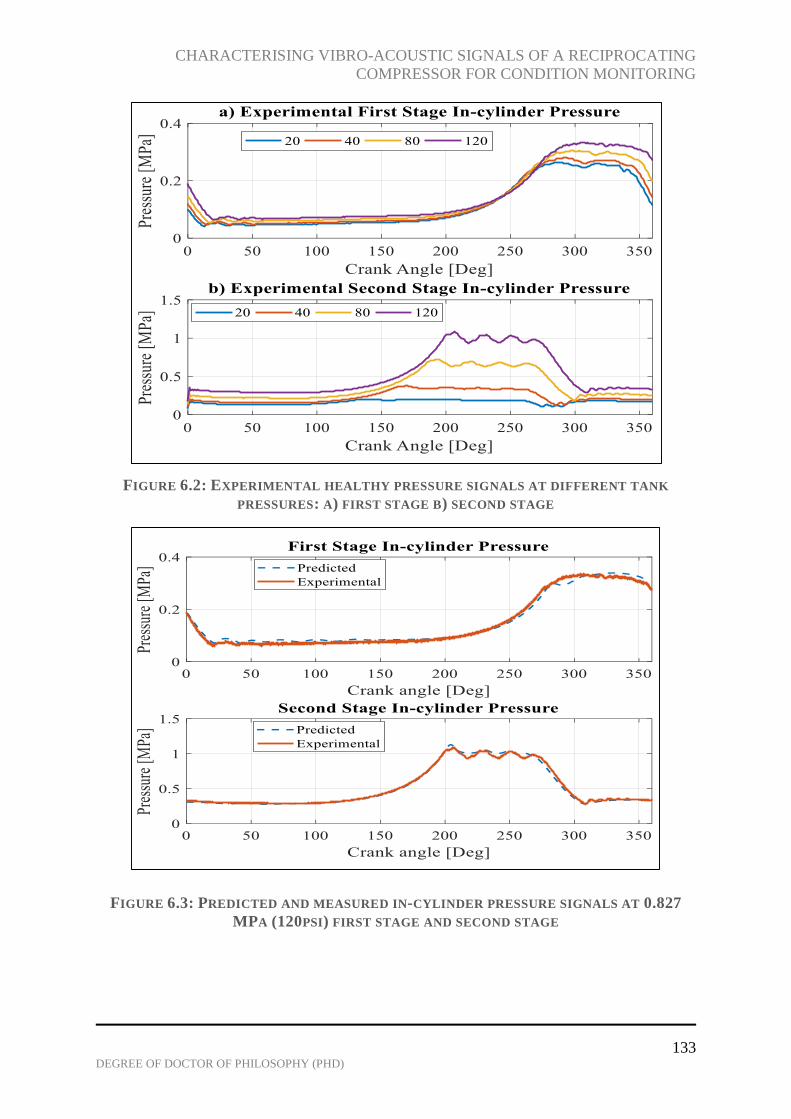
CHARACTERISING VIBRO-ACOUSTIC SIGNALS OF A RECIPROCATING
COMPRESSOR FOR CONDITION MONITORING
133 DEGREE OF DOCTOR OF PHILOSOPHY (PHD)
FIGURE 6.2: EXPERIMENTAL HEALTHY PRESSURE SIGNALS AT DIFFERENT TANK
PRESSURES: A) FIRST STAGE B) SECOND STAGE
FIGURE 6.3: PREDICTED AND MEASURED IN-CYLINDER PRESSURE SIGNALS AT 0.827
MPA (120PSI) FIRST STAGE AND SECOND STAGE

CHARACTERISING VIBRO-ACOUSTIC SIGNALS OF A RECIPROCATING
COMPRESSOR FOR CONDITION MONITORING
134 DEGREE OF DOCTOR OF PHILOSOPHY (PHD)
6.3.2 Valve Displacement and Vibration Signals
Suction and discharge valve displacements for both cylinders have been modelled to predict
the valve opening and closing times. Figures 6.4 and 6.5 shows the opening and closing times
for first and second stage cylinders under healthy compressor working cycle. The opening and
closing of the values depend on the in-cylinder pressure, which is a function of piston position.
FIGURE 6.4: PREDICTED SUCTION AND DISCHARGE VALVE MOTIONS FOR FIRST STAGE
CYLINDER AT 0.827 MPA (120 PSI)
FIGURE 6.5: PREDICTED SUCTION AND DISCHARGE VALVE MOTIONS FOR SECOND
STAGE CYLINDER AT 0.827 MPA (120 PSI)
Figure 6.6 presents the measured healthy vibration signals for the first and second stage
cylinder heads for one compressor cycle. The vibration signals consists of noise and several
transient events including valve and flow-induced impacts, which are difficult to identify
without the dynamic modelling and a good understanding of the reciprocating compressor unit.
SVO SVC DVO DVC
177.2
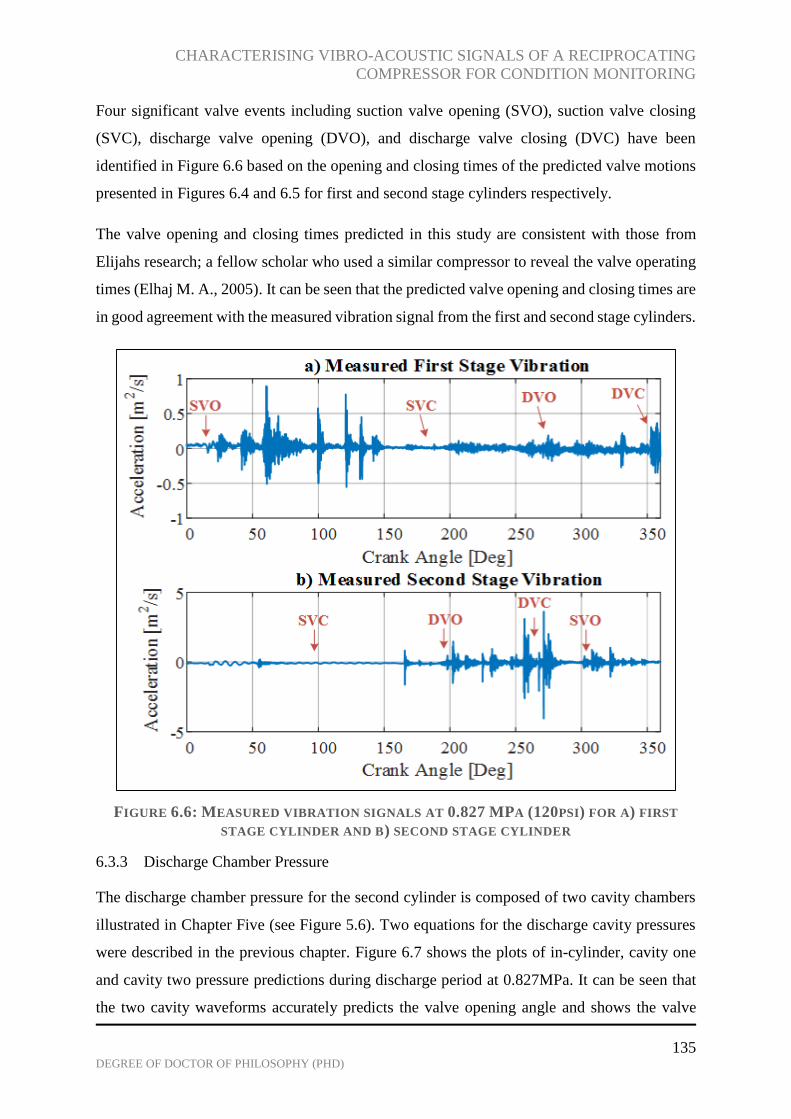
CHARACTERISING VIBRO-ACOUSTIC SIGNALS OF A RECIPROCATING
COMPRESSOR FOR CONDITION MONITORING
135 DEGREE OF DOCTOR OF PHILOSOPHY (PHD)
Four significant valve events including suction valve opening (SVO), suction valve closing
(SVC), discharge valve opening (DVO), and discharge valve closing (DVC) have been
identified in Figure 6.6 based on the opening and closing times of the predicted valve motions
presented in Figures 6.4 and 6.5 for first and second stage cylinders respectively.
The valve opening and closing times predicted in this study are consistent with those from
Elijahs research; a fellow scholar who used a similar compressor to reveal the valve operating
times (Elhaj M. A., 2005). It can be seen that the predicted valve opening and closing times are
in good agreement with the measured vibration signal from the first and second stage cylinders.
FIGURE 6.6: MEASURED VIBRATION SIGNALS AT 0.827 MPA (120PSI) FOR A) FIRST
STAGE CYLINDER AND B) SECOND STAGE CYLINDER
6.3.3 Discharge Chamber Pressure
The discharge chamber pressure for the second cylinder is composed of two cavity chambers
illustrated in Chapter Five (see Figure 5.6). Two equations for the discharge cavity pressures
were described in the previous chapter. Figure 6.7 shows the plots of in-cylinder, cavity one
and cavity two pressure predictions during discharge period at 0.827MPa. It can be seen that
the two cavity waveforms accurately predicts the valve opening angle and shows the valve

CHARACTERISING VIBRO-ACOUSTIC SIGNALS OF A RECIPROCATING
COMPRESSOR FOR CONDITION MONITORING
136 DEGREE OF DOCTOR OF PHILOSOPHY (PHD)
flutter. Moreover, both cavity pressure predictions show the effects of delayed valve opening
angle with increasing tank pressure in Figure 6.8.
FIGURE 6.7: PREDICTED PLOT OF IN-CYLINDER, CAVITY ONE, AND CAVITY TWO
PRESSURE AT DISCHARGE PERIOD
FIGURE 6.8: A) CAVITY ONE B) CAVITY TWO PRESSURE PREDICTIONS AT DIFFERENT
TANK PRESSURES
6.4 Discharge Valve Fault Simulation Results
6.4.1 In-Cylinder Pressure Fault Signal
Predicted in-cylinder pressure and valve motion waveforms simulated under second-stage
discharge-valve compressor fault condition is presented in this section. The discharge valve in-
cylinder pressure prediction at 0.827 MPa (120psi) is compared with the experimental in-
cylinder pressure waveform under the same fault condition. Figures 6.9 shows the first and

CHARACTERISING VIBRO-ACOUSTIC SIGNALS OF A RECIPROCATING
COMPRESSOR FOR CONDITION MONITORING
137 DEGREE OF DOCTOR OF PHILOSOPHY (PHD)
second stage results comparing the predicted in-cylinder fault signature with that of
experimental, and from the plots, it can be seen that the predicted and experimental waveforms
for discharge valve fault condition are in good agreement with some minor differences.
FIGURE 6.9: PREDICTED AND EXPERIMENTAL SECOND STAGE DISCHARGE VALVE FAULT
WAVEFORMS FOR FIRST AND SECOND STAGE IN-CYLINDER PRESSURE AT 0.823 MPA
6.4.1.1 Baseline and Discharge Valve Leakage
The predicted waveform for the discharge valve leakage is labelled DVF-Fault and it is plotted
with that of predicted heathy signal in Figure 6.10; furthermore, the same conditions (healthy
and faulty) for the experimental smeasurement are also presented for comparison with the
predicited results. The discharge valve leakage is carried out as explaned in section (4.6.1)
From the subplots of Figure 6.10, it can be seen that the waveform patterns for the predicted
first-stage in-cylinder pressure of healthy and faulty conditions are very similar to those from
the experimental measurement.
Moreover, the waveform for the predicted second-stage in-cylinder pressure of healthy and
faulty conditions are also very similar to those from the experimental measurements as seen in
Figure 6.11. When there is a discharge valve leakage on the second-stage cylinder, the valve
opens earlier as seen from the plot and the discharge process takes a longer time to complete.
These resulting effects are due to high-pressure air from the pipeline leaking into the cylinder,
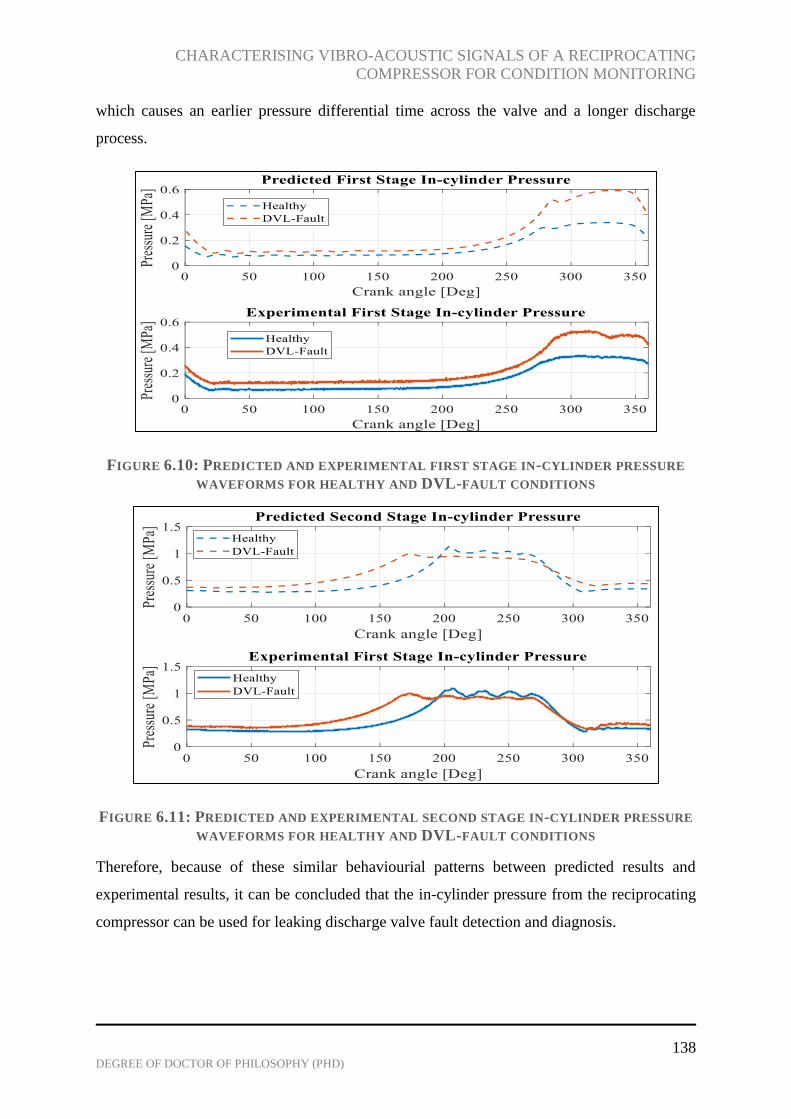
CHARACTERISING VIBRO-ACOUSTIC SIGNALS OF A RECIPROCATING
COMPRESSOR FOR CONDITION MONITORING
138 DEGREE OF DOCTOR OF PHILOSOPHY (PHD)
which causes an earlier pressure differential time across the valve and a longer discharge
process.
FIGURE 6.10: PREDICTED AND EXPERIMENTAL FIRST STAGE IN-CYLINDER PRESSURE
WAVEFORMS FOR HEALTHY AND DVL-FAULT CONDITIONS
FIGURE 6.11: PREDICTED AND EXPERIMENTAL SECOND STAGE IN-CYLINDER PRESSURE
WAVEFORMS FOR HEALTHY AND DVL-FAULT CONDITIONS
Therefore, because of these similar behaviourial patterns between predicted results and
experimental results, it can be concluded that the in-cylinder pressure from the reciprocating
compressor can be used for leaking discharge valve fault detection and diagnosis.

CHARACTERISING VIBRO-ACOUSTIC SIGNALS OF A RECIPROCATING
COMPRESSOR FOR CONDITION MONITORING
139 DEGREE OF DOCTOR OF PHILOSOPHY (PHD)
6.4.2 Valve Displacement and Vibration Fault Signals
Figure 6.12 shows the effects of leaks on the second stage valve plate via the first stage valve
displacement waveform. From the plot, it is observed that in the event of a leak, the suction
and discharge valves open later than normal. This is because the leaks from the second stage
delays the time at which pressure in the cylinder would be high enough to overcome the
pressure in the intercooler. This effect is also seen in the predicted healthy and faulty in-
cylinder traces presented in Figure 6.10.
Figure 6.13 shows the measured first stage vibration signature for healthy and discharge valve
leakage conditions. There is a slight delay in the suction valve opening angle 20.72° for DVL
(Faulty) vibration signature compared to heathy vibrations, which opens at 17.87°. The
discharge valve for healthy vibration signal opens at 275.9°, while that of fault condition opens
at 289.5° about 14° delay. Moreso, the introduction of leaks causes high levels of vibration
amplitude.
FIGURE 6.12: FIRST STAGE VALVE DISPLACEMENT COMPARISON OF HEALTHY AND
VALVE LEAKAGE FAULT PREDICTIONS

CHARACTERISING VIBRO-ACOUSTIC SIGNALS OF A RECIPROCATING
COMPRESSOR FOR CONDITION MONITORING
140 DEGREE OF DOCTOR OF PHILOSOPHY (PHD)
FIGURE 6.13: MEASURED FIRST STAGE VIBRATION SIGNALS FOR HEALTHY AND
DISCHARGE VALVE FAULT CONDITIONS
The second stage suction and discharge valve displacements are presented in Figure 6.14 for
both healthy and fault conditions. The healthy and faulty valve displacement comparision
shows a significant difference in second stage suction valve closing, opening, and discharge
valve opening times (crank angles). When there are leaks on the second stage discharge valve,
the suction valve opens 38° earlier than normal and the valve displacement amplitude is
significantly reduced. Moreso, the discharge valve for the faulty condition opens earlier
(167.3°) than normal (198.9°) with a difference of 31.6° in crack angle. Furthermore, the
suction valve opens later than normal when there is a discharge valve leakage on the second
stage; with a delay of 17°. From Figure 6.15, it can be observed that, the introduction of leaks
through the second stage discharge valve causes increased vibrations that make it difficult to
determine the valve opening and closing times on the vibration signal.
From the above analysis, it can be concluded that careful analysis of the vibration signal can
be used to determine the presence of discharge valve leaks on the second stage cylinder. The
level of vibration increases particularly during discharge valve closing times (angles).
SVO
SVO SVC
SVC
DVO
DVO
DVC
DVC

CHARACTERISING VIBRO-ACOUSTIC SIGNALS OF A RECIPROCATING
COMPRESSOR FOR CONDITION MONITORING
141 DEGREE OF DOCTOR OF PHILOSOPHY (PHD)
FIGURE 6.14: SECOND STAGE VALVE DISPLACEMENT COMPARISON OF HEALTHY AND
VALVE LEAKAGE FAULT PREDICTIONS
FIGURE 6.15: MEASURED SECOND STAGE VIBRATION SIGNALS FOR HEALTHY AND
DISCHARGE VALVE FAULT CONDITIONS
SVC DVO SVO
SVC
SVC
DVO
DVO
DVC
DVC
SVO
SVO
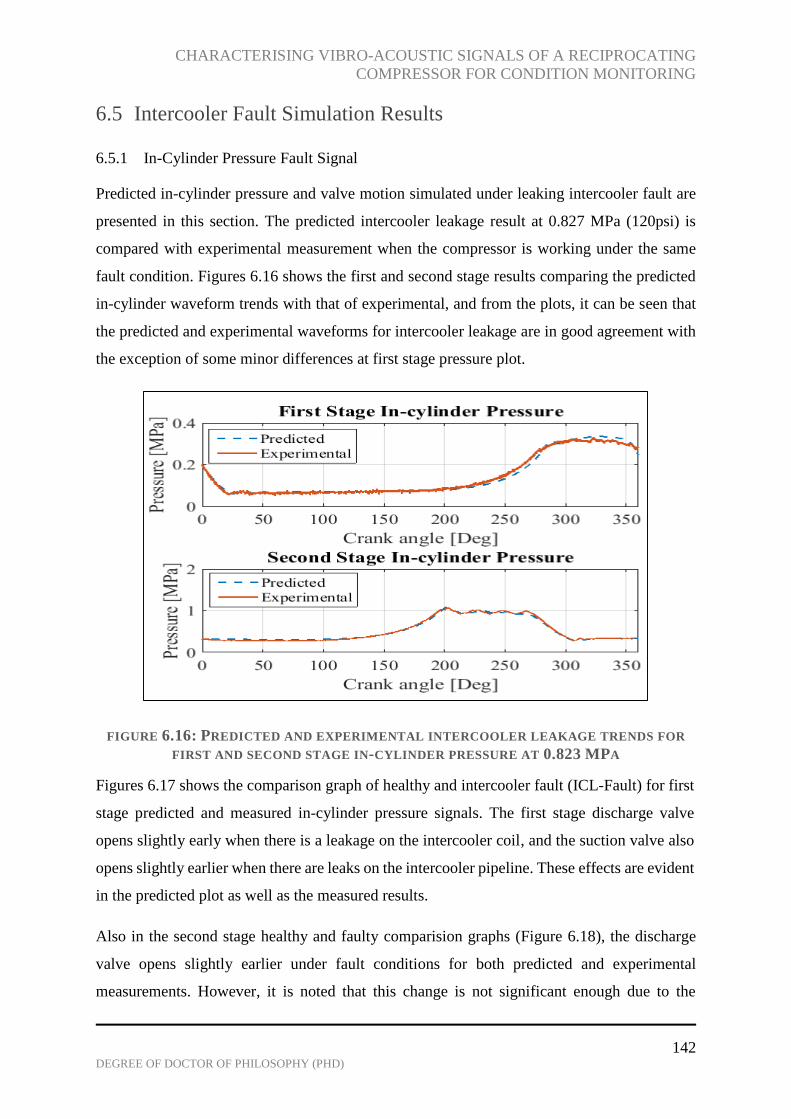
CHARACTERISING VIBRO-ACOUSTIC SIGNALS OF A RECIPROCATING
COMPRESSOR FOR CONDITION MONITORING
142 DEGREE OF DOCTOR OF PHILOSOPHY (PHD)
6.5 Intercooler Fault Simulation Results
6.5.1 In-Cylinder Pressure Fault Signal
Predicted in-cylinder pressure and valve motion simulated under leaking intercooler fault are
presented in this section. The predicted intercooler leakage result at 0.827 MPa (120psi) is
compared with experimental measurement when the compressor is working under the same
fault condition. Figures 6.16 shows the first and second stage results comparing the predicted
in-cylinder waveform trends with that of experimental, and from the plots, it can be seen that
the predicted and experimental waveforms for intercooler leakage are in good agreement with
the exception of some minor differences at first stage pressure plot.
FIGURE 6.16: PREDICTED AND EXPERIMENTAL INTERCOOLER LEAKAGE TRENDS FOR
FIRST AND SECOND STAGE IN-CYLINDER PRESSURE AT 0.823 MPA
Figures 6.17 shows the comparison graph of healthy and intercooler fault (ICL-Fault) for first
stage predicted and measured in-cylinder pressure signals. The first stage discharge valve
opens slightly early when there is a leakage on the intercooler coil, and the suction valve also
opens slightly earlier when there are leaks on the intercooler pipeline. These effects are evident
in the predicted plot as well as the measured results.
Also in the second stage healthy and faulty comparision graphs (Figure 6.18), the discharge
valve opens slightly earlier under fault conditions for both predicted and experimental
measurements. However, it is noted that this change is not significant enough due to the

CHARACTERISING VIBRO-ACOUSTIC SIGNALS OF A RECIPROCATING
COMPRESSOR FOR CONDITION MONITORING
143 DEGREE OF DOCTOR OF PHILOSOPHY (PHD)
quantity of leaks seeded on the intercooler pipeline and simulated mathematically. Moverover,
the intercooler fault carried out in this study does not appear to have an adverse effect on the
in-cylinder pressure signatures of the reciprocating compressor
FIGURE 6.17: PREDICTED AND EXPERIMENTAL FIRST STAGE IN-CYLINDER PRESSURE
WAVEFORMS FOR HEALTHY AND ICL-FAULT CONDITIONS
FIGURE 6.18: PREDICTED AND EXPERIMENTAL SECOND STAGE IN-CYLINDER PRESSURE
WAVEFORMS FOR HEALTHY AND ICL-FAULT CONDITIONS

CHARACTERISING VIBRO-ACOUSTIC SIGNALS OF A RECIPROCATING
COMPRESSOR FOR CONDITION MONITORING
144 DEGREE OF DOCTOR OF PHILOSOPHY (PHD)
6.5.2 Valve Displacement and Vibration Fault Signals
Figure 6.19 shows the first stage valve displacement trends when there are leaks on the
intercooler pipeline. From the graph, there are no significant changes between the healthy and
faulty predicted trends for both suction and discharge valve motion.
FIGURE 6.19: FIRST STAGE VALVE DISPLACEMENT COMPARISON OF HEALTHY AND
INTERCOOLER FAULT PREDICTIONS
FIGURE 6.20: MEASURED FIRST STAGE VIBRATION SIGNALS FOR HEALTHY AND
INTERCOOLER FAULT CONDITIONS

CHARACTERISING VIBRO-ACOUSTIC SIGNALS OF A RECIPROCATING
COMPRESSOR FOR CONDITION MONITORING
145 DEGREE OF DOCTOR OF PHILOSOPHY (PHD)
Figure 6.20 shows the measured first stage vibration signature for healthy and faulty
intercooler. The delays in valve opening and closing times are not apparent from the graphs
However, it is observed that the introduction of leaks on the intercooler pipeline causes high
levels of vibration amplitudes, particularly when the discharge valve closes about 352°.
The second stage suction and discharge valve displacements are presented in Figure 6.21 for
healthy and faulty conditions. The healthy and faulty valve displacement comparision shows
no significant difference in suction and discharge valve opening and closing times (crank
angles). Also, from Figure 6.22, which presents the measured vibration trends when intercooler
leaks are introducted to the system, it is difficult to point out the differences in valve event
times (angles) between healthy and intercooler fault vibration signatures.
From the above analysis, it can be concluded that the degree of intercooler leakage seeded and
mathematically simulated in this study does not show any notable trend differences compared
with heathy trends. However, it is worth noting that, increased levels of leaks on the intercooler
system do have adverse effects on the compressor efficiency (Zheng, 2005).
FIGURE 6.21: SECOND STAGE VALVE DISPLACEMENT COMPARISON OF HEALTHY AND
INTERCOOLER FAULT PREDICTIONS

CHARACTERISING VIBRO-ACOUSTIC SIGNALS OF A RECIPROCATING
COMPRESSOR FOR CONDITION MONITORING
146 DEGREE OF DOCTOR OF PHILOSOPHY (PHD)
FIGURE 6.22: MEASURED SECOND STAGE VIBRATION SIGNALS FOR HEALTHY AND
INTERCOOLER FAULT CONDITIONS
6.6 Discharge Chamber Fault Simulation Results
The effects of four fault conditions namely; second stage discharge fault (DVL), intercooler
fault (ICL), reservoir pipeline fault (PPL), and combined fault of DVL and PLL on the
discharge chamber have been simulated. The experimental results of all four fault conditions
are compared with healthy signal at 0.82MPa as seen in Figure 6.23. The effects of the
experimental results in Figure 6.23 are correlated with the fault predictions in Figure 6.24.
From the experimental results it can be seen that the intercooler fault (ICL) cannot be detected
from the gas pulsation signal and this effect is identical to the predicted intercooler fault
simulation. Very little almost insignificant effect is observed from the experimental reservoir
pipeline fault where the gas pulsation amplitude of the faulty signal is slightly higher than that
of the healthy signal. Also, this effect can be seen in the corresponding fault simulation (PLL).
The discharge valve fault and combined fault experimental signals had the greatest effect on
the gas pulsation signal with a significantly reduced amplitude of fault signals and visible
deformed waveform at the discharge opening times. Also, the discharge valve opens slightly
earlier with the two fault conditions. All three effects described are present in the simulated
results. From the results, it can be concluded that the model is reliable and accurately represents
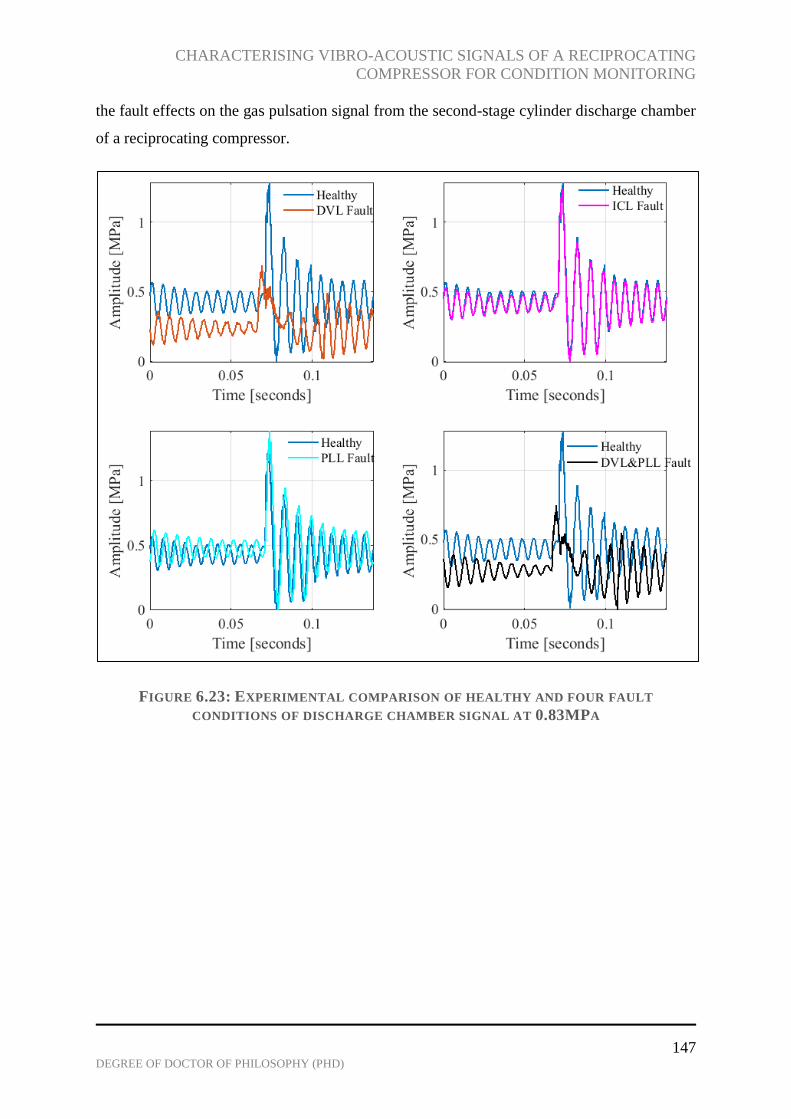
CHARACTERISING VIBRO-ACOUSTIC SIGNALS OF A RECIPROCATING
COMPRESSOR FOR CONDITION MONITORING
147 DEGREE OF DOCTOR OF PHILOSOPHY (PHD)
the fault effects on the gas pulsation signal from the second-stage cylinder discharge chamber
of a reciprocating compressor.
FIGURE 6.23: EXPERIMENTAL COMPARISON OF HEALTHY AND FOUR FAULT
CONDITIONS OF DISCHARGE CHAMBER SIGNAL AT 0.83MPA
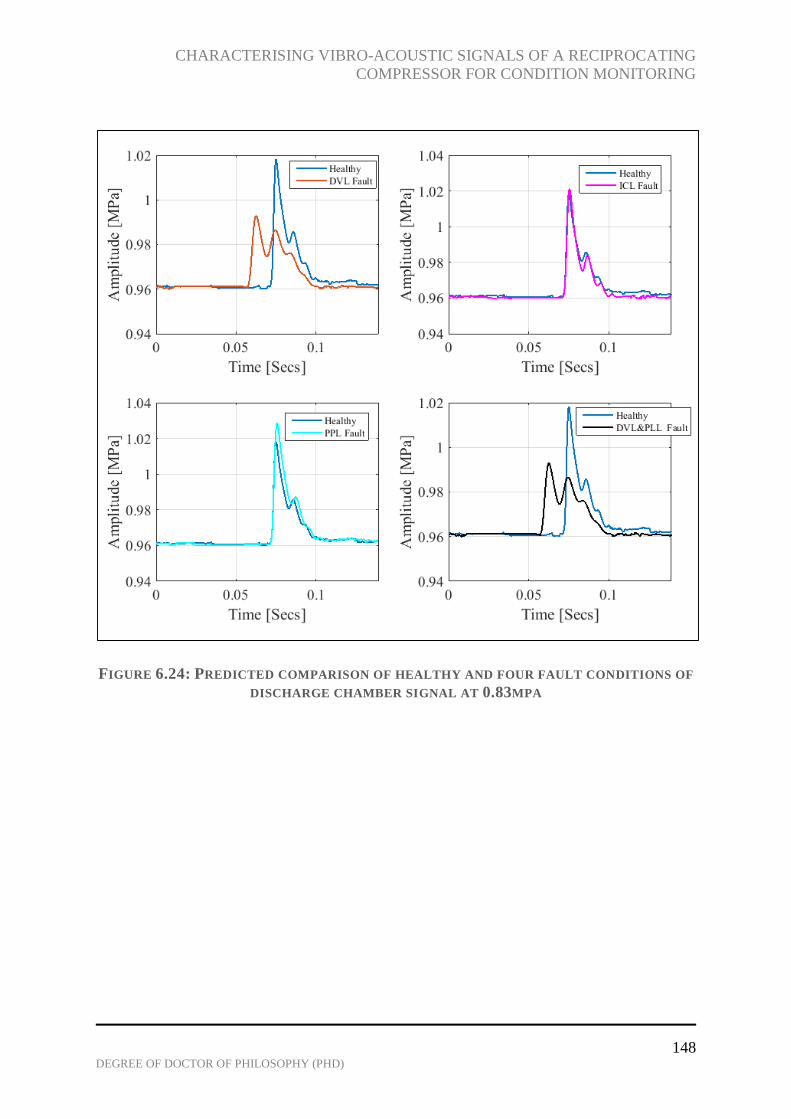
CHARACTERISING VIBRO-ACOUSTIC SIGNALS OF A RECIPROCATING
COMPRESSOR FOR CONDITION MONITORING
148 DEGREE OF DOCTOR OF PHILOSOPHY (PHD)
FIGURE 6.24: PREDICTED COMPARISON OF HEALTHY AND FOUR FAULT CONDITIONS OF
DISCHARGE CHAMBER SIGNAL AT 0.83MPA

CHARACTERISING VIBRO-ACOUSTIC SIGNALS OF A RECIPROCATING
COMPRESSOR FOR CONDITION MONITORING
149 DEGREE OF DOCTOR OF PHILOSOPHY (PHD)
CHAPTER SEVEN
7 CHARACTERISTICS OF VIBRATION SIGNALS FROM A
RECIPROCATING COMPRESSOR
This chapter describes the characteristics of vibro-acoustic signals from the reciprocating
compressor based on vibration measurement. Time domain and frequency domain signal
processing techniques are used to find features due to specific faults (valve and intercooler
leaks) common to the reciprocating compressor. It was revealed that frequency domain
analysis is better at detecting the investigated faults compared to using key time domain
statistical features studied, however, an advance signal processing tool is needed for a more
robust diagnostic.

CHARACTERISING VIBRO-ACOUSTIC SIGNALS OF A RECIPROCATING
COMPRESSOR FOR CONDITION MONITORING
150 DEGREE OF DOCTOR OF PHILOSOPHY (PHD)
7.1 Introduction
Vibration analysis is the most widely used signal processing technique for machine monitoring
and early fault diagnosis of most mechanical systems including reciprocating compressors
(RC). In this chapter, fundamental vibration techniques are used to detect common
reciprocating compressor faults before the faults become catastrophic. The vibration signals
are measured from the head of the two-stage (first and second) compressor cylinders (see
section 4.2.1). Figure 7.1 shows typical one cycle vibration signals from the two RC cylinder
heads.
FIGURE 7.1: MEASURED VIBRATION SIGNAL AT 0.82 MPA A) FIRST CYLINDER, AND B)
SECOND CYLINDER
The vibration signal from the compressor cylinder head is composed of flow-induced and
impact induced excitations. The flow-induced excitations are caused by air interactions with
valves resulting in periodic flow oscillations; while impact induced excitations are caused by
the effects of the valve plate hitting the seat when opening and closing.
In vibration analysis, time domain and frequency domain analysis are fundamental techniques
for interpreting data. Changes in machine condition can be detecting by analysing time-domain
statistical parameters such as root-mean-square, crest factor, peak level, kurtosis etc. The
frequency domain analysis is used to show individual frequency components within the signal,
CHARACTERISING VIBRO-ACOUSTIC SIGNALS OF A RECIPROCATING
COMPRESSOR FOR CONDITION MONITORING
151 DEGREE OF DOCTOR OF PHILOSOPHY (PHD)
which can identify fundamental characteristics of the machine and detect sources of defects
within the system.
In this chapter, time domain and frequency domain analysis are applied to the measured
vibration signal from the reciprocating compressor cylinder-head to extract useful information,
which will aid effective condition monitoring of the machine. A wide range of tank pressures
(0.01Mpa to 0.82MPa) are investigated and three common reciprocating compressor faults
including second-stage discharge valve leakage, intercooler leakage, and a combination of the
two faults are studied for fault detection purposes. Sources of vibration from the reciprocating
compressor are discussed and the application of time-domain and frequency-domain methods
are employed to determine the compressors’ condition.
7.2 Time Domain Analysis of Vibration Signal
In this section, vibration signatures from the cylinder head of the two-stage reciprocating
compressor are examined at all tank pressures. Three statistical parameters including Root
Mean Square (RMS), and kurtosis are presented and results for healthy and faulty compressor
conditions are analysed.
Figures 7.2 and 7.3 show the raw vibration signals from the first stage and second stage
compressor cylinder heads at all tank pressures. The plots of vibration signals presented in
Figure 7.2 shows the complexity and impulsive nature of the vibration signals from the
compressor. There are some differences between waveforms at several tank pressures; for
instance, at 0.13 seconds, high amplitudes can be observed for low to mid tank pressure range
(0.01MPa to 0.55MPa) as a result of low resistance in the form of pressure build-up in the
discharge plenum of the first-stage cylinder. However, other differences are not so obvious
from the waterfall plot. In Figure 7.3, significant impacts at 0.1 seconds are observed from mid
to higher tank pressure range (0.48MPa to 0.82MPa) and they occur at the discharge valve
closing (DVC) time for the second-stage cylinder. These high amplitude impacts result from
high pressure air acting as a resistant force in the discharge plenum of the cylinder causing the
valve to close harshly. This shows that changes in tank pressure influences vibration signatures
from the reciprocating compressor. Furthermore, the overall vibration amplitudes from the
second-stage cylinder head are greater than those from the first-stage RC cylinder head,
because the second-stage cylinder compresses gas at a higher pressure.

CHARACTERISING VIBRO-ACOUSTIC SIGNALS OF A RECIPROCATING
COMPRESSOR FOR CONDITION MONITORING
152 DEGREE OF DOCTOR OF PHILOSOPHY (PHD)
Figures 7.4 and 7.5 presents the healthy and faulty vibration signatures from the first-stage
cylinder head at 0.82MPa (maximum tank pressure).
FIGURE 7.2: FIRST STAGE VIBRATION SIGNATURES OVER A WIDE PRESSURE RANGE
UNDER NORMAL (HEALTHY) COMPRESSOR CONDITION
FIGURE 7.3: SECOND STAGE VIBRATION SIGNATURES OVER A WIDE PRESSURE RANGE
UNDER NORMAL (HEALTHY) COMPRESSOR CONDITION

CHARACTERISING VIBRO-ACOUSTIC SIGNALS OF A RECIPROCATING
COMPRESSOR FOR CONDITION MONITORING
153 DEGREE OF DOCTOR OF PHILOSOPHY (PHD)
The differences in healthy and faulty signal amplitudes for the two stages are not very clear
and can be quite misleading as the general amplitude of the healthy vibration signatures (BL)
are high compared to discharge valve leakage (DVL) and combined fault (DVL+ICL)
signatures in Figure 7.4. Furthermore, in Figure 7.5, the normal (BL) vibration amplitude is
also higher than those of fault signatures at 0.82MPa maximum tank pressure.
FIGURE 7.4: HEALTHY AND FAULTY VIBRATION SIGNATURES FROM FIRST STAGE
CYLINDER HEAD AT 0.82MPA
FIGURE 7.5: HEALTHY AND FAULTY VIBRATION SIGNATURES FROM SECOND STAGE
CYLINDER HEAD AT 0.82MPA

CHARACTERISING VIBRO-ACOUSTIC SIGNALS OF A RECIPROCATING
COMPRESSOR FOR CONDITION MONITORING
154 DEGREE OF DOCTOR OF PHILOSOPHY (PHD)
7.2.1 RMS
Root Mean Square (RMS) measures the overall changes in the system; it is computed to
understand the signals more accurately and to identify healthy and faulty signals clearly under
a wide pressure range. The result in Figure 7.6 shows how the RMS values for first and second
stage vibration signals vary with increasing tank pressure. It is observed that the RMS values
for the first stage vibration measurement are generally lower than the RMS values for second
stage vibration measurement from mid to high tank pressure range; also, the second stage RMS
values show an increasing linear trend for mid to high tank pressure ranges.
Figure 7.7 presents a comparison of healthy and faulty RMS values for first stage vibration
signals at several tank pressures. The random trends over the wide tank pressure range
(0.01MPa - 0.82MPa) observed in all cases do not provide significant information concerning
the condition of the RC, and therefore, cannot be used as a fault indicator.
FIGURE 7.6: FIRST AND SECOND STAGE VIBRATION RMS VALUES FOR SEVERAL TANK
PRESSURES
In Figure 7.8, the second-stage vibration measurement RMS under healthy and all fault cases
are presented. Here, it is seen that the mid to high tank pressure RMS values increase linearly
for all cases, however, there are very little variances between the healthy and faulty RMS
values, which shows it is not a suitable fault indication means.

CHARACTERISING VIBRO-ACOUSTIC SIGNALS OF A RECIPROCATING
COMPRESSOR FOR CONDITION MONITORING
155 DEGREE OF DOCTOR OF PHILOSOPHY (PHD)
FIGURE 7.7: HEALTHY AND FAULTY FIRST STAGE VIBRATION RMS VALUES AT
SEVERAL TANK PRESSURES
FIGURE 7.8: HEALTHY AND FAULTY SECOND STAGE VIBRATION RMS VALUES FOR
SEVERAL TANK PRESSURES
7.2.2 Kurtosis
The fourth statistical moment popularly known as kurtosis is a widely used statistical feature
in condition monitoring. Figure 7.9 shows the kurtosis for the first and second stage vibration
signal across a wide tank pressure range. The results for both first and second stage kurtosis
plots do not exhibit any reliable trends with increasing tank pressure. However, the kurtosis
values for low to mid (0.01MPa to 0.41MPa) tank pressure range of first-stage vibration
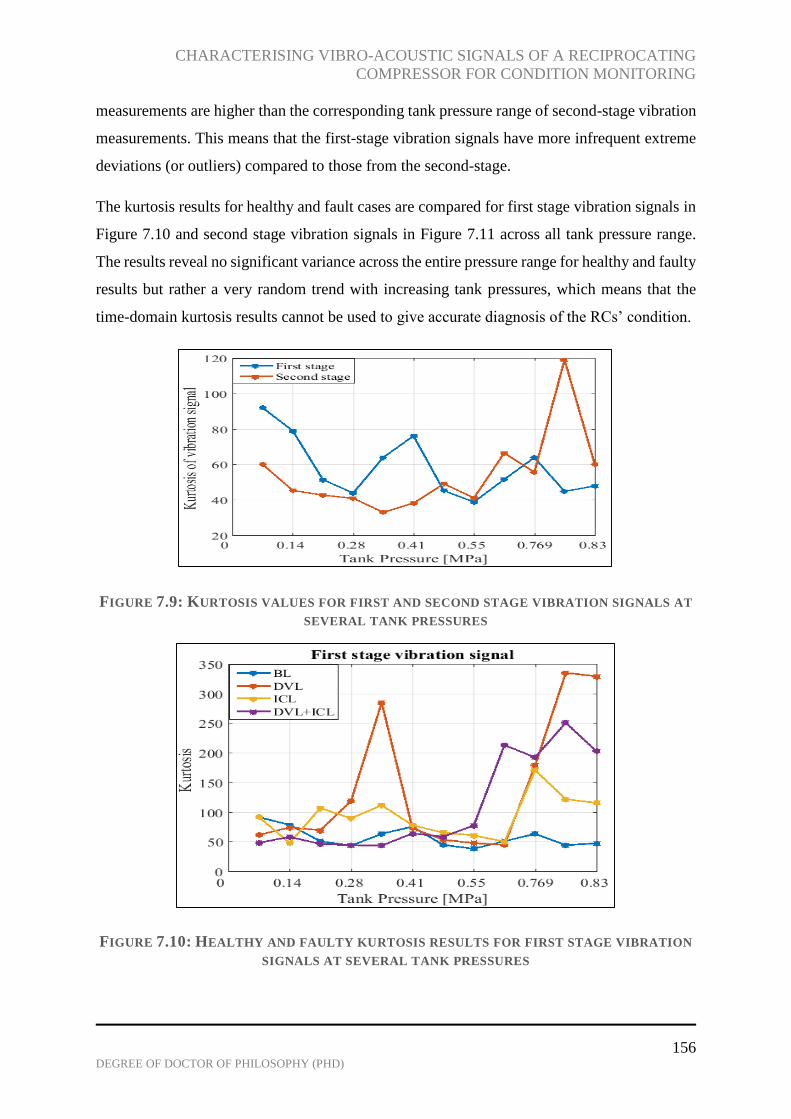
CHARACTERISING VIBRO-ACOUSTIC SIGNALS OF A RECIPROCATING
COMPRESSOR FOR CONDITION MONITORING
156 DEGREE OF DOCTOR OF PHILOSOPHY (PHD)
measurements are higher than the corresponding tank pressure range of second-stage vibration
measurements. This means that the first-stage vibration signals have more infrequent extreme
deviations (or outliers) compared to those from the second-stage.
The kurtosis results for healthy and fault cases are compared for first stage vibration signals in
Figure 7.10 and second stage vibration signals in Figure 7.11 across all tank pressure range.
The results reveal no significant variance across the entire pressure range for healthy and faulty
results but rather a very random trend with increasing tank pressures, which means that the
time-domain kurtosis results cannot be used to give accurate diagnosis of the RCs’ condition.
FIGURE 7.9: KURTOSIS VALUES FOR FIRST AND SECOND STAGE VIBRATION SIGNALS AT
SEVERAL TANK PRESSURES
FIGURE 7.10: HEALTHY AND FAULTY KURTOSIS RESULTS FOR FIRST STAGE VIBRATION
SIGNALS AT SEVERAL TANK PRESSURES

CHARACTERISING VIBRO-ACOUSTIC SIGNALS OF A RECIPROCATING
COMPRESSOR FOR CONDITION MONITORING
157 DEGREE OF DOCTOR OF PHILOSOPHY (PHD)
FIGURE 7.11: HEALTHY AND FAULTY KURTOSIS RESULTS FOR SECOND STAGE
VIBRATION SIGNALS AT SEVERAL TANK PRESSURES
In summary, due to the randomness and non-linear nature of statistical features from the
measured first and second stage vibration signals across a wide range of pressure, it is difficult
to detect and monitor common faults developed on the reciprocating compressor using the
investigated traditional time domain analytical methods.
7.3 Frequency Domain Analysis
The previous section revealed that the considered time-domain statistical parameters were not
able to detect the presence of common reciprocating compressor faults for a wide tank pressure
range. Therefore, frequency domain analysis is investigated in this section for condition
monitoring of the machine.
The vibration spectra for healthy first-stage and second-stage vibration measurements from the
reciprocating compressor are presented in Figure 7.12a and 7.12b respectively. From the plots,
it can be observed that the low frequencies have the greatest amplitude in both spectra, and the
magnitude of the second stage spectra is generally greater than that from the first-stage cylinder
head.

CHARACTERISING VIBRO-ACOUSTIC SIGNALS OF A RECIPROCATING
COMPRESSOR FOR CONDITION MONITORING
158 DEGREE OF DOCTOR OF PHILOSOPHY (PHD)
FIGURE 7.12: ONE SIDED VIBRATION SPECTRA FOR HEALTHY A) FIRST STAGE AND B)
SECOND STAGE VIBRATION MEASUREMENTS AT 0.82MPA
Figures 7.13 and 7.14 shows the changes in vibration spectra with increasing tank pressure for
first and second-stage vibration signals respectively. From the healthy first-stage vibration
spectra plot, it can be observed that there are no significant changes in amplitudes with
increasing tank pressure. However, for the healthy second-stage vibration spectra, at high
frequency range between 12 kHz to 17 kHz particularly, high frequency amplitudes are present
from mid to high tank pressure range. Figure 7.14 show that increasing tank pressure does have
some significant effect on the spectrum amplitude of the second-stage vibration measurements.
Figure 7.15 shows the waterfall plots of first-stage vibration spectrum for all tank pressure
range under healthy and fault conditions. At lower frequencies, high frequency amplitudes are
seen in the plots of all three fault cases at certain tank pressures, while the healthy signal (BL)
has relatively low amplitude. Introducing leaks (DVL and ICL) increases the amplitude of the
vibration spectra.
The vibration spectra from the second-stage measurements have greater amplitudes than those
from the first-stage cylinder for all cases studied including healthy signals. The increased
amplitude is a result of the greater discharge pressure from the second-stage cylinder.

CHARACTERISING VIBRO-ACOUSTIC SIGNALS OF A RECIPROCATING
COMPRESSOR FOR CONDITION MONITORING
159 DEGREE OF DOCTOR OF PHILOSOPHY (PHD)
FIGURE 7.13 : HEALTHY FIRST STAG VIBRATION SPECTRA FOR SEVERAL TANK
PRESSURES
Figure 7.16 presents the waterfall plots of second-stage vibration spectra for all tank pressures
under healthy and the three fault conditions. In the combined fault (DVL+ICL) plot, increased
amplitudes are observed in the 5 kHz to 13 kHz frequency range at high tank pressure levels
compared to other fault conditions including healthy case. The greatest peak is seen at 5646
Hz. The intercooler fault spectral plot has the lowest overall amplitude compared to the other
cases.
FIGURE 7.14: HEALTHY SECOND STAGE VIBRATION SPECTRA FOR SEVERAL TANK
PRESSURES

CHARACTERISING VIBRO-ACOUSTIC SIGNALS OF A RECIPROCATING
COMPRESSOR FOR CONDITION MONITORING
160 DEGREE OF DOCTOR OF PHILOSOPHY (PHD)
FIGURE 7.15: WATERFALL PLOTS OF FIRST STAGE VIBRATION SPECTRUM FOR
HEALTHY AND ALL FAULT CASES
The spectrum analysis of the measured vibration signals for healthy and fault conditions show
that the spectral amplitudes are important indicators for detecting common reciprocating
compressor faults particularly, when there is a discharge valve leakage.

CHARACTERISING VIBRO-ACOUSTIC SIGNALS OF A RECIPROCATING
COMPRESSOR FOR CONDITION MONITORING
161 DEGREE OF DOCTOR OF PHILOSOPHY (PHD)
FIGURE 7.16: WATERFALL PLOTS OF SECOND STAGE VIBRATION SPECTRUM FOR
HEALTHY AND ALL FAULT CASES
7.4 Summary
In this chapter, three common fault cases including second-stage discharge valve leakage,
intercooler leakage and a combination of the two faults are investigated experimentally. Time
domain and frequency domain analyses are used to determine vibration characteristics of the
signals from the first-stage and second-stage cylinder heads. The time-domain signal waveform
revealed several impacts and corresponding magnitudes caused by the valve and gas flow, two
key time domain statistical parameters were unable to clearly differentiate fault features from
that of healthy signal for a wide tank pressure range. Therefore, it can be concluded that time
domain statistical features cannot be used as an effective fault detection tool for condition
monitoring of the two-stage reciprocating compressor.
The frequency domain analysis revealed, that spectral amplitudes present significant variations
at high tank pressure range, particularly, for second-stage vibration signals. Moreover, spectral
amplitudes of fault cases increase, mostly at high tank pressure range over a certain frequencies
(5 kHz to 14 kHz) for the second-stage vibration signals. Conventional signal processing (time-

CHARACTERISING VIBRO-ACOUSTIC SIGNALS OF A RECIPROCATING
COMPRESSOR FOR CONDITION MONITORING
162 DEGREE OF DOCTOR OF PHILOSOPHY (PHD)
domain and frequency-domain) methods are often used for early fault detection, however, the
diagnostic features investigated in this chapter were ineffective as a diagnostic tool because of
the wide variety of operating conditions (tank pressures) and the complex impulsive nature of
the vibration signals.

CHARACTERISING VIBRO-ACOUSTIC SIGNALS OF A RECIPROCATING
COMPRESSOR FOR CONDITION MONITORING
163 DEGREE OF DOCTOR OF PHILOSOPHY (PHD)
CHAPTER EIGHT
8 CHARACTERISTICS OF DISCHARGE GAS PULSATION
FROM A RECIPROCATING COMPRESSOR
This chapter presents a practical approach to condition monitoring of reciprocating
compressors based on gas pulsation signals from the compressor valve discharge chamber
(plenum) for the detection of common reciprocating compressor faults (second-stage discharge
valve plate leakage, intercooler pipe leakage, and discharge-to- reservoir pipe leakage). The
noise characteristics from the measured pulsation signals are investigated using conventional
time domain and frequency domain methods.
It is concluded that the pulsation waves can provide accurate representation of the valve
opening times and any delays that may occur with increasing discharge/tank pressure.
However, statistical features of the time-domain analysis were insufficient for fault detection.
Furthermore, several resonances were present in the gas pulsation spectrum, but challenges
were encountered in accurately selecting the optimal resonance band, to effectively
characterise the investigated faults across several discharge/tank pressure range. Finally,
using the 1/3rd octave band analysis, band 22 and 23, which corresponds to centre frequency
500Hz and 630Hz gave the best fault separations from the baseline (healthy) signal.
CHARACTERISING VIBRO-ACOUSTIC SIGNALS OF A RECIPROCATING
COMPRESSOR FOR CONDITION MONITORING
164 DEGREE OF DOCTOR OF PHILOSOPHY (PHD)
8.1 Experimental Setup
The experimental setup of the reciprocating compressor is described in chapter four section
4.2.1. Figure 8.1 presents a schematic of the reciprocating compressor rig setup with
specifications of supporting components listed in Table 6.1.
The gas pulsation signal is collected via a piezoelectric dynamic pressure transducer (CY-YD-
212) installed on the head of the second-stage discharge system. The transducer has a frequency
range of more than 100 kHz, operating range of 0 to 10MPa, a temperature range of - 40°C to
+150°C, and sensitivity of 100pC/MPa. In addition to the acoustic measurement acquired by
the dynamic pressure transducer, eight transducers were installed on the test rig to acquire
additional data on vibration, in-cylinder pressure, temperature, instantaneous angular speed and
current signals. These signals were collected using the following transducers:
Accelerometers (two)
Static pressure sensors (two)
Thermocouples (two)
An optical encoder
A hall effect current transducer
8.1.1 Test Procedure
The data acquisition system was set to collect 40384 samples of data at a sampling frequency
of 49019 Hz. The 40384 samples collected make up six cycles of data collected at several
discharge pressure levels including 0.275 MPa, 0.413 MPa, 0.62, and 0.827 MPa. Five different
cases were investigated: baseline (BL), second-stage discharge valve leakage (DVL),
intercooler leakage (ICL), discharge to tank storage pipeline leakage (PLL), and a combined
fault of the discharge valve and pipeline leakage (DVL&PLL) under the tank pressure levels
specified above.

CHARACTERISING VIBRO-ACOUSTIC SIGNALS OF A RECIPROCATING
COMPRESSOR FOR CONDITION MONITORING
165 DEGREE OF DOCTOR OF PHILOSOPHY (PHD)
FIGURE 8.1: A) EXPERIMENTAL TEST RIG SETUP OF THE RECIPROCATING COMPRESSOR
B) HIGH-PRESSURE CYLINDER WITH SENSOR INSTALLATIONS, C) SCHEMATIC OF
ACOUSTIC SENSOR INSTALLATION
The DVL and ICL faults have been described in chapter four section 4.6. PLL is seeded by
loosening the nut connecting the second-stage discharge chamber to the tank air receiver. While
the combined fault (DVL+PLL) data is collected when the two faults are in effect.
8.2 Time Domain Analysis
A typical one-revolution time domain analysis of the gas pulsation signal from the second-
stage discharge chamber of the reciprocating compressor used for this study is shown in Figure
8.2a). It is difficult to determine the four compression process (suction, compression, discharge,
and expansion) from this plot; therefore, the gas pulsation signal is plot against the In-cylinder
pressure signal in Figure 8.2b).
The four processes, which are triggered by valve events namely: suction valve opening (SVO)
and closing (SVC), discharge valve opening (DVO) and closing (DVC) are not easily
discernible from the airborne (gas) acoustic signal. The only clear process is the discharge
process, which has significantly high amplitudes.
Figure 8.3 shows the time domain waveforms of raw pulsation signals from the reciprocating
compressor operating under normal conditions at several tank pressures (0.275 MPa, 0.413
MPa, 0.620, and 0.827 MPa). This waterfall plot presents a clearer view of the pressure acoustic
Engineering drawing of sensor installation
Discharge Cavity pressure transducer
Cylinder Pressure transducerIn-cylinder pressure
transducer
Dynamic pressure
transducer
a
b
c
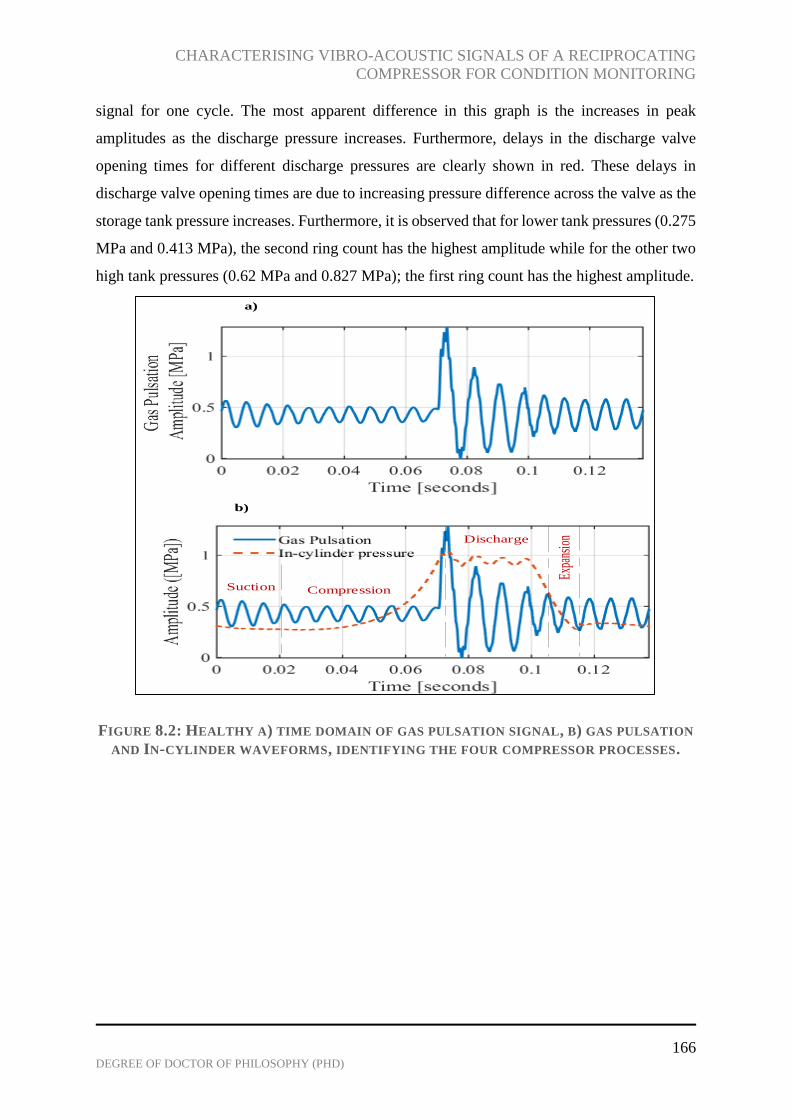
CHARACTERISING VIBRO-ACOUSTIC SIGNALS OF A RECIPROCATING
COMPRESSOR FOR CONDITION MONITORING
166 DEGREE OF DOCTOR OF PHILOSOPHY (PHD)
signal for one cycle. The most apparent difference in this graph is the increases in peak
amplitudes as the discharge pressure increases. Furthermore, delays in the discharge valve
opening times for different discharge pressures are clearly shown in red. These delays in
discharge valve opening times are due to increasing pressure difference across the valve as the
storage tank pressure increases. Furthermore, it is observed that for lower tank pressures (0.275
MPa and 0.413 MPa), the second ring count has the highest amplitude while for the other two
high tank pressures (0.62 MPa and 0.827 MPa); the first ring count has the highest amplitude.
FIGURE 8.2: HEALTHY A) TIME DOMAIN OF GAS PULSATION SIGNAL, B) GAS PULSATION
AND IN-CYLINDER WAVEFORMS, IDENTIFYING THE FOUR COMPRESSOR PROCESSES.
a)
Suction Compression
Discharge
Expa
nsio
n
b)

CHARACTERISING VIBRO-ACOUSTIC SIGNALS OF A RECIPROCATING
COMPRESSOR FOR CONDITION MONITORING
167 DEGREE OF DOCTOR OF PHILOSOPHY (PHD)
FIGURE 8.3: ONE CYCLE WAVEFORM OF GAS PULSATION SIGNALS AT SEVERAL TANK
PRESSURES
8.2.1 Gas Pulsation Time Domain Waveform for Fault Cases
The waveform of the four fault cases and healthy case studied are compared in the waterfall
plots for each discharge pressure range investigated. Table 8.1 summarises the observed
differences between healthy condition and fault cases for all studied discharge pressure ranges.
From the observations, it can be concluded that the differences between healthy and fault,
although evident by comparing waveforms, are not sufficient and clear enough to confidently
detect the common reciprocating compressor faults studied across the wide discharge pressure
range.
Discharge Valve
Opening
Discharge Valve
Opening
Discharge Valve
Opening
Discharge Valve
Opening

CHARACTERISING VIBRO-ACOUSTIC SIGNALS OF A RECIPROCATING
COMPRESSOR FOR CONDITION MONITORING
168 DEGREE OF DOCTOR OF PHILOSOPHY (PHD)
FIGURE 8.4: GAS PULSATION WAVE COMPARING NORMAL AND FAULT CONDITIONS AT
SEVERAL DISCHARGE PRESSURES
TABLE 8.1: SUMMARY OF DIFFERENCES BETWEEN NORMAL AND FAULT CASES OF
AIRBORNE ACOUSTIC WAVEFORM AT SEVERAL TANK PRESSURES
Cases Discharge Pressure at 0.28MPa
BL The second pulse from the discharge valve opening time has the greatest
amplitude (0.252). The discharge valve opens at 0.044 seconds for BL case.
DVL The amplitude of the second pulse from the discharge valve opening time
is almost the same as BL (0.264). The discharge valve opens at 0.043
seconds. Two short impulsive events are seen just before the discharge
valve closes at 0.1 seconds.
ICL The second pulse from the discharge valve opening time has the greatest
amplitude of 0.245. The discharge valve opens at 0.043 seconds.
PLL The waveform of PLL is significantly different from the other cases at the
second count (pulse) from the discharge valve opening time. In addition,
the amplitude of the second count is lower (0.196) compared to other cases.
The discharge valve opens at 0.039 seconds.

CHARACTERISING VIBRO-ACOUSTIC SIGNALS OF A RECIPROCATING
COMPRESSOR FOR CONDITION MONITORING
169 DEGREE OF DOCTOR OF PHILOSOPHY (PHD)
DVL&PLL The second pulse from the discharge valve opening time also has the
greatest amplitude of 0.254. The discharge valve opens at 0.041 seconds,
and two small impulsive events are evident at the end of discharge process.
Discharge Pressure at 0.41MPa
BL The second pulse from the DVO time has the greatest amplitude (0.374).
The waveform seems to have less noise and appears smoother compared to
fault cases.
The DVO time for BL is at 0.055 seconds
DVL The amplitude of the second pulse from the DVO time is the same as that
of BL at 0.374. However, two short impulsive events are present just before
the discharge valve closes. These events are caused by the discharge valve
impact on the valve seat as the process comes to an end. The DVO time for
DVL is at 0.052 seconds slightly earlier than BL
ICL The amplitude of the second pulse from the DVO time has the greatest
overall amplitude at 0.392 compared to other cases. Like the DVL fault
case, two short impulsive events can be seen during discharge valve closing
times but of a smaller magnitude. The DVO time for ICL is at 0.053 seconds
again slightly earlier than BL
PLL The amplitude of the second pulse from the DVO time decreased somewhat
for PLL fault case (0.3575) compared to normal (BL). The DVO time for
PLL is at 0.050 seconds noticeably earlier than BL
DVL&PLL The amplitude of the first pulse from the DVO time has the greatest peak
rather than the second count, which has been observed for other cases. The
DVO time is at 0.054 seconds
Discharge Pressure at 0.62MPa
BL The first pulse from the DVO time has the greatest peak value at 0.525.
DVL The DVO time amplitude is 0.682, slightly higher than the healthy case. A
short impulsive event can be observed on the waveform during the
discharge valve closing time.
ICL The DVO time amplitude of 0.536 is almost the same level as BL case.
PLL The DVO time amplitude at 0.516 reduced slightly for PLL fault case.
DVL&PLL The peak DVO time for the combined fault is at 0.673, slightly higher than
BL.
In addition, a short burst of impulse can be observed on the waveform
during the discharge valve closing time.
Discharge Pressure at 0.83MPa
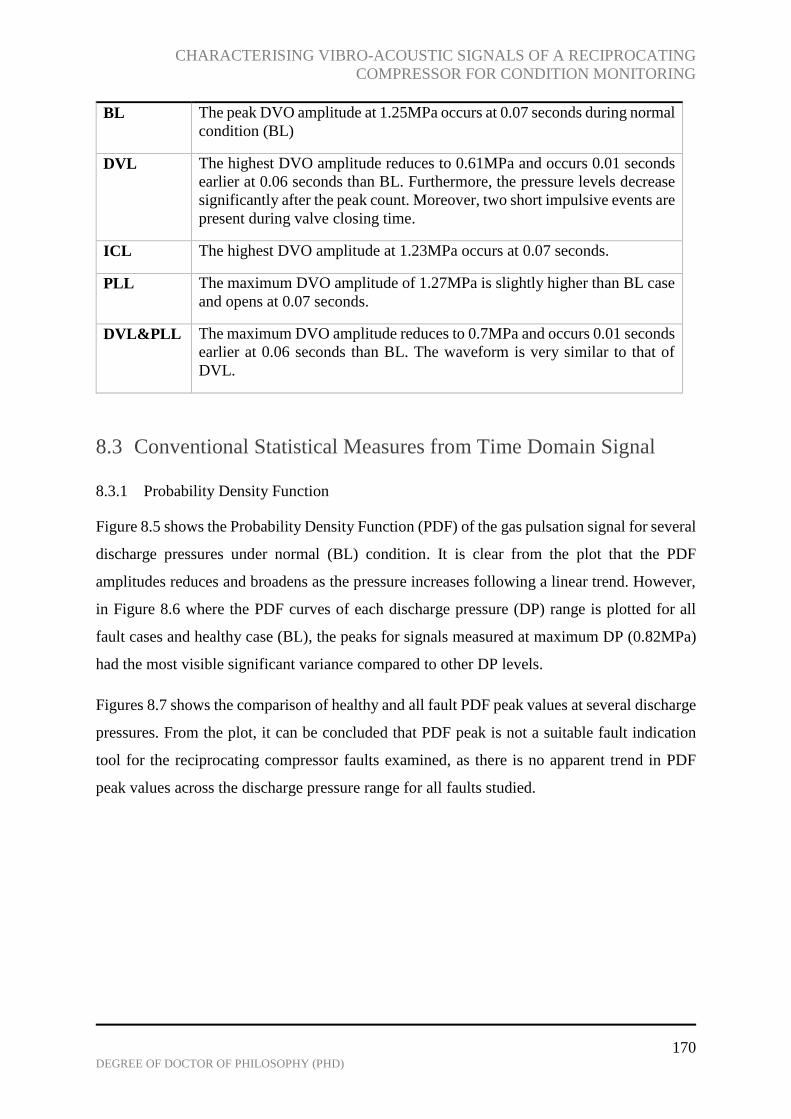
CHARACTERISING VIBRO-ACOUSTIC SIGNALS OF A RECIPROCATING
COMPRESSOR FOR CONDITION MONITORING
170 DEGREE OF DOCTOR OF PHILOSOPHY (PHD)
BL The peak DVO amplitude at 1.25MPa occurs at 0.07 seconds during normal
condition (BL)
DVL The highest DVO amplitude reduces to 0.61MPa and occurs 0.01 seconds
earlier at 0.06 seconds than BL. Furthermore, the pressure levels decrease
significantly after the peak count. Moreover, two short impulsive events are
present during valve closing time.
ICL The highest DVO amplitude at 1.23MPa occurs at 0.07 seconds.
PLL The maximum DVO amplitude of 1.27MPa is slightly higher than BL case
and opens at 0.07 seconds.
DVL&PLL The maximum DVO amplitude reduces to 0.7MPa and occurs 0.01 seconds
earlier at 0.06 seconds than BL. The waveform is very similar to that of
DVL.
8.3 Conventional Statistical Measures from Time Domain Signal
8.3.1 Probability Density Function
Figure 8.5 shows the Probability Density Function (PDF) of the gas pulsation signal for several
discharge pressures under normal (BL) condition. It is clear from the plot that the PDF
amplitudes reduces and broadens as the pressure increases following a linear trend. However,
in Figure 8.6 where the PDF curves of each discharge pressure (DP) range is plotted for all
fault cases and healthy case (BL), the peaks for signals measured at maximum DP (0.82MPa)
had the most visible significant variance compared to other DP levels.
Figures 8.7 shows the comparison of healthy and all fault PDF peak values at several discharge
pressures. From the plot, it can be concluded that PDF peak is not a suitable fault indication
tool for the reciprocating compressor faults examined, as there is no apparent trend in PDF
peak values across the discharge pressure range for all faults studied.
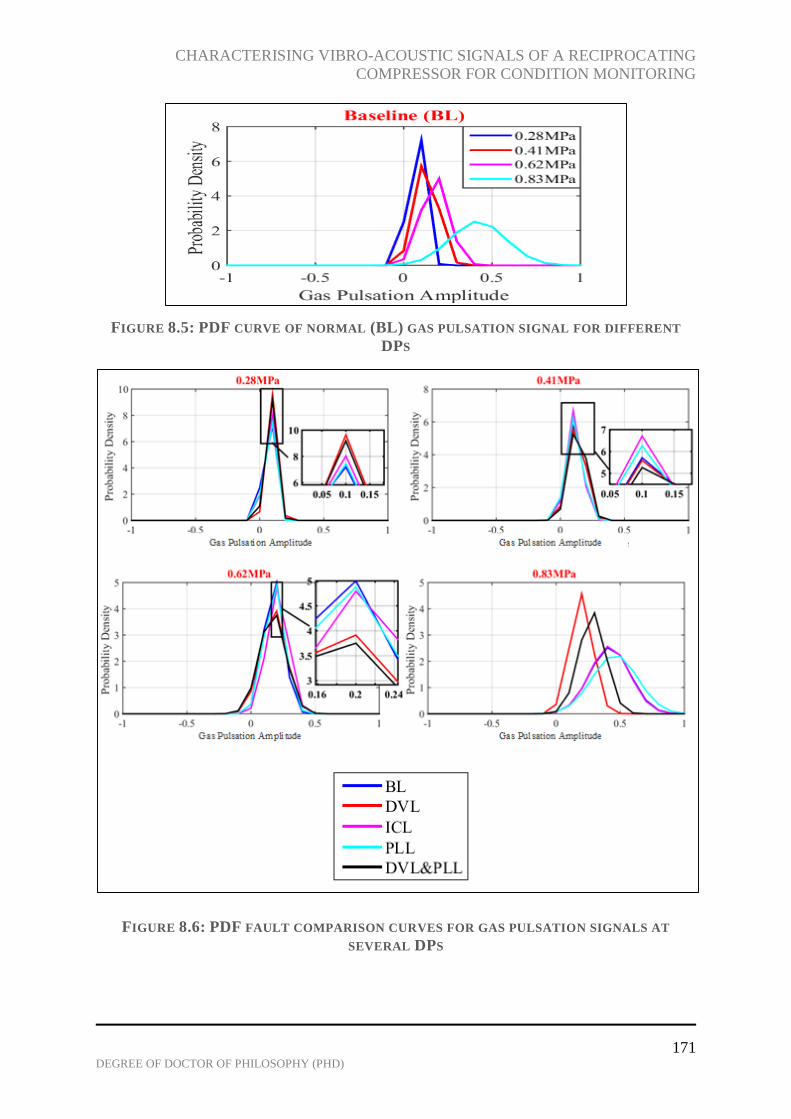
CHARACTERISING VIBRO-ACOUSTIC SIGNALS OF A RECIPROCATING
COMPRESSOR FOR CONDITION MONITORING
171 DEGREE OF DOCTOR OF PHILOSOPHY (PHD)
FIGURE 8.5: PDF CURVE OF NORMAL (BL) GAS PULSATION SIGNAL FOR DIFFERENT
DPS
FIGURE 8.6: PDF FAULT COMPARISON CURVES FOR GAS PULSATION SIGNALS AT
SEVERAL DPS

CHARACTERISING VIBRO-ACOUSTIC SIGNALS OF A RECIPROCATING
COMPRESSOR FOR CONDITION MONITORING
172 DEGREE OF DOCTOR OF PHILOSOPHY (PHD)
FIGURE 8.7: COMPARISON OF HEALTHY AND FAULT PDF PEAKS FOR SEVERAL
DISCHARGE PRESSURES
8.3.2 Root Mean Square and Kurtosis
Figures 8.8 and 8.9 show the RMS and kurtosis plots respectively, for the different discharge
pressures; comparing results of all fault cases including healthy (BL) signal. It is observed from
Figure 8.8 that the RMS values increase gradually with increasing discharge pressure at
0.28MPa, 0.41MPa, and 0.62MPa for all cases. However, at 0.83MPa, there is a slight fall in
the RMS values for DVL and DVL&PLL. Moreover, there are no clear variances in the RMS
values of healthy and faulty cases across all discharge pressures.
FIGURE 8.8: RMS OF GAS PULSATION SIGNAL AGAINST FAULT CASES AT SEVERAL
DISCHARGE PRESSURES

CHARACTERISING VIBRO-ACOUSTIC SIGNALS OF A RECIPROCATING
COMPRESSOR FOR CONDITION MONITORING
173 DEGREE OF DOCTOR OF PHILOSOPHY (PHD)
FIGURE 8.9: KURTOSIS OF GAS PULSATION SIGNAL AGAINST SEVERAL DISCHARGE
PRESSURES FOR ALL CASES
Observing Figure 8.9, the kurtosis of the signals for all cases are greater than the normal
Gaussian distribution, which is 3 (Kwok, 2018), and are therefore classed as heavily tailed. The
kurtosis values are randomly distributed and do not show any trend distinguishing the healthy
case from fault cases.
8.4 Frequency Domain Analysis
Figure 8.10 shows the differences between frequency components from the acoustic pressure
pulsations of the reciprocating compressor under several Discharge Pressures (DP). The
spectrum is characterised by discrete components and broadband noise. For the reciprocating
compressor, the fundamental frequency usually corresponds to the rotational speed of the
compressor at 7.28Hz, and its harmonics make up the discrete components in the spectrum.
The acoustic wave energy is concentrated in the low-frequency regions seen in Figure 8.10.
Therefore, the frequency analysis is tailored to low frequency region (0 to 2500Hz).
The waterfall plots of healthy and fault frequency spectra of each DP are presented in Figures
8.11. The differences in sound pressure levels are not very obvious from these waterfall plots.
However, several resonant modes can be seen. The most obvious is at the maximum discharge
pressure (0.82MPa). In order to analyse the source of sound waves generated at the compressor
head, a scale of one-third octave bands are developed to split the spectrum into specific range
of frequencies giving a more detailed view of the sound spectrum compared to the 1/1 octave
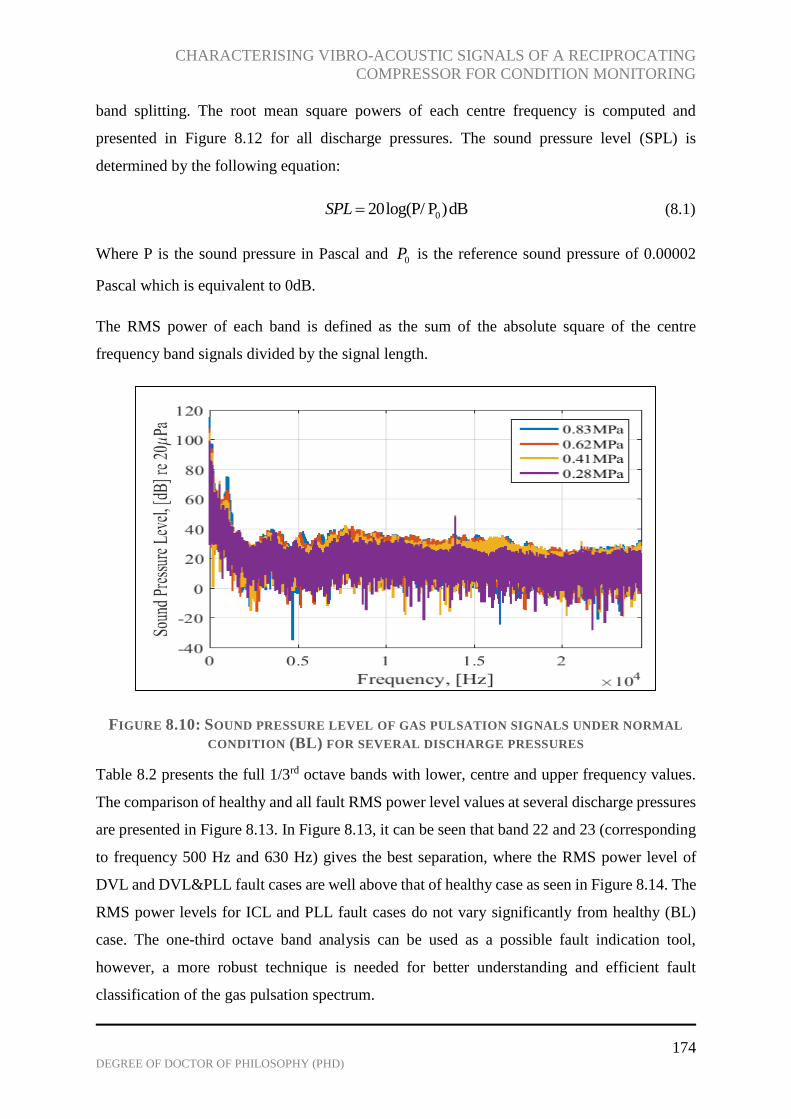
CHARACTERISING VIBRO-ACOUSTIC SIGNALS OF A RECIPROCATING
COMPRESSOR FOR CONDITION MONITORING
174 DEGREE OF DOCTOR OF PHILOSOPHY (PHD)
band splitting. The root mean square powers of each centre frequency is computed and
presented in Figure 8.12 for all discharge pressures. The sound pressure level (SPL) is
determined by the following equation:
020log(P/ P )dBSPL (8.1)
Where P is the sound pressure in Pascal and 0P is the reference sound pressure of 0.00002
Pascal which is equivalent to 0dB.
The RMS power of each band is defined as the sum of the absolute square of the centre
frequency band signals divided by the signal length.
FIGURE 8.10: SOUND PRESSURE LEVEL OF GAS PULSATION SIGNALS UNDER NORMAL
CONDITION (BL) FOR SEVERAL DISCHARGE PRESSURES
Table 8.2 presents the full 1/3rd octave bands with lower, centre and upper frequency values.
The comparison of healthy and all fault RMS power level values at several discharge pressures
are presented in Figure 8.13. In Figure 8.13, it can be seen that band 22 and 23 (corresponding
to frequency 500 Hz and 630 Hz) gives the best separation, where the RMS power level of
DVL and DVL&PLL fault cases are well above that of healthy case as seen in Figure 8.14. The
RMS power levels for ICL and PLL fault cases do not vary significantly from healthy (BL)
case. The one-third octave band analysis can be used as a possible fault indication tool,
however, a more robust technique is needed for better understanding and efficient fault
classification of the gas pulsation spectrum.

CHARACTERISING VIBRO-ACOUSTIC SIGNALS OF A RECIPROCATING
COMPRESSOR FOR CONDITION MONITORING
175 DEGREE OF DOCTOR OF PHILOSOPHY (PHD)
FIGURE 8.11: WATERFALL PLOT OF HEALTHY AND FAULT FREQUENCY SPECTRUM AT
SEVERAL DISCHARGE PRESSURES
FIGURE 8.12: 1/3 OCTAVE BAND SPECTRA OF HEALTHY AND ALL FAULT CASES AT
SEVERAL DISCHARGE PRESSURES
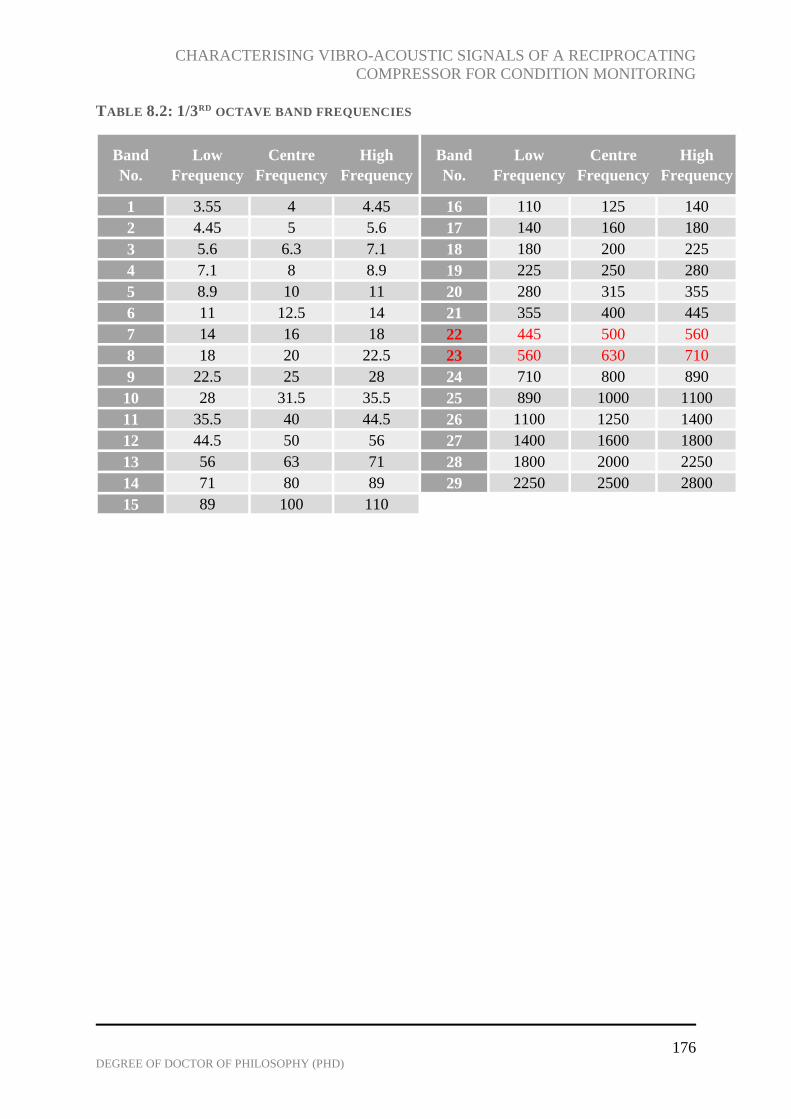
CHARACTERISING VIBRO-ACOUSTIC SIGNALS OF A RECIPROCATING
COMPRESSOR FOR CONDITION MONITORING
176 DEGREE OF DOCTOR OF PHILOSOPHY (PHD)
TABLE 8.2: 1/3RD OCTAVE BAND FREQUENCIES
Band
No.
Low
Frequency
Centre
Frequency
High
Frequency
Band
No.
Low
Frequency
Centre
Frequency
High
Frequency
1 3.55 4 4.45 16 110 125 140
2 4.45 5 5.6 17 140 160 180
3 5.6 6.3 7.1 18 180 200 225
4 7.1 8 8.9 19 225 250 280
5 8.9 10 11 20 280 315 355
6 11 12.5 14 21 355 400 445
7 14 16 18 22 445 500 560
8 18 20 22.5 23 560 630 710
9 22.5 25 28 24 710 800 890
10 28 31.5 35.5 25 890 1000 1100
11 35.5 40 44.5 26 1100 1250 1400
12 44.5 50 56 27 1400 1600 1800
13 56 63 71 28 1800 2000 2250
14 71 80 89 29 2250 2500 2800
15 89 100 110
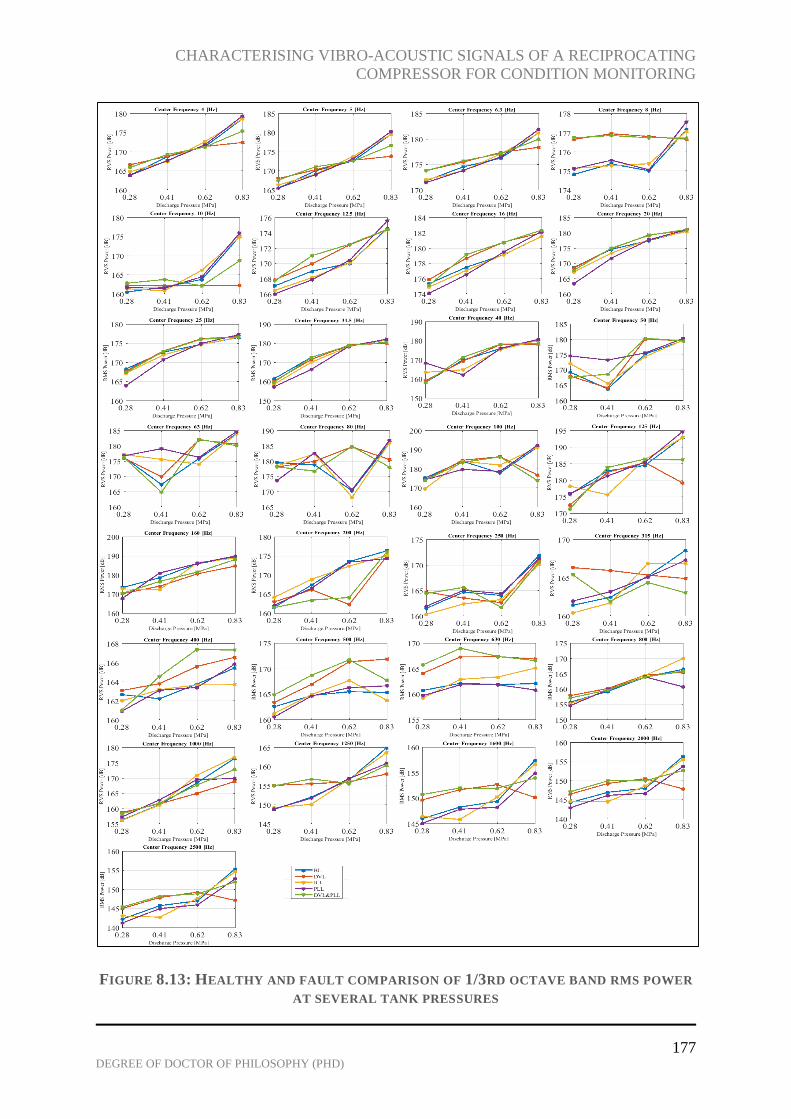
CHARACTERISING VIBRO-ACOUSTIC SIGNALS OF A RECIPROCATING
COMPRESSOR FOR CONDITION MONITORING
177 DEGREE OF DOCTOR OF PHILOSOPHY (PHD)
FIGURE 8.13: HEALTHY AND FAULT COMPARISON OF 1/3RD OCTAVE BAND RMS POWER
AT SEVERAL TANK PRESSURES

CHARACTERISING VIBRO-ACOUSTIC SIGNALS OF A RECIPROCATING
COMPRESSOR FOR CONDITION MONITORING
178 DEGREE OF DOCTOR OF PHILOSOPHY (PHD)
FIGURE 8.14: OCTAVE BANDS WITH BEST FAULT SEPARATION
a)
b)
CHARACTERISING VIBRO-ACOUSTIC SIGNALS OF A RECIPROCATING
COMPRESSOR FOR CONDITION MONITORING
179 DEGREE OF DOCTOR OF PHILOSOPHY (PHD)
CHAPTER NINE
9 ANALYSIS OF VIBRATION SIGNAL USING WAVELET
PACKET TRANSFORM WITH ENVELOPE ANALYSIS
This chapter presents the analysis of vibration signal from a two-stage reciprocating
compressor using wavelet packet transform and envelope analysis. Vibration signal from a
reciprocating compressor are non-stationary and consists of impulsive events, which are
mostly from high turbulent flow excitations, and mechanical valve impacts. This is why
conventional signal processing techniques are unsuitable for condition monitoring of vibration
signals from a reciprocating compressor. Therefore, wavelet packet transform is used to
extract the time-frequency information of the signal and envelope analysis of the reconstructed
signal is computed for fault classification of three common reciprocating compressor fault
cases (second-stage discharge valve leakage, intercooler leakage, and a combination of the
two faults) using the fundamental frequency and the its third harmonic frequency.
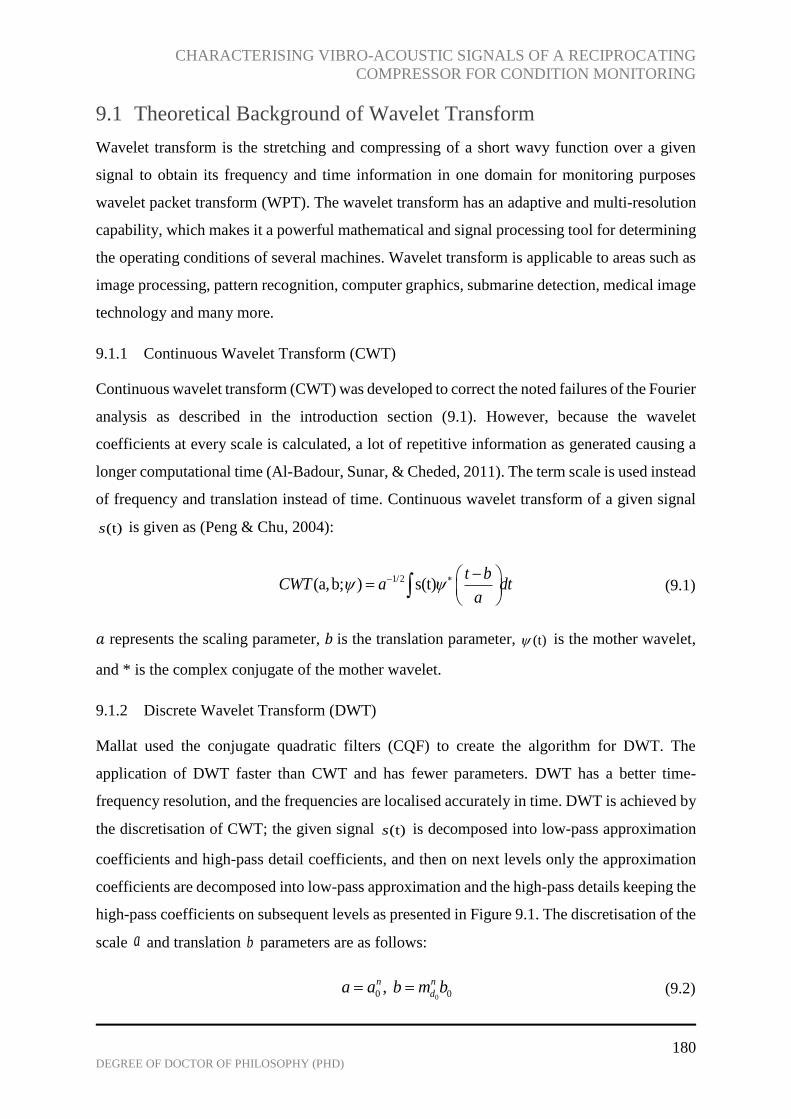
CHARACTERISING VIBRO-ACOUSTIC SIGNALS OF A RECIPROCATING
COMPRESSOR FOR CONDITION MONITORING
180 DEGREE OF DOCTOR OF PHILOSOPHY (PHD)
9.1 Theoretical Background of Wavelet Transform
Wavelet transform is the stretching and compressing of a short wavy function over a given
signal to obtain its frequency and time information in one domain for monitoring purposes
wavelet packet transform (WPT). The wavelet transform has an adaptive and multi-resolution
capability, which makes it a powerful mathematical and signal processing tool for determining
the operating conditions of several machines. Wavelet transform is applicable to areas such as
image processing, pattern recognition, computer graphics, submarine detection, medical image
technology and many more.
9.1.1 Continuous Wavelet Transform (CWT)
Continuous wavelet transform (CWT) was developed to correct the noted failures of the Fourier
analysis as described in the introduction section (9.1). However, because the wavelet
coefficients at every scale is calculated, a lot of repetitive information as generated causing a
longer computational time (Al-Badour, Sunar, & Cheded, 2011). The term scale is used instead
of frequency and translation instead of time. Continuous wavelet transform of a given signal
(t)s is given as (Peng & Chu, 2004):
1/2(a,b; ) s(t)
t bCWT a dt
a
(9.1)
𝑎 represents the scaling parameter, 𝑏 is the translation parameter, (t) is the mother wavelet,
and * is the complex conjugate of the mother wavelet.
9.1.2 Discrete Wavelet Transform (DWT)
Mallat used the conjugate quadratic filters (CQF) to create the algorithm for DWT. The
application of DWT faster than CWT and has fewer parameters. DWT has a better time-
frequency resolution, and the frequencies are localised accurately in time. DWT is achieved by
the discretisation of CWT; the given signal (t)s is decomposed into low-pass approximation
coefficients and high-pass detail coefficients, and then on next levels only the approximation
coefficients are decomposed into low-pass approximation and the high-pass details keeping the
high-pass coefficients on subsequent levels as presented in Figure 9.1. The discretisation of the
scale a and translation b parameters are as follows:
00 0, n n
da a b m b (9.2)

CHARACTERISING VIBRO-ACOUSTIC SIGNALS OF A RECIPROCATING
COMPRESSOR FOR CONDITION MONITORING
181 DEGREE OF DOCTOR OF PHILOSOPHY (PHD)
Where and n m are integers, therefore the continuous wavelet function in equation (9.1)
becomes the discrete wavelets and the discretisation of the scale and time parameter gives the
DWT in equation (9.2) below
/2
0 0 0( , ; ) ( ) ( )m mDWT m n a s t a t nb dt (9.3)
The disadvantage of DWT is that the high-frequency information which might contain fault
features is lost because subsequent detail coefficients are not decomposed.
FIGURE 9.1: THREE LEVELS DISCRETE WAVELET DECOMPOSITION TREE
9.1.3 Wavelet Packet Transform (WPT)
Coifman, Meyer, and wickerhauser extended the DWT to Wavelet packet transform in 1992.
WPT has been found to be a more efficient tool because both low and high frequency
components are decomposed on every level of the decomposition tree (Bendjama, Bouhouche,
& Boucherit, 2012). Figure 9.2 illustrates a 3-level WPT decomposition tree with L
representing the low-frequency approximation coefficients and H high-frequency detail
coefficients. The original signal ( )s t is convoluted with both low and high pass filters and
down-sampled by two to give approximate coefficients (1,0), and L detail coefficients (1,1)H with
Level 1
Level 2
Level 3
(1,0)L(1,1)H
(2,0)LL(2,1)LH
(3,0)LLL (3,1)LLH

CHARACTERISING VIBRO-ACOUSTIC SIGNALS OF A RECIPROCATING
COMPRESSOR FOR CONDITION MONITORING
182 DEGREE OF DOCTOR OF PHILOSOPHY (PHD)
length half the size of the original signal. The low pass and high pass filters are applied again
to the decomposed signal in level two to give four sub-bands (2,0) (2,1) (2,2) (2,3)( , , , )LL LH HL HH
of decomposed signals with one-fourth the signal length (Saleh & Rahman, 2005). The process
is repeated until all levels are decomposed. The wavelet packet has three integers , , and mi n ,
which represent the modulation, scale and translation parameters respectively. The wavelet
functions are determined from the recursive equations given below (Rafiee, Tse, Harifi, &
Sadeghi, 2009)
2 ( ) 2 ( ) 2n it h m t m
(9.4)
2 1( ) 2 ( ) 2n it g m t m
(9.5)
The original signal ( )s t after n level of decomposition is defined as:
2
1
( )n
i
n
i
s t s t
(9.6)
While the wavelet packet signal is given as follows:
, ,( ) ( )i i i
n n m n m
m
s t c t t
(9.7)
Where the wavelet packet coefficients , ( )i
n mc t are calculated by (Rafiee, Tse, Harifi, &
Sadeghi, 2009):
,( ) ( )i i
n n mc t s t t dt
(9.8)

CHARACTERISING VIBRO-ACOUSTIC SIGNALS OF A RECIPROCATING
COMPRESSOR FOR CONDITION MONITORING
183 DEGREE OF DOCTOR OF PHILOSOPHY (PHD)
FIGURE 9.2: ILLUSTRATION OF THREE LEVEL WAVELET PACKET TRANSFORM
DECOMPOSITION TREE
9.2 Selecting Mother Wavelet
There are several types of mother wavelets used for signal transformation and they are
classified as either orthogonal, biorthogonal, or nonorthogonal (chui, 1997). The orthogonal
wavelet families include Daubechies, Coiflet, and Symlet, while B-Spline is classed as
biorthogonal wavelet. Morlet and Mexican Hat fall under the non-orthogonal wavelet class
(chui, 1997); (Zaman, 2003). Until date, there are no standardised guidelines for selecting the
best mother wavelet or scale level for any particular application (Chrfi, ALHaddad, & Franqois
, 2004). Charfi et al. used Daubechies (db4) to investigate the characteristics of an incipient
fault in a three-phase induction motor drive after analysing several mother wavelets (Chrfi,
ALHaddad, & Franqois , 2004). Bendjama et al. found Daubechies_4 (Db4) to be more
effective for diagnosing faults from vibration signals (Bendjama, Bouhouche, & Boucherit,
Level 1
Level 2
Level 3
(1,0)L(1,1)H
(2,0)LL(2,1)LH
(3,0)LLL(3,1)LLH
(2,3)HH(2,2)HL
(3,2)LHL(3,3)LHH (3,4)HLL (3,5)HLH
(3,6)HHL (3,7)HHH

CHARACTERISING VIBRO-ACOUSTIC SIGNALS OF A RECIPROCATING
COMPRESSOR FOR CONDITION MONITORING
184 DEGREE OF DOCTOR OF PHILOSOPHY (PHD)
2012); also, findings by Al-Badour et al., found that Daubechies and Meyer to be the best
mother wavelets for transient vibration signals (Al-Badour, Sunar, & Cheded, 2011).
It is important to choose the optimal mother wavelet for any particular application because
studies have found that the choice of mother wavelet will affect results obtained by the wavelet
packet transform (Chrfi, ALHaddad, & Franqois , 2004). Kumar and Sriram mentioned in their
study on selecting optimal mother wavelet that scholars’ (Yan R. , 2007), and (Gao & Yan,
2011) employed two approaches when selecting the best wavelet basis (Kankar, Satish, &
Harsha, 2011). A qualitative approach, which is based on the properties of the mother wavelet
(such as orthogonality, compact support, symmetry, and vanishing moment) and the signal
shape similarity to the chosen mother wavelet. The second approach is based on quantitative
means, which is much easier to implement compared to visual matching of signal shape to
mother wavelet (Kumar, Srinivasa, Sriram, & Vijay, 2014). In recent years, several researchers
have studied quantitative means greatly. For instance, Ruqiang used energy to entropy ratio
and mini-max information criterion to choose an optimal wavelet basis for bearing vibration
signal. Kumar and his colleagues used minimum Shannon entropy criteria with maximum
energy to Shannon entropy ratio criterion to determine the optimal mother wavelet for bearing
vibration signal (Kumar, Srinivasa, Sriram, & Vijay, 2014).
For this study, Daubechies, Coiflet, Symlet, B-Spline and discrete Meyer wavelets were studied
intensively based on trial and error. The Coiflet wavelet function with one vanishing moment
(Coif1) was chosen because it gave the best fault separation result. Four levels of
decomposition were implemented on the reciprocating compressor vibration signal using
Coiflet wavelet. Level 4 decomposition was appropriate because higher levels did not give
good time localisation and lower levels gave poor frequency resolutions. Care was taken in
choosing the best wavelet packet node (frequency band); after several investigations the
percentage energy was used to choose the best wavelet packet node, which offered maximum
feature separation (Yen & Lin, 2000).
9.3 Envelope Analysis
Envelope analysis is a useful signal processing tool for monitoring machine condition. It is
based on Hilbert transform^
( )s t , which creates a special analytical signal of a complex function.
Envelope analysis is achieved by first band pass filtering of the signal, then envelope extraction
of the filtered signal using Hilbert transform is performed, and finally spectrum extraction of

CHARACTERISING VIBRO-ACOUSTIC SIGNALS OF A RECIPROCATING
COMPRESSOR FOR CONDITION MONITORING
185 DEGREE OF DOCTOR OF PHILOSOPHY (PHD)
the enveloped signal using Fast Fourier Transform (FFT) (Tse, Peng, & Yam, 2001); (Yaqub,
Gondal, & Kamruzzaman, 2011). Hilbert transform equation of a given signal ( )s t can be
defined as follows (Wang X. , 2006):
1 1
(t) ( )s
s s t dt t
(9.9)
It can be seen from equation (9.9) above that, the Hilbert function is a convolution with an
impulse function 1 ( )t . Envelope analysis is applied to the selected wavelet packet node to
extract the characteristic features for fault classification of the vibration signal.
9.4 Experimental Setup
The experimental setup of the reciprocating compressor is described in chapter four section
4.2.1. Figure 8.1 presents a schematic of the reciprocating compressor rig setup with
specifications of supporting components listed in Table 6.1.
Seven main sensors including two pressure transducers, two accelerometers, two
thermocouples and an encoder are used for collecting vital data from this machine. One
pressure transducer is seeded into each cylinder, one accelerometer mounted on each cylinder
head, one thermocouple on each cylinder body and an encoder on the flywheel.
9.5 Test Procedure
The reciprocating compressor piston in the first cylinder travels from top-dead centre (TDC)
to bottom-dead centre (BDC), atmospheric air is collected and filtered into the cylinder, as the
piston moves back up to TDC the filtered air is compressed and eventually discharged into the
intercooler when the pressure of the compressed air exceeds that in the intercooler. The high-
pressured air released into the intercooler is cooled before entering the suction chamber of the
second-stage cylinder, and as the piston of this cylinder travels back up to TDC, compressed
air is discharged into the tank receiver once its pressure exceeds that in the receiver. The tank
receiver stores the compressed air until the maximum pressure capacity is reached then the
system shutdowns automatically if not stopped manually.
The sampling frequency is set at 49,019 Hz, and 32768 data samples are collected for five
discharge pressures (0.55MPa, 0.83MPa). Vibration signal is only collected from the second-
stage (high-pressure) cylinder because previous findings have found that the fault effects are
more prominent from the high pressure cylinder. The cases investigated are: baseline (BL),

CHARACTERISING VIBRO-ACOUSTIC SIGNALS OF A RECIPROCATING
COMPRESSOR FOR CONDITION MONITORING
186 DEGREE OF DOCTOR OF PHILOSOPHY (PHD)
second-stage discharge valve leakage (DVL), intercooler leakage (ICL), and a combined fault
of the second-stage discharge valve and intercooler leakages (DVL+ICL).
9.6 Results and Discussion
9.6.1 Traditional Time Domain and Frequency Domain Analysis
The RMS value is a popular statistical tool for identifying changes in machine condition.
However, in cases where the signal contains information from multiple components, RMS
computation might not be very efficient in detecting faults in certain cases as can be seen in
Figure 7.7. Amplitude trends for investigated cases and tank pressures are random and therefore
unsuitable for effective condition monitoring.
The vibration spectrum in Figure 9.3b and 9.4b, presents a broad picture of the frequency
content of each signal. Individual frequency components and noise levels of the signal can be
identified and tracked. Although, a simple spectrum analysis is not a very suitable technique
for effectively analysing faults on a reciprocating compressor because of its non-stationary
signal characteristics and high noise levels. However, useful information about the compressor
dynamics can be obtained by examining the signal frequency content.
FIGURE 9.3: TIME WAVEFORM AND B) FREQUENCY SPECTRUM OF NORMAL (BL)
VIBRATION SIGNAL AT 0.83MPA TANK PRESSURE
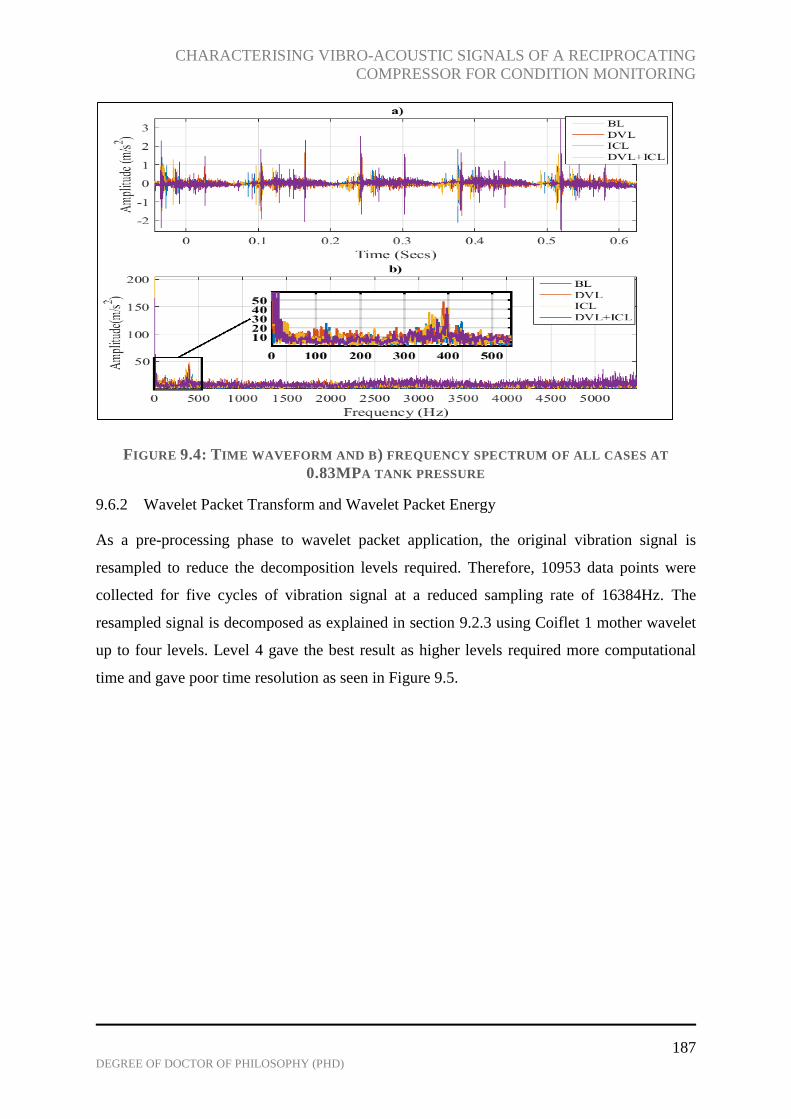
CHARACTERISING VIBRO-ACOUSTIC SIGNALS OF A RECIPROCATING
COMPRESSOR FOR CONDITION MONITORING
187 DEGREE OF DOCTOR OF PHILOSOPHY (PHD)
FIGURE 9.4: TIME WAVEFORM AND B) FREQUENCY SPECTRUM OF ALL CASES AT
0.83MPA TANK PRESSURE
9.6.2 Wavelet Packet Transform and Wavelet Packet Energy
As a pre-processing phase to wavelet packet application, the original vibration signal is
resampled to reduce the decomposition levels required. Therefore, 10953 data points were
collected for five cycles of vibration signal at a reduced sampling rate of 16384Hz. The
resampled signal is decomposed as explained in section 9.2.3 using Coiflet 1 mother wavelet
up to four levels. Level 4 gave the best result as higher levels required more computational
time and gave poor time resolution as seen in Figure 9.5.
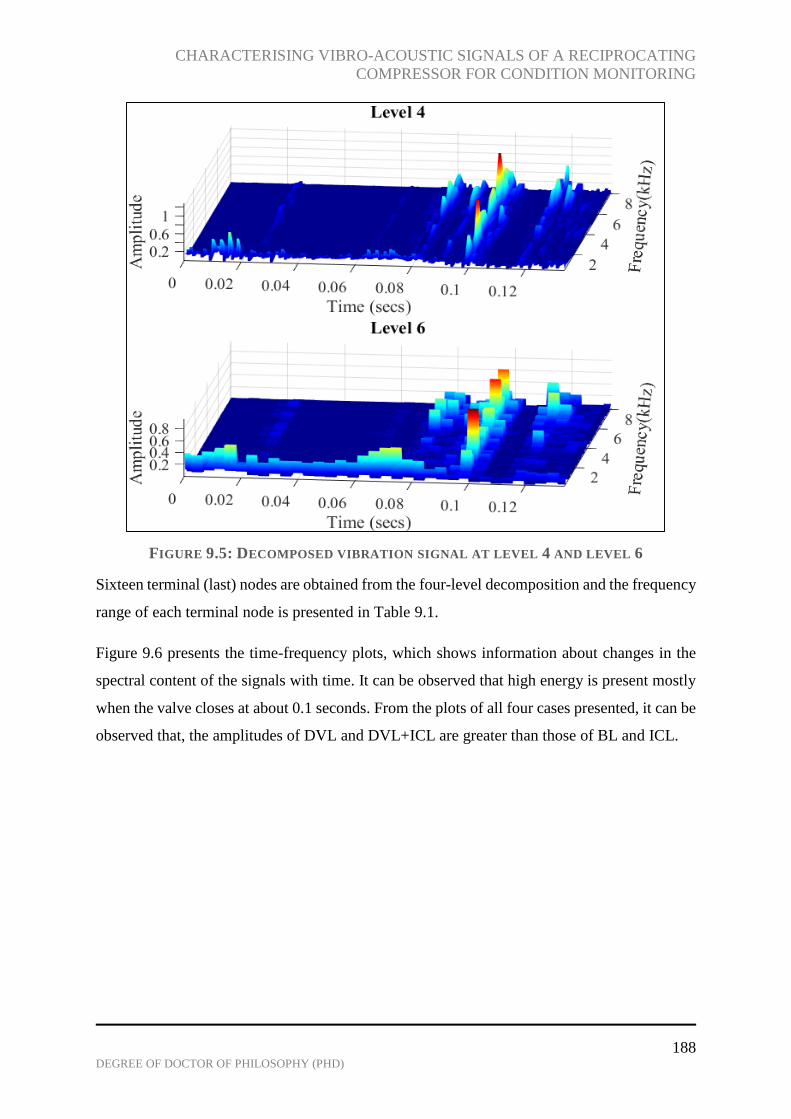
CHARACTERISING VIBRO-ACOUSTIC SIGNALS OF A RECIPROCATING
COMPRESSOR FOR CONDITION MONITORING
188 DEGREE OF DOCTOR OF PHILOSOPHY (PHD)
FIGURE 9.5: DECOMPOSED VIBRATION SIGNAL AT LEVEL 4 AND LEVEL 6
Sixteen terminal (last) nodes are obtained from the four-level decomposition and the frequency
range of each terminal node is presented in Table 9.1.
Figure 9.6 presents the time-frequency plots, which shows information about changes in the
spectral content of the signals with time. It can be observed that high energy is present mostly
when the valve closes at about 0.1 seconds. From the plots of all four cases presented, it can be
observed that, the amplitudes of DVL and DVL+ICL are greater than those of BL and ICL.
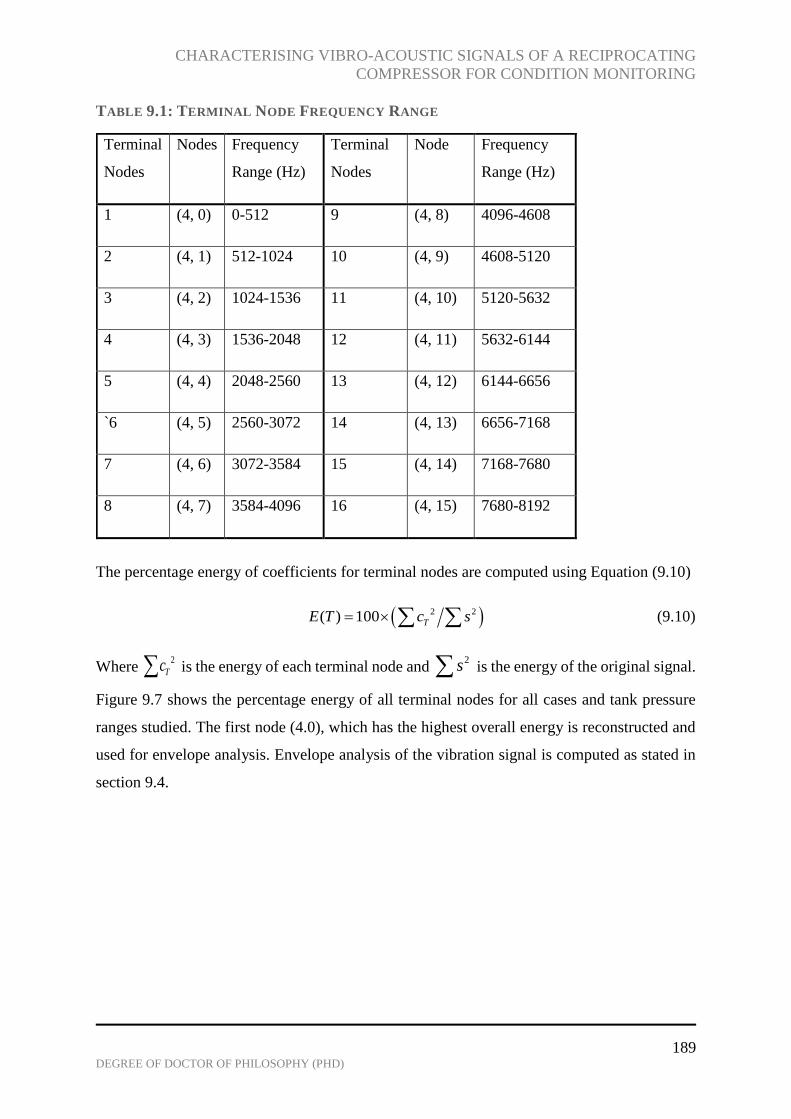
CHARACTERISING VIBRO-ACOUSTIC SIGNALS OF A RECIPROCATING
COMPRESSOR FOR CONDITION MONITORING
189 DEGREE OF DOCTOR OF PHILOSOPHY (PHD)
TABLE 9.1: TERMINAL NODE FREQUENCY RANGE
The percentage energy of coefficients for terminal nodes are computed using Equation (9.10)
2 2( ) 100 TE T c s (9.10)
Where 2
Tc is the energy of each terminal node and 2s is the energy of the original signal.
Figure 9.7 shows the percentage energy of all terminal nodes for all cases and tank pressure
ranges studied. The first node (4.0), which has the highest overall energy is reconstructed and
used for envelope analysis. Envelope analysis of the vibration signal is computed as stated in
section 9.4.
Terminal
Nodes
Nodes Frequency
Range (Hz)
Terminal
Nodes
Node Frequency
Range (Hz)
1 (4, 0) 0-512 9 (4, 8) 4096-4608
2 (4, 1) 512-1024 10 (4, 9) 4608-5120
3 (4, 2) 1024-1536 11 (4, 10) 5120-5632
4 (4, 3) 1536-2048 12 (4, 11) 5632-6144
5 (4, 4) 2048-2560 13 (4, 12) 6144-6656
`6 (4, 5) 2560-3072 14 (4, 13) 6656-7168
7 (4, 6) 3072-3584 15 (4, 14) 7168-7680
8 (4, 7) 3584-4096 16 (4, 15) 7680-8192
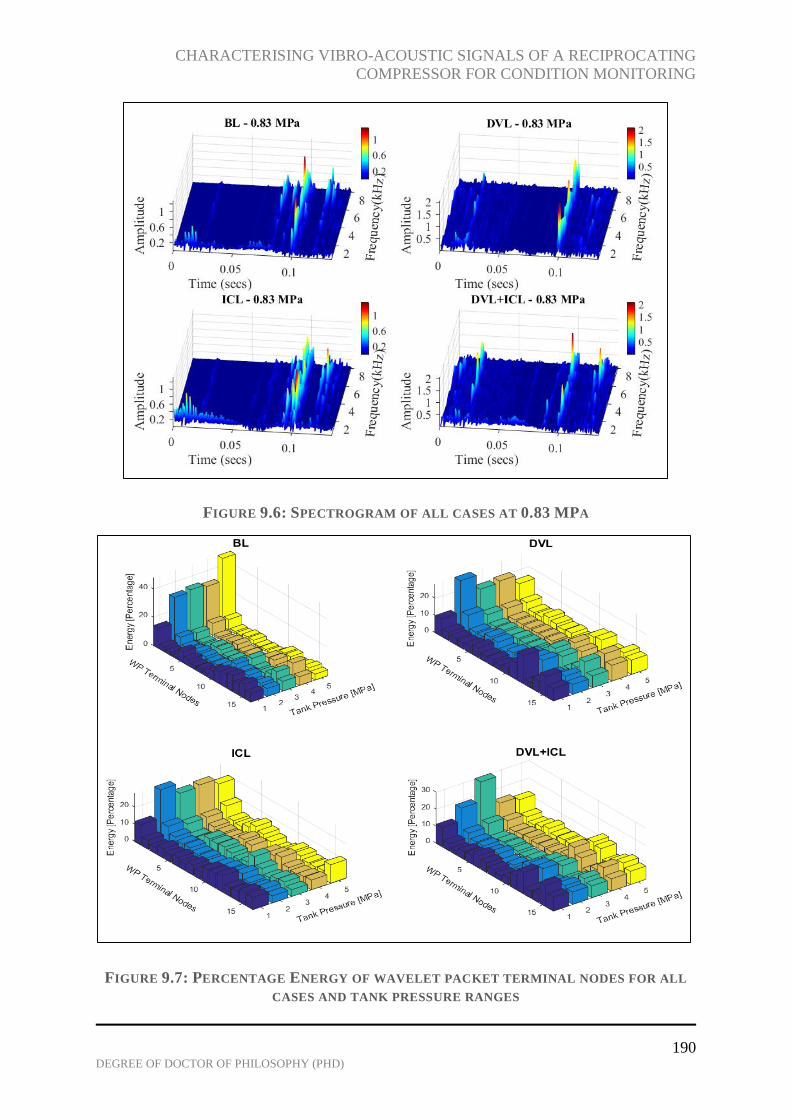
CHARACTERISING VIBRO-ACOUSTIC SIGNALS OF A RECIPROCATING
COMPRESSOR FOR CONDITION MONITORING
190 DEGREE OF DOCTOR OF PHILOSOPHY (PHD)
FIGURE 9.6: SPECTROGRAM OF ALL CASES AT 0.83 MPA
FIGURE 9.7: PERCENTAGE ENERGY OF WAVELET PACKET TERMINAL NODES FOR ALL
CASES AND TANK PRESSURE RANGES
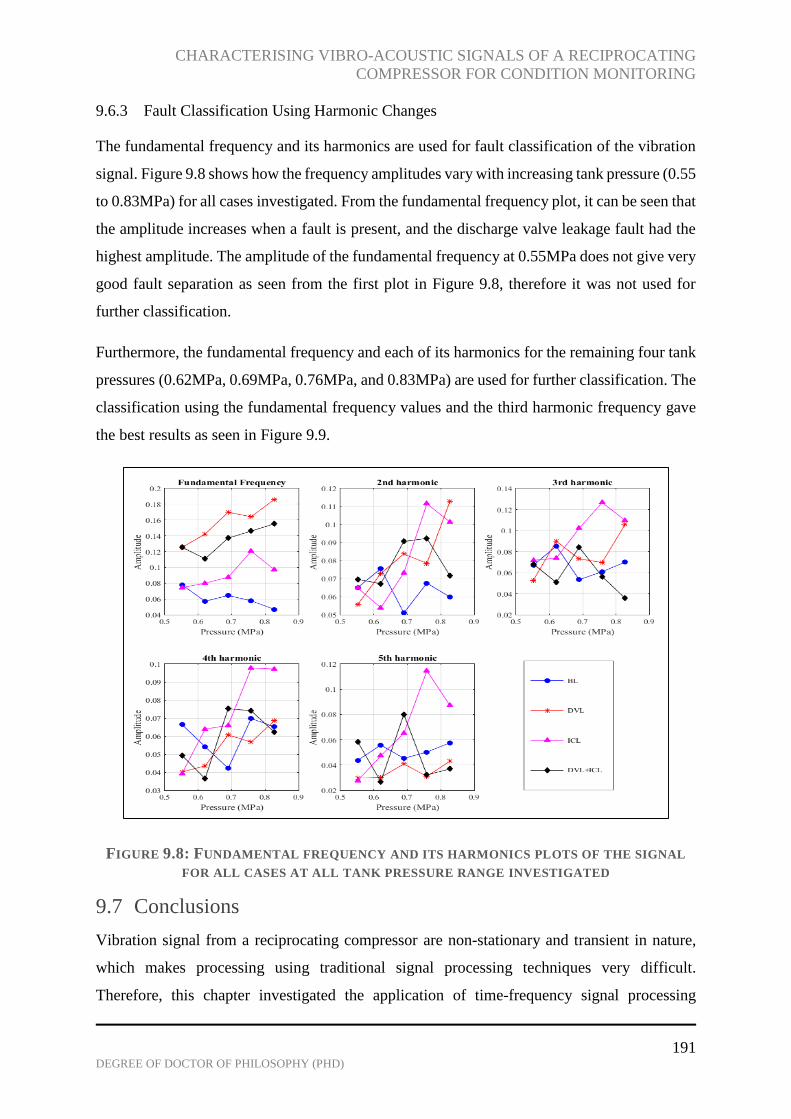
CHARACTERISING VIBRO-ACOUSTIC SIGNALS OF A RECIPROCATING
COMPRESSOR FOR CONDITION MONITORING
191 DEGREE OF DOCTOR OF PHILOSOPHY (PHD)
9.6.3 Fault Classification Using Harmonic Changes
The fundamental frequency and its harmonics are used for fault classification of the vibration
signal. Figure 9.8 shows how the frequency amplitudes vary with increasing tank pressure (0.55
to 0.83MPa) for all cases investigated. From the fundamental frequency plot, it can be seen that
the amplitude increases when a fault is present, and the discharge valve leakage fault had the
highest amplitude. The amplitude of the fundamental frequency at 0.55MPa does not give very
good fault separation as seen from the first plot in Figure 9.8, therefore it was not used for
further classification.
Furthermore, the fundamental frequency and each of its harmonics for the remaining four tank
pressures (0.62MPa, 0.69MPa, 0.76MPa, and 0.83MPa) are used for further classification. The
classification using the fundamental frequency values and the third harmonic frequency gave
the best results as seen in Figure 9.9.
FIGURE 9.8: FUNDAMENTAL FREQUENCY AND ITS HARMONICS PLOTS OF THE SIGNAL
FOR ALL CASES AT ALL TANK PRESSURE RANGE INVESTIGATED
9.7 Conclusions
Vibration signal from a reciprocating compressor are non-stationary and transient in nature,
which makes processing using traditional signal processing techniques very difficult.
Therefore, this chapter investigated the application of time-frequency signal processing
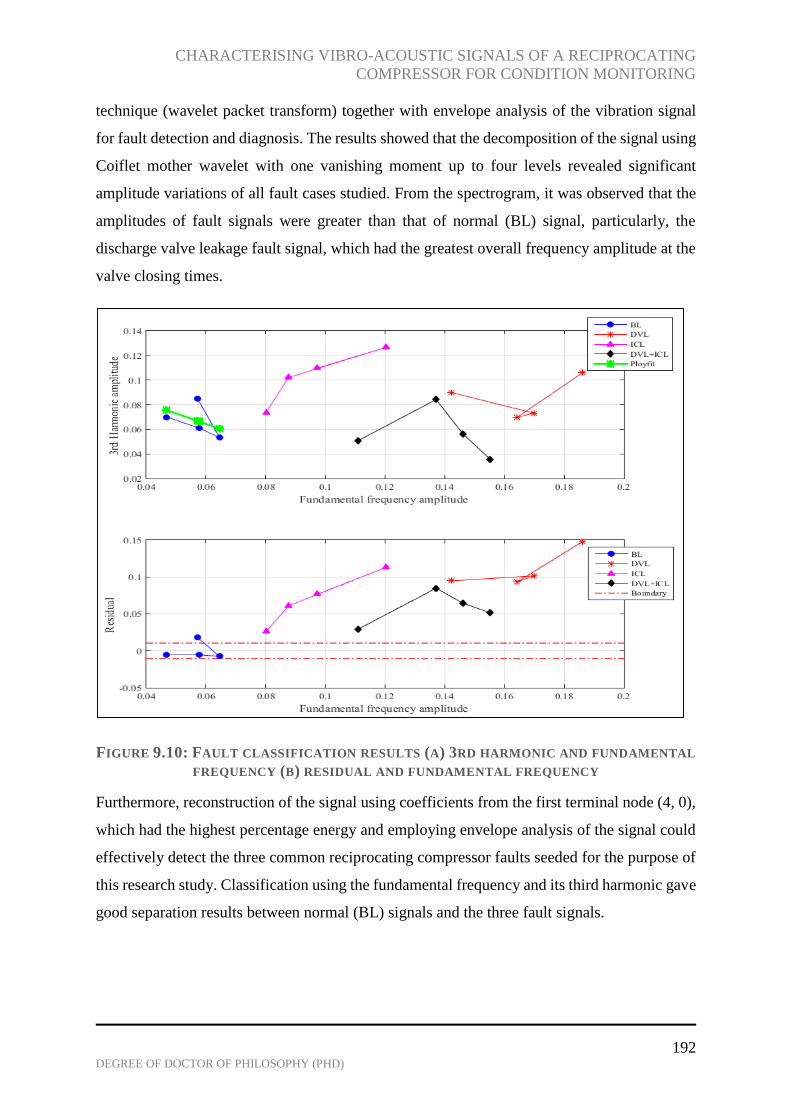
CHARACTERISING VIBRO-ACOUSTIC SIGNALS OF A RECIPROCATING
COMPRESSOR FOR CONDITION MONITORING
192 DEGREE OF DOCTOR OF PHILOSOPHY (PHD)
technique (wavelet packet transform) together with envelope analysis of the vibration signal
for fault detection and diagnosis. The results showed that the decomposition of the signal using
Coiflet mother wavelet with one vanishing moment up to four levels revealed significant
amplitude variations of all fault cases studied. From the spectrogram, it was observed that the
amplitudes of fault signals were greater than that of normal (BL) signal, particularly, the
discharge valve leakage fault signal, which had the greatest overall frequency amplitude at the
valve closing times.
FIGURE 9.10: FAULT CLASSIFICATION RESULTS (A) 3RD HARMONIC AND FUNDAMENTAL
FREQUENCY (B) RESIDUAL AND FUNDAMENTAL FREQUENCY
Furthermore, reconstruction of the signal using coefficients from the first terminal node (4, 0),
which had the highest percentage energy and employing envelope analysis of the signal could
effectively detect the three common reciprocating compressor faults seeded for the purpose of
this research study. Classification using the fundamental frequency and its third harmonic gave
good separation results between normal (BL) signals and the three fault signals.
CHARACTERISING VIBRO-ACOUSTIC SIGNALS OF A RECIPROCATING
COMPRESSOR FOR CONDITION MONITORING
193 DEGREE OF DOCTOR OF PHILOSOPHY (PHD)
CHAPTER TEN
+
10 ANALYSIS OF DISCHARGE GAS PULSATIONS USING
WAVELET PACKET TRANSFORM WITH ENVELOPE
ANALYSIS
This chapter presents the analysis of gas pulsation signal from a two-stage reciprocating
compressor using wavelet packet transform and envelope analysis. Gas pulsation signals from
a reciprocating compressor are non-stationary in nature and consists of resonance
frequencies, which can be detrimental to the system if significantly high in amplitude. Wavelet
packet decomposition is used to divide the signal into bands before de-nosing individual bands
using an adaptive hard threshold based on standard deviation. Furthermore, envelope analysis
of the reconstructed signal is computed for each band and the band with the best root mean
square fault variation is used for classification by means of statistical features (kurtosis and
entropy plot).
The results show wavelet packet decomposition allows for easy band-pass filtering for further
analysis on the chosen band of interest aiding fault detection and condition monitoring of
reciprocating compressors. I also shows that gas pulsation signals can be used to identify the
systems resonance but the main difficulty is in identifying the source of resonance.

CHARACTERISING VIBRO-ACOUSTIC SIGNALS OF A RECIPROCATING
COMPRESSOR FOR CONDITION MONITORING
194 DEGREE OF DOCTOR OF PHILOSOPHY (PHD)
10.1 Gas Pulsation Source and Resonance Assessment
The flow of gas through the discharge chamber and piping system of the reciprocating
compressor are unsteady and contains time varying pulses superimposed on the steady
(average) flow. Figure 10.1 shows a typical flow pulsation signal through the valves of the
reciprocating compressor cylinder head indicating the compressor process within a cycle and
the valve opening and closing times. These pulses are made-up of the geometrical, physical
and mechanical characteristics of the compressor (Shejal & Desai, 2014).The frequencies of
the signal are functions of the mechanical features of the compressor, while the acoustical
response in the discharge chamber and piping systems are functions of the mechanical and fluid
characteristics of the compressor, also it is hugely a function of the acoustical network by the
adjoining discharge chamber, piping systems and, storage units/or dampeners.
Figure 10.2 lists the sources of gas pulsation from a reciprocating compressor.
FIGURE 10.1: GAS PULSATIONS WAVES FROM THE DISCHARGE CHAMBER OF A
HEALTHY R.C AT 0.827MPA
Suction
Compression
Discharge
Suction
Exp
an
sio
n

CHARACTERISING VIBRO-ACOUSTIC SIGNALS OF A RECIPROCATING
COMPRESSOR FOR CONDITION MONITORING
195 DEGREE OF DOCTOR OF PHILOSOPHY (PHD)
FIGURE 10.2: SOURCES OF RECIPROCATING COMPRESSOR GAS PULSATIONS
10.1.1 Simplified Resonance Assessment of the System
Resonances (dynamic pressure amplification) occur when a harmonic of the compressor
running speed matches or is close to the acoustical natural frequency of the dampener. These
resonances are either simple organ-pipe resonances or of complex modes involving the
discharge chamber and the piping system. Resonances are detrimental to the system because
they create unbalanced forces that amplify vibrations causing high levels of noise and
shortening compressor valve life if not avoided or controlled (Shejal & Desai, 2014); (Enzo,
Marco, Matteo , & Stefano , 2006).
10.1.1.1 Quarter-Wavelength Resonance
The pipe lengths determine the acoustic natural frequencies depending on the boundary
conditions (open and/ or closed ends) illustrated in Figure 10.3. If the natural frequency of the
compressor occur at integer multiple of half or a quarter of the wavelength of the piping system,
an acoustical resonance can be excited (Greenfield, & Luis de la Roche, 2018).

CHARACTERISING VIBRO-ACOUSTIC SIGNALS OF A RECIPROCATING
COMPRESSOR FOR CONDITION MONITORING
196 DEGREE OF DOCTOR OF PHILOSOPHY (PHD)
FIGURE 10.3: A) MODE SHAPE OF HALF WAVE RESPONSE B) MODE SHAPE OF QUARTER
WAVE RESPONSE
The formulas for half wave resonance ( hwf ) and quarter wave resonance ( qwf ) are given by
the following respective equations (Schwartz & Nelson, 1984) :
2
hw
p
af n
L (10.1)
(2 1)2
qw
p
af n
L (10.2)
Where a is the speed of sound in air, pL is the pipe length, and (1,2,3,...)n harmonic . The
discharge chamber-pipe configuration of the reciprocating compressor is analysed as an open-
closed end system and therefore Equation 10.2 is used to calculate its quarter wave resonance
frequency and eight harmonics of the simplified system presented in Figure 10.4. The speed of
sound a in the discharge plenum of the reciprocating compressor (RC) is calculated using
equation 10.3 for several discharge pressures are presented in Figure 10.5. For this study, four
discharge pressure ranges are investigated (0.28MPa, 0.42MPa, 0.62MPa and, 0.83MPa) and
their acoustic natural frequencies based on the quarter-wave length Equation 10.2 are presented
in Table 10.1. These values presented in Table 10.1 constitute the excitation frequencies where
resonances are expected for the respective discharge pressures.
a RT (10.3)
a) b)
1f
2f
3f
Pipe close at both ends Pipe open at both ends Pipe open at one end and closed
end at other end

CHARACTERISING VIBRO-ACOUSTIC SIGNALS OF A RECIPROCATING
COMPRESSOR FOR CONDITION MONITORING
197 DEGREE OF DOCTOR OF PHILOSOPHY (PHD)
Where is the specific heat ratio for air 𝑎𝑡 1.4, 𝑅 is the gas constant at 287𝑚2𝑠−2𝐾−1 for air
and T the absolute temperature of the gas in the cylinder is calculated using equation 5.30 in
chapter five.
When analysing the effects of pulsations in a reciprocating compressor system, it is important
to determine the maximum pulsation. This is obtained using the wavelength, speed of sound
and, frequency relations described below (Greenfield, & Luis de la Roche, 2018):
qw
af
(10.4)
FIGURE 10.4: SIMPLIFIED MODEL OF THE DISCHARGE CHAMBER AND STORAGE TANK
PIPE CONFIGURATION WITH DIMENSIONS IN [MM]
FIGURE 10.5: SPEED OF SOUND IN GAS FOR SEVERAL DISCHARGE PRESSURES OF THE
RC
44.414
6.7
8
254
12
19
366.2
Vc1Vt
LpDp 24.78
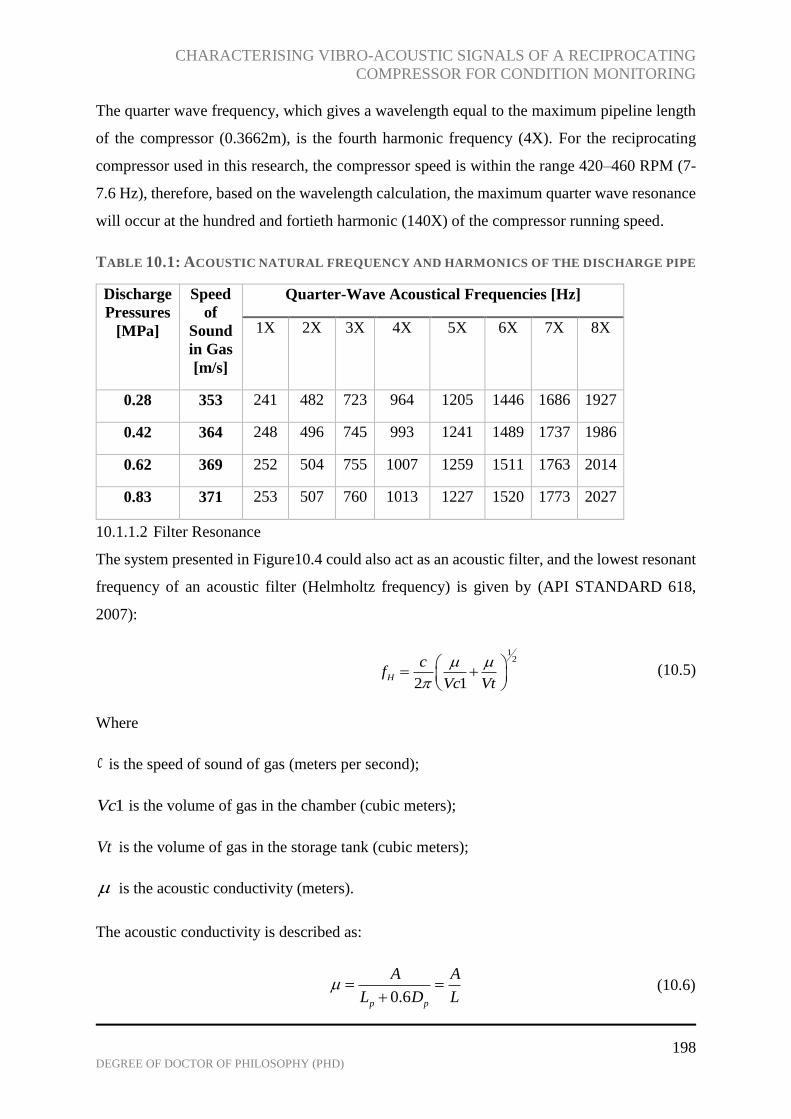
CHARACTERISING VIBRO-ACOUSTIC SIGNALS OF A RECIPROCATING
COMPRESSOR FOR CONDITION MONITORING
198 DEGREE OF DOCTOR OF PHILOSOPHY (PHD)
The quarter wave frequency, which gives a wavelength equal to the maximum pipeline length
of the compressor (0.3662m), is the fourth harmonic frequency (4X). For the reciprocating
compressor used in this research, the compressor speed is within the range 420–460 RPM (7-
7.6 Hz), therefore, based on the wavelength calculation, the maximum quarter wave resonance
will occur at the hundred and fortieth harmonic (140X) of the compressor running speed.
TABLE 10.1: ACOUSTIC NATURAL FREQUENCY AND HARMONICS OF THE DISCHARGE PIPE
Discharge
Pressures
[MPa]
Speed
of
Sound
in Gas
[m/s]
Quarter-Wave Acoustical Frequencies [Hz]
1X 2X 3X 4X 5X 6X 7X 8X
0.28 353 241 482 723 964 1205 1446 1686 1927
0.42 364 248 496 745 993 1241 1489 1737 1986
0.62 369 252 504 755 1007 1259 1511 1763 2014
0.83 371 253 507 760 1013 1227 1520 1773 2027
10.1.1.2 Filter Resonance
The system presented in Figure10.4 could also act as an acoustic filter, and the lowest resonant
frequency of an acoustic filter (Helmholtz frequency) is given by (API STANDARD 618,
2007):
12
2 1H
cf
Vc Vt
(10.5)
Where
c is the speed of sound of gas (meters per second);
1Vc is the volume of gas in the chamber (cubic meters);
Vt is the volume of gas in the storage tank (cubic meters);
is the acoustic conductivity (meters).
The acoustic conductivity is described as:
0.6p p
A A
L D L
(10.6)

CHARACTERISING VIBRO-ACOUSTIC SIGNALS OF A RECIPROCATING
COMPRESSOR FOR CONDITION MONITORING
199 DEGREE OF DOCTOR OF PHILOSOPHY (PHD)
Where
A is the internal cross-sectional area of the chamber (square meters);
pL is the actual length of the pipe (meters);
L is the acoustic length of the pipe (meters);
pD is the diameter of the pipe (meters).
The calculated Helmholtz frequencies of the simplified model of the discharge chamber
pipeline at several discharge pressures are presented in Table 10.2. Since the Helmholtz
frequencies are very close to the calculated quarter wave frequencies, it can be assumed that
the system in Figure 10.4 acts also as a Helmholtz resonator.
TABLE 10.2: HELMHOLTZ RESONANT FREQUENCIES OF THE RC AT SEVERAL TANK
PRESSURES
Discharge
Pressures
[MPa]
Speed
of
Sound
in Gas
[m/s]
Helmholtz Frequencies [Hz]
1X 2X 3X 4X 5X 6X 7X 8X
0.28 353 235 450 705 939 1174 1409 1644 1879
0.42 364 242 484 726 968 1210 1452 1694 1936
0.62 369 246 491 736 982 1227 1473 1718 1964
0.83 371 247 494 741 988 1235 1482 1729 1976
10.1.2 Gas Pulsation Propagation Simulation
Pressure and flow waves caused by a reciprocating compressor are modelled as one-
dimensional waves. The computer programs used in simulating pressure pulsations can be
classified into two groups, namely; frequency domain programs and time domain programs
(Ghanbariannaeeni & Ghazanfarihashemi, 2014).
The simpler frequency domain programs are based on acoustic plane wave theory and do not
include nonlinearities unlike the time domain programs which also account for time-varying
boundary conditions at the valves (Ghanbariannaeeni & Ghazanfarihashemi, 2014). Several
studies have shown that the time domain models are more accurate than the older frequency

CHARACTERISING VIBRO-ACOUSTIC SIGNALS OF A RECIPROCATING
COMPRESSOR FOR CONDITION MONITORING
200 DEGREE OF DOCTOR OF PHILOSOPHY (PHD)
domain models although, the program requires longer solution time (Ghanbariannaeeni &
Ghazanfarihashemi, 2014), (Brejaud, Higelin, Charlet, & Chamaillard, 2011). Characteristics
method and finite difference method are two of the most popular time-domain model programs
used to predict piping acoustics.
The continuity equation, momentum and energy equations are the three conservation laws that
govern gas pulsation propagation through a medium. Gas pulsation propagation simulation is
beyond the scope of this research and therefore would not be investigated. For more detailed
on gas pulsation propagation simulation refer to Brejaud, Higelin, Charlet, & Chamaillard,
2011, Benson, 1982, and Winterbone , Pearson, & Horlock, 2000.
10.2 Application of Wavelet Packet Transform
Several signal processing techniques including wavelet transform (Ogbulafor, Guojin, Mones,
Gu, & Ball, 2017), empirical mode decomposition (Muo, Madamedon, Gu, & Ball, 2017), (Lei,
Lin, He, & Zuo, 2013), Wigner-Ville distribution (Baydar & Ball, 2001), and singular value
decomposition (Yang & Tse, 2003) have been explored for feature extraction, signal de-
noising, enhancing weak feature extraction, signal decomposition and many more. Among
these signal-processing methods, wavelet transform is most commonly used for analysing non-
stationary signals. Wavelet transform provides a platform whereby the signal can be
represented in both time and frequency domain. The principle of wavelet transform and the
three common wavelet transform categories are discussed in chapter nine.
The wavelet packet transform is employed in this study to decompose the gas pulsation signal
from the compressor into low and high frequency bands because of its excellent high-frequency
resolution property. The gas pulsation analysis in time-frequency domain gives robust
information about the signal compared to time domain and frequency domain analysis
separately. By employing wavelet transform, it is possible to understand the effects of several
frequency bands of the gas pulsation signal.
The combination of wavelet packet transform and envelope analysis is proposed for detection of
common reciprocating compressor faults in several frequency bands. The flow chart in Figure 10.6
shows the diagnostic approach to faults on a reciprocating compressor through the gas pulsation
signals from the discharge chamber.

CHARACTERISING VIBRO-ACOUSTIC SIGNALS OF A RECIPROCATING
COMPRESSOR FOR CONDITION MONITORING
201 DEGREE OF DOCTOR OF PHILOSOPHY (PHD)
10.2.1 Selection of Base Wavelet
An appropriate base wavelet can be chosen by visually matching the shape of the gas pulsation
signal from the reciprocating compressor to the base or mother wavelet. An alternative and
more efficient way of selecting the best base wavelet is by employing quantitative measures
such as energy and Shannon entropy measures, similarity measures (correlation coefficient),
and information theoretic measures (such as joint entropy, conditional entropy and mutual
information) (Yan R. , 2007). In this study, the maximum energy to Shannon entropy ratio
criterion, maximum correlation coefficient, and minimum Shannon entropy criterion have been
employed for selecting the optimum base wavelet for the reciprocating compressor gas
pulsation analysis.
10.2.1.1 Minimum Shannon Entropy Criterion
The Shannon entropy of the wavelet coefficients is given by (Yan R. , 2007):
2
1
( ) .logN
entropy i i
i
E s p p
(10.7)
Where
𝑁 = 𝑙𝑒𝑛𝑔𝑡ℎ 𝑜𝑓 𝑠𝑖𝑔𝑛𝑎𝑙
𝑝𝑖 = 𝑒𝑛𝑒𝑟𝑔𝑦 𝑝𝑟𝑜𝑏𝑎𝑏𝑖𝑙𝑖𝑡𝑦 𝑑𝑖𝑠𝑡𝑟𝑖𝑏𝑢𝑡𝑖𝑜𝑛 𝑜𝑓 𝑡ℎ𝑒 𝑤𝑎𝑣𝑒𝑙𝑒𝑡 𝑐𝑜𝑒𝑓𝑓𝑖𝑐𝑖𝑒𝑛𝑡𝑠
2
( , )
( )i
energy
wt s ip
E s (10.8)
The mother wavelet, which minimises the computed entropy of the wavelet coefficients,
represents the best wavelet for analysing the signal.
10.2.1.2 Maximum Energy to Shannon Entropy Ratio Criterion
The maximum energy to Shannon entropy ratio is a combination of two qualitative measures.
The criterion involves extracting the maximum energy content and minimum Shannon entropy
of the corresponding wavelet coefficients is described as (Yan R. , 2007):
( )
( )( )
energy
entropy
E sR s
E s (10.9)
The amount of energy content in wavelet coefficients of a given signal is expressed as:

CHARACTERISING VIBRO-ACOUSTIC SIGNALS OF A RECIPROCATING
COMPRESSOR FOR CONDITION MONITORING
202 DEGREE OF DOCTOR OF PHILOSOPHY (PHD)
2
( , )energyE wt s t dsd (10.10)
The base wavelet with the greatest energy to Shannon entropy ratio is chosen as the best
wavelet for analysing the gas pulsation signals from the reciprocating compressor.
10.2.1.3 Maximum Correlation Coefficient
The signal similarity is described by the correlation coefficient of the original signal and the
reconstructed wavelet signal. The degree of similarity between two signals X and Y for instance
is described as (Yan R. , 2007):
( , ) XY
X Y
CC X Y
(10.11)
Where X and Y are the standard deviation of the data sequences and X Y , respectively. The
symbol XYC represents the covariance.
Thirty base wavelets are pre-selected from six wavelet families. The maximum energy to
entropy ratio, maximum correlation measure, and the minimum Shannon entropy values for
the pre-selected base wavelets applied to the original gas pulsation signal are listed in Table
10.3. The reverse bi-orthogonal mother wavelet has the highest maximum energy to entropy
ratio, maximum correlation measure, and the minimum Shannon entropy values, and is
therefore, considered as the optimal wavelet for the signal.
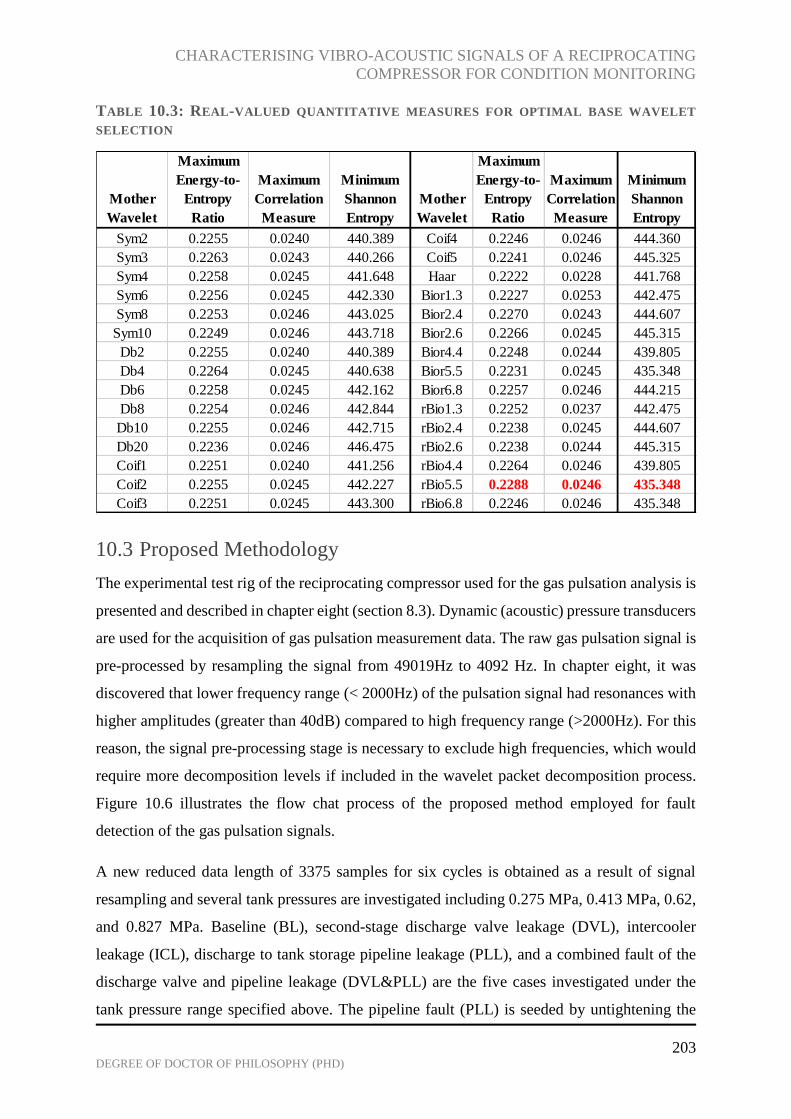
CHARACTERISING VIBRO-ACOUSTIC SIGNALS OF A RECIPROCATING
COMPRESSOR FOR CONDITION MONITORING
203 DEGREE OF DOCTOR OF PHILOSOPHY (PHD)
TABLE 10.3: REAL-VALUED QUANTITATIVE MEASURES FOR OPTIMAL BASE WAVELET
SELECTION
10.3 Proposed Methodology
The experimental test rig of the reciprocating compressor used for the gas pulsation analysis is
presented and described in chapter eight (section 8.3). Dynamic (acoustic) pressure transducers
are used for the acquisition of gas pulsation measurement data. The raw gas pulsation signal is
pre-processed by resampling the signal from 49019Hz to 4092 Hz. In chapter eight, it was
discovered that lower frequency range (< 2000Hz) of the pulsation signal had resonances with
higher amplitudes (greater than 40dB) compared to high frequency range (>2000Hz). For this
reason, the signal pre-processing stage is necessary to exclude high frequencies, which would
require more decomposition levels if included in the wavelet packet decomposition process.
Figure 10.6 illustrates the flow chat process of the proposed method employed for fault
detection of the gas pulsation signals.
A new reduced data length of 3375 samples for six cycles is obtained as a result of signal
resampling and several tank pressures are investigated including 0.275 MPa, 0.413 MPa, 0.62,
and 0.827 MPa. Baseline (BL), second-stage discharge valve leakage (DVL), intercooler
leakage (ICL), discharge to tank storage pipeline leakage (PLL), and a combined fault of the
discharge valve and pipeline leakage (DVL&PLL) are the five cases investigated under the
tank pressure range specified above. The pipeline fault (PLL) is seeded by untightening the
Mother
Wavelet
Maximum
Energy-to-
Entropy
Ratio
Maximum
Correlation
Measure
Minimum
Shannon
Entropy
Mother
Wavelet
Maximum
Energy-to-
Entropy
Ratio
Maximum
Correlation
Measure
Minimum
Shannon
Entropy
Sym2 0.2255 0.0240 440.389 Coif4 0.2246 0.0246 444.360
Sym3 0.2263 0.0243 440.266 Coif5 0.2241 0.0246 445.325
Sym4 0.2258 0.0245 441.648 Haar 0.2222 0.0228 441.768
Sym6 0.2256 0.0245 442.330 Bior1.3 0.2227 0.0253 442.475
Sym8 0.2253 0.0246 443.025 Bior2.4 0.2270 0.0243 444.607
Sym10 0.2249 0.0246 443.718 Bior2.6 0.2266 0.0245 445.315
Db2 0.2255 0.0240 440.389 Bior4.4 0.2248 0.0244 439.805
Db4 0.2264 0.0245 440.638 Bior5.5 0.2231 0.0245 435.348
Db6 0.2258 0.0245 442.162 Bior6.8 0.2257 0.0246 444.215
Db8 0.2254 0.0246 442.844 rBio1.3 0.2252 0.0237 442.475
Db10 0.2255 0.0246 442.715 rBio2.4 0.2238 0.0245 444.607
Db20 0.2236 0.0246 446.475 rBio2.6 0.2238 0.0244 445.315
Coif1 0.2251 0.0240 441.256 rBio4.4 0.2264 0.0246 439.805
Coif2 0.2255 0.0245 442.227 rBio5.5 0.2288 0.0246 435.348
Coif3 0.2251 0.0245 443.300 rBio6.8 0.2246 0.0246 435.348

CHARACTERISING VIBRO-ACOUSTIC SIGNALS OF A RECIPROCATING
COMPRESSOR FOR CONDITION MONITORING
204 DEGREE OF DOCTOR OF PHILOSOPHY (PHD)
connection between the second-stage discharge chamber and the air receiver storage tank.
While the combined fault (DVL+PLL) is implemented by running the compressor when the
two faults are in effect.
Based on the optimal base wavelet criterion presented earlier, the reverse bi-orthogonal mother
wavelet is used to decompose the signal into three levels (corresponding to 32 8 terminal
nodes). The wavelet packet transform acts as a band-pass filter and Table 10.4 presents the
respective frequency range covered by each terminal node for the entire sampling frequency
(4092 Hz). It should be noted that, the frequency ordering of wavelet packet coefficients is in
Gray code order rather than successive order. This is because the output of every level is the
result of both low/high pass filtering followed by down sampling as seen in the previous chapter
(Figure 9.9.2). Thereby switching the order of low and high pass components in subsequent
decompositions.
A hard threshold based on the standard deviation of each terminal node is applied to the
coefficients before reconstructing the de-noised signal. Then, envelope analysis (see Section
9.4) of the eight reconstructed wavelet packet coefficients are computed. The results present a
new time domain signal of each of the eight reconstructed coefficients consisting of their
respective frequency bands. The RMS values of all bands are compared and used to eliminate
bands with insufficient faults variations. Subsequently, two key statistical features, kurtosis
and entropy values of the enveloped signals are computed and used for fault classification.

CHARACTERISING VIBRO-ACOUSTIC SIGNALS OF A RECIPROCATING
COMPRESSOR FOR CONDITION MONITORING
205 DEGREE OF DOCTOR OF PHILOSOPHY (PHD)
FIGURE 10.6: FLOW CHART FOR FAULT DIAGNOSIS USING GAS PULSATION SIGNAL
TABLE 10.4: FREQUENCY RANGE FOR EACH TERMINAL NODE UNDER 4092 HZ SAMPLING
FREQUENCY IN GRAY CODE SEQUENCE
Terminal Nodes Frequency Range
(Hz)
Terminal Nodes Frequency Range
(Hz)
1 0-256 5 1792-2048
2 256-512 6 1536-1792
3 768-1024 7 1024-1280
4 512-768 8 1280-1536
10.4 Experimental Results and Discussion
The reciprocating compressor runs at speed of 420-460 RPM, which means the
fundamental order of excitation occurs between 7-7.6 Hz. From Table 10.1, which shows the
quarter wave resonant frequency and its harmonic for the simplified plenum system, the fourth
harmonic (4X) resonance frequency at 1013 Hz is very close to the 141st harmonic (1019 Hz)
of the average compressor shaft frequency 7.282Hz. Also, from the spectrum, it can be seen
that the broadest resonance occurs at this frequency (1019Hz). Resonance is greatly affected
Gas Pulsation
Signal
•SignalProcessing
Low-Mid Frequency
Range <2048 Hz
•Pre-Processing
WP Decomposition
and Thresholding
•Frequency Band Filtering and De-nosing
Envelope Analysis of
Reconstructed Signal
•Signal Convolution
Statisctical Feature
Extraction
•Optimal Band Selection
Kurtosis against Entropy
•Fault Classification
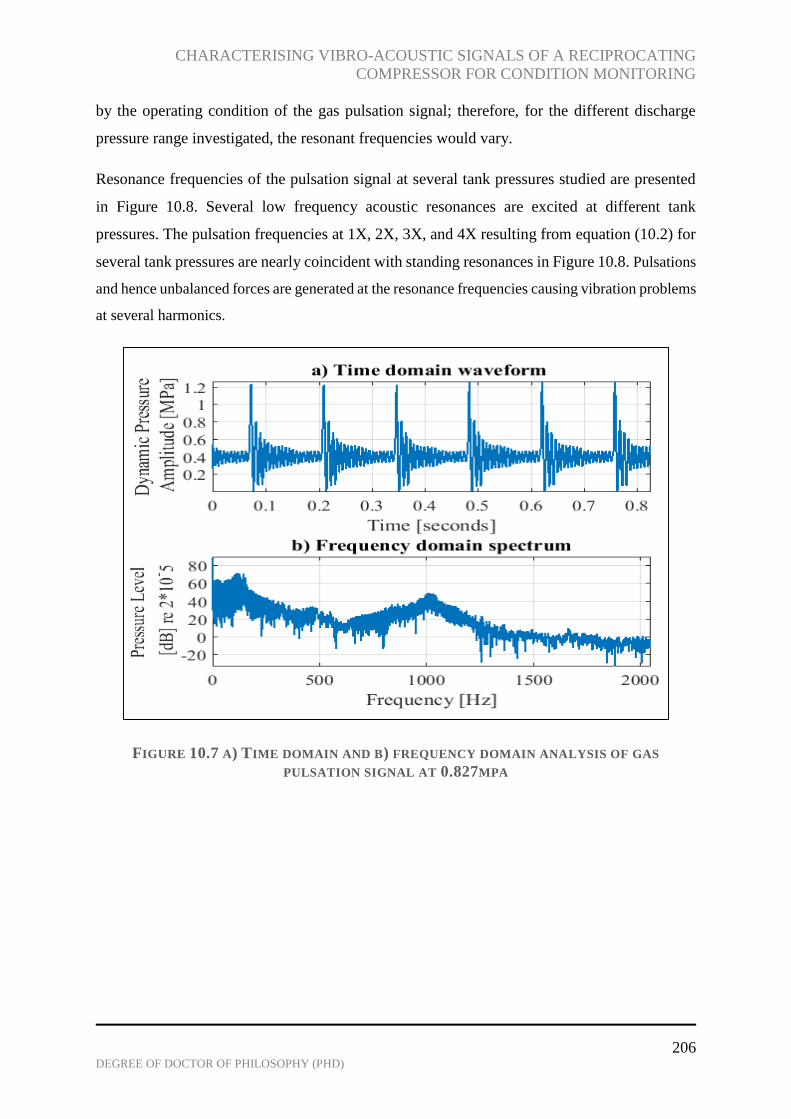
CHARACTERISING VIBRO-ACOUSTIC SIGNALS OF A RECIPROCATING
COMPRESSOR FOR CONDITION MONITORING
206 DEGREE OF DOCTOR OF PHILOSOPHY (PHD)
by the operating condition of the gas pulsation signal; therefore, for the different discharge
pressure range investigated, the resonant frequencies would vary.
Resonance frequencies of the pulsation signal at several tank pressures studied are presented
in Figure 10.8. Several low frequency acoustic resonances are excited at different tank
pressures. The pulsation frequencies at 1X, 2X, 3X, and 4X resulting from equation (10.2) for
several tank pressures are nearly coincident with standing resonances in Figure 10.8. Pulsations
and hence unbalanced forces are generated at the resonance frequencies causing vibration problems
at several harmonics.
FIGURE 10.7 A) TIME DOMAIN AND B) FREQUENCY DOMAIN ANALYSIS OF GAS
PULSATION SIGNAL AT 0.827MPA
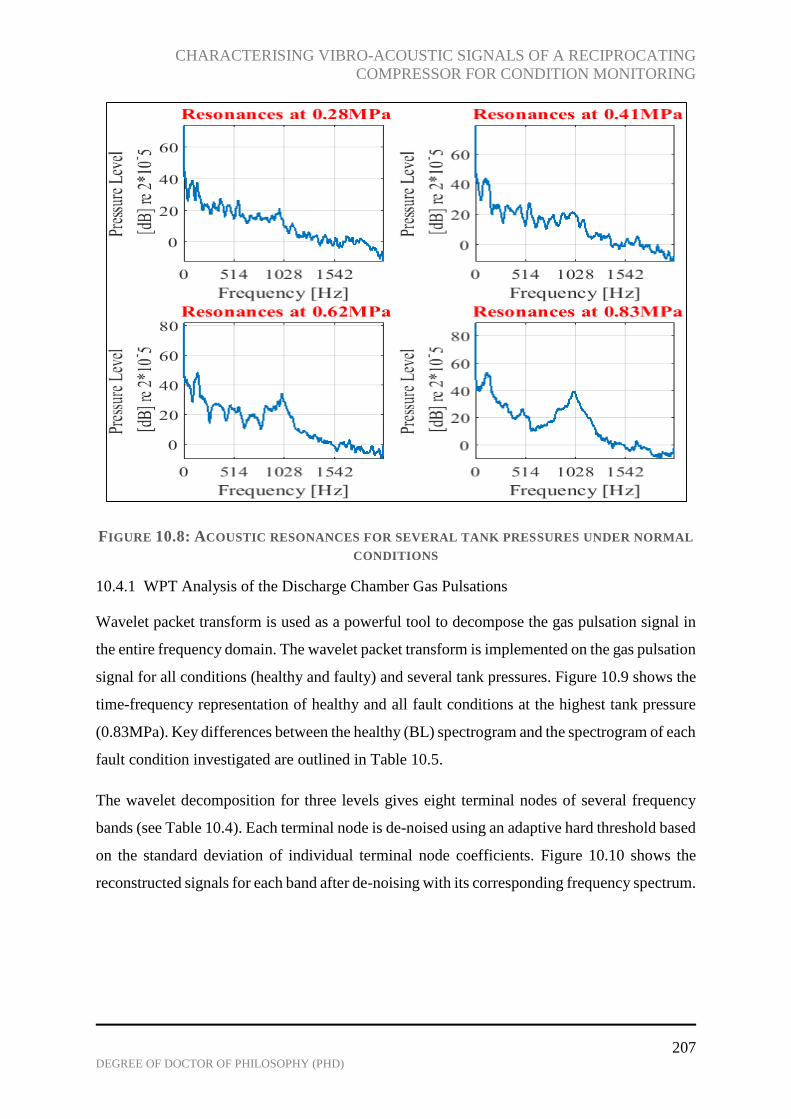
CHARACTERISING VIBRO-ACOUSTIC SIGNALS OF A RECIPROCATING
COMPRESSOR FOR CONDITION MONITORING
207 DEGREE OF DOCTOR OF PHILOSOPHY (PHD)
FIGURE 10.8: ACOUSTIC RESONANCES FOR SEVERAL TANK PRESSURES UNDER NORMAL
CONDITIONS
10.4.1 WPT Analysis of the Discharge Chamber Gas Pulsations
Wavelet packet transform is used as a powerful tool to decompose the gas pulsation signal in
the entire frequency domain. The wavelet packet transform is implemented on the gas pulsation
signal for all conditions (healthy and faulty) and several tank pressures. Figure 10.9 shows the
time-frequency representation of healthy and all fault conditions at the highest tank pressure
(0.83MPa). Key differences between the healthy (BL) spectrogram and the spectrogram of each
fault condition investigated are outlined in Table 10.5.
The wavelet decomposition for three levels gives eight terminal nodes of several frequency
bands (see Table 10.4). Each terminal node is de-noised using an adaptive hard threshold based
on the standard deviation of individual terminal node coefficients. Figure 10.10 shows the
reconstructed signals for each band after de-noising with its corresponding frequency spectrum.
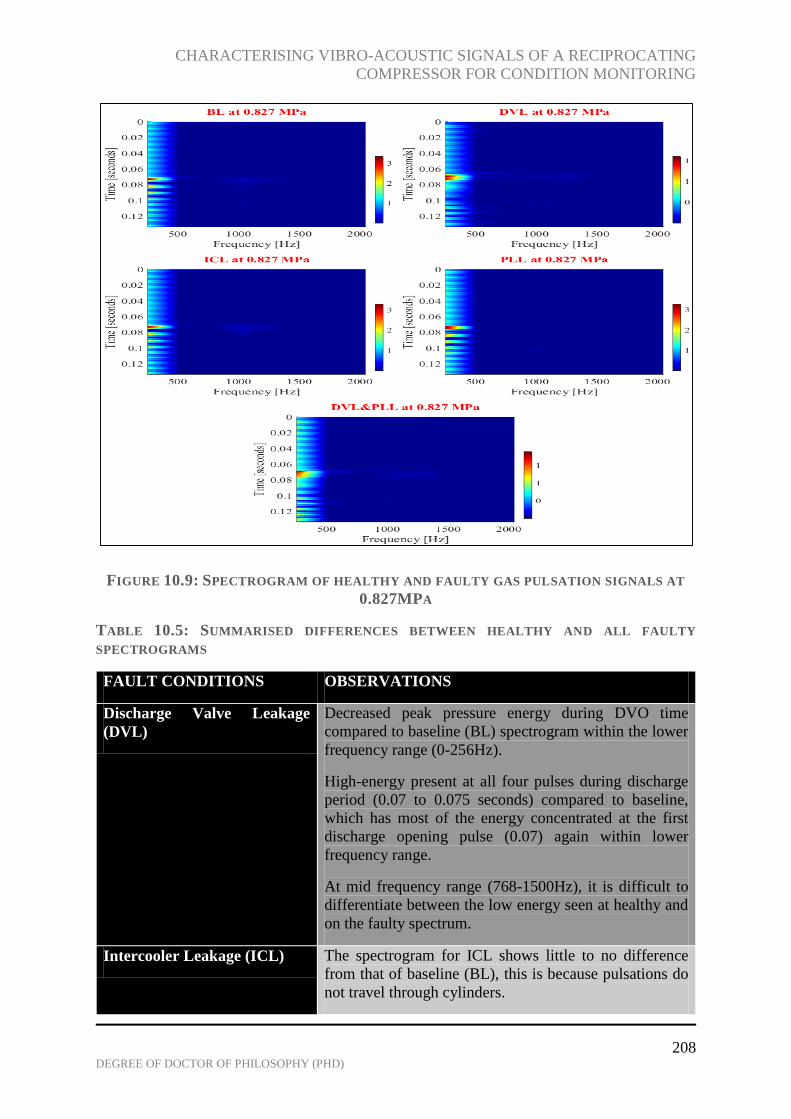
CHARACTERISING VIBRO-ACOUSTIC SIGNALS OF A RECIPROCATING
COMPRESSOR FOR CONDITION MONITORING
208 DEGREE OF DOCTOR OF PHILOSOPHY (PHD)
FIGURE 10.9: SPECTROGRAM OF HEALTHY AND FAULTY GAS PULSATION SIGNALS AT
0.827MPA
TABLE 10.5: SUMMARISED DIFFERENCES BETWEEN HEALTHY AND ALL FAULTY
SPECTROGRAMS
FAULT CONDITIONS OBSERVATIONS
Discharge Valve Leakage
(DVL)
Decreased peak pressure energy during DVO time
compared to baseline (BL) spectrogram within the lower
frequency range (0-256Hz).
High-energy present at all four pulses during discharge
period (0.07 to 0.075 seconds) compared to baseline,
which has most of the energy concentrated at the first
discharge opening pulse (0.07) again within lower
frequency range.
At mid frequency range (768-1500Hz), it is difficult to
differentiate between the low energy seen at healthy and
on the faulty spectrum.
Intercooler Leakage (ICL) The spectrogram for ICL shows little to no difference
from that of baseline (BL), this is because pulsations do
not travel through cylinders.

CHARACTERISING VIBRO-ACOUSTIC SIGNALS OF A RECIPROCATING
COMPRESSOR FOR CONDITION MONITORING
209 DEGREE OF DOCTOR OF PHILOSOPHY (PHD)
Discharge Line Pipe Leakage
(PPL)
Increased peak pressure energy during DVO time
compared to the baseline (BL) spectrogram within the
lower frequency range (0-256Hz).
Low energy within the mid frequency range (768-
1500Hz) seen in baseline (BL) spectrogram are not
present in the PLL spectrogram.
Combined Leakage
(DVL&PLL)
Decreased peak pressure energy during DVO time
compared to baseline (BL) spectrogram within the lower
frequency range (0-256Hz).
High-energy concentration spread across the discharge
period; also, within the lower frequency range.
At mid frequency range (768-1500Hz), it is difficult to
differentiate between the low energy seen at healthy and
on the faulty spectrum

CHARACTERISING VIBRO-ACOUSTIC SIGNALS OF A RECIPROCATING
COMPRESSOR FOR CONDITION MONITORING
210 DEGREE OF DOCTOR OF PHILOSOPHY (PHD)
FIGURE 10.10: RECONSTRUCTED TERMINAL NODE WAVEFORMS AND CORRESPONDING
SPECTRUM FOR GAS PULSATION SIGNAL AT 0.827MPA
10.4.2 Envelope Analysis and Feature Extraction of Discharge Chamber Gas Pulsations
The envelope of gas pulsation signals in different frequency-bands is calculated using Hilbert-
transform (Cizek , 1970). Chapter Nine (section 9.4) of this thesis already presents a brief
description of envelope analysis; however, a thorough review of the technique may be found
in (Wang X. , 2006).
The root-mean-square (RMS) of the enveloped signal for each frequency band is calculated to
detect the best band-pass filter, which gives the optimal fault separation seen in Figure 10.11
as terminal node 4 (512-768Hz) and terminal node 6 (1536-1792Hz) respectively. The
envelope and envelope spectrum of terminal nodes 4 and 6 seen in Figure 10.12 and Figure
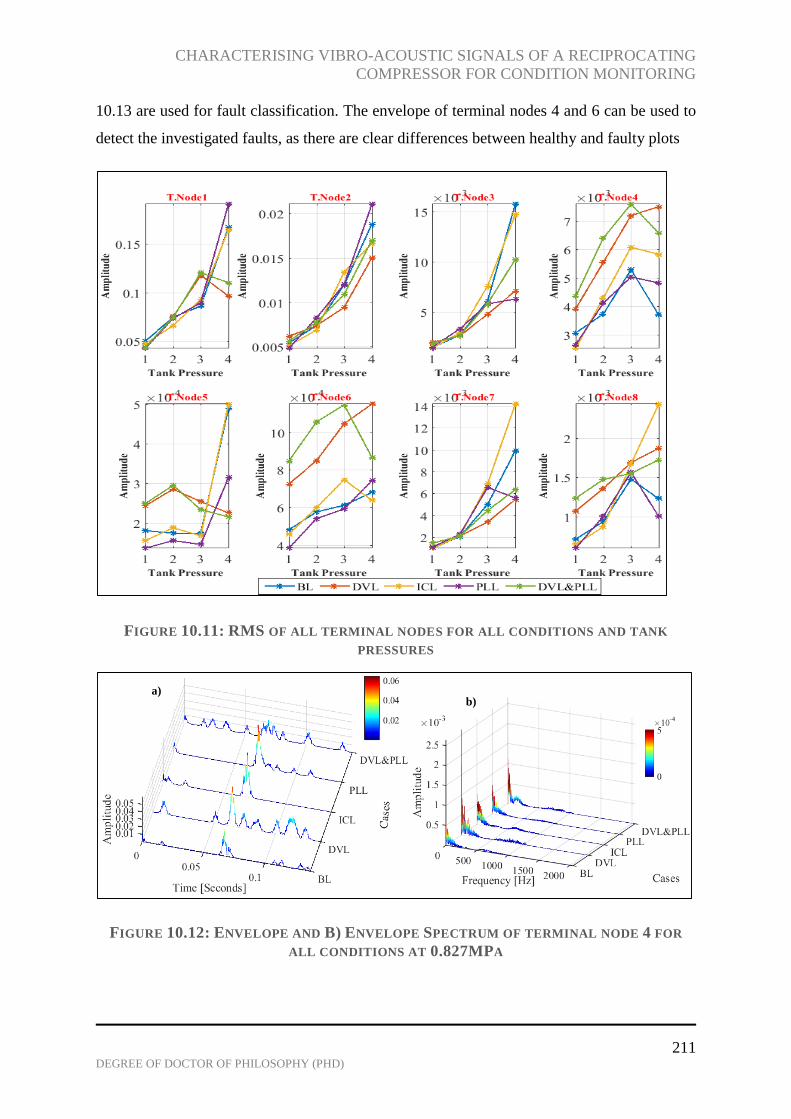
CHARACTERISING VIBRO-ACOUSTIC SIGNALS OF A RECIPROCATING
COMPRESSOR FOR CONDITION MONITORING
211 DEGREE OF DOCTOR OF PHILOSOPHY (PHD)
10.13 are used for fault classification. The envelope of terminal nodes 4 and 6 can be used to
detect the investigated faults, as there are clear differences between healthy and faulty plots
FIGURE 10.11: RMS OF ALL TERMINAL NODES FOR ALL CONDITIONS AND TANK
PRESSURES
FIGURE 10.12: ENVELOPE AND B) ENVELOPE SPECTRUM OF TERMINAL NODE 4 FOR
ALL CONDITIONS AT 0.827MPA
b)a)

CHARACTERISING VIBRO-ACOUSTIC SIGNALS OF A RECIPROCATING
COMPRESSOR FOR CONDITION MONITORING
212 DEGREE OF DOCTOR OF PHILOSOPHY (PHD)
FIGURE 10.13: ENVELOPE AND B) ENVELOPE SPECTRUM OF TERMINAL NODE 6 FOR ALL
CONDITIONS AT 0.827MPA
10.4.3 Fault Classification using Statistical Features
The kurtosis and entropy values of the enveloped gas pulsation signals are used for fault
classification. As mentioned in chapter 7 the kurtosis characterises the relative peakedness or
flatness of the signal (Dyer & Stewart, 1978). A high kurtosis value means the signal is sharply
peaked and has a longer tail while a low kurtosis value indicates that the signal has smoothened
peaks and thinner tail. Shannon entropy measures the amount of randomness and sparseness of
a signal. Therefore, a signal with minimum entropy has the greatest signal-to-noise ratio.
In this study, a combination plot of kurtosis and entropy values of the enveloped signal is used
as a tool for classification of common faults through gas pulsation signals from the discharge
chamber of a reciprocating compressor. Figure 10.14 presents the result for classification using
the aforementioned tool for terminal node 4 and Figure 10.15 presents that for terminal node
6.
For terminal node 4 band, it can be seen that pipe leakage faults (intercooler (ICL) and
discharge line (PLL)) do not show good separation from the baseline values, whereas, the valve
faults (DVL and DVL&PLL) are clearly separated from the baseline and are above boundary
line. Particularly, the intercooler fault (ICL) because pulsations do not travel through the
cylinders as the intercooler pipe connects first-stage cylinder to second-stage cylinder and the
suction and discharge valves do not open at the same time for the transducer located at the
discharge chamber of the second cylinder to detect the intercooler fault. Therefore, the
intercooler-fault signal results are in line with expectations.
a)
b)

CHARACTERISING VIBRO-ACOUSTIC SIGNALS OF A RECIPROCATING
COMPRESSOR FOR CONDITION MONITORING
213 DEGREE OF DOCTOR OF PHILOSOPHY (PHD)
Results from Figure 10.15, although slightly similar to that of Figure 10.14 gives a better result,
in that, values for the valve faults (DVL and DVL&PLL) are well above the boundary line.
From the plot, it can be observed that the valve faults have high entropy values compared to
other cases, which means that the noise level for these fault are significantly high. Based on
the results from the classification, it is concluded that terminal node 6 is best at classifying the
investigated faults on a reciprocating compressor using gas pulsation signals from the discharge
chamber.
FIGURE 10.14: FAULT CLASSIFICATION USING ENTROPY AGAINST KURTOSIS PLOT OF
TERMINAL NODE 4 ENVELOPED SIGNAL

CHARACTERISING VIBRO-ACOUSTIC SIGNALS OF A RECIPROCATING
COMPRESSOR FOR CONDITION MONITORING
214 DEGREE OF DOCTOR OF PHILOSOPHY (PHD)
FIGURE 10.15: FAULT CLASSIFICATION USING ENTROPY AGAINST KURTOSIS PLOT OF
TERMINAL NODE 6 ENVELOPED SIGNAL
10.5 Conclusion
Gas pulsations from the discharge chamber of a reciprocating compressor can be problematic
if the chamber or piping frequencies correspond to multiples of the compressor running
frequency or its harmonics. Moreover, these gas pulsation signals are non-stationary in nature
making it challenging to use time domain and frequency domain analysis for fault detection
and diagnosis. Therefore, in this chapter, wavelet packet transform and envelope analysis are
adopted for condition monitoring of gas pulsation signals from the reciprocating compressor.
The optimal wavelet basis is selected based on Shannon to entropy ratio criteria and cross
correlation and three levels of the wavelet packet decompositions are performed to give eight
band-pass filters (terminal nodes). An adaptive hard threshold using standard deviation of each
band coefficients is applied and the coefficients of each band is reconstructed. Furthermore,
envelope analysis of each band (reconstructed terminal node coefficients) is computed and the
root mean square values are used to select the optimal band that gives the best fault separation.
Finally, the optimal terminal nodes (4 and 6) where used for classification by plotting their
kurtosis values against entropy values. Terminal node 6 (1536-1792Hz) gave a more superior
valve fault separation when used for classification compared to terminal node 4 (512-768Hz).

CHARACTERISING VIBRO-ACOUSTIC SIGNALS OF A RECIPROCATING
COMPRESSOR FOR CONDITION MONITORING
215 DEGREE OF DOCTOR OF PHILOSOPHY (PHD)
CHAPTER ELEVEN
11 CONCLUSIONS AND RECOMMENDATIONS FOR
FURTHER WORK
This chapter summarises the achievement of the research described in this thesis and relates
them to the objectives defined in Section 1.5. Conclusions are drawn from key findings on the
study of condition monitoring of a two-stage single-acting reciprocating compressor with
common faults seeded for research purposes at the university of Huddersfield diagnostics
laboratory. Furthermore, five relevant contributions to study have been outlined and
suggestions for future work are presented.

CHARACTERISING VIBRO-ACOUSTIC SIGNALS OF A RECIPROCATING
COMPRESSOR FOR CONDITION MONITORING
216 DEGREE OF DOCTOR OF PHILOSOPHY (PHD)
11.1 Review of Thesis Objectives and Achievement
The major achievements and new contributions made by this research are discussed. This study
focused on determining the characteristics of vibro-acoustic signals from a reciprocating
compressor for condition monitoring purposes.
Theoretical analysis and experimental works were carried out, and several signal processing
methods and techniques were employed to study the characteristics of vibration and gas
pulsation signals measured under normal and common RC fault conditions.
The set out thesis objectives are carefully correlated to the key achievements of this research
study.
Objective 1: To set up a comprehensive reciprocating compressor test rig, and to
develop experimental procedures for condition monitoring of the two-stage
reciprocating compressor. This will allow condition monitoring using gas pulsation and
vibration sensors, and will also allow specific compressor faults to be seeded onto the
compressor: valve leakage, intercooler leakage, and discharge pipeline leakage.
Achievement 1: A suitable reciprocating compressor test rig facility was developed
and data acquisition system, relevant measurement sensors were purchased and used to
aid condition monitoring as presented in Chapter four of this thesis. The Broom Wade
TS9 reciprocating compressor is a V-shaped, two-cylinder, single acting machine with
a horizontal air receiver tank used for this research. The research environment in which
measurements were conducted was similar to an industrial environment with real
applications. The rig was used to determine compressor performance under normal and
faulty conditions and the results were used to validate the developed mathematical
model of the two-stage reciprocating compressor.
Objective 2: To review various condition-based monitoring techniques presently
adopted in industry and to assess the performance of crucial monitoring techniques
suitable for early fault detection.
Achievement 2: Of the many condition-monitoring techniques reviewed and
investigated in chapter three of this thesis, it was discovered that with reciprocating
compressors, most works were concerned with detection of valve faults using vibration
and in-cylinder pressure signals whilst adopting conventional signal processing
techniques and a few on advanced signal processing techniques such as continuous
wavelet transform. To the best of this researcher’s knowledge, no work has been done

CHARACTERISING VIBRO-ACOUSTIC SIGNALS OF A RECIPROCATING
COMPRESSOR FOR CONDITION MONITORING
217 DEGREE OF DOCTOR OF PHILOSOPHY (PHD)
on the use of advanced signal processing techniques (wavelet packet transform and
envelope analysis) for diagnosing faults using gas pulsation signals from the discharge
chamber of the reciprocating compressor. Most studies are rather focused on the
modelling and effectiveness of installed dampeners on the reciprocating compressor.
Objective 3 and Objective 4: To develop a mathematical model of the two-stage
reciprocating compressor, which includes the gas pulsation behaviour to aid in
understanding the physical properties of the reciprocating compressor; to validate the
mathematical model developed by correlating measured and simulated results.
Achievement 3 and Achievement 4: In chapter five, a thermodynamic model was
developed using the design parameters of the Broom Wade TS9 reciprocating
compressor. The model consists of a crankshaft equation, two in-cylinder pressure
equations, four equations to represent the valve motion, and an equation for second-
stage discharge gas pulsation. In particular, the introduction of second-stage discharge
gas pulsations simulations into the model required substantial adjustments of the mass
flow equations and subsequent changes to the in-cylinder pressure equations for second
stage (see section 5.9). Furthermore, valve and pipeline fault simulations are also
included in the model. The model predications show good agreement with measured
results.
Objective 5: To determine the characteristics of gas pulsation and vibration
measurements from the reciprocating compressor using traditional signal processing
methods.
Achievement 5: Several signal-processing methods were applied to the collected data
from gas pulsation and vibration transducers. Data was examined using time domain
and frequency domain analysis. The effectiveness of these methods in detecting
common reciprocating compressor faults were investigated for the two condition
monitoring techniques (vibration and gas pulsation). The results from the two
techniques are presented in Chapters seven and eight.
Objective 6: To analyse and examine the nonstationary vibration and gas pulsation
signatures by the application of advanced signal processing techniques, such as Hilbert
transform (envelope analysis) based convolution and wavelet packet transform.
Achievement 6: It was discovered that conventional signal processing methods (time
domain and frequency domain) on vibration signals from the reciprocating compressor
were unsuitable for effectively detecting the common faults investigated. Therefore,

CHARACTERISING VIBRO-ACOUSTIC SIGNALS OF A RECIPROCATING
COMPRESSOR FOR CONDITION MONITORING
218 DEGREE OF DOCTOR OF PHILOSOPHY (PHD)
advanced means for signal processing using wavelet packet transform together with
Hilbert transform was used to give a more robust fault classification in Chapter nine.
Time-domain and frequency-domain analysis of the gas pulsation signals were useful
in detecting faults and identifying resonance frequencies of the piping system.
However, Chapter ten, which presents the application of wavelet packet transform and
Hilbert transform on gas pulsation signals proofed to be a more superior and effective
means for band pass filtering of acoustical resonances and fault detection of valve faults
on the reciprocating compressor.
Objective 7: To provide guidelines for future research in this field based on the
investigations conducted.
Achievement 7: Some suggestions are provided for future work on condition
monitoring of multi-stage reciprocating compressors using different faults in Section
11.4 below.
11.2 Conclusion on Condition Monitoring of Vibro-acoustic Signals
from a Reciprocating Compressor
Early detection of failure is of prime importance and the use of vibration and gas pulsation
based monitoring techniques are suitable for condition monitoring of reciprocating
compressors. Based on the theoretical and experimental analysis of vibro-acoustic signals from
the RC, the following conclusions are drawn:
Conclusion 1: Based on the repeatability experiments carried out in section 4.7, it is
concluded that the overall repeatability of the measurements is acceptable, although
there were slight differences particularly for repeated vibration measurements; the one-
way ANOVA null hypothesis of the repeated vibration measurement is accepted
because the computed P-value was less than the 5 percent significance level set. Hence,
validating the repeatability of the vibration signal.
Conclusion 2: There were some positive correlations between the discharge pressure
and the RMS and Kurtosis of the vibration signals, however, the influence of studied
faults on both statistical features did not follow any particular pattern and were highly
inseparable for second-stage vibration measurements across a wide pressure range.
Conclusion 3: Pulsation waves could provide an accurate representation of the
discharge valve opening (DVO) times and any delays that may occur with increasing
discharge pressure. However, there were no positive correlation between the discharge
CHARACTERISING VIBRO-ACOUSTIC SIGNALS OF A RECIPROCATING
COMPRESSOR FOR CONDITION MONITORING
219 DEGREE OF DOCTOR OF PHILOSOPHY (PHD)
pressure and the RMS and Kurtosis of pulsation waves. The influence of studied faults
on both statistical features and PDF values were very close together and showed a
random pattern across a wide pressure range.
Conclusion 4: The frequency domain analysis revealed, that spectral amplitudes show
significant variations at high tank pressures especially for second stage vibration
signals; also spectral amplitudes of fault cases increase mostly at high tank pressure
ranges over a particular frequency range (5kHz to 14kHz) for second-stage vibration
signals
Conclusion 5: The spectrum of the acoustic (gas) pulsations revealed several
resonances, which varied with discharge pressure. However, challenges were
encountered in accurately selecting the optimal resonance band that would effectively
characterise the investigated faults across several discharge pressures. Finally, using
the 1/3rd octave band analysis, band 22 and 23 with centre frequencies 500Hz and
630Hz respectively gave the best valve leakage and combined fault separations from
the baseline signals.
Conclusion 6: The application of WPT and envelope analysis on the vibration signal
showed that WPT decomposition using Coiflet mother (base) wavelet with one
vanishing moment for four levels gave the best separation for fault detection results
across a wide discharge pressure range. From the spectrogram, it was observed that the
amplitudes of fault signals were greater than those of normal (BL) signal, particularly,
the discharge valve leakage fault signal, which had the greatest overall frequency
amplitude at the discharge valve closing (DVC) times. Furthermore, reconstruction of
the signal using coefficients from the first terminal node (4, 0), which had the highest
percentage energy and application of envelope analysis could effectively detect the
three common reciprocating compressor faults seeded. Finally, classification using the
fundamental frequency and its third harmonic gave good separation results between
normal (BL) signals and the three fault signals.
Conclusion 7: The application of WPT and envelope analysis on the gas pulsation
signals from the reciprocating compressor provides accurate monitoring information
for the RC. The optimal wavelet basis is selected based on maximum Shannon to
entropy ratio criteria, maximum cross correlation, and minimum Shannon entropy.
Three levels of the wavelet packet decompositions are performed to give eight band-
pass filters (terminal nodes). An adaptive hard threshold using standard deviation of

CHARACTERISING VIBRO-ACOUSTIC SIGNALS OF A RECIPROCATING
COMPRESSOR FOR CONDITION MONITORING
220 DEGREE OF DOCTOR OF PHILOSOPHY (PHD)
each band coefficients is applied and the coefficients of each bands are reconstructed
to reveal the de-noised signal. Then envelope analysis of each band (reconstructed
terminal node coefficients) is computed and the root mean square values are used to
select the optimal band that gives the best fault separation. Finally, the optimal terminal
nodes (4 and 6) were used for classification by plotting its kurtosis values against
entropy values. Terminal node 6 (1536-1792Hz) gave a more superior valve fault
separation when used for classification compared to terminal node 4.
Conclusion 8: Condition monitoring using vibration measurement still remains a more
superior technique compared to other signal processing types and indeed gas pulsation
measurement. From this study, using proposed methods, vibration measurements could
classify all faults investigated (valve and pipeline related faults); however, the gas
pulsation measurement was more effective at identifying valve related faults compared
to pipeline leakages. Nevertheless, the author highly recommends the use of both
vibration and gas pulsation measurement to better characterise the vibro-acoustic
signals from a reciprocating compressor. The key characteristics of a reciprocating
compressor have been summarised in Figure 11.1 below.
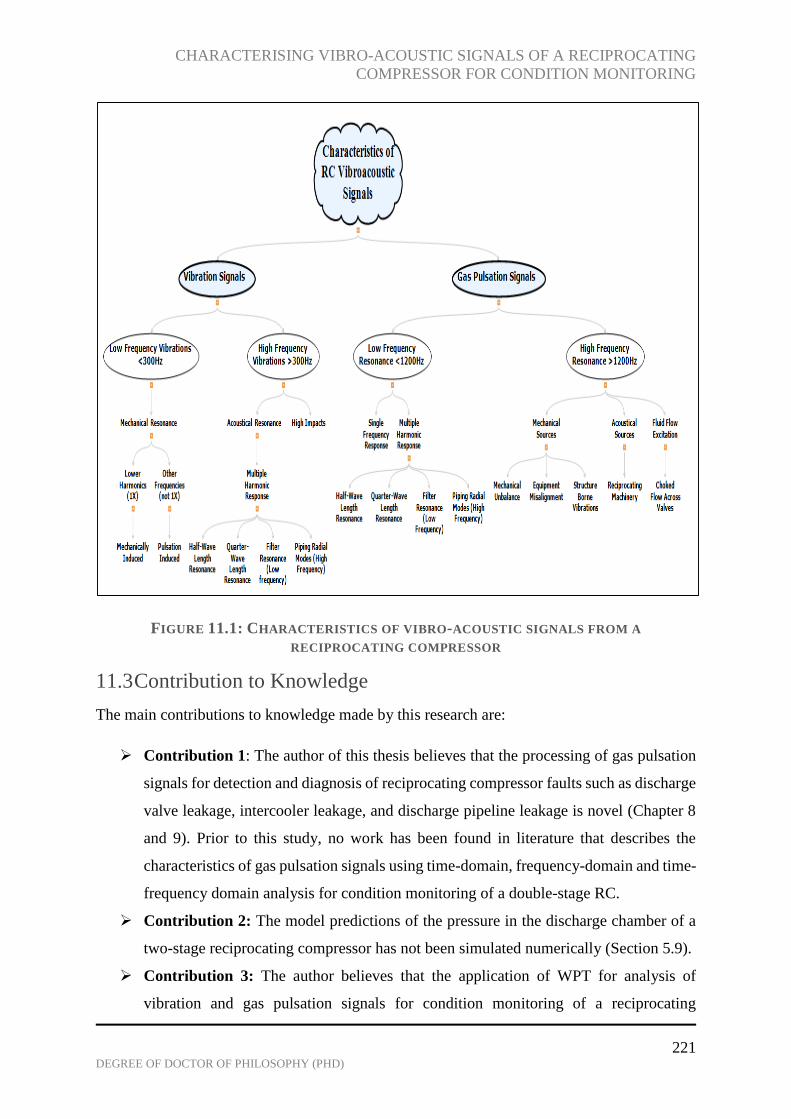
CHARACTERISING VIBRO-ACOUSTIC SIGNALS OF A RECIPROCATING
COMPRESSOR FOR CONDITION MONITORING
221 DEGREE OF DOCTOR OF PHILOSOPHY (PHD)
FIGURE 11.1: CHARACTERISTICS OF VIBRO-ACOUSTIC SIGNALS FROM A
RECIPROCATING COMPRESSOR
11.3 Contribution to Knowledge
The main contributions to knowledge made by this research are:
Contribution 1: The author of this thesis believes that the processing of gas pulsation
signals for detection and diagnosis of reciprocating compressor faults such as discharge
valve leakage, intercooler leakage, and discharge pipeline leakage is novel (Chapter 8
and 9). Prior to this study, no work has been found in literature that describes the
characteristics of gas pulsation signals using time-domain, frequency-domain and time-
frequency domain analysis for condition monitoring of a double-stage RC.
Contribution 2: The model predictions of the pressure in the discharge chamber of a
two-stage reciprocating compressor has not been simulated numerically (Section 5.9).
Contribution 3: The author believes that the application of WPT for analysis of
vibration and gas pulsation signals for condition monitoring of a reciprocating

CHARACTERISING VIBRO-ACOUSTIC SIGNALS OF A RECIPROCATING
COMPRESSOR FOR CONDITION MONITORING
222 DEGREE OF DOCTOR OF PHILOSOPHY (PHD)
compressor is novel as no reports in literature uses the combination of the two methods
applied in this thesis for fault detection and diagnosis of RCs.
Contribution 4: It shows that vibro-acoustic signal analysis by the wavelet packet
transform and envelope methods are able to diagnose changes in reciprocating
compressor behaviours. The classification tool using the fundamental frequency and
third harmonic of the transformed envelope vibration signal showed changes between
healthy and all fault conditions monitored across a wide pressure range.
Contribution 5: Finally, the achievements have provided sufficient experimental
supports to show that vibration and gas pulsation signals along with the proposed
advanced signal processing methods can be an effective technique for on-line
monitoring of reciprocating compressors.
11.4 Recommendation for Future Work
1. It is recommended that further research be conducted on the gas pulsation signals in the
first-stage discharge chamber to investigate possible resonances from the intercooler
pipeline, and the effects of common faults on the system.
2. It is recommended that further academic research be conducted on other valve related
faults such as faulty valve spring to determine their effects on gas pulsation signals
from the reciprocating compressor.
3. To develop faster algorithm to achieve optimal mother (base) wavelet selection so that
vibration and gas pulsation-based analysis can be implemented more efficiently online.
4. To directly extend this study by using intelligent algorithms (neural networks, fuzzy
logics, genetic algorithms, etc.) to examine the combination of features such as entropy,
kurtosis, crest factor, PDF values etc. from all terminal nodes of the transformed
vibration and gas pulsation signals to optimise recognition of common reciprocating
compressor faults
5. To carry out complex mode analysis of the discharge pipeline system to verify sources
of low frequency resonance present in the gas pulsation signals. Also, this would require
coupling of the one-dimensional flow model of the pipe to the already existing
compressor model to give a complete representation of the reciprocating compressor
system.

CHARACTERISING VIBRO-ACOUSTIC SIGNALS OF A RECIPROCATING
COMPRESSOR FOR CONDITION MONITORING
223 DEGREE OF DOCTOR OF PHILOSOPHY (PHD)
12 APPENDIX 1
TABLE 12.1: FAILURE MODES OF POSITIVE DISPLACEMENT ROTARY COMPRESSORS

CHARACTERISING VIBRO-ACOUSTIC SIGNALS OF A RECIPROCATING
COMPRESSOR FOR CONDITION MONITORING
224 DEGREE OF DOCTOR OF PHILOSOPHY (PHD)
TABLE 12.2: FAILURE MODES OF RECIPROCATING POSITIVE DISPLACEMENT
COMPRESSORS

CHARACTERISING VIBRO-ACOUSTIC SIGNALS OF A RECIPROCATING
COMPRESSOR FOR CONDITION MONITORING
225 DEGREE OF DOCTOR OF PHILOSOPHY (PHD)
REFERENCES
Al-Badour, F., Sunar, M., & Cheded, L. (2011). Vibration analysis of rotating machinery using
time-frequency analysis and wavelet techniques. Mechanical Systems and Signal
Processing, 25, 2083-2101.
Albarbar, A., Elhaji, M., Gu, F., & Ball, A. (2004). Independent Component Analysis for
Enhancing Diesel Engine Air-Borne Acoustics Signal to Noise Ratio. Proc. 9th Int.
Conference on Mechtronics, (pp. 345-355). Turkey.
Albarbar, A., Gu, F., Ball, A. D., & Starr, A. (2010). Acoustic Monitoring of Engine Fuel
Injection Based on Adaptive Filtering Techniques. Applied Acoustics, 71(12), 1132-
1141.
Al-Qattan, M. J. (2007). Industrial Application of Speed and Power for fault Detection and
Diagnosis of Large Compressor. University of manchester, School of Mechanical,
Aerospace and Civil Engineering. Manchester: University of Manchester.
Al-Qattan, M., Al-Juwayhel, F., Elhaj, M., Ball, A., & Gu, F. (2009). Instantaneous angular
speed and power for the diagnosis of single-stage, double-acting reciprocating
compressor. Journal of engineering tribology, 223(part J).
API STANDARD 618. (2007, December). Reciprocating Compressors for Petroleum,
Chemical, and Gas Industry Services.
Arnold, K., & Stewart, M. (1999). Surface Production Operations (2nd ed., Vol. I). Houston:
Butterworth-Heinemann.
Ball, A. D. (2000). Reciprocating Engines and Compressors. Maintenance Engineering M12,
section 11. Manchester England: University of Manchester.
Ball, A., Gu, F., & Li, W. (2000). Ball, A. D., Gu, F., & Li, W. (2000). The condition
monitoring of diesel engines using acoustic measurements part 2: fault detection and
diagnosis. SAE technical paper.
Barber, A. (1992). Handbook of Noise and Vibration Control (6th ed.). Oxford: Elsevier
Science Publishers.
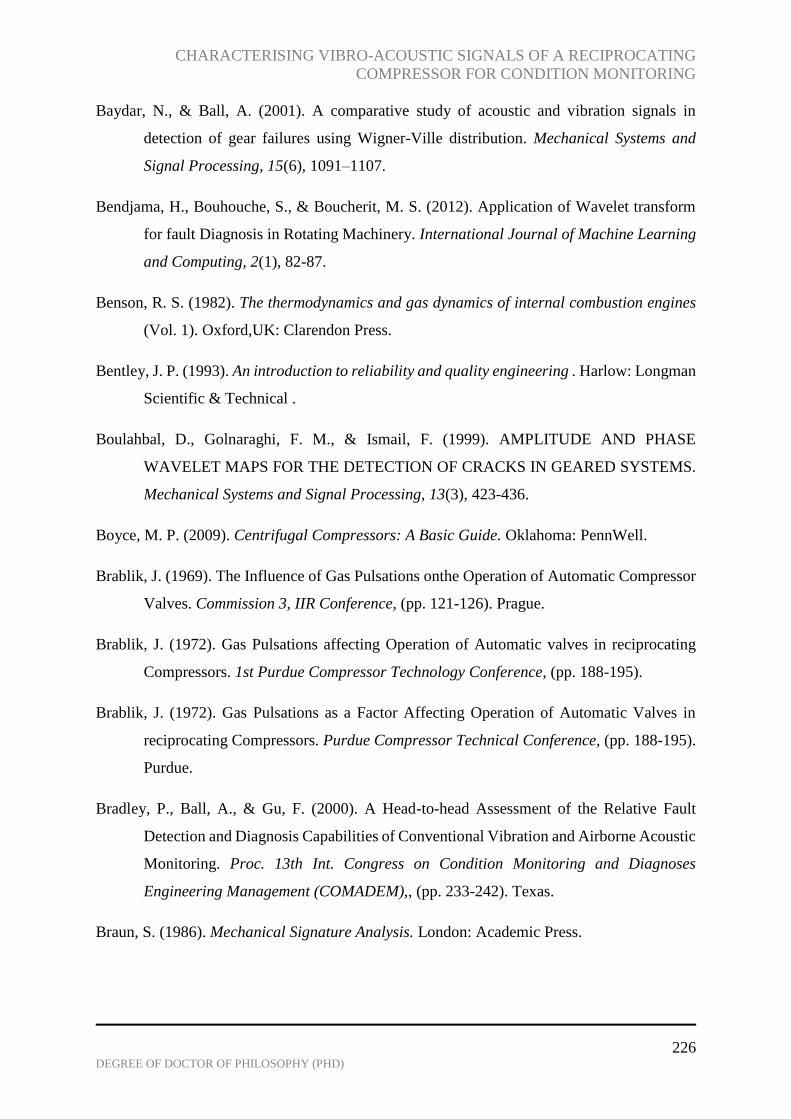
CHARACTERISING VIBRO-ACOUSTIC SIGNALS OF A RECIPROCATING
COMPRESSOR FOR CONDITION MONITORING
226 DEGREE OF DOCTOR OF PHILOSOPHY (PHD)
Baydar, N., & Ball, A. (2001). A comparative study of acoustic and vibration signals in
detection of gear failures using Wigner-Ville distribution. Mechanical Systems and
Signal Processing, 15(6), 1091–1107.
Bendjama, H., Bouhouche, S., & Boucherit, M. S. (2012). Application of Wavelet transform
for fault Diagnosis in Rotating Machinery. International Journal of Machine Learning
and Computing, 2(1), 82-87.
Benson, R. S. (1982). The thermodynamics and gas dynamics of internal combustion engines
(Vol. 1). Oxford,UK: Clarendon Press.
Bentley, J. P. (1993). An introduction to reliability and quality engineering . Harlow: Longman
Scientific & Technical .
Boulahbal, D., Golnaraghi, F. M., & Ismail, F. (1999). AMPLITUDE AND PHASE
WAVELET MAPS FOR THE DETECTION OF CRACKS IN GEARED SYSTEMS.
Mechanical Systems and Signal Processing, 13(3), 423-436.
Boyce, M. P. (2009). Centrifugal Compressors: A Basic Guide. Oklahoma: PennWell.
Brablik, J. (1969). The Influence of Gas Pulsations onthe Operation of Automatic Compressor
Valves. Commission 3, IIR Conference, (pp. 121-126). Prague.
Brablik, J. (1972). Gas Pulsations affecting Operation of Automatic valves in reciprocating
Compressors. 1st Purdue Compressor Technology Conference, (pp. 188-195).
Brablik, J. (1972). Gas Pulsations as a Factor Affecting Operation of Automatic Valves in
reciprocating Compressors. Purdue Compressor Technical Conference, (pp. 188-195).
Purdue.
Bradley, P., Ball, A., & Gu, F. (2000). A Head-to-head Assessment of the Relative Fault
Detection and Diagnosis Capabilities of Conventional Vibration and Airborne Acoustic
Monitoring. Proc. 13th Int. Congress on Condition Monitoring and Diagnoses
Engineering Management (COMADEM),, (pp. 233-242). Texas.
Braun, S. (1986). Mechanical Signature Analysis. London: Academic Press.
CHARACTERISING VIBRO-ACOUSTIC SIGNALS OF A RECIPROCATING
COMPRESSOR FOR CONDITION MONITORING
227 DEGREE OF DOCTOR OF PHILOSOPHY (PHD)
Brejaud, P., Higelin, P., Charlet, A., & Chamaillard, Y. (2011, April 15). Development and
experimental validation of a new one-dimensional valve boundary condition based on
the method of characteristics. Journal of Automobile Engineering, 225(Part D).
Brown, R. N. (2005). Compressors: Selection and Sizing (3rd ed.). Oxford: Elsevier Inc.
Caie, A., & Bickmann, T. (2017, September). Advanced Online Condition Monitoring and
Diagnostics support Operational and Maintenance Decisions in an Offshore Gas
Compression and Export System Unit. Retrieved from Baker Hughes aGE company:
https://www.gemeasurement.com/sites/gemc.dev/files/gea33192_chevron_europe_cas
e_study_r3.pdf
Cambridge Electronic Design Limited. (1991). The CED 1401 Plus. Intelligient Interface
Programmer's Handbook. Cambridge, UK: Cambridge Electronic Design.
castro, B., Kogan, D., & Geva, A. B. (2000). ECG Feature Extraction using Optimal Mother
Wavelet. IEEE convention of Electrical and Electronic Engineers in Israel, 346-350.
Chen, J., Li, Z., Pan, J., Chen, G., Zi, Y., Yuan, J., . . . He, Z. (2016). Wavelet transform based
on inner product in fault diagnosis of rotating machinery: A review. Mechanical
Systems and Signal Processing, 1-35.
Chrfi, F., ALHaddad, K., & Franqois , B. (2004). Power System Fault Monitoring Using
Wavelet Transform. Annul IEEE Power Electronics Specialists Conference.
chui, C. K. (1997). Wavelets: A Mathematical Tool for Signal Analysis. Philadelphia: SIAM.
Cipollone, R. (2016). Sliding vane rotary compressor technology and energy saving. Journal
of Process mechanical Engineering, 230(3), 208-234.
Cizek , V. (1970). Discrete Hilbert transform . IEEE Transactions on Audio and
Electroacoustics, 18(4), 340 - 343.
Collacott, R. (1977). Mechanical Fault Diagnosis and Condition Monitoring. London:
Chapman and Hall Ltd.
Costagliola, M. (1950). The Theory of Spring-Loaded Valves for Reciprocating Compressors'.
ASME Journal of Applied Mechanics, 17(4), 415-420.
CHARACTERISING VIBRO-ACOUSTIC SIGNALS OF A RECIPROCATING
COMPRESSOR FOR CONDITION MONITORING
228 DEGREE OF DOCTOR OF PHILOSOPHY (PHD)
Daniel, G. (2014, June). Reciprocating Compressor Suction and Discharge Valve Monitoring:
Evaluating the strengths and weaknesses of the most common online monitoring
technologies. Retrieved from prognost: https://www.prognost.com/wp-
content/uploads/2018/03/ct2-06-14_compressor-valve-monitoring.pdf
Danielson, D. (2003). Vectors And Tensors In Engineering And Physics. Boca Raton: CRC
Press.
Dong, Z. (2012). A study of non-stationar signal processing for machinery condition
monitoring. huddersfield: Univeristy of huddersfield.
Duan, L., Wang, Y., Wang, J., Zhang, L., & Chen, J. (2016). Undecimated Lifting Wavelet
Packet Transform with Boundary Treatment for Machinery Incipient Fault Diagnosis.
Shock and Vibration, 1-9.
Dyer, D., & Stewart, R. M. (1978). Detection of Rolling Element Bearing Damage by
Statistical Vibration Analysis. Journal of Mechanical Design, 100(2), 229-235.
Elhaj, M. A. (2005). CONDITION MONITORING OF RECIPROCATING COMPRESSOR
VALVES. manchester: University of Manchester.
Elhaj, M. A. (2005). CONDITION MONITORING OF RECIPROCATING COMPRESSOR
VALVES. Huddersfield: University of Hudderfield.
Elhaj, M., Gu, F., Ball, A. D., Albarbar, A., Al-Qattan, M., & Naid, A. (2008). Numerical
simulation and experimental study of a two-stage reciprocating compressor for
condition monitoring. Mechanical Systems and Signal Processing, 22, 374-389.
Elhaji, M., Gu, F., Shi, J., & Ball, A. (2001). Comparison of the Condition Monitoring of
Reciprocating Compressor Valves Using Vibration, Acoustic, Temperature and
Pressure Measurements. Electronic Proc. 6th Annual Maintenance and Reliability
Conference (MARCON),. Gatlinburg, Tennessee.
Elson, J. P., & Soedel, W. (1972). A Review of Discharge and Suction Line Oscillation
Research. International Compressor Engineering Conference, 49, 311-315.
Enzo, G., Marco, P., Matteo , R., & Stefano , G. (2006). FORCED RESPONSE OF
CYLINDER MANIFOLD FORCED RESPONSE OF CYLINDER MANIFOLD. 8th

CHARACTERISING VIBRO-ACOUSTIC SIGNALS OF A RECIPROCATING
COMPRESSOR FOR CONDITION MONITORING
229 DEGREE OF DOCTOR OF PHILOSOPHY (PHD)
Biennial ASME Conference on Engineering Systems Design and Analysis (pp. 1-10).
Torino, Italy: ASME.
Forsthoffer, M. S. (2017). More Best practices for Rotating Equipment. Oxford: Butterworth-
Heinemann.
Gao, R. X., & Yan, R. (2011). Wavelets: Theory and applications for manufacturing. US:
Springer US.
Gaspar, P. D., & Da Silva, P. D. (2015). Handbook of Research on Advances and Applications
in Refrigeration Systems and Technologies. Pennsylvania: Engineering Science
Reference (an imprint of IGI Global).
Geng, Z., Jin, C., & Hull, B. J. (2003). Analysis of engine vibration and design of an applicable
diagnosing approach. International Journal of Mechanical Sciences, 45, 1391-1410.
Ghanbariannaeeni, A., & Ghazanfarihashemi, G. (2014). Gas pulsation study for reciprocating
compressors in chemical plants. Journal of Process Mechanical Engineering, 230(1),
65-75.
Giampaolo, T. J. (2010). Compressor handbook: Principles and practice. Lilburn, GA, USA:
The Fairmont press. Retrieved from http://www.ebrary.com
Glen, P., & Eugene, E. (1989). Computer Simulation and Acoustic Tuning of Rolling Piston
Vapor Compressors. Computer Modeling and Simulation in Engineering & Sciences,
4(2), 117-123.
Goldman, S. (1984). Periodic Machinery Monitoring: Do It Right. Hydrocarbon Process, 51-
56.
Goyal, D., & Pabla, B. S. (2016). The vibration monitoring methods and signal processing
techniques for structural health monitoring: A review. Archives of Computational
Methods in Engineering, 23(4), 585-594.
Greenfield,, S. D., & Luis de la Roche, L. (2018, september 22). Introduction to Vibration &
Pulsation in Reciprocating Compressors. Retrieved from Vibration, dynamics and
noise: www.woodgroup.com/VDN
CHARACTERISING VIBRO-ACOUSTIC SIGNALS OF A RECIPROCATING
COMPRESSOR FOR CONDITION MONITORING
230 DEGREE OF DOCTOR OF PHILOSOPHY (PHD)
Grib, V. V., & Zhukov, R. V. (2001, January). ANALYSIS OF VIBROACOUSTIC
CHARACTERISTICS OF PISTON COMPRESSORS. Chemical and Petroleum
Engineering, 37(1), 40-42.
Gu, F., & Ball, A. (1995). Use of the smoothed pseudo-Wigner–Ville distribution in the
interpretation of monitored vibration data maintenance. 10, 16-23.
Gu, F., Li, W., Ball, A., & Leung, A. Y. (2000). The condition monitoring of diesel engines
using acoustic measurements Part1: Acoustic characteristics of the engine and
representation of the acoustic signals. SAE world congress, 1-9.
Gursoy, I. M., Yilmaz, S. A., & Ustun, V. S. (2018). A PRACTICAL REAL-TIME POWER
QUALITY EVENT MONITORING APPLICATIONS USING DISCRETE
WAVELET TRANSFORM AND ARTIFICIAL NEURAL NETWORK. Journal of
Engineering Science and Technology, 13(6), 1764-1781.
Hamilton, J. (1974). Extension of Mathematical Modelling of Positive Displacement. Type
Compressor; Ray W Herrick Laboratories. Purdue : Purdue University, USA.
Hanlon, P. C. (2001). Compressor Handbook. New York: McGraw-Hill.
Heinz, B., & John, J. (1996). Reciprocating Compressors, Operation & Maintenance. Houston:
Butterworth-Heinemann.
Jardine, A. K., Lin, D., & Banjevic, D. (2005). A review on machinery diagnostics and
prognostics implementing condition-based maintenance. Mechanical Systems and
Signal Processing, 20, 1483–1510.
Jiang, J., Gu, F., Gennish, R., Moore, D. J., Harris, G., & Ball , A. (2008). Monitoring of diesel
engine combustions based on the acoustic source characterisation of the exhaust
system. Mechanical Systems and Signal Processing, 22(6), 1465-1480.
Jiangming, J., & Weirong, H. (2012). Valve Dynamic and Thermal Cycle Model in Stepless
Capacity Regulation for Reciprocating Compressor. CHINESE JOURNAL OF
MECHANICAL ENGINEERING, 25(6), 151-160. doi:10.3901/CJME.2012.06.1151,
available online at www.springerlink.com; www.cjmenet.com; www.cjmenet.com.cn

CHARACTERISING VIBRO-ACOUSTIC SIGNALS OF A RECIPROCATING
COMPRESSOR FOR CONDITION MONITORING
231 DEGREE OF DOCTOR OF PHILOSOPHY (PHD)
Kankar, P. K., Satish, S. C., & Harsha, S. P. (2011). Rolling element bearing fault diagnosis
using wavelet transform. Neurocomputing, 74, 1638-1645.
Khan, N. (2018). Improved image compression with comparative analysis of progressive
coding techniques. MCS.
Komonen, K. (1998). The Structure and Effectivenessof industrial maintenance. Finnish
Academy of Technology.
Komonen, K. (2002, Septemeber). The structure and effectiveness of industrial maintenance
for profitability analysis and benchmarking. International Journal of production
economics, 79(1), 15-31.
Kulkarni, P. G., & Sahasrabudhe, A. D. (2013). Application Of Wavelet Transform For Fault
Diagnosisof Rolling Element Bearings. INTERNATIONAL JOURNAL OF
SCIENTIFIC & TECHNOLOGY RESEARCH, 2(4), 138-148.
Kumar, H. S., Srinivasa, P. P., Sriram, N. S., & Vijay, G. S. (2014). Selection of Mother
Wavelet for Effective Wavelet Transform of Bearing. Advanced Materials Research.
1039, pp. 169-176. Switzerland: Trans Tech Publications.
Kwok, T. F. (2018, January). An Automated Energy Detection Algorithm Based on Kurtosis-
Histogram Excision. US Army Research Laboratory, pp. 1-38.
Lei, Y., Lin, J., He, Z., & Zuo, M. J. (2013). A review on empirical mode decomposition in
fault diagnosis of rotating machinery. Mechanical Systems and Signal Processing,
35(1-2), 108-126.
Leonard, S. M. (1996, January). Increasing the Reliability of Reciprocating Compressors on
Hydrogen Services. New York: Dresser-Rand.
Li, Y., Gu, F., Harris, G., Ball, A., Bennett, N., & Travis, K. (2005). The measurement of
instantaneous angular speed. Mechanical Systems and Signal Processing, 19, 786-805.
Liang, B., Gu, F., & Ball, A. (1996). A Preliminary Investigation of Valve Fault Diagnosis in
Reciprocating Compressors. Journal of MAINTENANCE, 11(2), 3-8.
Liebetrau, J., & Grollnisch, S. (2017, September 11). Predicitive Maintenance with Airborne
Sound Analysis. Retrieved from Processing Solutions for the Process Industries:
CHARACTERISING VIBRO-ACOUSTIC SIGNALS OF A RECIPROCATING
COMPRESSOR FOR CONDITION MONITORING
232 DEGREE OF DOCTOR OF PHILOSOPHY (PHD)
Prevent machineery breakdown with acoustic condition monitoring:
https://www.processingmagazine.com/2017/09/11/predictive-maintenance-airborne-
sound-analysis/
Loutas, T. H., & Kostopoulos, V. (2017). Utilising the Wavelet Transform in Condition-Based
Maintenance: A Review with Applications.
Maclaren , J. F., Kerr, S. V., Tramschek, A. B., & Sanjines, O. A. (1974). A Model of a Single
Stage Reciprocating Gas Compressor Accounting for Flow Pulsations . International
Compressor Engineering Conference (pp. 144-150). Purdue: University' of Strathclyde,
Glasgow, U.K. .
Malago, M., Mucchi, E., & Dalpiaz, G. (2016). Fault detection in heavy duty wheels by
advanced vibration processing techniques and lumped parameter modeling.
Mechanical Systems and Signal Processing, 70-71, 141-160.
Manea, D., Mihaela, A. C., & Mutihac, R. (2018). Applications of fractional wavelet-based
denoising method in biomedical hyperspectral imaging. PROCEEDINGS OF SPIE (pp.
1-8). Strasbourg, France: SPIEDigitalLibrary.
Manepatil, S., Yadava, G., & Nakra, B. (2000, October). Modelling and Computer Simulation
of Reciprocating Compressor with Faults. Journal of the Institution of Engineers ,
81(3), 108 - 116.
Maurice, G., Kendall, M. A., & Alan, S. (1961). The advanced theory od statistics (Vol. II).
New York: Hafner publishing company.
McLaren, J., & Kerr, J. (1968). Valve Behaviour in a Small Refrigeration Compressor Using
Digital Computer. Journal of Refrigeration, 11(6), 78 - 89.
Mobley, K. R. (1999). Root Cause Failure Analysis: Plant Engineering Maintenance Series.
Massachusetts : Butterworth-Heinemann.
Mobley, K. R. (2004). Maintenance Fundamentals (2nd ed.). Oxford: Elsevier Butterworth–
Heinemann.
Mohanty, A. R. (2015). Machinery Condition Monitoring: Principles and Practices. Florida:
taylor and Francis Group, LLC.

CHARACTERISING VIBRO-ACOUSTIC SIGNALS OF A RECIPROCATING
COMPRESSOR FOR CONDITION MONITORING
233 DEGREE OF DOCTOR OF PHILOSOPHY (PHD)
Muo, U. E., Madamedon, M., Gu, F., & Ball, A. (2017). Wavelet Packet Analysis and
Empirical Mode Decomposition for the Fault Diagnosis of Reciprocating Compressors.
23rd International Conference on Automation & Computing (pp. 1-7). Huddersfield:
University of Huddersfield.
Naid, A., Gu, F., & Ball, A. (2007). Fault Detection and Diagnosis of Reciprocating
Compressors Using Motor Current Signature Analysis. 2nd World Cong. on WCEAM
and 4th CM2007. Harrogate.
Namdeo, R., Manepatil, S., & Saraswat, S. (2008). Detection of Valve leakage in reciprocating
Compressor using Artifical Neutral Network (ANN). International Compressor
Engineering Conference (pp. 14-17). Purdue.
National Instrument Company. (2003). LabWindows/CVI User Manual, Version 5.5.
London,Uk: National Instrument Company.
Newland, D. E. (1994). Wavelet analysis of vibration, Part I: theory. Journal of Vibration and
Acoustics, 116, 409-419.
Norton, M., & Karczub, D. (2003). Fundamentals of Noise and Vibration Analysis For
Engineers. UK: CUP.
Ogbulafor, U. E., Guojin, F., Mones, Z., Gu, F., & Ball, A. (2017). Application of Wavelet
Packet Transform and Envelope Analysis to Non-stationary Vibration Signals for Fault
Diagnosis of a Recipocating Compressor. First World Congress on Condition
Monitoring. London: University of Huddersfield.
Ormer, H. V. (2002, November 30). Compressors drive the system. Retrieved from Hydraulics
and Pneumatics: http://www.hydraulicspneumatics.com/other-
technologies/compressors-drive-system
Ozturk, C., Deblauwe, F., & Kopgeroolu, Y. (1996). Acoustic Features of the Reciprocating
Refrigeration Compressors. International Compressor Engineering Conference (pp.
729-734). Purdue University.
Padilla, E. (1971). Computer Simulation of a Two-cylinder Refrigeration Compressor with
Special Attention to the Cylinder and Cavity Interactions. Purdue: Purdue University.

CHARACTERISING VIBRO-ACOUSTIC SIGNALS OF A RECIPROCATING
COMPRESSOR FOR CONDITION MONITORING
234 DEGREE OF DOCTOR OF PHILOSOPHY (PHD)
Pan, F., & Jones, D. J. (1999). Gas Path Sound Transmission in Spherically-Shaped
Reciprocating Compressors: Theory and Experiment. J. Vib. Acoust, 121(1), 8-17.
Pascual, R., Meruane, V., & Rey, P. A. (2008). On the effect of downtime costs and budget
constraint on preventive and replacement policies. Reliability Engineering and System
Safety, 93(1), 144-151.
Peng, Z. K., & Chu, F. L. (2004). Application of the wavelet transform in machine condition
monitoring and fault diagnostics: a review with bibliography. Mechanical Systems and
Signal Processing, 18, 199-221.
Pichler, K., Lughofer, E., Pichler-Scheder, M., Buchegger, T., Klement, E. P., & Huschenbett,
M. (2013). Detecting cracks in reciprocating compressor valves using pattern
recognition in the pV diagram. EE/ASME International Conference on Advanced
Intelligent Mechatronics. 18, pp. 461-472. Austrialia: IEEE.
Price, G. R., & Botros, K. (1992). Numerical and Experimental Analysis of the Flow
Characteristics through a Channel Valve. Purdue Compressor Technology Conference,
1215- 1225.
Rafiee, J., & Tse, P. W. (2009). Use of autocorrelation of wavelet coefficients for fault
diagnosis. Mechanical Systems and Signal Processing, 23, 1554-1572.
Rafiee, J., Tse, P. W., Harifi, A., & Sadeghi, M. H. (2009). A novel technique for selecting
mother wavelet function using an intelligent fault diagnosis system. Expert Systems
with Applications, 36, 4862-4875.
Raharjo, P. (2013). An Investigation of Surface Vibration, Airbourne Sound and Acoustic
Emission Characteristics of a Journal Bearing for Early Fault Detection and
Diagnosis. Huddersfield: University of Huddersfield.
Rao, B. K. (1998). Handbook of Conditon Monitoring: Techniques and Methodology. (A.
Davies, Ed.) Cardiff: Springer Science and Business Media Dordrecht.
Rao, S. S. (2004). mechanical Vibration (5th ed.). Miami: Pearson.
Robinson, J. D. (1990). Submarine-installed Machinery Monitoring and Diagnostics: A State-
of-the-art Review. Monterey: Calhoun: The NPS Institutional Archive.

CHARACTERISING VIBRO-ACOUSTIC SIGNALS OF A RECIPROCATING
COMPRESSOR FOR CONDITION MONITORING
235 DEGREE OF DOCTOR OF PHILOSOPHY (PHD)
Robison, D. H., & Beaty, P. J. (N.d). Compressor types, classification, and applications.
Proceeding od the twenty-first turbomachinery symposium, (pp. 183-188).
Ross, S. M. (2004). Introduction to Probability and Statistics for Engineers (3rd ed.).
London;Amsterdam: Elsevier Academic.
Salah, A. M., Hui, K. H., Hee, L. M., & Salman, L. (2018). Automated valve fault detection
based on acoustic emission parameters and support vector machine. Alexanderia
engineering journal, 57, 491-498.
Saleh, S. A., & Rahman, M. A. (2005). Modeling and Protection of a Three-Phase power
Transformer Using Wavelet Packet Transfrom. IEEE transactions on Power delivery,
20(2), 1273 - 1282.
Scheideman, F., Schary, M., & Singh, R. (1978). Thermodynamic and Acoustic Simulation of
Positive Displacement Refrigeration Compressors. International Compressor
Engineering Conference, 290-299.
Schultheis, S. M., Lickteig, C. A., & Parchewsky, R. (2007). Reciprocating compressor
condition monitoring. 36th Turbomachinery symposium, (pp. 10-13). Texas: College
station.
Schwartz, R., & Nelson, R. (1984). Acoustic Resonance Phenomena In High Energy Variable
Speed Centrifugal Pumps. Texas: Turbomachinery Laboratories, Department of
Mechanical Engineering, Texas A&M University. Retrieved from http : / /hdl .handle
.net /1969 .1 /164375
Schwerzler, D. (1971). Mathematical Modelling of a Multicylinder Refrigeration Compressor.
Purdue: Purdue University.
Scruby, C. B. (1987). An introduction to acoustic emission. Journal of physics E: Scientific
Instruments, 945-953.
Sharma, V., & Parey, A. (2016). Gearbox fault diagnosis using RMS based probability density
function and entropy measures for fluctuating speed conditions. Structural Health
Monitoring, 16(6), 682–695.

CHARACTERISING VIBRO-ACOUSTIC SIGNALS OF A RECIPROCATING
COMPRESSOR FOR CONDITION MONITORING
236 DEGREE OF DOCTOR OF PHILOSOPHY (PHD)
Shejal, P. P., & Desai, A. D. (2014). Pulsation and Vibration Study Of Reciprocating
Compressor According to API 618 5th Edition. International journal of Modern
Engineering Research, 4(7).
Sikorska, J. Z., & Mba, D. (2008). Challenges and obstacles in the application of acoustic
emission to process machinery. Journal of Process Mechanical Engineering, 222, 1-
19.
Sim, H., Ramli , R., Saifizul, A. A., & Abdullah, M. (2014). Empirical investigation of acoustic
emission signals for valve failure identification by using statistical method.
Measurement, 165–174.
Singh, R. (1975). Modeling of Multicylinder Compressor Discharge Systems. Purdue: Purdue
University.
Smith, S. W. (1999). Digital Signal Processing (2nd ed.). San Diego: Califonia Technical
Publishing.
Soedel, W. (2007). Sound and Vibrations of Positive Displacement Compressors. New York:
CRC Press.
Srinivas, M. N., & Padmanabhanb, C. (2002). Computationally efficient model for
refrigeration compressor gas dynamics. International Journal of Refrigeration, 25,
1083–1092.
Staszewski, W. (1994). The Application of Time-Variant Analysis to Gearbox Fault Detection.
Manchester: University of Manchester.
Staszewski, W. J., & Worden, K. (1997). Classification of faults in gearboxes — pre-
processing algorithms and neural networks. Neural Computing & Applications, 5(3),
160-183.
Stiaccini, I., Galoppi, G., Ferrari, L., & Ferrara, G. (2016). A reciprocating compressor hybrid
model with acoustic FEM characterization. international journal of refrigeration, 63,
171-183.
Thobiani, F. W. (2011). The Non-intrusive Detection of Incipient Cavitation in Centrifugal
Pumps. Huddersfield: University of Huddersfield.

CHARACTERISING VIBRO-ACOUSTIC SIGNALS OF A RECIPROCATING
COMPRESSOR FOR CONDITION MONITORING
237 DEGREE OF DOCTOR OF PHILOSOPHY (PHD)
Toyota, T., Niho, T., Chen, P., & Komura, H. (2001). CONDITION DIAGNOSIS OF
RECIPROCATING MACHINERY USING INFORMATION THEORY. Condition
Monitoring and Diagnostic Engineering Management, 657-662.
Tse, P. W., Peng, Y. H., & Yam, R. (2001). Wavelet analysis and envelope detection for rolling
element bearing fault diagnosis—their effectiveness and flexibilities. Journal of
Vibration and Acoustics, 303-310.
US Department of Energy. (2003). Improving Compressed Air System Performance. Retrieved
October 6, 2014, from Energy Efficiency and Renewable Energy:
www.oit.doe.gov/bestpractices/compressed_air
Wachel, J. C. (N.D). Turbine and Compressor Vibrations. San Antonio: Engineering
Dynamics, Inc.
Wang, F., Song, L., Zhang, L., & Li, H. (2010). , Fault diagnosis for reciprocating air
compressor valve using p-V indicator diagram and SVM. 3rd International Symposium
on Information Science and Engineering,, (pp. 255-258). Shanghai, China.
Wang, W. J. (1996). Wavelet transform in vibration analysis for mechanical fault diagnosis.
Shock and Vibration, 3(1), 17-26.
Wang, W. J., & McFadden, P. D. (1996). APPLICATION OF WAVELETS TO GEARBOX
VIBRATION SIGNALS FOR FAULT DETECTION. Journal of Sound and Vibration,
192(5), 927-939.
Wang, X. (2006). NUMERICAL IMPLEMENTATION OF THE HILBERT TRANSFORM.
Saskatoon,: University of Saskatchewan.
Wang, Y., Gao, A., Zheng, S., & Peng, X. (2015). Experimental investigation of the fault
diagnosis of typical faults in reciprocating compressor valves. Journal of Mechanical
Engineering Science, 230(13), 2285 - 2299.
Wang, Y., Xue, C., Jia, X., & Peng, X. (2015). Fault diagnosis of reciprocating compressor
valve with the method integrating acoustic emission signal and simulated valve motion.
Mechanical Systems and Signal Processing, 56-57, 197-212.
CHARACTERISING VIBRO-ACOUSTIC SIGNALS OF A RECIPROCATING
COMPRESSOR FOR CONDITION MONITORING
238 DEGREE OF DOCTOR OF PHILOSOPHY (PHD)
Wasmbasganss, M. (1966). Mathematical Modelling and Design Evaluation of High-Speed
Reciprocating Compressors. Purdue: Purdue University, USA.
Wickerhauser, M. V. (1994). Adapted wavelet analysis from theory to software. Natick:
Wllesley.
Williams, J. H., Davies, A., & Drake, P. R. (1994). Condition-Based Maintenance and Machine
Diagnostics. London: Chapman & Hall.
Winterbone , D. E., Pearson, R. J., & Horlock, J. (2000). Theory of engine manifold design:
Wave Action Methods for IC Engines. Wiley-Blackwell.
Wu, J.-D., & Chiang, P.-H. (2009). Application of Wigner–Ville distribution and probability
neural network for scooter engine fault diagnosis. Expert Systems with Applications,
36(2), 2187-2199.
Wu, J.-D., & Lui, C.-H. (2009). An expert system for fault diagnosis in internal combustion
engines using wavelet packet transform and neural network. Expert Systems with
Applications, 36(3,Part 1), 4278-4286.
Xiao, H., Wang, Z., & Ren, X. (2005). Classification of surface EMG signal using relative
wavelet packet energy. Computer Methods and Programs in Biomedicine, 79(3), 189-
195.
Yan, J., Heng-hu, Y., Yang , H., Feng, Z., Zhen, L., Ping, W., & Yan, Y. (2015). Nondestructive
Detection of Valves Using Acoustic Emission Technique. Advances in Materials
Science and Engineering, 1-9.
Yan, R. (2007). Base wavelet selection criteria for non-stationary vibration analysis in bearing
health diagnosis. UMass Amherst.
Yang , W. X., & Tse, P. W. (2003). Development of an advanced noise reduction method for
vibration analysis based on singular value decomposition. NDT & E International,
36(6), 419-432.
Yang, B.-S., Hwang, W.-W., Kim, D.-J., & Chit Tan, A. (2005). Condition classification of
small reciprocating compressor for refrigerators using artificial neural networks and
support vector machines. Mechanical Systems and Signal Processing, 371-390.

CHARACTERISING VIBRO-ACOUSTIC SIGNALS OF A RECIPROCATING
COMPRESSOR FOR CONDITION MONITORING
239 DEGREE OF DOCTOR OF PHILOSOPHY (PHD)
Yaqub, M. F., Gondal, I., & Kamruzzaman, J. (2011). Envelope-Wavelet Packet Transform for
Machine Condition Monitoring. International Journal of Mechanical, Aerospace,
Industrial, Mechatronic and Manufacturing Engineering, 5(11), 2477-2482.
Yen, G. G., & Lin, K. C. (2000). Wavelet packet feature extraction for vibration monitoring.
IEEE Transaction on Industrial Electronics, 650-667.
Yen, G. G., & Lin, K. C. (2000). Wavelet packet feature extraction for vibration monitoring.
IEEE transactions on industrial electronics, 47, pp. 650-667.
Yesilyurt, I. (1997). Gearbox Fault Detection and Severity Assessment Using Vibration
Analysis. University of Manchester.
Yongbo, L., Xu, M., Wei, Y., & Huang, W. (2014). Diagnostics of reciprocating compressor
fault based on a new envelope algorithm of empirical mode decomposition. Journal of
Vibroengineering, 16(5), 2269-2286.
Zaman, M. R. (2003). Artifical Neural Network Based Protection of Power Transformers.
Canada: Memorial University of Newfoundland.
Zhan, L., Cheng, J., & Quanke, F. (2015). Effect of a cross-flow perforated tube on pressure
pulsation and pressure loss in a reciprocating compressor piping system. Proceedings
of the Institution of Mechanical Engineers, Part C: Journal of mechanical Engineering
Science, 231(3), 473-484.
Zhen, D., Alibarbar, A., Zhou, X., Gu, F., & Ball, A. (2011). Electrical Motor Current Signal
Analysis using a Dynamic Time Warping Method for Fault Diagnosis. 9th International
Conference on Damage Assessment of Structures, (pp. 1-8).
Zheng, Y. (2005). Numerical Simulation of a Multi-Cylinder Reciprocating Compressor for
Condition Monitoring. Manchester: University of Manchester, Faculty of Engineering
and Physical Sciences.
Zhou, W., Kim, J., & Soedel, W. (2001). New iterative scheme in computer simulation of
positive displacement compressors considering the effects of gas pulsations.
Transactions of the ASME, 123, 282-288.

CHARACTERISING VIBRO-ACOUSTIC SIGNALS OF A RECIPROCATING
COMPRESSOR FOR CONDITION MONITORING
240 DEGREE OF DOCTOR OF PHILOSOPHY (PHD)
Zhu, J., Nostrand, T., Spiegel, C., & Morton, B. (2014). Survey of Condition Indicators for
Condition Monitoring Systems. Annual Conference of the Prognostics and Health
Management Society, (pp. 1-13). Vermont.
Zhuanga, Z., Li, F., & Wei, C. (2012). A Probability Density Estimation for Fault Detection.
Advanced Materials Research, 562-564, 1113-1116.
Related Documents