Department of Biology Laboratory of Protistology and Aquatic Ecology Characterisation of reproductive behaviour and plastid inheritance in pennate diatoms using a Seminavis robusta mapping population Sien Audoor Student number: 01201252 Promoters: Prof. Dr. Wim Vyverman, Prof. Dr. Lieven Clement and Prof. Dr. Koen Sabbe Scientific supervisor: Sam De Decker Master’s dissertation submitted to Ghent University to obtain the degree of Master of Science in Biochemistry and Biotechnology. Major Microbial Biotechnology Academic year: 2016 - 2017

Welcome message from author
This document is posted to help you gain knowledge. Please leave a comment to let me know what you think about it! Share it to your friends and learn new things together.
Transcript
Department of Biology
Laboratory of Protistology and Aquatic Ecology
Characterisation of reproductive behaviour
and plastid inheritance in pennate diatoms
using a Seminavis robusta mapping
population
Sien Audoor Student number: 01201252
Promoters: Prof. Dr. Wim Vyverman, Prof. Dr. Lieven Clement and Prof. Dr. Koen Sabbe
Scientific supervisor: Sam De Decker
Master’s dissertation submitted to Ghent University to obtain the degree of Master of Science in
Biochemistry and Biotechnology. Major Microbial Biotechnology
Academic year: 2016 - 2017
Department of Biology
Laboratory of Protistology and Aquatic Ecology
Characterisation of reproductive behaviour
and plastid inheritance in pennate diatoms
using a Seminavis robusta mapping
population
Sien Audoor Student number: 01201252
Promoters: Prof. Dr. Wim Vyverman, Prof. Dr. Lieven Clement and Prof. Dr. Koen Sabbe
Scientific supervisor: Sam De Decker
Master’s dissertation submitted to Ghent University to obtain the degree of Master of Science in Biochemistry
and Biotechnology. Major Microbial Biotechnology
Academic year: 2016 - 2017
Acknowledgments
This master thesis project involved the input of many people. First, I would like to thank my (co)promotors Wim Vyverman and Lieven Clement for their support and feedback. Secondly, I am
grateful to my supervisor Sam De Decker. He introduced me to the world of diatoms and showed me how interesting they are. He guided me with much enthusiasm and it was a pleasure working
with him. Furthermore, I would like to thank Sofie D’Hondt for sharing her expertise on DGGE and for her help at the Ledeganck. I also want to thank all members of the PAE for welcoming me in
their group. Lastly, I would like to show my gratitude towards my family. My parents, for supporting me in my choices and for encouraging me along the way. And my brother and sister,
for letting me put things into perspective.
Sien
Table of Contents List of abbreviations ......................................................................................................................... i
Nederlandse Samenvatting ............................................................................................................. ii
English Summary ............................................................................................................................ iii
Part 1: Introduction ......................................................................................................................... 1
General introduction ................................................................................................................... 1
Classification ............................................................................................................................... 1
Applications ................................................................................................................................ 2
Plastid evolution ......................................................................................................................... 3
Life cycle ..................................................................................................................................... 3
Seminavis robusta ....................................................................................................................... 5
Model system .......................................................................................................................... 5
Life cycle ................................................................................................................................. 6
Chemical signalling .................................................................................................................. 6
Cryptic diversity in S. robusta .................................................................................................. 8
Plastid inheritance in diatoms ................................................................................................... 10
Part 2: Aims of Research project ................................................................................................... 14
Part 3: Results ............................................................................................................................... 15
DGGE ........................................................................................................................................ 15
Primer design ........................................................................................................................ 15
Nested PCR............................................................................................................................ 15
DGGE ..................................................................................................................................... 15
Characterisation of the F1 mapping population ......................................................................... 17
Generation of the mapping population ................................................................................. 17
Mating type determination ................................................................................................... 17
Sexual compatibility .............................................................................................................. 20
Fitness analysis ...................................................................................................................... 22
Plastid inheritance..................................................................................................................... 23
rbcL sequencing ..................................................................................................................... 23
Microscopical analysis ........................................................................................................... 26
Part 4: Discussion .......................................................................................................................... 28
DGGE ........................................................................................................................................ 28
Characterisation of the F1 mapping population ......................................................................... 28
Plastid inheritance..................................................................................................................... 30
Part 5: Materials and Methods ...................................................................................................... 32
Generating the F1 mapping population ...................................................................................... 32
Phenotyping: Determination of the F1 progeny mating type ...................................................... 32
Growth curve analysis ............................................................................................................... 32
DNA extraction of S. robusta cultures ........................................................................................ 33
Nested PCR ............................................................................................................................... 33
Denaturing gradient gel electrophoresis (DGGE) ....................................................................... 34
Sequencing of rbcL .................................................................................................................... 34
Fluorescence microscopy .......................................................................................................... 34
References .................................................................................................................................... 35
Addendum .................................................................................................................................... 40
Supplementary figures .............................................................................................................. 40
Protocols ................................................................................................................................... 42
QIAquick PCR purification kit ................................................................................................. 42
Muyzer DNA extraction protocol ........................................................................................... 43
DGGE protocol ...................................................................................................................... 44
i
List of abbreviations bp Base pair
DGGE Denaturing Gradient Gel Electrophoresis
EPS Extracellular polysaccharides
G1-phase Gap 1 phase
ITS Internal Transcribed Spacers
MG Mating Group
MT Mating Type
PAM Pulse-Amplitude Modulated
PCR Polymerase Chain Reaction
rbcL Ribulose-1,5-bisphosphate carboxylase/oxygenase large subunit
RuBisCO Ribulose-1,5-bisphosphate carboxylase/oxygenase
SIP Sex-Inducing Pheromone
SST Sexual Size Threshold
ii
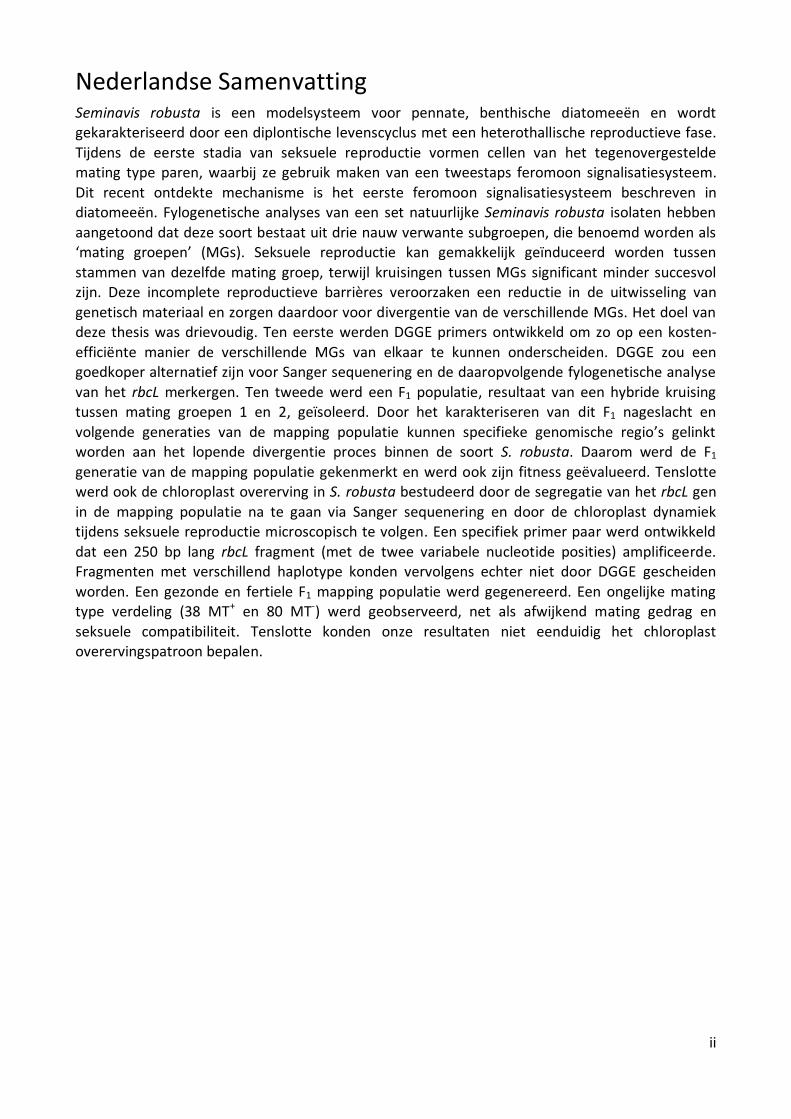
Nederlandse Samenvatting Seminavis robusta is een modelsysteem voor pennate, benthische diatomeeën en wordt gekarakteriseerd door een diplontische levenscyclus met een heterothallische reproductieve fase.
Tijdens de eerste stadia van seksuele reproductie vormen cellen van het tegenovergestelde mating type paren, waarbij ze gebruik maken van een tweestaps feromoon signalisatiesysteem.
Dit recent ontdekte mechanisme is het eerste feromoon signalisatiesysteem beschreven in diatomeeën. Fylogenetische analyses van een set natuurlijke Seminavis robusta isolaten hebben
aangetoond dat deze soort bestaat uit drie nauw verwante subgroepen, die benoemd worden als ‘mating groepen’ (MGs). Seksuele reproductie kan gemakkelijk geïnduceerd worden tussen
stammen van dezelfde mating groep, terwijl kruisingen tussen MGs significant minder succesvol zijn. Deze incomplete reproductieve barrières veroorzaken een reductie in de uitwisseling van
genetisch materiaal en zorgen daardoor voor divergentie van de verschillende MGs. Het doel van deze thesis was drievoudig. Ten eerste werden DGGE primers ontwikkeld om zo op een kosten-
efficiënte manier de verschillende MGs van elkaar te kunnen onderscheiden. DGGE zou een goedkoper alternatief zijn voor Sanger sequenering en de daaropvolgende fylogenetische analyse
van het rbcL merkergen. Ten tweede werd een F1 populatie, resultaat van een hybride kruising tussen mating groepen 1 en 2, geïsoleerd. Door het karakteriseren van dit F1 nageslacht en
volgende generaties van de mapping populatie kunnen specifieke genomische regio’s gelinkt worden aan het lopende divergentie proces binnen de soort S. robusta. Daarom werd de F1
generatie van de mapping populatie gekenmerkt en werd ook zijn fitness geëvalueerd. Tenslotte werd ook de chloroplast overerving in S. robusta bestudeerd door de segregatie van het rbcL gen
in de mapping populatie na te gaan via Sanger sequenering en door de chloroplast dynamiek tijdens seksuele reproductie microscopisch te volgen. Een specifiek primer paar werd ontwikkeld
dat een 250 bp lang rbcL fragment (met de twee variabele nucleotide posities) amplificeerde. Fragmenten met verschillend haplotype konden vervolgens echter niet door DGGE gescheiden
worden. Een gezonde en fertiele F1 mapping populatie werd gegenereerd. Een ongelijke mating type verdeling (38 MT+ en 80 MT-) werd geobserveerd, net als afwijkend mating gedrag en
seksuele compatibiliteit. Tenslotte konden onze resultaten niet eenduidig het chloroplast overervingspatroon bepalen.
iii
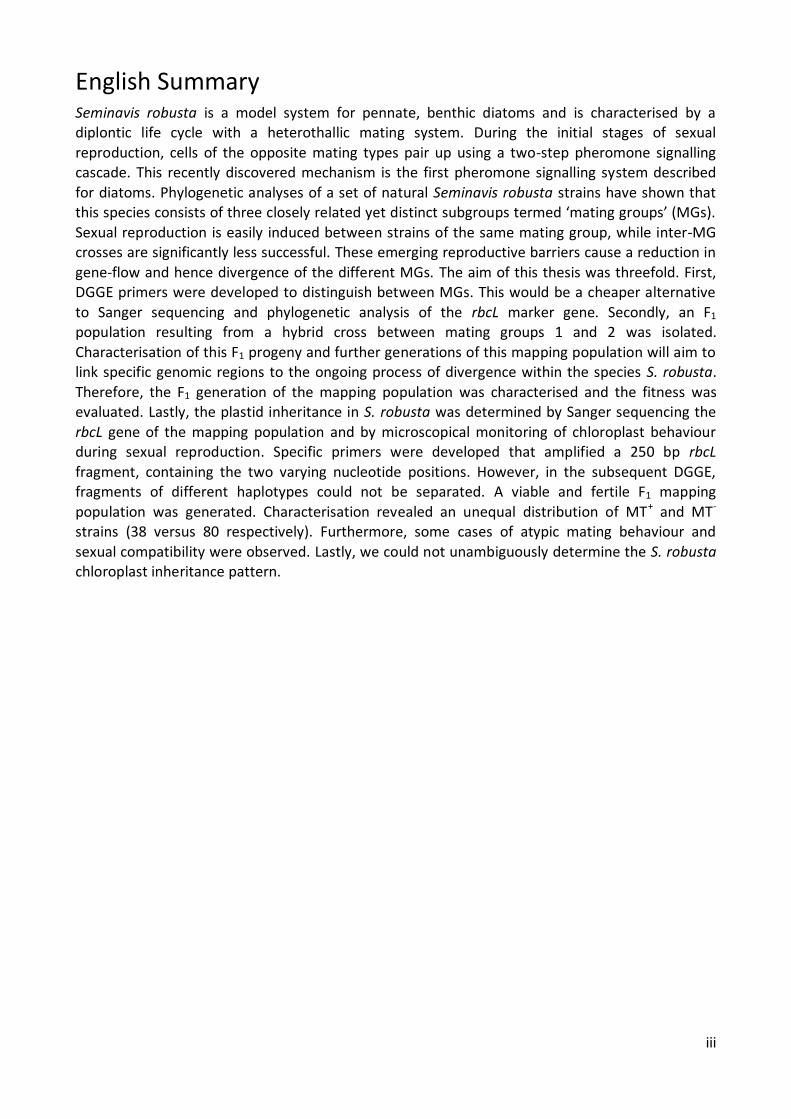
English Summary Seminavis robusta is a model system for pennate, benthic diatoms and is characterised by a diplontic life cycle with a heterothallic mating system. During the initial stages of sexual
reproduction, cells of the opposite mating types pair up using a two-step pheromone signalling cascade. This recently discovered mechanism is the first pheromone signalling system described
for diatoms. Phylogenetic analyses of a set of natural Seminavis robusta strains have shown that this species consists of three closely related yet distinct subgroups termed ‘mating groups’ (MGs).
Sexual reproduction is easily induced between strains of the same mating group, while inter-MG crosses are significantly less successful. These emerging reproductive barriers cause a reduction in
gene-flow and hence divergence of the different MGs. The aim of this thesis was threefold. First, DGGE primers were developed to distinguish between MGs. This would be a cheaper alternative
to Sanger sequencing and phylogenetic analysis of the rbcL marker gene. Secondly, an F1 population resulting from a hybrid cross between mating groups 1 and 2 was isolated.
Characterisation of this F1 progeny and further generations of this mapping population will aim to link specific genomic regions to the ongoing process of divergence within the species S. robusta.
Therefore, the F1 generation of the mapping population was characterised and the fitness was evaluated. Lastly, the plastid inheritance in S. robusta was determined by Sanger sequencing the
rbcL gene of the mapping population and by microscopical monitoring of chloroplast behaviour during sexual reproduction. Specific primers were developed that amplified a 250 bp rbcL
fragment, containing the two varying nucleotide positions. However, in the subsequent DGGE, fragments of different haplotypes could not be separated. A viable and fertile F1 mapping
population was generated. Characterisation revealed an unequal distribution of MT+ and MT- strains (38 versus 80 respectively). Furthermore, some cases of atypic mating behaviour and
sexual compatibility were observed. Lastly, we could not unambiguously determine the S. robusta chloroplast inheritance pattern.
Part 1: Introduction
Page | 1
Part 1: Introduction General introduction Diatoms (Bacillariophyceae) are found in a wide range of habitats. They mainly live in marine environments and freshwater lakes and rivers (Armbrust, 2009; Sims et al, 2006), but some are
also found in wet terrestrial habitats (Sims et al, 2006). With an estimated amount of approximately 200 000 species, they are one of the most diverse groups of microalgae (Mann &
Droop, 1996). Diatoms are of great ecological importance as they are responsible for up to 20% of the global carbon fixation, which is comparable to the total CO2 fixation in all rainforests (Field et
al, 1998; Mann, 1999). Diatoms also have a key role in the global carbon cycle, as their organic matter serves as a food source for aquatic organisms. A part of this organic matter settles on the
sea floor, where it is stored in sediments and contributes to petroleum reserves (Armbrust, 2009). Diatoms have a cell wall built from silica, which is available in the sea water, thus giving diatoms a
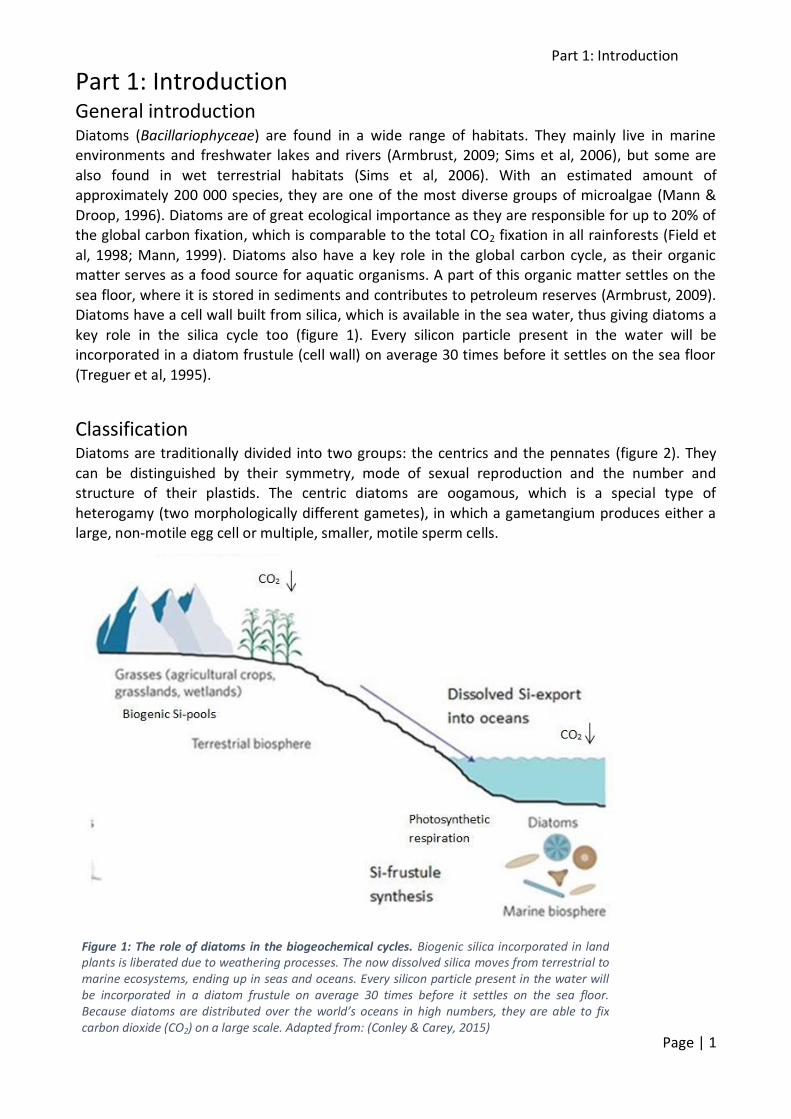
key role in the silica cycle too (figure 1). Every silicon particle present in the water will be incorporated in a diatom frustule (cell wall) on average 30 times before it settles on the sea floor
(Treguer et al, 1995).
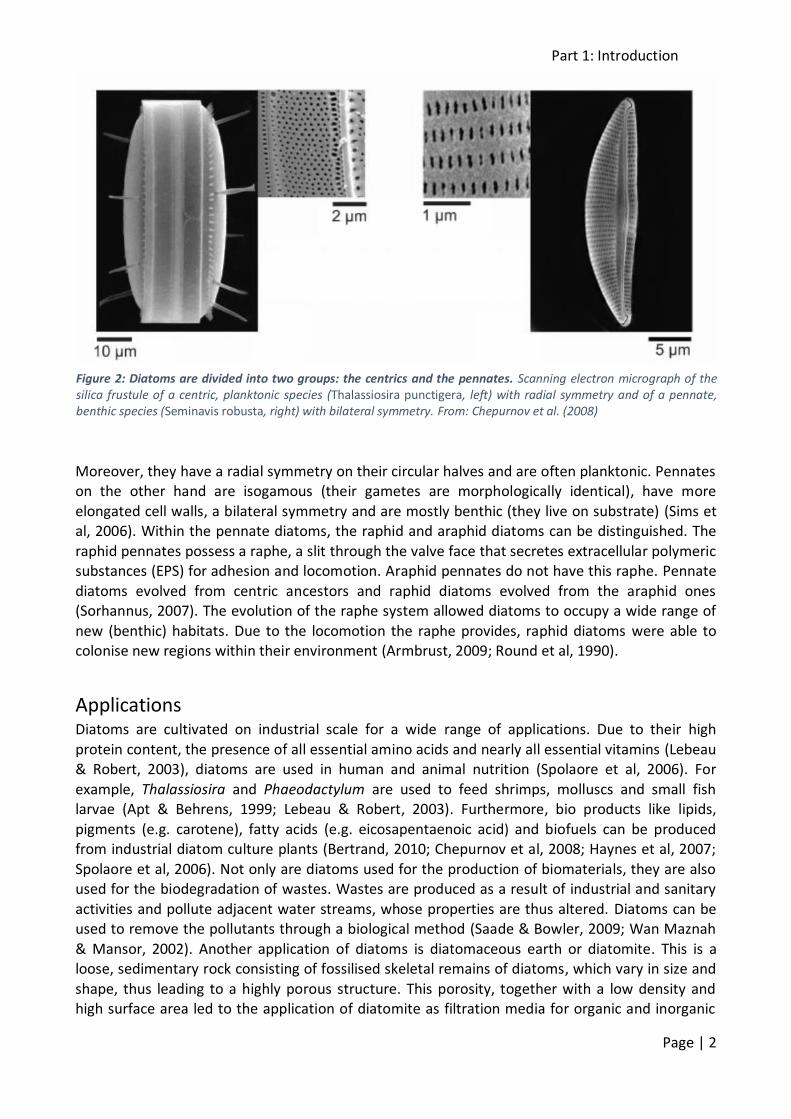
Classification Diatoms are traditionally divided into two groups: the centrics and the pennates (figure 2). They
can be distinguished by their symmetry, mode of sexual reproduction and the number and structure of their plastids. The centric diatoms are oogamous, which is a special type of
heterogamy (two morphologically different gametes), in which a gametangium produces either a large, non-motile egg cell or multiple, smaller, motile sperm cells.
Figure 1: The role of diatoms in the biogeochemical cycles. Biogenic silica incorporated in land plants is liberated due to weathering processes. The now dissolved silica moves from terrestrial to marine ecosystems, ending up in seas and oceans. Every silicon particle present in the water will be incorporated in a diatom frustule on average 30 times before it settles on the sea floor. Because diatoms are distributed over the world’s oceans in high numbers, they are able to fix carbon dioxide (CO2) on a large scale. Adapted from: (Conley & Carey, 2015)
Part 1: Introduction
Page | 2
Moreover, they have a radial symmetry on their circular halves and are often planktonic. Pennates on the other hand are isogamous (their gametes are morphologically identical), have more
elongated cell walls, a bilateral symmetry and are mostly benthic (they live on substrate) (Sims et al, 2006). Within the pennate diatoms, the raphid and araphid diatoms can be distinguished. The
raphid pennates possess a raphe, a slit through the valve face that secretes extracellular polymeric substances (EPS) for adhesion and locomotion. Araphid pennates do not have this raphe. Pennate
diatoms evolved from centric ancestors and raphid diatoms evolved from the araphid ones (Sorhannus, 2007). The evolution of the raphe system allowed diatoms to occupy a wide range of
new (benthic) habitats. Due to the locomotion the raphe provides, raphid diatoms were able to colonise new regions within their environment (Armbrust, 2009; Round et al, 1990).
Applications Diatoms are cultivated on industrial scale for a wide range of applications. Due to their high
protein content, the presence of all essential amino acids and nearly all essential vitamins (Lebeau & Robert, 2003), diatoms are used in human and animal nutrition (Spolaore et al, 2006). For
example, Thalassiosira and Phaeodactylum are used to feed shrimps, molluscs and small fish larvae (Apt & Behrens, 1999; Lebeau & Robert, 2003). Furthermore, bio products like lipids,
pigments (e.g. carotene), fatty acids (e.g. eicosapentaenoic acid) and biofuels can be produced from industrial diatom culture plants (Bertrand, 2010; Chepurnov et al, 2008; Haynes et al, 2007;
Spolaore et al, 2006). Not only are diatoms used for the production of biomaterials, they are also used for the biodegradation of wastes. Wastes are produced as a result of industrial and sanitary
activities and pollute adjacent water streams, whose properties are thus altered. Diatoms can be used to remove the pollutants through a biological method (Saade & Bowler, 2009; Wan Maznah
& Mansor, 2002). Another application of diatoms is diatomaceous earth or diatomite. This is a loose, sedimentary rock consisting of fossilised skeletal remains of diatoms, which vary in size and
shape, thus leading to a highly porous structure. This porosity, together with a low density and high surface area led to the application of diatomite as filtration media for organic and inorganic
Figure 2: Diatoms are divided into two groups: the centrics and the pennates. Scanning electron micrograph of the silica frustule of a centric, planktonic species (Thalassiosira punctigera, left) with radial symmetry and of a pennate, benthic species (Seminavis robusta, right) with bilateral symmetry. From: Chepurnov et al. (2008)
Part 1: Introduction
Page | 3
chemicals and as adsorbent for oil spills (Lemonas, 1997). Furthermore, modified diatomite is used
as filter for the absorption of heavy metals (Al-Degs et al, 2001). Finally, diatoms can also be used to evaluate toxicity of mineral elements whereby growth inhibition due to the toxic effects is
evaluated (Hess, 2010; Navarro et al, 2008).
Plastid evolution Diatoms possess chloroplasts which execute the photosynthetic functions. Depending on the diatom species, the number of chloroplasts, the cellular location and the structure can vary
(Mann, 1996). Most centric diatoms contain multiple disk-shaped chloroplasts, while most pennate diatoms have only one or two large elongated or lob-shaped chloroplasts (Round et al,
1990).
Chloroplast membrane structure is very similar in all diatoms. Chloroplasts are surrounded by four
membranes, as supported by the secondary endosymbiosis hypothesis. This hypothesis states that chloroplasts in Stramenopiles (to which diatoms belong), Euglenids and Dinoflagellates originate
from two subsequent endosymbiotic events. During primary endosymbiosis, a unicellular protist, the common ancestor of green and red algae, engulfed a cyanobacterium through phagocytosis.
Instead of being digested in the vacuole, this bacterium was retained in the cell and evolved to a double-membrane plastid, giving this ancestor photosynthetic properties. During secondary
endosymbiosis, a red alga was subsequently engulfed by a diatom ancestor and again retained in the cell for its photosynthetic functions. This explains why chloroplasts of diatoms have four
membranes: two originate from the engulfed red alga and two are the result of the engulfment by the diatom ancestor. Gene transfer between chloroplast genomes, red algae genomes and diatom
genomes further supports this hypothesis (Bhattacharya et al, 2004; Bowler et al, 2008; McFadden, 2001; Mereschkowsky, 1905; Moreira et al, 2000). Furthermore, chloroplasts still
possess some core genes from their cyanobacterial ancestor. The majority of them are needed to drive the light reactions of the photosynthesis (Green, 2011). One of those chloroplast-encoded
genes is rbcL (ribulose-1,5-bisphosphate carboxylase/oxygenase large subunit), often used in studies of evolution, phylogeny and systematics (Alverson, 2008). This gene codes for the large
subunit of the RuBisCO (ribulose-1,5-bisphosphate carboxylase/oxygenase) protein. This protein has a double function. It catalyses the carboxylation of D-ribulose 1-5 bisphosphate (carboxylase
function), the first event in the carbon dioxide fixation, as well as the oxidation of D-ribulose 1-5 bisphosphate (oxygenase function). Both reactions compete for the same reactive site, as a result
the oxygenase activity decreases the carboxylase activity and thus also the photosynthesis efficiency .
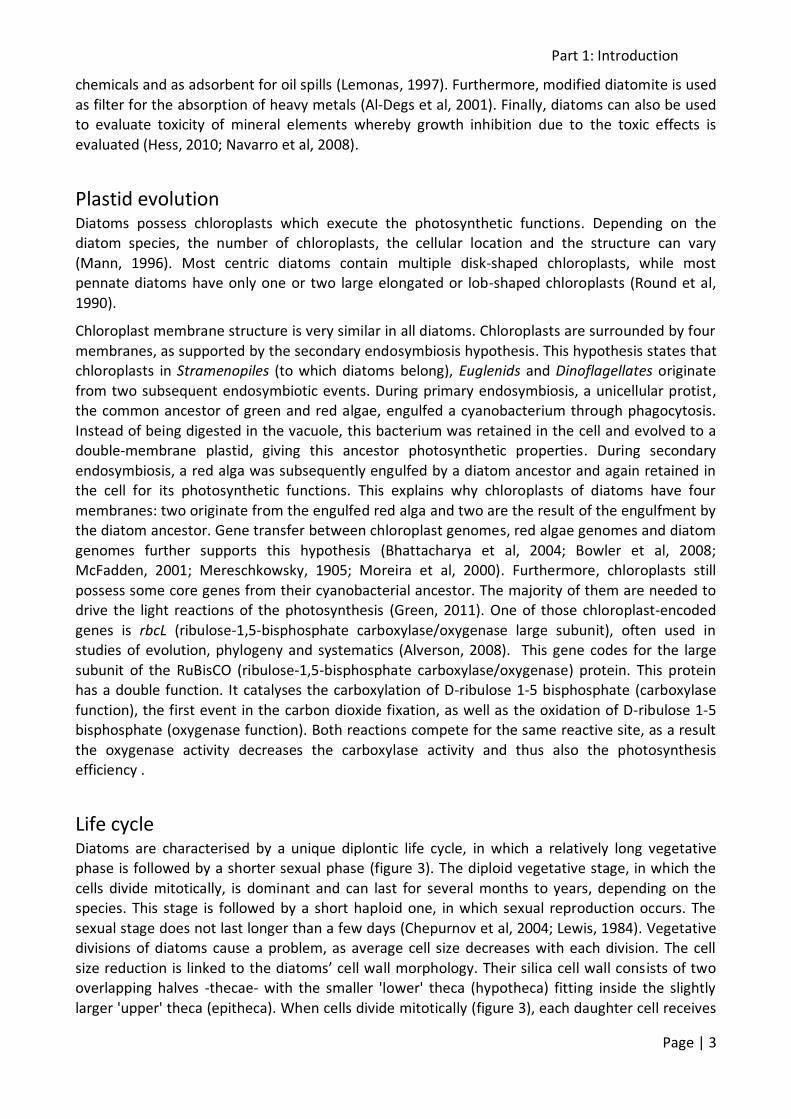
Life cycle Diatoms are characterised by a unique diplontic life cycle, in which a relatively long vegetative phase is followed by a shorter sexual phase (figure 3). The diploid vegetative stage, in which the
cells divide mitotically, is dominant and can last for several months to years, depending on the species. This stage is followed by a short haploid one, in which sexual reproduction occurs. The
sexual stage does not last longer than a few days (Chepurnov et al, 2004; Lewis, 1984). Vegetative divisions of diatoms cause a problem, as average cell size decreases with each division. The cell
size reduction is linked to the diatoms’ cell wall morphology. Their silica cell wall consists of two overlapping halves -thecae- with the smaller 'lower' theca (hypotheca) fitting inside the slightly
larger 'upper' theca (epitheca). When cells divide mitotically (figure 3), each daughter cell receives
Part 1: Introduction
Page | 4
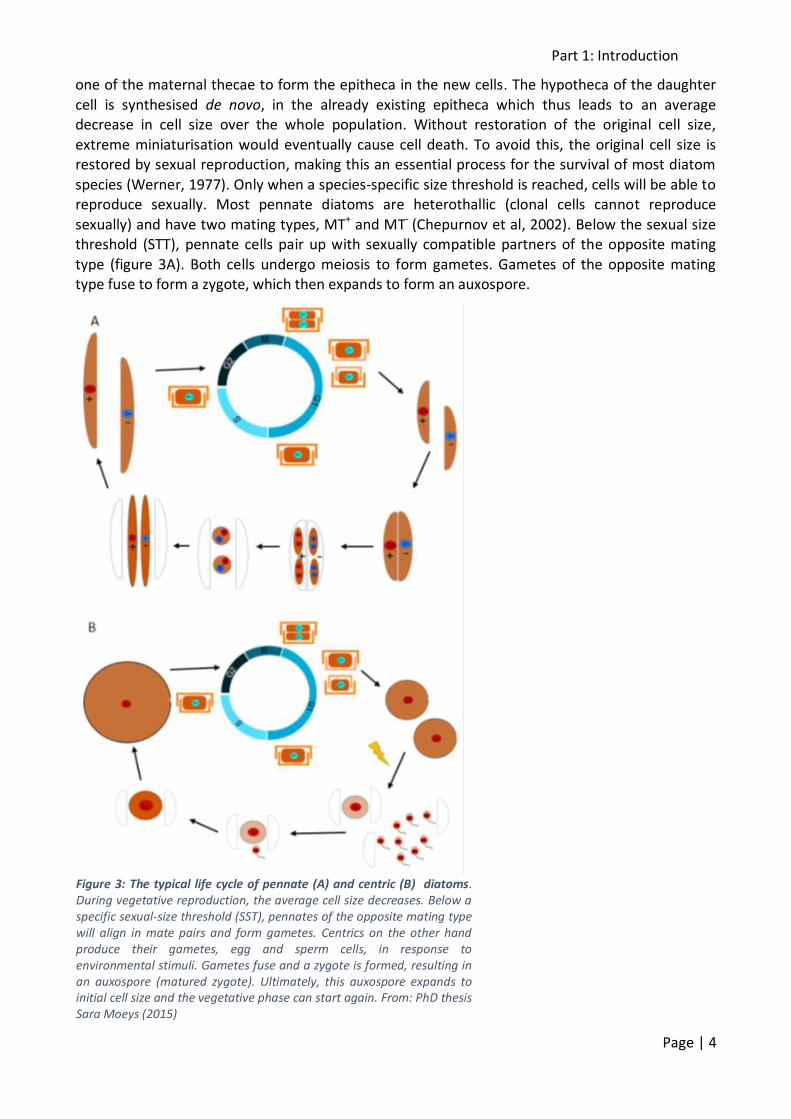
one of the maternal thecae to form the epitheca in the new cells. The hypotheca of the daughter
cell is synthesised de novo, in the already existing epitheca which thus leads to an average decrease in cell size over the whole population. Without restoration of the original cell size,
extreme miniaturisation would eventually cause cell death. To avoid this, the original cell size is restored by sexual reproduction, making this an essential process for the survival of most diatom
species (Werner, 1977). Only when a species-specific size threshold is reached, cells will be able to reproduce sexually. Most pennate diatoms are heterothallic (clonal cells cannot reproduce
sexually) and have two mating types, MT+ and MT- (Chepurnov et al, 2002). Below the sexual size threshold (STT), pennate cells pair up with sexually compatible partners of the opposite mating
type (figure 3A). Both cells undergo meiosis to form gametes. Gametes of the opposite mating type fuse to form a zygote, which then expands to form an auxospore.
Figure 3: The typical life cycle of pennate (A) and centric (B) diatoms. During vegetative reproduction, the average cell size decreases. Below a specific sexual-size threshold (SST), pennates of the opposite mating type will align in mate pairs and form gametes. Centrics on the other hand produce their gametes, egg and sperm cells, in response to environmental stimuli. Gametes fuse and a zygote is formed, resulting in an auxospore (matured zygote). Ultimately, this auxospore expands to initial cell size and the vegetative phase can start again. From: PhD thesis Sara Moeys (2015)
Part 1: Introduction
Page | 5
Auxospores further expand to sizes two or three times bigger than the parental cells. Inside the
auxospore, an initial cell (vegetative cell with maximal cell size) is formed. Once the initial cell formation is complete, vegetative cell divisions can start again (Chepurnov et al, 2008).
Centric diatoms generally use a different strategy (figure 3B). They produce gametangia in
response to environmental cues (Armbrust, 2009). These gametangia will either form an immotile
egg cell or multiple motile sperm cells that will fertilise the egg cell. This means that centrics are
self-fertile and that clonal cells can mate and form progeny (homothallic reproduction)
(Chepurnov et al, 2004; Round et al, 1990).
Seminavis robusta Model system
Traditionally, Thalassiosira pseudonana, a centric diatom, and Phaeodactylum tricornutum, a
pennate diatom, are the most used model systems for functional studies of diatom biology. Both diatom species have a known genome sequence and easy genetic transformation is possible for
both (Apt et al, 1996; Armbrust et al, 2004; Bowler et al, 2008; Poulsen et al, 2006). However, T. pseudonana and P. tricornutum do not show cell size reduction and thus sexual reproduction
(Chepurnov et al, 2004; Hildebrand et al, 2007). This allows them to be kept in culture indefinitely. This property can be advantageous in many studies, but is not suitable when studying the diatom
life cycle. Furthermore, it does not allow for experimental crossing.
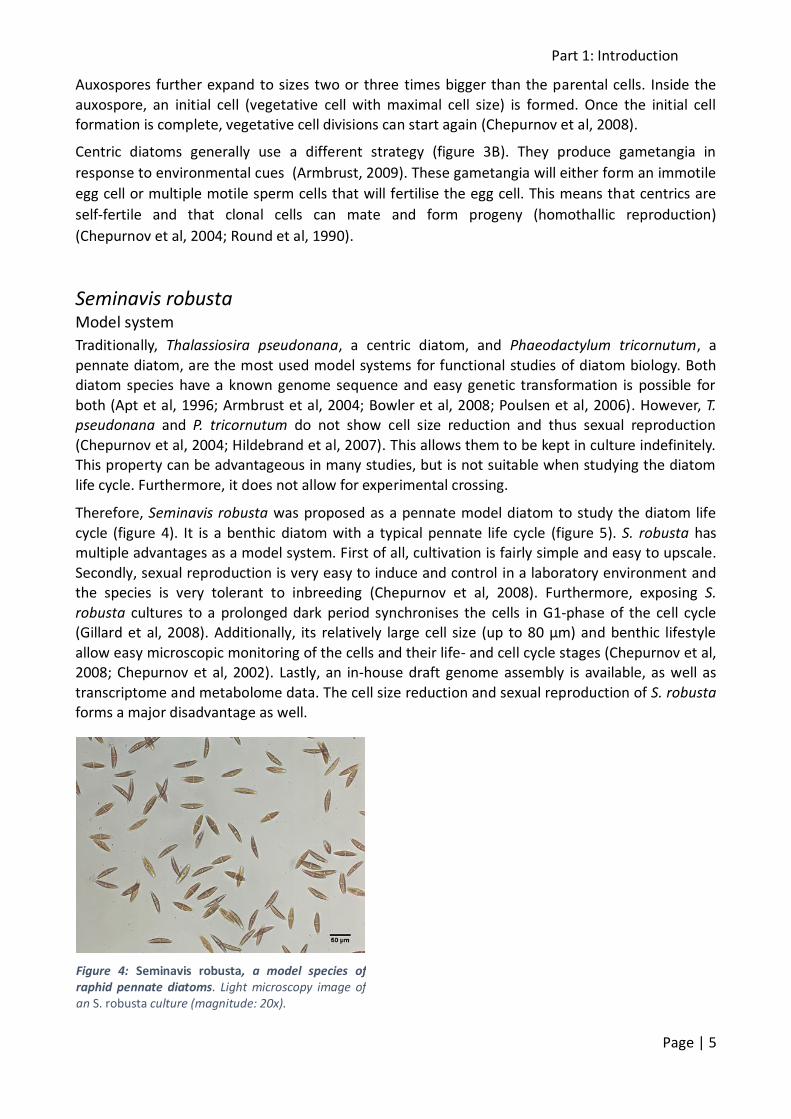
Therefore, Seminavis robusta was proposed as a pennate model diatom to study the diatom life
cycle (figure 4). It is a benthic diatom with a typical pennate life cycle (figure 5). S. robusta has multiple advantages as a model system. First of all, cultivation is fairly simple and easy to upscale.
Secondly, sexual reproduction is very easy to induce and control in a laboratory environment and the species is very tolerant to inbreeding (Chepurnov et al, 2008). Furthermore, exposing S.
robusta cultures to a prolonged dark period synchronises the cells in G1-phase of the cell cycle (Gillard et al, 2008). Additionally, its relatively large cell size (up to 80 µm) and benthic lifestyle
allow easy microscopic monitoring of the cells and their life- and cell cycle stages (Chepurnov et al, 2008; Chepurnov et al, 2002). Lastly, an in-house draft genome assembly is available, as well as
transcriptome and metabolome data. The cell size reduction and sexual reproduction of S. robusta forms a major disadvantage as well.
Figure 4: Seminavis robusta, a model species of raphid pennate diatoms. Light microscopy image of an S. robusta culture (magnitude: 20x).
Part 1: Introduction
Page | 6
In contrast to T. pseudonana and P. tricornutum, S. robusta cannot be kept in culture indefinitely.
If strains are not crossed with compatible mates, they will die of extreme miniaturisation. To prevent this cell death from happening, strains can be cryopreserved.
In the last years, S. robusta was subject of many studies. Not only was cell cycle progression and chloroplast development investigated, also gene expression in relation to chloroplast functioning
and photosynthesis was studied (Gillard et al, 2008). Additionally, the chloroplast genome was revealed, indicating horizontal gene transfer events between diatom plastids (Brembu et al, 2014).
Furthermore, the chemical signalling cascade prior to mating is very well-studied in S. robusta (figure 5). It is the first diatom for which the molecular structure of a pheromone as well as a two-
step signalling system was identified (Gillard et al, 2013; Moeys et al, 2016). Lastly, a linkage mapping approach allowed delineation of a single genetic locus determining the mating type of S.
robusta (Vanstechelman et al, 2013).
Life cycle
Seminavis robusta has a typical pennate life cycle (figure 5). A short period of sexual reproduction is preceded by a long period of vegetative reproduction. Only when cell size is below the SST, the
switch from vegetative to sexual reproduction is possible. For S. robusta, the SST is around 50 µm (Chepurnov et al, 2002). Like most pennates, S. robusta is heterothallic with two mating types:
MT+ and MT- . Below the SST, MT- cells attract MT+ cells and they make physical contact, lying parallel to each other and forming mating pairs. After contact, both gametangia will produce
morphologically identical gametes. The gametangia undergo meiosis I and cytokinesis. As a result, two protoplasts lacking a siliceous cell wall are formed within the mother cell. Soon after
cytokinesis, the protoplasts undergo meiosis II, which is not followed by cytokinesis. As a result, each gametangium possesses two protoplasts, each containing two haploid nuclei. The protoplasts
differentiate into (identical) gametes which, after contraction, partially separate from the gametangia. Gametes from both gametangia make contact and fuse, resulting in two zygotes.
During the initial phase of zygote development two haploid nuclei are aborted. Both zygotes will expand to form auxospores, one of each mating type. The two surviving nuclei remain closely
associated in the cytoplasm of the auxospores. Fusion of both nuclei occurs either at a very late stage of auxospore expansion or just after expansion is completed, resulting in an auxospore with
a single diploid nucleus. Ultimately, the auxospore starts to form an initial epitheca, followed by the formation of an initial hypotheca, thus forming the initial cell. The length of S. robusta initial
cells varies between 64 and 73 µm. After this cell escapes the auxospore exoskeleton (perizonium), mitotic divisions start again and the life can start all over again (Chepurnov et al,
2002).
Chemical signalling
An important step in the S. robusta life cycle is the mate pairing of MT+ and MT- cells just before
gametogenesis. Synchronised behaviour is required for two mates to pair successfully (Johansson & Jones, 2007). This means that one or both of the partners should be able to move and locate its
partner. Centric diatoms are generally oogamous and have flagellated sperm cells, which are motile, thus leading them to the immobile egg cell (Chepurnov et al, 2006; Idei & Chihara, 1992).
Some araphid pennates like Pseudostaurosira trainorii or Tabularia fasciculate exhibit anisogamy, in which the pairing gametes have a different morphology and behaviour.
Part 1: Introduction
Page | 7
In P. trainorii, motile male gametes find the stationary female ones, whereas in T. fasciculate
fertilisation occurs through a non-directed random walk (Edgar et al, 2014; Sato et al, 2011). However, most raphid pennate diatoms such as Seminavis robusta exhibit isogamy, in which the
pairing gametes are morphologically and physiologically indistinguishable (Chepurnov et al, 2004). As a consequence, the gametangia and not the gametes are responsible for mate finding under
the influence of pheromones. Gliding movement of pennate diatoms is possible through the coupling of an intra-cellular actin-myosin system below the raphe with adhesive EPS excreted from
the raphe (Poulsen et al, 1999).
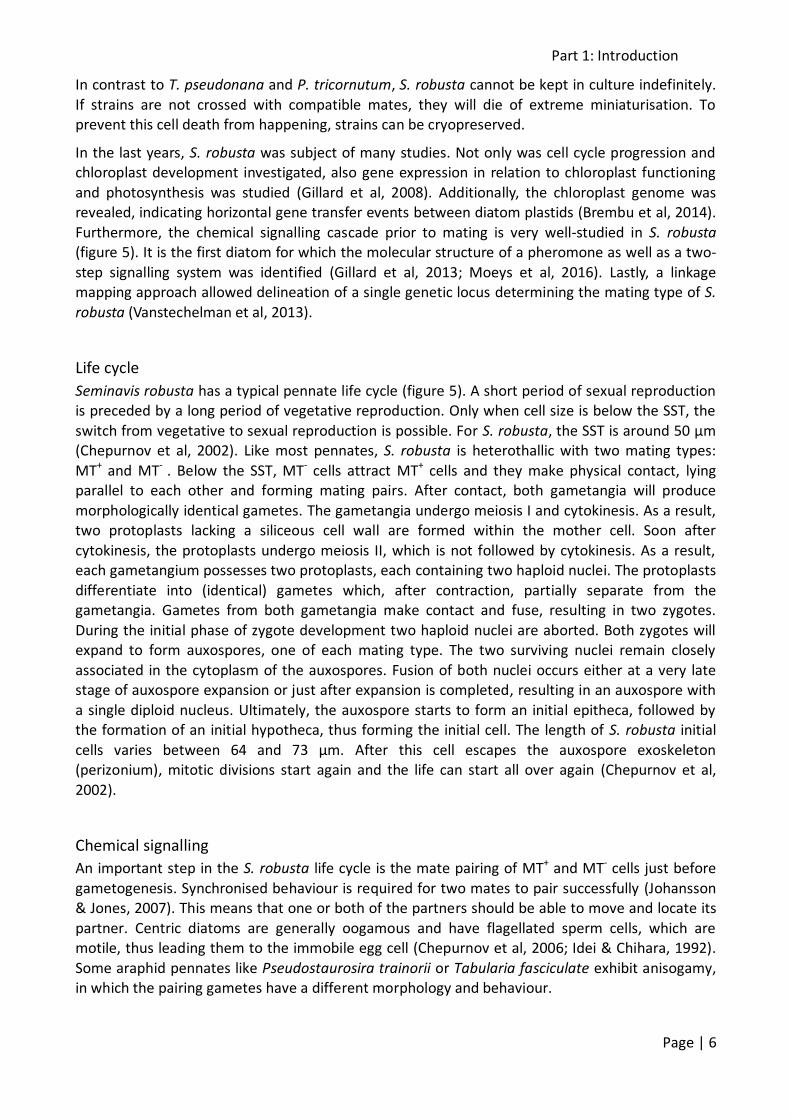
In S. robusta, at least 2 pheromones are involved: a sex-inducing pheromone, SIP, and an
attraction pheromone, diproline (figure 5). Below the SST, both MT+ and MT- cells produce a sex-inducing pheromone, SIP+ and SIP- respectively. These SIPs, present in very low concentrations
(probably picomolar range), elicit multiple responses when perceived by cells of the opposite mating type. First, it induces an arrest in the G1 phase of the cell cycle (Moeys et al, 2016).
Secondly, SIP+ will trigger MT- cells to produce diproline, a proline derived diketopiperazine, functioning as an attraction pheromone. Diproline is produced in relatively high concentrations
(nanomolar range), resulting in a diproline concentration gradient. Upon perception of SIP-, MT+
Figure 5: The Seminavis robusta life cycle. During the vegetative phase cells divide mitotically, which decreases the average cell size with every mitotic division. When the cell size is below a certain size, the sexual size threshold (SST), diatoms will be able to engage in sexual reproduction. MT+ and MT- diatoms start the production of sex-inducing pheromones, SIP+ and SIP- respectively. Upon SIP+ perception, MT- cells produce and secrete diproline, an attraction pheromone. At the same time, MT+ becomes sensitive to diproline after perception of SIP-. Opposite mates find each other due to diproline signalling and mates are formed. Both mates produce gametes and a zygote is formed. Ultimately, auxospores (matured zygotes) will expand to initial cell size and the cycle can start again. From: Moeys et al. (2016)
Part 1: Introduction
Page | 8
cells will become sensitive to diproline. As a consequence, MT+ cells will move towards the
opposite MT- cells by following the produced diproline gradient (Gillard et al, 2013).
Cryptic diversity in S. robusta
As mentioned above, sexual reproduction is often an obligatory step in the life cycle of diatoms. Whereas sexual reproduction in centrics is triggered by environmental cues and thus condition-
dependent (Armbrust, 2009), most pennate diatoms developed a sophisticated, controlled mating system. In S. robusta, for example, sexual reproduction will only be induced below the SST and
upon SIP and diproline production and perception (Chepurnov et al, 2002; Moeys et al, 2016). The emergence of reproductive barriers and the subsequent process of species divergence could be
the result of a divergence of the mating systems (von Dassow & Montresor, 2011). Even within the same ‘species’, incomplete reproductive isolation might give rise to cryptic intra-specific diversity.
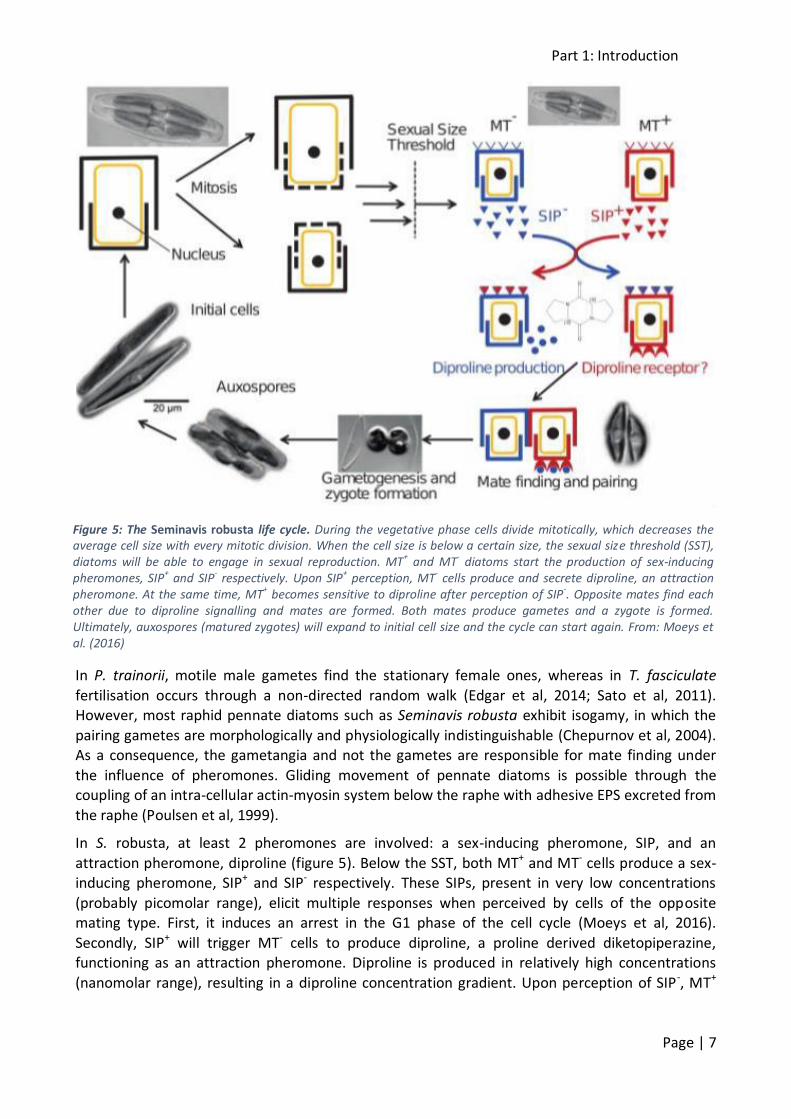
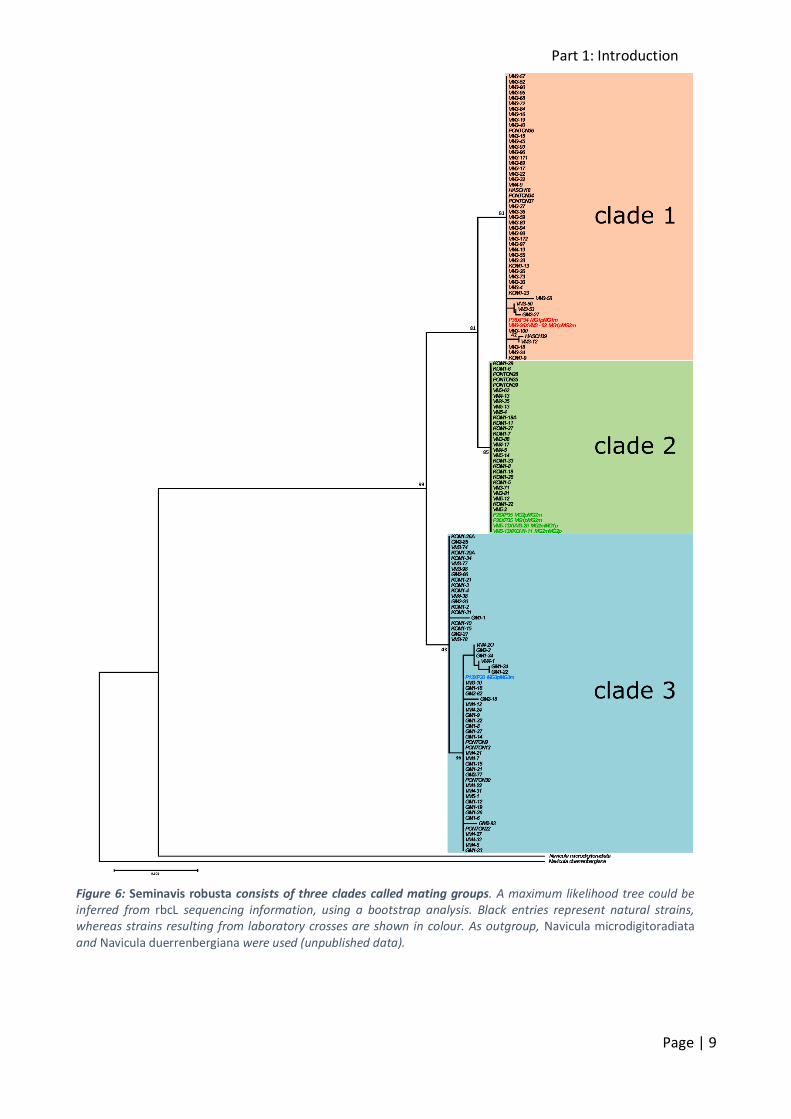
Based on rbcL sequence data, S. robusta consists of three closely related yet distinct clades called mating groups (MGs) (figure 6, unpublished data).
Within MG1 and MG2, rbcL sequences are almost completely identical, with average intra-lineage p-distances of 0.0%. Within MG3, the sequences show a slightly higher divergence, with an
average intra-lineage p-distance of 0.1%. Although the inter-lineage differences between the three mating groups are relatively low (0.24% between MG1 and MG2, 0.48% between MG2 and MG3
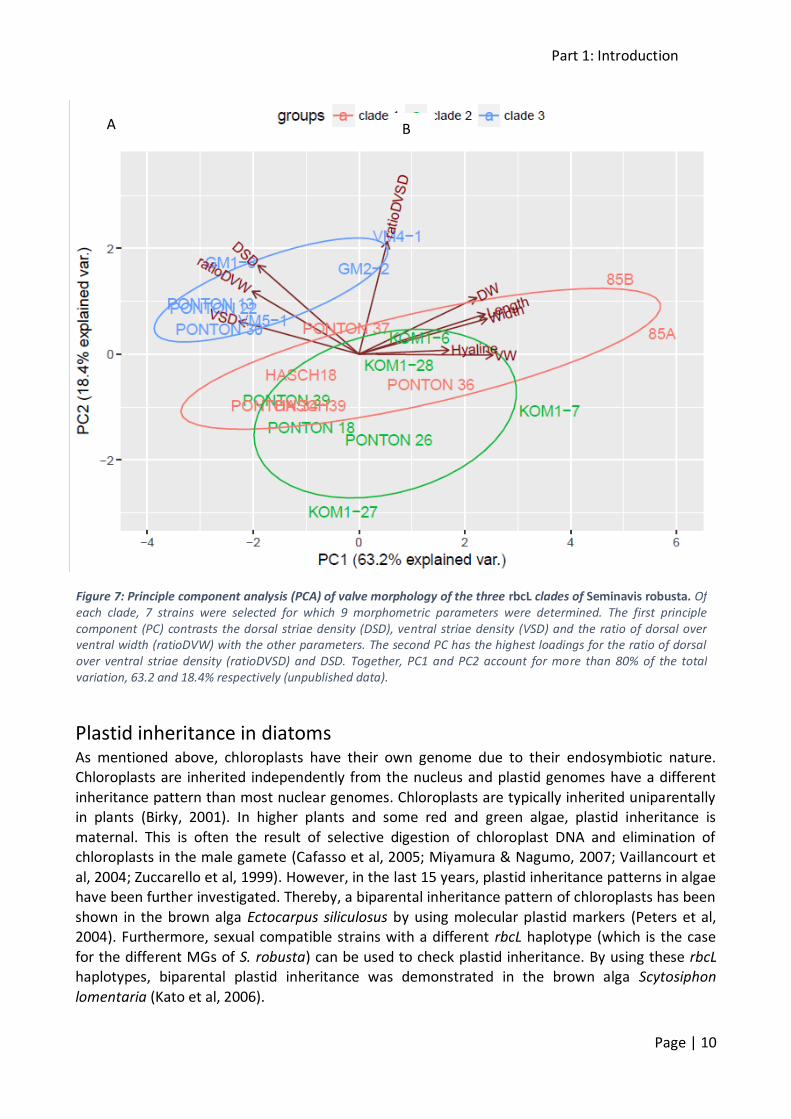
and 0.55% between MG1 and MG3), those differences are conserved among all studied strains within each mating group. Further analysis of valve morphology confirms this grouping. Although
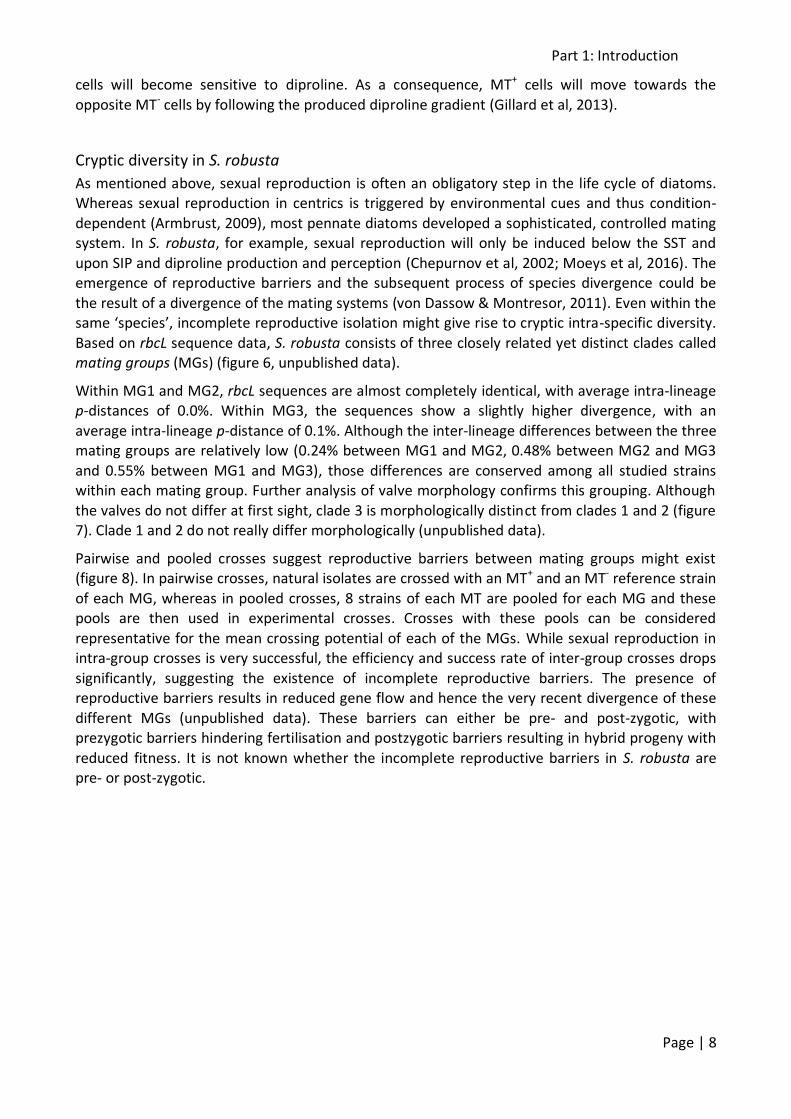
the valves do not differ at first sight, clade 3 is morphologically distinct from clades 1 and 2 (figure 7). Clade 1 and 2 do not really differ morphologically (unpublished data).
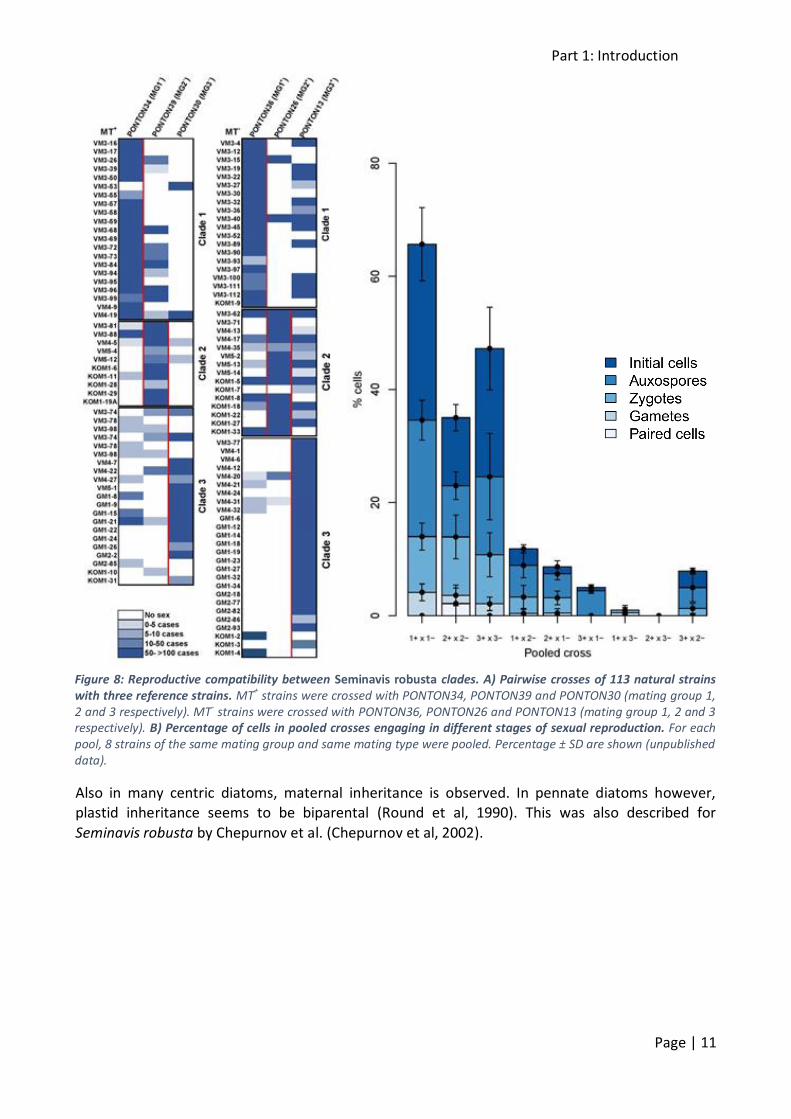
Pairwise and pooled crosses suggest reproductive barriers between mating groups might exist (figure 8). In pairwise crosses, natural isolates are crossed with an MT+ and an MT- reference strain
of each MG, whereas in pooled crosses, 8 strains of each MT are pooled for each MG and these pools are then used in experimental crosses. Crosses with these pools can be considered
representative for the mean crossing potential of each of the MGs. While sexual reproduction in intra-group crosses is very successful, the efficiency and success rate of inter-group crosses drops
significantly, suggesting the existence of incomplete reproductive barriers. The presence of reproductive barriers results in reduced gene flow and hence the very recent divergence of these
different MGs (unpublished data). These barriers can either be pre- and post-zygotic, with prezygotic barriers hindering fertilisation and postzygotic barriers resulting in hybrid progeny with
reduced fitness. It is not known whether the incomplete reproductive barriers in S. robusta are pre- or post-zygotic.
Part 1: Introduction
Page | 9
Figure 6: Seminavis robusta consists of three clades called mating groups. A maximum likelihood tree could be inferred from rbcL sequencing information, using a bootstrap analysis. Black entries represent natural strains, whereas strains resulting from laboratory crosses are shown in colour. As outgroup, Navicula microdigitoradiata and Navicula duerrenbergiana were used (unpublished data).
Part 1: Introduction
Page | 10
Plastid inheritance in diatoms As mentioned above, chloroplasts have their own genome due to their endosymbiotic nature. Chloroplasts are inherited independently from the nucleus and plastid genomes have a different
inheritance pattern than most nuclear genomes. Chloroplasts are typically inherited uniparentally in plants (Birky, 2001). In higher plants and some red and green algae, plastid inheritance is
maternal. This is often the result of selective digestion of chloroplast DNA and elimination of chloroplasts in the male gamete (Cafasso et al, 2005; Miyamura & Nagumo, 2007; Vaillancourt et
al, 2004; Zuccarello et al, 1999). However, in the last 15 years, plastid inheritance patterns in algae have been further investigated. Thereby, a biparental inheritance pattern of chloroplasts has been
shown in the brown alga Ectocarpus siliculosus by using molecular plastid markers (Peters et al, 2004). Furthermore, sexual compatible strains with a different rbcL haplotype (which is the case
for the different MGs of S. robusta) can be used to check plastid inheritance. By using these rbcL haplotypes, biparental plastid inheritance was demonstrated in the brown alga Scytosiphon
lomentaria (Kato et al, 2006).
Figure 7: Principle component analysis (PCA) of valve morphology of the three rbcL clades of Seminavis robusta. Of each clade, 7 strains were selected for which 9 morphometric parameters were determined. The first principle component (PC) contrasts the dorsal striae density (DSD), ventral striae density (VSD) and the ratio of dorsal over ventral width (ratioDVW) with the other parameters. The second PC has the highest loadings for the ratio of dorsal over ventral striae density (ratioDVSD) and DSD. Together, PC1 and PC2 account for more than 80% of the total variation, 63.2 and 18.4% respectively (unpublished data).
A B
Part 1: Introduction
Page | 11
Also in many centric diatoms, maternal inheritance is observed. In pennate diatoms however, plastid inheritance seems to be biparental (Round et al, 1990). This was also described for
Seminavis robusta by Chepurnov et al. (Chepurnov et al, 2002).
Figure 8: Reproductive compatibility between Seminavis robusta clades. A) Pairwise crosses of 113 natural strains with three reference strains. MT+ strains were crossed with PONTON34, PONTON39 and PONTON30 (mating group 1, 2 and 3 respectively). MT- strains were crossed with PONTON36, PONTON26 and PONTON13 (mating group 1, 2 and 3 respectively). B) Percentage of cells in pooled crosses engaging in different stages of sexual reproduction. For each pool, 8 strains of the same mating group and same mating type were pooled. Percentage ± SD are shown (unpublished data).
Part 1: Introduction
Page | 12
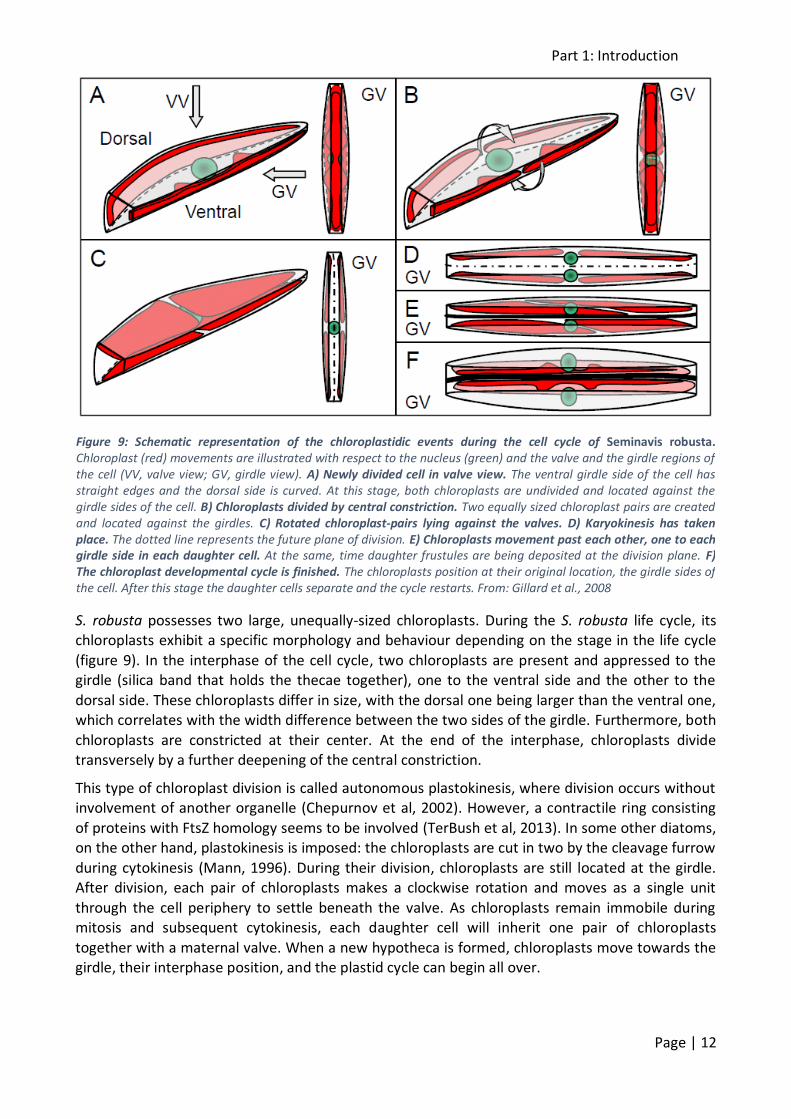
S. robusta possesses two large, unequally-sized chloroplasts. During the S. robusta life cycle, its chloroplasts exhibit a specific morphology and behaviour depending on the stage in the life cycle
(figure 9). In the interphase of the cell cycle, two chloroplasts are present and appressed to the girdle (silica band that holds the thecae together), one to the ventral side and the other to the
dorsal side. These chloroplasts differ in size, with the dorsal one being larger than the ventral one, which correlates with the width difference between the two sides of the girdle. Furthermore, both
chloroplasts are constricted at their center. At the end of the interphase, chloroplasts divide transversely by a further deepening of the central constriction.
This type of chloroplast division is called autonomous plastokinesis, where division occurs without involvement of another organelle (Chepurnov et al, 2002). However, a contractile ring consisting
of proteins with FtsZ homology seems to be involved (TerBush et al, 2013). In some other diatoms, on the other hand, plastokinesis is imposed: the chloroplasts are cut in two by the cleavage furrow
during cytokinesis (Mann, 1996). During their division, chloroplasts are still located at the girdle. After division, each pair of chloroplasts makes a clockwise rotation and moves as a single unit
through the cell periphery to settle beneath the valve. As chloroplasts remain immobile during mitosis and subsequent cytokinesis, each daughter cell will inherit one pair of chloroplasts
together with a maternal valve. When a new hypotheca is formed, chloroplasts move towards the girdle, their interphase position, and the plastid cycle can begin all over.
Figure 9: Schematic representation of the chloroplastidic events during the cell cycle of Seminavis robusta. Chloroplast (red) movements are illustrated with respect to the nucleus (green) and the valve and the girdle regions of the cell (VV, valve view; GV, girdle view). A) Newly divided cell in valve view. The ventral girdle side of the cell has straight edges and the dorsal side is curved. At this stage, both chloroplasts are undivided and located against the girdle sides of the cell. B) Chloroplasts divided by central constriction. Two equally sized chloroplast pairs are created and located against the girdles. C) Rotated chloroplast-pairs lying against the valves. D) Karyokinesis has taken place. The dotted line represents the future plane of division. E) Chloroplasts movement past each other, one to each girdle side in each daughter cell. At the same, time daughter frustules are being deposited at the division plane. F) The chloroplast developmental cycle is finished. The chloroplasts position at their original location, the girdle sides of the cell. After this stage the daughter cells separate and the cycle restarts. From: Gillard et al., 2008
Part 1: Introduction
Page | 13
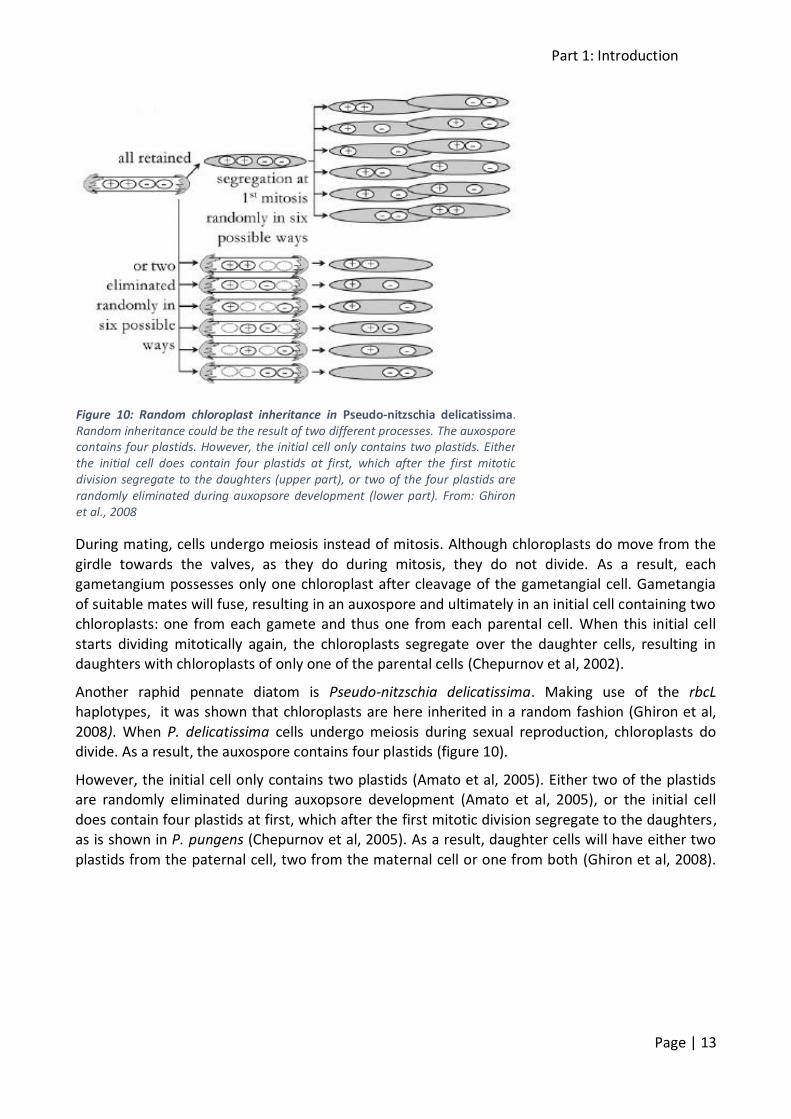
During mating, cells undergo meiosis instead of mitosis. Although chloroplasts do move from the
girdle towards the valves, as they do during mitosis, they do not divide. As a result, each gametangium possesses only one chloroplast after cleavage of the gametangial cell. Gametangia
of suitable mates will fuse, resulting in an auxospore and ultimately in an initial cell containing two chloroplasts: one from each gamete and thus one from each parental cell. When this initial cell
starts dividing mitotically again, the chloroplasts segregate over the daughter cells, resulting in daughters with chloroplasts of only one of the parental cells (Chepurnov et al, 2002).
Another raphid pennate diatom is Pseudo-nitzschia delicatissima. Making use of the rbcL haplotypes, it was shown that chloroplasts are here inherited in a random fashion (Ghiron et al,
2008). When P. delicatissima cells undergo meiosis during sexual reproduction, chloroplasts do divide. As a result, the auxospore contains four plastids (figure 10).
However, the initial cell only contains two plastids (Amato et al, 2005). Either two of the plastids are randomly eliminated during auxopsore development (Amato et al, 2005), or the initial cell
does contain four plastids at first, which after the first mitotic division segregate to the daughters, as is shown in P. pungens (Chepurnov et al, 2005). As a result, daughter cells will have either two
plastids from the paternal cell, two from the maternal cell or one from both (Ghiron et al, 2008).
Figure 10: Random chloroplast inheritance in Pseudo-nitzschia delicatissima. Random inheritance could be the result of two different processes. The auxospore contains four plastids. However, the initial cell only contains two plastids. Either the initial cell does contain four plastids at first, which after the first mitotic division segregate to the daughters (upper part), or two of the four plastids are randomly eliminated during auxopsore development (lower part). From: Ghiron et al., 2008
Part 2: Aims of Research Project
Page | 14
Part 2: Aims of Research project Seminavis robusta can be divided in three mating groups, based on the sequence of the chloroplast-encoded rbcL gene. Mating groups 1 and 2 only differ in 2 nucleotides (addendum,
supplementary figure I). The difference between mating groups 1 and 2 with mating group 3 are 5 nucleotides. At present, Sanger sequencing and subsequent phylogenetic analysis of rcbL is
performed to assign strains to their respective mating groups. DGGE (Denaturing Gradient Gel Electrophoresis) makes it possible to separate nucleic acids based on differences in sequence and
is often used to study microbial communities. This technique presents itself as a cheaper alternative to Sanger sequencing. One of the aims of this thesis is to develop DGGE primers so
DGGE of the marker gene rbcL can be used to assign strains to their respective mating group.
The main focus of this thesis is the characterisation of an F1 generation of an S. robusta mapping population. This population was generated by crossing an MG1+ with an MG2- strain. The progeny
of this cross is a (hybrid) F1 generation, whose fitness will be compared to non-hybrid progeny. Therefore, growth curves will be constructed and the average growth rates will be compared with
those of the parental strains. Furthermore, the sexual compatibility of the F1 progeny with both MG1 and MG2 strains will be tested in strictly standardised laboratory crosses. The efficiency of
the cross with the F1 progeny will be compared to the efficiency of crossing the parental strains with the same strains. Compatibility of the F1 progeny with the parental (non-hybrid) strains will
be evaluated by backcrossing. This will also allow isolation of the F2 generation of the mapping population.
Lastly, this thesis aims to evaluate the chloroplast inheritance in Seminavis robusta. rbcL sequence
information of more than 100 natural S. robusta strains was used to construct a phylogenetic tree (figure 4). Most strains could be placed in one of the three clades or mating groups. However,
some strains showed ambiguous nucleotides at the distinctive positions (addendum, supplementary figure I). Because these strains are heterozygous for rbcL, they are thought to have
chloroplasts of both parents. However, Chepurnov et al. (2002) state that only the initial cells of S. robusta possess both parental chloroplasts. After the first mitotic division, these chloroplasts
segregate over the daughter cells. Our observations do not match this theory and we would like to further investigate the chloroplast inheritance. Therefore, the rbcL gene of 46 strains of our
mapping population and their parents will be amplified and sequenced using Sanger sequencing. Then, the presence of ambiguous bases at the distinctive sites will be assessed. Furthermore,
microscopic monitoring of chloroplast behaviour during sexual reproduction will allow us to test the theory as described by Chepurnov et al. (2002).
Part 3: Results
Page | 15
Part 3: Results DGGE Primer design
An F1 mapping population was generated by crossing Seminavis robusta D6 (MG1+) and S. robusta
KOM1-8 (MG2-). Thus, the F1 strains can belong to either MG1 or MG2. Via DGGE, it should be possible to distinguish both mating groups, as their rbcL sequences differ at only two positions.
The fragment length for DGGE is limited to 500 bp, so the full rbcL sequence (±1200 bp) could not be used. Therefore, specific primers were designed to amplify the region with the two varying
nucleotides. These were only 40 bp apart (addendum, supplementary figure I). Based on an rbcL alignment in MEGA7, specific primers were designed. As reverse primer, the 15R primer (Jones et
al, 2005) could be used. Three different forward primers were designed: fw1 (5’-CATTACTGCGGCTACTATGG-3’), fw2 (5’-ACTGCGGCTACTATGGAAG-3’) and fw3 (5’-
CATTGTAGAACGTGAGCGTTT-3’). These primers all bind to a unique DNA region, do not self-anneal or form primer-dimers. The combination of fw1 and fw2 with 15R should result in a 250 bp rbcL
fragment, the combination of fw3 with 15R in a 500 bp rbcL fragment.
Nested PCR
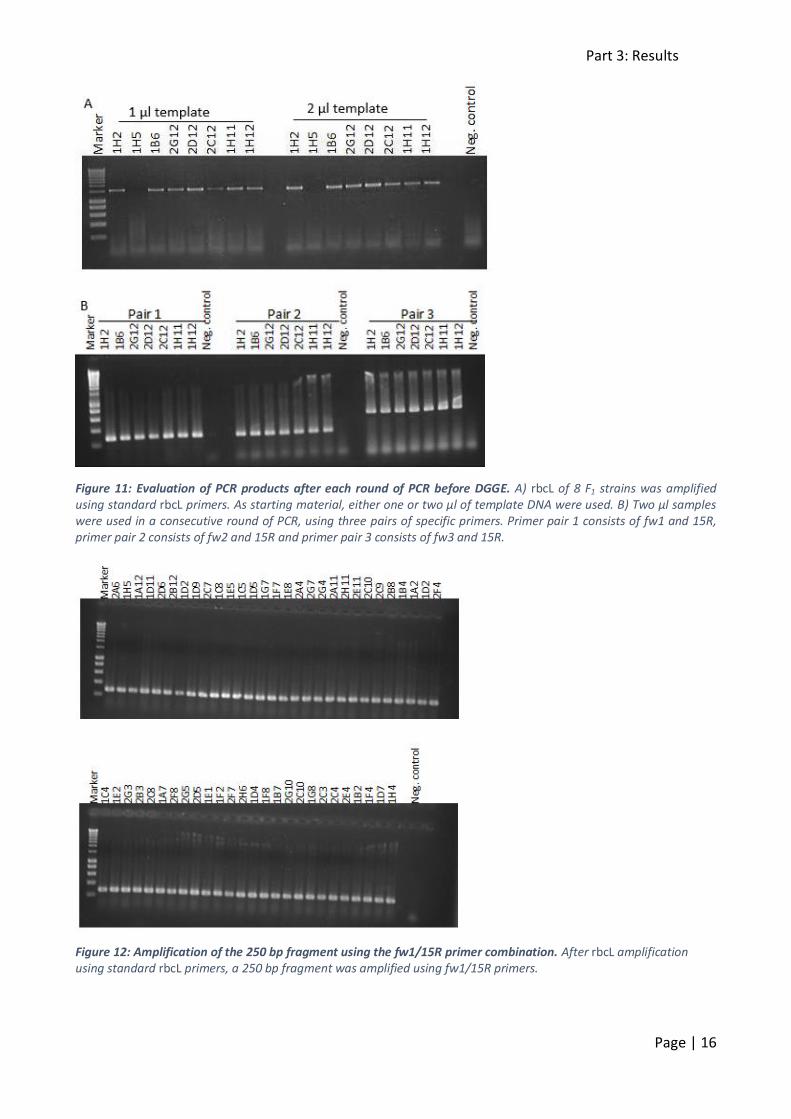
The 250 and 500 bp rbcL fragments were amplified in two consecutive rounds of PCR. In the first round, full-length rbcL was amplified from a crude DNA extract (figure 11A). Either one or two µl
of template DNA was used as starting material. In a nested PCR, only 20 cycles of denaturation, annealing and elongation are performed, to avoid too much starting material in the second round
of PCR. After 20 cycles however, there is not enough amplification to visualise rbcL on gel. Thus a parallel PCR reaction was performed, so rbcL amplification could be checked through a gel
electrophoresis. The full rbcL sequence was around 1200 bp long and failed to amplify in only one strain (figure 11A). Next, this first PCR product was used as the starting material in a second round
of PCR with the fw1/fw2/fw3 primers in combination with the 15R primer. The samples with 2 µl template DNA underwent this second PCR. Three primer pairs were tested: fw1/15R (primer pair
1), fw2/15R (primer pair 2) and fw3/15R (primer pair 3). When visualising the PCR products on gel, the expected fragments were observed (figure 11B). For DGGE, primer pair 1 (fw1/15R) was used
to amplify the 250 bp fragment (figure 12).
DGGE
Before DGGE could be performed on all samples of the mapping population, the parameters should be determined. First, two broad-range gradients of denaturing reagents (formamide and
urea) were used: 20%-80% and 30%-60%. Based on these results (addendum, supplementary figure II), two narrow-range gradients were tested: 30%-45% and 35%-50%. These were still too
broad (addendum, supplementary figure II), so two new gradients were tested that were even more narrow: 40%-45% and 40%-50%. Because these could still not distinguish the different rbcL
haplotypes, the gradient was even more narrowed from 43% to 45% and from 44% to 46% (addendum, supplementary figure III). These gradients could still not separate the different
fragments.
Part 3: Results
Page | 16
Figure 11: Evaluation of PCR products after each round of PCR before DGGE. A) rbcL of 8 F1 strains was amplified using standard rbcL primers. As starting material, either one or two µl of template DNA were used. B) Two µl samples were used in a consecutive round of PCR, using three pairs of specific primers. Primer pair 1 consists of fw1 and 15R, primer pair 2 consists of fw2 and 15R and primer pair 3 consists of fw3 and 15R.
Figure 12: Amplification of the 250 bp fragment using the fw1/15R primer combination. After rbcL amplification using standard rbcL primers, a 250 bp fragment was amplified using fw1/15R primers.
Part 3: Results
Page | 17
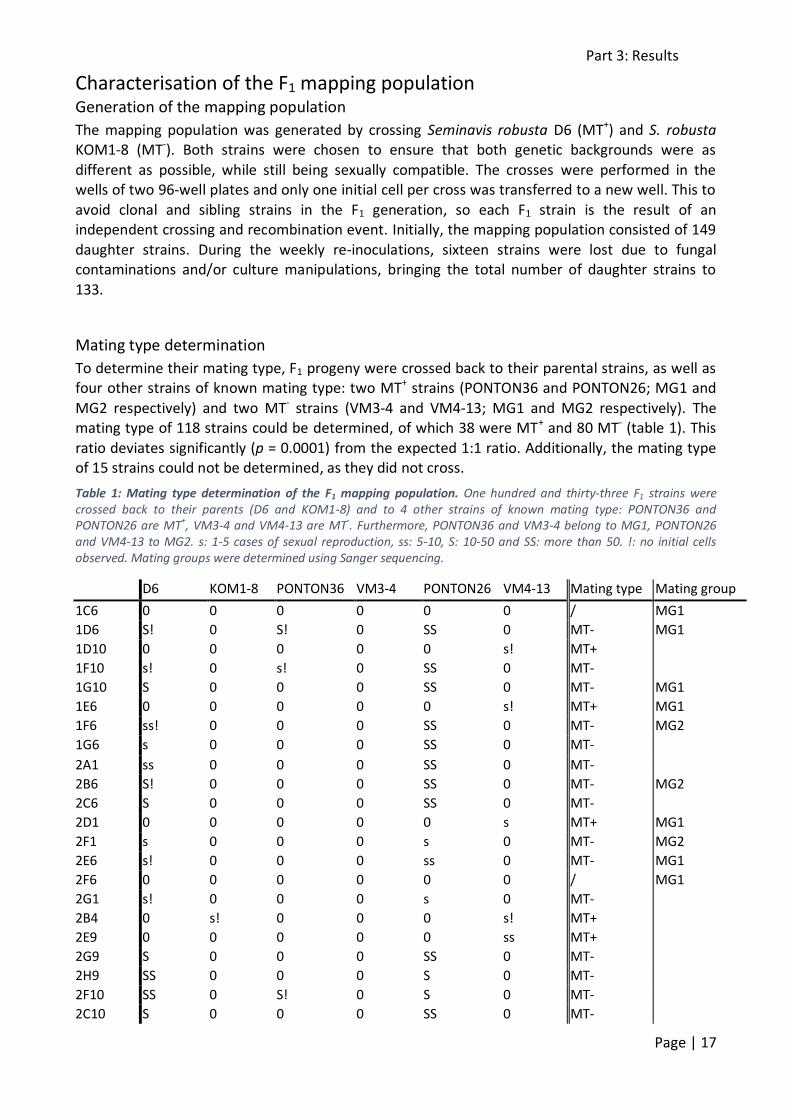
Characterisation of the F1 mapping population Generation of the mapping population
The mapping population was generated by crossing Seminavis robusta D6 (MT+) and S. robusta KOM1-8 (MT-). Both strains were chosen to ensure that both genetic backgrounds were as
different as possible, while still being sexually compatible. The crosses were performed in the wells of two 96-well plates and only one initial cell per cross was transferred to a new well. This to
avoid clonal and sibling strains in the F1 generation, so each F1 strain is the result of an independent crossing and recombination event. Initially, the mapping population consisted of 149
daughter strains. During the weekly re-inoculations, sixteen strains were lost due to fungal contaminations and/or culture manipulations, bringing the total number of daughter strains to
133.
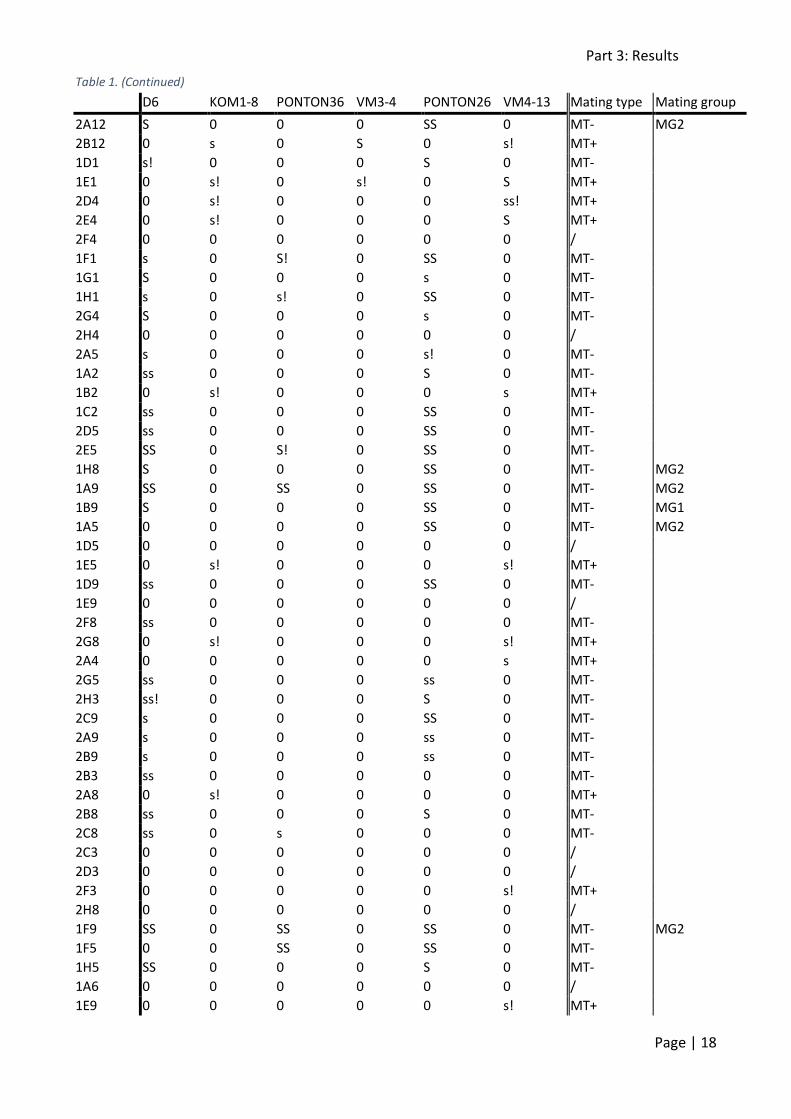
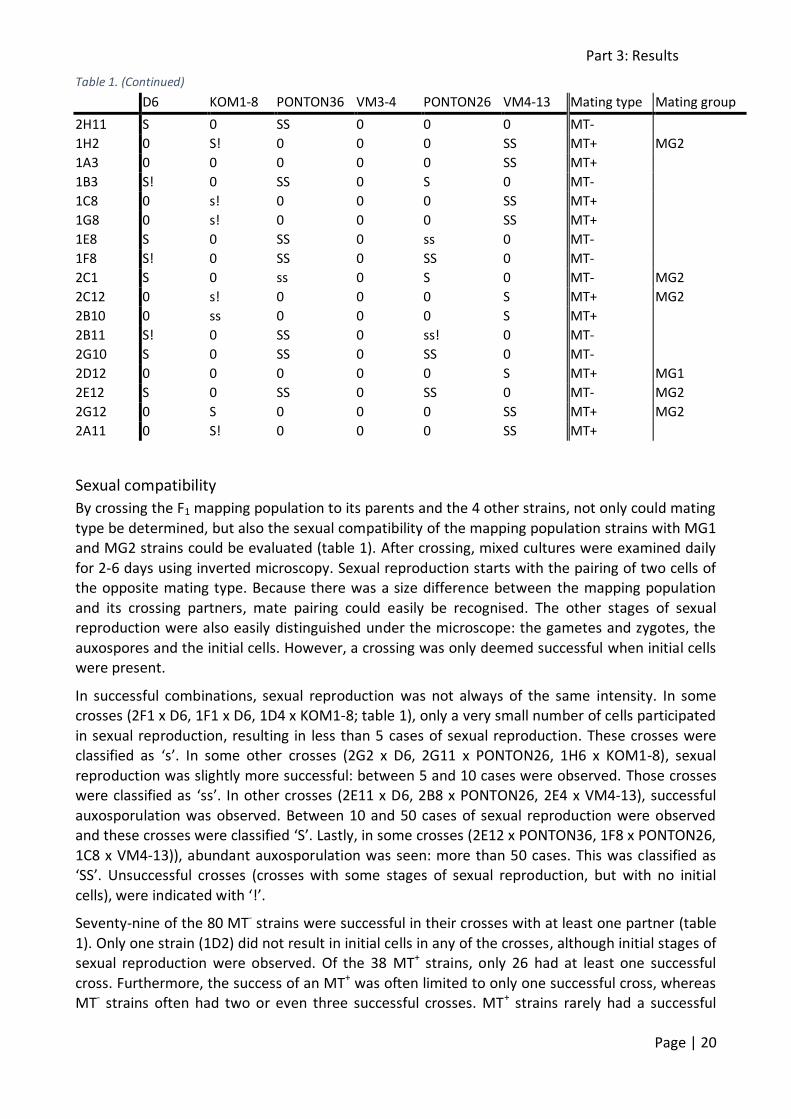
Mating type determination
To determine their mating type, F1 progeny were crossed back to their parental strains, as well as four other strains of known mating type: two MT+ strains (PONTON36 and PONTON26; MG1 and
MG2 respectively) and two MT- strains (VM3-4 and VM4-13; MG1 and MG2 respectively). The mating type of 118 strains could be determined, of which 38 were MT+ and 80 MT- (table 1). This
ratio deviates significantly (p = 0.0001) from the expected 1:1 ratio. Additionally, the mating type of 15 strains could not be determined, as they did not cross.
Table 1: Mating type determination of the F1 mapping population. One hundred and thirty-three F1 strains were crossed back to their parents (D6 and KOM1-8) and to 4 other strains of known mating type: PONTON36 and PONTON26 are MT
+, VM3-4 and VM4-13 are MT
-. Furthermore, PONTON36 and VM3-4 belong to MG1, PONTON26
and VM4-13 to MG2. s: 1-5 cases of sexual reproduction, ss: 5-10, S: 10-50 and SS: more than 50. !: no initial cells observed. Mating groups were determined using Sanger sequencing.
D6 KOM1-8 PONTON36 VM3-4 PONTON26 VM4-13 Mating type Mating group
1C6 0 0 0 0 0 0 / MG1
1D6 S! 0 S! 0 SS 0 MT- MG1
1D10 0 0 0 0 0 s! MT+
1F10 s! 0 s! 0 SS 0 MT-
1G10 S 0 0 0 SS 0 MT- MG1
1E6 0 0 0 0 0 s! MT+ MG1
1F6 ss! 0 0 0 SS 0 MT- MG2
1G6 s 0 0 0 SS 0 MT-
2A1 ss 0 0 0 SS 0 MT-
2B6 S! 0 0 0 SS 0 MT- MG2
2C6 S 0 0 0 SS 0 MT-
2D1 0 0 0 0 0 s MT+ MG1
2F1 s 0 0 0 s 0 MT- MG2
2E6 s! 0 0 0 ss 0 MT- MG1
2F6 0 0 0 0 0 0 / MG1
2G1 s! 0 0 0 s 0 MT-
2B4 0 s! 0 0 0 s! MT+
2E9 0 0 0 0 0 ss MT+
2G9 S 0 0 0 SS 0 MT-
2H9 SS 0 0 0 S 0 MT-
2F10 SS 0 S! 0 S 0 MT-
2C10 S 0 0 0 SS 0 MT-
Part 3: Results
Page | 18
Table 1. (Continued)
D6 KOM1-8 PONTON36 VM3-4 PONTON26 VM4-13 Mating type Mating group
2A12 S 0 0 0 SS 0 MT- MG2
2B12 0 s 0 S 0 s! MT+
1D1 s! 0 0 0 S 0 MT-
1E1 0 s! 0 s! 0 S MT+
2D4 0 s! 0 0 0 ss! MT+
2E4 0 s! 0 0 0 S MT+
2F4 0 0 0 0 0 0 /
1F1 s 0 S! 0 SS 0 MT-
1G1 S 0 0 0 s 0 MT-
1H1 s 0 s! 0 SS 0 MT-
2G4 S 0 0 0 s 0 MT-
2H4 0 0 0 0 0 0 /
2A5 s 0 0 0 s! 0 MT-
1A2 ss 0 0 0 S 0 MT-
1B2 0 s! 0 0 0 s MT+
1C2 ss 0 0 0 SS 0 MT-
2D5 ss 0 0 0 SS 0 MT-
2E5 SS 0 S! 0 SS 0 MT-
1H8 S 0 0 0 SS 0 MT- MG2
1A9 SS 0 SS 0 SS 0 MT- MG2
1B9 S 0 0 0 SS 0 MT- MG1
1A5 0 0 0 0 SS 0 MT- MG2
1D5 0 0 0 0 0 0 /
1E5 0 s! 0 0 0 s! MT+
1D9 ss 0 0 0 SS 0 MT-
1E9 0 0 0 0 0 0 /
2F8 ss 0 0 0 0 0 MT-
2G8 0 s! 0 0 0 s! MT+
2A4 0 0 0 0 0 s MT+
2G5 ss 0 0 0 ss 0 MT-
2H3 ss! 0 0 0 S 0 MT-
2C9 s 0 0 0 SS 0 MT-
2A9 s 0 0 0 ss 0 MT-
2B9 s 0 0 0 ss 0 MT-
2B3 ss 0 0 0 0 0 MT-
2A8 0 s! 0 0 0 0 MT+
2B8 ss 0 0 0 S 0 MT-
2C8 ss 0 s 0 0 0 MT-
2C3 0 0 0 0 0 0 /
2D3 0 0 0 0 0 0 /
2F3 0 0 0 0 0 s! MT+
2H8 0 0 0 0 0 0 /
1F9 SS 0 SS 0 SS 0 MT- MG2
1F5 0 0 SS 0 SS 0 MT-
1H5 SS 0 0 0 S 0 MT-
1A6 0 0 0 0 0 0 /
1E9 0 0 0 0 0 s! MT+

Part 3: Results
Page | 19
Table 1. (Continued)
D6 KOM1-8 PONTON36 VM3-4 PONTON26 VM4-13 Mating type Mating group
1A10 SS 0 0 0 SS 0 MT- MG1
1B10 0 s! 0 0 0 0 MT+
1B6 s 0 s 0 SS 0 MT- MG2
1D2 ss! 0 0 0 s! 0 MT-
1E2 0 0 0 0 0 0 /
1F2 ss! 0 0 0 SS 0 MT-
2F5 0 0 0 0 0 0 /
2G5 0 0 0 0 0 s! MT+
2H5 0 0 0 0 0 0 /
2G2 ss 0 0 0 SS 0 MT-
2H2 0 0 0 0 0 s! MT+
2A2 0 0 s! 0 s 0 MT-
2C6 s 0 s! 0 SS 0 MT-
2H6 ss 0 s! 0 SS 0 MT-
2C7 s 0 s! 0 SS 0 MT-
2C2 s 0 0 0 SS 0 MT-
2F7 s 0 s 0 SS 0 MT-
2G7 s 0 s 0 SS 0 MT-
1C1 0 0 0 0 0 s MT+
1H10 0 s! 0 s 0 SS MT+
1A11 0 s! 0 0 0 SS MT+ MG2
1C11 0 S 0 0 0 SS MT+ MG1
1E5 S 0 SS 0 SS 0 MT-
1F5 S 0 SS 0 S 0 MT- MG2
1A4 S 0 SS 0 SS 0 MT- MG2
1D11 S 0 SS 0 0 0 MT-
1F11 S 0 S 0 SS 0 MT- MG2
1H4 S 0 SS 0 ss! 0 MT-
1H6 0 ss 0 s 0 SS MT+
1A7 S 0 SS 0 0 0 MT-
1B7 0 s! 0 0 0 SS MT+
1D7 s! 0 S 0 0 0 MT-
1F7 S 0 SS 0 0 0 MT-
1G7 s! 0 SS 0 S 0 MT-
1B8 s! 0 S! 0 S 0 MT- MG2
1G11 ss! 0 SS 0 S 0 MT-
1C4 s! 0 SS 0 ss! 0 MT-
1D4 0 s 0 0 0 SS MT+
1E4 0 0 0 0 0 0 / MG1
1B12 ss 0 SS 0 0 0 MT-
1H12 0 0 0 0 0 0 / MG1
1F4 0 0 0 0 0 S MT+
1G4 ss 0 SS 0 S 0 MT- MG1
2F11 0 0 0 0 0 SS MT+ MG2
2G11 S 0 SS 0 ss 0 MT-
2H12 0 0 0 0 0 SS MT+
2E11 S 0 SS 0 0 0 MT-
Part 3: Results
Page | 20
Table 1. (Continued)
D6 KOM1-8 PONTON36 VM3-4 PONTON26 VM4-13 Mating type Mating group
2H11 S 0 SS 0 0 0 MT-
1H2 0 S! 0 0 0 SS MT+ MG2
1A3 0 0 0 0 0 SS MT+
1B3 S! 0 SS 0 S 0 MT-
1C8 0 s! 0 0 0 SS MT+
1G8 0 s! 0 0 0 SS MT+
1E8 S 0 SS 0 ss 0 MT-
1F8 S! 0 SS 0 SS 0 MT-
2C1 S 0 ss 0 S 0 MT- MG2
2C12 0 s! 0 0 0 S MT+ MG2
2B10 0 ss 0 0 0 S MT+
2B11 S! 0 SS 0 ss! 0 MT-
2G10 S 0 SS 0 SS 0 MT-
2D12 0 0 0 0 0 S MT+ MG1
2E12 S 0 SS 0 SS 0 MT- MG2
2G12 0 S 0 0 0 SS MT+ MG2
2A11 0 S! 0 0 0 SS MT+
Sexual compatibility
By crossing the F1 mapping population to its parents and the 4 other strains, not only could mating
type be determined, but also the sexual compatibility of the mapping population strains with MG1 and MG2 strains could be evaluated (table 1). After crossing, mixed cultures were examined daily
for 2-6 days using inverted microscopy. Sexual reproduction starts with the pairing of two cells of the opposite mating type. Because there was a size difference between the mapping population
and its crossing partners, mate pairing could easily be recognised. The other stages of sexual reproduction were also easily distinguished under the microscope: the gametes and zygotes, the
auxospores and the initial cells. However, a crossing was only deemed successful when initial cells were present.
In successful combinations, sexual reproduction was not always of the same intensity. In some crosses (2F1 x D6, 1F1 x D6, 1D4 x KOM1-8; table 1), only a very small number of cells participated
in sexual reproduction, resulting in less than 5 cases of sexual reproduction. These crosses were classified as ‘s’. In some other crosses (2G2 x D6, 2G11 x PONTON26, 1H6 x KOM1-8), sexual
reproduction was slightly more successful: between 5 and 10 cases were observed. Those crosses were classified as ‘ss’. In other crosses (2E11 x D6, 2B8 x PONTON26, 2E4 x VM4-13), successful
auxosporulation was observed. Between 10 and 50 cases of sexual reproduction were observed and these crosses were classified ‘S’. Lastly, in some crosses (2E12 x PONTON36, 1F8 x PONTON26,
1C8 x VM4-13)), abundant auxosporulation was seen: more than 50 cases. This was classified as ‘SS’. Unsuccessful crosses (crosses with some stages of sexual reproduction, but with no initial
cells), were indicated with ‘!’.
Seventy-nine of the 80 MT- strains were successful in their crosses with at least one partner (table
1). Only one strain (1D2) did not result in initial cells in any of the crosses, although initial stages of sexual reproduction were observed. Of the 38 MT+ strains, only 26 had at least one successful
cross. Furthermore, the success of an MT+ was often limited to only one successful cross, whereas MT- strains often had two or even three successful crosses. MT+ strains rarely had a successful
Part 3: Results
Page | 21
backcross with their parent (KOM1-8), while backcrossing of MT- strains to D6 was frequently
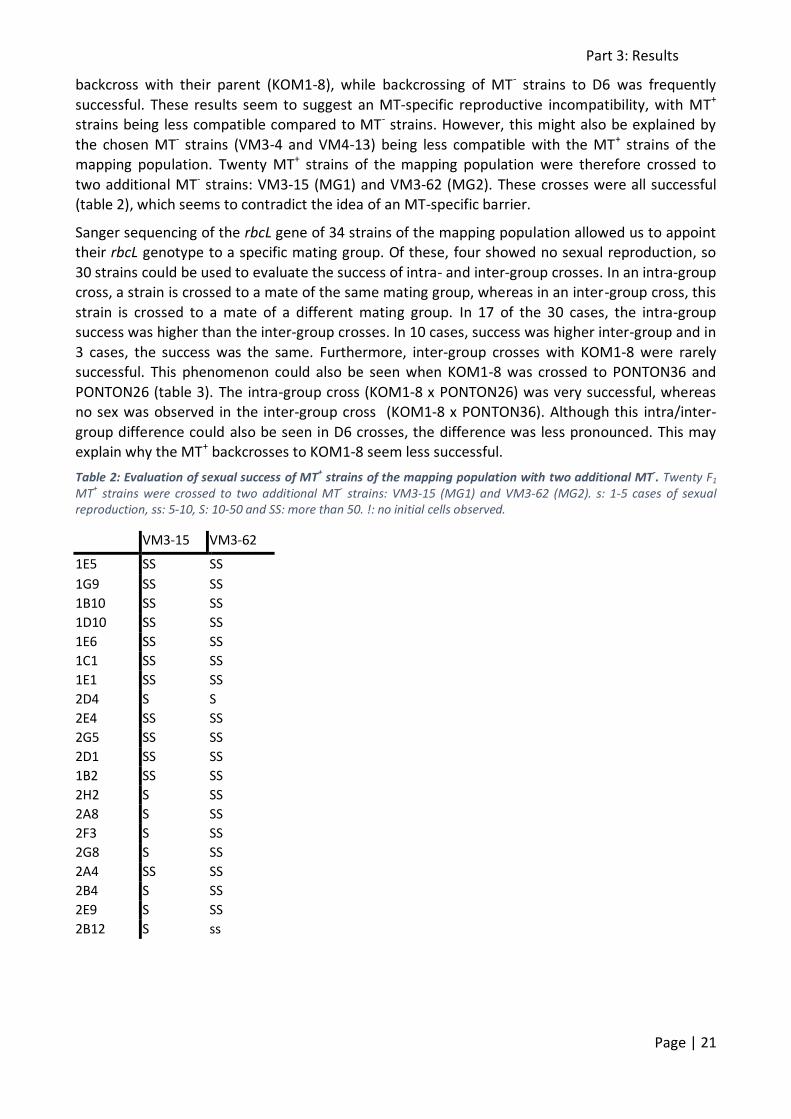
successful. These results seem to suggest an MT-specific reproductive incompatibility, with MT+ strains being less compatible compared to MT- strains. However, this might also be explained by
the chosen MT- strains (VM3-4 and VM4-13) being less compatible with the MT+ strains of the mapping population. Twenty MT+ strains of the mapping population were therefore crossed to
two additional MT- strains: VM3-15 (MG1) and VM3-62 (MG2). These crosses were all successful (table 2), which seems to contradict the idea of an MT-specific barrier.
Sanger sequencing of the rbcL gene of 34 strains of the mapping population allowed us to appoint their rbcL genotype to a specific mating group. Of these, four showed no sexual reproduction, so
30 strains could be used to evaluate the success of intra- and inter-group crosses. In an intra-group cross, a strain is crossed to a mate of the same mating group, whereas in an inter-group cross, this
strain is crossed to a mate of a different mating group. In 17 of the 30 cases, the intra-group success was higher than the inter-group crosses. In 10 cases, success was higher inter-group and in
3 cases, the success was the same. Furthermore, inter-group crosses with KOM1-8 were rarely successful. This phenomenon could also be seen when KOM1-8 was crossed to PONTON36 and
PONTON26 (table 3). The intra-group cross (KOM1-8 x PONTON26) was very successful, whereas no sex was observed in the inter-group cross (KOM1-8 x PONTON36). Although this intra/inter-
group difference could also be seen in D6 crosses, the difference was less pronounced. This may explain why the MT+ backcrosses to KOM1-8 seem less successful.
Table 2: Evaluation of sexual success of MT+ strains of the mapping population with two additional MT-. Twenty F1 MT+ strains were crossed to two additional MT- strains: VM3-15 (MG1) and VM3-62 (MG2). s: 1-5 cases of sexual reproduction, ss: 5-10, S: 10-50 and SS: more than 50. !: no initial cells observed.
VM3-15 VM3-62
1E5 SS SS
1G9 SS SS
1B10 SS SS
1D10 SS SS
1E6 SS SS
1C1 SS SS
1E1 SS SS
2D4 S S
2E4 SS SS
2G5 SS SS
2D1 SS SS
1B2 SS SS
2H2 S SS
2A8 S SS
2F3 S SS
2G8 S SS
2A4 SS SS
2B4 S SS
2E9 S SS
2B12 S ss
Part 3: Results
Page | 22
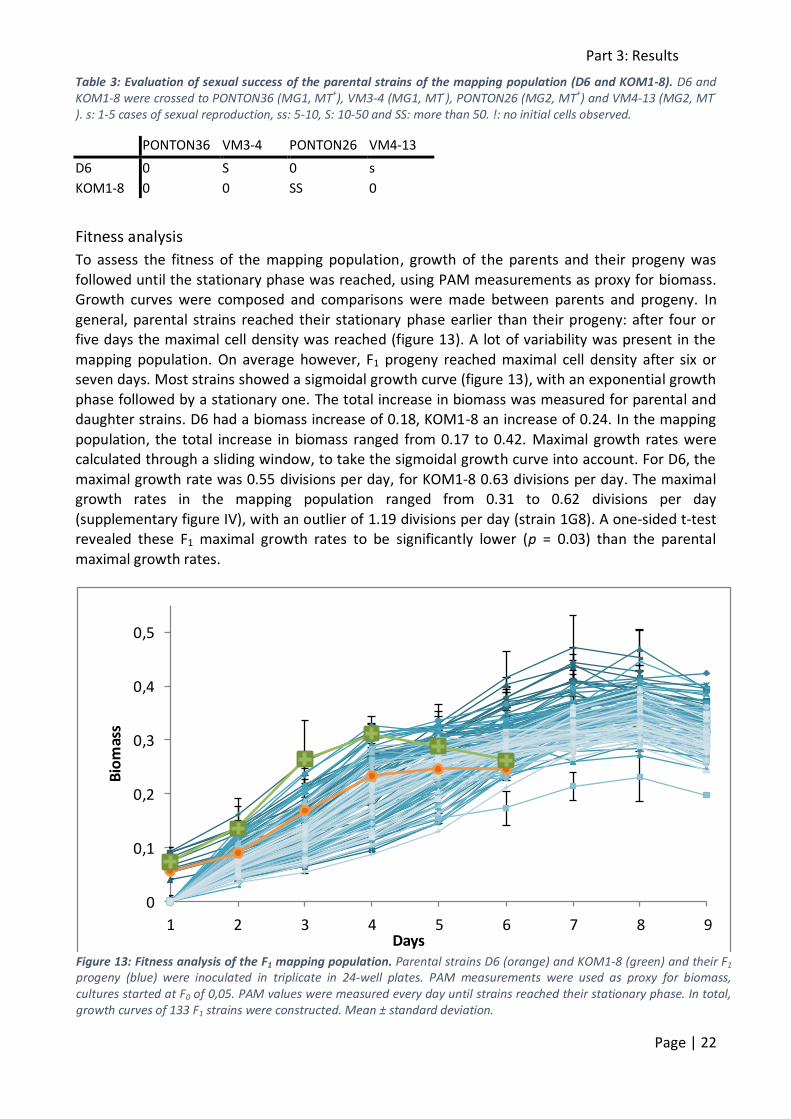
Table 3: Evaluation of sexual success of the parental strains of the mapping population (D6 and KOM1-8). D6 and KOM1-8 were crossed to PONTON36 (MG1, MT
+), VM3-4 (MG1, MT
-), PONTON26 (MG2, MT
+) and VM4-13 (MG2, MT
-
). s: 1-5 cases of sexual reproduction, ss: 5-10, S: 10-50 and SS: more than 50. !: no initial cells observed.
PONTON36 VM3-4 PONTON26 VM4-13
D6 0 S 0 s
KOM1-8 0 0 SS 0
Fitness analysis
To assess the fitness of the mapping population, growth of the parents and their progeny was
followed until the stationary phase was reached, using PAM measurements as proxy for biomass. Growth curves were composed and comparisons were made between parents and progeny. In
general, parental strains reached their stationary phase earlier than their progeny: after four or five days the maximal cell density was reached (figure 13). A lot of variability was present in the
mapping population. On average however, F1 progeny reached maximal cell density after six or seven days. Most strains showed a sigmoidal growth curve (figure 13), with an exponential growth
phase followed by a stationary one. The total increase in biomass was measured for parental and daughter strains. D6 had a biomass increase of 0.18, KOM1-8 an increase of 0.24. In the mapping
population, the total increase in biomass ranged from 0.17 to 0.42. Maximal growth rates were calculated through a sliding window, to take the sigmoidal growth curve into account. For D6, the
maximal growth rate was 0.55 divisions per day, for KOM1-8 0.63 divisions per day. The maximal growth rates in the mapping population ranged from 0.31 to 0.62 divisions per day
(supplementary figure IV), with an outlier of 1.19 divisions per day (strain 1G8). A one-sided t-test revealed these F1 maximal growth rates to be significantly lower (p = 0.03) than the parental
maximal growth rates.
Figure 13: Fitness analysis of the F1 mapping population. Parental strains D6 (orange) and KOM1-8 (green) and their F1 progeny (blue) were inoculated in triplicate in 24-well plates. PAM measurements were used as proxy for biomass, cultures started at F0 of 0,05. PAM values were measured every day until strains reached their stationary phase. In total, growth curves of 133 F1 strains were constructed. Mean ± standard deviation.
0
0,1
0,2
0,3
0,4
0,5
1 2 3 4 5 6 7 8 9
Bio
mas
s
Days
Part 3: Results
Page | 23
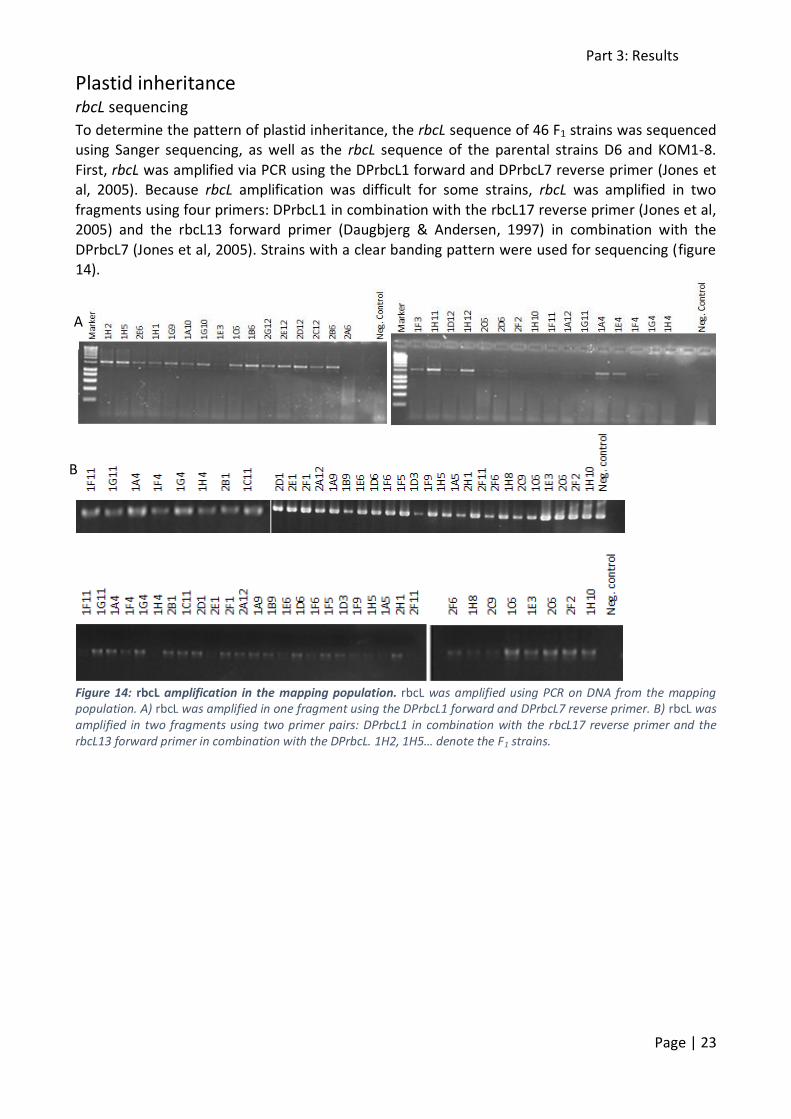
Plastid inheritance rbcL sequencing
To determine the pattern of plastid inheritance, the rbcL sequence of 46 F1 strains was sequenced using Sanger sequencing, as well as the rbcL sequence of the parental strains D6 and KOM1-8.
First, rbcL was amplified via PCR using the DPrbcL1 forward and DPrbcL7 reverse primer (Jones et al, 2005). Because rbcL amplification was difficult for some strains, rbcL was amplified in two
fragments using four primers: DPrbcL1 in combination with the rbcL17 reverse primer (Jones et al, 2005) and the rbcL13 forward primer (Daugbjerg & Andersen, 1997) in combination with the
DPrbcL7 (Jones et al, 2005). Strains with a clear banding pattern were used for sequencing (figure 14).
Figure 14: rbcL amplification in the mapping population. rbcL was amplified using PCR on DNA from the mapping population. A) rbcL was amplified in one fragment using the DPrbcL1 forward and DPrbcL7 reverse primer. B) rbcL was amplified in two fragments using two primer pairs: DPrbcL1 in combination with the rbcL17 reverse primer and the rbcL13 forward primer in combination with the DPrbcL. 1H2, 1H5… denote the F1 strains.
A
B
Part 3: Results
Page | 24
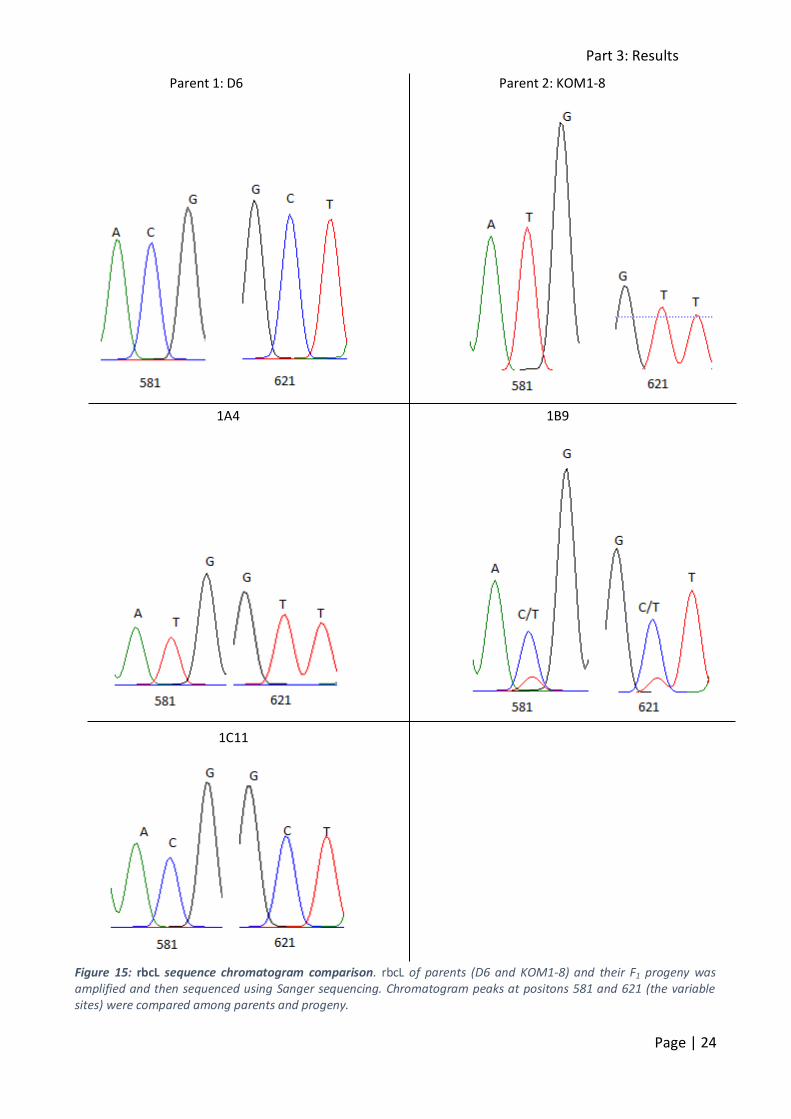
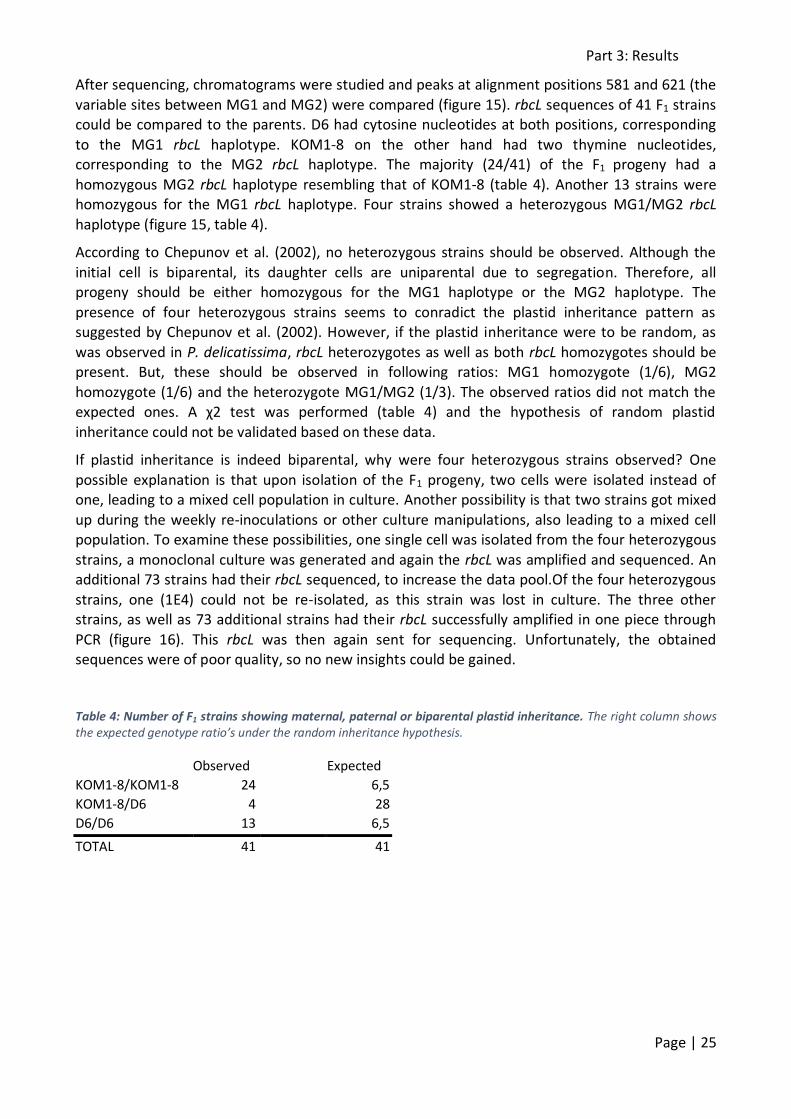
Parent 1: D6 Parent 2: KOM1-8
1A4 1B9
1C11
Figure 15: rbcL sequence chromatogram comparison. rbcL of parents (D6 and KOM1-8) and their F1 progeny was amplified and then sequenced using Sanger sequencing. Chromatogram peaks at positons 581 and 621 (the variable sites) were compared among parents and progeny.
Part 3: Results
Page | 25
After sequencing, chromatograms were studied and peaks at alignment positions 581 and 621 (the
variable sites between MG1 and MG2) were compared (figure 15). rbcL sequences of 41 F1 strains could be compared to the parents. D6 had cytosine nucleotides at both positions, corresponding
to the MG1 rbcL haplotype. KOM1-8 on the other hand had two thymine nucleotides, corresponding to the MG2 rbcL haplotype. The majority (24/41) of the F1 progeny had a
homozygous MG2 rbcL haplotype resembling that of KOM1-8 (table 4). Another 13 strains were homozygous for the MG1 rbcL haplotype. Four strains showed a heterozygous MG1/MG2 rbcL
haplotype (figure 15, table 4).
According to Chepunov et al. (2002), no heterozygous strains should be observed. Although the
initial cell is biparental, its daughter cells are uniparental due to segregation. Therefore, all progeny should be either homozygous for the MG1 haplotype or the MG2 haplotype. The
presence of four heterozygous strains seems to conradict the plastid inheritance pattern as suggested by Chepunov et al. (2002). However, if the plastid inheritance were to be random, as
was observed in P. delicatissima, rbcL heterozygotes as well as both rbcL homozygotes should be present. But, these should be observed in following ratios: MG1 homozygote (1/6), MG2
homozygote (1/6) and the heterozygote MG1/MG2 (1/3). The observed ratios did not match the expected ones. A χ2 test was performed (table 4) and the hypothesis of random plastid
inheritance could not be validated based on these data.
If plastid inheritance is indeed biparental, why were four heterozygous strains observed? One
possible explanation is that upon isolation of the F1 progeny, two cells were isolated instead of one, leading to a mixed cell population in culture. Another possibility is that two strains got mixed
up during the weekly re-inoculations or other culture manipulations, also leading to a mixed cell population. To examine these possibilities, one single cell was isolated from the four heterozygous
strains, a monoclonal culture was generated and again the rbcL was amplified and sequenced. An additional 73 strains had their rbcL sequenced, to increase the data pool.Of the four heterozygous
strains, one (1E4) could not be re-isolated, as this strain was lost in culture. The three other strains, as well as 73 additional strains had their rbcL successfully amplified in one piece through
PCR (figure 16). This rbcL was then again sent for sequencing. Unfortunately, the obtained sequences were of poor quality, so no new insights could be gained.
Table 4: Number of F1 strains showing maternal, paternal or biparental plastid inheritance. The right column shows the expected genotype ratio’s under the random inheritance hypothesis.
Observed Expected
KOM1-8/KOM1-8 24 6,5
KOM1-8/D6 4 28
D6/D6 13 6,5
TOTAL 41 41
B
Part 3: Results
Page | 26
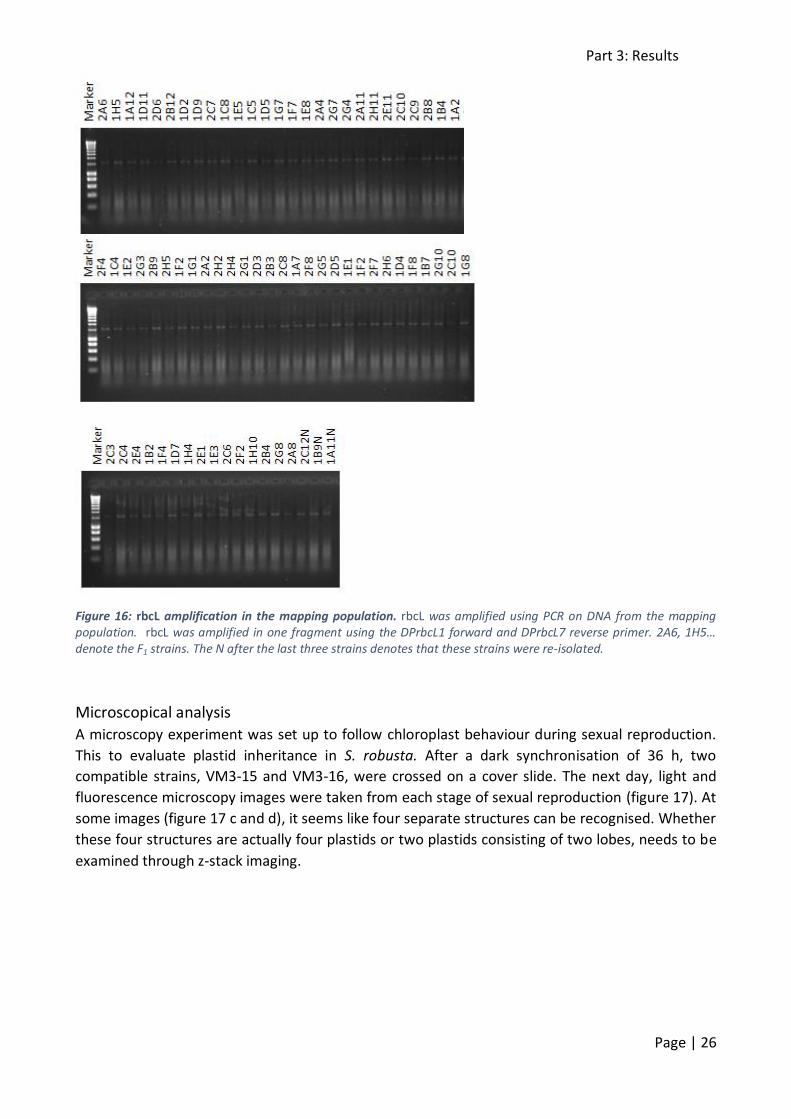
Figure 16: rbcL amplification in the mapping population. rbcL was amplified using PCR on DNA from the mapping population. rbcL was amplified in one fragment using the DPrbcL1 forward and DPrbcL7 reverse primer. 2A6, 1H5… denote the F1 strains. The N after the last three strains denotes that these strains were re-isolated.
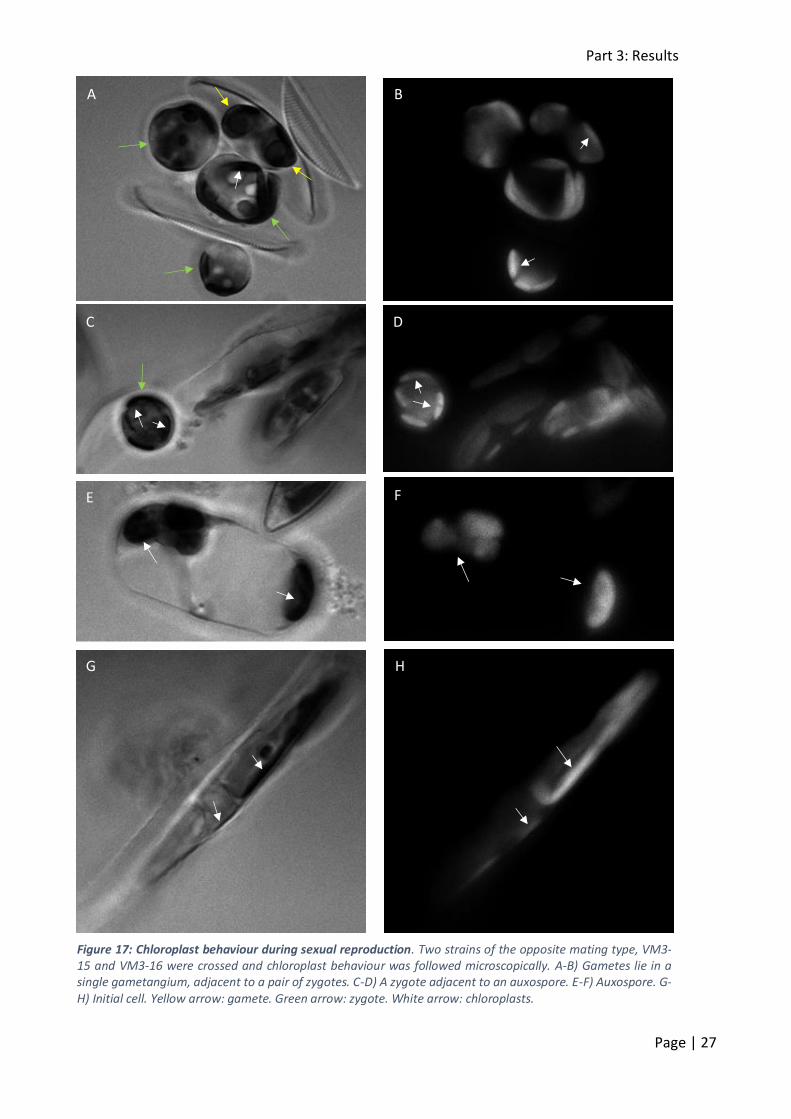
Microscopical analysis
A microscopy experiment was set up to follow chloroplast behaviour during sexual reproduction.
This to evaluate plastid inheritance in S. robusta. After a dark synchronisation of 36 h, two
compatible strains, VM3-15 and VM3-16, were crossed on a cover slide. The next day, light and
fluorescence microscopy images were taken from each stage of sexual reproduction (figure 17). At
some images (figure 17 c and d), it seems like four separate structures can be recognised. Whether
these four structures are actually four plastids or two plastids consisting of two lobes, needs to be
examined through z-stack imaging.
Part 3: Results
Page | 27
Figure 17: Chloroplast behaviour during sexual reproduction. Two strains of the opposite mating type, VM3-15 and VM3-16 were crossed and chloroplast behaviour was followed microscopically. A-B) Gametes lie in a single gametangium, adjacent to a pair of zygotes. C-D) A zygote adjacent to an auxospore. E-F) Auxospore. G-H) Initial cell. Yellow arrow: gamete. Green arrow: zygote. White arrow: chloroplasts.
H
A B
C D
E F
G H
Part 4: Discussion
Page | 28
Part 4: Discussion In this thesis, a hybrid F1 mapping population was generated by crossing an MG1+ (S. robusta D6) with an MG2- (S. robusta KOM1-8). We used this mapping population to study reproductive
behaviour and plastid inheritance and to develop specific primers to allow mating group determination through DGGE.
DGGE DGGE allows the separation of same-length DNA sequences, amplified by PCR, which have at least
one varying nucleotide (Fischer & Lerman, 1983; Muyzer et al, 1993). PCR-DGGE is a fingerprinting methodology that is widely used for diversity analysis in microbial ecology (Muyzer & Smalla,
1998). Based on PCR-DGGE of 16S rRNA, the composition of microbial communities can be determined (Muyzer et al, 1993). Not only is this a successful method to study prokaryotic
communities, also microeukaryotic community dynamics can be studied. For example, the diversity of a microeukaryotic plankton community could be evaluated using PCR-DGGE (Yu et al,
2015). In this study, DGGE was used to assess plankton diversity at different locations using 18S rRNA based primers. Furthermore, using Bacillariophyceae 18S rRNA specific primers, diatom
communities in fresh water could be studied (Morin et al, 2012). In this study, community structure, richness and diversity of natural samples were assessed. This study could not determine
whether DGGE is more reliable at the genus or species level. DGGE was also used for molecular fingerprinting and for diversity assessment of microphytobenthos in the Scheldt Estuary
(Vyverman et al, 2011). Moreover, different rbcL haplotypes could be determined in Pseudo-nitzschia pungens by DGGE (Casteleyn et al, 2009). They demonstrate that two rbcL haplotypes,
varying at four positions, could be separated by DGGE, using a 135 bp PCR fragment containing two of the four varying nucleotides. Based on these haplotypes, the presence of natural P.
pungens hybrids could be demonstrated. Our approach was very similar to that of Casteleyn et al. (2009). We developed specific primers, so a 250 bp PCR fragment of rbcL containing two variable
nucleotides could be amplified. However, the amplified fragments could not be separated by DGGE. A possible explanation could be that our fragment was too long to be separated based on
only two nucleotide differences or that the GC content of the fragment was too high. Designing a new set of primers to amplify a shorter region around the two variable sites could allow
separation of this fragment by DGGE. Therefore, different gradients should be tested to find the separating gradient.
Characterisation of the F1 mapping population It becomes more and more clear that genetic diversity within species is present and that the species number, determined by classical morphology based taxonomy, is greatly underestimated
(Mann, 1999). For more and more species, (pseudo)cryptic diversity is described. For example, two Pseudo-nitzschia species, P. delicatissima and P. pseudodelicatissima, were found to be
(pseudo)cryptic. Based on morphological and molecular data, P. delicatissima could be divided into three phylogenetic groups, whereas P. pseudodelicatissima could be divided into five groups
(Amato et al, 2007). Clades were based on differences in the internal transcribed spacers (ITS) sequences of ribosomal DNA. They did not use an rbcL based phylogeny, as two P. delicatissima
strains with different rbcL genotypes could be successfully mated, generating a viable and fertile F1
mapping population. Mating experiments revealed successful crosses were only observed within
clades and never between clades, indicating reproductive isolation of these cryptic variants.
Part 4: Discussion
Page | 29
Although no sexual reproduction was observed in inter-clade crosses, zygotes were observed in
some crosses. However, these were not able to develop into auxospores and thus initial cells, indicating sexual incompatibility.
Asterionellopsis glacialis was discovered to be another cryptic species (Kaczmarska et al, 2014). Based on morphological and molecular data (ITS), A. glacialis could be divided into five genetically
distinct groups. Furthermore, Pseudo-nitzschia pungens could also be divided into three clades, based on morphological and molecular (ITS) data (Casteleyn et al, 2008). Contrary to what was
found in P. delicatissima and P. pseudodelicatissima, successful inter-clade crosses were observed in P. pungens. Seminavis robusta is found to be a cryptic species too. Based on the sequence of the
chloroplast-encoded rbcL gene, it can be divided in three mating groups. Depending on the rbcL haplotype, S. robusta strains can be appointed to one of the three mating groups. Sexual
reproduction is very successful between two strains of the same mating group (intra-group cross), but the efficiency and success rate of inter-group crosses (two strains of different mating groups)
drop significantly, suggesting the existence of incomplete reproductive barriers (unpublished data). Our data show that in Seminavis robusta, just like in P. delicatissima and P.
pseudodelicatissima, strains with different rbcL haplotypes can successfully mate, generating a viable and fertile F1 mapping population. Mapping populations are useful tools for determining
genetic distances between pairs of loci or genes and for mapping these loci/genes to specific genome locations (Singh & Singh, 2015). For example, a Seminavis robusta mapping population
was used by Vanstechelman et al. (2013) to identify the S. robusta sex determining region.
Our mapping population was used to perform crossing experiments, allowing characterisation of
mating behaviour and sexual compatibility. Our data confirmed the heterothally and the cell-size dependent induction of sexual reproduction, as described by Chepurnov et al. (2002). However,
some cases were aberrant and require further study. First, the mating type of 118 strains could be determined, with 38 strains being MT+ and 80 MT-. This ratio significantly deviates from the
expected 1:1 ratio, but this imbalance was not observed in the mapping population generated by Vanstechelman et al. (2013), where both parental strains originated from the same mating group
(MG1). Whether the observed mating type imbalance in our mapping population is the result of the parental strains belonging to different mating groups, needs to be further investigated. The
MT+ is the heterogametic sex (Vanstechelman et al, 2013), but whether this plays a role in why so few MT+ strains were observed, remains to be seen. Secondly, the mating type of fifteen strains
could not be determined, as they did not show sexual activity when crossed with their parents and with reference strains of both mating types and mating groups, although these strains were far
below the 50 µm SST of S. robusta (Chepurnov et al, 2002). Infertility in combination with low growth rates could indicate a reduced hybrid fitness, however, all fifteen strains had maximal
growth rates between 0.40 and 0.50 divisions per day. Furthermore, some MT+ strains showed no or very weak sexual reproduction with the reference strains, even if they belonged to the same
mating group. When crossed with other MT- strains, they showed vigorous sexual reproduction. Why these strains showed ‘atypical’ mating behaviour and sexual compatibility, is not clear, as
they did not seem to differ in cell size, growth rates and viability from the strains with ‘normal’ mating behaviour.
Further, we assessed the fitness of our mapping population. We followed growth of parental and F1 strains by taking daily PAM measurements as proxy for biomass. Growth curves were
constructed and total biomass increase was determined. However, to compare fitness, total biomass increase and length of exponential phase cannot be used, as these are dependent on cell
size. The parental strains were much smaller than the F1 progeny. Therefore, the parental strains
Part 4: Discussion
Page | 30
have a higher cell number to obtain the same start F0-value of 0.05 (addendum, supplementary
figure V). More cells mean a faster depletion of nutrients and thus a faster transition to the stationary phase. This also explains the lower total increase in biomass for the parents. Thus
growth rates were measured. To avoid this problem, we compared maximal growth rates between parental and progeny strains, which should be independent from cell size. The maximal growth
rate was obtained in the first three days for parents and most F1 progeny cells, indicating a very short lag phase, before cells went into exponential phase (figure 13). Growth rates of the parental
and F1 strains were compared. Maximal growth rates were compared, as the growth of F1 strains slowed down when nearing the stationary phase. A one-sided t-test revealed the F1 maximal
growth rates to be significantly lower than the parental growth rates (p=0.03), which seems to suggest a reduced hybrid fitness. However, we never observed this difference in culture, as
parents and their progeny seemed to grow equally fast. Although growth rates should be independent of cell size, we cannot exclude that cell size is an influencing factor. To be certain, the
experiment should be repeated when the cell size of the mapping population equals those of the parents.
Plastid inheritance Chloroplasts have their own genome due to their endosymbiotic nature and are inherited
independently from the nucleus. In many raphid pennate diatoms, plastid inheritance was determined based on microscopical observations during sexual reproduction studies (Amato et al,
2005; Chepurnov et al, 2002; Poulíčková & Mann, 2006). However, they could not distinguish paternal or maternal plastids. The existence of different rbcL haplotypes enables the tracking of
the parental plastids during sexual reproduction. Using the rbcL haplotype strategy, plastid inheritance could successfully be followed in some alga. Peters et al. (2004) could demonstrate a
biparental plastid inheritance pattern in the brown alga Ectocarpus siliculosus, while Kato et al. (2006) demonstrated biparental inheritance in the brown alga Scytosiphon lomentaria. In the
raphid pennate diatom Pseudo-nitzschia delicatissima, Ghiron et al. (2008) could demonstrate a random plastid inheritance. In this diatom, the chloroplasts divide during mating, resulting in
gametes containing two plastids and an auxospore with four plastids. Either two plastids will be randomly eliminated during auxospore development (Amato et al, 2005), or the four plastids are
randomly segregated over the daughter cells during the first mitotic division of the initiall cell, as described for P. pungens (Chepurnov et al, 2005). Based on their mode of plastid inheritance and
their different rbcL haplotypes, the existence of natural hybrids could be demonstrated in P. pungens. These hybrids could be hetero- and homoplastidial (Casteleyn et al, 2009).
For Seminavis robusta, Chepurnov et al. (2002) describe that the chloroplasts are inherited biparentally. During mating, chloroplasts move from the girdle towards the valves without
dividing. As a result, each gametangium possesses only one chloroplast after cleavage of the gametangial cell. Gametangia of suitable mates will fuse, resulting in an auxospore and ultimately
in an initial cell containing two chloroplasts: one from each gamete and thus one from each parental cell. When this initial cell starts dividing mitotically again, the chloroplasts segregate over
the daughter cells, resulting in daughters with chloroplasts of only one of the parental cells. However, some natural S. robusta strains showed ambiguous nucleotides at the distinctive
positions of the rbcL haplotypes (addendum, supplementary figure I). Because these strains are heterozygous for rbcL, they are thought to have chloroplasts of both parents, which contradicts
what Chepurnov et al. (2002) state.
Part 4: Discussion
Page | 31
To assess plastid inheritance in S. robusta, the rbcL gene of 41 F1 mapping population strains and
their parents was sequenced. This revealed that 24 strains were homozygous for the MG2 haplotype, 13 were homozygous for the MG1 haplotype and four were heterozygous MG1/MG2
(table 4). If plastids were inherited biparentally, no heterozygotes should be observed, as the chloroplasts segregate over the daughter cells. So the presence of four heterozygous strains seems
to conradict the plastid inheritance pattern as suggested by Chepunov et al. (2002). However, if the plastid inheritance were random as in P. delicatissima, the heterozygotes should be present in
a 2/3 ratio, whereas each homozygote should be present in a 1/6 ratio. Based on our results, the random inheritance hypothesis could not be validated. Thus, if plastid inheritance is indeed
biparental, why were four heterozygous strains observed? One possible explanation is that upon isolation of the F1 progeny, two cells were isolated instead of one, leading to a mixed cell
population in culture. Another possibility is that two strains got mixed up during the weekly re-inoculations or other culture manipulations, also leading to a mixed cell population. To examine
these possibilities, one single cell was isolated from the four heterozygous strains, a monoclonal culture was generated and again the rbcL was amplified and sequenced. If these re-isolated strains
are still heterozygous for rbcL, the classical theory for plastid inheritance of S. robusta needs to be re-evaluated. Unfortunately, the obtained sequences were of poor quality, so no new insights
could be gained. A second try to sequence the rbcL of these re-isolated cultures will shed light on the matter.
Furthermore, plastid inheritance was evaluated by following chloroplast behaviour during sexual
reproduction. Two compatible strains, S. robusta VM3-15 and VM3-16, were crossed and light and
fluorescence microscopy images were taken. Chloroplasts are auto-fluorescent, meaning they are
visible under fluorescent light. At some images (figure 17 c and d), it seems like four separate
structures can be recognised. These results could suggest zygotes with four plastids, however,
according to Chepurnov et al. (2002), these are just two plastids consisting of two lobes. Whether
these four structures are actually four plastids or two two-lobed plastids, needs to be examined
through z-stack imaging.
Part 5: Materials and Methods
Page | 32
Part 5: Materials and Methods Generating the F1 mapping population Parental Seminavis robusta strains were obtained from the diatom culture collection of the Belgian Coordinated Collection of Micro-organisms (BCCM/DCG, http://bccm.belspo.be/). An F1 mapping
population, containing 148 individual F1 progeny, was produced from a cross between strains D6 (MT+, DCG 0498) and KOM1-8 (MT-, DCG 0559). Those strains were chosen to ensure both genetic
backgrounds were as different as possible, while still being sexually compatible. Cultures were grown at 18°C under cool white fluorescent lights with a photoperiod of 12h:12h light:dark at
approximately 60 µmol photons m-2 s-1 and were then grown in the dark for 36 h synchronisation (Gillard et al, 2008). Crosses were performed by inoculating aliquots of both cultures in
exponential growth phase in the wells of two 96-well plates (Greiner Bio One, Vilvoorde, Belgium) containing Guillard’s F/2 medium (Guillard, 1975). When initial cells were observed, well content
was transferred to a Petri dish (Greiner Bio One, Vilvoorde, Belgium). Only one initial cell per Petri dish was picked and transferred to a new 96-well plate containing F/2 medium. Separate crosses
were performed to avoid clonal and sibling strains in the F1 generation, so each F1 strain was the result of an independent crossing and recombination event.
Phenotyping: Determination of the F1 progeny mating type F1 cultures were weekly re-inoculated in 24-well culture plates (Greiner Bio One, Vilvoorde, Belgium) by transferring small aliquots of cell suspension into fresh F/2 medium. After 5 months,
cells reached their SST (~50 µm). To determine their mating type, F1 progeny were crossed back to the parental strains, as well as four other strains of known mating type: two MT+ strains
(PONTON36 and PONTON26; MG1 and MG2 respectively) and two MT- strains (VM3-4 and VM4-13; MG1 and MG2 respectively). Aliquots of both cultures in exponential growth phase were
inoculated in the wells of a 48-well plate (Greiner Bio One, Vilvoorde, Belgium) containing F/2 medium. Mixed cultures were examined daily for 2-6 days using a Zeiss Axiovert 135 inverted
microscope (Zeiss, Jena, Germany). A cross was only considered successful when healthy and dividing initial cells were present.
Growth curve analysis Pulse-amplitude modulated (PAM) minimum fluorescence (F0) signals were used as a proxy for
biomass of the cultures. F0-values were obtained using a MAXI Imaging PAM M-series (Walz), equipped with an IMAG-K4 camera and mounted with IMAG-MAX/F filter and connected to
ImagingWin (v2.41a) software. Cultures were dark-adapted 20 min before F0 measurement. The intensity of the light flash was set to 7, the gain to 3 and damping to 2. F1 strains were inoculated
in triplicate in 24-well plates to a start F0 of 0.05. F0-values were measured every day until the stationary phase was reached. Average F0-values per day were measured and plotted in a graph
via Excel (Microsoft Office). The total increase of biomass was determined by subtracting the initial biomass density of the maximal biomass density. Maximal growth rates were determined through
a sliding window. For every three days, maximal growth rate per replicate was calculated using the following formula: 𝑚𝑎𝑥𝑖𝑚𝑎𝑙 𝑔𝑟𝑜𝑤𝑡ℎ 𝑟𝑎𝑡𝑒 = (ln(𝐷2/𝐷1))/(𝑡2 − 𝑡1). Statistical analyses were
done using R version 3.2.2 (www.r-project.org).
Part 5: Materials and Methods
Page | 33
DNA extraction of S. robusta cultures Cultures were grown in 6-well culture plates (Greiner Bio One, Vilvoorde, Belgium) and 2 ml of a
dense culture was harvested by pipetting and transferred to a 2 ml Eppendorf. After centrifugation for 2 min at 12 000g (4K15(Sigma, Germany)), supernatant was discarded. Again 2 ml of detached
cells were transferred to this Eppendorf. After centrifugation (2 min; 12 000g), supernatant was discarded. Eppendorf tubes with cell pellets were frozen at –20°C until DNA extraction was
performed. For DNA extraction, 0.5 g Zirconia Beads diameter 0.1 mm (Merck Eurolab, Darmstadt, Germany), 0.5 ml TE buffer (10 mM Tris/HCl (pH 7.6), 1 mM EDTA (pH 8.0)) and 0.5 ml buffered
phenol (pH 7.0-8.0; Roth, Karlsruhe, Germany) were added to each sample. Samples were first shaken manually and then bead-beaten (3x; 85 s; 30 Hz). The samples were then centrifuged
(Centrifuge 5415R(EPPENDORF, Hamburg, Germany) 4°C; 5 min; 10 000 rpm). The aqueous phase containing the DNA was transferred to a new 2 ml Eppendorf and 0.5 ml PCI
(phenol:chloroform:isoamylalcohol = 25:24:1 v/v; Roth) was added and tubes were shaken. The samples were then centrifuged (4°C; 5 min; 10 000 rpm). Again, the aqueous phase was
transferred to a new 2 ml Eppendorf, 0.5 ml PCI was added and samples were shaken and centrifuged. At last, the aqueous phase was transferred to a 1.5 ml Eppendorf. 50 µl 3 M NaAc (pH
±5), 1 ml 96% ethanol (-20°C) and 2 µl glycogen (-20°C; (Roche, Basel, Switzerland)) were added. Tubes were shaken twice and were incubated over night at -20°C. The DNA samples were then
centrifuged (4°C; 30 min; 13 000 rpm). The liquid phase was removed and 1 ml 70% ethanol was added. Tubes were centrifuged (4°C; 5 min; 13 000 rpm) and ethanol was removed. Tubes were
then short-spinned and the remaining ethanol was removed with a 200 µl pipet. The pellet was air-dried for at least 20 min and 50 µl preheated (55°C) TE buffer (pH 8.0) was added. Samples
were incubated at 55°C for 20 min. DNA concentrations were determined using NanoDrop 2000 (Thermo Scientific, Waltham, MA, USA). Lastly, the DNA of the mapping population was stored at -
20°C.
Nested PCR Seminavis robusta could be divided into 3 mating groups, based on nucleotide differences in the
rbcL gene (addendum, supplementary figure I). MG1 only differed at two positions from MG2: MG1 showed C…C nucleotides at positions 581 and 621, while MG2 had T…T nucleotides at those
positions. Specific rbcL primers were designed to amplify this DNA region, based on rbcL alignments in Molecular Evolutionary Genetics Analysis version 7.0 (MEGA7). Three forward
primers were designed, fw1 (5’-CATTACTGCGGCTACTATGG-3’), fw2 (5’-ACTGCGGCTACTATGGAAG-3’) and fw3 (5’-CATTGTAGAACGTGAGCGTTT-3’). Parameters of these primers were checked using
PCR Primer Stat (bioinformatics.org) As reverse primer, the DPrbcL15 reverse primer could be used (Jones et al, 2005). Next, a nested PCR was performed. During the first PCR, rbcL was amplified
using the DPrbcL1 forward and DPrbcL7 reverse primer (Jones et al, 2005). PCR conditions were as follows: an initial denaturation at 94°C for 7 min, followed by 20 cycles of denaturation at 94°C for
60 s, annealing at 55°C for 60 s and elongation at 72°C for 90 s, with a final elongation step at 72°C for 10 min. PCR reactions were performed in 25 µl solutions containing each 1U/µl AmpliTaq DNA
polymerase (Applied Biosystems, Foster City, CA, USA), 2.5 µl 10x PCR buffer I (15 mM MgCl2; Applied Biosystems, Foster City, CA, USA), 2.5 µl dNTPs and 2.5 µl of each primer. After
purification of the DNA samples using a Qiaquick PCR purification kit (Qiagen, Hilden, Germany), a next round of PCR, using the specifically designed primers (fw1, fw2, fw3 and DPrbcL15R), was
performed. PCR conditions were as follows: an initial denaturation at 94°C for 5 min, followed by 35 cycles of denaturation at 94°C for 60 s, annealing at 55°C for 60 s and elongation at 72°C for 60

Part 5: Materials and Methods
Page | 34
s, with a final elongation step at 72°C for 5 min. PCR reactions were the same as in the first PCR,
save for the used primers. Reactions were performed in a Veriti 96-Well Thermal Cycler (Applied Biosystems, Foster City, CA, USA). The yield of PCR products and primer specificity were analysed
by 1.66% (w/v) agarose gel electrophoresis and ethidium bromide staining in the presence of the SmartLadder DNA marker (Eurogentec, Liege, Belgium). The obtained PCR products were stored at
-20°C until DGGE analysis.
Denaturing gradient gel electrophoresis (DGGE) The DCode™ Universal Mutation Detection System (Bio-Rad, Hercules, CA, USA) was used for the DGGE analysis. A 10-μl aliquot of nested-PCR product per sample was loaded onto an 8% (w/v)
poly-acrylamide (37.5:1 acrylamide/bio-acrylamide) gel containing a linear denaturing gradient of ultimately 43% to 45%, where 100% denaturing acrylamide contained 7 M urea and 40%
formamide. The gel was electrophoresed at 75 V for 16 h at 60°C in 1× TAE buffer (40 mM Tris-acetate (pH 7.4), 20 mM sodium acetate, 1 mM disodium EDTA). After staining with SYBR Gold
solution for 30 minutes, the gel was photographed under UV light using the Gel Doc™XR+ System (Bio-Rad, Hercules, CA, USA).
Sequencing of rbcL rbcL was sequenced from 46 F1 strains and the two parental strains (D6 and KOM1-8). Therefore, rbcL was amplified via PCR as described above in the first step of nested PCR, except 35 cycles
were performed instead of 20. Because rbcL amplification was difficult for some strains, rbcL was amplified in two fragments. Following primers were used: DPrbcL1 was combined with rbcL17
reverse primer (Jones et al, 2005) and the rbcL13 forward primer (Daugbjerg & Andersen, 1997) was combined withDPrbcL7 (Jones et al, 2005). PCR products were sent to the Magrogen Inc.
(South Korea) for commercial sequencing. Sequencing of rbcL was done in two fragments, the four sequencing primers were the same as the PCR primers. The obtained sequences were edited using
BioNumerics version 3.5 (Applied Maths, Kortrijk, Belgium). The sequences were then automatically aligned using MEGA7 and subsequently corrected manually. The sequencing peaks
were compared using BioEdit Sequence Alignment Editor.
Fluorescence microscopy Strain VM3-15 (MG1+) and strain VM3-16 (MG1+) were inoculated at same densities in a 6-well plate and dark-synchronised for 36 h. After dark-synchronisation, both cultures were mixed in a
new 6-well plate containing one coverslip per well. The next day, the coverslip was placed on a microscope glide. Sexual reproduction was observed using a Zeiss Axiophot 2 Universal
microscope (Zeiss, Jena, Germany) equipped with an AxioCam MRm camera (Zeiss, Jena, Germany) and the AxioVision imaging software package.
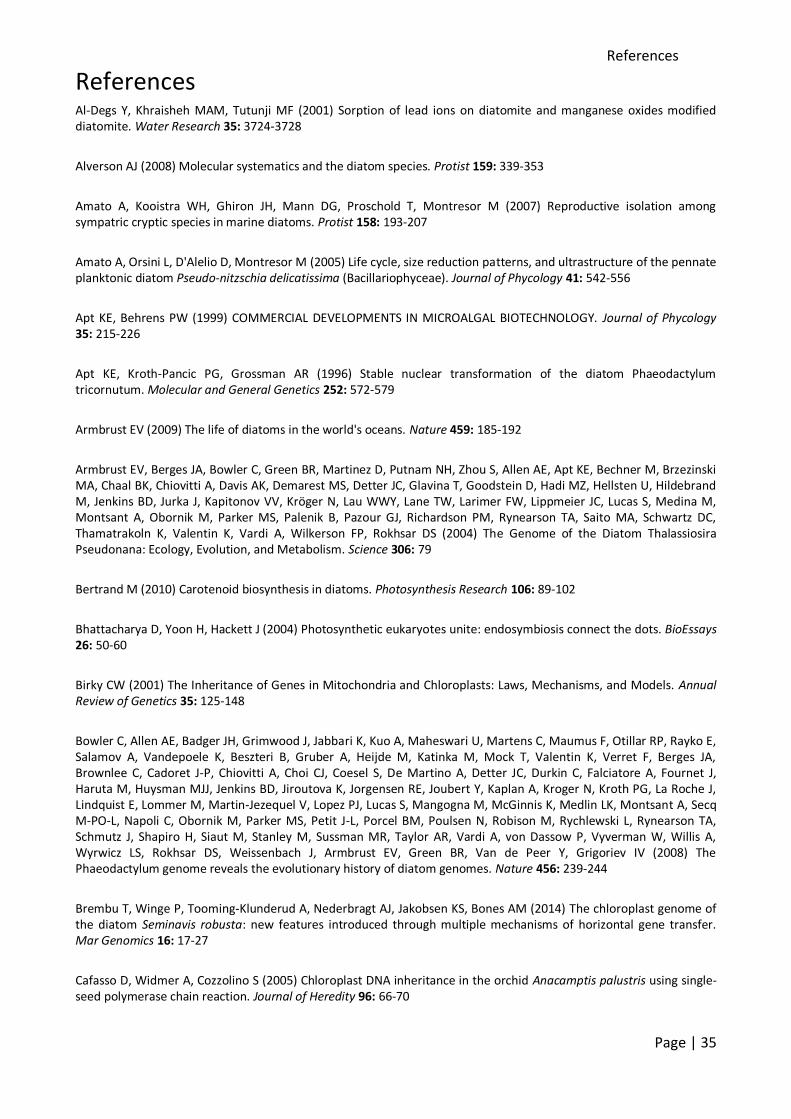
References
Page | 35
References Al-Degs Y, Khraisheh MAM, Tutunji MF (2001) Sorption of lead ions on diatomite and manganese oxides modified diatomite. Water Research 35: 3724-3728
Alverson AJ (2008) Molecular systematics and the diatom species. Protist 159: 339-353
Amato A, Kooistra WH, Ghiron JH, Mann DG, Proschold T, Montresor M (2007) Reproductive isolation among sympatric cryptic species in marine diatoms. Protist 158: 193-207
Amato A, Orsini L, D'Alelio D, Montresor M (2005) Life cycle, size reduction patterns, and ultrastructure of the pennate planktonic diatom Pseudo-nitzschia delicatissima (Bacillariophyceae). Journal of Phycology 41: 542-556
Apt KE, Behrens PW (1999) COMMERCIAL DEVELOPMENTS IN MICROALGAL BIOTECHNOLOGY. Journal of Phycology 35: 215-226
Apt KE, Kroth-Pancic PG, Grossman AR (1996) Stable nuclear transformation of the diatom Phaeodactylum tricornutum. Molecular and General Genetics 252: 572-579
Armbrust EV (2009) The life of diatoms in the world's oceans. Nature 459: 185-192
Armbrust EV, Berges JA, Bowler C, Green BR, Martinez D, Putnam NH, Zhou S, Allen AE, Apt KE, Bechner M, Brzezinski MA, Chaal BK, Chiovitti A, Davis AK, Demarest MS, Detter JC, Glavina T, Goodstein D, Hadi MZ, Hellsten U, Hildebrand M, Jenkins BD, Jurka J, Kapitonov VV, Kröger N, Lau WWY, Lane TW, Larimer FW, Lippmeier JC, Lucas S, Medina M, Montsant A, Obornik M, Parker MS, Palenik B, Pazour GJ, Richardson PM, Rynearson TA, Saito MA, Schwartz DC, Thamatrakoln K, Valentin K, Vardi A, Wilkerson FP, Rokhsar DS (2004) The Genome of the Diatom Thalassiosira Pseudonana: Ecology, Evolution, and Metabolism. Science 306: 79
Bertrand M (2010) Carotenoid biosynthesis in diatoms. Photosynthesis Research 106: 89-102
Bhattacharya D, Yoon H, Hackett J (2004) Photosynthetic eukaryotes unite: endosymbiosis connect the dots. BioEssays 26: 50-60
Birky CW (2001) The Inheritance of Genes in Mitochondria and Chloroplasts: Laws, Mechanisms, and Models. Annual Review of Genetics 35: 125-148
Bowler C, Allen AE, Badger JH, Grimwood J, Jabbari K, Kuo A, Maheswari U, Martens C, Maumus F, Otillar RP, Rayko E, Salamov A, Vandepoele K, Beszteri B, Gruber A, Heijde M, Katinka M, Mock T, Valentin K, Verret F, Berges JA, Brownlee C, Cadoret J-P, Chiovitti A, Choi CJ, Coesel S, De Martino A, Detter JC, Durkin C, Falciatore A, Fournet J, Haruta M, Huysman MJJ, Jenkins BD, Jiroutova K, Jorgensen RE, Joubert Y, Kaplan A, Kroger N, Kroth PG, La Roche J, Lindquist E, Lommer M, Martin-Jezequel V, Lopez PJ, Lucas S, Mangogna M, McGinnis K, Medlin LK, Montsant A, Secq M-PO-L, Napoli C, Obornik M, Parker MS, Petit J-L, Porcel BM, Poulsen N, Robison M, Rychlewski L, Rynearson TA, Schmutz J, Shapiro H, Siaut M, Stanley M, Sussman MR, Taylor AR, Vardi A, von Dassow P, Vyverman W, Willis A, Wyrwicz LS, Rokhsar DS, Weissenbach J, Armbrust EV, Green BR, Van de Peer Y, Grigoriev IV (2008) The Phaeodactylum genome reveals the evolutionary history of diatom genomes. Nature 456: 239-244
Brembu T, Winge P, Tooming-Klunderud A, Nederbragt AJ, Jakobsen KS, Bones AM (2014) The chloroplast genome of the diatom Seminavis robusta: new features introduced through multiple mechanisms of horizontal gene transfer. Mar Genomics 16: 17-27
Cafasso D, Widmer A, Cozzolino S (2005) Chloroplast DNA inheritance in the orchid Anacamptis palustris using single-seed polymerase chain reaction. Journal of Heredity 96: 66-70
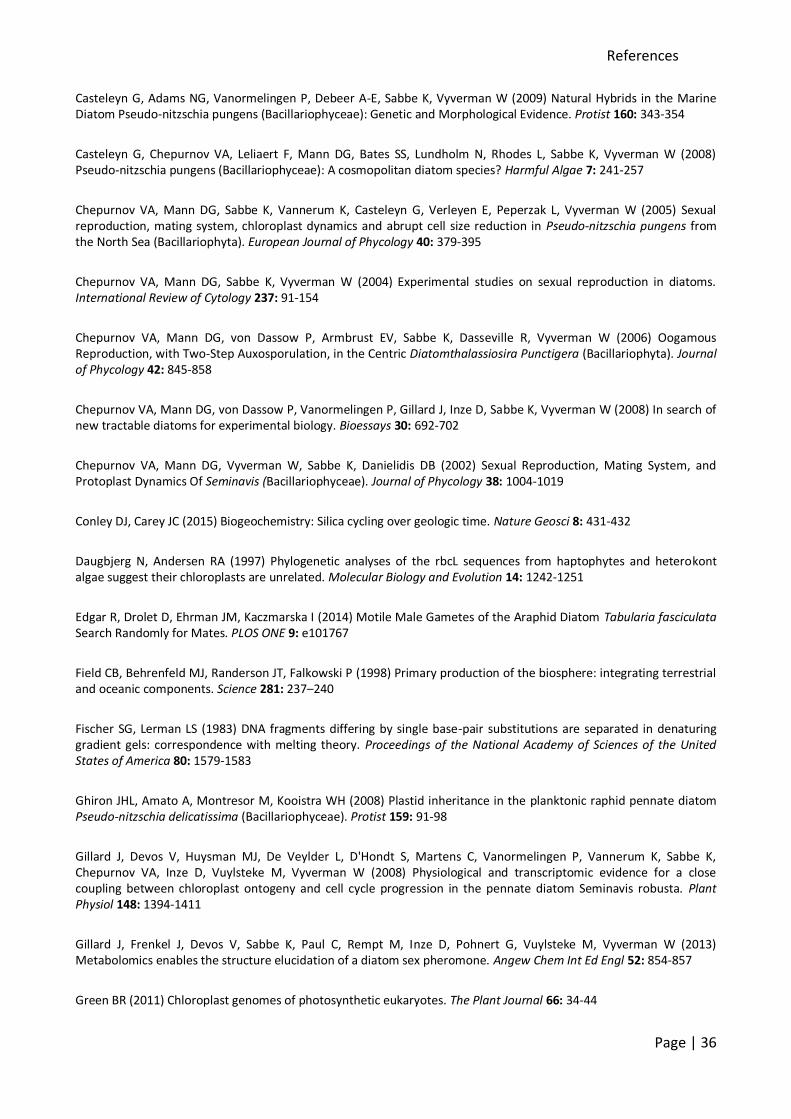
References
Page | 36
Casteleyn G, Adams NG, Vanormelingen P, Debeer A-E, Sabbe K, Vyverman W (2009) Natural Hybrids in the Marine Diatom Pseudo-nitzschia pungens (Bacillariophyceae): Genetic and Morphological Evidence. Protist 160: 343-354
Casteleyn G, Chepurnov VA, Leliaert F, Mann DG, Bates SS, Lundholm N, Rhodes L, Sabbe K, Vyverman W (2008) Pseudo-nitzschia pungens (Bacillariophyceae): A cosmopolitan diatom species? Harmful Algae 7: 241-257
Chepurnov VA, Mann DG, Sabbe K, Vannerum K, Casteleyn G, Verleyen E, Peperzak L, Vyverman W (2005) Sexual reproduction, mating system, chloroplast dynamics and abrupt cell size reduction in Pseudo-nitzschia pungens from the North Sea (Bacillariophyta). European Journal of Phycology 40: 379-395
Chepurnov VA, Mann DG, Sabbe K, Vyverman W (2004) Experimental studies on sexual reproduction in diatoms. International Review of Cytology 237: 91-154
Chepurnov VA, Mann DG, von Dassow P, Armbrust EV, Sabbe K, Dasseville R, Vyverman W (2006) Oogamous Reproduction, with Two-Step Auxosporulation, in the Centric Diatomthalassiosira Punctigera (Bacillariophyta). Journal of Phycology 42: 845-858
Chepurnov VA, Mann DG, von Dassow P, Vanormelingen P, Gillard J, Inze D, Sabbe K, Vyverman W (2008) In search of new tractable diatoms for experimental biology. Bioessays 30: 692-702
Chepurnov VA, Mann DG, Vyverman W, Sabbe K, Danielidis DB (2002) Sexual Reproduction, Mating System, and Protoplast Dynamics Of Seminavis (Bacillariophyceae). Journal of Phycology 38: 1004-1019
Conley DJ, Carey JC (2015) Biogeochemistry: Silica cycling over geologic time. Nature Geosci 8: 431-432
Daugbjerg N, Andersen RA (1997) Phylogenetic analyses of the rbcL sequences from haptophytes and heterokont algae suggest their chloroplasts are unrelated. Molecular Biology and Evolution 14: 1242-1251
Edgar R, Drolet D, Ehrman JM, Kaczmarska I (2014) Motile Male Gametes of the Araphid Diatom Tabularia fasciculata Search Randomly for Mates. PLOS ONE 9: e101767
Field CB, Behrenfeld MJ, Randerson JT, Falkowski P (1998) Primary production of the biosphere: integrating terrestrial and oceanic components. Science 281: 237–240
Fischer SG, Lerman LS (1983) DNA fragments differing by single base-pair substitutions are separated in denaturing gradient gels: correspondence with melting theory. Proceedings of the National Academy of Sciences of the United States of America 80: 1579-1583
Ghiron JHL, Amato A, Montresor M, Kooistra WH (2008) Plastid inheritance in the planktonic raphid pennate diatom Pseudo-nitzschia delicatissima (Bacillariophyceae). Protist 159: 91-98
Gillard J, Devos V, Huysman MJ, De Veylder L, D'Hondt S, Martens C, Vanormelingen P, Vannerum K, Sabbe K, Chepurnov VA, Inze D, Vuylsteke M, Vyverman W (2008) Physiological and transcriptomic evidence for a close coupling between chloroplast ontogeny and cell cycle progression in the pennate diatom Seminavis robusta. Plant Physiol 148: 1394-1411
Gillard J, Frenkel J, Devos V, Sabbe K, Paul C, Rempt M, Inze D, Pohnert G, Vuylsteke M, Vyverman W (2013) Metabolomics enables the structure elucidation of a diatom sex pheromone. Angew Chem Int Ed Engl 52: 854-857
Green BR (2011) Chloroplast genomes of photosynthetic eukaryotes. The Plant Journal 66: 34-44
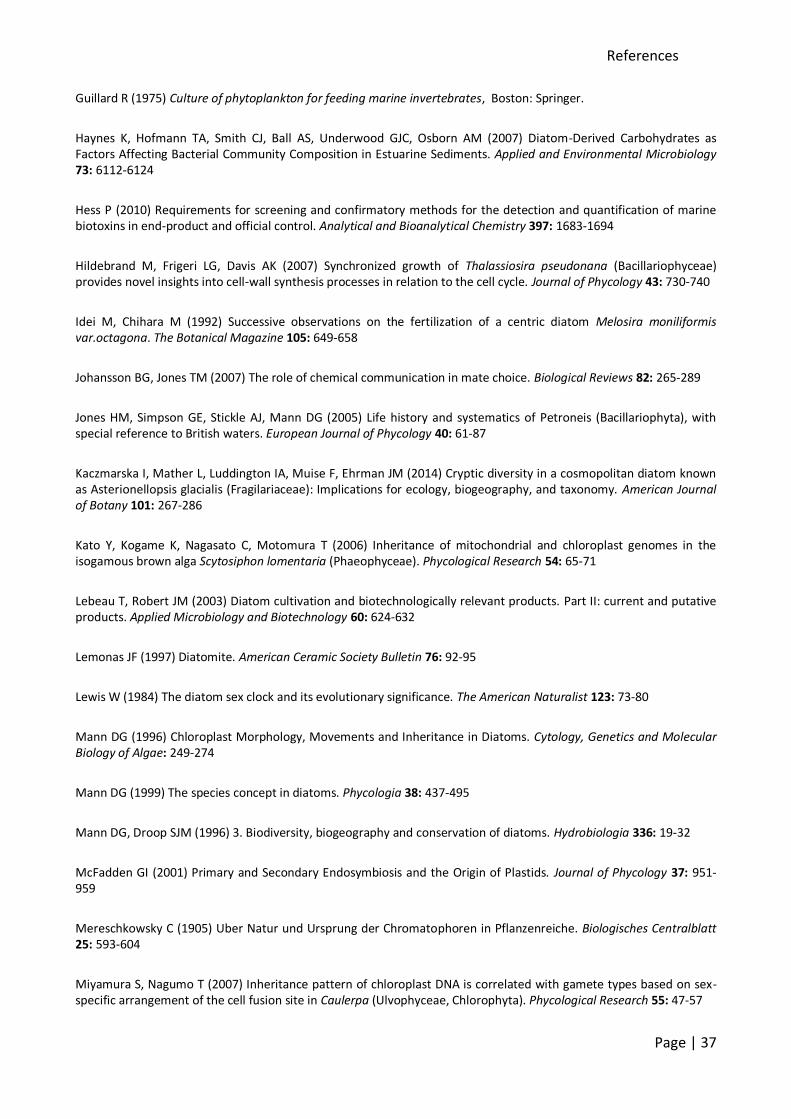
References
Page | 37
Guillard R (1975) Culture of phytoplankton for feeding marine invertebrates, Boston: Springer.
Haynes K, Hofmann TA, Smith CJ, Ball AS, Underwood GJC, Osborn AM (2007) Diatom-Derived Carbohydrates as Factors Affecting Bacterial Community Composition in Estuarine Sediments. Applied and Environmental Microbiology 73: 6112-6124
Hess P (2010) Requirements for screening and confirmatory methods for the detection and quantification of marine biotoxins in end-product and official control. Analytical and Bioanalytical Chemistry 397: 1683-1694
Hildebrand M, Frigeri LG, Davis AK (2007) Synchronized growth of Thalassiosira pseudonana (Bacillariophyceae) provides novel insights into cell-wall synthesis processes in relation to the cell cycle. Journal of Phycology 43: 730-740
Idei M, Chihara M (1992) Successive observations on the fertilization of a centric diatom Melosira moniliformis var.octagona. The Botanical Magazine 105: 649-658
Johansson BG, Jones TM (2007) The role of chemical communication in mate choice. Biological Reviews 82: 265-289
Jones HM, Simpson GE, Stickle AJ, Mann DG (2005) Life history and systematics of Petroneis (Bacillariophyta), with special reference to British waters. European Journal of Phycology 40: 61-87
Kaczmarska I, Mather L, Luddington IA, Muise F, Ehrman JM (2014) Cryptic diversity in a cosmopolitan diatom known as Asterionellopsis glacialis (Fragilariaceae): Implications for ecology, biogeography, and taxonomy. American Journal of Botany 101: 267-286
Kato Y, Kogame K, Nagasato C, Motomura T (2006) Inheritance of mitochondrial and chloroplast genomes in the isogamous brown alga Scytosiphon lomentaria (Phaeophyceae). Phycological Research 54: 65-71
Lebeau T, Robert JM (2003) Diatom cultivation and biotechnologically relevant products. Part II: current and putative products. Applied Microbiology and Biotechnology 60: 624-632
Lemonas JF (1997) Diatomite. American Ceramic Society Bulletin 76: 92-95
Lewis W (1984) The diatom sex clock and its evolutionary significance. The American Naturalist 123: 73-80
Mann DG (1996) Chloroplast Morphology, Movements and Inheritance in Diatoms. Cytology, Genetics and Molecular Biology of Algae: 249-274
Mann DG (1999) The species concept in diatoms. Phycologia 38: 437-495
Mann DG, Droop SJM (1996) 3. Biodiversity, biogeography and conservation of diatoms. Hydrobiologia 336: 19-32
McFadden GI (2001) Primary and Secondary Endosymbiosis and the Origin of Plastids. Journal of Phycology 37: 951-959
Mereschkowsky C (1905) Uber Natur und Ursprung der Chromatophoren in Pflanzenreiche. Biologisches Centralblatt 25: 593-604
Miyamura S, Nagumo T (2007) Inheritance pattern of chloroplast DNA is correlated with gamete types based on sex-specific arrangement of the cell fusion site in Caulerpa (Ulvophyceae, Chlorophyta). Phycological Research 55: 47-57
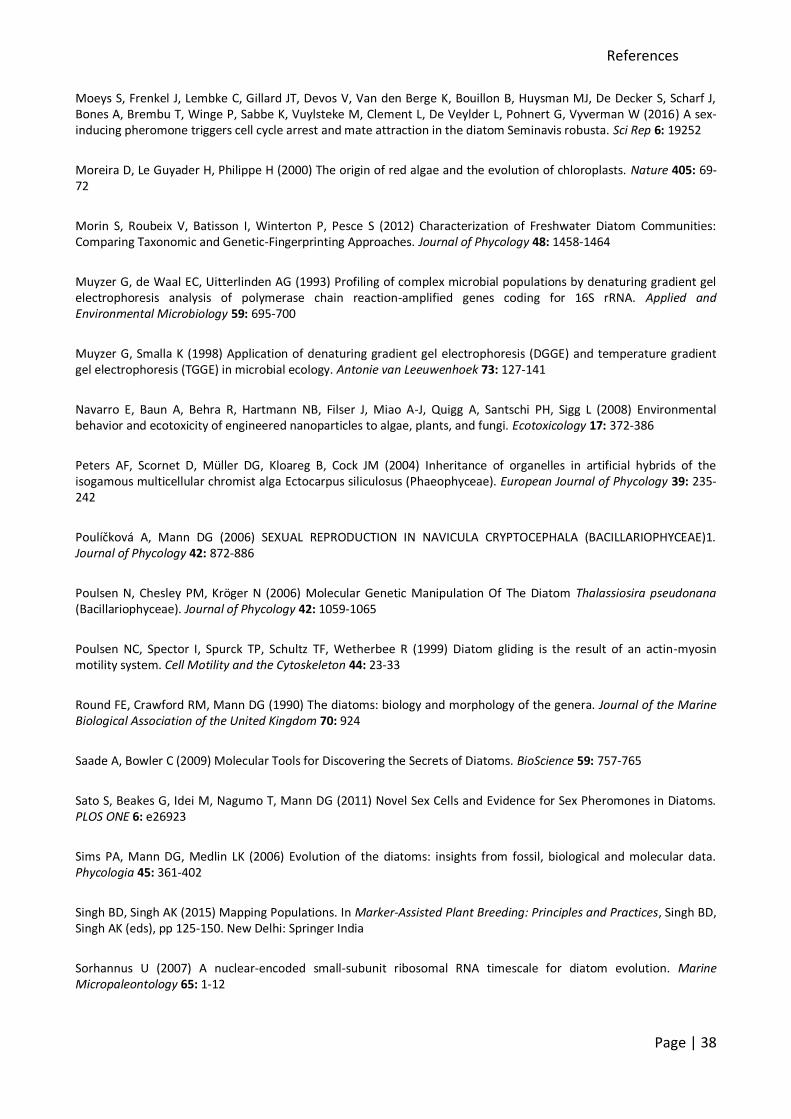
References
Page | 38
Moeys S, Frenkel J, Lembke C, Gillard JT, Devos V, Van den Berge K, Bouillon B, Huysman MJ, De Decker S, Scharf J, Bones A, Brembu T, Winge P, Sabbe K, Vuylsteke M, Clement L, De Veylder L, Pohnert G, Vyverman W (2016) A sex-inducing pheromone triggers cell cycle arrest and mate attraction in the diatom Seminavis robusta. Sci Rep 6: 19252
Moreira D, Le Guyader H, Philippe H (2000) The origin of red algae and the evolution of chloroplasts. Nature 405: 69-72
Morin S, Roubeix V, Batisson I, Winterton P, Pesce S (2012) Characterization of Freshwater Diatom Communities: Comparing Taxonomic and Genetic‐Fingerprinting Approaches. Journal of Phycology 48: 1458-1464
Muyzer G, de Waal EC, Uitterlinden AG (1993) Profiling of complex microbial populations by denaturing gradient gel electrophoresis analysis of polymerase chain reaction-amplified genes coding for 16S rRNA. Applied and Environmental Microbiology 59: 695-700
Muyzer G, Smalla K (1998) Application of denaturing gradient gel electrophoresis (DGGE) and temperature gradient gel electrophoresis (TGGE) in microbial ecology. Antonie van Leeuwenhoek 73: 127-141
Navarro E, Baun A, Behra R, Hartmann NB, Filser J, Miao A-J, Quigg A, Santschi PH, Sigg L (2008) Environmental behavior and ecotoxicity of engineered nanoparticles to algae, plants, and fungi. Ecotoxicology 17: 372-386
Peters AF, Scornet D, Müller DG, Kloareg B, Cock JM (2004) Inheritance of organelles in artificial hybrids of the isogamous multicellular chromist alga Ectocarpus siliculosus (Phaeophyceae). European Journal of Phycology 39: 235-242
Poulíčková A, Mann DG (2006) SEXUAL REPRODUCTION IN NAVICULA CRYPTOCEPHALA (BACILLARIOPHYCEAE)1. Journal of Phycology 42: 872-886
Poulsen N, Chesley PM, Kröger N (2006) Molecular Genetic Manipulation Of The Diatom Thalassiosira pseudonana (Bacillariophyceae). Journal of Phycology 42: 1059-1065
Poulsen NC, Spector I, Spurck TP, Schultz TF, Wetherbee R (1999) Diatom gliding is the result of an actin-myosin motility system. Cell Motility and the Cytoskeleton 44: 23-33
Round FE, Crawford RM, Mann DG (1990) The diatoms: biology and morphology of the genera. Journal of the Marine Biological Association of the United Kingdom 70: 924
Saade A, Bowler C (2009) Molecular Tools for Discovering the Secrets of Diatoms. BioScience 59: 757-765
Sato S, Beakes G, Idei M, Nagumo T, Mann DG (2011) Novel Sex Cells and Evidence for Sex Pheromones in Diatoms. PLOS ONE 6: e26923
Sims PA, Mann DG, Medlin LK (2006) Evolution of the diatoms: insights from fossil, biological and molecular data. Phycologia 45: 361-402
Singh BD, Singh AK (2015) Mapping Populations. In Marker-Assisted Plant Breeding: Principles and Practices, Singh BD, Singh AK (eds), pp 125-150. New Delhi: Springer India
Sorhannus U (2007) A nuclear-encoded small-subunit ribosomal RNA timescale for diatom evolution. Marine Micropaleontology 65: 1-12
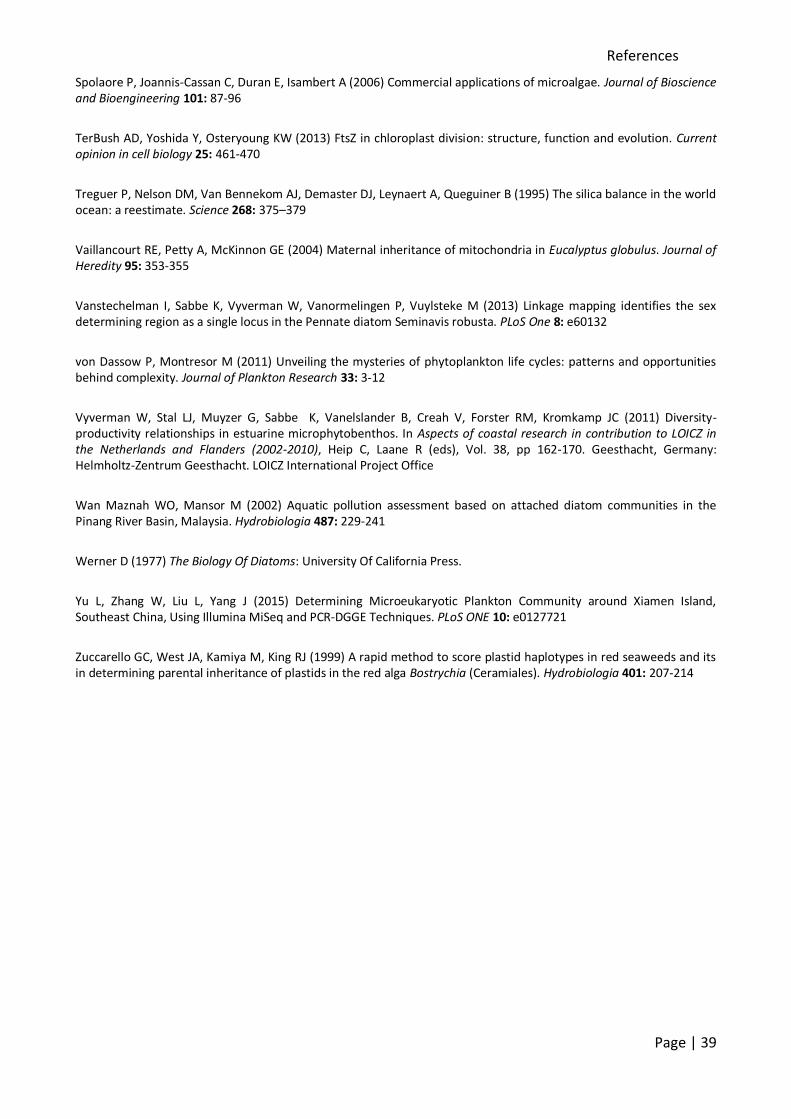
References
Page | 39
Spolaore P, Joannis-Cassan C, Duran E, Isambert A (2006) Commercial applications of microalgae. Journal of Bioscience and Bioengineering 101: 87-96
TerBush AD, Yoshida Y, Osteryoung KW (2013) FtsZ in chloroplast division: structure, function and evolution. Current opinion in cell biology 25: 461-470
Treguer P, Nelson DM, Van Bennekom AJ, Demaster DJ, Leynaert A, Queguiner B (1995) The silica balance in the world ocean: a reestimate. Science 268: 375–379
Vaillancourt RE, Petty A, McKinnon GE (2004) Maternal inheritance of mitochondria in Eucalyptus globulus. Journal of Heredity 95: 353-355
Vanstechelman I, Sabbe K, Vyverman W, Vanormelingen P, Vuylsteke M (2013) Linkage mapping identifies the sex determining region as a single locus in the Pennate diatom Seminavis robusta. PLoS One 8: e60132
von Dassow P, Montresor M (2011) Unveiling the mysteries of phytoplankton life cycles: patterns and opportunities behind complexity. Journal of Plankton Research 33: 3-12
Vyverman W, Stal LJ, Muyzer G, Sabbe K, Vanelslander B, Creah V, Forster RM, Kromkamp JC (2011) Diversity-productivity relationships in estuarine microphytobenthos. In Aspects of coastal research in contribution to LOICZ in the Netherlands and Flanders (2002-2010), Heip C, Laane R (eds), Vol. 38, pp 162-170. Geesthacht, Germany: Helmholtz-Zentrum Geesthacht. LOICZ International Project Office
Wan Maznah WO, Mansor M (2002) Aquatic pollution assessment based on attached diatom communities in the Pinang River Basin, Malaysia. Hydrobiologia 487: 229-241
Werner D (1977) The Biology Of Diatoms: University Of California Press.
Yu L, Zhang W, Liu L, Yang J (2015) Determining Microeukaryotic Plankton Community around Xiamen Island, Southeast China, Using Illumina MiSeq and PCR-DGGE Techniques. PLoS ONE 10: e0127721
Zuccarello GC, West JA, Kamiya M, King RJ (1999) A rapid method to score plastid haplotypes in red seaweeds and its in determining parental inheritance of plastids in the red alga Bostrychia (Ceramiales). Hydrobiologia 401: 207-214
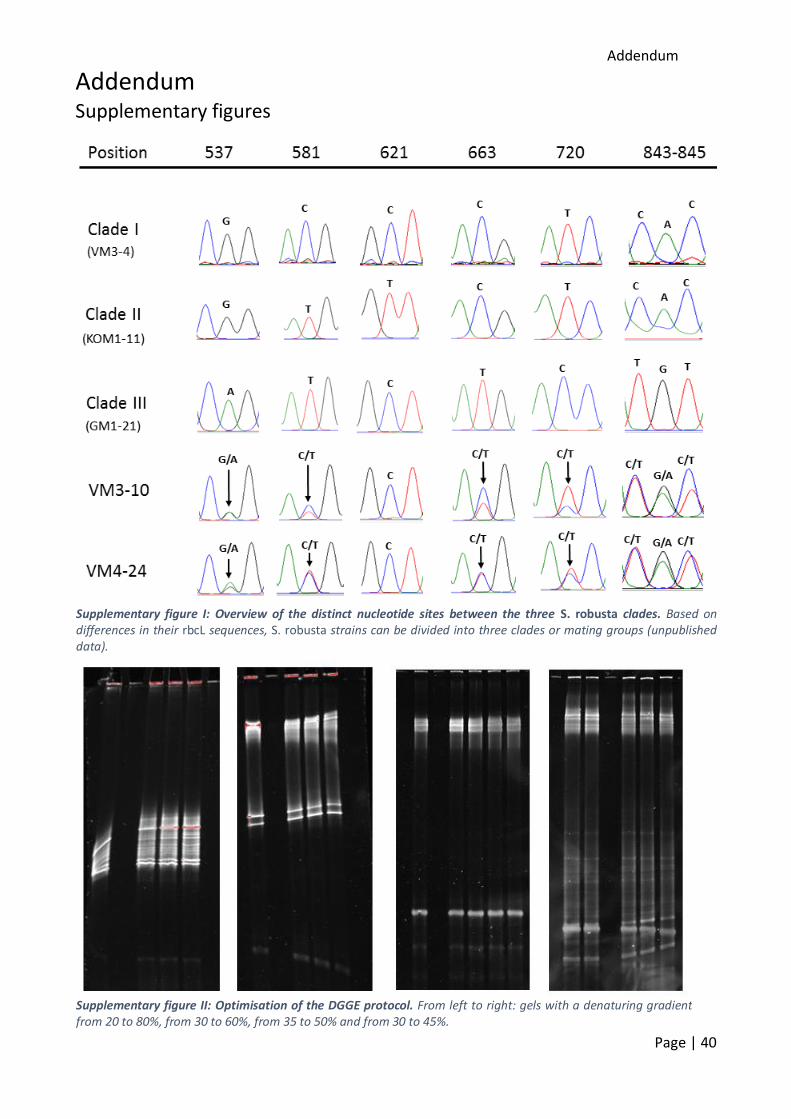
Addendum
Page | 40
Addendum Supplementary figures
Supplementary figure I: Overview of the distinct nucleotide sites between the three S. robusta clades. Based on differences in their rbcL sequences, S. robusta strains can be divided into three clades or mating groups (unpublished data).
Supplementary figure II: Optimisation of the DGGE protocol. From left to right: gels with a denaturing gradient from 20 to 80%, from 30 to 60%, from 35 to 50% and from 30 to 45%.
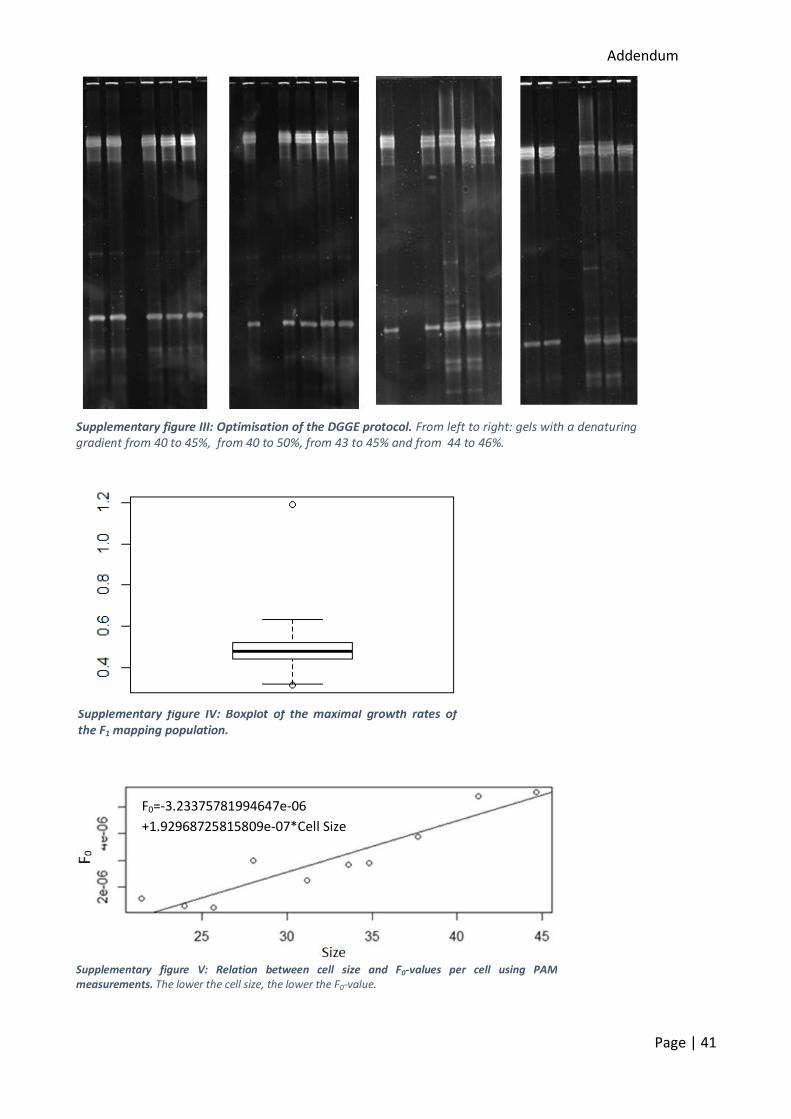
Addendum
Page | 41
Supplementary figure III: Optimisation of the DGGE protocol. From left to right: gels with a denaturing gradient from 40 to 45%, from 40 to 50%, from 43 to 45% and from 44 to 46%.
Supplementary figure IV: Boxplot of the maximal growth rates of the F1 mapping population.
Supplementary figure V: Relation between cell size and F0-values per cell using PAM measurements. The lower the cell size, the lower the F0-value.
F0=-3.23375781994647e-06
+1.92968725815809e-07*Cell Size
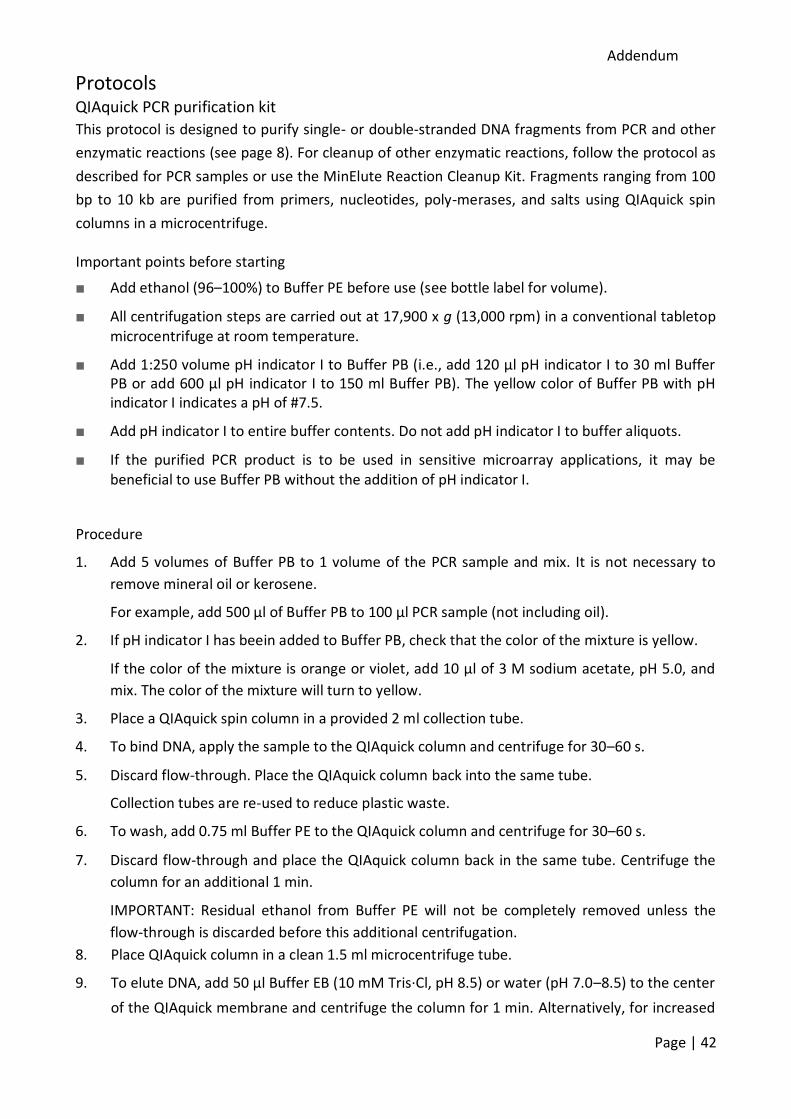
Addendum
Page | 42
Protocols QIAquick PCR purification kit
This protocol is designed to purify single- or double-stranded DNA fragments from PCR and other
enzymatic reactions (see page 8). For cleanup of other enzymatic reactions, follow the protocol as
described for PCR samples or use the MinElute Reaction Cleanup Kit. Fragments ranging from 100
bp to 10 kb are purified from primers, nucleotides, poly-merases, and salts using QIAquick spin
columns in a microcentrifuge.
Important points before starting ■ Add ethanol (96–100%) to Buffer PE before use (see bottle label for volume). ■ All centrifugation steps are carried out at 17,900 x g (13,000 rpm) in a conventional tabletop
microcentrifuge at room temperature. ■ Add 1:250 volume pH indicator I to Buffer PB (i.e., add 120 µl pH indicator I to 30 ml Buffer
PB or add 600 µl pH indicator I to 150 ml Buffer PB). The yellow color of Buffer PB with pH indicator I indicates a pH of #7.5.
■ Add pH indicator I to entire buffer contents. Do not add pH indicator I to buffer aliquots. ■ If the purified PCR product is to be used in sensitive microarray applications, it may be
beneficial to use Buffer PB without the addition of pH indicator I. Procedure 1. Add 5 volumes of Buffer PB to 1 volume of the PCR sample and mix. It is not necessary to
remove mineral oil or kerosene.
For example, add 500 µl of Buffer PB to 100 µl PCR sample (not including oil). 2. If pH indicator I has beein added to Buffer PB, check that the color of the mixture is yellow.
If the color of the mixture is orange or violet, add 10 µl of 3 M sodium acetate, pH 5.0, and
mix. The color of the mixture will turn to yellow. 3. Place a QIAquick spin column in a provided 2 ml collection tube. 4. To bind DNA, apply the sample to the QIAquick column and centrifuge for 30–60 s. 5. Discard flow-through. Place the QIAquick column back into the same tube.
Collection tubes are re-used to reduce plastic waste. 6. To wash, add 0.75 ml Buffer PE to the QIAquick column and centrifuge for 30–60 s. 7. Discard flow-through and place the QIAquick column back in the same tube. Centrifuge the
column for an additional 1 min.
IMPORTANT: Residual ethanol from Buffer PE will not be completely removed unless the
flow-through is discarded before this additional centrifugation.
8. Place QIAquick column in a clean 1.5 ml microcentrifuge tube. 9. To elute DNA, add 50 µl Buffer EB (10 mM Tris·Cl, pH 8.5) or water (pH 7.0–8.5) to the center
of the QIAquick membrane and centrifuge the column for 1 min. Alternatively, for increased
Addendum
Page | 43
DNA concentration, add 30 µl elution buffer to the center of the QIAquick membrane, let the
column stand for 1 min, and then centrifuge.
IMPORTANT: Ensure that the elution buffer is dispensed directly onto the QIAquick
membrane for complete elution of bound DNA. The average eluate volume is 48 µl from 50
µl elution buffer volume, and 28 µl from 30 µl elution buffer.
Elution efficiency is dependent on pH. The maximum elution efficiency is achieved between
pH 7.0 and 8.5. When using water, make sure that the pH value is within this range, and
store DNA at –20°C as DNA may degrade in the absence of a buffering agent. The purified
DNA can also be eluted in TE buffer (10 mM Tris·Cl, 1 mM EDTA, pH 8.0), but the EDTA may
inhibit subsequent enzymatic reactions.
Muyzer DNA extraction protocol
In fumehood, with gloves and on ice.
1. Add:
0,5 g zirconium beads
0,5 ml Tris/EDTA (1X TE, pH 8,0)
0,5 ml buffered phenol (pH 7 - 8, firm Roth 2. Shake tubes manually 1 time and then 3 times 1,25 minutes in a beadbeater with a frequency
of 30 Hz 3. Centrifuge at 10 000 rpm for 5 minutes in a cooled centrifuge (4 °C) 4. Pipet the water phase (upper layer) to a new eppendorf with a 200 µl pipet 5. Add 0,5 ml PCl (buffered phenol: chloroform: isoamylalcohol = 25:24:1 l/l). Shake 1 x. 6. Centrifuge at 10 000 rpm for 5 minutes 7. Repeat steps 4, 5 and 6. 8. Transfer the water phase to a new eppendorf of 1,5 ml 9. Add:
50 µl 3 M NaAc pH 5
1 ml 96 % ethanol (-20 °C)
2 µl glycogen (-20 °C, pipet up and down) Shake 2 x
10. Incubate overnight at -20 °C. 11. Centrifuge at 13.000 rpm for 30 minutes in a cooled centrifuge (4°C) 12. Remove upper phase ( DNA-pellet remains in the eppendorf) 13. Add 1 ml 70 % ethanol 14. Centrifuge at 13.000 rpm for 5 minutes 15. Remove the upper phase (ethanol) 16. Centrifuge again at 13.000 rpm for 5 minutes 17. Carefully remove the ethanol with a 200 µl pipet by placing the pipet tip on the opposite side
of the pellet 18. Let the pellet air dry for at least 20 minutes 19. Add 100 µl pre-heated TE (55 °C) and suspend the DNA-pellet by pipetting up and down a few
times 20. Incubate 20 minutes at 55 °C to completely suspend the DNA 21. Stock the DNA at -20 °C.
Addendum
Page | 44
DGGE protocol
Preparation of DGGE gel
1. Clean glass plates well, using in succession strong detergent, water and finally acetone or alcohol. Dry well.
2. Place spacers between the plates and put the construction into a “holder” that stabilizes the plates in a vertical position.
3. Connect the tubing to a clean and dry gradient maker, closing the communicating channel between the 2 chambers and also the tubing that leads from the gradient maker to the glass plates, with the use of stop-cock or clamps.
4. Position the magnetic stirrer about 25 cm above the glass plates and place the gradient maker on top, securing well.
5. In two separate test tubes prepare two denaturing solutions (representing the high and low of the range appropriate for the fragment) of 12 ml each, and add 8 μl TEMED and 100 μl of fresh ammonium peroxydedipersulphate (10% APS). Mix well.
6. Without delay, put the solution with the lowest denaturant concentration in the chamber of the gradient maker furthest from the glass plates. Allow a minimal volume to flow through the connecting channel to avoid blockage by air, and then place the solution with the highest denaturant concentration in the chamber nearest the glass plates.
7. Put the magnet in this chamber, turn stirrer on and open the connecting tube between chambers to begin mixing the two solutions. Immediately open the connection on the tubing leading to the glass plates and the acrylamide will begin to flow steadily under the force of gravity.
8. Let the gel polymerise for 2 h.
Electrophoresis of the DGGE gel
1. Fill the electrophoresis tank with running buffer (1x TAE). Heat buffer to 60 °C. 2. Once the gel has polymerised, carefully remove the comb and clean away excess
acrylamide, taking care not to spoil the wells. 3. Place the gel in the gel electrophoresis cassette. 4. Flush the wells with a fine syringe and load about 10-15 μl of each sample, containing
loading dye, using thin-ended or duck-billed tip. 5. Submerge the electrophoresis cassette in the buffer in the tank. 6. Run gel about 16 hours (overnight) at 75 volts. The gel is ready for viewing when the
bromophenol blue dye has run completely out of the gel.
DGGE gel staining and viewing
1. After the run, turn off power supply and remove gel from tank and holder. 2. Unseal the sides of the glass plates and gently remove one of the glass plates, leaving the
gel to rest on the other. 3. Place the gel (on the glass plate) in a container with SYBR Gold and stain for about 30
minutes. 4. Place the gel onto a UV transilluminator, sliding it off the plate carefully so it does not fold
over or split. 5. Examine the gel under UV light (256 nm wavelength) and photograph.
Related Documents