1 Triola Triola, Essentials of Statistics, Third Edition. Copyright 2008. Pea , Essentials of Statistics, Third Edition. Copyright 2008. Pearson Education, Inc. rson Education, Inc. Chapters 10 and 11 Chapters 10 and 11 Review for Exam Review for Exam 2 Triola Triola, Essentials of Statistics, Third Edition. Copyright 2008. Pea , Essentials of Statistics, Third Edition. Copyright 2008. Pearson Education, Inc. rson Education, Inc. Chapter 10 Chapter 10 Correlation Correlation and and Regression Regression 3 Triola Triola, Essentials of Statistics, Third Edition. Copyright 2008. Pea , Essentials of Statistics, Third Edition. Copyright 2008. Pearson Education, Inc. rson Education, Inc. Overview Overview Paired Data Paired Data v is there a relationship is there a relationship v if so, what is the equation if so, what is the equation v use the equation for prediction use the equation for prediction

Welcome message from author
This document is posted to help you gain knowledge. Please leave a comment to let me know what you think about it! Share it to your friends and learn new things together.
Transcript
11TriolaTriola, Essentials of Statistics, Third Edition. Copyright 2008. Pea, Essentials of Statistics, Third Edition. Copyright 2008. Pearson Education, Inc.rson Education, Inc.
Chapters 10 and 11Chapters 10 and 11
Review for ExamReview for Exam
22TriolaTriola, Essentials of Statistics, Third Edition. Copyright 2008. Pea, Essentials of Statistics, Third Edition. Copyright 2008. Pearson Education, Inc.rson Education, Inc.
Chapter 10Chapter 10
Correlation Correlation and and
RegressionRegression
33TriolaTriola, Essentials of Statistics, Third Edition. Copyright 2008. Pea, Essentials of Statistics, Third Edition. Copyright 2008. Pearson Education, Inc.rson Education, Inc.
OverviewOverviewPaired DataPaired Data
vv is there a relationshipis there a relationship
vv if so, what is the equationif so, what is the equation
vv use the equation for predictionuse the equation for prediction

44TriolaTriola, Essentials of Statistics, Third Edition. Copyright 2008. Pea, Essentials of Statistics, Third Edition. Copyright 2008. Pearson Education, Inc.rson Education, Inc.
DefinitionDefinition
vv CorrelationCorrelationexists between two variables exists between two variables when one of them is related to when one of them is related to the other in some waythe other in some way
55TriolaTriola, Essentials of Statistics, Third Edition. Copyright 2008. Pea, Essentials of Statistics, Third Edition. Copyright 2008. Pearson Education, Inc.rson Education, Inc.
Definition
vv ScatterplotScatterplot (or scatter diagram)(or scatter diagram)is a graph in which the paired is a graph in which the paired ((x,yx,y) sample data are plotted with ) sample data are plotted with a horizontal a horizontal xx axis and a vertical axis and a vertical yy axis. Each individual (axis. Each individual (x,yx,y) pair ) pair is plotted as a single point.is plotted as a single point.
66TriolaTriola, Essentials of Statistics, Third Edition. Copyright 2008. Pea, Essentials of Statistics, Third Edition. Copyright 2008. Pearson Education, Inc.rson Education, Inc.
Scatter Diagram of Paired DataScatter Diagram of Paired Data
0
100
200
300
400
500
35 40 45 50 55 60 65 70 75
Weight(lb.)
••
•
•(72,416)
••
•• (72,348)
(73,332)
(73.5,262)
(67.5,344)
(68.5,360)
(37,34) (53,80)
Lengths and Weights of Male Bears
Length (in.)
77TriolaTriola, Essentials of Statistics, Third Edition. Copyright 2008. Pea, Essentials of Statistics, Third Edition. Copyright 2008. Pearson Education, Inc.rson Education, Inc.
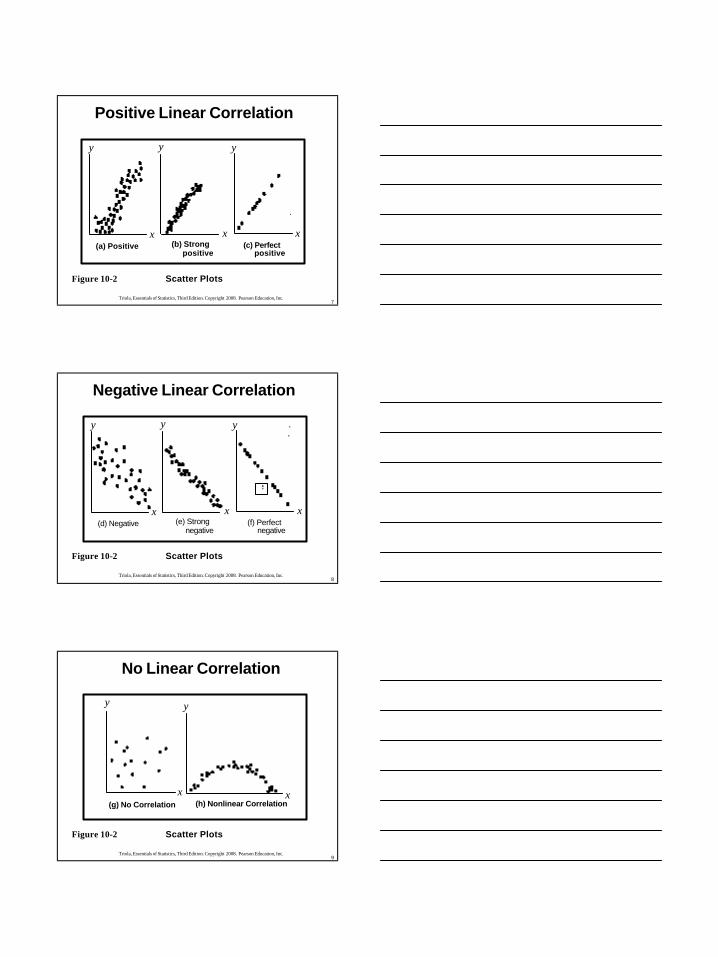
Positive Linear CorrelationPositive Linear Correlation
x x
yy y
x
Figure 10Figure 10--2 2 Scatter Plots Scatter Plots
(a) Positive (b) Strongpositive
(c) Perfectpositive
88TriolaTriola, Essentials of Statistics, Third Edition. Copyright 2008. Pea, Essentials of Statistics, Third Edition. Copyright 2008. Pearson Education, Inc.rson Education, Inc.
Negative Linear CorrelationNegative Linear Correlation
x x
yy y
x(d) Negative (e) Strong
negative(f) Perfect
negative
Figure 10Figure 10--2 2 Scatter Plots Scatter Plots
99TriolaTriola, Essentials of Statistics, Third Edition. Copyright 2008. Pea, Essentials of Statistics, Third Edition. Copyright 2008. Pearson Education, Inc.rson Education, Inc.
No Linear CorrelationNo Linear Correlation
x x
yy
(g) No Correlation (h) Nonlinear Correlation
Figure 10Figure 10--2 2 Scatter Plots Scatter Plots
1010TriolaTriola, Essentials of Statistics, Third Edition. Copyright 2008. Pea, Essentials of Statistics, Third Edition. Copyright 2008. Pearson Education, Inc.rson Education, Inc.
DefinitionDefinition
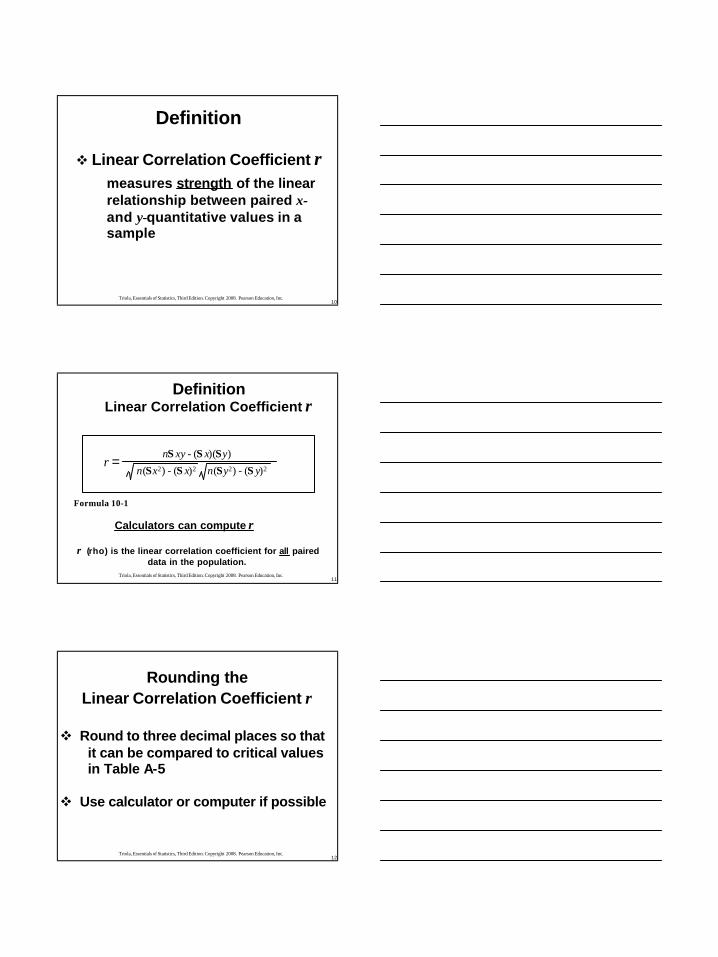
vv Linear Correlation Coefficient Linear Correlation Coefficient rrmeasures measures strengthstrength of the linear of the linear relationship between paired relationship between paired xx--and and yy--quantitative values in a quantitative values in a sample sample
1111TriolaTriola, Essentials of Statistics, Third Edition. Copyright 2008. Pea, Essentials of Statistics, Third Edition. Copyright 2008. Pearson Education, Inc.rson Education, Inc.
nΣ xy - (Σ x)(Σy)
n(Σx2) - (Σ x)2 n(Σy2) - (Σ y)2r =
DefinitionDefinitionLinear Correlation Coefficient Linear Correlation Coefficient rr
Formula 10Formula 10--11
Calculators can compute Calculators can compute rr
ρ ρ ((rhorho) is the linear correlation coefficient for ) is the linear correlation coefficient for allall paired paired data in the population.data in the population.
1212TriolaTriola, Essentials of Statistics, Third Edition. Copyright 2008. Pea, Essentials of Statistics, Third Edition. Copyright 2008. Pearson Education, Inc.rson Education, Inc.
vv Round to three decimal places so that Round to three decimal places so that it can be compared to critical values it can be compared to critical values in Table Ain Table A--55
vv Use calculator or computer if possibleUse calculator or computer if possible
Rounding the Rounding the Linear Correlation Coefficient Linear Correlation Coefficient rr

1313TriolaTriola, Essentials of Statistics, Third Edition. Copyright 2008. Pea, Essentials of Statistics, Third Edition. Copyright 2008. Pearson Education, Inc.rson Education, Inc.
Interpreting the Linear Interpreting the Linear Correlation CoefficientCorrelation Coefficient
vv If the absolute value of If the absolute value of rr exceeds the exceeds the value in Table A value in Table A -- 5, conclude that 5, conclude that there is a significant linear correlation. there is a significant linear correlation.
vv Otherwise, there is not sufficient Otherwise, there is not sufficient evidence to support the conclusion of evidence to support the conclusion of significant linear correlation.significant linear correlation.
1414TriolaTriola, Essentials of Statistics, Third Edition. Copyright 2008. Pea, Essentials of Statistics, Third Edition. Copyright 2008. Pearson Education, Inc.rson Education, Inc.
TABLE ATABLE A--5 5 Critical Values of the Critical Values of the Pearson Correlation Coefficient rPearson Correlation Coefficient r
456789101112131415161718192025303540455060708090100
n
.999
.959
.917
.875
.834
.798
.765
.735
.708
.684
.661
.641
.623
.606
.590
.575
.561
.505
.463
.430
.402
.378
.361
.330
.305
.286
.269
.256
.950
.878
.811
.754
.707
.666
.632
.602
.576
.553
.532
.514
.497
.482
.468
.456
.444
.396
.361
.335
.312
.294
.279
.254
.236
.220
.207
.196
α = .05 α = .01
1515TriolaTriola, Essentials of Statistics, Third Edition. Copyright 2008. Pea, Essentials of Statistics, Third Edition. Copyright 2008. Pearson Education, Inc.rson Education, Inc.
Properties of the Properties of the Linear Correlation Coefficient Linear Correlation Coefficient rr
1. 1. --1 1 ≤≤ rr ≤≤ 11
2. Value of 2. Value of rr does not change if all values of does not change if all values of either variable are converted to a different either variable are converted to a different scale.scale.
3. 3. The value of The value of rr is not affected by the choice of is not affected by the choice of xx and and yy. Interchange . Interchange xx and and y y and the value of and the value of r r will not change.will not change.
4. 4. rr measures strength of a measures strength of a linearlinearrelationship.relationship.
1616TriolaTriola, Essentials of Statistics, Third Edition. Copyright 2008. Pea, Essentials of Statistics, Third Edition. Copyright 2008. Pearson Education, Inc.rson Education, Inc.
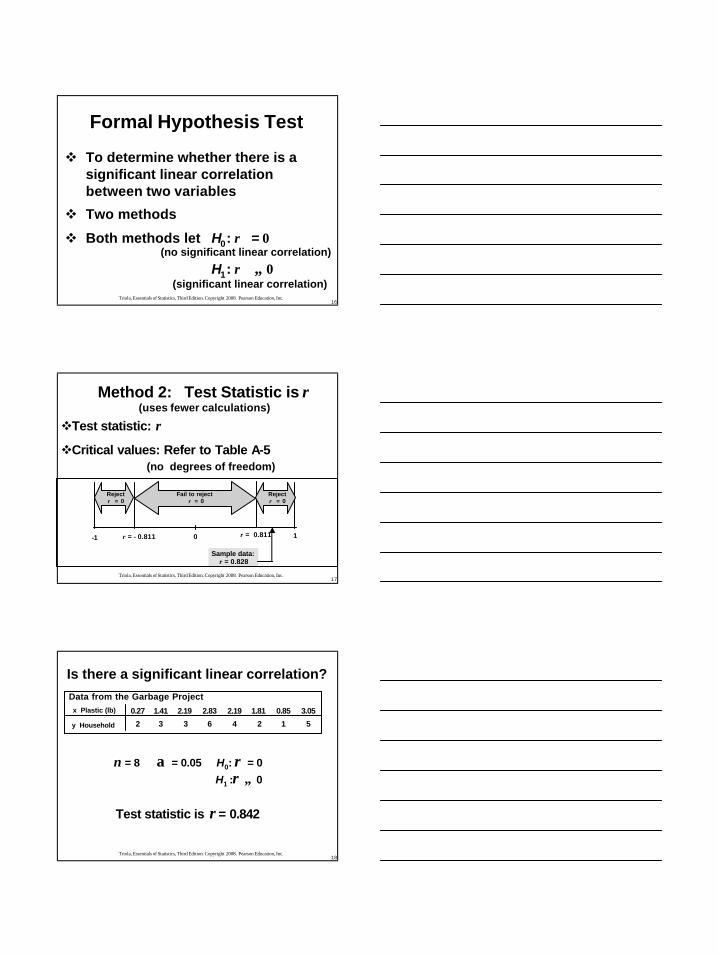
Formal Hypothesis TestFormal Hypothesis Test
vv To determine whether there is a To determine whether there is a significant linear correlation significant linear correlation between two variablesbetween two variables
vv Two methodsTwo methods
vv Both methods letBoth methods let HH00: : ρρ == 0 0 (no significant linear correlation)(no significant linear correlation)
HH11: : ρρ ≠ ≠ 0 0 (significant linear correlation)(significant linear correlation)
1717TriolaTriola, Essentials of Statistics, Third Edition. Copyright 2008. Pea, Essentials of Statistics, Third Edition. Copyright 2008. Pearson Education, Inc.rson Education, Inc.
vvTest statistic: Test statistic: rr
vvCritical values: Refer to Table ACritical values: Refer to Table A--5 5 (no degrees of freedom)(no degrees of freedom)
Method 2: Test Statistic is Method 2: Test Statistic is rr(uses fewer calculations)(uses fewer calculations)
Fail to rejectρ = 0
0r = - 0.811 r = 0.811 1
Sample data:r = 0.828
-1
Rejectρ = 0
Rejectρ = 0
1818TriolaTriola, Essentials of Statistics, Third Edition. Copyright 2008. Pea, Essentials of Statistics, Third Edition. Copyright 2008. Pearson Education, Inc.rson Education, Inc.
0.27
2
1.41
3
2.19
3
2.83
6
2.19
4
1.81
2
0.85
1
3.05
5
Data from the Garbage Projectx Plastic (lb)
y Household
nn = 8 = 8 αα = 0.05 = 0.05 HH00: : ρρ = 0= 0
HH1 1 ::ρρ ≠≠ 00
Test statistic is Test statistic is rr = 0.842= 0.842
Is there a significant linear correlation?Is there a significant linear correlation?

1919TriolaTriola, Essentials of Statistics, Third Edition. Copyright 2008. Pea, Essentials of Statistics, Third Edition. Copyright 2008. Pearson Education, Inc.rson Education, Inc.
nn = 8 = 8 αα = 0.05 = 0.05 HH00: : ρρ = 0= 0
HH1 1 ::ρρ ≠≠ 00
Test statistic is Test statistic is rr = 0.842 = 0.842
Critical values are Critical values are rr = = -- 0.707 and 0.7070.707 and 0.707(Table A(Table A--5 with 5 with nn = 8 and = 8 and αα = 0.05)= 0.05)
TABLE ATABLE A --5 Critical Values of the Pearson Correlation Coefficient 5 Critical Values of the Pearson Correlation Coefficient rr
456789101112131415161718192025303540455060708090
100
n.999.959.917.875.834.798.765.735.708.684.661.641.623.606.590.575.561.505.463.430.402.378.361.330.305.286.269.256
.950
.878
.811
.754
.707
.666
.632
.602
.576
.553
.532
.514
.497
.482
.468
.456
.444
.396
.361
.335
.312
.294
.279
.254
.236
.220
.207
.196
α = .05 α = .01
Is there a significant linear correlation?Is there a significant linear correlation?
2020TriolaTriola, Essentials of Statistics, Third Edition. Copyright 2008. Pea, Essentials of Statistics, Third Edition. Copyright 2008. Pearson Education, Inc.rson Education, Inc.
0r = - 0.707 r = 0.707 1
Sample data:r = 0.842
- 1
0.842 > 0.707 0.842 > 0.707 The test statistic The test statistic doesdoes fall within the critical region.fall within the critical region.
Therefore, we REJECT Therefore, we REJECT HH00: : ρρ = 0 (no correlation) and conclude= 0 (no correlation) and concludethere isthere is a significant linear correlation between the weights ofa significant linear correlation between the weights ofdiscarded plastic and household size.discarded plastic and household size.
Is there a significant linear correlation?Is there a significant linear correlation?
Fail to rejectρ = 0
Rejectρ = 0
Rejectρ = 0
2121TriolaTriola, Essentials of Statistics, Third Edition. Copyright 2008. Pea, Essentials of Statistics, Third Edition. Copyright 2008. Pearson Education, Inc.rson Education, Inc.
10.310.3
RegressionRegression

2222TriolaTriola, Essentials of Statistics, Third Edition. Copyright 2008. Pea, Essentials of Statistics, Third Edition. Copyright 2008. Pearson Education, Inc.rson Education, Inc.
RegressionRegressionDefinitionDefinitionvv Regression EquationRegression Equation
Given a collection of paired data, the regression Given a collection of paired data, the regression equationequation
vv Regression LineRegression Line(line of best fit or least(line of best fit or least--squares line)squares line)
the the graphgraph of the regression equationof the regression equation
y = b0 + b1x^
algebraically describes the relationship between the algebraically describes the relationship between the two variablestwo variables
2323TriolaTriola, Essentials of Statistics, Third Edition. Copyright 2008. Pea, Essentials of Statistics, Third Edition. Copyright 2008. Pearson Education, Inc.rson Education, Inc.
The Regression EquationThe Regression Equationxx is the independent variable is the independent variable
(predictor variable)(predictor variable)
y y is the dependent variable is the dependent variable (response variable)(response variable)
^̂
y = b0 +b1x^
y = mx +b
b0 = y - intercept
b1 = slope
2424TriolaTriola, Essentials of Statistics, Third Edition. Copyright 2008. Pea, Essentials of Statistics, Third Edition. Copyright 2008. Pearson Education, Inc.rson Education, Inc.
Regression Line Plotted on Scatter PlotRegression Line Plotted on Scatter Plot
2525TriolaTriola, Essentials of Statistics, Third Edition. Copyright 2008. Pea, Essentials of Statistics, Third Edition. Copyright 2008. Pearson Education, Inc.rson Education, Inc.
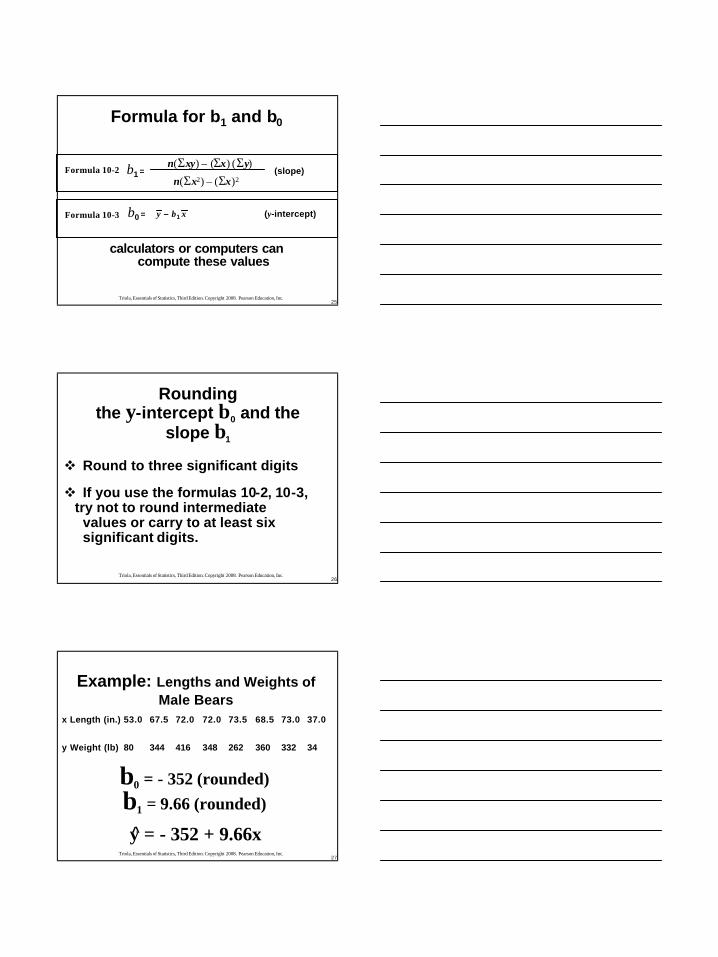
Formula 10-2n(Σxy) – (Σx) (Σy)b1 = (slope)
n(Σx2) – (Σx)2
b0 = y – b1 x (y-intercept)Formula 10-3
calculators or computers can calculators or computers can compute these valuescompute these values
Formula for bFormula for b11 and band b00
2626TriolaTriola, Essentials of Statistics, Third Edition. Copyright 2008. Pea, Essentials of Statistics, Third Edition. Copyright 2008. Pearson Education, Inc.rson Education, Inc.
Rounding Rounding the the yy--intercept intercept bb00 and the and the
slope slope bb11
vv Round to three significant digitsRound to three significant digits
vv If you use the formulas 10If you use the formulas 10--2, 102, 10--3, 3, try not to round intermediate try not to round intermediate
values or carry to at least six values or carry to at least six significant digits.significant digits.
2727TriolaTriola, Essentials of Statistics, Third Edition. Copyright 2008. Pea, Essentials of Statistics, Third Edition. Copyright 2008. Pearson Education, Inc.rson Education, Inc.
Example: Example: Lengths and Weights of Lengths and Weights of Male BearsMale Bears
bb00 = = -- 352 (rounded)352 (rounded)
bb11 = 9.66 (rounded)= 9.66 (rounded)
y = y = -- 352 + 9.66x352 + 9.66x^̂
x Length (in.)x Length (in.) 53.053.0 67.567.5 72.072.0 72.072.0 73.573.5 68.568.5 73.073.0 37.037.0
y Weight (lb)y Weight (lb) 8080 344344 416416 348348 262262 360360 332332 3434

2828TriolaTriola, Essentials of Statistics, Third Edition. Copyright 2008. Pea, Essentials of Statistics, Third Edition. Copyright 2008. Pearson Education, Inc.rson Education, Inc.
Scatter Diagram of Paired DataScatter Diagram of Paired Data
0
100
200
300
400
500
35 40 45 50 55 60 65 70 75
Weight(lb.)
Length (in.)
••
•
•••
••
Lengths and Weights of Male Bears
2929TriolaTriola, Essentials of Statistics, Third Edition. Copyright 2008. Pea, Essentials of Statistics, Third Edition. Copyright 2008. Pearson Education, Inc.rson Education, Inc.
In predicting a value of In predicting a value of yy based on some based on some given value of given value of xx ......
1. 1. If there is not a significant linear If there is not a significant linear correlation, the best predicted ycorrelation, the best predicted y--value is y.value is y.
2.2. If there is a significant linear correlation, If there is a significant linear correlation, the best predicted ythe best predicted y--value is found by value is found by substituting the xsubstituting the x--value into the value into the regression equation.regression equation.
PredictionsPredictions
3030TriolaTriola, Essentials of Statistics, Third Edition. Copyright 2008. Pea, Essentials of Statistics, Third Edition. Copyright 2008. Pearson Education, Inc.rson Education, Inc.
1. If there is no significant linear correlation, 1. If there is no significant linear correlation, dondon’’t use the regression equation to make t use the regression equation to make predictions.predictions.
2. When using the regression equation for 2. When using the regression equation for predictions, stay within the scope of the predictions, stay within the scope of the available sample data.available sample data.
3. A regression equation based on old data is 3. A regression equation based on old data is not necessarily valid now.not necessarily valid now.
4. Don4. Don’’t make predictions about a population t make predictions about a population that is different from the population from that is different from the population from which the sample data was drawn.which the sample data was drawn.
Guidelines for Using TheGuidelines for Using TheRegression EquationRegression Equation
3131TriolaTriola, Essentials of Statistics, Third Edition. Copyright 2008. Pea, Essentials of Statistics, Third Edition. Copyright 2008. Pearson Education, Inc.rson Education, Inc.
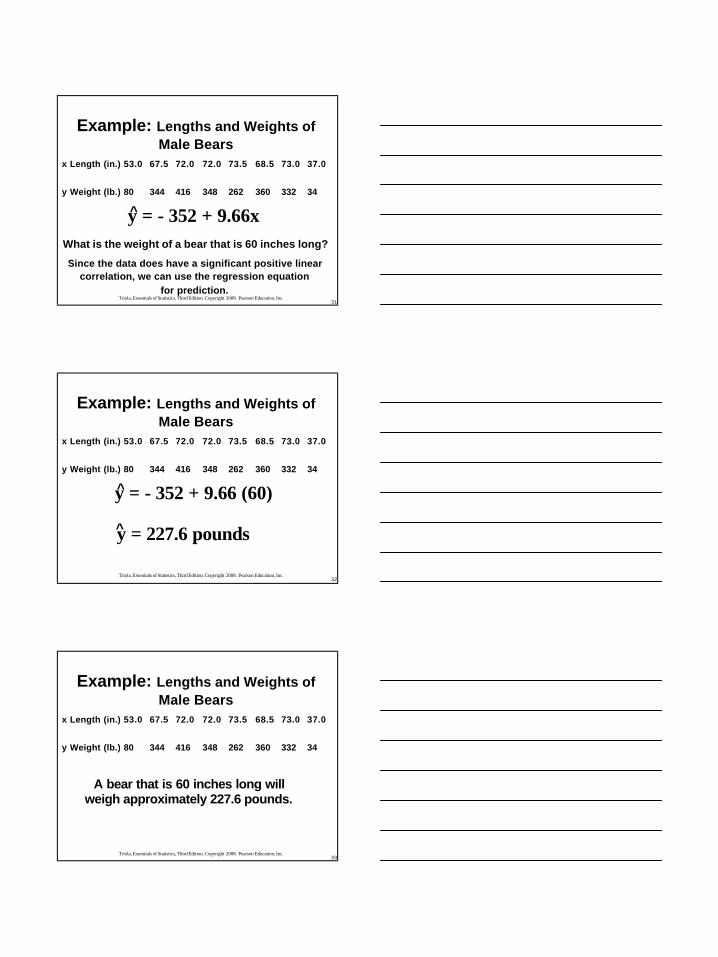
Example: Example: Lengths and Weights of Lengths and Weights of Male BearsMale Bears
y = y = -- 352 + 9.66x352 + 9.66x^̂
x Length (in.)x Length (in.) 53.053.0 67.567.5 72.072.0 72.072.0 73.573.5 68.568.5 73.073.0 37.037.0
y Weight (lb.)y Weight (lb.) 8080 344344 416416 348348 262262 360360 332332 3434
What is the weight of a bear that is 60 inches long?What is the weight of a bear that is 60 inches long?
Since the data does have a significant positive linear Since the data does have a significant positive linear correlation, we can use the regression equation correlation, we can use the regression equation
for prediction.for prediction.
3232TriolaTriola, Essentials of Statistics, Third Edition. Copyright 2008. Pea, Essentials of Statistics, Third Edition. Copyright 2008. Pearson Education, Inc.rson Education, Inc.
Example: Example: Lengths and Weights of Lengths and Weights of Male BearsMale Bears
y = y = -- 352 + 9.66 352 + 9.66 (60)(60)^̂
x Length (in.)x Length (in.) 53.053.0 67.567.5 72.072.0 72.072.0 73.573.5 68.568.5 73.073.0 37.037.0
y Weight (lb.)y Weight (lb.) 8080 344344 416416 348348 262262 360360 332332 3434
y = 227.6 poundsy = 227.6 pounds^̂
3333TriolaTriola, Essentials of Statistics, Third Edition. Copyright 2008. Pea, Essentials of Statistics, Third Edition. Copyright 2008. Pearson Education, Inc.rson Education, Inc.
Example: Example: Lengths and Weights of Lengths and Weights of Male BearsMale Bears
x Length (in.)x Length (in.) 53.053.0 67.567.5 72.072.0 72.072.0 73.573.5 68.568.5 73.073.0 37.037.0
y Weight (lb.)y Weight (lb.) 8080 344344 416416 348348 262262 360360 332332 3434
A bear that is 60 inches long will A bear that is 60 inches long will weigh approximately 227.6 pounds.weigh approximately 227.6 pounds.
3434TriolaTriola, Essentials of Statistics, Third Edition. Copyright 2008. Pea, Essentials of Statistics, Third Edition. Copyright 2008. Pearson Education, Inc.rson Education, Inc.
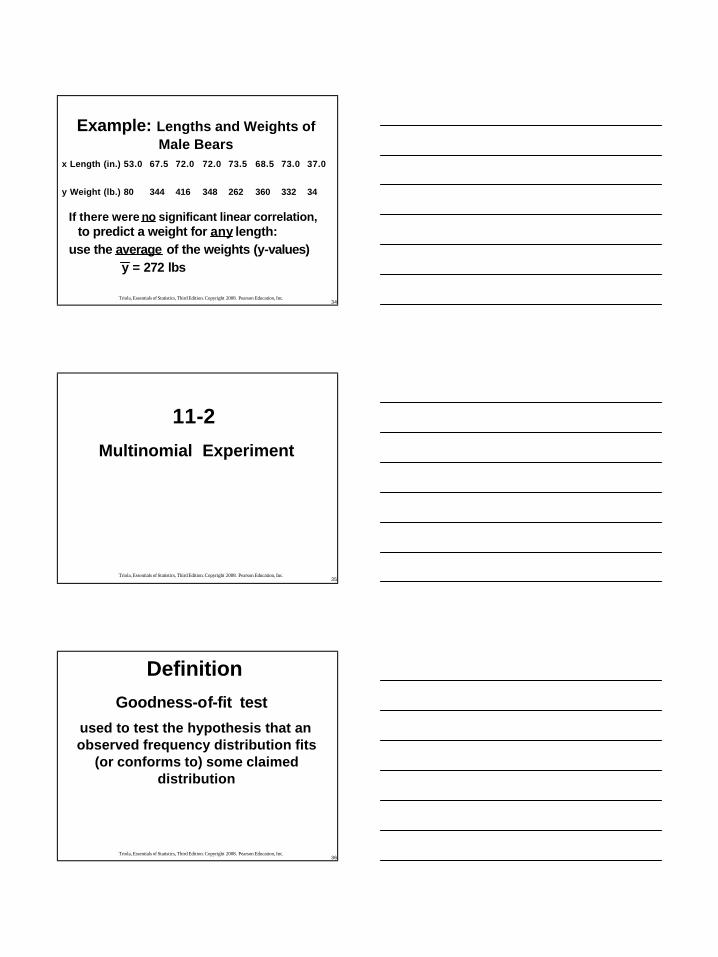
Example: Example: Lengths and Weights of Lengths and Weights of Male BearsMale Bears
x Length (in.)x Length (in.) 53.053.0 67.567.5 72.072.0 72.072.0 73.573.5 68.568.5 73.073.0 37.037.0
y Weight (lb.)y Weight (lb.) 8080 344344 416416 348348 262262 360360 332332 3434
If there were If there were nono significant linear correlation,significant linear correlation,to predict a weight for to predict a weight for anyany length:length:
use the use the averageaverage of the weights (yof the weights (y--values)values)y = 272 lbsy = 272 lbs
3535TriolaTriola, Essentials of Statistics, Third Edition. Copyright 2008. Pea, Essentials of Statistics, Third Edition. Copyright 2008. Pearson Education, Inc.rson Education, Inc.
Multinomial ExperimentMultinomial Experiment
11-2
3636TriolaTriola, Essentials of Statistics, Third Edition. Copyright 2008. Pea, Essentials of Statistics, Third Edition. Copyright 2008. Pearson Education, Inc.rson Education, Inc.
DefinitionDefinition
GoodnessGoodness--ofof--fit testfit test
used to test the hypothesis that an used to test the hypothesis that an observed frequency distribution fits observed frequency distribution fits
(or conforms to) some claimed (or conforms to) some claimed distributiondistribution
3737TriolaTriola, Essentials of Statistics, Third Edition. Copyright 2008. Pea, Essentials of Statistics, Third Edition. Copyright 2008. Pearson Education, Inc.rson Education, Inc.
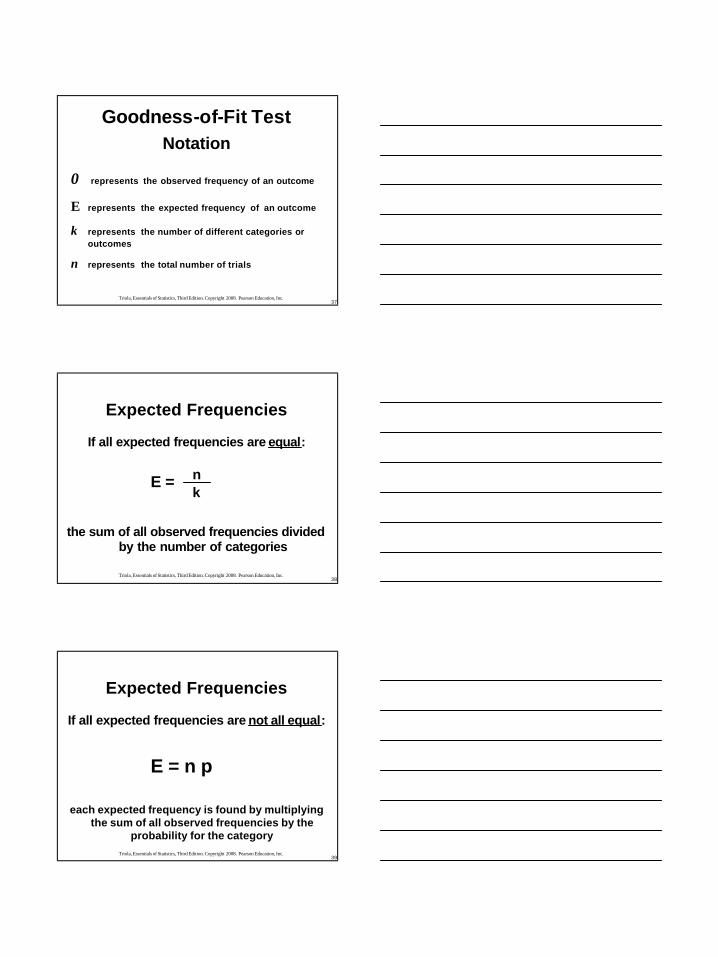
00 represents the represents the observed frequencyobserved frequency of an outcomeof an outcome
EE represents the represents the expected frequencyexpected frequency of an outcomeof an outcome
kk represents the represents the number of different categoriesnumber of different categories or or outcomesoutcomes
nn represents the total represents the total number of trialsnumber of trials
GoodnessGoodness--ofof--Fit TestFit TestNotationNotation
3838TriolaTriola, Essentials of Statistics, Third Edition. Copyright 2008. Pea, Essentials of Statistics, Third Edition. Copyright 2008. Pearson Education, Inc.rson Education, Inc.
Expected FrequenciesExpected Frequencies
If all expected frequencies are If all expected frequencies are equalequal::
the sum of all observed frequencies divided the sum of all observed frequencies divided by the number of categoriesby the number of categories
nnE =E =kk
3939TriolaTriola, Essentials of Statistics, Third Edition. Copyright 2008. Pea, Essentials of Statistics, Third Edition. Copyright 2008. Pearson Education, Inc.rson Education, Inc.
Expected FrequenciesExpected Frequencies
If all expected frequencies are If all expected frequencies are not all equalnot all equal::
each expected frequency is found by multiplying each expected frequency is found by multiplying the sum of all observed frequencies by the the sum of all observed frequencies by the
probability for the categoryprobability for the category
E = n pE = n p
4040TriolaTriola, Essentials of Statistics, Third Edition. Copyright 2008. Pea, Essentials of Statistics, Third Edition. Copyright 2008. Pearson Education, Inc.rson Education, Inc.
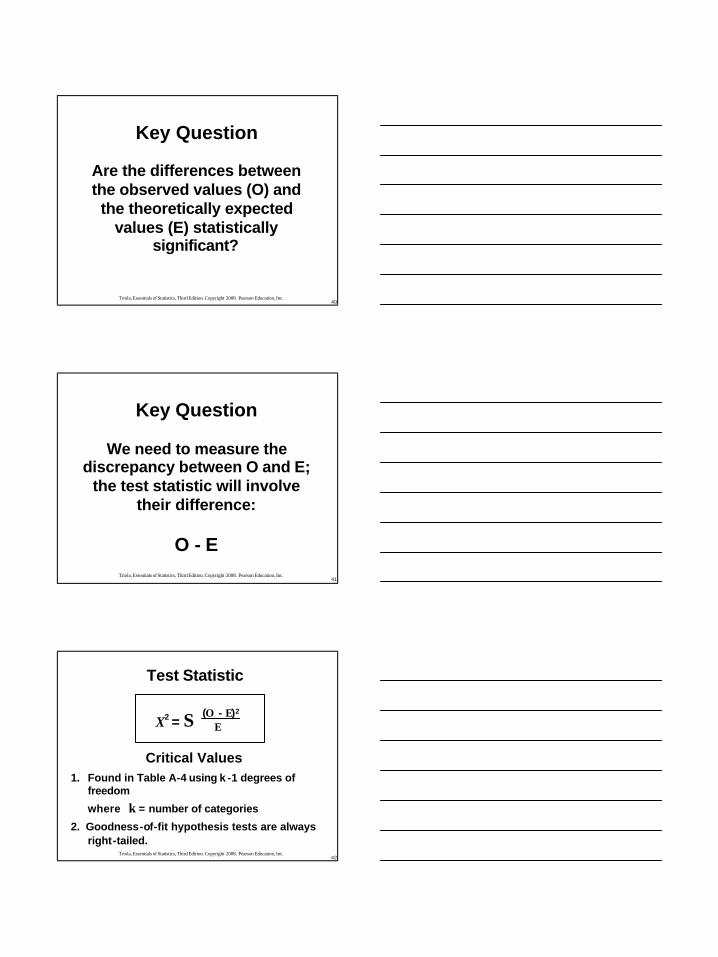
Key Question Key Question
Are the differences between Are the differences between the observed values (O) and the observed values (O) and
the theoretically expected the theoretically expected values (E) statistically values (E) statistically
significant?significant?
4141TriolaTriola, Essentials of Statistics, Third Edition. Copyright 2008. Pea, Essentials of Statistics, Third Edition. Copyright 2008. Pearson Education, Inc.rson Education, Inc.
Key QuestionKey Question
We need to measure the We need to measure the discrepancy between O and E; discrepancy between O and E;
the test statistic will involve the test statistic will involve their difference: their difference:
O O -- EE
4242TriolaTriola, Essentials of Statistics, Third Edition. Copyright 2008. Pea, Essentials of Statistics, Third Edition. Copyright 2008. Pearson Education, Inc.rson Education, Inc.
Test StatisticTest Statistic
Critical ValuesCritical Values1. 1. Found in Table AFound in Table A--4 using k4 using k --1 degrees of 1 degrees of
freedomfreedom
where where kk == number of categoriesnumber of categories
2. Goodness2. Goodness--ofof--fit hypothesis tests are always fit hypothesis tests are always rightright--tailed.tailed.
X2 = Σ (O - E)2
E

4343TriolaTriola, Essentials of Statistics, Third Edition. Copyright 2008. Pea, Essentials of Statistics, Third Edition. Copyright 2008. Pearson Education, Inc.rson Education, Inc.
HH00:: No difference between No difference between
observed and expected observed and expected probabilitiesprobabilities
HH11:: at least one of the at least one of the probabilities is different probabilities is different from the othersfrom the others
Multinomial Experiment: Multinomial Experiment: GoodnessGoodness--ofof--Fit TestFit Test
4444TriolaTriola, Essentials of Statistics, Third Edition. Copyright 2008. Pea, Essentials of Statistics, Third Edition. Copyright 2008. Pearson Education, Inc.rson Education, Inc.
Categories with Categories with EqualEqualFrequenciesFrequencies
HH00: : pp
11= = pp
22= = pp
33= . . . = = . . . = pp
kk
HH11: at least one of the probabilities is : at least one of the probabilities is different from the othersdifferent from the others
(Probabilities)(Probabilities)
4545TriolaTriola, Essentials of Statistics, Third Edition. Copyright 2008. Pea, Essentials of Statistics, Third Edition. Copyright 2008. Pearson Education, Inc.rson Education, Inc.
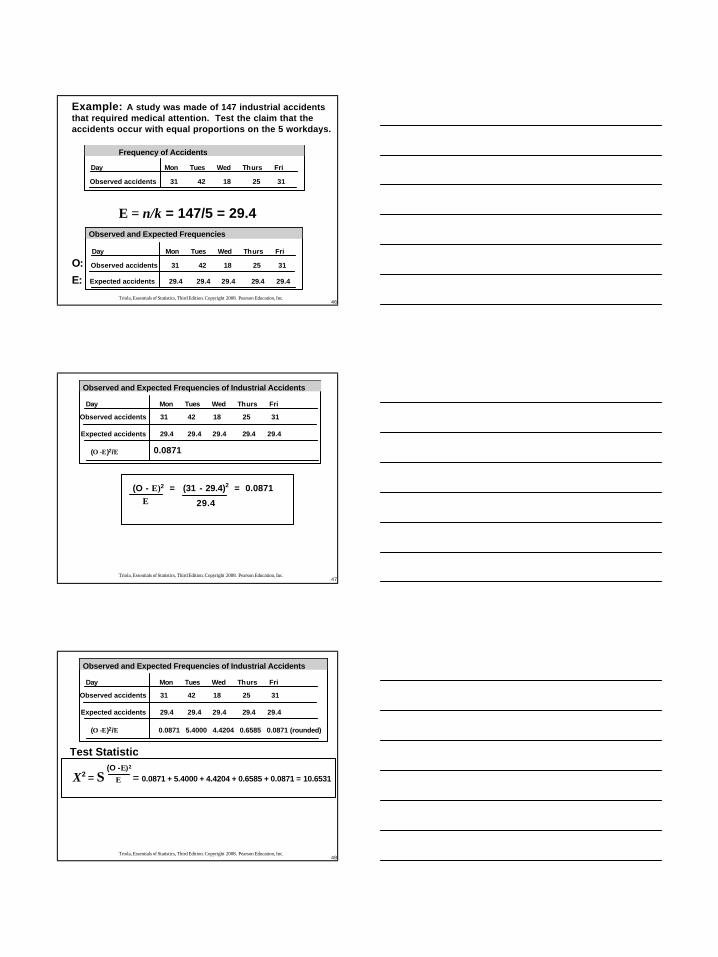
Example:Example: A study was made of 147 industrial accidents A study was made of 147 industrial accidents that required medical attention. Test the claim that the that required medical attention. Test the claim that the accidents occur with equal proportions on the 5 workdays.accidents occur with equal proportions on the 5 workdays.
Day Mon Tues Wed Thurs Fri
Observed accidents 31 42 18 25 31
Frequency of Accidents
Claim: Claim: Accidents occur with the same proportion Accidents occur with the same proportion (frequency); that is, (frequency); that is, pp11 = = pp22 = = pp33 = = pp44 = = pp55
HH00: : pp11 = = pp22 = = pp33 = = pp44 == pp55
HH11: : At least 1 of the 5 proportions is different from At least 1 of the 5 proportions is different from othersothers
4646TriolaTriola, Essentials of Statistics, Third Edition. Copyright 2008. Pea, Essentials of Statistics, Third Edition. Copyright 2008. Pearson Education, Inc.rson Education, Inc.
E = E = n/kn/k = 147/5 = 29.4= 147/5 = 29.4
Example:Example: A study was made of 147 industrial accidents A study was made of 147 industrial accidents that required medical attention. Test the claim that the that required medical attention. Test the claim that the accidents occur with equal proportions on the 5 workdays.accidents occur with equal proportions on the 5 workdays.
Day Mon Tues Wed Thurs Fri
Observed accidents 31 42 18 25 31
Frequency of Accidents
Day Mon Tues Wed Thurs Fri
Observed accidents 31 42 18 25 31
Observed and Expected Frequencies
Expected accidents 29.4 29.4 29.4 29.4 29.4
O:O:
E:E:
4747TriolaTriola, Essentials of Statistics, Third Edition. Copyright 2008. Pea, Essentials of Statistics, Third Edition. Copyright 2008. Pearson Education, Inc.rson Education, Inc.
Day Mon Tues Wed Thurs Fri
Observed accidents 31 42 18 25 31
Observed and Expected Frequencies of Industrial Accidents
Expected accidents 29.4 29.4 29.4 29.4 29.4
((O O --EE))22//EE
(O - E)2 = (31 - 29.4)2 = 0.08710.0871E 29.4
0.08710.0871
4848TriolaTriola, Essentials of Statistics, Third Edition. Copyright 2008. Pea, Essentials of Statistics, Third Edition. Copyright 2008. Pearson Education, Inc.rson Education, Inc.
Day Mon Tues Wed Thurs Fri
Observed accidents 31 42 18 25 31
Observed and Expected Frequencies of Industrial Accidents
Expected accidents 29.4 29.4 29.4 29.4 29.4
((O O --EE))22//EE 0.0871 5.4000 4.4204 0.6585 0.0871 (0.0871 5.4000 4.4204 0.6585 0.0871 (rounded) rounded)
XX22 = = ΣΣ == 0.0871 + 5.4000 + 4.4204 + 0.6585 + 0.08710.0871 + 5.4000 + 4.4204 + 0.6585 + 0.0871 == 10.653110.6531(O -E)2
E
Test StatisticTest Statistic

4949TriolaTriola, Essentials of Statistics, Third Edition. Copyright 2008. Pea, Essentials of Statistics, Third Edition. Copyright 2008. Pearson Education, Inc.rson Education, Inc.
Day Mon Tues Wed Thurs Fri
Observed accidents 31 42 18 25 31
Observed and Expected Frequencies of Industrial Accidents
Expected accidents 29.4 29.4 29.4 29.4 29.4
((O O --EE))22//EE 0.0871 5.4000 4.4204 0.6585 0.0871 (0.0871 5.4000 4.4204 0.6585 0.0871 (rounded) rounded)
X2 = Σ = 0.0871 + 5.4000 + 4.4204 + 0.6585 + 0.0871 = 10.6531(O -E)2
E
Test Statistic:Test Statistic:
Critical Value:Critical Value:XX22 = 9.488 = 9.488
Table ATable A--4 with 4 with kk--1 = 5 1 = 5 --1 = 41 = 4and and αα = 0.05= 0.05
5050TriolaTriola, Essentials of Statistics, Third Edition. Copyright 2008. Pea, Essentials of Statistics, Third Edition. Copyright 2008. Pearson Education, Inc.rson Education, Inc.
0
Sample data: X2 = 10.653
α = 0.05
Fail to Rejectp1 = p2 = p3 = p4 =
p5
Rejectp1 = p2 = p3 = p4 =
p5
X2 = 9.488
Test Statistic falls Test Statistic falls withinwithin the critical region: REJECT the null hypothesisthe critical region: REJECT the null hypothesisClaim:Claim: Accidents occur with the same proportion (frequency); Accidents occur with the same proportion (frequency);
that is, that is, pp11 = = pp22 = = pp33 = = pp44 = = pp55
HH00:: pp11 = = pp22 = = pp33 = = pp44 == pp55
HH11:: At least 1 of the 5 proportions is different from othersAt least 1 of the 5 proportions is different from others
5151TriolaTriola, Essentials of Statistics, Third Edition. Copyright 2008. Pea, Essentials of Statistics, Third Edition. Copyright 2008. Pearson Education, Inc.rson Education, Inc.
0
Sample data: X2 = 10.653
α = 0.05
Fail to Rejectp1 = p2 = p3 = p4 =
p5
Rejectp1 = p2 = p3 = p4 =
p5
Test Statistic falls Test Statistic falls withinwithin the critical region: REJECT the null hypothesisthe critical region: REJECT the null hypothesis
X2 = 9.488
We reject claim that the accidents occur with equal proportions We reject claim that the accidents occur with equal proportions (frequency) on the 5 workdays. (Although it appears Wednesday (frequency) on the 5 workdays. (Although it appears Wednesday has a lower accident rate, arriving at such a conclusion would has a lower accident rate, arriving at such a conclusion would require other methods of analysis.)require other methods of analysis.)
5252TriolaTriola, Essentials of Statistics, Third Edition. Copyright 2008. Pea, Essentials of Statistics, Third Edition. Copyright 2008. Pearson Education, Inc.rson Education, Inc.
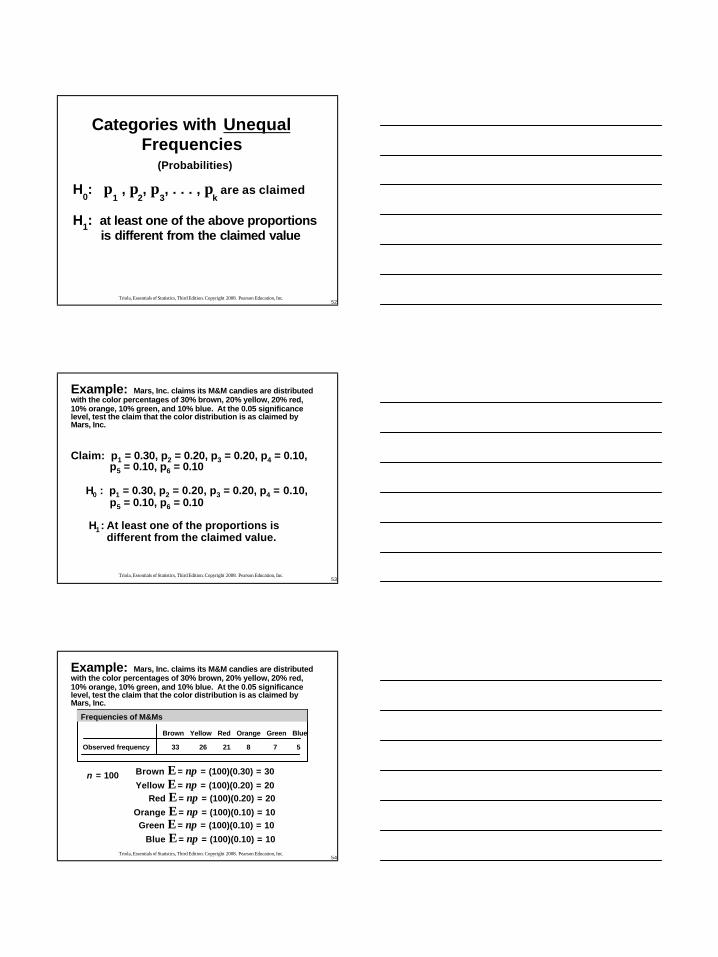
HH00: : pp
11, , pp
22, , pp
33, . . . , , . . . , pp
kkare as claimedare as claimed
HH11: : at least one of the above proportions at least one of the above proportions is different from the claimed valueis different from the claimed value
Categories with Categories with UnequalUnequalFrequenciesFrequencies
(Probabilities)
5353TriolaTriola, Essentials of Statistics, Third Edition. Copyright 2008. Pea, Essentials of Statistics, Third Edition. Copyright 2008. Pearson Education, Inc.rson Education, Inc.
Example:Example: Mars, Inc. claims its M&M candies are distributed Mars, Inc. claims its M&M candies are distributed with the color percentages of 30% brown, 20% yellow, 20% red, with the color percentages of 30% brown, 20% yellow, 20% red, 10% orange, 10% green, and 10% blue. At the 0.05 significance 10% orange, 10% green, and 10% blue. At the 0.05 significance level, test the claim that the color distribution is as claimed level, test the claim that the color distribution is as claimed by by Mars, Inc. Mars, Inc.
Claim: pClaim: p11 = 0.30, p= 0.30, p22 = 0.20, p= 0.20, p33 = 0.20, p= 0.20, p44 = 0.10, = 0.10, pp55 = 0.10, p= 0.10, p66 = 0.10= 0.10
HH00 : p: p11 = 0.30, p= 0.30, p22 = 0.20, p= 0.20, p33 = 0.20, p= 0.20, p44 = 0.10, = 0.10, pp55 = 0.10, p= 0.10, p66 = 0.10= 0.10
HH11 :: At least one of the proportions is At least one of the proportions is different from the claimed value.different from the claimed value.
5454TriolaTriola, Essentials of Statistics, Third Edition. Copyright 2008. Pea, Essentials of Statistics, Third Edition. Copyright 2008. Pearson Education, Inc.rson Education, Inc.
Brown Yellow Red Orange Green Blue
Observed frequency 33 26 21 8 7 5
Frequencies of M&Ms
Brown Brown EE== npnp = (100)(0.30) = 30= (100)(0.30) = 30
Yellow Yellow EE== npnp = (100)(0.20) = 20= (100)(0.20) = 20Red Red EE== npnp = (100)(0.20) = 20= (100)(0.20) = 20
Orange Orange EE== npnp = (100)(0.10) = 10= (100)(0.10) = 10Green Green EE== npnp = (100)(0.10) = 10= (100)(0.10) = 10
Blue Blue EE== npnp = (100)(0.10) = 10= (100)(0.10) = 10
nn = 100= 100
Example:Example: Mars, Inc. claims its M&M candies are distributed Mars, Inc. claims its M&M candies are distributed with the color percentages of 30% brown, 20% yellow, 20% red, with the color percentages of 30% brown, 20% yellow, 20% red, 10% orange, 10% green, and 10% blue. At the 0.05 significance 10% orange, 10% green, and 10% blue. At the 0.05 significance level, test the claim that the color distribution is as claimed level, test the claim that the color distribution is as claimed by by Mars, Inc. Mars, Inc.
5555TriolaTriola, Essentials of Statistics, Third Edition. Copyright 2008. Pea, Essentials of Statistics, Third Edition. Copyright 2008. Pearson Education, Inc.rson Education, Inc.
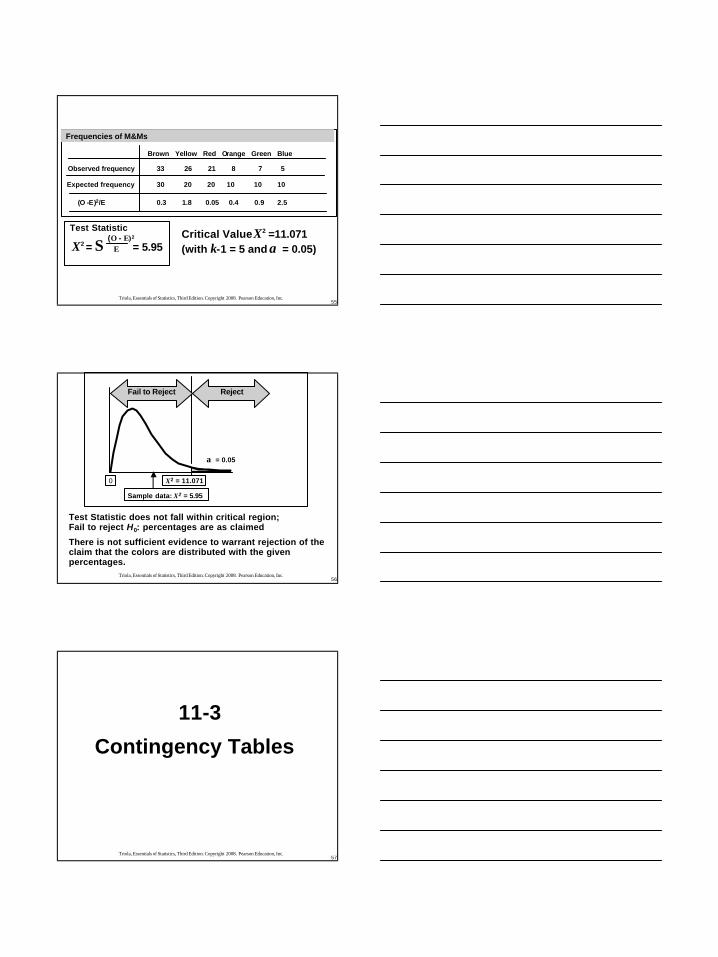
Brown Yellow Red Orange Green Blue
Observed frequency 33 26 21 8 7 5
Frequencies of M&Ms
Expected frequency 30 20 20 10 10 10
(O -E)2/E 0.3 1.8 0.05 0.4 0.9 2.5
X2 = Σ = 5.95(O - E)2
E
Test StatisticCritical Value Critical Value XX22 =11.071 =11.071 (with (with kk--1 = 5 and 1 = 5 and αα = 0.05)= 0.05)
5656TriolaTriola, Essentials of Statistics, Third Edition. Copyright 2008. Pea, Essentials of Statistics, Third Edition. Copyright 2008. Pearson Education, Inc.rson Education, Inc.
Test Statistic does not fall within critical region; Fail to reject H0: percentages are as claimed
There is not sufficient evidence to warrant rejection of the claim that the colors are distributed with the given percentages.
0
Sample data: X2 = 5.95
α = 0.05
X2 = 11.071
Fail to Reject Reject
5757TriolaTriola, Essentials of Statistics, Third Edition. Copyright 2008. Pea, Essentials of Statistics, Third Edition. Copyright 2008. Pearson Education, Inc.rson Education, Inc.
Contingency TablesContingency Tables
1111--33

5858TriolaTriola, Essentials of Statistics, Third Edition. Copyright 2008. Pea, Essentials of Statistics, Third Edition. Copyright 2008. Pearson Education, Inc.rson Education, Inc.
DefinitionDefinition
vv Contingency Table Contingency Table (or two(or two --way frequency table)way frequency table)
a table in which frequencies a table in which frequencies correspond to two variables. correspond to two variables.
(One variable is used to categorize rows, (One variable is used to categorize rows, and a second variable is used to and a second variable is used to categorize columns.)categorize columns.)
Contingency tables have Contingency tables have at least at least two two rows and at least two columns.rows and at least two columns.
5959TriolaTriola, Essentials of Statistics, Third Edition. Copyright 2008. Pea, Essentials of Statistics, Third Edition. Copyright 2008. Pearson Education, Inc.rson Education, Inc.
vv Test of IndependenceTest of Independencetests the null hypothesis that there is tests the null hypothesis that there is no association between the row no association between the row variable and the column variable.variable and the column variable.
(The null hypothesis is the statement (The null hypothesis is the statement that the row and column variables are that the row and column variables are independentindependent.).)
DefinitionDefinition
6060TriolaTriola, Essentials of Statistics, Third Edition. Copyright 2008. Pea, Essentials of Statistics, Third Edition. Copyright 2008. Pearson Education, Inc.rson Education, Inc.
Tests of IndependenceTests of IndependenceHH00 : The row variable is independent of the : The row variable is independent of the
column variablecolumn variable
HH11 : The row variable is dependent (related to) : The row variable is dependent (related to) the column variablethe column variable
This procedure cannot be used to establish a This procedure cannot be used to establish a direct causedirect cause--andand--effect link between variables in effect link between variables in question.question.
Dependence means only there is a Dependence means only there is a relationshiprelationshipbetween the two variables.between the two variables.
6161TriolaTriola, Essentials of Statistics, Third Edition. Copyright 2008. Pea, Essentials of Statistics, Third Edition. Copyright 2008. Pearson Education, Inc.rson Education, Inc.
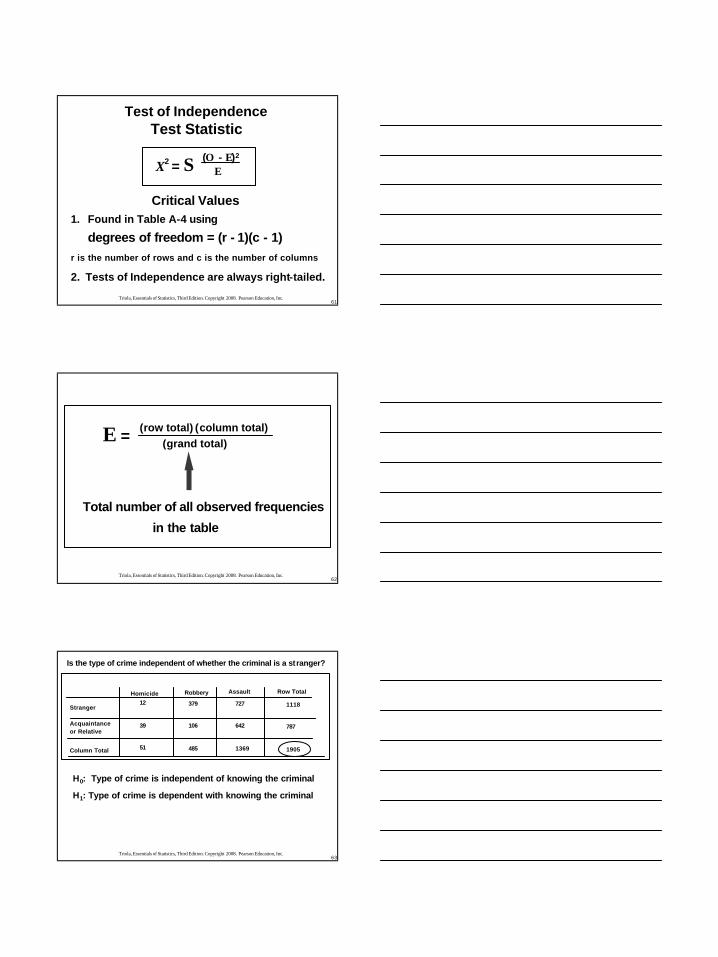
Test of IndependenceTest of IndependenceTest Statistic Test Statistic
Critical ValuesCritical Values1. 1. Found in Table AFound in Table A--4 using4 using
degrees of freedom = (r degrees of freedom = (r -- 1)(c 1)(c -- 1)1)r is the number of rows and c is the number of columnsr is the number of rows and c is the number of columns
2. Tests of Independence are always right2. Tests of Independence are always right--tailed.tailed.
X2 = Σ (O - E)2
E
6262TriolaTriola, Essentials of Statistics, Third Edition. Copyright 2008. Pea, Essentials of Statistics, Third Edition. Copyright 2008. Pearson Education, Inc.rson Education, Inc.
(row total) (column total)(grand total)E =
Total number of all observed frequencies
in the table
6363TriolaTriola, Essentials of Statistics, Third Edition. Copyright 2008. Pea, Essentials of Statistics, Third Edition. Copyright 2008. Pearson Education, Inc.rson Education, Inc.
Row Total
Column Total
Stranger
Acquaintanceor Relative
Homicide Robbery Assault
Is the type of crime independent of whether the criminal is a stIs the type of crime independent of whether the criminal is a stranger? ranger?
1118
787
1905
12
39
51
379
106
485
727
642
1369
HH00: Type of crime is independent of knowing the criminal: Type of crime is independent of knowing the criminal
HH11: Type of crime is dependent with knowing the criminal: Type of crime is dependent with knowing the criminal
6464TriolaTriola, Essentials of Statistics, Third Edition. Copyright 2008. Pea, Essentials of Statistics, Third Edition. Copyright 2008. Pearson Education, Inc.rson Education, Inc.
Row Total
(29.93)
(21.07)
(284.64)
(200.36)
(803.43)
(565.57)
Column Total
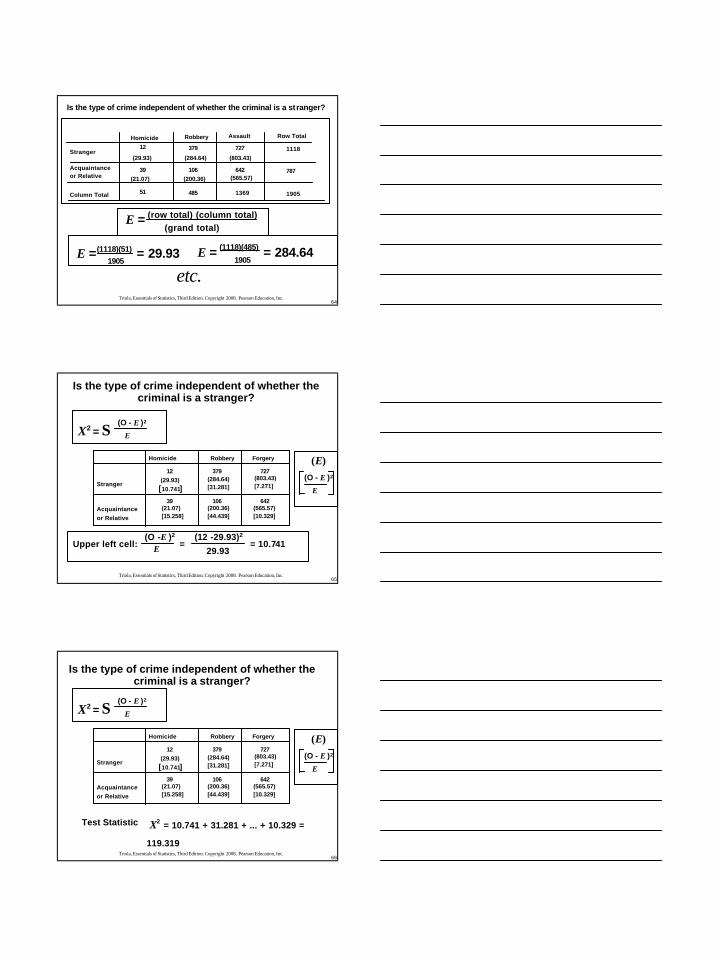
E = (row total) (column total)(grand total)
E = (1118)(51)1905
= 29.93 E = (1118)(485)
1905= 284.64
etc.etc.
Stranger
Acquaintanceor Relative
Homicide Robbery Assault
Is the type of crime independent of whether the criminal is a stIs the type of crime independent of whether the criminal is a stranger? ranger?
1118
787
1905
12
39
51
379
106
485
727
642
1369
6565TriolaTriola, Essentials of Statistics, Third Edition. Copyright 2008. Pea, Essentials of Statistics, Third Edition. Copyright 2008. Pearson Education, Inc.rson Education, Inc.
12
39
379
106
727
642
Homicide Robbery Forgery
(29.93)
(21.07)[15.258]
(284.64)[31.281]
(200.36)[44.439]
(803.43)[7.271]
(565.57)[10.329]
[10.741]Stranger
Acquaintanceor Relative
X2 = Σ(O - E )2
E
(O -E )2
EUpper left cell: = = 10.741(12 -29.93)2
29.93
(E)(O - E )2
E
Is the type of crime independent of whether the Is the type of crime independent of whether the criminal is a stranger? criminal is a stranger?
6666TriolaTriola, Essentials of Statistics, Third Edition. Copyright 2008. Pea, Essentials of Statistics, Third Edition. Copyright 2008. Pearson Education, Inc.rson Education, Inc.
12
39
379
106
727
642
Homicide Robbery Forgery
(29.93)
(21.07)[15.258]
(284.64)[31.281]
(200.36)[44.439]
(803.43)[7.271]
(565.57)[10.329]
[10.741]Stranger
Acquaintanceor Relative
X2 = Σ(O - E )2
E
(E)(O - E )2
E
Is the type of crime independent of whether the Is the type of crime independent of whether the criminal is a stranger? criminal is a stranger?
Test Statistic Test Statistic XX22 = 10.741 + 31.281 + ... + 10.329 = = 10.741 + 31.281 + ... + 10.329 =
119.319119.319

6767TriolaTriola, Essentials of Statistics, Third Edition. Copyright 2008. Pea, Essentials of Statistics, Third Edition. Copyright 2008. Pearson Education, Inc.rson Education, Inc.
0
α = 0.05
X2 = 5.991
RejectIndependence
Reject independence
Sample data: X2 =119.319
Fail to RejectIndependence
HHoo : The type of crime and knowing the criminal are independent : The type of crime and knowing the criminal are independent HH11 : The type of crime and knowing the criminal are dependent: The type of crime and knowing the criminal are dependent
Test Statistic: Test Statistic: XX22 == 119.319119.319
with with αα = 0.05 and= 0.05 and ((r r --1) (1) (cc --1) = (2 1) = (2 --1) (3 1) (3 --1) = 21) = 2 degrees of freedomdegrees of freedom
Critical Value:Critical Value:XX22 == 5.991 (from Table A5.991 (from Table A--4)4)
6868TriolaTriola, Essentials of Statistics, Third Edition. Copyright 2008. Pea, Essentials of Statistics, Third Edition. Copyright 2008. Pearson Education, Inc.rson Education, Inc.
It appears that the type of crime and It appears that the type of crime and knowing the criminal are related. knowing the criminal are related.
0
α = 0.05
X2 = 5.991
RejectIndependence
Test Statistic: Test Statistic: XX22 == 119.319119.319
with with αα = 0.05 and= 0.05 and ((r r --1) (1) (cc --1) = (2 1) = (2 --1) (3 1) (3 --1) = 21) = 2 degrees of freedomdegrees of freedom
Critical Value:Critical Value:XX22 == 5.991 (from Table A5.991 (from Table A--4)4)
Reject independence
Sample data: X2 =119.319
Fail to RejectIndependence
6969TriolaTriola, Essentials of Statistics, Third Edition. Copyright 2008. Pea, Essentials of Statistics, Third Edition. Copyright 2008. Pearson Education, Inc.rson Education, Inc.
DefinitionDefinitionTest of HomogeneityTest of Homogeneity
tests the claim that tests the claim that different populations different populations have the samehave the same proportions of some proportions of some characteristicscharacteristics
7070TriolaTriola, Essentials of Statistics, Third Edition. Copyright 2008. Pea, Essentials of Statistics, Third Edition. Copyright 2008. Pearson Education, Inc.rson Education, Inc.
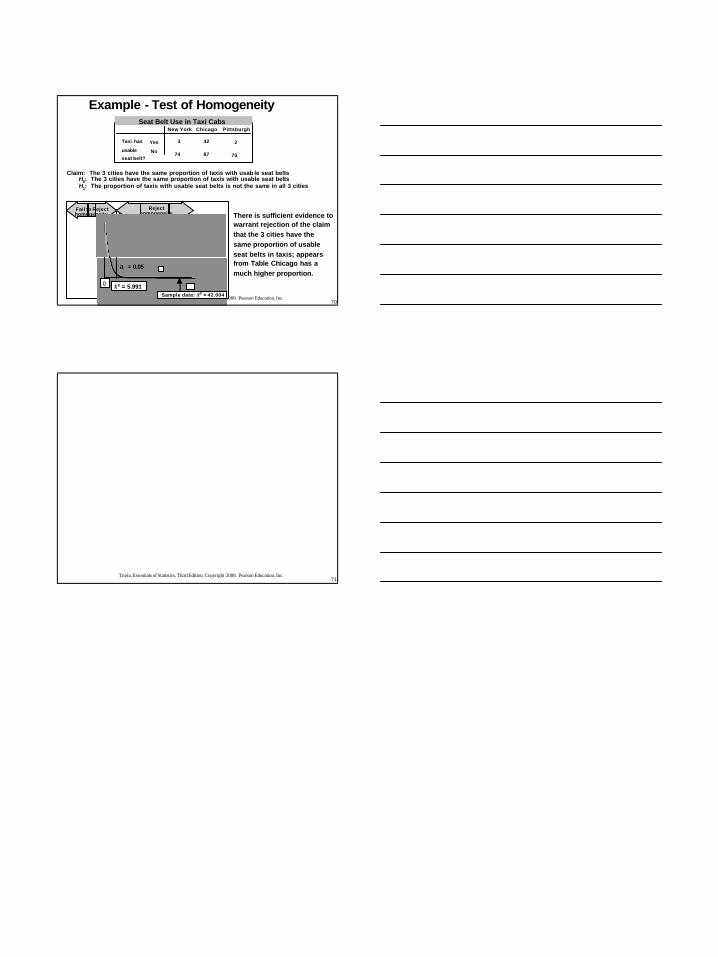
Example Example -- Test of HomogeneityTest of Homogeneity
3
74
Taxi has
usable
seat belt?
New York Chicago Pittsburgh
Yes
No
42
87
2
70
Seat Belt Use in Taxi Cabs
Claim: The 3 cities have the same proportion of taxis with usabClaim: The 3 cities have the same proportion of taxis with usab le seat beltsle seat beltsHH00: The 3 cities have the same proportion of taxis with usable se: The 3 cities have the same proportion of taxis with usable seat beltsat beltsHH11: The proportion of taxis with usable seat belts is not the sam: The proportion of taxis with usable seat belts is not the same in all 3 citiese in all 3 cities
0
Sample data: X2 = 42.004
α = 0.05
X2 = 5.991
Fail to Rejecthomogeneity
Rejecthomogeneity There is sufficient evidence to There is sufficient evidence to
warrant rejection of the claim warrant rejection of the claim that the 3 cities have the that the 3 cities have the same proportion of usable same proportion of usable seat belts in taxis; appears seat belts in taxis; appears from Table Chicago has a from Table Chicago has a much higher proportion. much higher proportion.
7171TriolaTriola, Essentials of Statistics, Third Edition. Copyright 2008. Pea, Essentials of Statistics, Third Edition. Copyright 2008. Pearson Education, Inc.rson Education, Inc.
Related Documents


![PELLISSIPPI PARKWAY EXTENSION (State Route 162) · 2017-10-19 · Parkway (State Route [SR] 162) in Blount County, Tennessee. The project begins at the current terminus of Pellissippi](https://static.cupdf.com/doc/110x72/5f52f4f637e1436be01ba203/pellissippi-parkway-extension-state-route-162-2017-10-19-parkway-state-route.jpg)