8. The Cooling Load 8.1 Describe a situation where the heat gain to the space is (a) greater than the cooling load at a given time; (b) less than the cooling load at a given time; (c) equal to the cooling load at a given time. Answer: Based on Fig. 8.2 (a) Heat gain to the space is greater than the cooling load at a given time at the first half of the usage or operation. (b) Heat gain to the space is less than the cooling load at a given time at the second half of the usage or operation. (c) Heat gain to the space is equal to the cooling load at a given time at the middle of the usage or operation. 8.2 Southern coastal regions of the United States experience periods of very high humidity. Explain how this might influence selection of design conditions. Answer: The very high humidity outside conditions influence the selection of inside design condition through selection of desired room relative humidity not at the lowest side of range that cause higher latent cooling load or a higher moisture content than indoor design conditions but at the highest side of humidity range. 8.3 Determine the ASHRAE Standard 90.1 design conditions for the following locations. Include the maximum outdoor temperature, the outdoor mean coincident wet bulb temperature, the indoor dry bulb temperature, the relative humidity, the elevation, and the latitude. (a) Washington, D.C., (b) San Francisco, California, (c) Denver, Colorado, (d) Dallas, Texas. Answer: (a) Washington, D.C. Maximum outdoor temperature = 95 F (35 C) Outdoor mean coincident wet bulb temperature = 76 F (25 C) Indoor dry bulb temperature = 75 F (24 C) Relative humidity = 50 % Elevation = 66 ft (20 m) Latitude = 38.85 deg (b) San Francisco, California Maximum outdoor temperature = 83 F (28 C) Outdoor mean coincident wet bulb temperature = 63 F (17 C) Indoor dry bulb temperature = 75 F (24 C) Relative humidity = 50 % Elevation = 16 ft (5 m) Latitude = 37.62 deg

Chapter_8
Dec 10, 2015
heating ventilating and air conditioning analysis and design Chapter_8 ans
Welcome message from author
This document is posted to help you gain knowledge. Please leave a comment to let me know what you think about it! Share it to your friends and learn new things together.
Transcript
8. The Cooling Load
8.1 Describe a situation where the heat gain to the space is (a) greater than the
cooling load at a given time; (b) less than the cooling load at a given time; (c)
equal to the cooling load at a given time.
Answer:
Based on Fig. 8.2
(a) Heat gain to the space is greater than the cooling load at a given time at the
first half of the usage or operation.
(b) Heat gain to the space is less than the cooling load at a given time at the
second half of the usage or operation.
(c) Heat gain to the space is equal to the cooling load at a given time at the middle
of the usage or operation.
8.2 Southern coastal regions of the United States experience periods of very high
humidity. Explain how this might influence selection of design conditions.
Answer:
The very high humidity outside conditions influence the selection of inside design
condition through selection of desired room relative humidity not at the lowest side of
range that cause higher latent cooling load or a higher moisture content than indoor
design conditions but at the highest side of humidity range.
8.3 Determine the ASHRAE Standard 90.1 design conditions for the following
locations. Include the maximum outdoor temperature, the outdoor mean
coincident wet bulb temperature, the indoor dry bulb temperature, the relative
humidity, the elevation, and the latitude. (a) Washington, D.C., (b) San
Francisco, California, (c) Denver, Colorado, (d) Dallas, Texas.
Answer:
(a) Washington, D.C.
Maximum outdoor temperature = 95 F (35 C)
Outdoor mean coincident wet bulb temperature = 76 F (25 C)
Indoor dry bulb temperature = 75 F (24 C)
Relative humidity = 50 %
Elevation = 66 ft (20 m)
Latitude = 38.85 deg
(b) San Francisco, California
Maximum outdoor temperature = 83 F (28 C)
Outdoor mean coincident wet bulb temperature = 63 F (17 C)
Indoor dry bulb temperature = 75 F (24 C)
Relative humidity = 50 %
Elevation = 16 ft (5 m)
Latitude = 37.62 deg
8. The Cooling Load
(c) Denver, Colorado
Maximum outdoor temperature = 93 F (34 C)
Outdoor mean coincident wet bulb temperature = 60 F (15 C)
Indoor dry bulb temperature = 75 F (24 C)
Relative humidity = 50 %
Elevation = 5331 ft (1625 m)
Latitude = 39.75 deg
(d) Dallas, Texas
Maximum outdoor temperature = 100 F (38 C)
Outdoor mean coincident wet bulb temperature = 74 F (24 C)
Indoor dry bulb temperature = 75 F (24 C)
Relative humidity = 50 %
Elevation = 597 ft (182 m)
Latitude = 32.90 deg
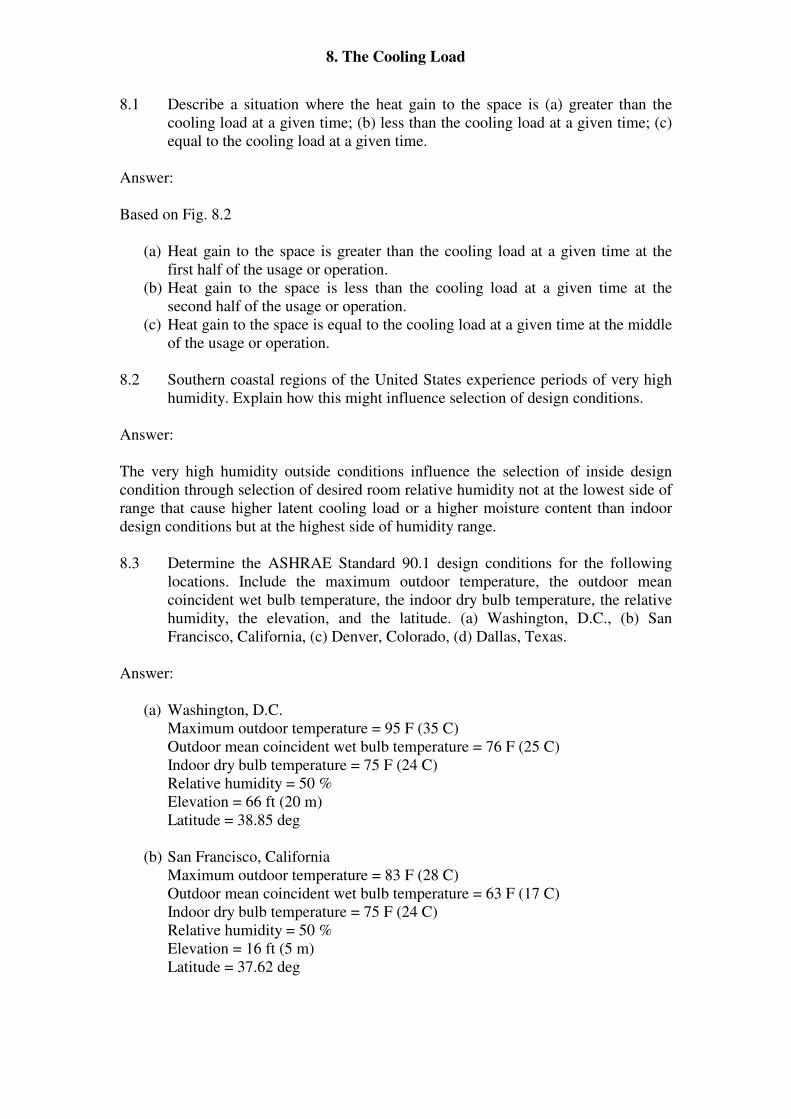
8.4 Determine the wall conduction transfer function coefficients for a wall
composed of 4 in. brick [k = 7 (Btu-in.)/(hr-ft2-F)], 1/2 in. plywood, 3 1/2 in.
mineral fiber insulation (R-11), and 1/2 in. gypsum board.
Solution:
Wall Layers (Table 5-4)
Layer Thickness, in Density, lb/ft3
Conductivity,
(Btu-in)/(hr-
ft2-F)
Specific Heat,
Brick 4 130 7 0.19
Plywood 0.5 34 0.8 0.29
Mineral fiber
insulation
(R-11)
3.5 1.2 0.3185 0.17
Gypsum board 0.5 50 1.11 0.26
CTF Coefficients (From PRF/RTF Generator)
n nX ,
Btu/(h-ft2-F)
nY ,
Btu/(h-ft2-F)
nZ ,
Btu/(h-ft2-F)
nΦ
0 4.033132292 0.001517739 0.623505633 0
1 -4.890102268 0.017652429 -0.943189491 0.643204868
2 0.893455637 0.010001789 0.358387909 -0.017086206
3 -0.006945024 0.000370798 -0.009166607 1.3166E-05
4 2.65956E-06 6.21048E-07 5.90198E-06 -1.31644E-09
5 -1.59894E-10 4.86714E-11 -2.45933E-10 1.12031E-14
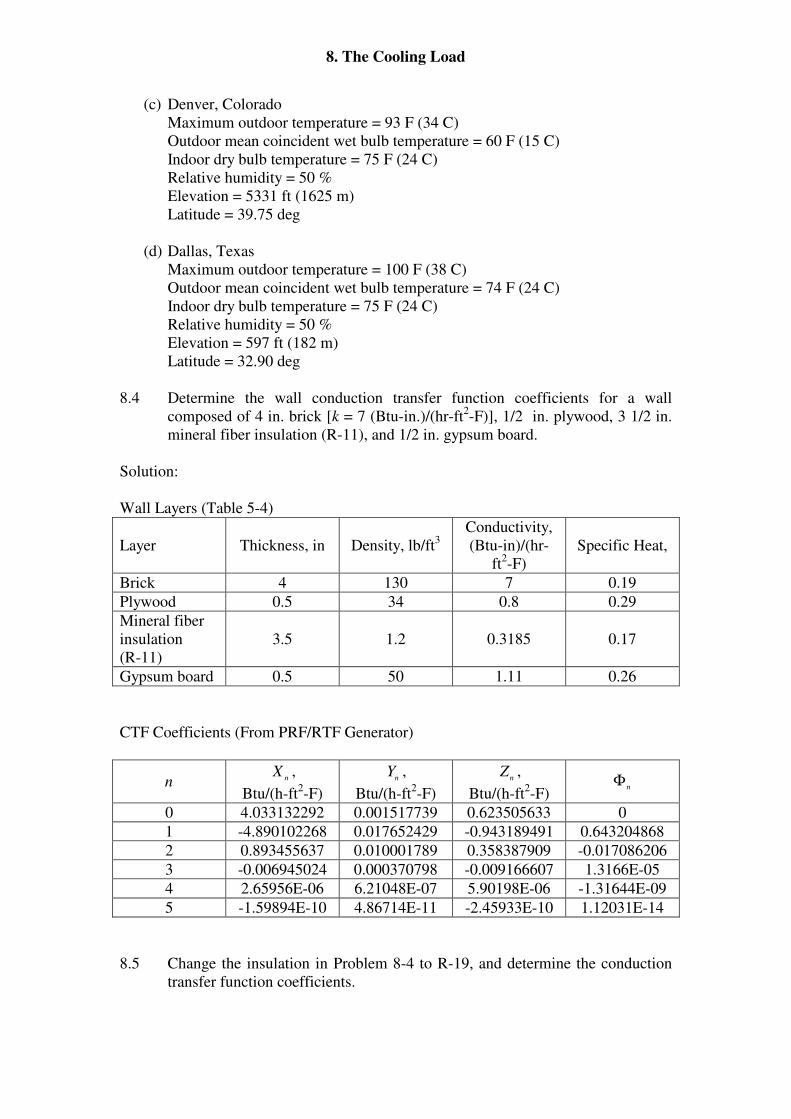
8.5 Change the insulation in Problem 8-4 to R-19, and determine the conduction
transfer function coefficients.
8. The Cooling Load
Solution:
Wall Layers (Table 5-4)
Layer Thickness, in Density, lb/ft3
Conductivity,
(Btu-in)/(hr-
ft2-F)
Specific Heat,
Brick 4 130 7 0.19
Plywood 0.5 34 0.8 0.29
Mineral fiber
insulation
(R-19)
6 1.2 0.3158 0.17
Gypsum board 0.5 50 1.11 0.26
CTF Coefficients (From PRF/RTF Generator)
n nX ,
Btu/(h-ft2-F)
nY ,
Btu/(h-ft2-F)
nZ ,
Btu/(h-ft2-F)
nΦ
0 4.033132964 0.000387523 0.611908143 0
1 -4.978563054 0.008315152 -0.968315133 0.66508466
2 0.982856227 0.008091923 0.388562266 -0.02728007
3 -0.019978162 0.000729205 -0.014736957 0.000228003
4 8.14087E-05 5.69043E-06 0.000111178 -9.35628E-08
5 -1.44779E-08 2.93347E-09 -3.98891E-08 4.13516E-12
6 4.33848E-13 8.69125E-14 6.47835E-13 -2.32896E-17
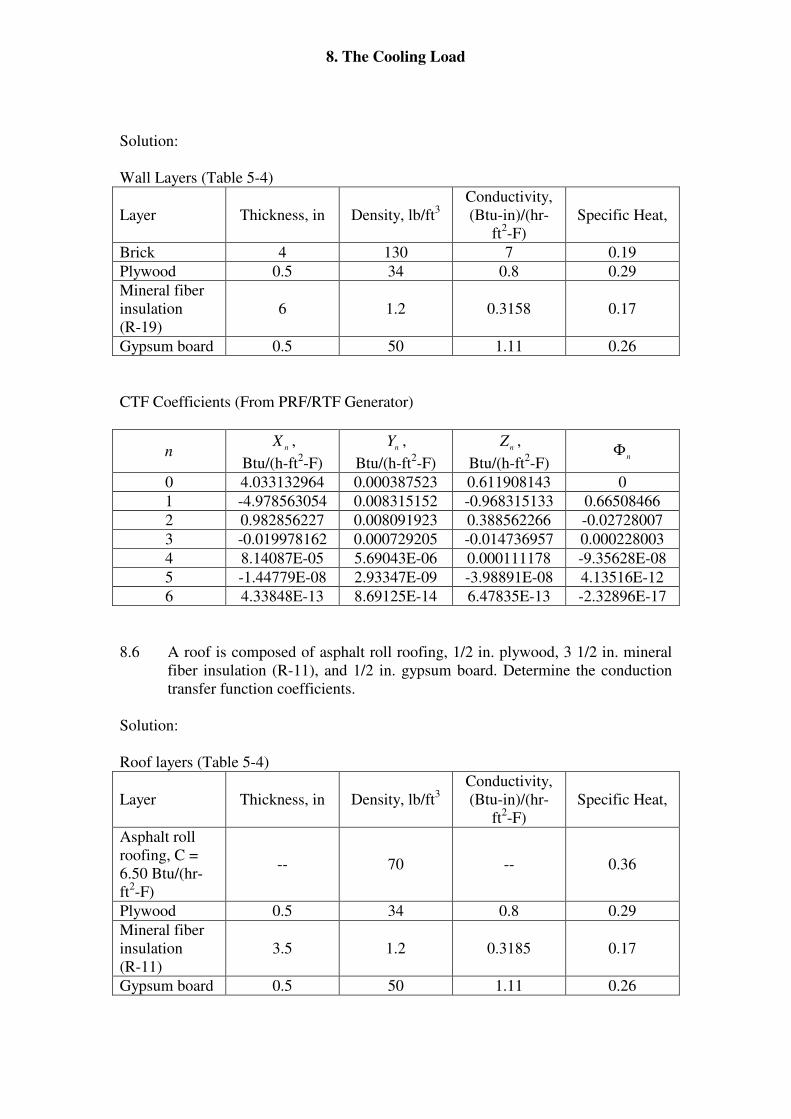
8.6 A roof is composed of asphalt roll roofing, 1/2 in. plywood, 3 1/2 in. mineral
fiber insulation (R-11), and 1/2 in. gypsum board. Determine the conduction
transfer function coefficients.
Solution:
Roof layers (Table 5-4)
Layer Thickness, in Density, lb/ft3
Conductivity,
(Btu-in)/(hr-
ft2-F)
Specific Heat,
Asphalt roll
roofing, C =
6.50 Btu/(hr-
ft2-F)
-- 70 -- 0.36
Plywood 0.5 34 0.8 0.29
Mineral fiber
insulation
(R-11)
3.5 1.2 0.3185 0.17
Gypsum board 0.5 50 1.11 0.26
8. The Cooling Load
CTF Coefficients (From PRF/RTF Generator)
n nX ,
Btu/(h-ft2-F)
nY ,
Btu/(h-ft2-F)
nZ ,
Btu/(h-ft2-F)
nΦ
0 0.479438185 0.046513387 0.623539389 0
1 -0.398071691 0.03488033 -0.543490526 0.003066927
2 0.000215969 0.000188726 0.00153361 -2.70423E-07
3 -1.13694E-08 4.98289E-09 -3.36675E-08 1.75447E-14
4 5.74319E-16 2.39706E-17 1.43501E-15 5.26759E-28
8.7 The roof of Problem 8-6 is changed to have a suspended ceiling with a 12 in.
air space above it. Determine the conduction transfer function coefficients.
Solution:
Roof layers (Table 5-4)
Layer Thickness, in Density, lb/ft3
Conductivity,
(Btu-in)/(hr-
ft2-F)
Specific Heat,
Asphalt roll
roofing, C =
6.50 Btu/(hr-
ft2-F)
-- 70 -- 0.36
Air Space
R=0.93 (F-ft2-
hr)/Btu
12 >3.5
Plywood 0.5 34 0.8 0.29
Mineral fiber
insulation
(R-11)
3.5 1.2 0.3185 0.17
Gypsum board 0.5 50 1.11 0.26
CTF Coefficients (From PRF/RTF Generator)
n nX ,
Btu/(h-ft2-F)
nY ,
Btu/(h-ft2-F)
nZ ,
Btu/(h-ft2-F)
nΦ
0 0.373706533 0.026229879 0.623038586 0
1 -0.308505531 0.038174505 -0.630432109 0.136813194
2 0.000527467 0.001323929 0.073124072 -1.60845E-05
3 -4.88864E-08 8.3104E-08 -2.15052E-06 1.88841E-12
4 4.50557E-15 1.14735E-15 1.54748E-13 4.57357E-21
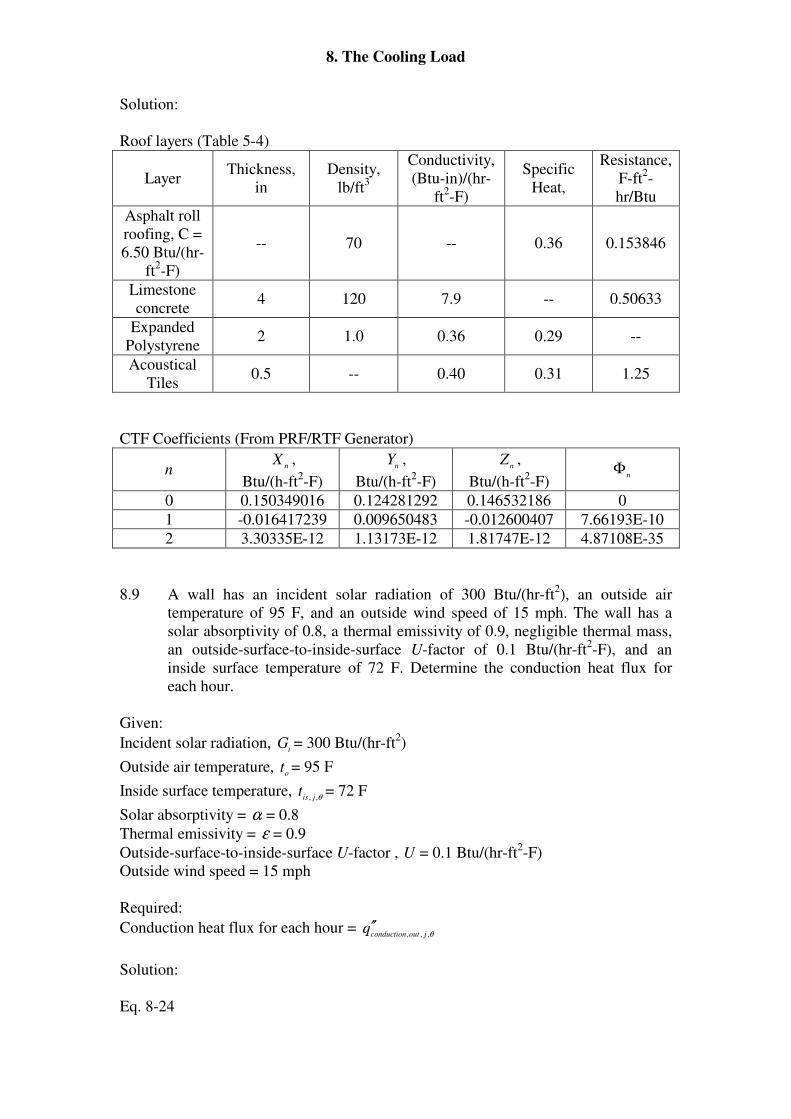
8.8 A roof is composed of asphalt roll roofing, 4 in. of 120 lb/ft3 limestone
concrete, 2 in. of expanded polystyrene, and 0.5 in. of acoustical tile.
Determine the conduction transfer function coefficients.
8. The Cooling Load
Solution:
Roof layers (Table 5-4)
Layer Thickness,
in
Density,
lb/ft3
Conductivity,
(Btu-in)/(hr-
ft2-F)
Specific
Heat,
Resistance,
F-ft2-
hr/Btu
Asphalt roll
roofing, C =
6.50 Btu/(hr-
ft2-F)
-- 70 -- 0.36 0.153846
Limestone
concrete 4 120 7.9 -- 0.50633
Expanded
Polystyrene 2 1.0 0.36 0.29 --
Acoustical
Tiles 0.5 -- 0.40 0.31 1.25
CTF Coefficients (From PRF/RTF Generator)
n nX ,
Btu/(h-ft2-F)
nY ,
Btu/(h-ft2-F)
nZ ,
Btu/(h-ft2-F)
nΦ
0 0.150349016 0.124281292 0.146532186 0
1 -0.016417239 0.009650483 -0.012600407 7.66193E-10
2 3.30335E-12 1.13173E-12 1.81747E-12 4.87108E-35
8.9 A wall has an incident solar radiation of 300 Btu/(hr-ft2), an outside air
temperature of 95 F, and an outside wind speed of 15 mph. The wall has a
solar absorptivity of 0.8, a thermal emissivity of 0.9, negligible thermal mass,
an outside-surface-to-inside-surface U-factor of 0.1 Btu/(hr-ft2-F), and an
inside surface temperature of 72 F. Determine the conduction heat flux for
each hour.
Given:
Incident solar radiation, t
G = 300 Btu/(hr-ft2)
Outside air temperature, o
t = 95 F
Inside surface temperature, θ,, jist = 72 F
Solar absorptivity = α = 0.8
Thermal emissivity = ε = 0.9
Outside-surface-to-inside-surface U-factor , U = 0.1 Btu/(hr-ft2-F)
Outside wind speed = 15 mph
Required:
Conduction heat flux for each hour = θ,,, joutconductionq ′′
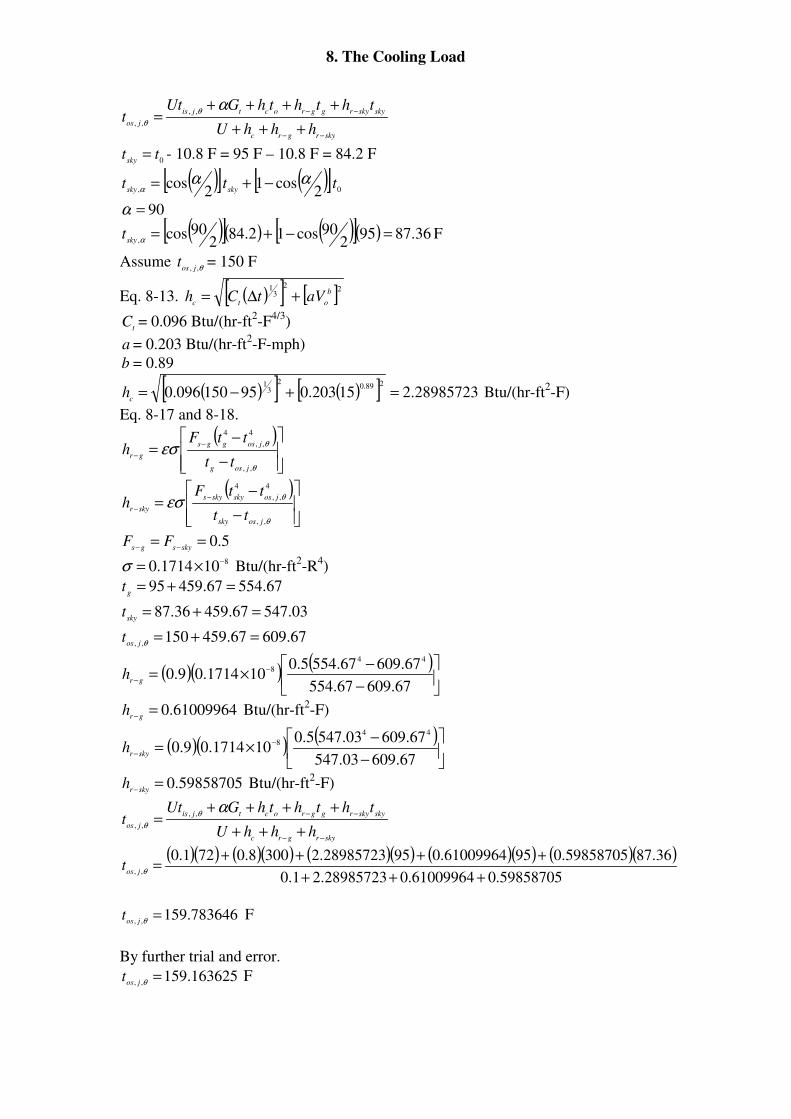
Solution:
Eq. 8-24
8. The Cooling Load
skyrgrc
skyskyrggroctjis
joshhhU
thththGUtt
−−
−−
+++
++++=
αθ
θ
,,
,,
0tt
sky= - 10.8 F = 95 F – 10.8 F = 84.2 F
( )[ ] ( )[ ]0, 2
cos12
cos tttskysky
ααα −+=
90=α
( )[ ]( ) ( )[ ]( ) 36.87952
90cos12.842
90cos,
=−+=αskyt F
Assume θ,, jost = 150 F
Eq. 8-13. ( )[ ] [ ]223
1 b
otcaVtCh +∆=
tC = 0.096 Btu/(hr-ft
2-F
4/3)
a = 0.203 Btu/(hr-ft2-F-mph)
b = 0.89
( )[ ] ( )[ ] 28985723.215203.095150096.0289.0
23
1
=+−=c
h Btu/(hr-ft2-F)
Eq. 8-17 and 8-18.
( )
−
−=
−
−
θ
θεσ,,
4
,,
4
josg
josggs
grtt
ttFh
( )
−
−=
−
−
θ
θεσ,,
4
,,
4
jossky
josskyskys
skyrtt
ttFh
5.0==−− skysgs
FF 8101714.0 −×=σ Btu/(hr-ft
2-R
4)
67.55467.45995 =+=g
t
03.54767.45936.87 =+=sky
t
67.60967.459150,,
=+=θjost
( )( ) ( )
−
−×= −
−67.60967.554
67.60967.5545.0101714.09.0
44
8
grh
61009964.0=−gr
h Btu/(hr-ft2-F)
( )( ) ( )
−
−×= −
−67.60903.547
67.60903.5475.0101714.09.0
44
8
skyrh
59858705.0=−skyr
h Btu/(hr-ft2-F)
skyrgrc
skyskyrggroctjis
joshhhU
thththGUtt
−−
−−
+++
++++=
αθ
θ
,,
,,
( )( ) ( )( ) ( )( ) ( )( ) ( )( )59858705.061009964.028985723.21.0
36.8759858705.09561009964.09528985723.23008.0721.0,,
+++
++++=
θjost
783646.159,,
=θjost F
By further trial and error.
163625.159,,
=θjost F
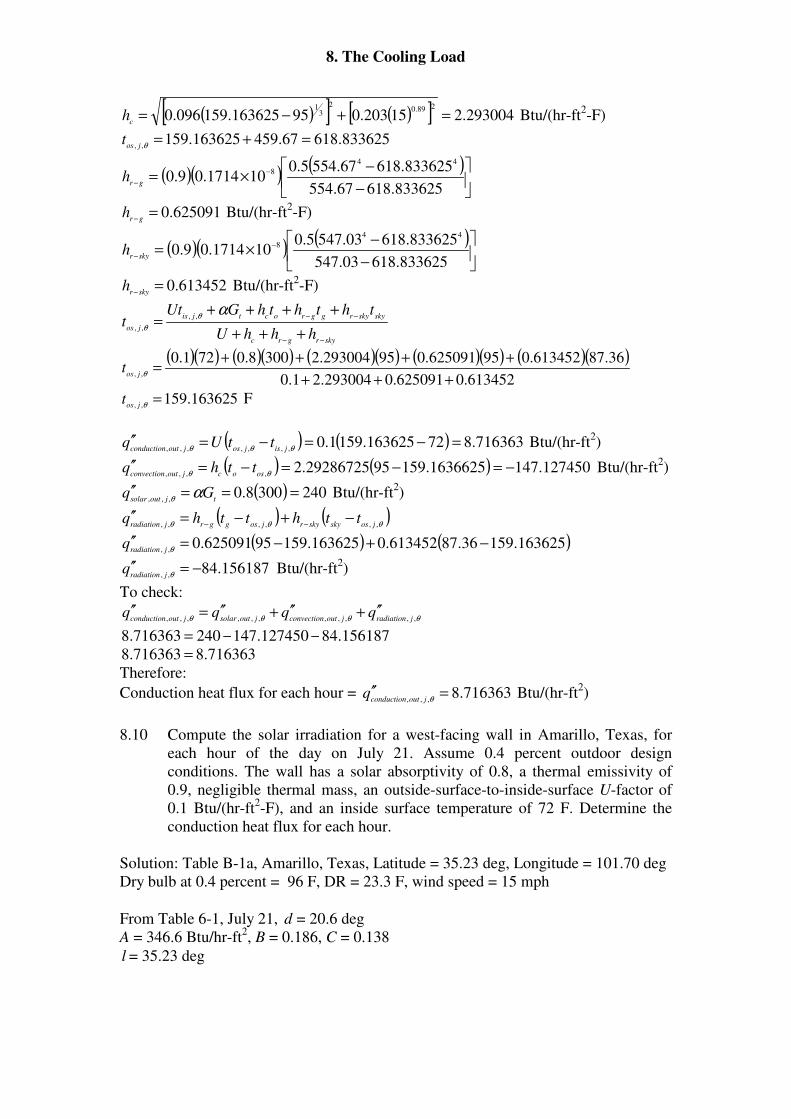
8. The Cooling Load
( )[ ] ( )[ ] 293004.215203.095163625.159096.0289.0
23
1
=+−=c
h Btu/(hr-ft2-F)
833625.61867.459163625.159,,
=+=θjost
( )( ) ( )
−
−×= −
−833625.61867.554
833625.61867.5545.0101714.09.0
44
8
grh
625091.0=−gr
h Btu/(hr-ft2-F)
( )( ) ( )
−
−×= −
−833625.61803.547
833625.61803.5475.0101714.09.0
44
8
skyrh
613452.0=−skyr
h Btu/(hr-ft2-F)
skyrgrc
skyskyrggroctjis
joshhhU
thththGUtt
−−
−−
+++
++++=
αθ
θ
,,
,,
( )( ) ( )( ) ( )( ) ( )( ) ( )( )613452.0625091.0293004.21.0
36.87613452.095625091.095293004.23008.0721.0,,
+++
++++=
θjost
163625.159,,
=θjost F
( ) ( ) 716363.872163625.1591.0,,,,,,,
=−=−=′′θθθ jisjosjoutconduction
ttUq Btu/(hr-ft2)
( ) ( ) 127450.1471636625.1599529286725.2,,,,
−=−=−=′′θθ osocjoutconvection
tthq Btu/(hr-ft2)
( ) 2403008.0,,,
===′′tjoutsolar
Gq αθ Btu/(hr-ft2)
( ) ( )θθθ ,,,,,, josskyskyrjosggrjradiation
tthtthq −+−=′′−−
( ) ( )163625.15936.87613452.0163625.15995625091.0,,
−+−=′′θjradiation
q
156187.84,,
−=′′θjradiation
q Btu/(hr-ft2)
To check:
θθθθ ,,,,,,,,,,, jradiationjoutconvectionjoutsolarjoutconductionqqqq ′′+′′+′′=′′
156187.84127450.147240716363.8 −−=
716363.8716363.8 =
Therefore:
Conduction heat flux for each hour = 716363.8,,,
=′′θjoutconduction
q Btu/(hr-ft2)
8.10 Compute the solar irradiation for a west-facing wall in Amarillo, Texas, for
each hour of the day on July 21. Assume 0.4 percent outdoor design
conditions. The wall has a solar absorptivity of 0.8, a thermal emissivity of
0.9, negligible thermal mass, an outside-surface-to-inside-surface U-factor of
0.1 Btu/(hr-ft2-F), and an inside surface temperature of 72 F. Determine the
conduction heat flux for each hour.
Solution: Table B-1a, Amarillo, Texas, Latitude = 35.23 deg, Longitude = 101.70 deg
Dry bulb at 0.4 percent = 96 F, DR = 23.3 F, wind speed = 15 mph
From Table 6-1, July 21, d = 20.6 deg
A = 346.6 Btu/hr-ft2, B = 0.186, C = 0.138
l = 35.23 deg
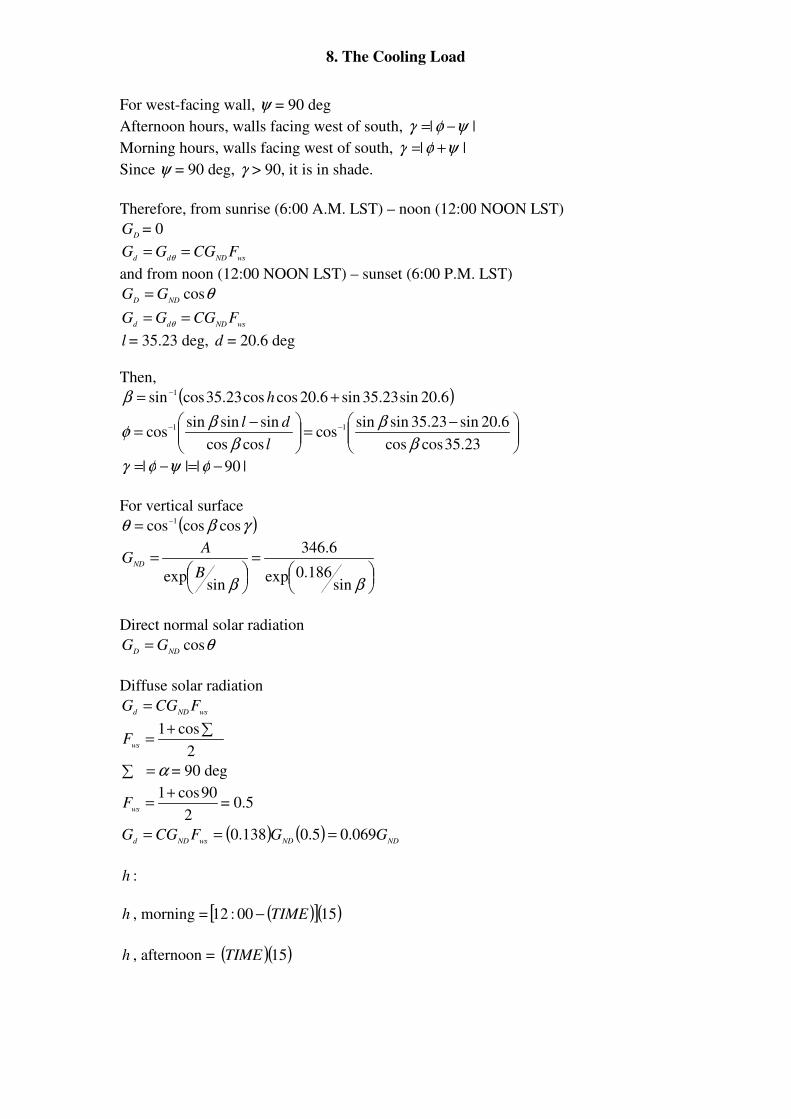
8. The Cooling Load
For west-facing wall, ψ = 90 deg
Afternoon hours, walls facing west of south, || ψφγ −=
Morning hours, walls facing west of south, || ψφγ +=
Since ψ = 90 deg, γ > 90, it is in shade.
Therefore, from sunrise (6:00 A.M. LST) – noon (12:00 NOON LST)
DG = 0
wsNDddFCGGG == θ
and from noon (12:00 NOON LST) – sunset (6:00 P.M. LST)
θcosNDD
GG =
wsNDddFCGGG == θ
l = 35.23 deg, d = 20.6 deg
Then,
( )6.20sin23.35sin6.20coscos23.35cossin 1 += −hβ
−=
−= −−
23.35coscos
6.20sin23.35sinsincos
coscos
sinsinsincos 11
β
β
β
βφ
l
dl
|90||| −=−= φψφγ
For vertical surface
( )γβθ coscoscos 1−=
=
=
ββ sin186.0exp
6.346
sinexp B
AG
ND
Direct normal solar radiation
θcosNDD
GG =
Diffuse solar radiation
wsNDdFCGG =
2
cos1 ∑+=
wsF
α=∑ = 90 deg
2
90cos1+=
wsF = 0.5
( ) ( )NDNDwsNDd
GGFCGG 069.05.0138.0 ===
h :
h , morning = ( )[ ]( )1500:12 TIME−
h , afternoon = ( )( )15TIME
8. The Cooling Load
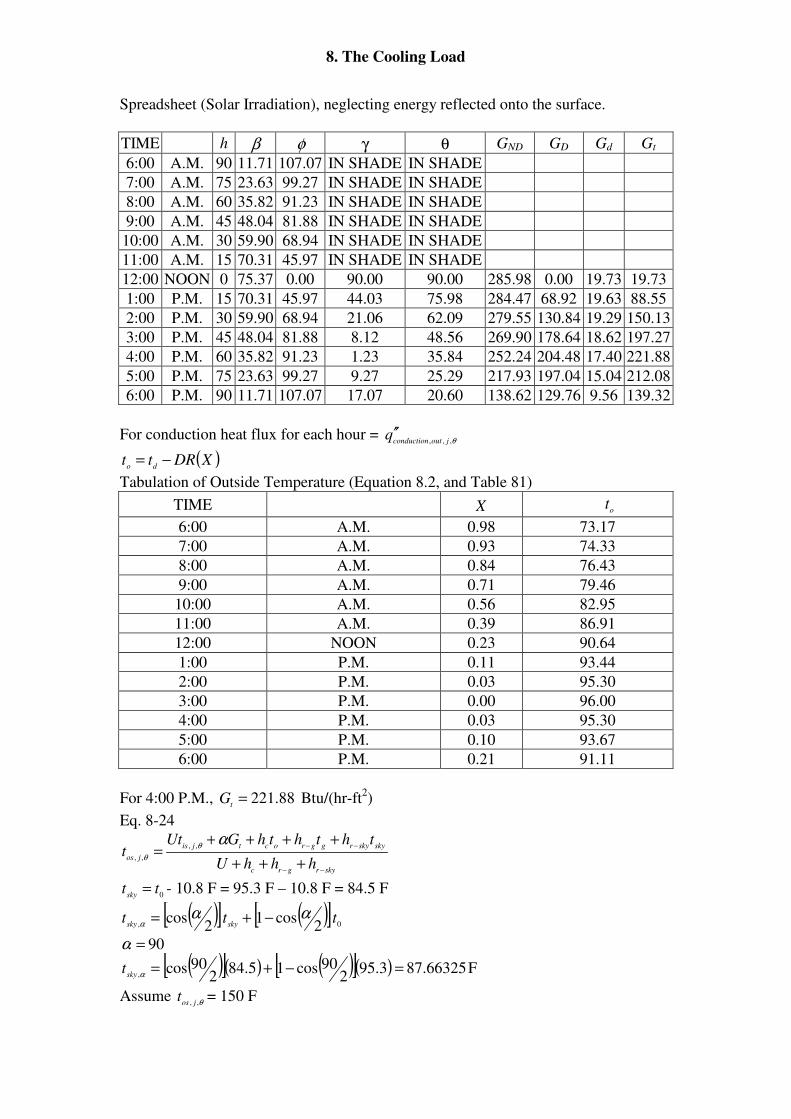
Spreadsheet (Solar Irradiation), neglecting energy reflected onto the surface.
TIME h β φ γ θ GND GD Gd Gt
6:00 A.M. 90 11.71 107.07 IN SHADE IN SHADE
7:00 A.M. 75 23.63 99.27 IN SHADE IN SHADE
8:00 A.M. 60 35.82 91.23 IN SHADE IN SHADE
9:00 A.M. 45 48.04 81.88 IN SHADE IN SHADE
10:00 A.M. 30 59.90 68.94 IN SHADE IN SHADE
11:00 A.M. 15 70.31 45.97 IN SHADE IN SHADE
12:00 NOON 0 75.37 0.00 90.00 90.00 285.98 0.00 19.73 19.73
1:00 P.M. 15 70.31 45.97 44.03 75.98 284.47 68.92 19.63 88.55
2:00 P.M. 30 59.90 68.94 21.06 62.09 279.55 130.84 19.29 150.13
3:00 P.M. 45 48.04 81.88 8.12 48.56 269.90 178.64 18.62 197.27
4:00 P.M. 60 35.82 91.23 1.23 35.84 252.24 204.48 17.40 221.88
5:00 P.M. 75 23.63 99.27 9.27 25.29 217.93 197.04 15.04 212.08
6:00 P.M. 90 11.71 107.07 17.07 20.60 138.62 129.76 9.56 139.32
For conduction heat flux for each hour = θ,,, joutconductionq ′′
( )XDRttdo
−=
Tabulation of Outside Temperature (Equation 8.2, and Table 81)
TIME X ot
6:00 A.M. 0.98 73.17
7:00 A.M. 0.93 74.33
8:00 A.M. 0.84 76.43
9:00 A.M. 0.71 79.46
10:00 A.M. 0.56 82.95
11:00 A.M. 0.39 86.91
12:00 NOON 0.23 90.64
1:00 P.M. 0.11 93.44
2:00 P.M. 0.03 95.30
3:00 P.M. 0.00 96.00
4:00 P.M. 0.03 95.30
5:00 P.M. 0.10 93.67
6:00 P.M. 0.21 91.11
For 4:00 P.M., 88.221=t
G Btu/(hr-ft2)
Eq. 8-24
skyrgrc
skyskyrggroctjis
joshhhU
thththGUtt
−−
−−
+++
++++=
αθ
θ
,,
,,
0tt
sky= - 10.8 F = 95.3 F – 10.8 F = 84.5 F
( )[ ] ( )[ ]0, 2
cos12
cos tttskysky
ααα −+=
90=α
( )[ ]( ) ( )[ ]( ) 66325.873.952
90cos15.842
90cos,
=−+=αskyt F
Assume θ,, jost = 150 F
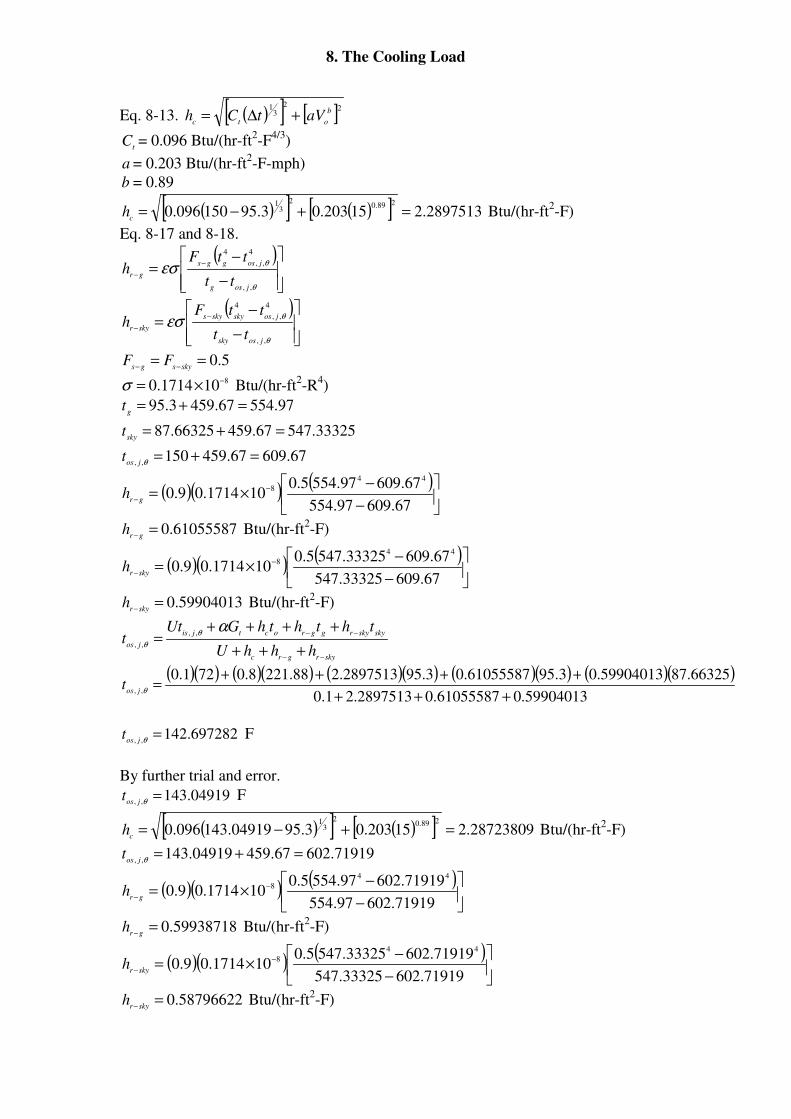
8. The Cooling Load
Eq. 8-13. ( )[ ] [ ]223
1 b
otcaVtCh +∆=
tC = 0.096 Btu/(hr-ft
2-F
4/3)
a = 0.203 Btu/(hr-ft2-F-mph)
b = 0.89
( )[ ] ( )[ ] 2897513.215203.03.95150096.0289.0
23
1
=+−=c
h Btu/(hr-ft2-F)
Eq. 8-17 and 8-18.
( )
−
−=
−
−
θ
θεσ,,
4
,,
4
josg
josggs
grtt
ttFh
( )
−
−=
−
−
θ
θεσ,,
4
,,
4
jossky
josskyskys
skyrtt
ttFh
5.0==−− skysgs
FF 8101714.0 −×=σ Btu/(hr-ft
2-R
4)
97.55467.4593.95 =+=g
t
33325.54767.45966325.87 =+=sky
t
67.60967.459150,,
=+=θjost
( )( ) ( )
−
−×= −
−67.60997.554
67.60997.5545.0101714.09.0
44
8
grh
61055587.0=−gr
h Btu/(hr-ft2-F)
( )( ) ( )
−
−×= −
−67.60933325.547
67.60933325.5475.0101714.09.0
44
8
skyrh
59904013.0=−skyr
h Btu/(hr-ft2-F)
skyrgrc
skyskyrggroctjis
joshhhU
thththGUtt
−−
−−
+++
++++=
αθ
θ
,,
,,
( )( ) ( )( ) ( )( ) ( )( ) ( )( )59904013.061055587.02897513.21.0
66325.8759904013.03.9561055587.03.952897513.288.2218.0721.0,,
+++
++++=
θjost
697282.142,,
=θjost F
By further trial and error.
04919.143,,
=θjost F
( )[ ] ( )[ ] 28723809.215203.03.9504919.143096.0289.0
23
1
=+−=c
h Btu/(hr-ft2-F)
71919.60267.45904919.143,,
=+=θjost
( )( ) ( )
−
−×= −
−71919.60297.554
71919.60297.5545.0101714.09.0
44
8
grh
59938718.0=−gr
h Btu/(hr-ft2-F)
( )( ) ( )
−
−×= −
−71919.60233325.547
71919.60233325.5475.0101714.09.0
44
8
skyrh
58796622.0=−skyr
h Btu/(hr-ft2-F)
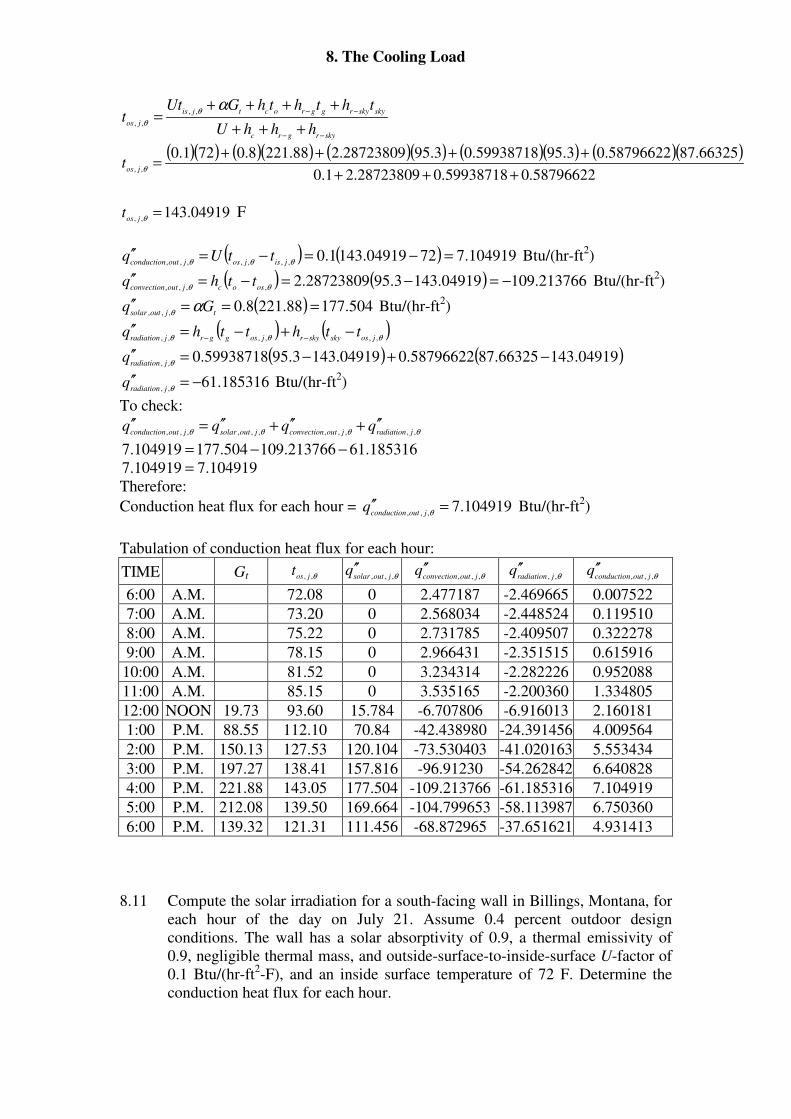
8. The Cooling Load
skyrgrc
skyskyrggroctjis
joshhhU
thththGUtt
−−
−−
+++
++++=
αθ
θ
,,
,,
( )( ) ( )( ) ( )( ) ( )( ) ( )( )58796622.059938718.028723809.21.0
66325.8758796622.03.9559938718.03.9528723809.288.2218.0721.0,,
+++
++++=
θjost
04919.143,,
=θjost F
( ) ( ) 104919.77204919.1431.0,,,,,,,
=−=−=′′θθθ jisjosjoutconduction
ttUq Btu/(hr-ft2)
( ) ( ) 213766.10904919.1433.9528723809.2,,,,
−=−=−=′′θθ osocjoutconvection
tthq Btu/(hr-ft2)
( ) 504.17788.2218.0,,,
===′′tjoutsolar
Gq αθ Btu/(hr-ft2)
( ) ( )θθθ ,,,,,, josskyskyrjosggrjradiation
tthtthq −+−=′′−−
( ) ( )04919.14366325.8758796622.004919.1433.9559938718.0,,
−+−=′′θjradiation
q
185316.61,,
−=′′θjradiation
q Btu/(hr-ft2)
To check:
θθθθ ,,,,,,,,,,, jradiationjoutconvectionjoutsolarjoutconductionqqqq ′′+′′+′′=′′
185316.61213766.109504.177104919.7 −−=
104919.7104919.7 =
Therefore:
Conduction heat flux for each hour = 104919.7,,,
=′′θjoutconduction
q Btu/(hr-ft2)
Tabulation of conduction heat flux for each hour:
TIME Gt θ,, jost
θ,,, joutsolarq ′′
θ,,, joutconvectionq ′′ θ,, jradiation
q ′′ θ,,, joutconductionq ′′
6:00 A.M. 72.08 0 2.477187 -2.469665 0.007522
7:00 A.M. 73.20 0 2.568034 -2.448524 0.119510
8:00 A.M. 75.22 0 2.731785 -2.409507 0.322278
9:00 A.M. 78.15 0 2.966431 -2.351515 0.615916
10:00 A.M. 81.52 0 3.234314 -2.282226 0.952088
11:00 A.M. 85.15 0 3.535165 -2.200360 1.334805
12:00 NOON 19.73 93.60 15.784 -6.707806 -6.916013 2.160181
1:00 P.M. 88.55 112.10 70.84 -42.438980 -24.391456 4.009564
2:00 P.M. 150.13 127.53 120.104 -73.530403 -41.020163 5.553434
3:00 P.M. 197.27 138.41 157.816 -96.91230 -54.262842 6.640828
4:00 P.M. 221.88 143.05 177.504 -109.213766 -61.185316 7.104919
5:00 P.M. 212.08 139.50 169.664 -104.799653 -58.113987 6.750360
6:00 P.M. 139.32 121.31 111.456 -68.872965 -37.651621 4.931413
8.11 Compute the solar irradiation for a south-facing wall in Billings, Montana, for
each hour of the day on July 21. Assume 0.4 percent outdoor design
conditions. The wall has a solar absorptivity of 0.9, a thermal emissivity of
0.9, negligible thermal mass, and outside-surface-to-inside-surface U-factor of
0.1 Btu/(hr-ft2-F), and an inside surface temperature of 72 F. Determine the
conduction heat flux for each hour.
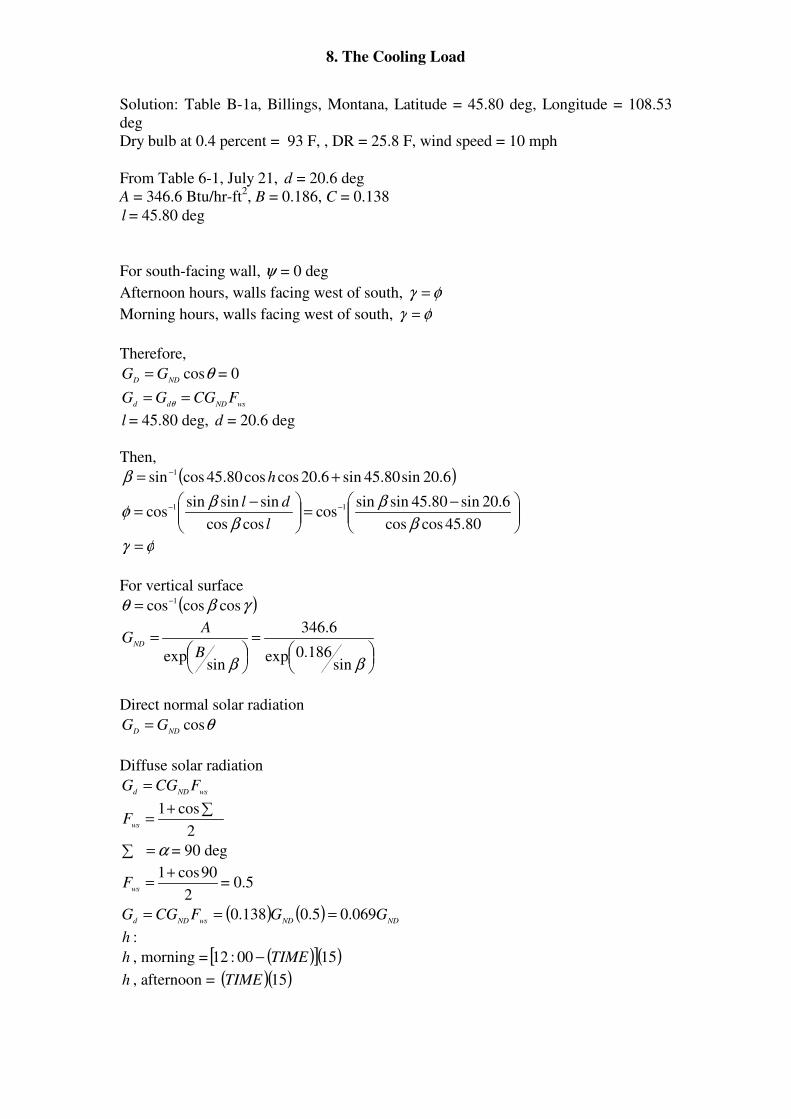
8. The Cooling Load
Solution: Table B-1a, Billings, Montana, Latitude = 45.80 deg, Longitude = 108.53
deg
Dry bulb at 0.4 percent = 93 F, , DR = 25.8 F, wind speed = 10 mph
From Table 6-1, July 21, d = 20.6 deg
A = 346.6 Btu/hr-ft2, B = 0.186, C = 0.138
l = 45.80 deg
For south-facing wall, ψ = 0 deg
Afternoon hours, walls facing west of south, φγ =
Morning hours, walls facing west of south, φγ =
Therefore,
θcosNDD
GG = = 0
wsNDddFCGGG == θ
l = 45.80 deg, d = 20.6 deg
Then,
( )6.20sin80.45sin6.20coscos80.45cossin 1 += −hβ
−=
−= −−
80.45coscos
6.20sin80.45sinsincos
coscos
sinsinsincos 11
β
β
β
βφ
l
dl
φγ =
For vertical surface
( )γβθ coscoscos 1−=
=
=
ββ sin186.0exp
6.346
sinexp B
AG
ND
Direct normal solar radiation
θcosNDD
GG =
Diffuse solar radiation
wsNDdFCGG =
2
cos1 ∑+=
wsF
α=∑ = 90 deg
2
90cos1+=
wsF = 0.5
( ) ( )NDNDwsNDd
GGFCGG 069.05.0138.0 ===
h :
h , morning = ( )[ ]( )1500:12 TIME−
h , afternoon = ( )( )15TIME
8. The Cooling Load
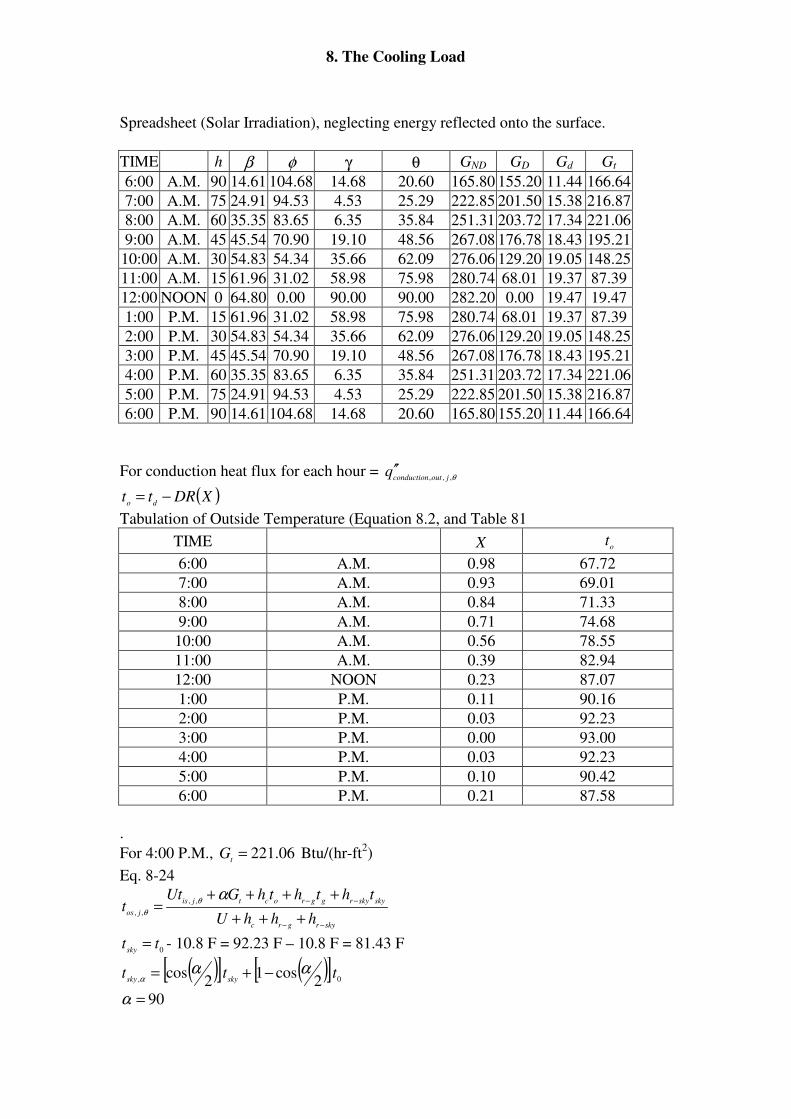
Spreadsheet (Solar Irradiation), neglecting energy reflected onto the surface.
TIME h β φ γ θ GND GD Gd Gt
6:00 A.M. 90 14.61 104.68 14.68 20.60 165.80 155.20 11.44 166.64
7:00 A.M. 75 24.91 94.53 4.53 25.29 222.85 201.50 15.38 216.87
8:00 A.M. 60 35.35 83.65 6.35 35.84 251.31 203.72 17.34 221.06
9:00 A.M. 45 45.54 70.90 19.10 48.56 267.08 176.78 18.43 195.21
10:00 A.M. 30 54.83 54.34 35.66 62.09 276.06 129.20 19.05 148.25
11:00 A.M. 15 61.96 31.02 58.98 75.98 280.74 68.01 19.37 87.39
12:00 NOON 0 64.80 0.00 90.00 90.00 282.20 0.00 19.47 19.47
1:00 P.M. 15 61.96 31.02 58.98 75.98 280.74 68.01 19.37 87.39
2:00 P.M. 30 54.83 54.34 35.66 62.09 276.06 129.20 19.05 148.25
3:00 P.M. 45 45.54 70.90 19.10 48.56 267.08 176.78 18.43 195.21
4:00 P.M. 60 35.35 83.65 6.35 35.84 251.31 203.72 17.34 221.06
5:00 P.M. 75 24.91 94.53 4.53 25.29 222.85 201.50 15.38 216.87
6:00 P.M. 90 14.61 104.68 14.68 20.60 165.80 155.20 11.44 166.64
For conduction heat flux for each hour = θ,,, joutconductionq ′′
( )XDRttdo
−=
Tabulation of Outside Temperature (Equation 8.2, and Table 81
TIME X ot
6:00 A.M. 0.98 67.72
7:00 A.M. 0.93 69.01
8:00 A.M. 0.84 71.33
9:00 A.M. 0.71 74.68
10:00 A.M. 0.56 78.55
11:00 A.M. 0.39 82.94
12:00 NOON 0.23 87.07
1:00 P.M. 0.11 90.16
2:00 P.M. 0.03 92.23
3:00 P.M. 0.00 93.00
4:00 P.M. 0.03 92.23
5:00 P.M. 0.10 90.42
6:00 P.M. 0.21 87.58
.
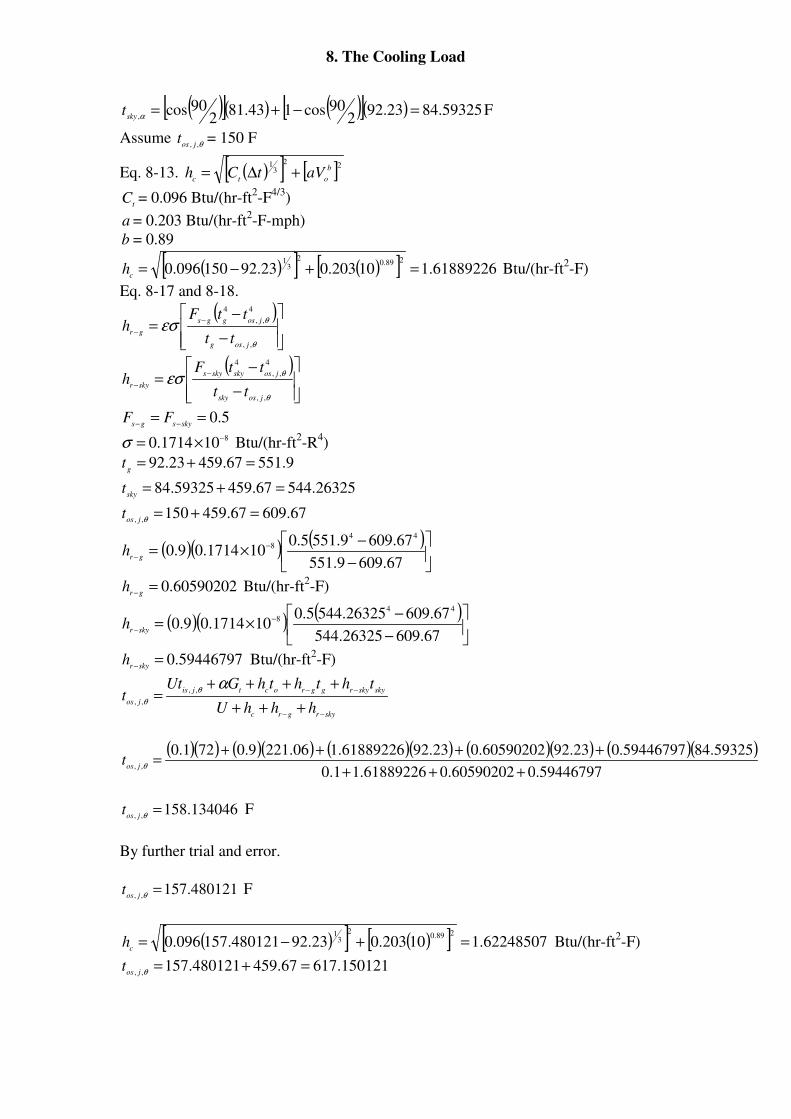
For 4:00 P.M., 06.221=t
G Btu/(hr-ft2)
Eq. 8-24
skyrgrc
skyskyrggroctjis
joshhhU
thththGUtt
−−
−−
+++
++++=
αθ
θ
,,
,,
0tt
sky= - 10.8 F = 92.23 F – 10.8 F = 81.43 F
( )[ ] ( )[ ]0, 2
cos12
cos tttskysky
ααα −+=
90=α
8. The Cooling Load
( )[ ]( ) ( )[ ]( ) 59325.8423.922
90cos143.812
90cos,
=−+=αskyt F
Assume θ,, jost = 150 F
Eq. 8-13. ( )[ ] [ ]223
1 b
otcaVtCh +∆=
tC = 0.096 Btu/(hr-ft
2-F
4/3)
a = 0.203 Btu/(hr-ft2-F-mph)
b = 0.89
( )[ ] ( )[ ] 61889226.110203.023.92150096.0289.0
23
1
=+−=c
h Btu/(hr-ft2-F)
Eq. 8-17 and 8-18.
( )
−
−=
−
−
θ
θεσ,,
4
,,
4
josg
josggs
grtt
ttFh
( )
−
−=
−
−
θ
θεσ,,
4
,,
4
jossky
josskyskys
skyrtt
ttFh
5.0==−− skysgs
FF
8101714.0 −×=σ Btu/(hr-ft2-R
4)
9.55167.45923.92 =+=g
t
26325.54467.45959325.84 =+=sky
t
67.60967.459150,,
=+=θjost
( )( ) ( )
−
−×= −
−67.6099.551
67.6099.5515.0101714.09.0
44
8
grh
60590202.0=−gr
h Btu/(hr-ft2-F)
( )( ) ( )
−
−×= −
−67.60926325.544
67.60926325.5445.0101714.09.0
44
8
skyrh
59446797.0=−skyr
h Btu/(hr-ft2-F)
skyrgrc
skyskyrggroctjis
joshhhU
thththGUtt
−−
−−
+++
++++=
αθ
θ
,,
,,
( )( ) ( )( ) ( )( ) ( )( ) ( )( )59446797.060590202.061889226.11.0
59325.8459446797.023.9260590202.023.9261889226.106.2219.0721.0,,
+++
++++=
θjost
134046.158,,
=θjost F
By further trial and error.
480121.157,,
=θjost F
( )[ ] ( )[ ] 62248507.110203.023.92480121.157096.0289.0
23
1
=+−=c
h Btu/(hr-ft2-F)
150121.61767.459480121.157,,
=+=θjost
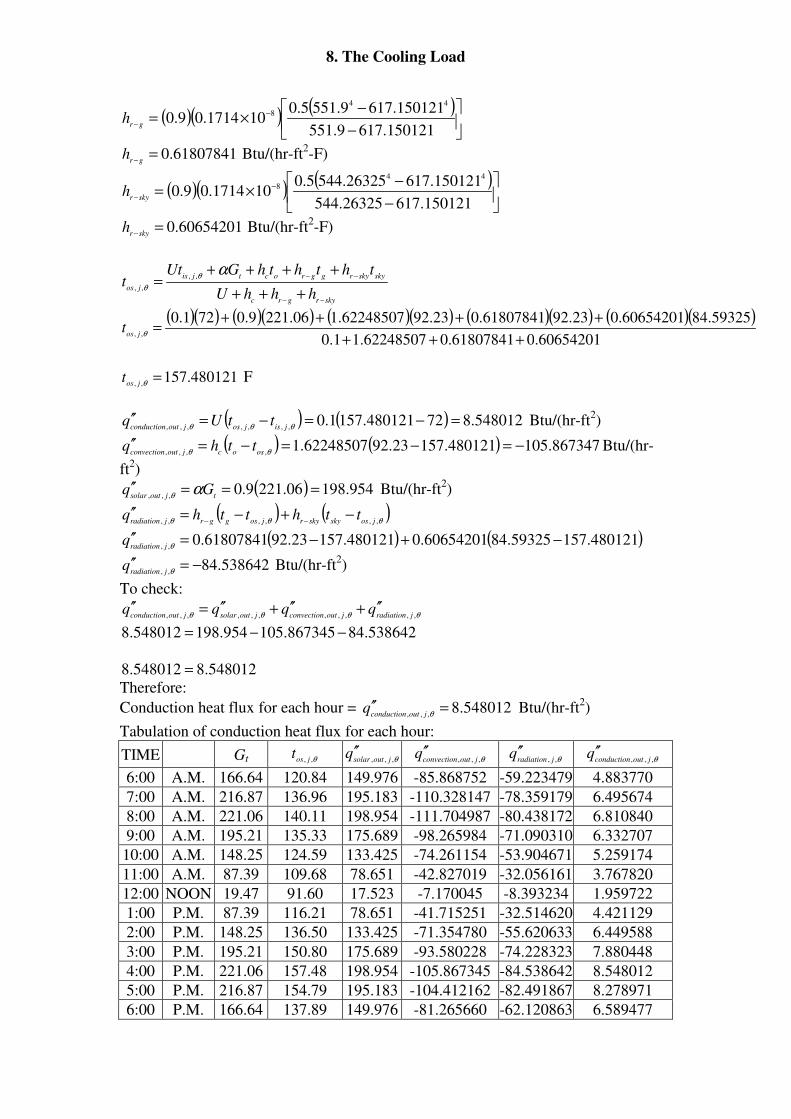
8. The Cooling Load
( )( ) ( )
−
−×= −
−150121.6179.551
150121.6179.5515.0101714.09.0
44
8
grh
61807841.0=−gr
h Btu/(hr-ft2-F)
( )( ) ( )
−
−×= −
−150121.61726325.544
150121.61726325.5445.0101714.09.0
44
8
skyrh
60654201.0=−skyr
h Btu/(hr-ft2-F)
skyrgrc
skyskyrggroctjis
joshhhU
thththGUtt
−−
−−
+++
++++=
αθ
θ
,,
,,
( )( ) ( )( ) ( )( ) ( )( ) ( )( )60654201.061807841.062248507.11.0
59325.8460654201.023.9261807841.023.9262248507.106.2219.0721.0,,
+++
++++=
θjost
480121.157,,
=θjost F
( ) ( ) 548012.872480121.1571.0,,,,,,,
=−=−=′′θθθ jisjosjoutconduction
ttUq Btu/(hr-ft2)
( ) ( ) 867347.105480121.15723.9262248507.1,,,,
−=−=−=′′θθ osocjoutconvection
tthq Btu/(hr-
ft2)
( ) 954.19806.2219.0,,,
===′′tjoutsolar
Gq αθ Btu/(hr-ft2)
( ) ( )θθθ ,,,,,, josskyskyrjosggrjradiation
tthtthq −+−=′′−−
( ) ( )480121.15759325.8460654201.0480121.15723.9261807841.0,,
−+−=′′θjradiation
q
538642.84,,
−=′′θjradiation
q Btu/(hr-ft2)
To check:
θθθθ ,,,,,,,,,,, jradiationjoutconvectionjoutsolarjoutconductionqqqq ′′+′′+′′=′′
538642.84867345.105954.198548012.8 −−=
548012.8548012.8 =
Therefore:
Conduction heat flux for each hour = 548012.8,,,
=′′θjoutconduction
q Btu/(hr-ft2)
Tabulation of conduction heat flux for each hour:
TIME Gt θ,, jost
θ,,, joutsolarq ′′
θ,,, joutconvectionq ′′ θ,, jradiation
q ′′ θ,,, joutconductionq ′′
6:00 A.M. 166.64 120.84 149.976 -85.868752 -59.223479 4.883770
7:00 A.M. 216.87 136.96 195.183 -110.328147 -78.359179 6.495674
8:00 A.M. 221.06 140.11 198.954 -111.704987 -80.438172 6.810840
9:00 A.M. 195.21 135.33 175.689 -98.265984 -71.090310 6.332707
10:00 A.M. 148.25 124.59 133.425 -74.261154 -53.904671 5.259174
11:00 A.M. 87.39 109.68 78.651 -42.827019 -32.056161 3.767820
12:00 NOON 19.47 91.60 17.523 -7.170045 -8.393234 1.959722
1:00 P.M. 87.39 116.21 78.651 -41.715251 -32.514620 4.421129
2:00 P.M. 148.25 136.50 133.425 -71.354780 -55.620633 6.449588
3:00 P.M. 195.21 150.80 175.689 -93.580228 -74.228323 7.880448
4:00 P.M. 221.06 157.48 198.954 -105.867345 -84.538642 8.548012
5:00 P.M. 216.87 154.79 195.183 -104.412162 -82.491867 8.278971
6:00 P.M. 166.64 137.89 149.976 -81.265660 -62.120863 6.589477
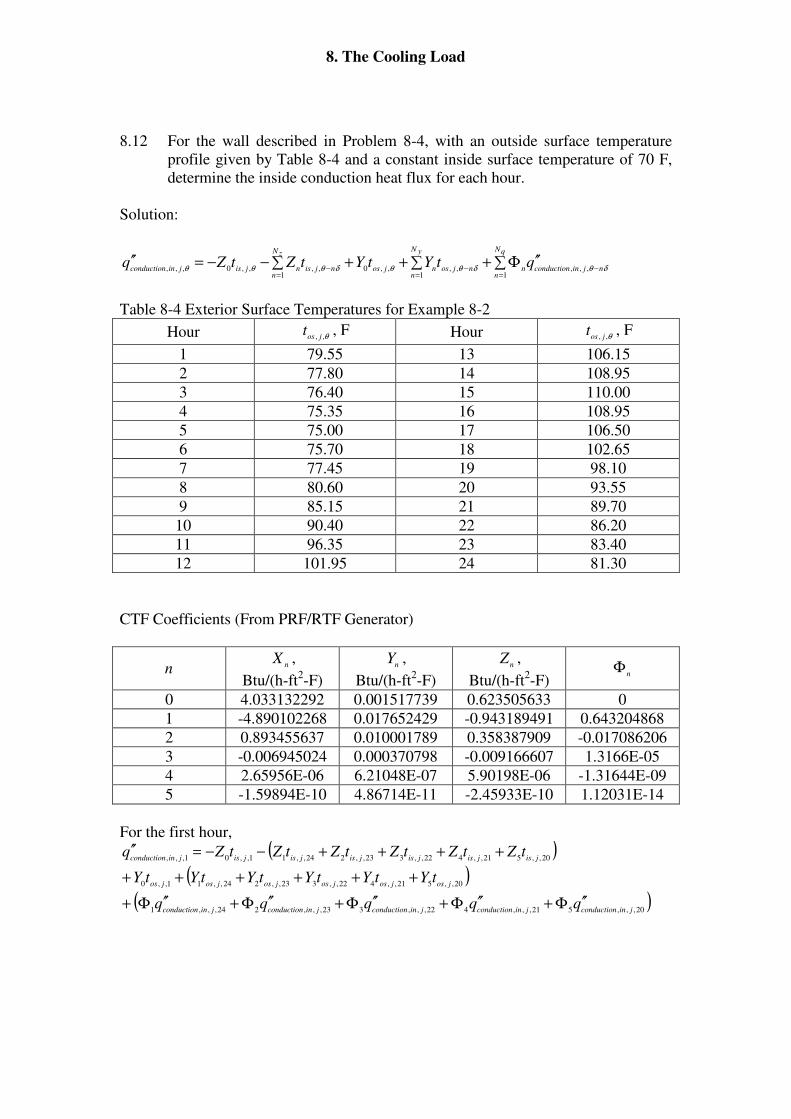
8. The Cooling Load
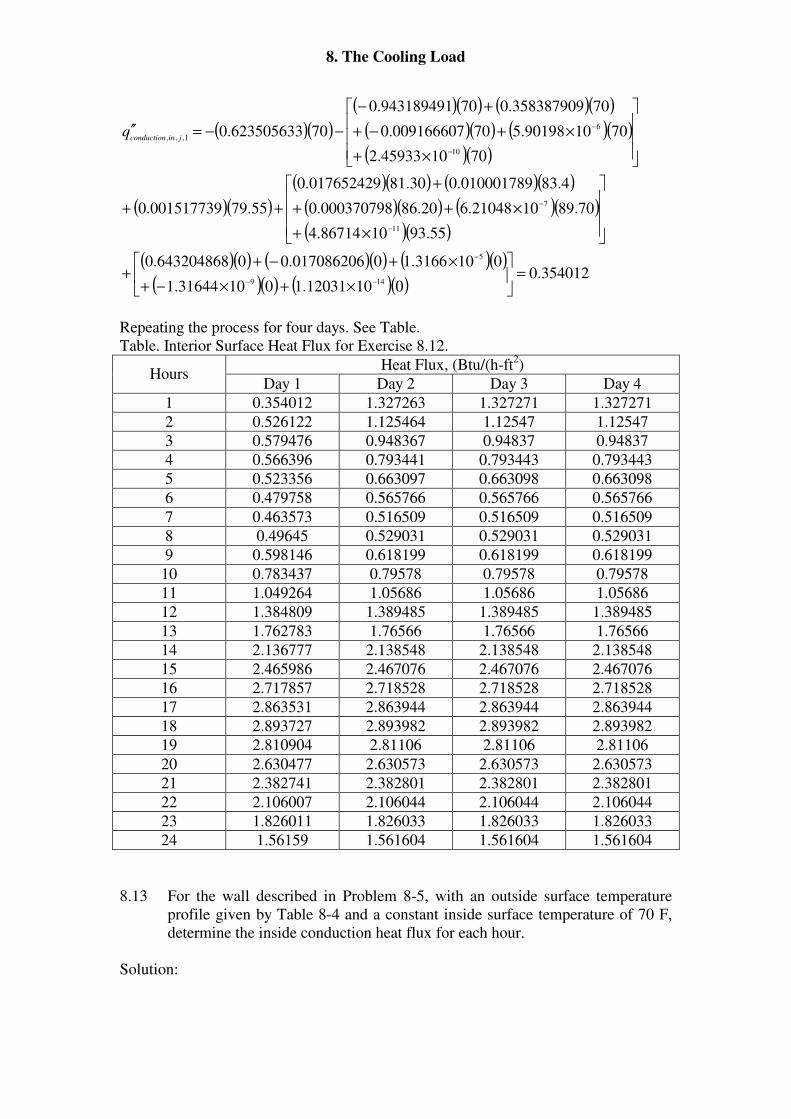
8.12 For the wall described in Problem 8-4, with an outside surface temperature
profile given by Table 8-4 and a constant inside surface temperature of 70 F,
determine the inside conduction heat flux for each hour.
Solution:
∑ ′′Φ+∑++∑−−=′′=
−=
−=
−
qN
nnjinconductionn
yN
nnjosnjos
zN
nnjisnjisjinconduction
qtYtYtZtZq1
,,,1
,,,,01
,,,,0,,, δθδθθδθθθ
Table 8-4 Exterior Surface Temperatures for Example 8-2
Hour θ,, jost , F Hour θ,, jos
t , F
1 79.55 13 106.15
2 77.80 14 108.95
3 76.40 15 110.00
4 75.35 16 108.95
5 75.00 17 106.50
6 75.70 18 102.65
7 77.45 19 98.10
8 80.60 20 93.55
9 85.15 21 89.70
10 90.40 22 86.20
11 96.35 23 83.40
12 101.95 24 81.30
CTF Coefficients (From PRF/RTF Generator)
n nX ,
Btu/(h-ft2-F)
nY ,
Btu/(h-ft2-F)
nZ ,
Btu/(h-ft2-F)
nΦ
0 4.033132292 0.001517739 0.623505633 0
1 -4.890102268 0.017652429 -0.943189491 0.643204868
2 0.893455637 0.010001789 0.358387909 -0.017086206
3 -0.006945024 0.000370798 -0.009166607 1.3166E-05
4 2.65956E-06 6.21048E-07 5.90198E-06 -1.31644E-09
5 -1.59894E-10 4.86714E-11 -2.45933E-10 1.12031E-14
For the first hour,
( )( )
( )20,,,521,,,422,,,323,,,224,,,1
20,,521,,422,,323,,224,,11,,0
20,,521,,422,,323,,224,,11,,01,,,
jinconductionjinconductionjinconductionjinconductionjinconduction
josjosjosjosjosjos
jisjisjisjisjisjisjinconduction
qqqqq
tYtYtYtYtYtY
tZtZtZtZtZtZq
′′Φ+′′Φ+′′Φ+′′Φ+′′Φ+
++++++
++++−−=′′
8. The Cooling Load
( )( )( )( ) ( )( )
( )( ) ( )( )( )( )
( )( )( )( ) ( )( )
( )( ) ( )( )( )( )
( )( ) ( )( ) ( )( )( )( ) ( )( )
354012.001012031.101031644.1
0103166.10017086206.00643204868.0
55.931086714.4
70.891021048.620.86000370798.0
4.83010001789.030.81017652429.0
55.79001517739.0
701045933.2
701090198.570009166607.0
70358387909.070943189491.0
70623505633.0
149
5
11
7
10
6
1,,,
=
×+×−+
×+−++
×+
×++
+
++
×+
×+−+
+−
−−=′′
−−
−
−
−
−
−
jinconductionq
Repeating the process for four days. See Table.
Table. Interior Surface Heat Flux for Exercise 8.12.
Heat Flux, (Btu/(h-ft2)
Hours Day 1 Day 2 Day 3 Day 4
1 0.354012 1.327263 1.327271 1.327271
2 0.526122 1.125464 1.12547 1.12547
3 0.579476 0.948367 0.94837 0.94837
4 0.566396 0.793441 0.793443 0.793443
5 0.523356 0.663097 0.663098 0.663098
6 0.479758 0.565766 0.565766 0.565766
7 0.463573 0.516509 0.516509 0.516509
8 0.49645 0.529031 0.529031 0.529031
9 0.598146 0.618199 0.618199 0.618199
10 0.783437 0.79578 0.79578 0.79578
11 1.049264 1.05686 1.05686 1.05686
12 1.384809 1.389485 1.389485 1.389485
13 1.762783 1.76566 1.76566 1.76566
14 2.136777 2.138548 2.138548 2.138548
15 2.465986 2.467076 2.467076 2.467076
16 2.717857 2.718528 2.718528 2.718528
17 2.863531 2.863944 2.863944 2.863944
18 2.893727 2.893982 2.893982 2.893982
19 2.810904 2.81106 2.81106 2.81106
20 2.630477 2.630573 2.630573 2.630573
21 2.382741 2.382801 2.382801 2.382801
22 2.106007 2.106044 2.106044 2.106044
23 1.826011 1.826033 1.826033 1.826033
24 1.56159 1.561604 1.561604 1.561604
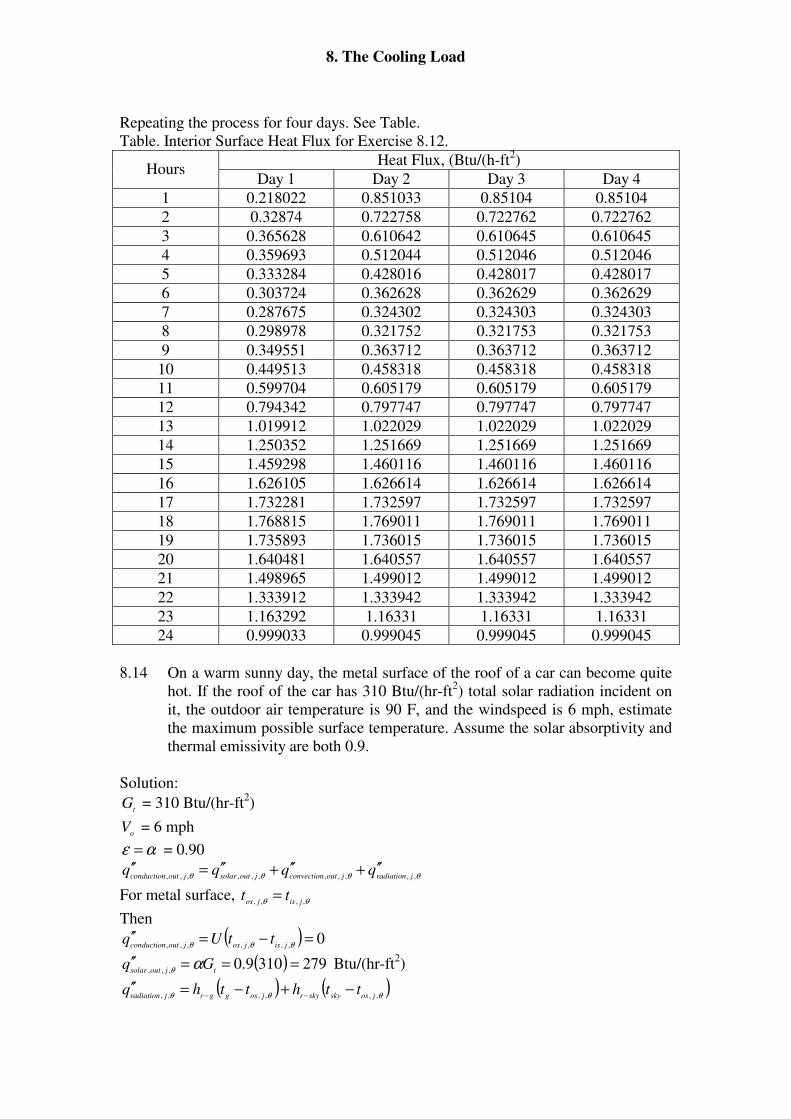
8.13 For the wall described in Problem 8-5, with an outside surface temperature
profile given by Table 8-4 and a constant inside surface temperature of 70 F,
determine the inside conduction heat flux for each hour.
Solution:

8. The Cooling Load
∑ ′′Φ+∑++∑−−=′′=
−=
−=
−
qN
nnjinconductionn
yN
nnjosnjos
zN
nnjisnjisjinconduction
qtYtYtZtZq1
,,,1
,,,,01
,,,,0,,, δθδθθδθθθ
Table 8-4 Exterior Surface Temperatures for Example 8-2
Hour θ,, jost , F Hour θ,, jos
t , F
1 79.55 13 106.15
2 77.80 14 108.95
3 76.40 15 110.00
4 75.35 16 108.95
5 75.00 17 106.50
6 75.70 18 102.65
7 77.45 19 98.10
8 80.60 20 93.55
9 85.15 21 89.70
10 90.40 22 86.20
11 96.35 23 83.40
12 101.95 24 81.30
CTF Coefficients (From PRF/RTF Generator)
n nX ,
Btu/(h-ft2-F)
nY ,
Btu/(h-ft2-F)
nZ ,
Btu/(h-ft2-F)
nΦ
0 4.033132964 0.000387523 0.611908143 0
1 -4.978563054 0.008315152 -0.968315133 0.66508466
2 0.982856227 0.008091923 0.388562266 -0.02728007
3 -0.019978162 0.000729205 -0.014736957 0.000228003
4 8.14087E-05 5.69043E-06 0.000111178 -9.35628E-08
5 -1.44779E-08 2.93347E-09 -3.98891E-08 4.13516E-12
6 4.33848E-13 8.69125E-14 6.47835E-13 -2.32896E-17
For the first hour,
( )( )
′′Φ+′′Φ+
′′Φ+′′Φ+′′Φ+′′Φ+
+++++++
+++++−−=′′
19,,,620,,,5
21,,,422,,,323,,,224,,,1
19,,620,,521,,422,,323,,224,,11,,0
19,,620,,521,,422,,323,,224,,11,,01,,,
jinconductionjinconduction
jinconductionjinconductionjinconductionjinconduction
josjosjosjosjosjosjos
jisjisjisjisjisjisjisjinconduction
qqqq
tYtYtYtYtYtYtY
tZtZtZtZtZtZtZq
( )( )( )( ) ( )( )
( )( ) ( )( )( )( ) ( )( )
( )( )( )( ) ( )( )
( )( ) ( )( )( )( ) ( )( )
( )( ) ( )( ) ( )( )( )( ) ( )( ) ( )( )
218022.001032896.201013516.401035628.9
0000228003.0002728007.0066508466.0
10.981069125.855.931093347.2
70.891069043.520.86000729205.0
4.83008091923.030.81008315152.0
55.79000387523.0
701047835.6701098891.3
70000111178.070014736957.0
70388562266.070968315133.0
70611908143.0
17128
149
6
138
1,,,
=
×−+×+×−+
+−++
×+×+
×++
+
++
×+×−+
+−+
+−
−−=′′
−−−
−−
−
−−
jinconductionq
8. The Cooling Load
Repeating the process for four days. See Table.
Table. Interior Surface Heat Flux for Exercise 8.12.
Heat Flux, (Btu/(h-ft2)
Hours Day 1 Day 2 Day 3 Day 4
1 0.218022 0.851033 0.85104 0.85104
2 0.32874 0.722758 0.722762 0.722762
3 0.365628 0.610642 0.610645 0.610645
4 0.359693 0.512044 0.512046 0.512046
5 0.333284 0.428016 0.428017 0.428017
6 0.303724 0.362628 0.362629 0.362629
7 0.287675 0.324302 0.324303 0.324303
8 0.298978 0.321752 0.321753 0.321753
9 0.349551 0.363712 0.363712 0.363712
10 0.449513 0.458318 0.458318 0.458318
11 0.599704 0.605179 0.605179 0.605179
12 0.794342 0.797747 0.797747 0.797747
13 1.019912 1.022029 1.022029 1.022029
14 1.250352 1.251669 1.251669 1.251669
15 1.459298 1.460116 1.460116 1.460116
16 1.626105 1.626614 1.626614 1.626614
17 1.732281 1.732597 1.732597 1.732597
18 1.768815 1.769011 1.769011 1.769011
19 1.735893 1.736015 1.736015 1.736015
20 1.640481 1.640557 1.640557 1.640557
21 1.498965 1.499012 1.499012 1.499012
22 1.333912 1.333942 1.333942 1.333942
23 1.163292 1.16331 1.16331 1.16331
24 0.999033 0.999045 0.999045 0.999045
8.14 On a warm sunny day, the metal surface of the roof of a car can become quite
hot. If the roof of the car has 310 Btu/(hr-ft2) total solar radiation incident on
it, the outdoor air temperature is 90 F, and the windspeed is 6 mph, estimate
the maximum possible surface temperature. Assume the solar absorptivity and
thermal emissivity are both 0.9.
Solution:
tG = 310 Btu/(hr-ft
2)
oV = 6 mph
αε = = 0.90
θθθθ ,,,,,,,,,,, jradiationjoutconvectionjoutsolarjoutconductionqqqq ′′+′′+′′=′′
For metal surface, θθ ,,,, jisjostt =
Then
( ) 0,,,,,,,
=−=′′θθθ jisjosjoutconduction
ttUq
( ) 2793109.0,,,
===′′tjoutsolar
Gq αθ Btu/(hr-ft2)
( ) ( )θθθ ,,,,,, josskyskyrjosggrjradiation
tthtthq −+−=′′−−
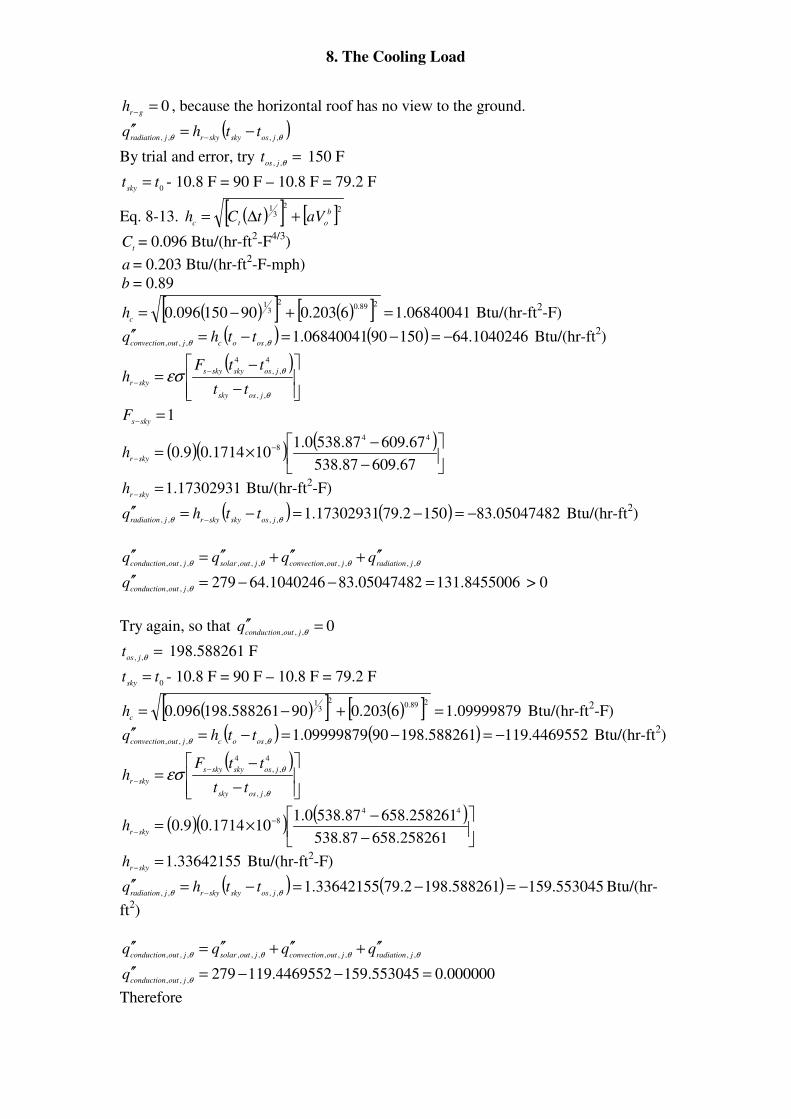
8. The Cooling Load
0=−gr
h , because the horizontal roof has no view to the ground.
( )θθ ,,,, josskyskyrjradiation
tthq −=′′−
By trial and error, try =θ,, jost 150 F
0tt
sky= - 10.8 F = 90 F – 10.8 F = 79.2 F
Eq. 8-13. ( )[ ] [ ]223
1 b
otcaVtCh +∆=
tC = 0.096 Btu/(hr-ft
2-F
4/3)
a = 0.203 Btu/(hr-ft2-F-mph)
b = 0.89
( )[ ] ( )[ ] 06840041.16203.090150096.0289.0
23
1
=+−=c
h Btu/(hr-ft2-F)
( ) ( ) 1040246.641509006840041.1,,,,
−=−=−=′′θθ osocjoutconvection
tthq Btu/(hr-ft2)
( )
−
−=
−
−
θ
θεσ,,
4
,,
4
jossky
josskyskys
skyrtt
ttFh
1=−skys
F
( )( ) ( )
−
−×= −
−67.60987.538
67.60987.5380.1101714.09.0
44
8
skyrh
17302931.1=−skyr
h Btu/(hr-ft2-F)
( ) ( ) 05047482.831502.7917302931.1,,,,
−=−=−=′′− θθ josskyskyrjradiation
tthq Btu/(hr-ft2)
θθθθ ,,,,,,,,,,, jradiationjoutconvectionjoutsolarjoutconductionqqqq ′′+′′+′′=′′
8455006.13105047482.831040246.64279,,,
=−−=′′θjoutconduction
q > 0
Try again, so that 0,,,
=′′θjoutconduction
q
=θ,, jost 198.588261 F
0tt
sky= - 10.8 F = 90 F – 10.8 F = 79.2 F
( )[ ] ( )[ ] 09999879.16203.090588261.198096.0289.0
23
1
=+−=c
h Btu/(hr-ft2-F)
( ) ( ) 4469552.119588261.1989009999879.1,,,,
−=−=−=′′θθ osocjoutconvection
tthq Btu/(hr-ft2)
( )
−
−=
−
−
θ
θεσ,,
4
,,
4
jossky
josskyskys
skyrtt
ttFh
( )( ) ( )
−
−×= −
−258261.65887.538
258261.65887.5380.1101714.09.0
44
8
skyrh
33642155.1=−skyr
h Btu/(hr-ft2-F)
( ) ( ) 553045.159588261.1982.7933642155.1,,,,
−=−=−=′′− θθ josskyskyrjradiation
tthq Btu/(hr-
ft2)
θθθθ ,,,,,,,,,,, jradiationjoutconvectionjoutsolarjoutconductionqqqq ′′+′′+′′=′′
000000.0553045.1594469552.119279,,,
=−−=′′θjoutconduction
q
Therefore
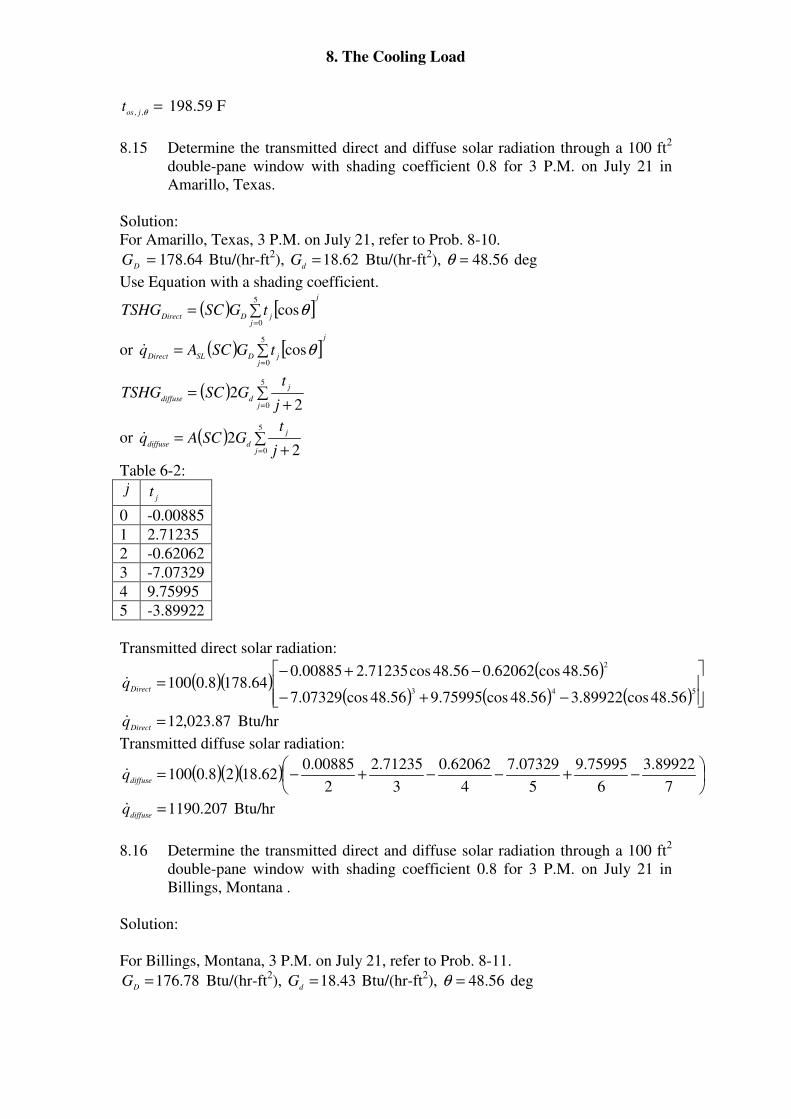
8. The Cooling Load
=θ,, jost 198.59 F
8.15 Determine the transmitted direct and diffuse solar radiation through a 100 ft2
double-pane window with shading coefficient 0.8 for 3 P.M. on July 21 in
Amarillo, Texas.
Solution:
For Amarillo, Texas, 3 P.M. on July 21, refer to Prob. 8-10.
64.178=D
G Btu/(hr-ft2), 62.18=
dG Btu/(hr-ft
2), 56.48=θ deg
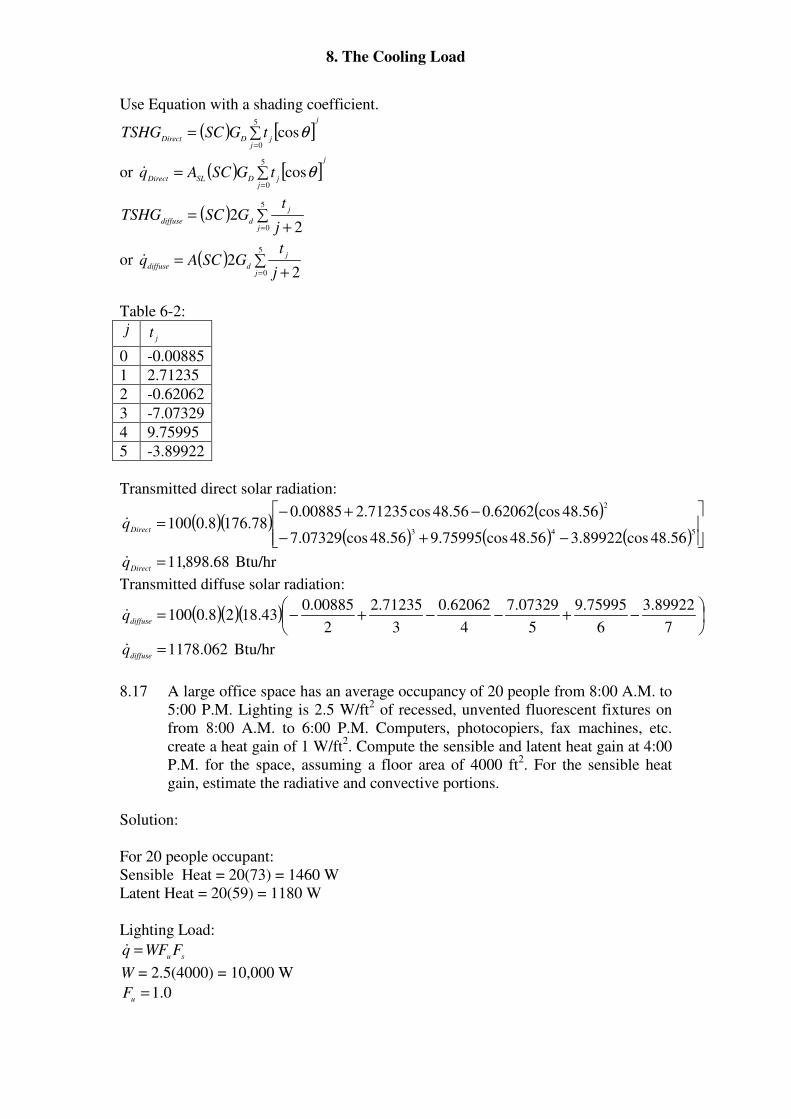
Use Equation with a shading coefficient.
( ) [ ]j
jjDDirect
tGSCTSHG ∑==
5
0
cosθ
or ( ) [ ]j
jjDSLDirect
tGSCAq ∑==
5
0
cosθ&
( ) ∑+
==
5
0 22
j
j
ddiffusej
tGSCTSHG
or ( ) ∑+
==
5
0 22
j
j
ddiffusej
tGSCAq&
Table 6-2: j
jt
0 -0.00885
1 2.71235
2 -0.62062
3 -7.07329
4 9.75995
5 -3.89922
Transmitted direct solar radiation:
( )( )( )
( ) ( ) ( )
−+−
−+−=
543
2
56.48cos89922.356.48cos75995.956.48cos07329.7
56.48cos62062.056.48cos71235.200885.064.1788.0100
Directq&
87.023,12=Direct
q& Btu/hr
Transmitted diffuse solar radiation:
( )( )( )
−+−−+−=
7
89922.3
6
75995.9
5
07329.7
4
62062.0
3
71235.2
2
00885.062.1828.0100
diffuseq&
207.1190=diffuse
q& Btu/hr
8.16 Determine the transmitted direct and diffuse solar radiation through a 100 ft2
double-pane window with shading coefficient 0.8 for 3 P.M. on July 21 in
Billings, Montana .
Solution:
For Billings, Montana, 3 P.M. on July 21, refer to Prob. 8-11.
78.176=D
G Btu/(hr-ft2), 43.18=
dG Btu/(hr-ft
2), 56.48=θ deg
8. The Cooling Load
Use Equation with a shading coefficient.
( ) [ ]j
jjDDirect
tGSCTSHG ∑==
5
0
cosθ
or ( ) [ ]j
jjDSLDirect
tGSCAq ∑==
5
0
cosθ&
( ) ∑+
==
5
0 22
j
j
ddiffusej
tGSCTSHG
or ( ) ∑+
==
5
0 22
j
j
ddiffusej
tGSCAq&
Table 6-2: j
jt
0 -0.00885
1 2.71235
2 -0.62062
3 -7.07329
4 9.75995
5 -3.89922
Transmitted direct solar radiation:
( )( )( )
( ) ( ) ( )
−+−
−+−=
543
2
56.48cos89922.356.48cos75995.956.48cos07329.7
56.48cos62062.056.48cos71235.200885.078.1768.0100
Directq&
68.898,11=Direct
q& Btu/hr
Transmitted diffuse solar radiation:
( )( )( )
−+−−+−=
7
89922.3
6
75995.9
5
07329.7
4
62062.0
3
71235.2
2
00885.043.1828.0100
diffuseq&
062.1178=diffuse
q& Btu/hr
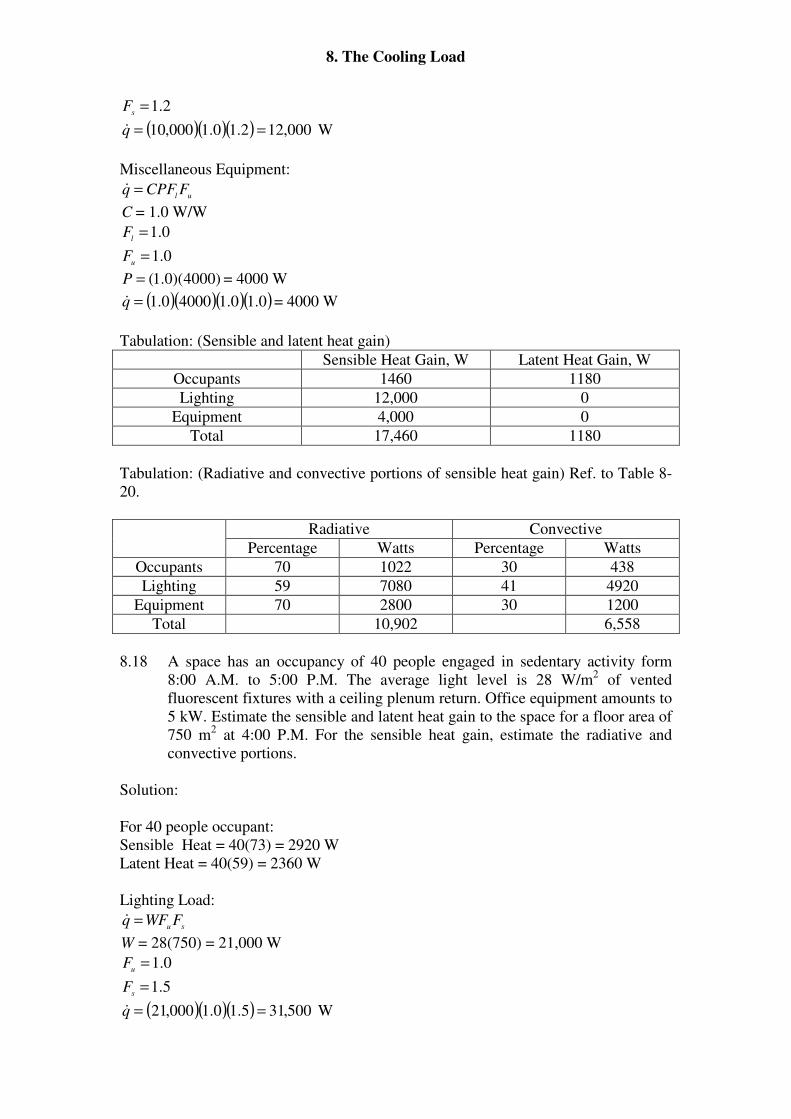
8.17 A large office space has an average occupancy of 20 people from 8:00 A.M. to
5:00 P.M. Lighting is 2.5 W/ft2 of recessed, unvented fluorescent fixtures on
from 8:00 A.M. to 6:00 P.M. Computers, photocopiers, fax machines, etc.
create a heat gain of 1 W/ft2. Compute the sensible and latent heat gain at 4:00
P.M. for the space, assuming a floor area of 4000 ft2. For the sensible heat
gain, estimate the radiative and convective portions.
Solution:
For 20 people occupant:
Sensible Heat = 20(73) = 1460 W
Latent Heat = 20(59) = 1180 W
Lighting Load:
suFWFq =&
W = 2.5(4000) = 10,000 W
0.1=u
F
8. The Cooling Load
2.1=s
F
( )( )( ) 000,122.10.1000,10 ==q& W
Miscellaneous Equipment:
ulFCPFq =&
C = 1.0 W/W
0.1=l
F
0.1=u
F
)4000)(0.1(=P = 4000 W
( )( )( )( )0.10.140000.1=q& = 4000 W
Tabulation: (Sensible and latent heat gain)
Sensible Heat Gain, W Latent Heat Gain, W
Occupants 1460 1180
Lighting 12,000 0
Equipment 4,000 0
Total 17,460 1180
Tabulation: (Radiative and convective portions of sensible heat gain) Ref. to Table 8-
20.
Radiative Convective
Percentage Watts Percentage Watts
Occupants 70 1022 30 438
Lighting 59 7080 41 4920
Equipment 70 2800 30 1200
Total 10,902 6,558
8.18 A space has an occupancy of 40 people engaged in sedentary activity form
8:00 A.M. to 5:00 P.M. The average light level is 28 W/m2 of vented
fluorescent fixtures with a ceiling plenum return. Office equipment amounts to
5 kW. Estimate the sensible and latent heat gain to the space for a floor area of
750 m2 at 4:00 P.M. For the sensible heat gain, estimate the radiative and
convective portions.
Solution:
For 40 people occupant:
Sensible Heat = 40(73) = 2920 W
Latent Heat = 40(59) = 2360 W
Lighting Load:
suFWFq =&
W = 28(750) = 21,000 W
0.1=u
F
5.1=s
F
( )( )( ) 500,315.10.1000,21 ==q& W
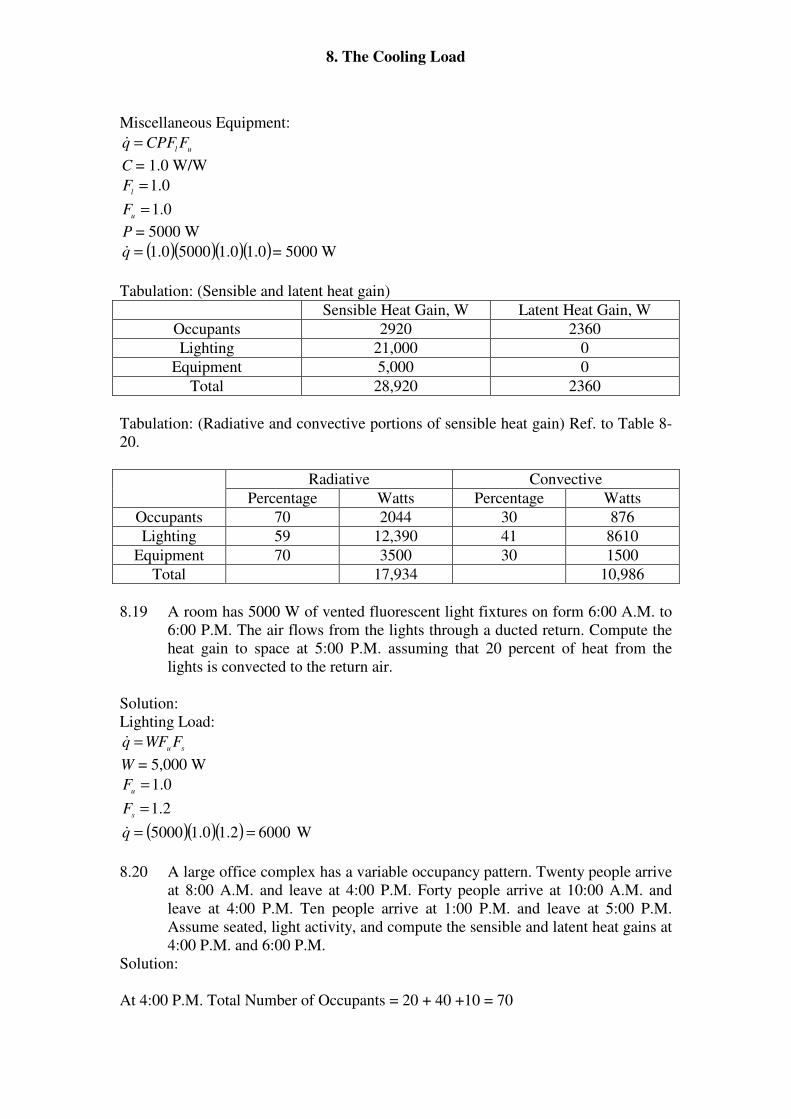
8. The Cooling Load
Miscellaneous Equipment:
ulFCPFq =&
C = 1.0 W/W
0.1=l
F
0.1=u
F
P = 5000 W
( )( )( )( )0.10.150000.1=q& = 5000 W
Tabulation: (Sensible and latent heat gain)
Sensible Heat Gain, W Latent Heat Gain, W
Occupants 2920 2360
Lighting 21,000 0
Equipment 5,000 0
Total 28,920 2360
Tabulation: (Radiative and convective portions of sensible heat gain) Ref. to Table 8-
20.
Radiative Convective
Percentage Watts Percentage Watts
Occupants 70 2044 30 876
Lighting 59 12,390 41 8610
Equipment 70 3500 30 1500
Total 17,934 10,986
8.19 A room has 5000 W of vented fluorescent light fixtures on form 6:00 A.M. to
6:00 P.M. The air flows from the lights through a ducted return. Compute the
heat gain to space at 5:00 P.M. assuming that 20 percent of heat from the
lights is convected to the return air.
Solution:
Lighting Load:
suFWFq =&
W = 5,000 W
0.1=u
F
2.1=s
F
( )( )( ) 60002.10.15000 ==q& W
8.20 A large office complex has a variable occupancy pattern. Twenty people arrive
at 8:00 A.M. and leave at 4:00 P.M. Forty people arrive at 10:00 A.M. and
leave at 4:00 P.M. Ten people arrive at 1:00 P.M. and leave at 5:00 P.M.
Assume seated, light activity, and compute the sensible and latent heat gains at
4:00 P.M. and 6:00 P.M.
Solution:
At 4:00 P.M. Total Number of Occupants = 20 + 40 +10 = 70
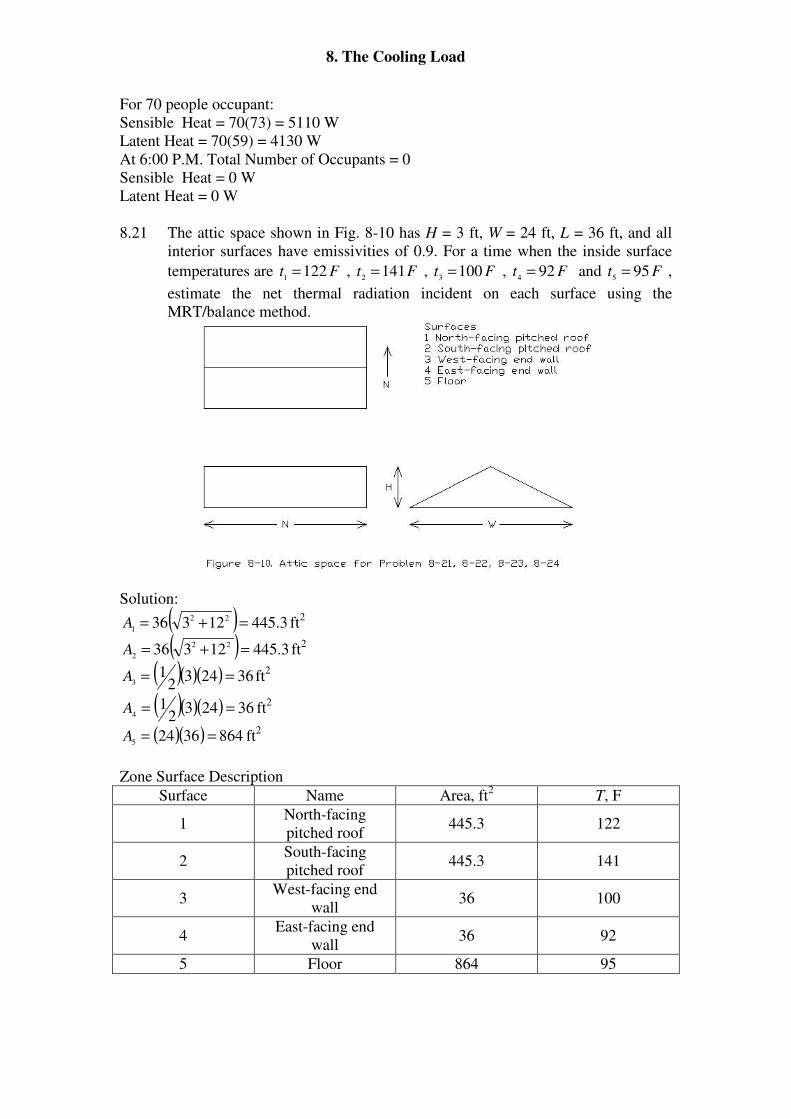
8. The Cooling Load
For 70 people occupant:
Sensible Heat = 70(73) = 5110 W
Latent Heat = 70(59) = 4130 W
At 6:00 P.M. Total Number of Occupants = 0
Sensible Heat = 0 W
Latent Heat = 0 W
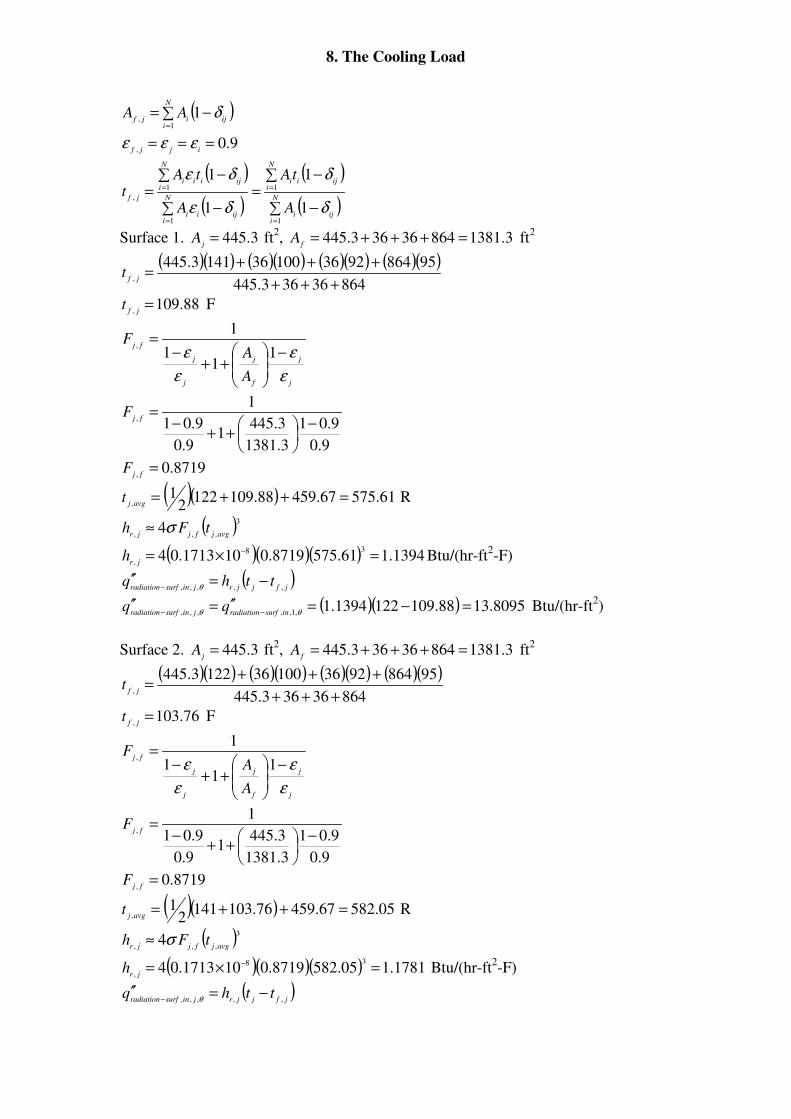
8.21 The attic space shown in Fig. 8-10 has H = 3 ft, W = 24 ft, L = 36 ft, and all
interior surfaces have emissivities of 0.9. For a time when the inside surface
temperatures are Ft 1221
= , Ft 1412
= , Ft 1003
= , Ft 924
= and Ft 955
= ,
estimate the net thermal radiation incident on each surface using the
MRT/balance method.
Solution:
( ) 3.44512336 22
1=+=A ft
2
( ) 3.44512336 22
2=+=A ft
2
( )( )( ) 362432
13
==A ft2
( )( )( ) 362432
14
==A ft2
( )( ) 86436245
==A ft2
Zone Surface Description
Surface Name Area, ft2 T, F
1 North-facing
pitched roof 445.3 122
2 South-facing
pitched roof 445.3 141
3 West-facing end
wall 36 100
4 East-facing end
wall 36 92
5 Floor 864 95
8. The Cooling Load
( )∑ −==
N
iijijf
AA1
,1 δ
9.0,
===ijjf
εεε
( )
( )
( )
( )∑ −
∑ −=
∑ −
∑ −=
=
=
=
=
N
iiji
N
iijii
N
iijii
N
iijiii
jf
A
tA
A
tAt
1
1
1
1
,
1
1
1
1
δ
δ
δε
δε
Surface 1. 3.445=j
A ft2, 3.138186436363.445 =+++=
fA ft
2
( )( ) ( )( ) ( )( ) ( )( )86436363.445
958649236100361413.445,
+++
+++=
jft
88.109,
=jf
t F
j
j
f
j
j
j
fj
A
AF
ε
ε
ε
ε −
++
−=
11
1
1,
9.0
9.01
3.1381
3.4451
9.0
9.01
1, −
++
−=
fjF
8719.0,
=fj
F
( )( ) 61.57567.45988.1091222
1,
=++=avgj
t R
( )3
,,,4
avgjfjjrtFh σ≈
( )( )( ) 1394.161.5758719.0101713.0438
,=×= −
jrh Btu/(hr-ft
2-F)
( )jfjjrjinsurfradiation
tthq,,,,,
−=′′− θ
( )( ) 8095.1388.1091221394.1,1,,,,,
=−=′′=′′−− θθ insurfradiationjinsurfradiation
qq Btu/(hr-ft2)
Surface 2. 3.445=j
A ft2, 3.138186436363.445 =+++=
fA ft
2
( )( ) ( )( ) ( )( ) ( )( )86436363.445
958649236100361223.445,
+++
+++=
jft
76.103,
=jf
t F
j
j
f
j
j
j
fj
A
AF
ε
ε
ε
ε −
++
−=
11
1
1,
9.0
9.01
3.1381
3.4451
9.0
9.01
1, −
++
−=
fjF
8719.0,
=fj
F
( )( ) 05.58267.45976.1031412
1,
=++=avgj
t R
( )3
,,,4
avgjfjjrtFh σ≈
( )( )( ) 1781.105.5828719.0101713.0438
,=×= −
jrh Btu/(hr-ft
2-F)
( )jfjjrjinsurfradiation
tthq,,,,,
−=′′− θ
8. The Cooling Load
( )( ) 8724.4376.1031411781.1,2,,,,,
=−=′′=′′−− θθ insurfradiationjinsurfradiation
qq Btu/(hr-ft2)
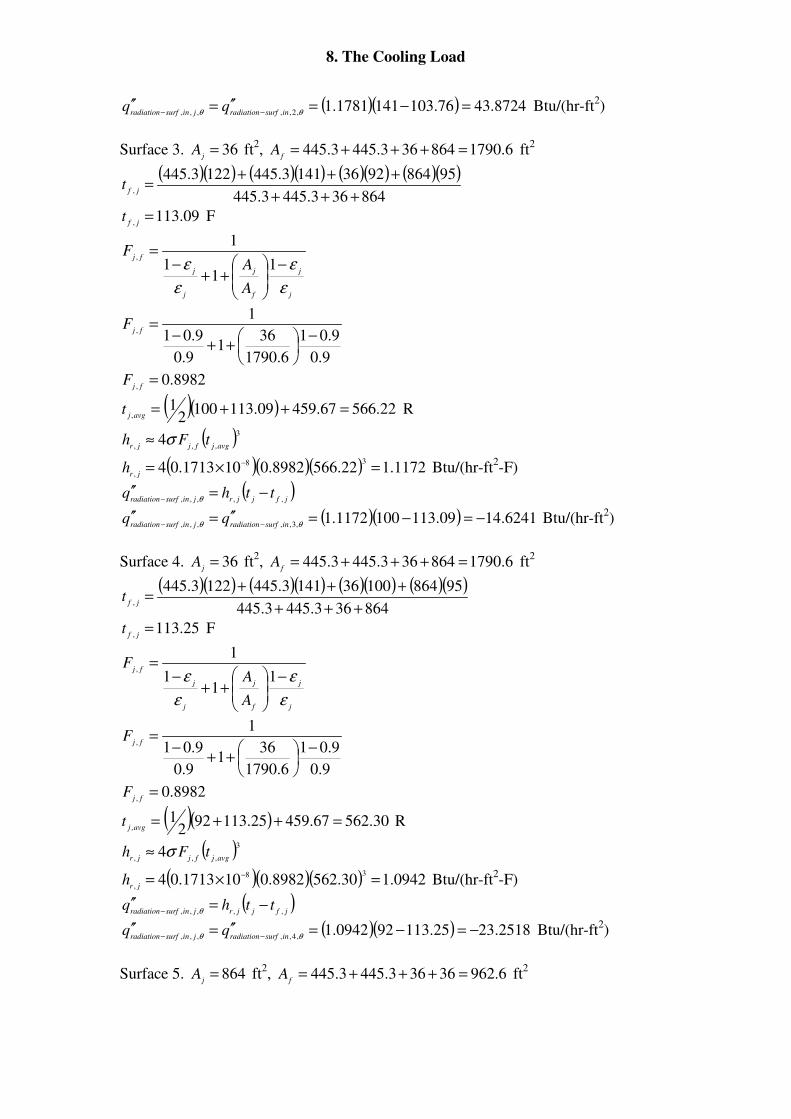
Surface 3. 36=j
A ft2, 6.1790864363.4453.445 =+++=
fA ft
2
( )( ) ( )( ) ( )( ) ( )( )864363.4453.445
9586492361413.4451223.445,
+++
+++=
jft
09.113,
=jf
t F
j
j
f
j
j
j
fj
A
AF
ε
ε
ε
ε −
++
−=
11
1
1,
9.0
9.01
6.1790
361
9.0
9.01
1, −
++
−=
fjF
8982.0,
=fj
F
( )( ) 22.56667.45909.1131002
1,
=++=avgj
t R
( )3
,,,4
avgjfjjrtFh σ≈
( )( )( ) 1172.122.5668982.0101713.0438
,=×= −
jrh Btu/(hr-ft
2-F)
( )jfjjrjinsurfradiation
tthq,,,,,
−=′′− θ
( )( ) 6241.1409.1131001172.1,3,,,,,
−=−=′′=′′−− θθ insurfradiationjinsurfradiation
qq Btu/(hr-ft2)
Surface 4. 36=j
A ft2, 6.1790864363.4453.445 =+++=
fA ft
2
( )( ) ( )( ) ( )( ) ( )( )864363.4453.445
95864100361413.4451223.445,
+++
+++=
jft
25.113,
=jf
t F
j
j
f
j
j
j
fj
A
AF
ε
ε
ε
ε −
++
−=
11
1
1,
9.0
9.01
6.1790
361
9.0
9.01
1, −
++
−=
fjF
8982.0,
=fj
F
( )( ) 30.56267.45925.113922
1,
=++=avgj
t R
( )3
,,,4
avgjfjjrtFh σ≈
( )( )( ) 0942.130.5628982.0101713.0438
,=×= −
jrh Btu/(hr-ft
2-F)
( )jfjjrjinsurfradiation
tthq,,,,,
−=′′− θ
( )( ) 2518.2325.113920942.1,4,,,,,
−=−=′′=′′−− θθ insurfradiationjinsurfradiation
qq Btu/(hr-ft2)
Surface 5. 864=j
A ft2, 6.96236363.4453.445 =+++=
fA ft
2
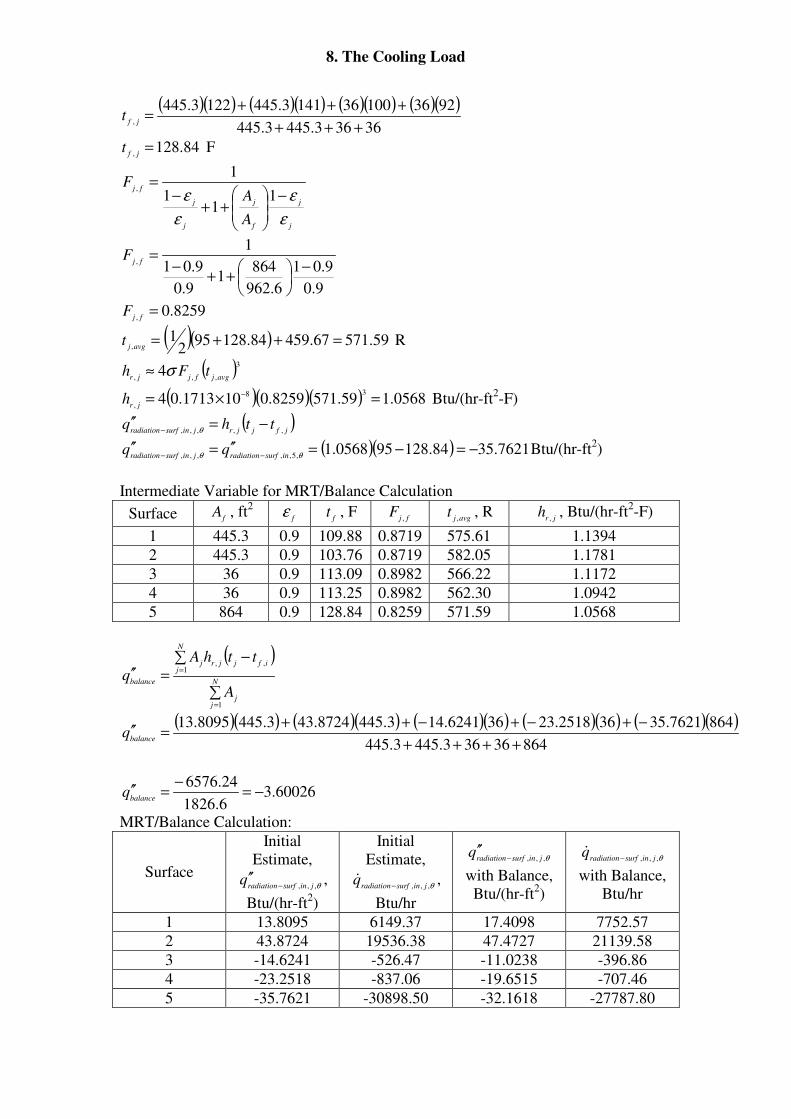
8. The Cooling Load
( )( ) ( )( ) ( )( ) ( )( )36363.4453.445
9236100361413.4451223.445,
+++
+++=
jft
84.128,
=jf
t F
j
j
f
j
j
j
fj
A
AF
ε
ε
ε
ε −
++
−=
11
1
1,
9.0
9.01
6.962
8641
9.0
9.01
1, −
++
−=
fjF
8259.0,
=fj
F
( )( ) 59.57167.45984.128952
1,
=++=avgj
t R
( )3
,,,4
avgjfjjrtFh σ≈
( )( )( ) 0568.159.5718259.0101713.0438
,=×= −
jrh Btu/(hr-ft
2-F)
( )jfjjrjinsurfradiation
tthq,,,,,
−=′′− θ
( )( ) 7621.3584.128950568.1,5,,,,,
−=−=′′=′′−− θθ insurfradiationjinsurfradiation
qq Btu/(hr-ft2)
Intermediate Variable for MRT/Balance Calculation
Surface fA , ft
2
fε
ft , F
fjF
,
avgjt
,, R
jrh
,, Btu/(hr-ft
2-F)
1 445.3 0.9 109.88 0.8719 575.61 1.1394
2 445.3 0.9 103.76 0.8719 582.05 1.1781
3 36 0.9 113.09 0.8982 566.22 1.1172
4 36 0.9 113.25 0.8982 562.30 1.0942
5 864 0.9 128.84 0.8259 571.59 1.0568
( )
∑
∑ −=′′
=
=
N
jj
N
jifjjrj
balance
A
tthA
q
1
1,,
( )( ) ( )( ) ( )( ) ( )( ) ( )( )86436363.4453.445
8647621.35362518.23366241.143.4458724.433.4458095.13
++++
−+−+−++=′′
balanceq
60026.36.1826
24.6576−=
−=′′
balanceq
MRT/Balance Calculation:
Surface
Initial
Estimate,
θ,,, jinsurfradiationq
−′′ ,
Btu/(hr-ft2)
Initial
Estimate,
θ,,, jinsurfradiationq
−& ,
Btu/hr
θ,,, jinsurfradiationq
−′′
with Balance,
Btu/(hr-ft2)
θ,,, jinsurfradiationq
−&
with Balance,
Btu/hr
1 13.8095 6149.37 17.4098 7752.57
2 43.8724 19536.38 47.4727 21139.58
3 -14.6241 -526.47 -11.0238 -396.86
4 -23.2518 -837.06 -19.6515 -707.46
5 -35.7621 -30898.50 -32.1618 -27787.80
8. The Cooling Load
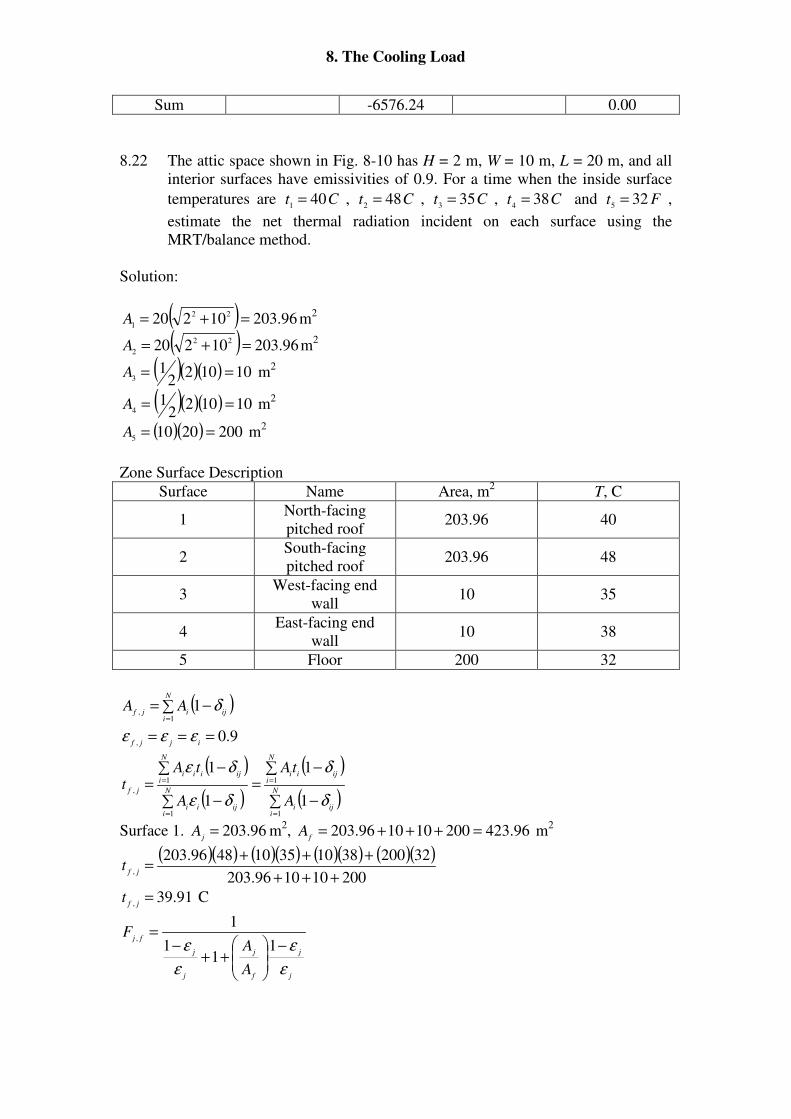
Sum -6576.24 0.00
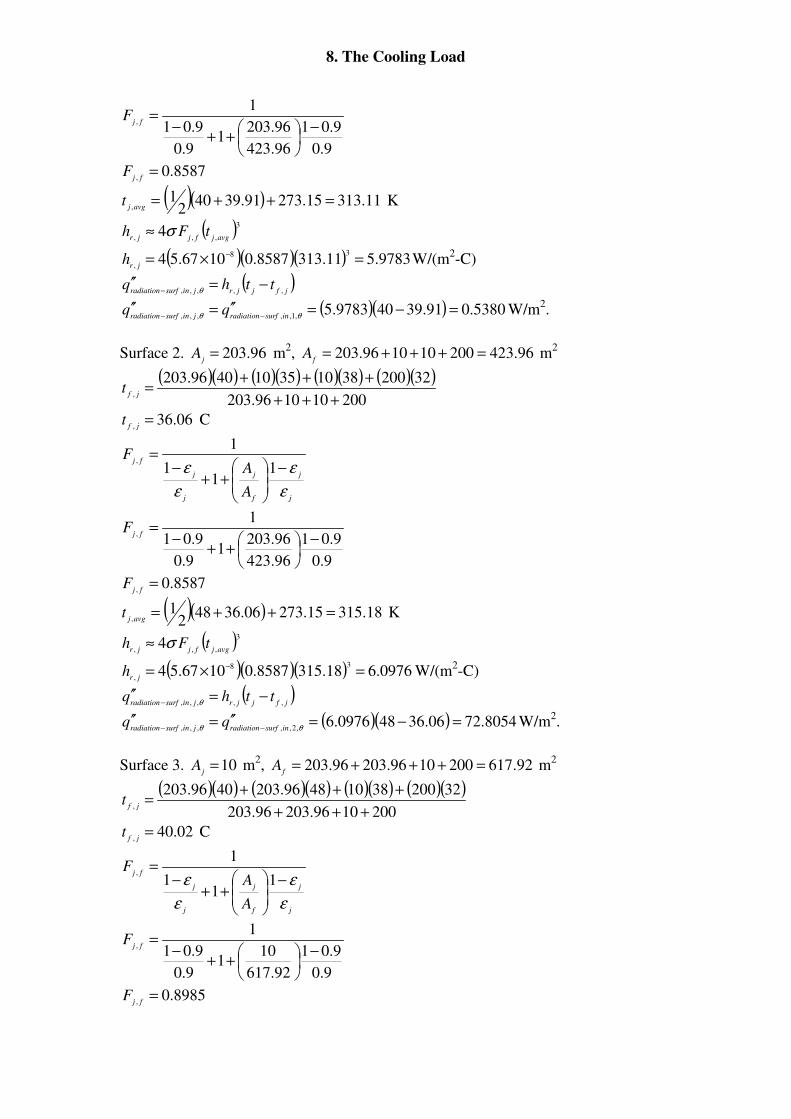
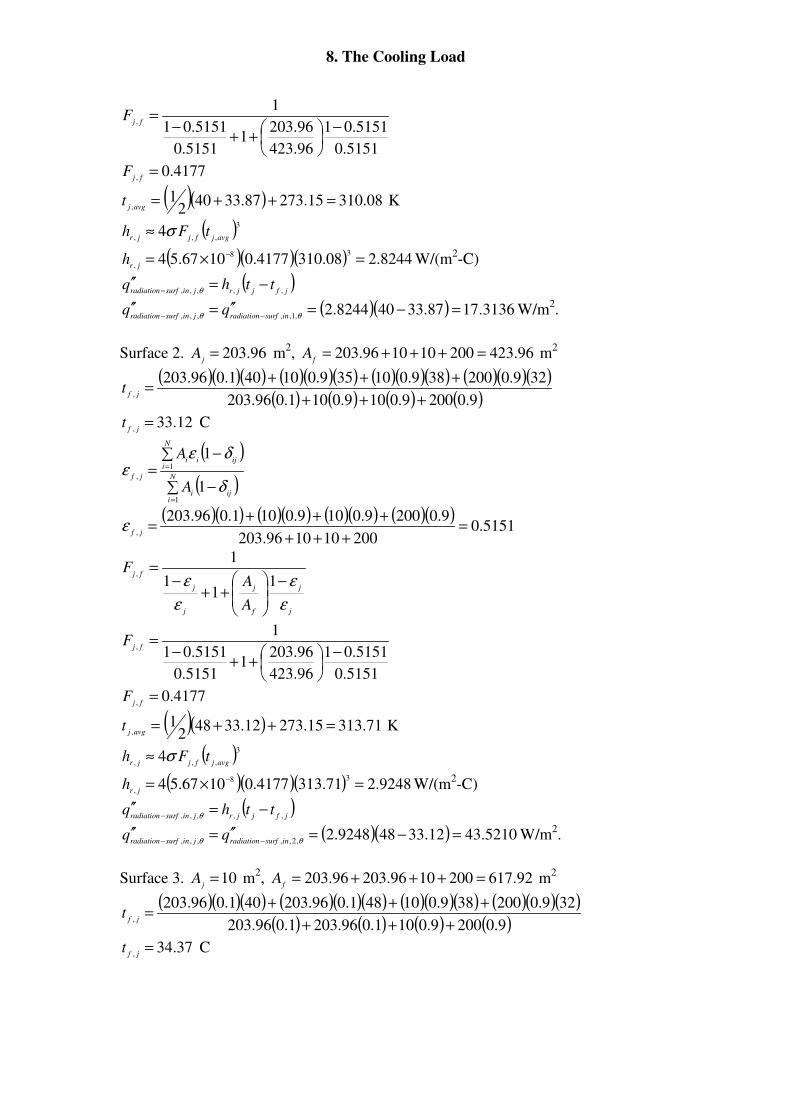
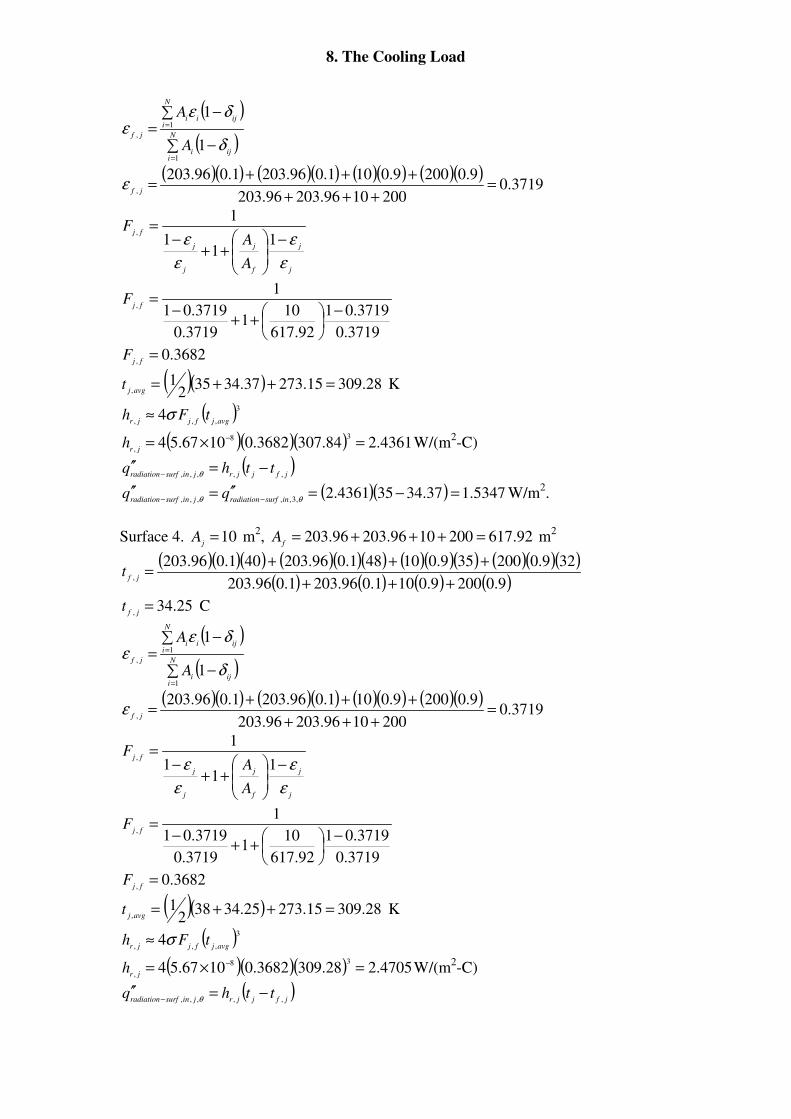
8.22 The attic space shown in Fig. 8-10 has H = 2 m, W = 10 m, L = 20 m, and all
interior surfaces have emissivities of 0.9. For a time when the inside surface
temperatures are Ct 401
= , Ct 482
= , Ct 353
= , Ct 384
= and Ft 325
= ,
estimate the net thermal radiation incident on each surface using the
MRT/balance method.
Solution:
( ) 96.20310220 22
1=+=A m
2
( ) 96.20310220 22
2=+=A m
2
( )( )( ) 101022
13
==A m2
( )( )( ) 101022
14
==A m2
( )( ) 20020105
==A m2
Zone Surface Description
Surface Name Area, m2 T, C
1 North-facing
pitched roof 203.96 40
2 South-facing
pitched roof 203.96 48
3 West-facing end
wall 10 35
4 East-facing end
wall 10 38
5 Floor 200 32
( )∑ −==
N
iijijf
AA1
,1 δ
9.0,
===ijjf
εεε
( )
( )
( )
( )∑ −
∑ −=
∑ −
∑ −=
=
=
=
=
N
iiji
N
iijii
N
iijii
N
iijiii
jf
A
tA
A
tAt
1
1
1
1
,
1
1
1
1
δ
δ
δε
δε
Surface 1. 96.203=j
A m2, 96.423200101096.203 =+++=
fA m
2
( )( ) ( )( ) ( )( ) ( )( )200101096.203
32200381035104896.203,
+++
+++=
jft
91.39,
=jf
t C
j
j
f
j
j
j
fj
A
AF
ε
ε
ε
ε −
++
−=
11
1
1,
8. The Cooling Load
9.0
9.01
96.423
96.2031
9.0
9.01
1, −
++
−=
fjF
8587.0,
=fj
F
( )( ) 11.31315.27391.39402
1,
=++=avgj
t K
( )3
,,,4
avgjfjjrtFh σ≈
( )( )( ) 9783.511.3138587.01067.5438
,=×= −
jrh W/(m
2-C)
( )jfjjrjinsurfradiation
tthq,,,,,
−=′′− θ
( )( ) 5380.091.39409783.5,1,,,,,
=−=′′=′′−− θθ insurfradiationjinsurfradiation
qq W/m2.
Surface 2. 96.203=j
A m2, 96.423200101096.203 =+++=
fA m
2
( )( ) ( )( ) ( )( ) ( )( )200101096.203
32200381035104096.203,
+++
+++=
jft
06.36,
=jf
t C
j
j
f
j
j
j
fj
A
AF
ε
ε
ε
ε −
++
−=
11
1
1,
9.0
9.01
96.423
96.2031
9.0
9.01
1, −
++
−=
fjF
8587.0,
=fj
F
( )( ) 18.31515.27306.36482
1,
=++=avgj
t K
( )3
,,,4
avgjfjjrtFh σ≈
( )( )( ) 0976.618.3158587.01067.5438
,=×= −
jrh W/(m
2-C)
( )jfjjrjinsurfradiation
tthq,,,,,
−=′′− θ
( )( ) 8054.7206.36480976.6,2,,,,,
=−=′′=′′−− θθ insurfradiationjinsurfradiation
qq W/m2.
Surface 3. 10=j
A m2, 92.6172001096.20396.203 =+++=
fA m
2
( )( ) ( )( ) ( )( ) ( )( )2001096.20396.203
3220038104896.2034096.203,
+++
+++=
jft
02.40,
=jf
t C
j
j
f
j
j
j
fj
A
AF
ε
ε
ε
ε −
++
−=
11
1
1,
9.0
9.01
92.617
101
9.0
9.01
1, −
++
−=
fjF
8985.0,
=fj
F
8. The Cooling Load
( )( ) 66.31015.27302.40352
1,
=++=avgj
t K
( )3
,,,4
avgjfjjrtFh σ≈
( )( )( ) 1097.666.3108985.01067.5438
,=×= −
jrh W/(m
2-C)
( )jfjjrjinsurfradiation
tthq,,,,,
−=′′− θ
( )( ) 6707.3002.40351097.6,3,,,,,
−=−=′′=′′−− θθ insurfradiationjinsurfradiation
qq W/m2.
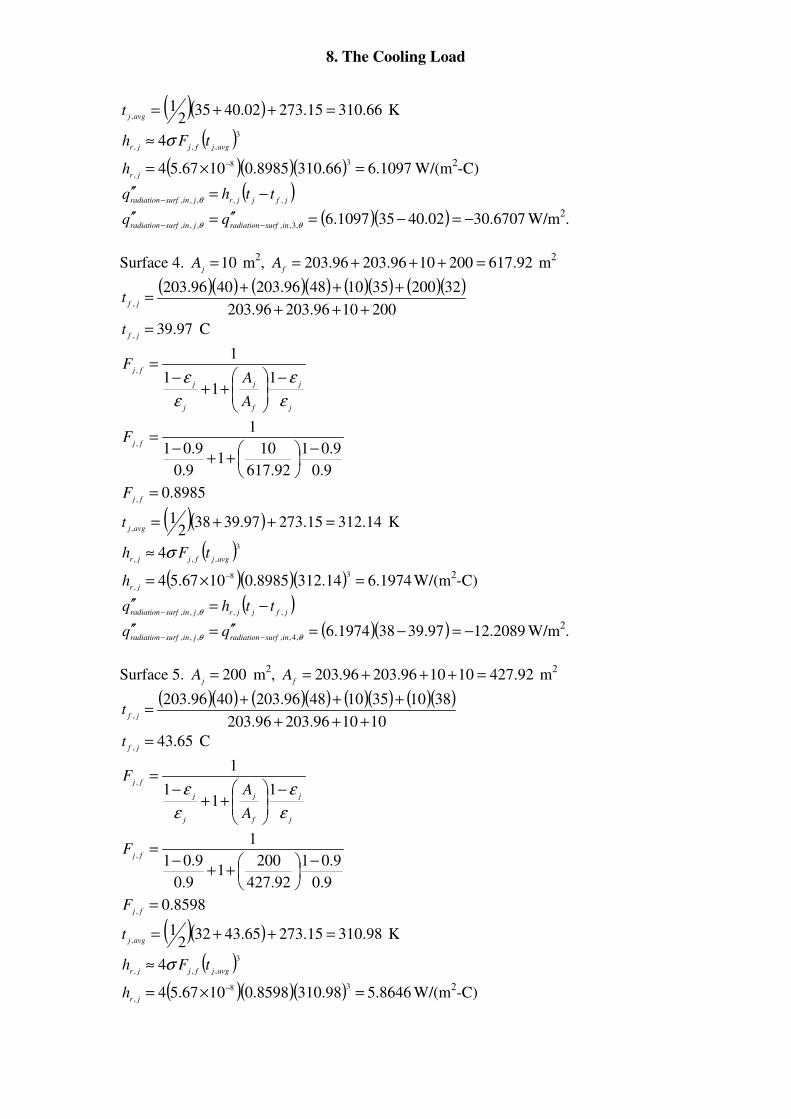
Surface 4. 10=j
A m2, 92.6172001096.20396.203 =+++=
fA m
2
( )( ) ( )( ) ( )( ) ( )( )2001096.20396.203
3220035104896.2034096.203,
+++
+++=
jft
97.39,
=jf
t C
j
j
f
j
j
j
fj
A
AF
ε
ε
ε
ε −
++
−=
11
1
1,
9.0
9.01
92.617
101
9.0
9.01
1, −
++
−=
fjF
8985.0,
=fj
F
( )( ) 14.31215.27397.39382
1,
=++=avgj
t K
( )3
,,,4
avgjfjjrtFh σ≈
( )( )( ) 1974.614.3128985.01067.5438
,=×= −
jrh W/(m
2-C)
( )jfjjrjinsurfradiation
tthq,,,,,
−=′′− θ
( )( ) 2089.1297.39381974.6,4,,,,,
−=−=′′=′′−− θθ insurfradiationjinsurfradiation
qq W/m2.
Surface 5. 200=j
A m2, 92.427101096.20396.203 =+++=
fA m
2
( )( ) ( )( ) ( )( ) ( )( )101096.20396.203
381035104896.2034096.203,
+++
+++=
jft
65.43,
=jf
t C
j
j
f
j
j
j
fj
A
AF
ε
ε
ε
ε −
++
−=
11
1
1,
9.0
9.01
92.427
2001
9.0
9.01
1, −
++
−=
fjF
8598.0,
=fj
F
( )( ) 98.31015.27365.43322
1,
=++=avgj
t K
( )3
,,,4
avgjfjjrtFh σ≈
( )( )( ) 8646.598.3108598.01067.5438
,=×= −
jrh W/(m
2-C)
8. The Cooling Load
( )jfjjrjinsurfradiation
tthq,,,,,
−=′′− θ
( )( ) 3226.6865.43328646.5,5,,,,,
−=−=′′=′′−− θθ insurfradiationjinsurfradiation
qq W/m2.
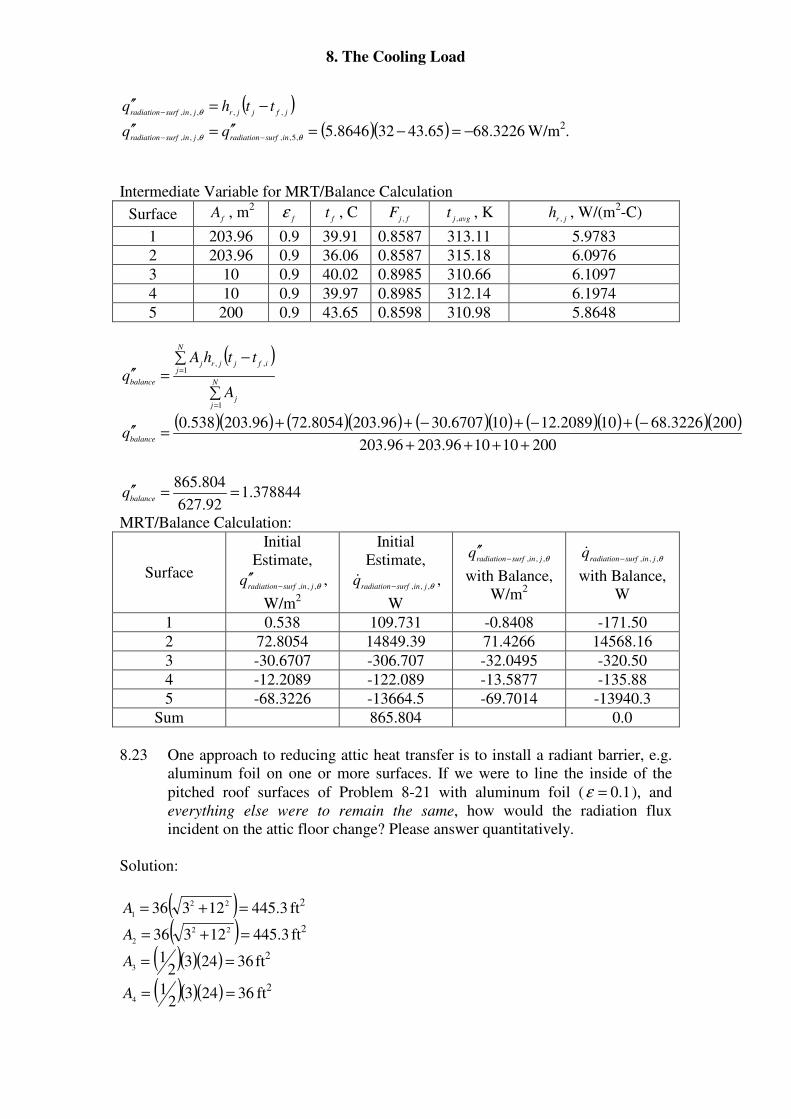
Intermediate Variable for MRT/Balance Calculation
Surface fA , m
2
fε
ft , C
fjF
,
avgjt
,, K
jrh
,, W/(m
2-C)
1 203.96 0.9 39.91 0.8587 313.11 5.9783
2 203.96 0.9 36.06 0.8587 315.18 6.0976
3 10 0.9 40.02 0.8985 310.66 6.1097
4 10 0.9 39.97 0.8985 312.14 6.1974
5 200 0.9 43.65 0.8598 310.98 5.8648
( )
∑
∑ −=′′
=
=
N
jj
N
jifjjrj
balance
A
tthA
q
1
1,,
( )( ) ( )( ) ( )( ) ( )( ) ( )( )200101096.20396.203
2003226.68102089.12106707.3096.2038054.7296.203538.0
++++
−+−+−++=′′
balanceq
378844.192.627
804.865==′′
balanceq
MRT/Balance Calculation:
Surface
Initial
Estimate,
θ,,, jinsurfradiationq
−′′ ,
W/m2
Initial
Estimate,
θ,,, jinsurfradiationq
−& ,
W
θ,,, jinsurfradiationq
−′′
with Balance,
W/m2
θ,,, jinsurfradiationq
−&
with Balance,
W
1 0.538 109.731 -0.8408 -171.50
2 72.8054 14849.39 71.4266 14568.16
3 -30.6707 -306.707 -32.0495 -320.50
4 -12.2089 -122.089 -13.5877 -135.88
5 -68.3226 -13664.5 -69.7014 -13940.3
Sum 865.804 0.0
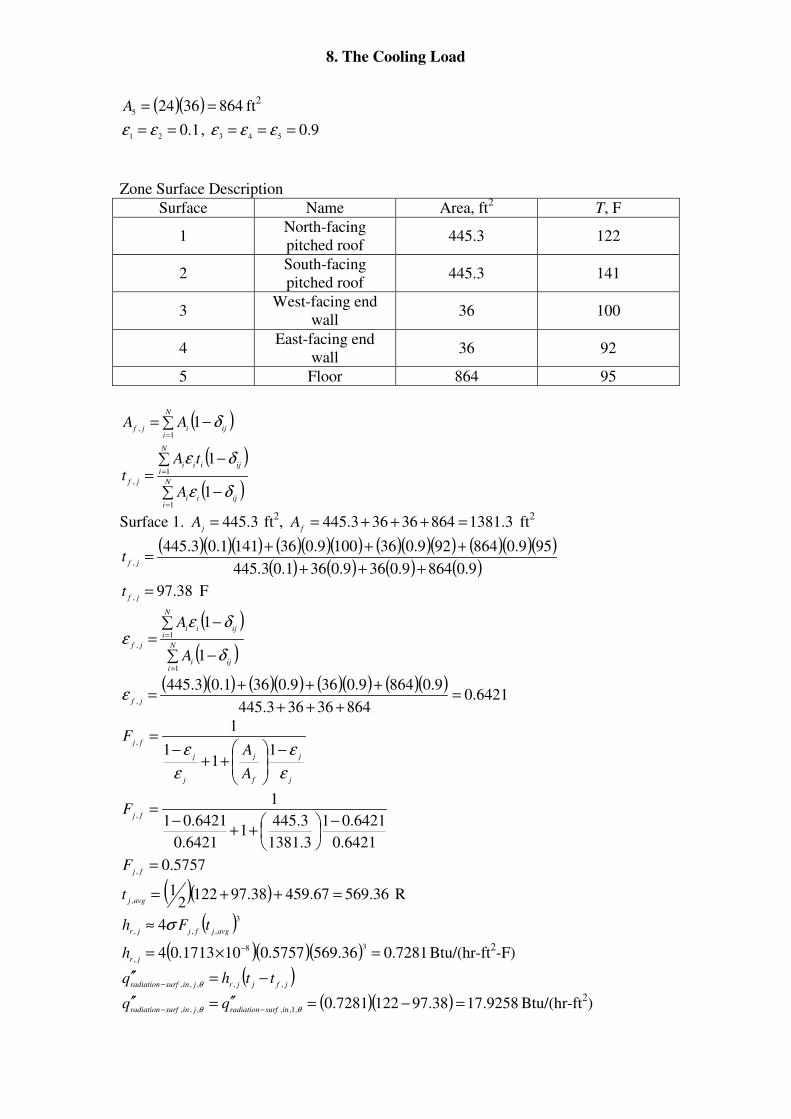
8.23 One approach to reducing attic heat transfer is to install a radiant barrier, e.g.
aluminum foil on one or more surfaces. If we were to line the inside of the
pitched roof surfaces of Problem 8-21 with aluminum foil ( 1.0=ε ), and
everything else were to remain the same, how would the radiation flux
incident on the attic floor change? Please answer quantitatively.
Solution:
( ) 3.44512336 22
1=+=A ft
2
( ) 3.44512336 22
2=+=A ft
2
( )( )( ) 362432
13
==A ft2
( )( )( ) 362432
14
==A ft2
8. The Cooling Load
( )( ) 86436245
==A ft2
1.021
== εε , 9.0543
=== εεε
Zone Surface Description
Surface Name Area, ft2 T, F
1 North-facing
pitched roof 445.3 122
2 South-facing
pitched roof 445.3 141
3 West-facing end
wall 36 100
4 East-facing end
wall 36 92
5 Floor 864 95
( )∑ −==
N
iijijf
AA1
,1 δ
( )
( )∑ −
∑ −=
=
=
N
iijii
N
iijiii
jf
A
tAt
1
1
,
1
1
δε
δε
Surface 1. 3.445=j
A ft2, 3.138186436363.445 =+++=
fA ft
2
( )( )( ) ( )( )( ) ( )( )( ) ( )( )( )( ) ( ) ( ) ( )9.08649.0369.0361.03.445
959.0864929.0361009.0361411.03.445,
+++
+++=
jft
38.97,
=jf
t F
( )
( )∑ −
∑ −=
=
=
N
iiji
N
iijii
jf
A
A
1
1
,
1
1
δ
δεε
( )( ) ( )( ) ( )( ) ( )( )6421.0
86436363.445
9.08649.0369.0361.03.445,
=+++
+++=
jfε
j
j
f
j
j
j
fj
A
AF
ε
ε
ε
ε −
++
−=
11
1
1,
6421.0
6421.01
3.1381
3.4451
6421.0
6421.01
1, −
++
−=
fjF
5757.0,
=fj
F
( )( ) 36.56967.45938.971222
1,
=++=avgj
t R
( )3
,,,4
avgjfjjrtFh σ≈
( )( )( ) 7281.036.5695757.0101713.0438
,=×= −
jrh Btu/(hr-ft
2-F)
( )jfjjrjinsurfradiation
tthq,,,,,
−=′′− θ
( )( ) 9258.1738.971227281.0,1,,,,,
=−=′′=′′−− θθ insurfradiationjinsurfradiation
qq Btu/(hr-ft2)
8. The Cooling Load
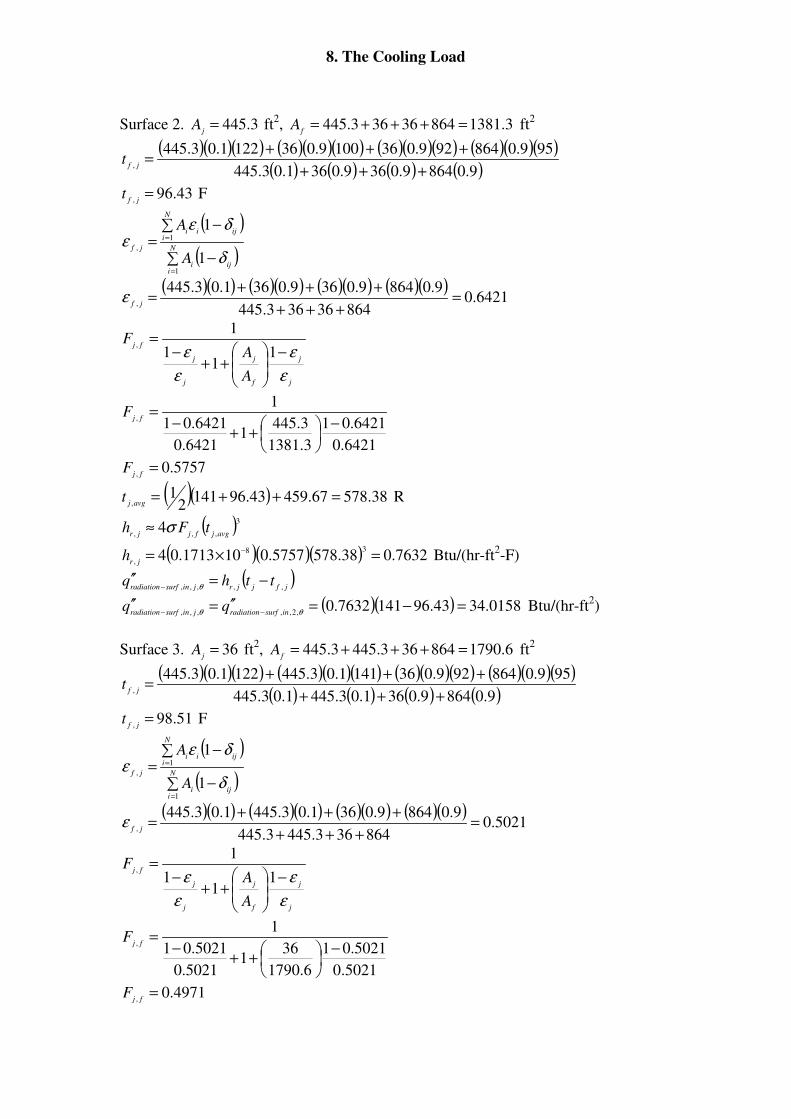
Surface 2. 3.445=j
A ft2, 3.138186436363.445 =+++=
fA ft
2
( )( )( ) ( )( )( ) ( )( )( ) ( )( )( )( ) ( ) ( ) ( )9.08649.0369.0361.03.445
959.0864929.0361009.0361221.03.445,
+++
+++=
jft
43.96,
=jf
t F
( )
( )∑ −
∑ −=
=
=
N
iiji
N
iijii
jf
A
A
1
1
,
1
1
δ
δεε
( )( ) ( )( ) ( )( ) ( )( )6421.0
86436363.445
9.08649.0369.0361.03.445,
=+++
+++=
jfε
j
j
f
j
j
j
fj
A
AF
ε
ε
ε
ε −
++
−=
11
1
1,
6421.0
6421.01
3.1381
3.4451
6421.0
6421.01
1, −
++
−=
fjF
5757.0,
=fj
F
( )( ) 38.57867.45943.961412
1,
=++=avgj
t R
( )3
,,,4
avgjfjjrtFh σ≈
( )( )( ) 7632.038.5785757.0101713.0438
,=×= −
jrh Btu/(hr-ft
2-F)
( )jfjjrjinsurfradiation
tthq,,,,,
−=′′− θ
( )( ) 0158.3443.961417632.0,2,,,,,
=−=′′=′′−− θθ insurfradiationjinsurfradiation
qq Btu/(hr-ft2)
Surface 3. 36=j
A ft2, 6.1790864363.4453.445 =+++=
fA ft
2
( )( )( ) ( )( )( ) ( )( )( ) ( )( )( )( ) ( ) ( ) ( )9.08649.0361.03.4451.03.445
959.0864929.0361411.03.4451221.03.445,
+++
+++=
jft
51.98,
=jf
t F
( )
( )∑ −
∑ −=
=
=
N
iiji
N
iijii
jf
A
A
1
1
,
1
1
δ
δεε
( )( ) ( )( ) ( )( ) ( )( )5021.0
864363.4453.445
9.08649.0361.03.4451.03.445,
=+++
+++=
jfε
j
j
f
j
j
j
fj
A
AF
ε
ε
ε
ε −
++
−=
11
1
1,
5021.0
5021.01
6.1790
361
5021.0
5021.01
1, −
++
−=
fjF
4971.0,
=fj
F
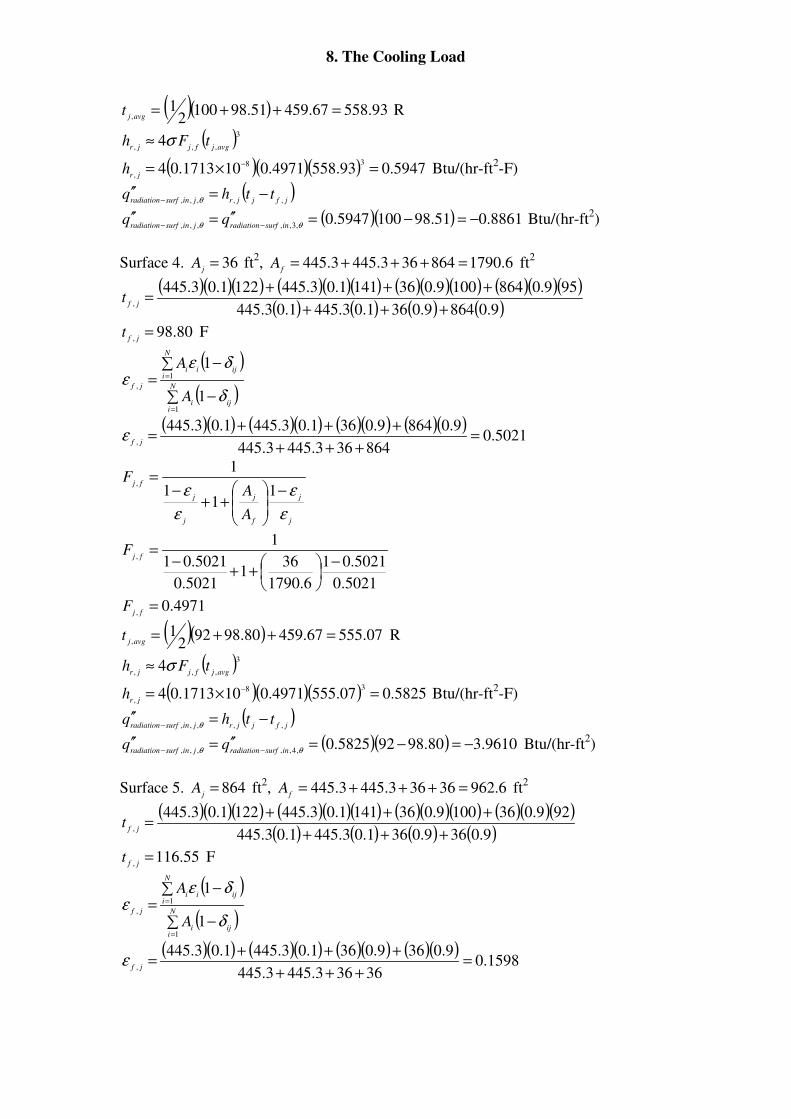
8. The Cooling Load
( )( ) 93.55867.45951.981002
1,
=++=avgj
t R
( )3
,,,4
avgjfjjrtFh σ≈
( )( )( ) 5947.093.5584971.0101713.0438
,=×= −
jrh Btu/(hr-ft
2-F)
( )jfjjrjinsurfradiation
tthq,,,,,
−=′′− θ
( )( ) 8861.051.981005947.0,3,,,,,
−=−=′′=′′−− θθ insurfradiationjinsurfradiation
qq Btu/(hr-ft2)
Surface 4. 36=j
A ft2, 6.1790864363.4453.445 =+++=
fA ft
2
( )( )( ) ( )( )( ) ( )( )( ) ( )( )( )( ) ( ) ( ) ( )9.08649.0361.03.4451.03.445
959.08641009.0361411.03.4451221.03.445,
+++
+++=
jft
80.98,
=jf
t F
( )
( )∑ −
∑ −=
=
=
N
iiji
N
iijii
jf
A
A
1
1
,
1
1
δ
δεε
( )( ) ( )( ) ( )( ) ( )( )5021.0
864363.4453.445
9.08649.0361.03.4451.03.445,
=+++
+++=
jfε
j
j
f
j
j
j
fj
A
AF
ε
ε
ε
ε −
++
−=
11
1
1,
5021.0
5021.01
6.1790
361
5021.0
5021.01
1, −
++
−=
fjF
4971.0,
=fj
F
( )( ) 07.55567.45980.98922
1,
=++=avgj
t R
( )3
,,,4
avgjfjjrtFh σ≈
( )( )( ) 5825.007.5554971.0101713.0438
,=×= −
jrh Btu/(hr-ft
2-F)
( )jfjjrjinsurfradiation
tthq,,,,,
−=′′− θ
( )( ) 9610.380.98925825.0,4,,,,,
−=−=′′=′′−− θθ insurfradiationjinsurfradiation
qq Btu/(hr-ft2)
Surface 5. 864=j
A ft2, 6.96236363.4453.445 =+++=
fA ft
2
( )( )( ) ( )( )( ) ( )( )( ) ( )( )( )( ) ( ) ( ) ( )9.0369.0361.03.4451.03.445
929.0361009.0361411.03.4451221.03.445,
+++
+++=
jft
55.116,
=jf
t F
( )
( )∑ −
∑ −=
=
=
N
iiji
N
iijii
jf
A
A
1
1
,
1
1
δ
δεε
( )( ) ( )( ) ( )( ) ( )( )1598.0
36363.4453.445
9.0369.0361.03.4451.03.445,
=+++
+++=
jfε
8. The Cooling Load
j
j
f
j
j
j
fj
A
AF
ε
ε
ε
ε −
++
−=
11
1
1,
1598.0
1598.01
6.962
8641
1598.0
1598.01
1, −
++
−=
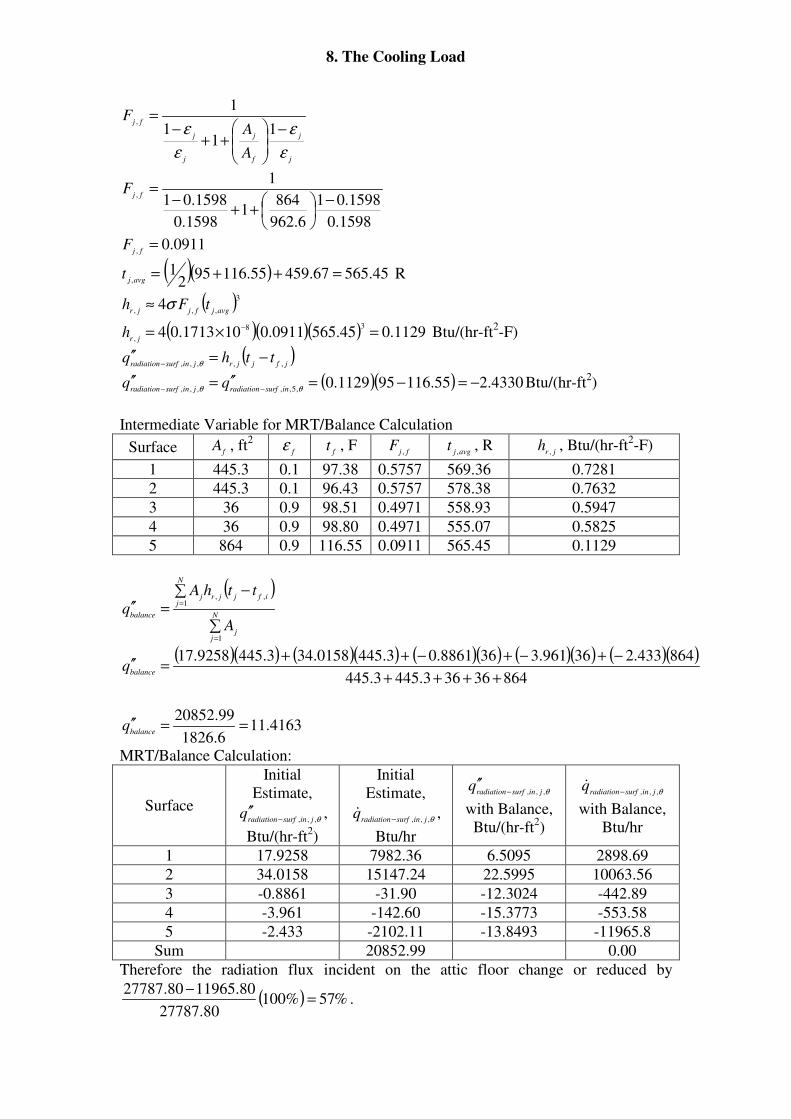
fjF
0911.0,
=fj
F
( )( ) 45.56567.45955.116952
1,
=++=avgj
t R
( )3
,,,4
avgjfjjrtFh σ≈
( )( )( ) 1129.045.5650911.0101713.0438
,=×= −
jrh Btu/(hr-ft
2-F)
( )jfjjrjinsurfradiation
tthq,,,,,
−=′′− θ
( )( ) 4330.255.116951129.0,5,,,,,
−=−=′′=′′−− θθ insurfradiationjinsurfradiation
qq Btu/(hr-ft2)
Intermediate Variable for MRT/Balance Calculation
Surface fA , ft
2
fε
ft , F
fjF
,
avgjt
,, R
jrh
,, Btu/(hr-ft
2-F)
1 445.3 0.1 97.38 0.5757 569.36 0.7281
2 445.3 0.1 96.43 0.5757 578.38 0.7632
3 36 0.9 98.51 0.4971 558.93 0.5947
4 36 0.9 98.80 0.4971 555.07 0.5825
5 864 0.9 116.55 0.0911 565.45 0.1129
( )
∑
∑ −=′′
=
=
N
jj
N
jifjjrj
balance
A
tthA
q
1
1,,
( )( ) ( )( ) ( )( ) ( )( ) ( )( )86436363.4453.445
864433.236961.3368861.03.4450158.343.4459258.17
++++
−+−+−++=′′
balanceq
4163.116.1826
99.20852==′′
balanceq
MRT/Balance Calculation:
Surface
Initial
Estimate,
θ,,, jinsurfradiationq
−′′ ,
Btu/(hr-ft2)
Initial
Estimate,
θ,,, jinsurfradiationq
−& ,
Btu/hr
θ,,, jinsurfradiationq
−′′
with Balance,
Btu/(hr-ft2)
θ,,, jinsurfradiationq
−&
with Balance,
Btu/hr
1 17.9258 7982.36 6.5095 2898.69
2 34.0158 15147.24 22.5995 10063.56
3 -0.8861 -31.90 -12.3024 -442.89
4 -3.961 -142.60 -15.3773 -553.58
5 -2.433 -2102.11 -13.8493 -11965.8
Sum 20852.99 0.00
Therefore the radiation flux incident on the attic floor change or reduced by
( ) %57%10080.27787
80.1196580.27787=
−.
8. The Cooling Load
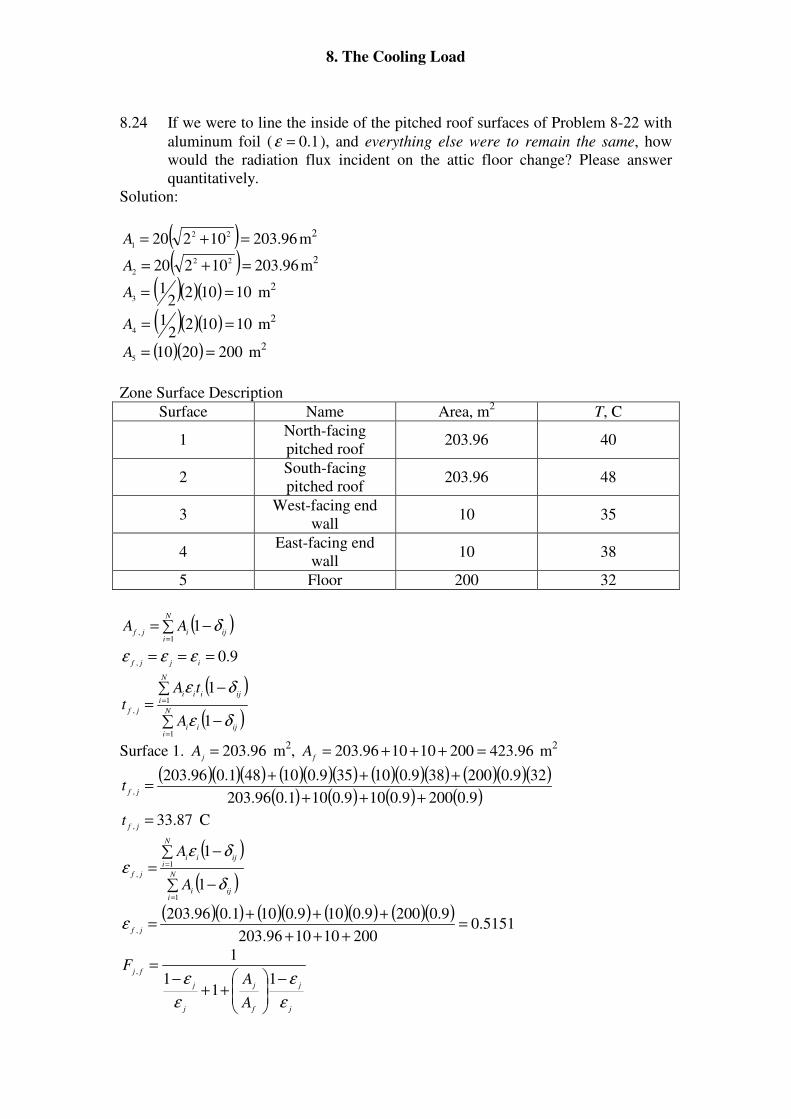
8.24 If we were to line the inside of the pitched roof surfaces of Problem 8-22 with
aluminum foil ( 1.0=ε ), and everything else were to remain the same, how
would the radiation flux incident on the attic floor change? Please answer
quantitatively.
Solution:
( ) 96.20310220 22
1=+=A m
2
( ) 96.20310220 22
2=+=A m
2
( )( )( ) 101022
13
==A m2
( )( )( ) 101022
14
==A m2
( )( ) 20020105
==A m2
Zone Surface Description
Surface Name Area, m2 T, C
1 North-facing
pitched roof 203.96 40
2 South-facing
pitched roof 203.96 48
3 West-facing end
wall 10 35
4 East-facing end
wall 10 38
5 Floor 200 32
( )∑ −==
N
iijijf
AA1
,1 δ
9.0,
===ijjf
εεε
( )
( )∑ −
∑ −=
=
=
N
iijii
N
iijiii
jf
A
tAt
1
1
,
1
1
δε
δε
Surface 1. 96.203=j
A m2, 96.423200101096.203 =+++=
fA m
2
( )( )( ) ( )( )( ) ( )( )( ) ( )( )( )( ) ( ) ( ) ( )9.02009.0109.0101.096.203
329.0200389.010359.010481.096.203,
+++
+++=
jft
87.33,
=jf
t C
( )
( )∑ −
∑ −=
=
=
N
iiji
N
iijii
jf
A
A
1
1
,
1
1
δ
δεε
( )( ) ( )( ) ( )( ) ( )( )5151.0
200101096.203
9.02009.0109.0101.096.203,
=+++
+++=
jfε
j
j
f
j
j
j
fj
A
AF
ε
ε
ε
ε −
++
−=
11
1
1,
8. The Cooling Load
5151.0
5151.01
96.423
96.2031
5151.0
5151.01
1, −
++
−=
fjF
4177.0,
=fj
F
( )( ) 08.31015.27387.33402
1,
=++=avgj
t K
( )3
,,,4
avgjfjjrtFh σ≈
( )( )( ) 8244.208.3104177.01067.5438
,=×= −
jrh W/(m
2-C)
( )jfjjrjinsurfradiation
tthq,,,,,
−=′′− θ
( )( ) 3136.1787.33408244.2,1,,,,,
=−=′′=′′−− θθ insurfradiationjinsurfradiation
qq W/m2.
Surface 2. 96.203=j
A m2, 96.423200101096.203 =+++=
fA m
2
( )( )( ) ( )( )( ) ( )( )( ) ( )( )( )( ) ( ) ( ) ( )9.02009.0109.0101.096.203
329.0200389.010359.010401.096.203,
+++
+++=
jft
12.33,
=jf
t C
( )
( )∑ −
∑ −=
=
=
N
iiji
N
iijii
jf
A
A
1
1
,
1
1
δ
δεε
( )( ) ( )( ) ( )( ) ( )( )5151.0
200101096.203
9.02009.0109.0101.096.203,
=+++
+++=
jfε
j
j
f
j
j
j
fj
A
AF
ε
ε
ε
ε −
++
−=
11
1
1,
5151.0
5151.01
96.423
96.2031
5151.0
5151.01
1, −
++
−=
fjF
4177.0,
=fj
F
( )( ) 71.31315.27312.33482
1,
=++=avgj
t K
( )3
,,,4
avgjfjjrtFh σ≈
( )( )( ) 9248.271.3134177.01067.5438
,=×= −
jrh W/(m
2-C)
( )jfjjrjinsurfradiation
tthq,,,,,
−=′′− θ
( )( ) 5210.4312.33489248.2,2,,,,,
=−=′′=′′−− θθ insurfradiationjinsurfradiation
qq W/m2.
Surface 3. 10=j
A m2, 92.6172001096.20396.203 =+++=
fA m
2
( )( )( ) ( )( )( ) ( )( )( ) ( )( )( )( ) ( ) ( ) ( )9.02009.0101.096.2031.096.203
329.0200389.010481.096.203401.096.203,
+++
+++=
jft
37.34,
=jf
t C
8. The Cooling Load
( )
( )∑ −
∑ −=
=
=
N
iiji
N
iijii
jf
A
A
1
1
,
1
1
δ
δεε
( )( ) ( )( ) ( )( ) ( )( )3719.0
2001096.20396.203
9.02009.0101.096.2031.096.203,
=+++
+++=
jfε
j
j
f
j
j
j
fj
A
AF
ε
ε
ε
ε −
++
−=
11
1
1,
3719.0
3719.01
92.617
101
3719.0
3719.01
1, −
++
−=
fjF
3682.0,
=fj
F
( )( ) 28.30915.27337.34352
1,
=++=avgj
t K
( )3
,,,4
avgjfjjrtFh σ≈
( )( )( ) 4361.284.3073682.01067.5438
,=×= −
jrh W/(m
2-C)
( )jfjjrjinsurfradiation
tthq,,,,,
−=′′− θ
( )( ) 5347.137.34354361.2,3,,,,,
=−=′′=′′−− θθ insurfradiationjinsurfradiation
qq W/m2.
Surface 4. 10=j
A m2, 92.6172001096.20396.203 =+++=
fA m
2
( )( )( ) ( )( )( ) ( )( )( ) ( )( )( )( ) ( ) ( ) ( )9.02009.0101.096.2031.096.203
329.0200359.010481.096.203401.096.203,
+++
+++=
jft
25.34,
=jf
t C
( )
( )∑ −
∑ −=
=
=
N
iiji
N
iijii
jf
A
A
1
1
,
1
1
δ
δεε
( )( ) ( )( ) ( )( ) ( )( )3719.0
2001096.20396.203
9.02009.0101.096.2031.096.203,
=+++
+++=
jfε
j
j
f
j
j
j
fj
A
AF
ε
ε
ε
ε −
++
−=
11
1
1,
3719.0
3719.01
92.617
101
3719.0
3719.01
1, −
++
−=
fjF
3682.0,
=fj
F
( )( ) 28.30915.27325.34382
1,
=++=avgj
t K
( )3
,,,4
avgjfjjrtFh σ≈
( )( )( ) 4705.228.3093682.01067.5438
,=×= −
jrh W/(m
2-C)
( )jfjjrjinsurfradiation
tthq,,,,,
−=′′− θ
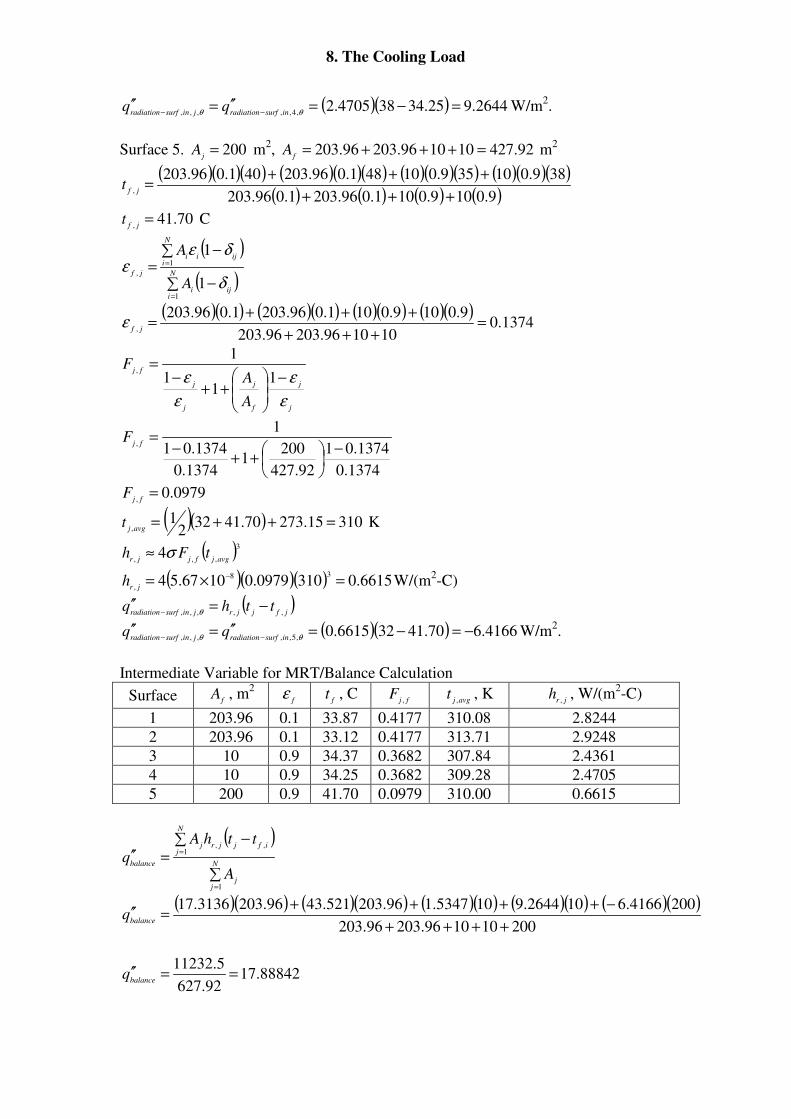
8. The Cooling Load
( )( ) 2644.925.34384705.2,4,,,,,
=−=′′=′′−− θθ insurfradiationjinsurfradiation
qq W/m2.
Surface 5. 200=j
A m2, 92.427101096.20396.203 =+++=
fA m
2
( )( )( ) ( )( )( ) ( )( )( ) ( )( )( )( ) ( ) ( ) ( )9.0109.0101.096.2031.096.203
389.010359.010481.096.203401.096.203,
+++
+++=
jft
70.41,
=jf
t C
( )
( )∑ −
∑ −=
=
=
N
iiji
N
iijii
jf
A
A
1
1
,
1
1
δ
δεε
( )( ) ( )( ) ( )( ) ( )( )1374.0
101096.20396.203
9.0109.0101.096.2031.096.203,
=+++
+++=
jfε
j
j
f
j
j
j
fj
A
AF
ε
ε
ε
ε −
++
−=
11
1
1,
1374.0
1374.01
92.427
2001
1374.0
1374.01
1, −
++
−=
fjF
0979.0,
=fj
F
( )( ) 31015.27370.41322
1,
=++=avgj
t K
( )3
,,,4
avgjfjjrtFh σ≈
( )( )( ) 6615.03100979.01067.5438
,=×= −
jrh W/(m
2-C)
( )jfjjrjinsurfradiation
tthq,,,,,
−=′′− θ
( )( ) 4166.670.41326615.0,5,,,,,
−=−=′′=′′−− θθ insurfradiationjinsurfradiation
qq W/m2.
Intermediate Variable for MRT/Balance Calculation
Surface fA , m
2
fε
ft , C
fjF
,
avgjt
,, K
jrh
,, W/(m
2-C)
1 203.96 0.1 33.87 0.4177 310.08 2.8244
2 203.96 0.1 33.12 0.4177 313.71 2.9248
3 10 0.9 34.37 0.3682 307.84 2.4361
4 10 0.9 34.25 0.3682 309.28 2.4705
5 200 0.9 41.70 0.0979 310.00 0.6615
( )
∑
∑ −=′′
=
=
N
jj
N
jifjjrj
balance
A
tthA
q
1
1,,
( )( ) ( )( ) ( )( ) ( )( ) ( )( )200101096.20396.203
2004166.6102644.9105347.196.203521.4396.2033136.17
++++
−++++=′′
balanceq
88842.1792.627
5.11232==′′
balanceq
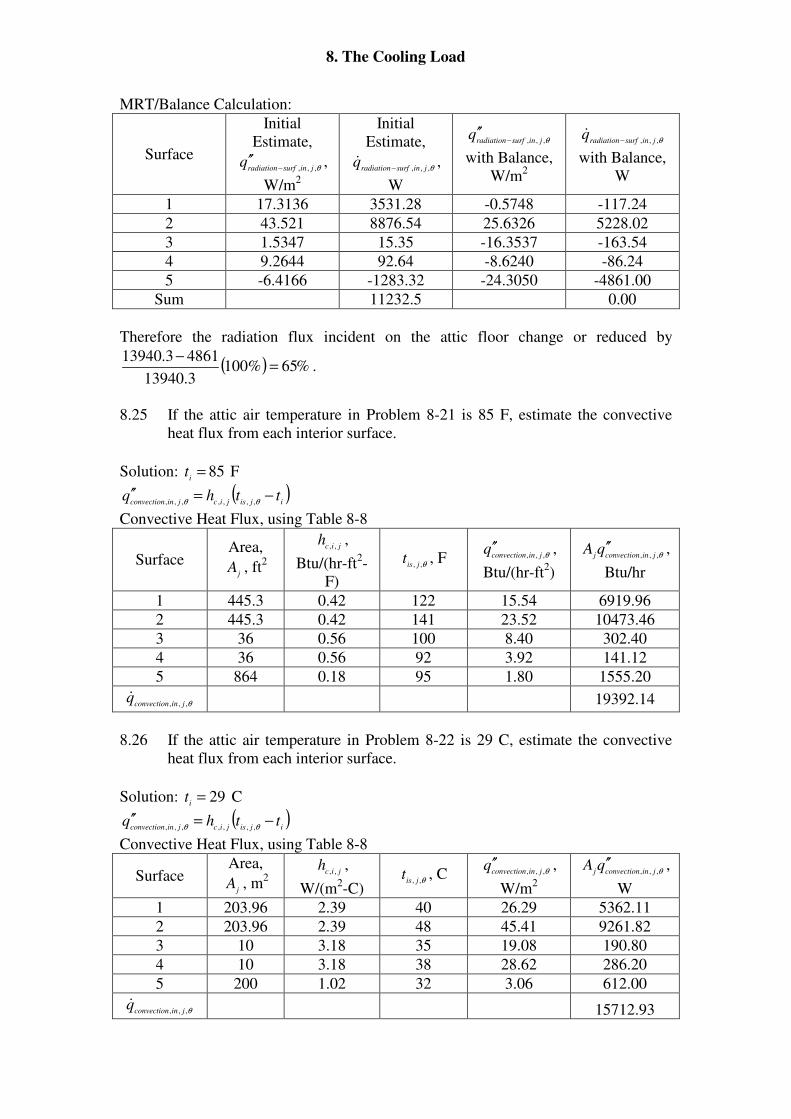
8. The Cooling Load
MRT/Balance Calculation:
Surface
Initial
Estimate,
θ,,, jinsurfradiationq
−′′ ,
W/m2
Initial
Estimate,
θ,,, jinsurfradiationq
−& ,
W
θ,,, jinsurfradiationq
−′′
with Balance,
W/m2
θ,,, jinsurfradiationq
−&
with Balance,
W
1 17.3136 3531.28 -0.5748 -117.24
2 43.521 8876.54 25.6326 5228.02
3 1.5347 15.35 -16.3537 -163.54
4 9.2644 92.64 -8.6240 -86.24
5 -6.4166 -1283.32 -24.3050 -4861.00
Sum 11232.5 0.00
Therefore the radiation flux incident on the attic floor change or reduced by
( ) %65%1003.13940
48613.13940=
−.
8.25 If the attic air temperature in Problem 8-21 is 85 F, estimate the convective
heat flux from each interior surface.
Solution: 85=i
t F
( )ijisjicjinconvection
tthq −=′′θθ ,,,,,,,
Convective Heat Flux, using Table 8-8
Surface Area,
jA , ft
2
jich
,,,
Btu/(hr-ft2-
F)
θ,, jist , F θ,,, jinconvection
q ′′ ,
Btu/(hr-ft2)
θ,,, jinconvectionjqA ′′ ,
Btu/hr
1 445.3 0.42 122 15.54 6919.96
2 445.3 0.42 141 23.52 10473.46
3 36 0.56 100 8.40 302.40
4 36 0.56 92 3.92 141.12
5 864 0.18 95 1.80 1555.20
θ,,, jinconvectionq& 19392.14
8.26 If the attic air temperature in Problem 8-22 is 29 C, estimate the convective
heat flux from each interior surface.
Solution: 29=i
t C
( )ijisjicjinconvection
tthq −=′′θθ ,,,,,,,
Convective Heat Flux, using Table 8-8
Surface Area,
jA , m
2
jich
,,,
W/(m2-C)
θ,, jist , C θ,,, jinconvection
q ′′ ,
W/m2
θ,,, jinconvectionjqA ′′ ,
W
1 203.96 2.39 40 26.29 5362.11
2 203.96 2.39 48 45.41 9261.82
3 10 3.18 35 19.08 190.80
4 10 3.18 38 28.62 286.20
5 200 1.02 32 3.06 612.00
θ,,, jinconvectionq& 15712.93
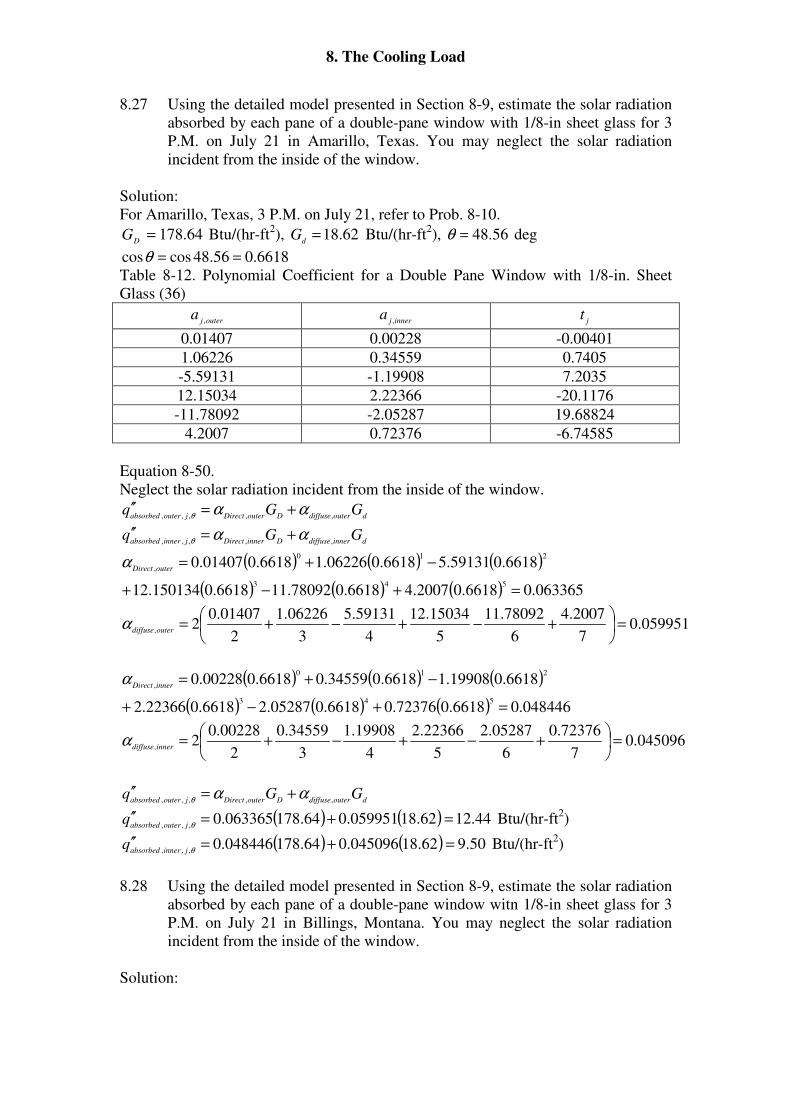
8. The Cooling Load
8.27 Using the detailed model presented in Section 8-9, estimate the solar radiation
absorbed by each pane of a double-pane window with 1/8-in sheet glass for 3
P.M. on July 21 in Amarillo, Texas. You may neglect the solar radiation
incident from the inside of the window.
Solution:
For Amarillo, Texas, 3 P.M. on July 21, refer to Prob. 8-10.
64.178=D
G Btu/(hr-ft2), 62.18=
dG Btu/(hr-ft
2), 56.48=θ deg
6618.056.48coscos ==θ
Table 8-12. Polynomial Coefficient for a Double Pane Window with 1/8-in. Sheet
Glass (36)
outerja
,
innerja
,
jt
0.01407 0.00228 -0.00401
1.06226 0.34559 0.7405
-5.59131 -1.19908 7.2035
12.15034 2.22366 -20.1176
-11.78092 -2.05287 19.68824
4.2007 0.72376 -6.74585
Equation 8-50.
Neglect the solar radiation incident from the inside of the window.
douterdiffuseDouterDirectjouterabsorbedGGq
,,,,,ααθ +=′′
dinnerdiffuseDinnerDirectjinnerabsorbedGGq
,,,,,ααθ +=′′
( ) ( ) ( )
( ) ( ) ( ) 063365.06618.02007.46618.078092.116618.0150134.12
6618.059131.56618.006226.16618.001407.0
543
210
,
=+−+
−+=outerDirect
α
059951.07
2007.4
6
78092.11
5
15034.12
4
59131.5
3
06226.1
2
01407.02
,=
+−+−+=
outerdiffuseα
( ) ( ) ( )
( ) ( ) ( ) 048446.06618.072376.06618.005287.26618.022366.2
6618.019908.16618.034559.06618.000228.0
543
210
,
=+−+
−+=innerDirect
α
045096.07
72376.0
6
05287.2
5
22366.2
4
19908.1
3
34559.0
2
00228.02
,=
+−+−+=
innerdiffuseα
douterdiffuseDouterDirectjouterabsorbedGGq
,,,,,ααθ +=′′
( ) ( ) 44.1262.18059951.064.178063365.0,,,
=+=′′θjouterabsorbed
q Btu/(hr-ft2)
( ) ( ) 50.962.18045096.064.178048446.0,,,
=+=′′θjinnerabsorbed
q Btu/(hr-ft2)
8.28 Using the detailed model presented in Section 8-9, estimate the solar radiation
absorbed by each pane of a double-pane window witn 1/8-in sheet glass for 3
P.M. on July 21 in Billings, Montana. You may neglect the solar radiation
incident from the inside of the window.
Solution:
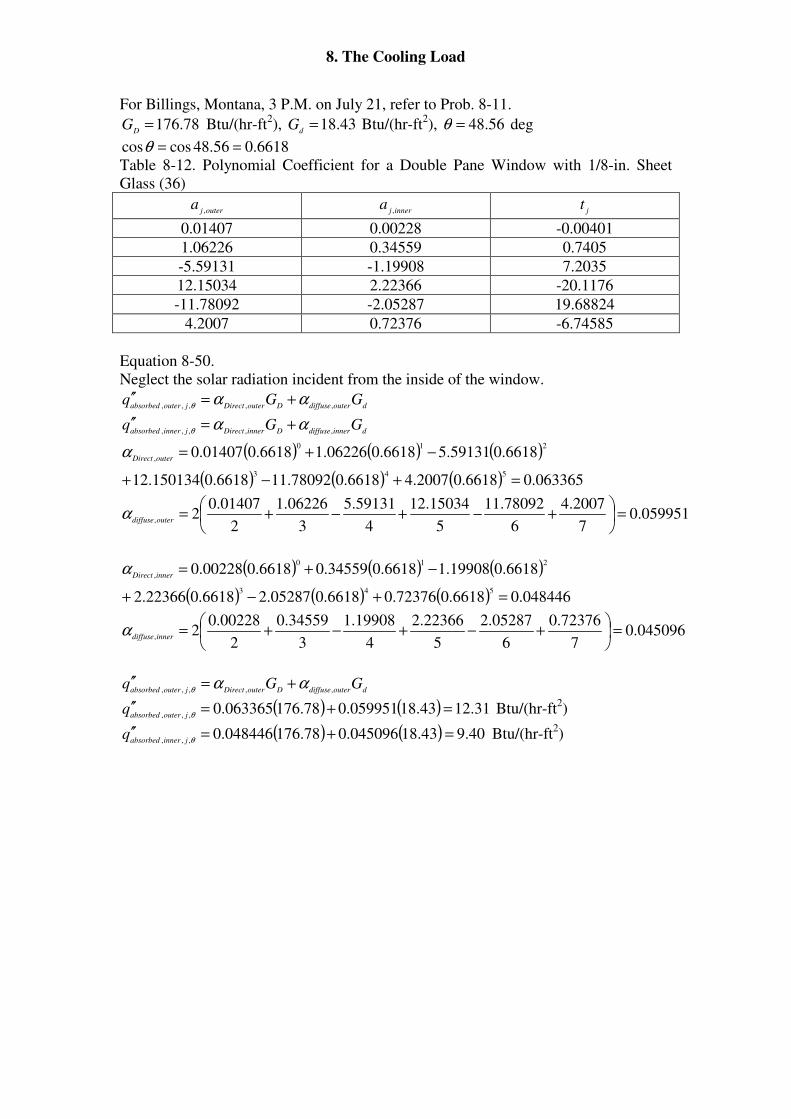
8. The Cooling Load
For Billings, Montana, 3 P.M. on July 21, refer to Prob. 8-11.
78.176=D
G Btu/(hr-ft2), 43.18=
dG Btu/(hr-ft
2), 56.48=θ deg
6618.056.48coscos ==θ
Table 8-12. Polynomial Coefficient for a Double Pane Window with 1/8-in. Sheet
Glass (36)
outerja
,
innerja
,
jt
0.01407 0.00228 -0.00401
1.06226 0.34559 0.7405
-5.59131 -1.19908 7.2035
12.15034 2.22366 -20.1176
-11.78092 -2.05287 19.68824
4.2007 0.72376 -6.74585
Equation 8-50.
Neglect the solar radiation incident from the inside of the window.
douterdiffuseDouterDirectjouterabsorbedGGq
,,,,,ααθ +=′′
dinnerdiffuseDinnerDirectjinnerabsorbedGGq
,,,,,ααθ +=′′
( ) ( ) ( )
( ) ( ) ( ) 063365.06618.02007.46618.078092.116618.0150134.12
6618.059131.56618.006226.16618.001407.0
543
210
,
=+−+
−+=outerDirect
α
059951.07
2007.4
6
78092.11
5
15034.12
4
59131.5
3
06226.1
2
01407.02
,=
+−+−+=
outerdiffuseα
( ) ( ) ( )
( ) ( ) ( ) 048446.06618.072376.06618.005287.26618.022366.2
6618.019908.16618.034559.06618.000228.0
543
210
,
=+−+
−+=innerDirect
α
045096.07
72376.0
6
05287.2
5
22366.2
4
19908.1
3
34559.0
2
00228.02
,=
+−+−+=
innerdiffuseα
douterdiffuseDouterDirectjouterabsorbedGGq
,,,,,ααθ +=′′
( ) ( ) 31.1243.18059951.078.176063365.0,,,
=+=′′θjouterabsorbed
q Btu/(hr-ft2)
( ) ( ) 40.943.18045096.078.176048446.0,,,
=+=′′θjinnerabsorbed
q Btu/(hr-ft2)
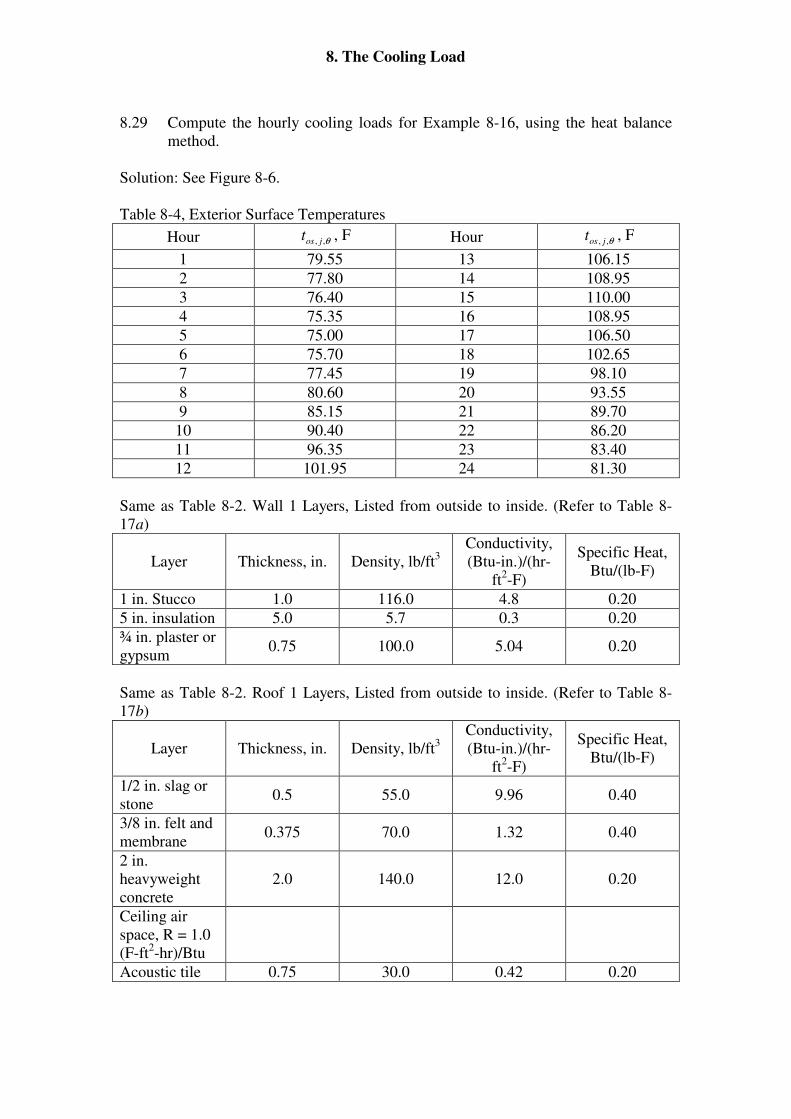
8. The Cooling Load
8.29 Compute the hourly cooling loads for Example 8-16, using the heat balance
method.
Solution: See Figure 8-6.
Table 8-4, Exterior Surface Temperatures
Hour θ,, jost , F Hour θ,, jost , F
1 79.55 13 106.15
2 77.80 14 108.95
3 76.40 15 110.00
4 75.35 16 108.95
5 75.00 17 106.50
6 75.70 18 102.65
7 77.45 19 98.10
8 80.60 20 93.55
9 85.15 21 89.70
10 90.40 22 86.20
11 96.35 23 83.40
12 101.95 24 81.30
Same as Table 8-2. Wall 1 Layers, Listed from outside to inside. (Refer to Table 8-
17a)
Layer Thickness, in. Density, lb/ft3
Conductivity,
(Btu-in.)/(hr-
ft2-F)
Specific Heat,
Btu/(lb-F)
1 in. Stucco 1.0 116.0 4.8 0.20
5 in. insulation 5.0 5.7 0.3 0.20
¾ in. plaster or
gypsum 0.75 100.0 5.04 0.20
Same as Table 8-2. Roof 1 Layers, Listed from outside to inside. (Refer to Table 8-
17b)
Layer Thickness, in. Density, lb/ft3
Conductivity,
(Btu-in.)/(hr-
ft2-F)
Specific Heat,
Btu/(lb-F)
1/2 in. slag or
stone 0.5 55.0 9.96 0.40
3/8 in. felt and
membrane 0.375 70.0 1.32 0.40
2 in.
heavyweight
concrete
2.0 140.0 12.0 0.20
Ceiling air
space, R = 1.0
(F-ft2-hr)/Btu
Acoustic tile 0.75 30.0 0.42 0.20
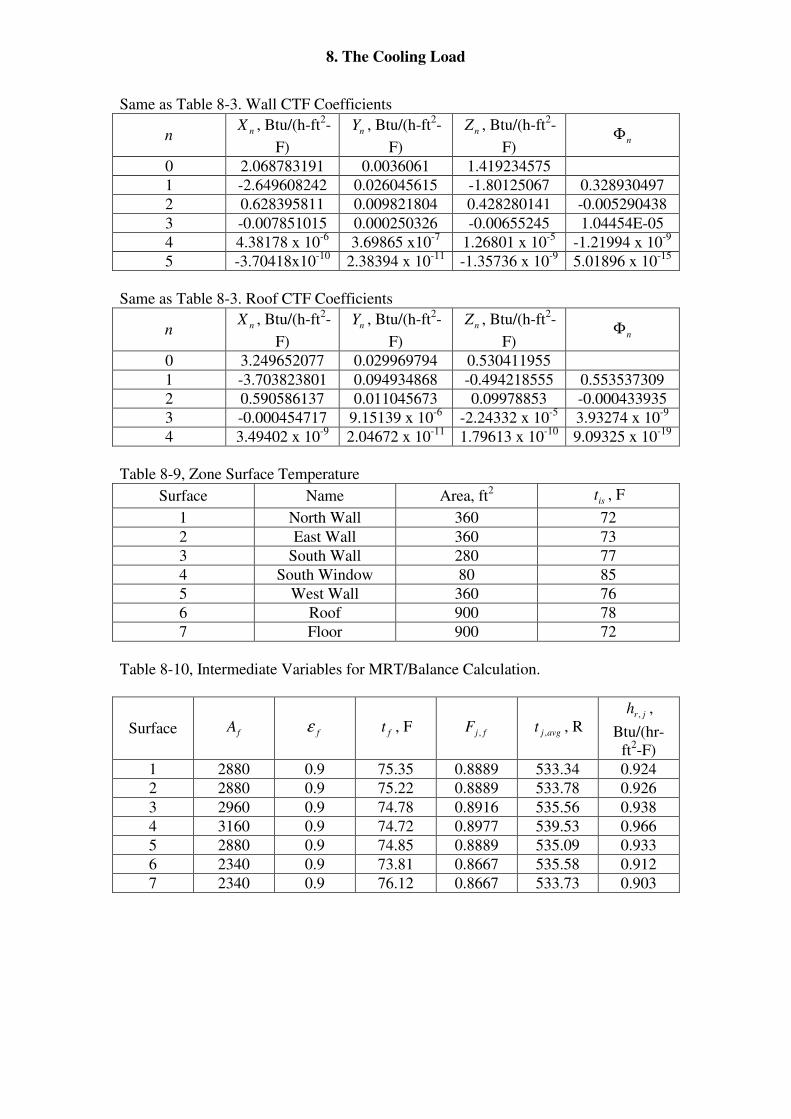
8. The Cooling Load
Same as Table 8-3. Wall CTF Coefficients
n nX , Btu/(h-ft2-
F)
nY , Btu/(h-ft2-
F)
nZ , Btu/(h-ft2-
F) nΦ
0 2.068783191 0.0036061 1.419234575
1 -2.649608242 0.026045615 -1.80125067 0.328930497
2 0.628395811 0.009821804 0.428280141 -0.005290438
3 -0.007851015 0.000250326 -0.00655245 1.04454E-05
4 4.38178 x 10⁻⁶
3.69865 x10⁻⁷
1.26801 x 10⁻⁵
-1.21994 x 10⁻⁹
5 -3.70418x10⁻¹⁰
2.38394 x 10⁻¹¹
-1.35736 x 10⁻⁹
5.01896 x 10⁻¹⁵
Same as Table 8-3. Roof CTF Coefficients
n nX , Btu/(h-ft2-
F)
nY , Btu/(h-ft2-
F)
nZ , Btu/(h-ft2-
F) nΦ
0 3.249652077 0.029969794 0.530411955
1 -3.703823801 0.094934868 -0.494218555 0.553537309
2 0.590586137 0.011045673 0.09978853 -0.000433935
3 -0.000454717 9.15139 x 10⁻⁶
-2.24332 x 10⁻⁵
3.93274 x 10⁻⁹
4 3.49402 x 10⁻⁹
2.04672 x 10⁻¹¹
1.79613 x 10⁻¹⁰
9.09325 x 10⁻¹⁹
Table 8-9, Zone Surface Temperature
Surface Name Area, ft2 ist , F
1 North Wall 360 72
2 East Wall 360 73
3 South Wall 280 77
4 South Window 80 85
5 West Wall 360 76
6 Roof 900 78
7 Floor 900 72
Table 8-10, Intermediate Variables for MRT/Balance Calculation.
Surface fA fε ft , F fjF , avgjt , , R jrh , ,
Btu/(hr-
ft2-F)
1 2880 0.9 75.35 0.8889 533.34 0.924
2 2880 0.9 75.22 0.8889 533.78 0.926
3 2960 0.9 74.78 0.8916 535.56 0.938
4 3160 0.9 74.72 0.8977 539.53 0.966
5 2880 0.9 74.85 0.8889 535.09 0.933
6 2340 0.9 73.81 0.8667 535.58 0.912
7 2340 0.9 76.12 0.8667 533.73 0.903
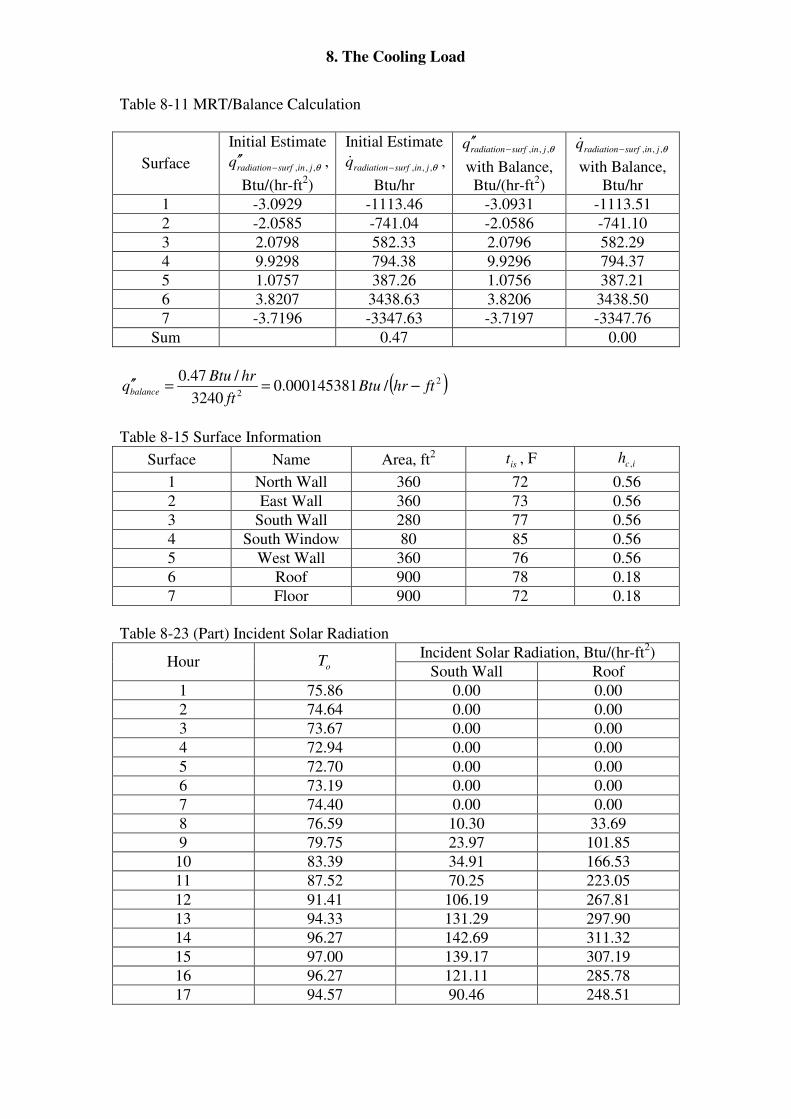
8. The Cooling Load
Table 8-11 MRT/Balance Calculation
Surface
Initial Estimate
θ,,, jinsurfradiationq −′′ ,
Btu/(hr-ft2)
Initial Estimate
θ,,, jinsurfradiationq −& ,
Btu/hr
θ,,, jinsurfradiationq −′′
with Balance,
Btu/(hr-ft2)
θ,,, jinsurfradiationq −&
with Balance,
Btu/hr
1 -3.0929 -1113.46 -3.0931 -1113.51
2 -2.0585 -741.04 -2.0586 -741.10
3 2.0798 582.33 2.0796 582.29
4 9.9298 794.38 9.9296 794.37
5 1.0757 387.26 1.0756 387.21
6 3.8207 3438.63 3.8206 3438.50
7 -3.7196 -3347.63 -3.7197 -3347.76
Sum 0.47 0.00
( )2
2/000145381.0
3240
/47.0fthrBtu
ft
hrBtuqbalance −==′′
Table 8-15 Surface Information
Surface Name Area, ft2 ist , F ich ,
1 North Wall 360 72 0.56
2 East Wall 360 73 0.56
3 South Wall 280 77 0.56
4 South Window 80 85 0.56
5 West Wall 360 76 0.56
6 Roof 900 78 0.18
7 Floor 900 72 0.18
Table 8-23 (Part) Incident Solar Radiation
Incident Solar Radiation, Btu/(hr-ft2)
Hour oT South Wall Roof
1 75.86 0.00 0.00
2 74.64 0.00 0.00
3 73.67 0.00 0.00
4 72.94 0.00 0.00
5 72.70 0.00 0.00
6 73.19 0.00 0.00
7 74.40 0.00 0.00
8 76.59 10.30 33.69
9 79.75 23.97 101.85
10 83.39 34.91 166.53
11 87.52 70.25 223.05
12 91.41 106.19 267.81
13 94.33 131.29 297.90
14 96.27 142.69 311.32
15 97.00 139.17 307.19
16 96.27 121.11 285.78
17 94.57 90.46 248.51
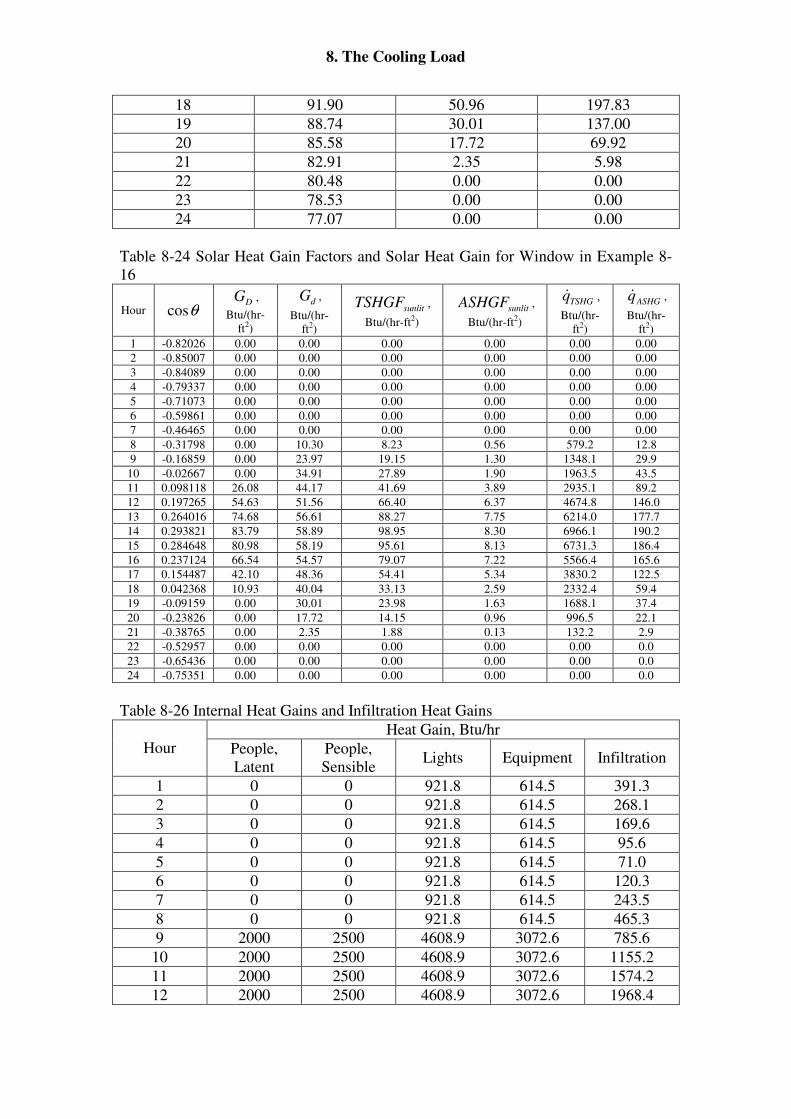
8. The Cooling Load
18 91.90 50.96 197.83
19 88.74 30.01 137.00
20 85.58 17.72 69.92
21 82.91 2.35 5.98
22 80.48 0.00 0.00
23 78.53 0.00 0.00
24 77.07 0.00 0.00
Table 8-24 Solar Heat Gain Factors and Solar Heat Gain for Window in Example 8-
16
Hour θcos DG ,
Btu/(hr-
ft2)
dG ,
Btu/(hr-
ft2)
sunlitTSHGF ,
Btu/(hr-ft2)
sunlitASHGF ,
Btu/(hr-ft2)
TSHGq& ,
Btu/(hr-
ft2)
ASHGq& ,
Btu/(hr-
ft2)
1 -0.82026 0.00 0.00 0.00 0.00 0.00 0.00 2 -0.85007 0.00 0.00 0.00 0.00 0.00 0.00 3 -0.84089 0.00 0.00 0.00 0.00 0.00 0.00 4 -0.79337 0.00 0.00 0.00 0.00 0.00 0.00 5 -0.71073 0.00 0.00 0.00 0.00 0.00 0.00 6 -0.59861 0.00 0.00 0.00 0.00 0.00 0.00 7 -0.46465 0.00 0.00 0.00 0.00 0.00 0.00 8 -0.31798 0.00 10.30 8.23 0.56 579.2 12.8
9 -0.16859 0.00 23.97 19.15 1.30 1348.1 29.9
10 -0.02667 0.00 34.91 27.89 1.90 1963.5 43.5
11 0.098118 26.08 44.17 41.69 3.89 2935.1 89.2
12 0.197265 54.63 51.56 66.40 6.37 4674.8 146.0
13 0.264016 74.68 56.61 88.27 7.75 6214.0 177.7
14 0.293821 83.79 58.89 98.95 8.30 6966.1 190.2
15 0.284648 80.98 58.19 95.61 8.13 6731.3 186.4
16 0.237124 66.54 54.57 79.07 7.22 5566.4 165.6
17 0.154487 42.10 48.36 54.41 5.34 3830.2 122.5
18 0.042368 10.93 40.04 33.13 2.59 2332.4 59.4
19 -0.09159 0.00 30.01 23.98 1.63 1688.1 37.4
20 -0.23826 0.00 17.72 14.15 0.96 996.5 22.1
21 -0.38765 0.00 2.35 1.88 0.13 132.2 2.9
22 -0.52957 0.00 0.00 0.00 0.00 0.00 0.0
23 -0.65436 0.00 0.00 0.00 0.00 0.00 0.0
24 -0.75351 0.00 0.00 0.00 0.00 0.00 0.0
Table 8-26 Internal Heat Gains and Infiltration Heat Gains
Heat Gain, Btu/hr
Hour People,
Latent
People,
Sensible Lights Equipment Infiltration
1 0 0 921.8 614.5 391.3
2 0 0 921.8 614.5 268.1
3 0 0 921.8 614.5 169.6
4 0 0 921.8 614.5 95.6
5 0 0 921.8 614.5 71.0
6 0 0 921.8 614.5 120.3
7 0 0 921.8 614.5 243.5
8 0 0 921.8 614.5 465.3
9 2000 2500 4608.9 3072.6 785.6
10 2000 2500 4608.9 3072.6 1155.2
11 2000 2500 4608.9 3072.6 1574.2
12 2000 2500 4608.9 3072.6 1968.4
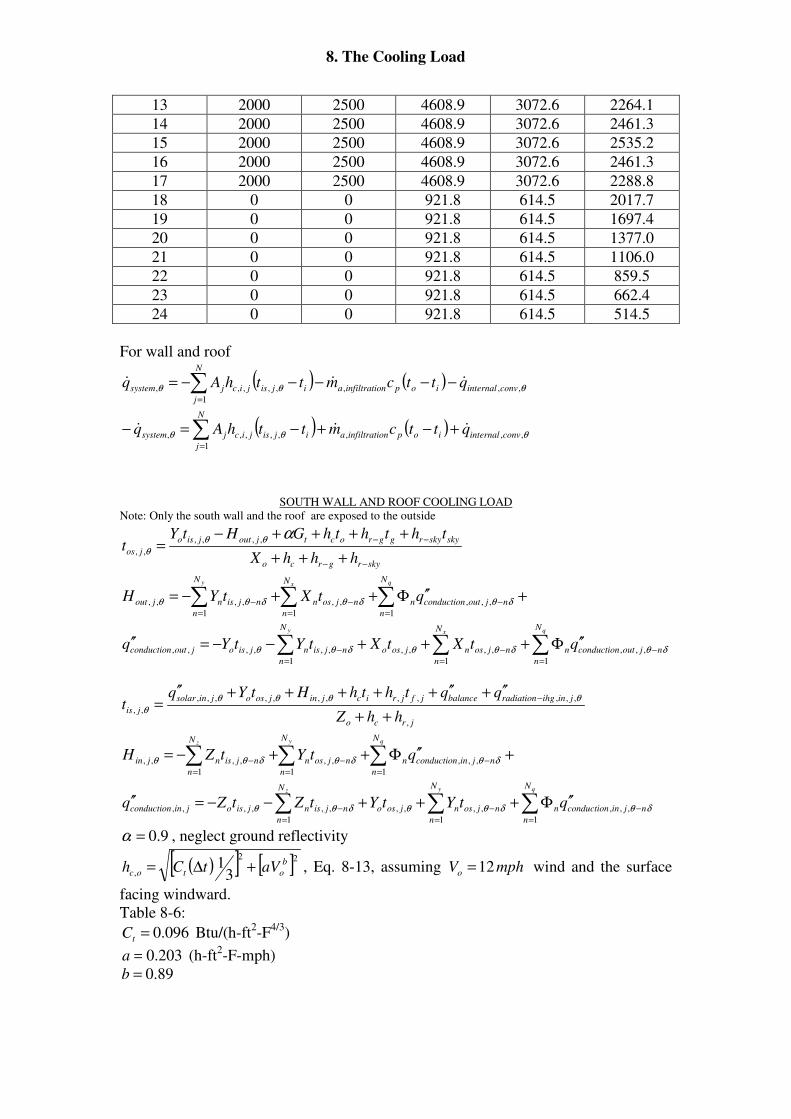
8. The Cooling Load
13 2000 2500 4608.9 3072.6 2264.1
14 2000 2500 4608.9 3072.6 2461.3
15 2000 2500 4608.9 3072.6 2535.2
16 2000 2500 4608.9 3072.6 2461.3
17 2000 2500 4608.9 3072.6 2288.8
18 0 0 921.8 614.5 2017.7
19 0 0 921.8 614.5 1697.4
20 0 0 921.8 614.5 1377.0
21 0 0 921.8 614.5 1106.0
22 0 0 921.8 614.5 859.5
23 0 0 921.8 614.5 662.4
24 0 0 921.8 614.5 514.5
For wall and roof
( ) ( ) θθθ ,,,
1
,,,,, convernalintiopiltrationinfa
N
j
ijisjicjsystem qttcmtthAq &&& −−−−−= ∑=
( ) ( ) θθθ ,,,
1
,,,,, convernalintiopiltrationinfa
N
j
ijisjicjsystem qttcmtthAq &&& +−+−=− ∑=
SOUTH WALL AND ROOF COOLING LOAD
Note: Only the south wall and the roof are exposed to the outside
skyrgrco
skyskyrggroctjoutjiso
joshhhX
thththGHtYt
−−
−−
+++
++++−=
αθθ
θ
,,,,
,,
∑∑∑=
−
=
−
=
− +′′Φ++−=qxy N
n
njoutconductionn
N
n
njosn
N
n
njisnjout qtXtYH1
,,,
1
,,
1
,,,, δθδθδθθ
∑∑∑=
−
=
−
=
−′′Φ+++−−=′′
qxy N
n
njoutconductionn
N
n
njosnjoso
N
n
njisnjisojoutconduction qtXtXtYtYq1
,,,
1
,,,,
1
,,,,,, δθδθθδθθ
jrco
jinihgradiationbalancejfjricjinjosojinsolar
jishhZ
qqththHtYqt
,
,,,,,,,,,,,,
,,++
′′+′′+++++′′=
− θθθθ
θ
∑∑∑=
−
=
−
=
− +′′Φ++−=qyz
N
n
njinconductionn
N
n
njosn
N
n
njisnjin qtYtZH1
,,,
1
,,
1
,,,, δθδθδθθ
∑∑∑=
−
=
−
=
−′′Φ+++−−=′′
qyzN
n
njinconductionn
N
n
njosnjoso
N
n
njisnjisojinconduction qtYtYtZtZq1
,,,
1
,,,,
1
,,,,,, δθδθθδθθ
9.0=α , neglect ground reflectivity
( )[ ] [ ]22
, 31 b
otoc aVtCh +∆= , Eq. 8-13, assuming mphVo 12= wind and the surface
facing windward.
Table 8-6:
096.0=tC Btu/(h-ft2-F
4/3)
203.0=a (h-ft2-F-mph)
89.0=b
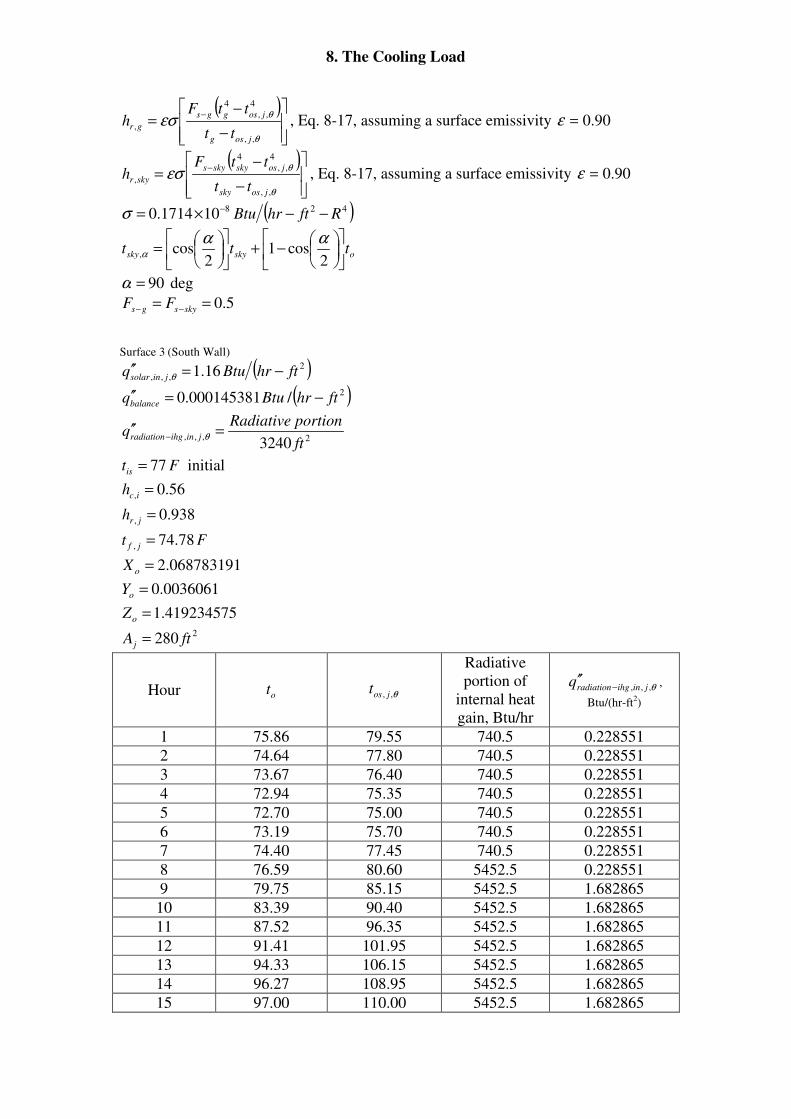
8. The Cooling Load
( )
−
−=
−
θ
θεσ
,,
4
,,
4
,
josg
josggs
grtt
ttFh , Eq. 8-17, assuming a surface emissivity 90.0=ε
( )
−
−=
−
θ
θεσ
,,
4
,,
4
,
jossky
josskyskys
skyrtt
ttFh , Eq. 8-17, assuming a surface emissivity 90.0=ε
( )428101714.0 RfthrBtu −−×= −σ
oskysky ttt
−+
=
2cos1
2cos,
ααα
90=α deg
5.0== −− skysgs FF
Surface 3 (South Wall)
( )2
,,, 16.1 fthrBtuq jinsolar −=′′θ
( )2/000145381.0 fthrBtuqbalance −=′′
2,,,3240 ft
portionRadiativeq jinihgradiation =′′
− θ
Ftis 77= initial
56.0, =ich
938.0, =jrh
Ft jf 78.74, =
068783191.2=oX
0036061.0=oY
419234575.1=oZ
2280 ftAj =
Hour ot θ,, jost
Radiative
portion of
internal heat
gain, Btu/hr
θ,,, jinihgradiationq −′′ ,
Btu/(hr-ft2)
1 75.86 79.55 740.5 0.228551
2 74.64 77.80 740.5 0.228551
3 73.67 76.40 740.5 0.228551
4 72.94 75.35 740.5 0.228551
5 72.70 75.00 740.5 0.228551
6 73.19 75.70 740.5 0.228551
7 74.40 77.45 740.5 0.228551
8 76.59 80.60 5452.5 0.228551
9 79.75 85.15 5452.5 1.682865
10 83.39 90.40 5452.5 1.682865
11 87.52 96.35 5452.5 1.682865
12 91.41 101.95 5452.5 1.682865
13 94.33 106.15 5452.5 1.682865
14 96.27 108.95 5452.5 1.682865
15 97.00 110.00 5452.5 1.682865
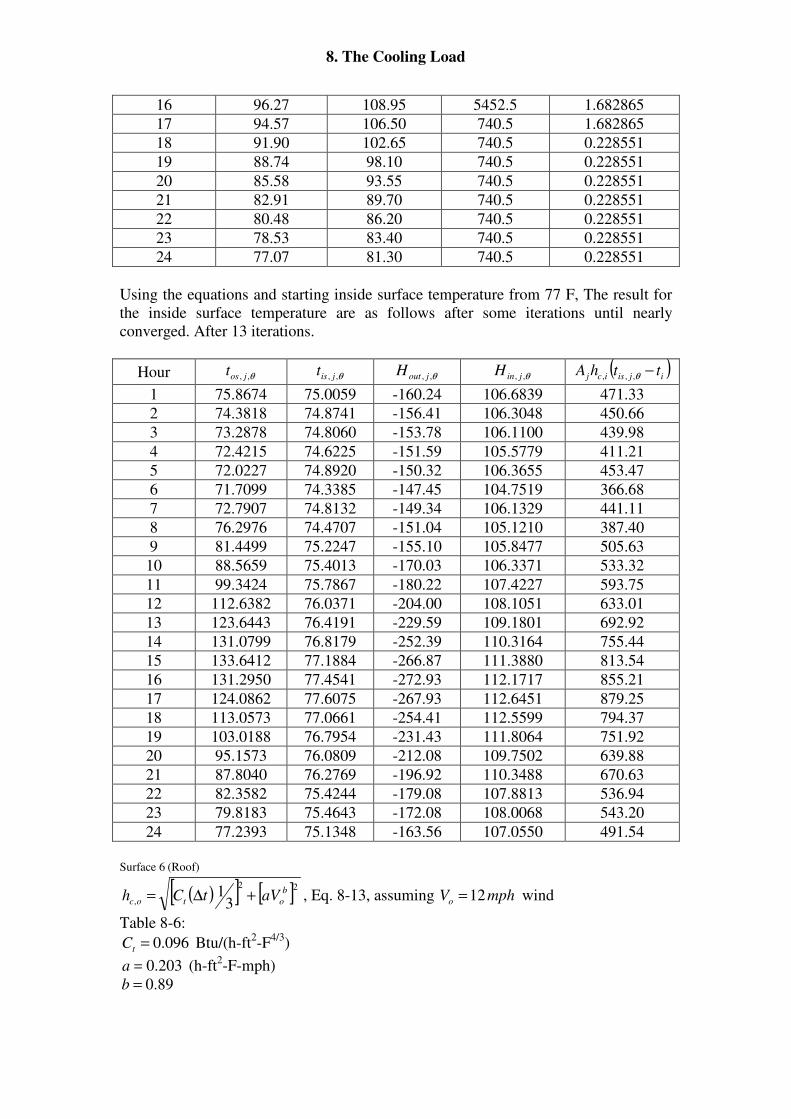
8. The Cooling Load
16 96.27 108.95 5452.5 1.682865
17 94.57 106.50 740.5 1.682865
18 91.90 102.65 740.5 0.228551
19 88.74 98.10 740.5 0.228551
20 85.58 93.55 740.5 0.228551
21 82.91 89.70 740.5 0.228551
22 80.48 86.20 740.5 0.228551
23 78.53 83.40 740.5 0.228551
24 77.07 81.30 740.5 0.228551
Using the equations and starting inside surface temperature from 77 F, The result for
the inside surface temperature are as follows after some iterations until nearly
converged. After 13 iterations.
Hour θ,, jost θ,, jist θ,, joutH θ,, jinH ( )ijisicj tthA −θ,,,
1 75.8674 75.0059 -160.24 106.6839 471.33
2 74.3818 74.8741 -156.41 106.3048 450.66
3 73.2878 74.8060 -153.78 106.1100 439.98
4 72.4215 74.6225 -151.59 105.5779 411.21
5 72.0227 74.8920 -150.32 106.3655 453.47
6 71.7099 74.3385 -147.45 104.7519 366.68
7 72.7907 74.8132 -149.34 106.1329 441.11
8 76.2976 74.4707 -151.04 105.1210 387.40
9 81.4499 75.2247 -155.10 105.8477 505.63
10 88.5659 75.4013 -170.03 106.3371 533.32
11 99.3424 75.7867 -180.22 107.4227 593.75
12 112.6382 76.0371 -204.00 108.1051 633.01
13 123.6443 76.4191 -229.59 109.1801 692.92
14 131.0799 76.8179 -252.39 110.3164 755.44
15 133.6412 77.1884 -266.87 111.3880 813.54
16 131.2950 77.4541 -272.93 112.1717 855.21
17 124.0862 77.6075 -267.93 112.6451 879.25
18 113.0573 77.0661 -254.41 112.5599 794.37
19 103.0188 76.7954 -231.43 111.8064 751.92
20 95.1573 76.0809 -212.08 109.7502 639.88
21 87.8040 76.2769 -196.92 110.3488 670.63
22 82.3582 75.4244 -179.08 107.8813 536.94
23 79.8183 75.4643 -172.08 108.0068 543.20
24 77.2393 75.1348 -163.56 107.0550 491.54
Surface 6 (Roof)
( )[ ] [ ]22
, 31 b
otoc aVtCh +∆= , Eq. 8-13, assuming mphVo 12= wind
Table 8-6:
096.0=tC Btu/(h-ft2-F
4/3)
203.0=a (h-ft2-F-mph)
89.0=b
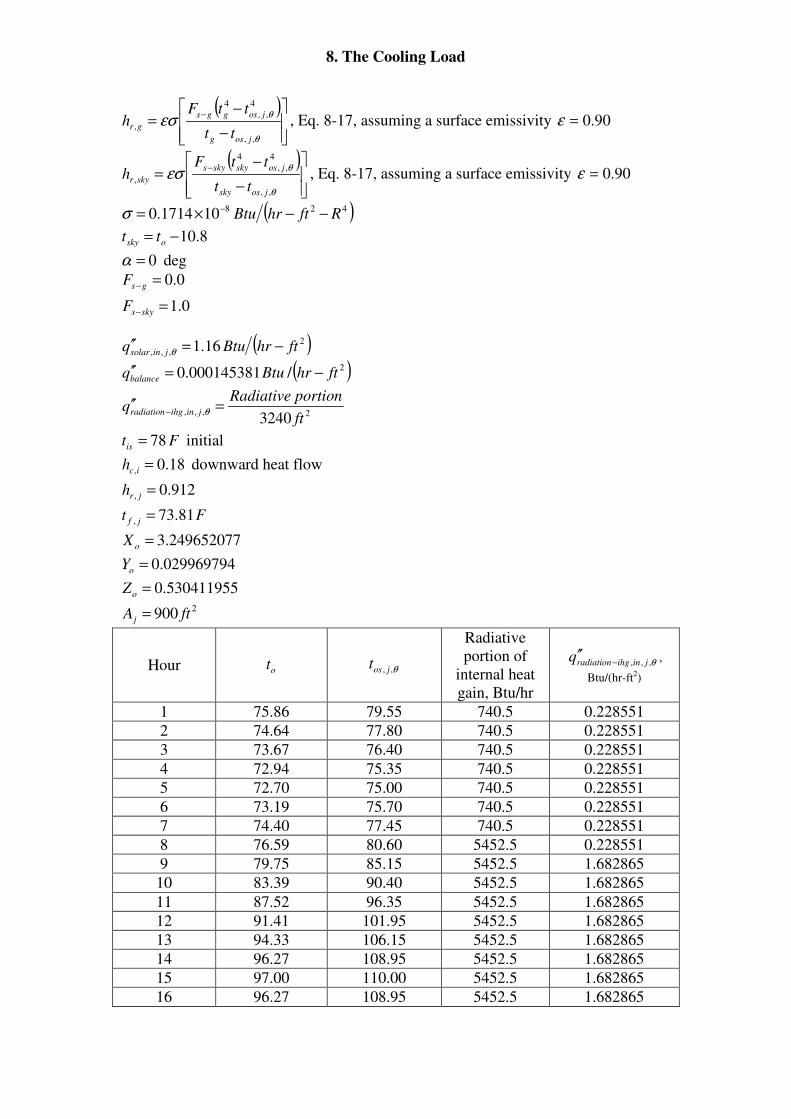
8. The Cooling Load
( )
−
−=
−
θ
θεσ
,,
4
,,
4
,
josg
josggs
grtt
ttFh , Eq. 8-17, assuming a surface emissivity 90.0=ε
( )
−
−=
−
θ
θεσ
,,
4
,,
4
,
jossky
josskyskys
skyrtt
ttFh , Eq. 8-17, assuming a surface emissivity 90.0=ε
( )428101714.0 RfthrBtu −−×= −σ
8.10−= osky tt
0=α deg
0.1
0.0
=
=
−
−
skys
gs
F
F
( )2
,,, 16.1 fthrBtuq jinsolar −=′′θ
( )2/000145381.0 fthrBtuqbalance −=′′
2,,,3240 ft
portionRadiativeq jinihgradiation =′′
− θ
Ftis 78= initial
18.0, =ich downward heat flow
912.0, =jrh
Ft jf 81.73, =
249652077.3=oX
029969794.0=oY
530411955.0=oZ
2900 ftAj =
Hour ot θ,, jost
Radiative
portion of
internal heat
gain, Btu/hr
θ,,, jinihgradiationq −′′ ,
Btu/(hr-ft2)
1 75.86 79.55 740.5 0.228551
2 74.64 77.80 740.5 0.228551
3 73.67 76.40 740.5 0.228551
4 72.94 75.35 740.5 0.228551
5 72.70 75.00 740.5 0.228551
6 73.19 75.70 740.5 0.228551
7 74.40 77.45 740.5 0.228551
8 76.59 80.60 5452.5 0.228551
9 79.75 85.15 5452.5 1.682865
10 83.39 90.40 5452.5 1.682865
11 87.52 96.35 5452.5 1.682865
12 91.41 101.95 5452.5 1.682865
13 94.33 106.15 5452.5 1.682865
14 96.27 108.95 5452.5 1.682865
15 97.00 110.00 5452.5 1.682865
16 96.27 108.95 5452.5 1.682865
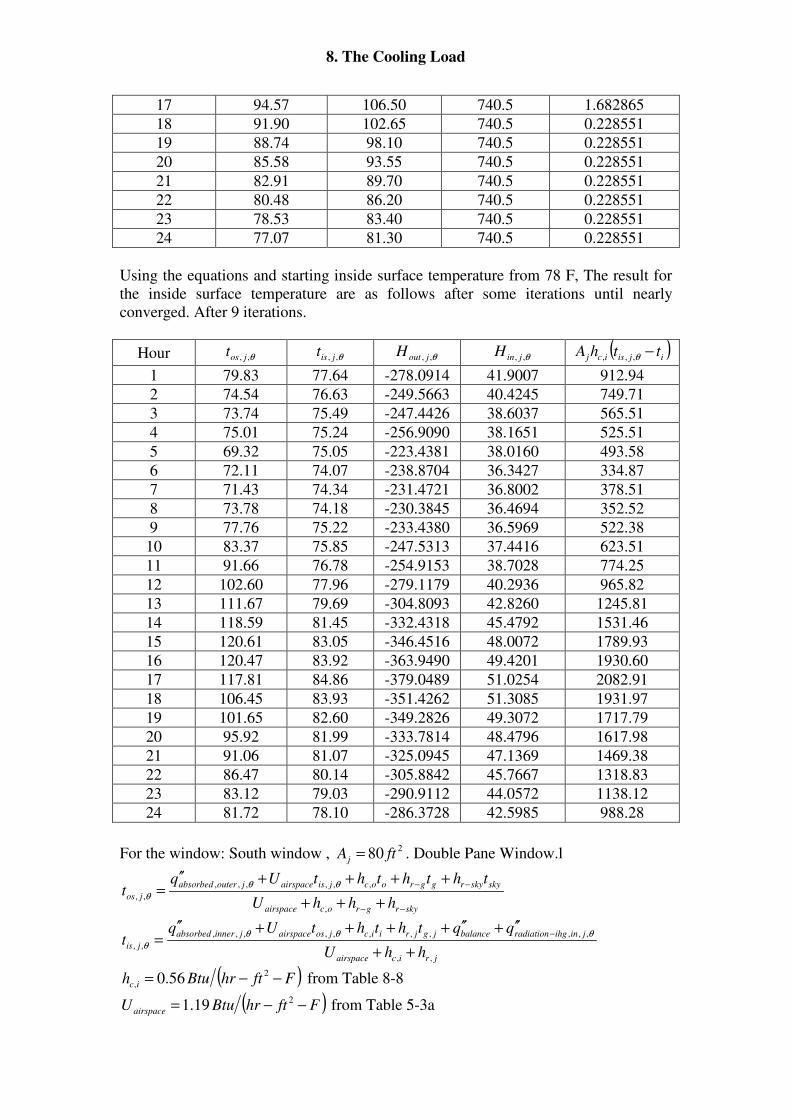
8. The Cooling Load
17 94.57 106.50 740.5 1.682865
18 91.90 102.65 740.5 0.228551
19 88.74 98.10 740.5 0.228551
20 85.58 93.55 740.5 0.228551
21 82.91 89.70 740.5 0.228551
22 80.48 86.20 740.5 0.228551
23 78.53 83.40 740.5 0.228551
24 77.07 81.30 740.5 0.228551
Using the equations and starting inside surface temperature from 78 F, The result for
the inside surface temperature are as follows after some iterations until nearly
converged. After 9 iterations.
Hour θ,, jost θ,, jist θ,, joutH θ,, jinH ( )ijisicj tthA −θ,,,
1 79.83 77.64 -278.0914 41.9007 912.94
2 74.54 76.63 -249.5663 40.4245 749.71
3 73.74 75.49 -247.4426 38.6037 565.51
4 75.01 75.24 -256.9090 38.1651 525.51
5 69.32 75.05 -223.4381 38.0160 493.58
6 72.11 74.07 -238.8704 36.3427 334.87
7 71.43 74.34 -231.4721 36.8002 378.51
8 73.78 74.18 -230.3845 36.4694 352.52
9 77.76 75.22 -233.4380 36.5969 522.38
10 83.37 75.85 -247.5313 37.4416 623.51
11 91.66 76.78 -254.9153 38.7028 774.25
12 102.60 77.96 -279.1179 40.2936 965.82
13 111.67 79.69 -304.8093 42.8260 1245.81
14 118.59 81.45 -332.4318 45.4792 1531.46
15 120.61 83.05 -346.4516 48.0072 1789.93
16 120.47 83.92 -363.9490 49.4201 1930.60
17 117.81 84.86 -379.0489 51.0254 2082.91
18 106.45 83.93 -351.4262 51.3085 1931.97
19 101.65 82.60 -349.2826 49.3072 1717.79
20 95.92 81.99 -333.7814 48.4796 1617.98
21 91.06 81.07 -325.0945 47.1369 1469.38
22 86.47 80.14 -305.8842 45.7667 1318.83
23 83.12 79.03 -290.9112 44.0572 1138.12
24 81.72 78.10 -286.3728 42.5985 988.28
For the window: South window , 280 ftAj = . Double Pane Window.l
skyrgrocairspace
skyskyrggroocjisairspacejouterabsorbed
joshhhU
thththtUqt
−−
−−
+++
++++′′=
,
,,,,,,
,,
θθ
θ
jricairspace
jinihgradiationbalancejgjriicjosairspacejinnerabsorbed
jishhU
qqththtUqt
,,
,,,,,,,,,,,
,,++
′′+′′++++′′=
− θθθ
θ
( )FfthrBtuh ic −−= 2
, 56.0 from Table 8-8
( )FfthrBtuUairspace −−= 219.1 from Table 5-3a
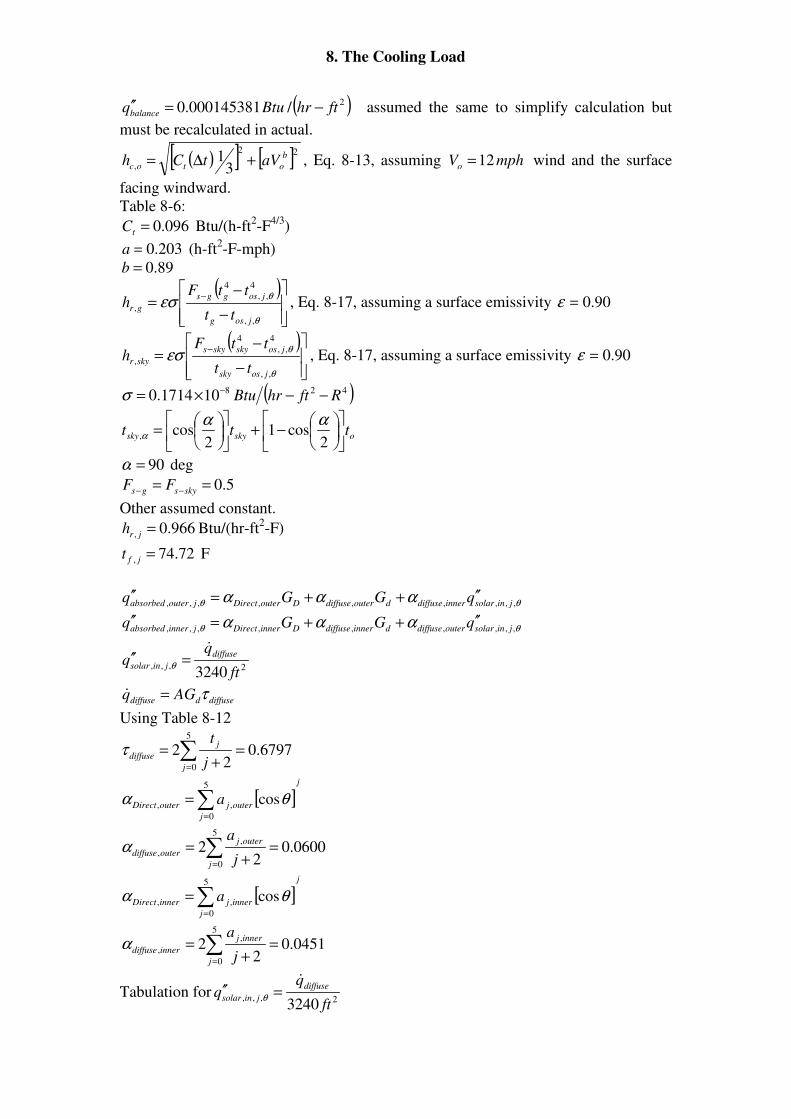
8. The Cooling Load
( )2/000145381.0 fthrBtuqbalance −=′′ assumed the same to simplify calculation but
must be recalculated in actual.
( )[ ] [ ]22
, 31 b
otoc aVtCh +∆= , Eq. 8-13, assuming mphVo 12= wind and the surface
facing windward.
Table 8-6:
096.0=tC Btu/(h-ft2-F
4/3)
203.0=a (h-ft2-F-mph)
89.0=b
( )
−
−=
−
θ
θεσ
,,
4
,,
4
,
josg
josggs
grtt
ttFh , Eq. 8-17, assuming a surface emissivity 90.0=ε
( )
−
−=
−
θ
θεσ
,,
4
,,
4
,
jossky
josskyskys
skyrtt
ttFh , Eq. 8-17, assuming a surface emissivity 90.0=ε
( )428101714.0 RfthrBtu −−×= −σ
oskysky ttt
−+
=
2cos1
2cos,
ααα
90=α deg
5.0== −− skysgs FF
Other assumed constant.
966.0, =jrh Btu/(hr-ft2-F)
72.74, =jft F
θθ ααα ,,,,,,,,, jinsolarinnerdiffusedouterdiffuseDouterDirectjouterabsorbed qGGq ′′++=′′
θθ ααα ,,,,,,,,, jinsolarouterdiffusedinnerdiffuseDinnerDirectjinnerabsorbed qGGq ′′++=′′
2,,,3240 ft
diffuse
jinsolar
&=′′
θ
diffuseddiffuse AGq τ=&
Using Table 8-12
6797.02
25
0
=+
= ∑=j
j
diffusej
tτ
[ ]j
j
outerjouterDirect a∑=
=5
0
,, cosθα
0600.02
25
0
,
, =+
= ∑=j
outerj
outerdiffusej
aα
[ ]j
j
innerjinnerDirect a∑=
=5
0
,, cosθα
0451.02
25
0
,
, =+
= ∑=j
innerj
innerdiffusej
aα
Tabulation for2,,,
3240 ft
diffuse
jinsolar
&=′′
θ
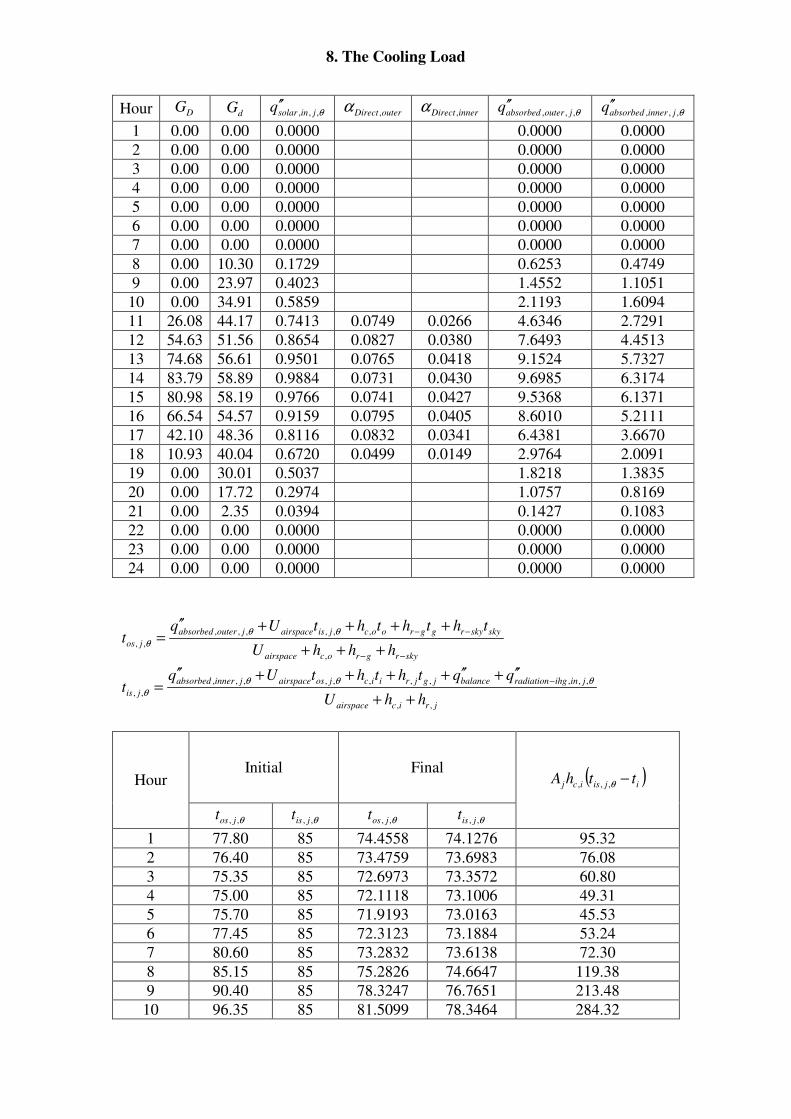
8. The Cooling Load
Hour DG dG θ,,, jinsolarq ′′ outerDirect ,α innerDirect ,α θ,,, jouterabsorbedq ′′ θ,,, jinnerabsorbedq ′′
1 0.00 0.00 0.0000 0.0000 0.0000
2 0.00 0.00 0.0000 0.0000 0.0000
3 0.00 0.00 0.0000 0.0000 0.0000
4 0.00 0.00 0.0000 0.0000 0.0000
5 0.00 0.00 0.0000 0.0000 0.0000
6 0.00 0.00 0.0000 0.0000 0.0000
7 0.00 0.00 0.0000 0.0000 0.0000
8 0.00 10.30 0.1729 0.6253 0.4749
9 0.00 23.97 0.4023 1.4552 1.1051
10 0.00 34.91 0.5859 2.1193 1.6094
11 26.08 44.17 0.7413 0.0749 0.0266 4.6346 2.7291
12 54.63 51.56 0.8654 0.0827 0.0380 7.6493 4.4513
13 74.68 56.61 0.9501 0.0765 0.0418 9.1524 5.7327
14 83.79 58.89 0.9884 0.0731 0.0430 9.6985 6.3174
15 80.98 58.19 0.9766 0.0741 0.0427 9.5368 6.1371
16 66.54 54.57 0.9159 0.0795 0.0405 8.6010 5.2111
17 42.10 48.36 0.8116 0.0832 0.0341 6.4381 3.6670
18 10.93 40.04 0.6720 0.0499 0.0149 2.9764 2.0091
19 0.00 30.01 0.5037 1.8218 1.3835
20 0.00 17.72 0.2974 1.0757 0.8169
21 0.00 2.35 0.0394 0.1427 0.1083
22 0.00 0.00 0.0000 0.0000 0.0000
23 0.00 0.00 0.0000 0.0000 0.0000
24 0.00 0.00 0.0000 0.0000 0.0000
skyrgrocairspace
skyskyrggroocjisairspacejouterabsorbed
joshhhU
thththtUqt
−−
−−
+++
++++′′=
,
,,,,,,
,,
θθ
θ
jricairspace
jinihgradiationbalancejgjriicjosairspacejinnerabsorbed
jishhU
qqththtUqt
,,
,,,,,,,,,,,
,,++
′′+′′++++′′=
− θθθ
θ
Initial Final Hour
θ,, jost θ,, jist θ,, jost θ,, jist
( )ijisicj tthA −θ,,,
1 77.80 85 74.4558 74.1276 95.32
2 76.40 85 73.4759 73.6983 76.08
3 75.35 85 72.6973 73.3572 60.80
4 75.00 85 72.1118 73.1006 49.31
5 75.70 85 71.9193 73.0163 45.53
6 77.45 85 72.3123 73.1884 53.24
7 80.60 85 73.2832 73.6138 72.30
8 85.15 85 75.2826 74.6647 119.38
9 90.40 85 78.3247 76.7651 213.48
10 96.35 85 81.5099 78.3464 284.32
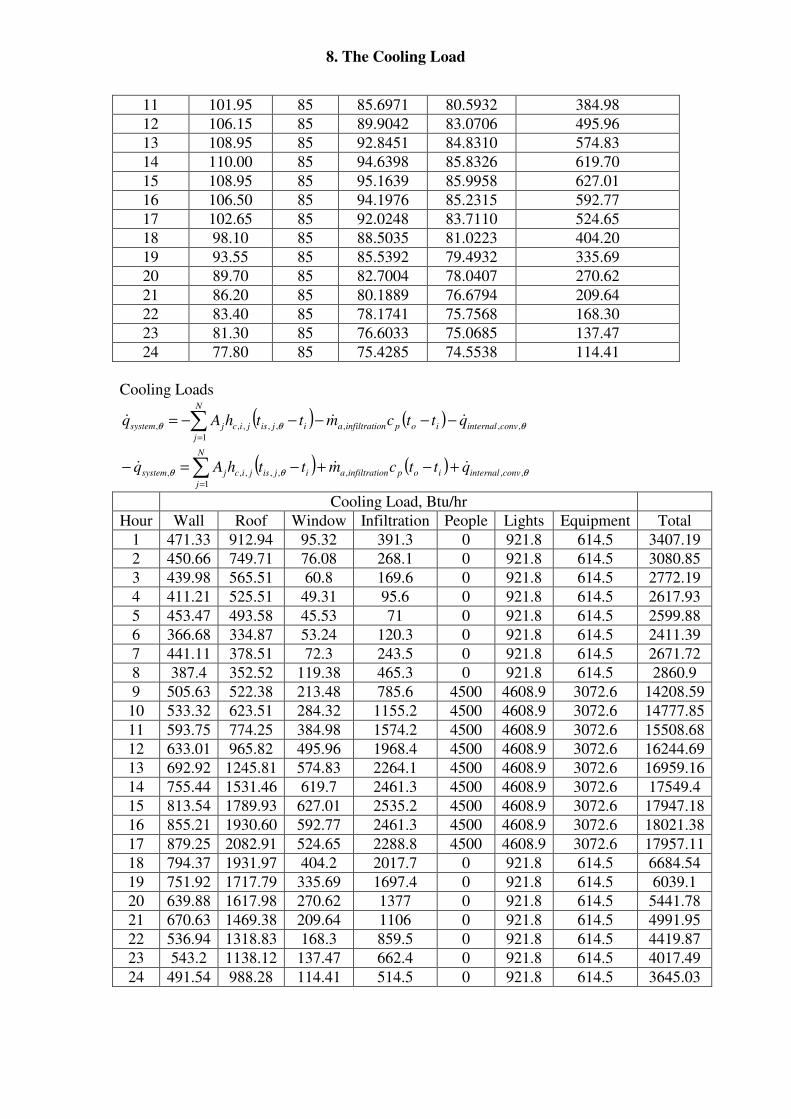
8. The Cooling Load
11 101.95 85 85.6971 80.5932 384.98
12 106.15 85 89.9042 83.0706 495.96
13 108.95 85 92.8451 84.8310 574.83
14 110.00 85 94.6398 85.8326 619.70
15 108.95 85 95.1639 85.9958 627.01
16 106.50 85 94.1976 85.2315 592.77
17 102.65 85 92.0248 83.7110 524.65
18 98.10 85 88.5035 81.0223 404.20
19 93.55 85 85.5392 79.4932 335.69
20 89.70 85 82.7004 78.0407 270.62
21 86.20 85 80.1889 76.6794 209.64
22 83.40 85 78.1741 75.7568 168.30
23 81.30 85 76.6033 75.0685 137.47
24 77.80 85 75.4285 74.5538 114.41
Cooling Loads
( ) ( ) θθθ ,,,
1
,,,,, convernalintiopiltrationinfa
N
j
ijisjicjsystem qttcmtthAq &&& −−−−−= ∑=
( ) ( ) θθθ ,,,
1
,,,,, convernalintiopiltrationinfa
N
j
ijisjicjsystem qttcmtthAq &&& +−+−=− ∑=
Cooling Load, Btu/hr
Hour Wall Roof Window Infiltration People Lights Equipment Total
1 471.33 912.94 95.32 391.3 0 921.8 614.5 3407.19
2 450.66 749.71 76.08 268.1 0 921.8 614.5 3080.85
3 439.98 565.51 60.8 169.6 0 921.8 614.5 2772.19
4 411.21 525.51 49.31 95.6 0 921.8 614.5 2617.93
5 453.47 493.58 45.53 71 0 921.8 614.5 2599.88
6 366.68 334.87 53.24 120.3 0 921.8 614.5 2411.39
7 441.11 378.51 72.3 243.5 0 921.8 614.5 2671.72
8 387.4 352.52 119.38 465.3 0 921.8 614.5 2860.9
9 505.63 522.38 213.48 785.6 4500 4608.9 3072.6 14208.59
10 533.32 623.51 284.32 1155.2 4500 4608.9 3072.6 14777.85
11 593.75 774.25 384.98 1574.2 4500 4608.9 3072.6 15508.68
12 633.01 965.82 495.96 1968.4 4500 4608.9 3072.6 16244.69
13 692.92 1245.81 574.83 2264.1 4500 4608.9 3072.6 16959.16
14 755.44 1531.46 619.7 2461.3 4500 4608.9 3072.6 17549.4
15 813.54 1789.93 627.01 2535.2 4500 4608.9 3072.6 17947.18
16 855.21 1930.60 592.77 2461.3 4500 4608.9 3072.6 18021.38
17 879.25 2082.91 524.65 2288.8 4500 4608.9 3072.6 17957.11
18 794.37 1931.97 404.2 2017.7 0 921.8 614.5 6684.54
19 751.92 1717.79 335.69 1697.4 0 921.8 614.5 6039.1
20 639.88 1617.98 270.62 1377 0 921.8 614.5 5441.78
21 670.63 1469.38 209.64 1106 0 921.8 614.5 4991.95
22 536.94 1318.83 168.3 859.5 0 921.8 614.5 4419.87
23 543.2 1138.12 137.47 662.4 0 921.8 614.5 4017.49
24 491.54 988.28 114.41 514.5 0 921.8 614.5 3645.03
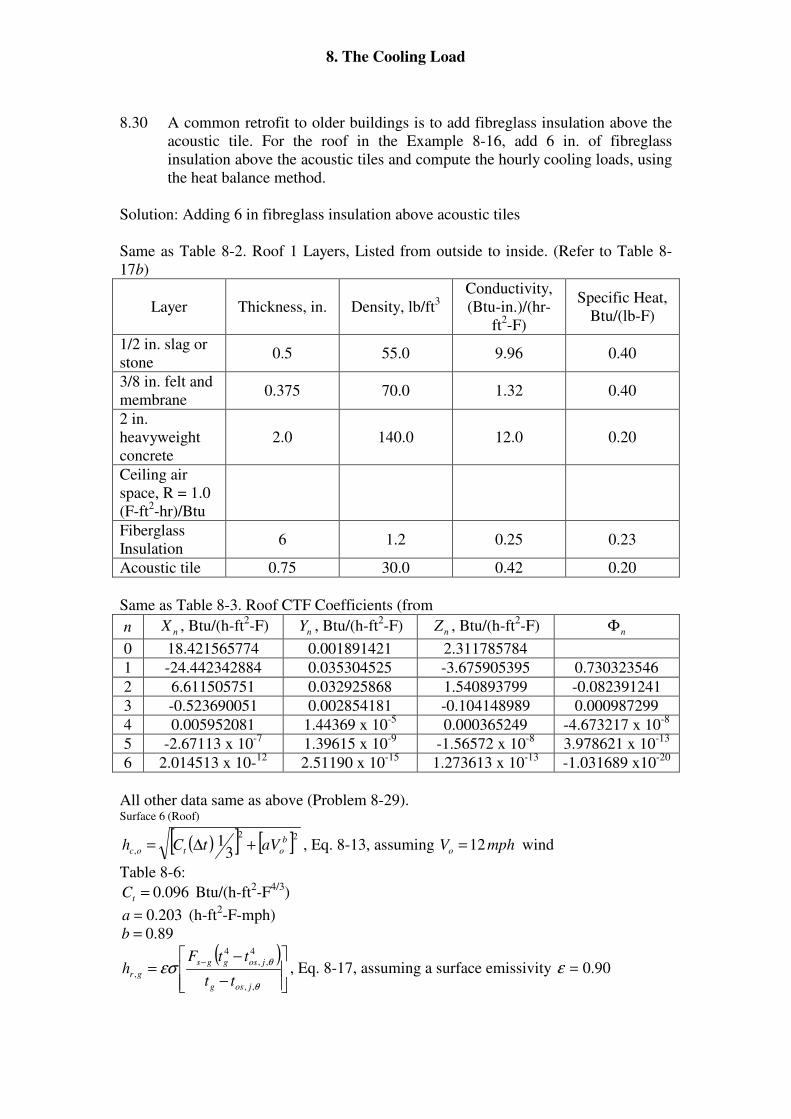
8. The Cooling Load
8.30 A common retrofit to older buildings is to add fibreglass insulation above the
acoustic tile. For the roof in the Example 8-16, add 6 in. of fibreglass
insulation above the acoustic tiles and compute the hourly cooling loads, using
the heat balance method.
Solution: Adding 6 in fibreglass insulation above acoustic tiles
Same as Table 8-2. Roof 1 Layers, Listed from outside to inside. (Refer to Table 8-
17b)
Layer Thickness, in. Density, lb/ft3
Conductivity,
(Btu-in.)/(hr-
ft2-F)
Specific Heat,
Btu/(lb-F)
1/2 in. slag or
stone 0.5 55.0 9.96 0.40
3/8 in. felt and
membrane 0.375 70.0 1.32 0.40
2 in.
heavyweight
concrete
2.0 140.0 12.0 0.20
Ceiling air
space, R = 1.0
(F-ft2-hr)/Btu
Fiberglass
Insulation 6 1.2 0.25 0.23
Acoustic tile 0.75 30.0 0.42 0.20
Same as Table 8-3. Roof CTF Coefficients (from
n nX , Btu/(h-ft2-F) nY , Btu/(h-ft
2-F) nZ , Btu/(h-ft
2-F) nΦ
0 18.421565774 0.001891421 2.311785784
1 -24.442342884 0.035304525 -3.675905395 0.730323546
2 6.611505751 0.032925868 1.540893799 -0.082391241
3 -0.523690051 0.002854181 -0.104148989 0.000987299
4 0.005952081 1.44369 x 10⁻⁵
0.000365249 -4.673217 x 10⁻⁸
5 -2.67113 x 10⁻⁷
1.39615 x 10⁻⁹
-1.56572 x 10⁻⁸
3.978621 x 10⁻¹³
6 2.014513 x 10⁻¹²
2.51190 x 10⁻¹⁵
1.273613 x 10⁻¹³
-1.031689 x10⁻²⁰
All other data same as above (Problem 8-29). Surface 6 (Roof)
( )[ ] [ ]22
, 31 b
otoc aVtCh +∆= , Eq. 8-13, assuming mphVo 12= wind
Table 8-6:
096.0=tC Btu/(h-ft2-F
4/3)
203.0=a (h-ft2-F-mph)
89.0=b
( )
−
−=
−
θ
θεσ
,,
4
,,
4
,
josg
josggs
grtt
ttFh , Eq. 8-17, assuming a surface emissivity 90.0=ε
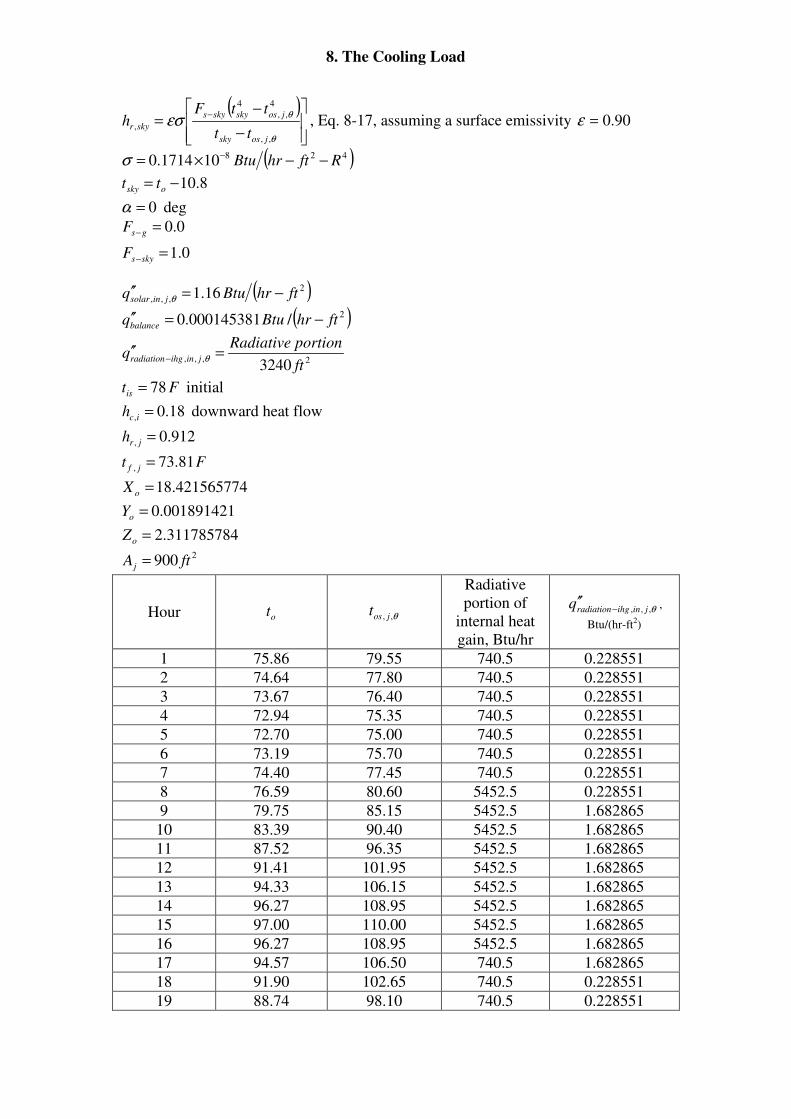
8. The Cooling Load
( )
−
−=
−
θ
θεσ
,,
4
,,
4
,
jossky
josskyskys
skyrtt
ttFh , Eq. 8-17, assuming a surface emissivity 90.0=ε
( )428101714.0 RfthrBtu −−×= −σ
8.10−= osky tt
0=α deg
0.1
0.0
=
=
−
−
skys
gs
F
F
( )2
,,, 16.1 fthrBtuq jinsolar −=′′θ
( )2/000145381.0 fthrBtuqbalance −=′′
2,,,3240 ft
portionRadiativeq jinihgradiation =′′
− θ
Ftis 78= initial
18.0, =ich downward heat flow
912.0, =jrh
Ft jf 81.73, =
421565774.18=oX
001891421.0=oY
311785784.2=oZ
2900 ftAj =
Hour ot θ,, jost
Radiative
portion of
internal heat
gain, Btu/hr
θ,,, jinihgradiationq −′′ ,
Btu/(hr-ft2)
1 75.86 79.55 740.5 0.228551
2 74.64 77.80 740.5 0.228551
3 73.67 76.40 740.5 0.228551
4 72.94 75.35 740.5 0.228551
5 72.70 75.00 740.5 0.228551
6 73.19 75.70 740.5 0.228551
7 74.40 77.45 740.5 0.228551
8 76.59 80.60 5452.5 0.228551
9 79.75 85.15 5452.5 1.682865
10 83.39 90.40 5452.5 1.682865
11 87.52 96.35 5452.5 1.682865
12 91.41 101.95 5452.5 1.682865
13 94.33 106.15 5452.5 1.682865
14 96.27 108.95 5452.5 1.682865
15 97.00 110.00 5452.5 1.682865
16 96.27 108.95 5452.5 1.682865
17 94.57 106.50 740.5 1.682865
18 91.90 102.65 740.5 0.228551
19 88.74 98.10 740.5 0.228551
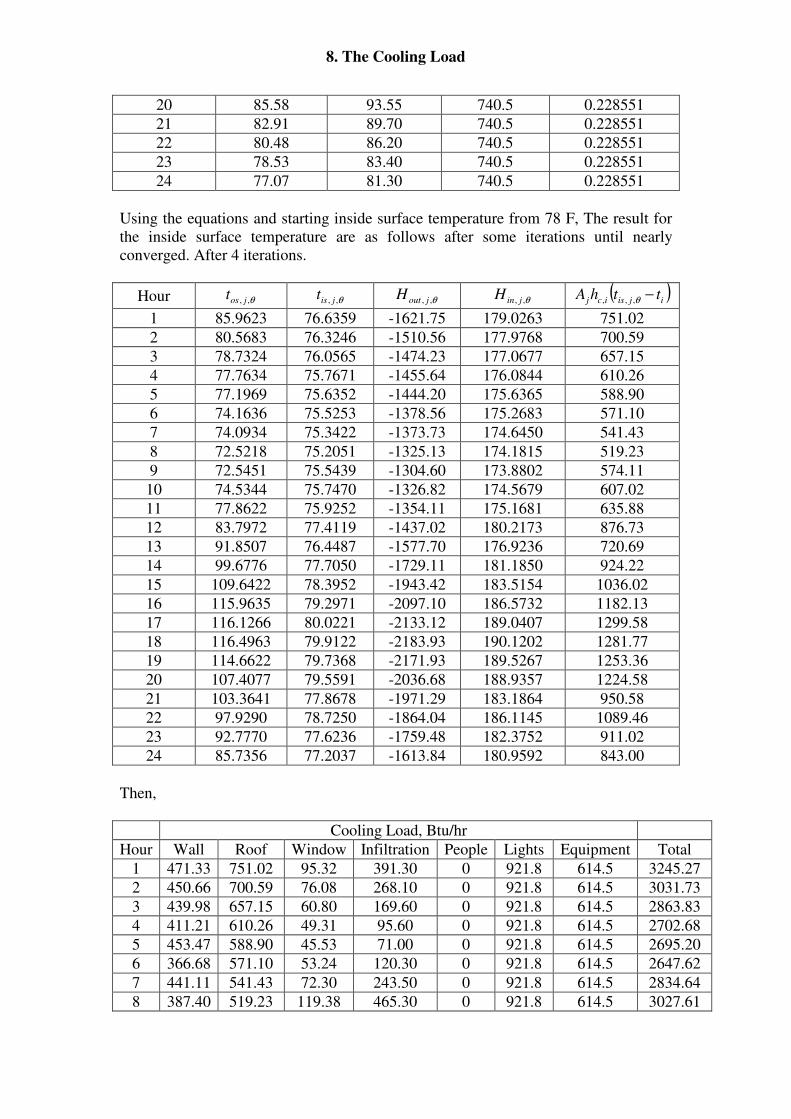
8. The Cooling Load
20 85.58 93.55 740.5 0.228551
21 82.91 89.70 740.5 0.228551
22 80.48 86.20 740.5 0.228551
23 78.53 83.40 740.5 0.228551
24 77.07 81.30 740.5 0.228551
Using the equations and starting inside surface temperature from 78 F, The result for
the inside surface temperature are as follows after some iterations until nearly
converged. After 4 iterations.
Hour θ,, jost θ,, jist θ,, joutH θ,, jinH ( )ijisicj tthA −θ,,,
1 85.9623 76.6359 -1621.75 179.0263 751.02
2 80.5683 76.3246 -1510.56 177.9768 700.59
3 78.7324 76.0565 -1474.23 177.0677 657.15
4 77.7634 75.7671 -1455.64 176.0844 610.26
5 77.1969 75.6352 -1444.20 175.6365 588.90
6 74.1636 75.5253 -1378.56 175.2683 571.10
7 74.0934 75.3422 -1373.73 174.6450 541.43
8 72.5218 75.2051 -1325.13 174.1815 519.23
9 72.5451 75.5439 -1304.60 173.8802 574.11
10 74.5344 75.7470 -1326.82 174.5679 607.02
11 77.8622 75.9252 -1354.11 175.1681 635.88
12 83.7972 77.4119 -1437.02 180.2173 876.73
13 91.8507 76.4487 -1577.70 176.9236 720.69
14 99.6776 77.7050 -1729.11 181.1850 924.22
15 109.6422 78.3952 -1943.42 183.5154 1036.02
16 115.9635 79.2971 -2097.10 186.5732 1182.13
17 116.1266 80.0221 -2133.12 189.0407 1299.58
18 116.4963 79.9122 -2183.93 190.1202 1281.77
19 114.6622 79.7368 -2171.93 189.5267 1253.36
20 107.4077 79.5591 -2036.68 188.9357 1224.58
21 103.3641 77.8678 -1971.29 183.1864 950.58
22 97.9290 78.7250 -1864.04 186.1145 1089.46
23 92.7770 77.6236 -1759.48 182.3752 911.02
24 85.7356 77.2037 -1613.84 180.9592 843.00
Then,
Cooling Load, Btu/hr
Hour Wall Roof Window Infiltration People Lights Equipment Total
1 471.33 751.02 95.32 391.30 0 921.8 614.5 3245.27
2 450.66 700.59 76.08 268.10 0 921.8 614.5 3031.73
3 439.98 657.15 60.80 169.60 0 921.8 614.5 2863.83
4 411.21 610.26 49.31 95.60 0 921.8 614.5 2702.68
5 453.47 588.90 45.53 71.00 0 921.8 614.5 2695.20
6 366.68 571.10 53.24 120.30 0 921.8 614.5 2647.62
7 441.11 541.43 72.30 243.50 0 921.8 614.5 2834.64
8 387.40 519.23 119.38 465.30 0 921.8 614.5 3027.61
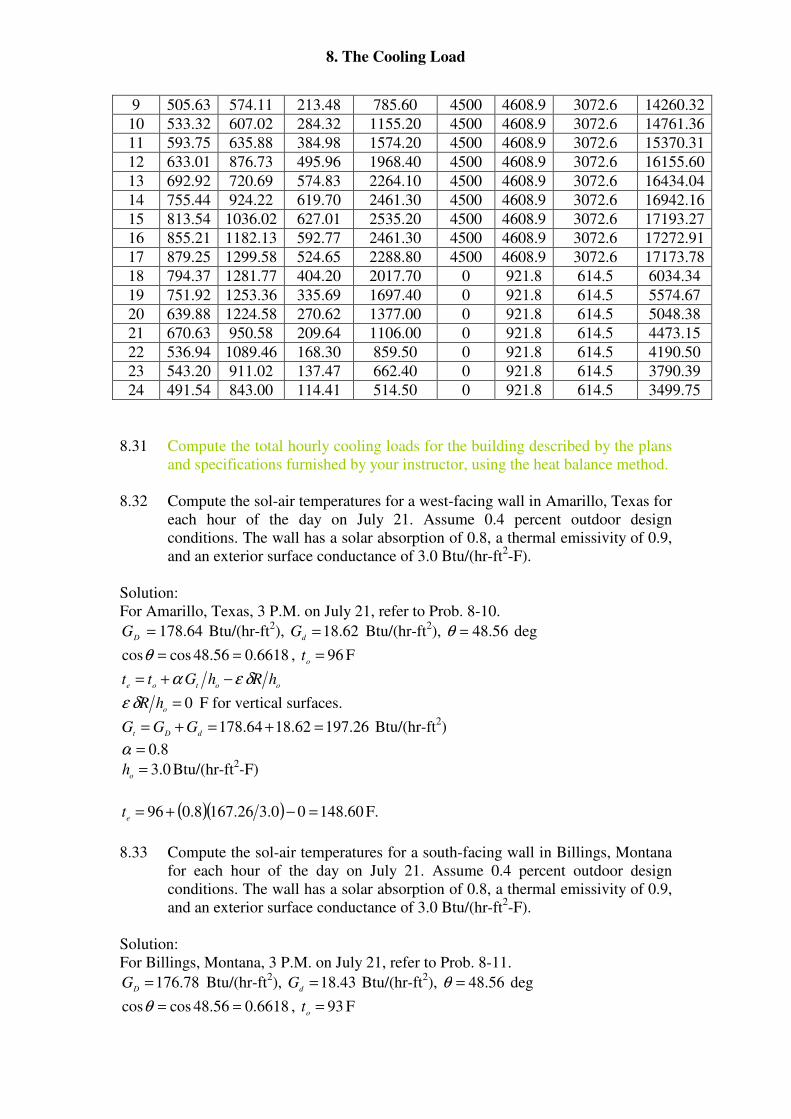
8. The Cooling Load
9 505.63 574.11 213.48 785.60 4500 4608.9 3072.6 14260.32
10 533.32 607.02 284.32 1155.20 4500 4608.9 3072.6 14761.36
11 593.75 635.88 384.98 1574.20 4500 4608.9 3072.6 15370.31
12 633.01 876.73 495.96 1968.40 4500 4608.9 3072.6 16155.60
13 692.92 720.69 574.83 2264.10 4500 4608.9 3072.6 16434.04
14 755.44 924.22 619.70 2461.30 4500 4608.9 3072.6 16942.16
15 813.54 1036.02 627.01 2535.20 4500 4608.9 3072.6 17193.27
16 855.21 1182.13 592.77 2461.30 4500 4608.9 3072.6 17272.91
17 879.25 1299.58 524.65 2288.80 4500 4608.9 3072.6 17173.78
18 794.37 1281.77 404.20 2017.70 0 921.8 614.5 6034.34
19 751.92 1253.36 335.69 1697.40 0 921.8 614.5 5574.67
20 639.88 1224.58 270.62 1377.00 0 921.8 614.5 5048.38
21 670.63 950.58 209.64 1106.00 0 921.8 614.5 4473.15
22 536.94 1089.46 168.30 859.50 0 921.8 614.5 4190.50
23 543.20 911.02 137.47 662.40 0 921.8 614.5 3790.39
24 491.54 843.00 114.41 514.50 0 921.8 614.5 3499.75
8.31 Compute the total hourly cooling loads for the building described by the plans
and specifications furnished by your instructor, using the heat balance method.
8.32 Compute the sol-air temperatures for a west-facing wall in Amarillo, Texas for
each hour of the day on July 21. Assume 0.4 percent outdoor design
conditions. The wall has a solar absorption of 0.8, a thermal emissivity of 0.9,
and an exterior surface conductance of 3.0 Btu/(hr-ft2-F).
Solution:
For Amarillo, Texas, 3 P.M. on July 21, refer to Prob. 8-10.
64.178=D
G Btu/(hr-ft2), 62.18=
dG Btu/(hr-ft
2), 56.48=θ deg
6618.056.48coscos ==θ , 96=o
t F
ootoehRhGtt δεα −+=
0=o
hRδε F for vertical surfaces.
26.19762.1864.178 =+=+=dDt
GGG Btu/(hr-ft2)
8.0=α
0.3=o
h Btu/(hr-ft2-F)
( )( ) 60.14800.326.1678.096 =−+=e
t F.
8.33 Compute the sol-air temperatures for a south-facing wall in Billings, Montana
for each hour of the day on July 21. Assume 0.4 percent outdoor design
conditions. The wall has a solar absorption of 0.8, a thermal emissivity of 0.9,
and an exterior surface conductance of 3.0 Btu/(hr-ft2-F).
Solution:
For Billings, Montana, 3 P.M. on July 21, refer to Prob. 8-11.
78.176=D
G Btu/(hr-ft2), 43.18=
dG Btu/(hr-ft
2), 56.48=θ deg
6618.056.48coscos ==θ , 93=o
t F
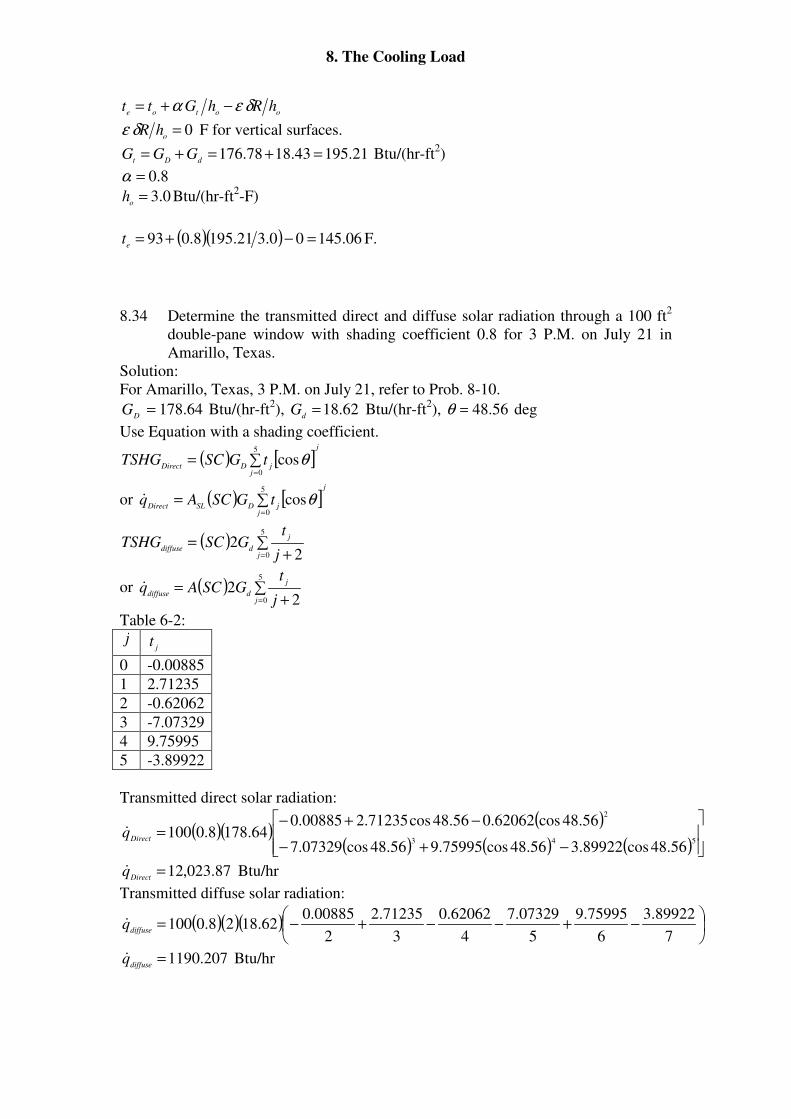
8. The Cooling Load
ootoehRhGtt δεα −+=
0=o
hRδε F for vertical surfaces.
21.19543.1878.176 =+=+=dDt
GGG Btu/(hr-ft2)
8.0=α
0.3=o
h Btu/(hr-ft2-F)
( )( ) 06.14500.321.1958.093 =−+=e
t F.
8.34 Determine the transmitted direct and diffuse solar radiation through a 100 ft2
double-pane window with shading coefficient 0.8 for 3 P.M. on July 21 in
Amarillo, Texas.
Solution:
For Amarillo, Texas, 3 P.M. on July 21, refer to Prob. 8-10.
64.178=D
G Btu/(hr-ft2), 62.18=
dG Btu/(hr-ft
2), 56.48=θ deg
Use Equation with a shading coefficient.
( ) [ ]j
jjDDirect
tGSCTSHG ∑==
5
0
cosθ
or ( ) [ ]j
jjDSLDirect
tGSCAq ∑==
5
0
cosθ&
( ) ∑+
==
5
0 22
j
j
ddiffusej
tGSCTSHG
or ( ) ∑+
==
5
0 22
j
j
ddiffusej
tGSCAq&
Table 6-2: j
jt
0 -0.00885
1 2.71235
2 -0.62062
3 -7.07329
4 9.75995
5 -3.89922
Transmitted direct solar radiation:
( )( )( )
( ) ( ) ( )
−+−
−+−=
543
2
56.48cos89922.356.48cos75995.956.48cos07329.7
56.48cos62062.056.48cos71235.200885.064.1788.0100
Directq&
87.023,12=Direct
q& Btu/hr
Transmitted diffuse solar radiation:
( )( )( )
−+−−+−=
7
89922.3
6
75995.9
5
07329.7
4
62062.0
3
71235.2
2
00885.062.1828.0100
diffuseq&
207.1190=diffuse
q& Btu/hr
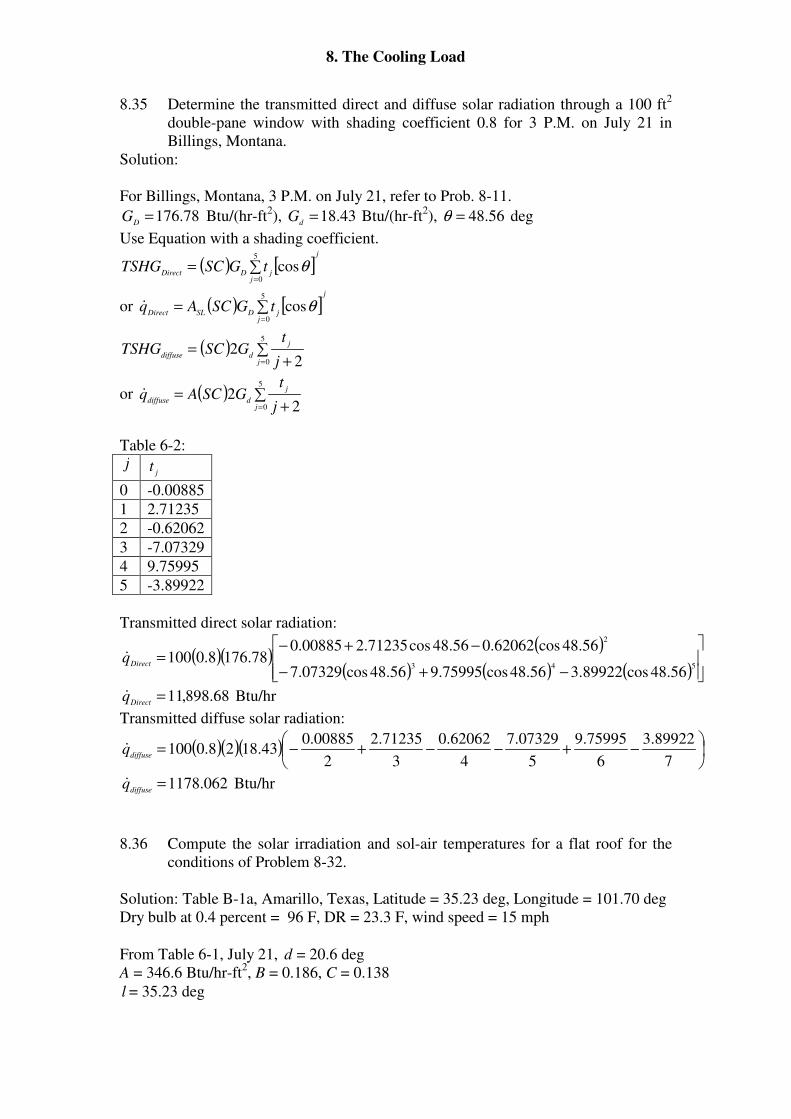
8. The Cooling Load
8.35 Determine the transmitted direct and diffuse solar radiation through a 100 ft2
double-pane window with shading coefficient 0.8 for 3 P.M. on July 21 in
Billings, Montana.
Solution:
For Billings, Montana, 3 P.M. on July 21, refer to Prob. 8-11.
78.176=D
G Btu/(hr-ft2), 43.18=
dG Btu/(hr-ft
2), 56.48=θ deg
Use Equation with a shading coefficient.
( ) [ ]j
jjDDirect
tGSCTSHG ∑==
5
0
cosθ
or ( ) [ ]j
jjDSLDirect
tGSCAq ∑==
5
0
cosθ&
( ) ∑+
==
5
0 22
j
j
ddiffusej
tGSCTSHG
or ( ) ∑+
==
5
0 22
j
j
ddiffusej
tGSCAq&
Table 6-2: j
jt
0 -0.00885
1 2.71235
2 -0.62062
3 -7.07329
4 9.75995
5 -3.89922
Transmitted direct solar radiation:
( )( )( )
( ) ( ) ( )
−+−
−+−=
543
2
56.48cos89922.356.48cos75995.956.48cos07329.7
56.48cos62062.056.48cos71235.200885.078.1768.0100
Directq&
68.898,11=Direct
q& Btu/hr
Transmitted diffuse solar radiation:
( )( )( )
−+−−+−=
7
89922.3
6
75995.9
5
07329.7
4
62062.0
3
71235.2
2
00885.043.1828.0100
diffuseq&
062.1178=diffuse
q& Btu/hr
8.36 Compute the solar irradiation and sol-air temperatures for a flat roof for the
conditions of Problem 8-32.
Solution: Table B-1a, Amarillo, Texas, Latitude = 35.23 deg, Longitude = 101.70 deg
Dry bulb at 0.4 percent = 96 F, DR = 23.3 F, wind speed = 15 mph
From Table 6-1, July 21, d = 20.6 deg
A = 346.6 Btu/hr-ft2, B = 0.186, C = 0.138
l = 35.23 deg
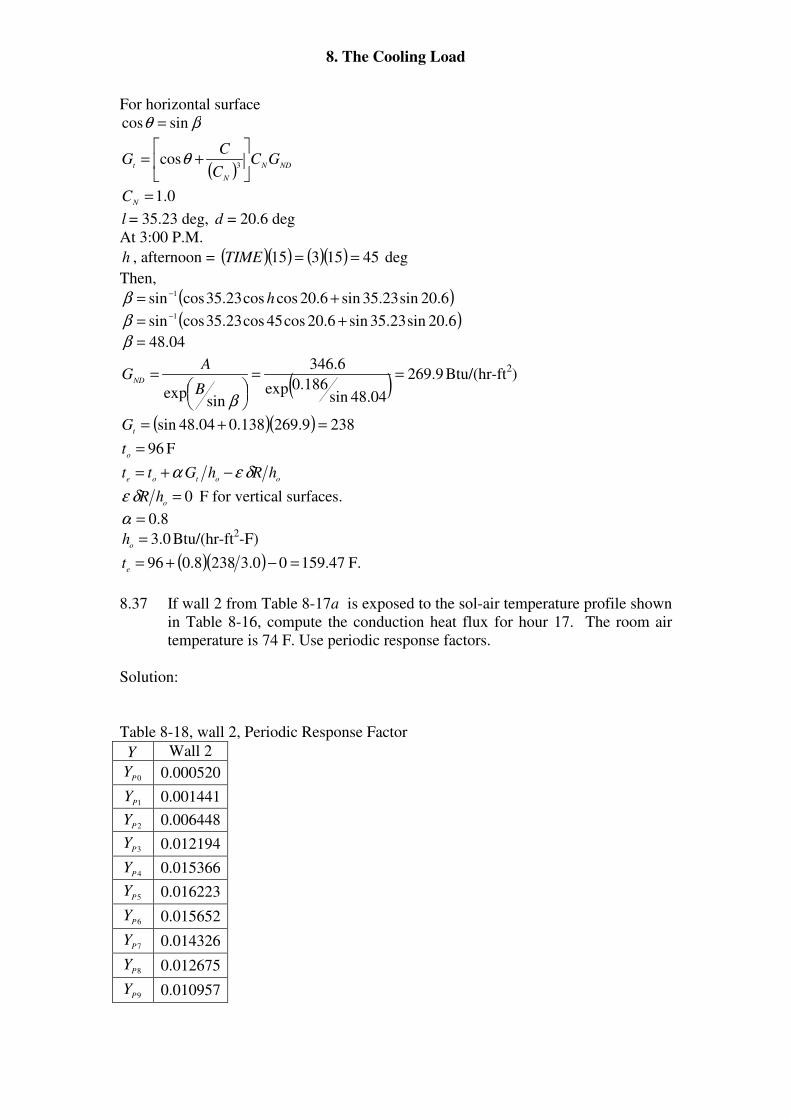
8. The Cooling Load
For horizontal surface
βθ sincos =
( ) NDN
N
tGC
C
CG
+=
3cosθ
0.1=N
C
l = 35.23 deg, d = 20.6 deg
At 3:00 P.M.
h , afternoon = ( )( ) ( )( ) 4515315 ==TIME deg
Then,
( )6.20sin23.35sin6.20coscos23.35cossin 1 += −hβ
( )6.20sin23.35sin6.20cos45cos23.35cossin 1 += −β
04.48=β
( ) 9.269
04.48sin186.0exp
6.346
sinexp
==
=
βB
AG
NDBtu/(hr-ft
2)
( )( ) 2389.269138.004.48sin =+=t
G
96=o
t F
ootoehRhGtt δεα −+=
0=o
hRδε F for vertical surfaces.
8.0=α
0.3=o
h Btu/(hr-ft2-F)
( )( ) 47.15900.32388.096 =−+=e
t F.
8.37 If wall 2 from Table 8-17a is exposed to the sol-air temperature profile shown
in Table 8-16, compute the conduction heat flux for hour 17. The room air
temperature is 74 F. Use periodic response factors.
Solution:
Table 8-18, wall 2, Periodic Response Factor
Y Wall 2
0PY 0.000520
1PY 0.001441
2PY 0.006448
3PY 0.012194
4PY 0.015366
5PY 0.016223
6PY 0.015652
7PY 0.014326
8PY 0.012675
9PY 0.010957
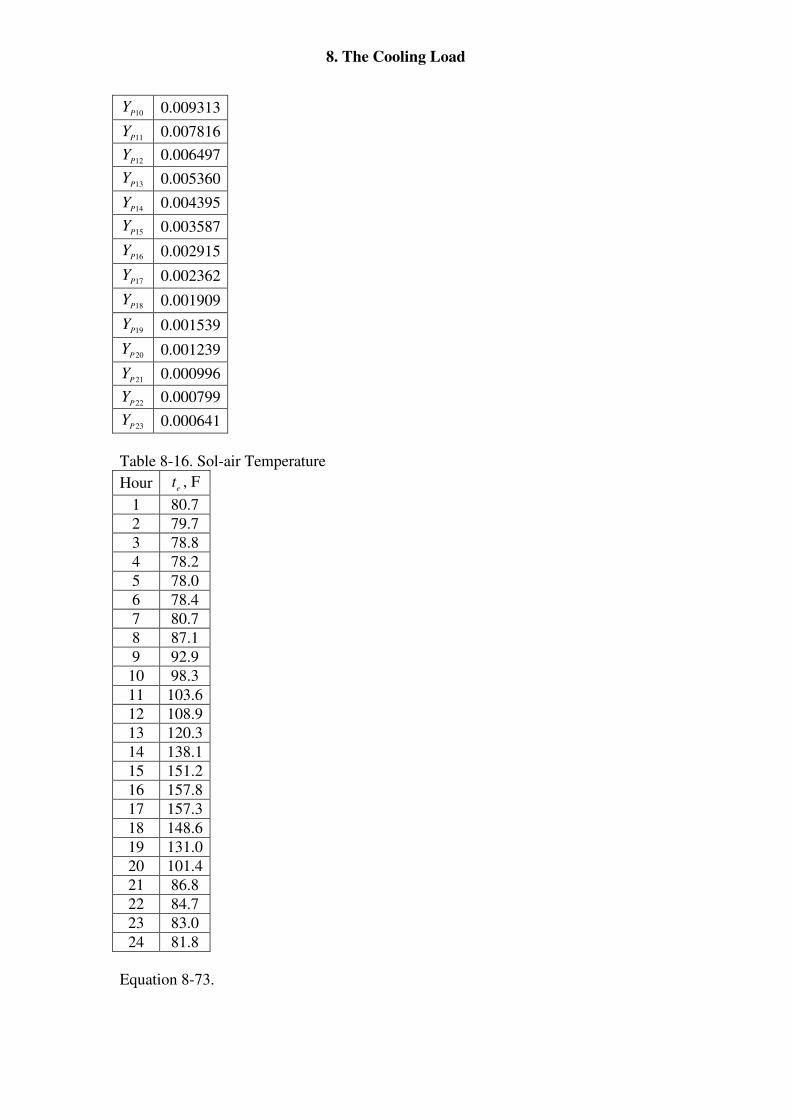
8. The Cooling Load
10PY 0.009313
11PY 0.007816
12PY 0.006497
13PY 0.005360
14PY 0.004395
15PY 0.003587
16PY 0.002915
17PY 0.002362
18PY 0.001909
19PY 0.001539
20PY 0.001239
21PY 0.000996
22PY 0.000799
23PY 0.000641
Table 8-16. Sol-air Temperature
Hour et , F
1 80.7
2 79.7
3 78.8
4 78.2
5 78.0
6 78.4
7 80.7
8 87.1
9 92.9
10 98.3
11 103.6
12 108.9
13 120.3
14 138.1
15 151.2
16 157.8
17 157.3
18 148.6
19 131.0
20 101.4
21 86.8
22 84.7
23 83.0
24 81.8
Equation 8-73.
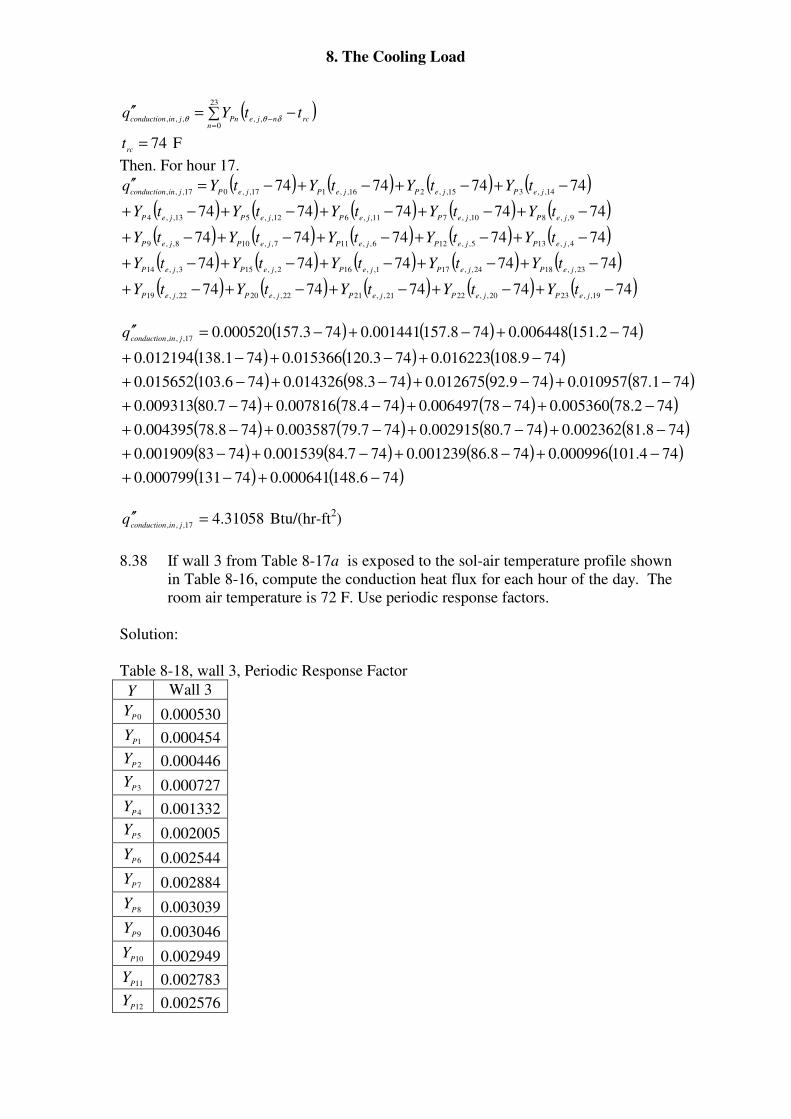
8. The Cooling Load
( )∑ −=′′=
−
23
0,,,,,
nrcnjePnjinconduction
ttYq δθθ
74=rc
t F
Then. For hour 17.
( ) ( ) ( ) ( )( ) ( ) ( ) ( ) ( )( ) ( ) ( ) ( ) ( )( ) ( ) ( ) ( ) ( )( ) ( ) ( ) ( ) ( )7474747474
7474747474
7474747474
7474747474
74747474
19,,2320,,2221,,2122,,2022,,19
23,,1824,,171,,162,,153,,14
4,,135,,126,,117,,108,,9
9,,810,,711,,612,,513,,4
14,,315,,216,,117,,017,,,
−+−+−+−+−+
−+−+−+−+−+
−+−+−+−+−+
−+−+−+−+−+
−+−+−+−=′′
jePjePjePjePjeP
jePjePjePjePjeP
jePjePjePjePjeP
jePjePjePjePjeP
jePjePjePjePjinconduction
tYtYtYtYtY
tYtYtYtYtY
tYtYtYtYtY
tYtYtYtYtY
tYtYtYtYq
( ) ( ) ( )
( ) ( ) ( )( ) ( ) ( ) ( )( ) ( ) ( ) ( )( ) ( ) ( ) ( )( ) ( ) ( ) ( )( ) ( )746.148000641.074131000799.0
744.101000996.0748.86001239.0747.84001539.07483001909.0
748.81002362.0747.80002915.0747.79003587.0748.78004395.0
742.78005360.07478006497.0744.78007816.0747.80009313.0
741.87010957.0749.92012675.0743.98014326.0746.103015652.0
749.108016223.0743.120015366.0741.138012194.0
742.151006448.0748.157001441.0743.157000520.017,,,
−+−+
−+−+−+−+
−+−+−+−+
−+−+−+−+
−+−+−+−+
−+−+−+
−+−+−=′′jinconduction
q
31058.417,,,
=′′jinconduction
q Btu/(hr-ft2)
8.38 If wall 3 from Table 8-17a is exposed to the sol-air temperature profile shown
in Table 8-16, compute the conduction heat flux for each hour of the day. The
room air temperature is 72 F. Use periodic response factors.
Solution:
Table 8-18, wall 3, Periodic Response Factor
Y Wall 3
0PY 0.000530
1PY 0.000454
2PY 0.000446
3PY 0.000727
4PY 0.001332
5PY 0.002005
6PY 0.002544
7PY 0.002884
8PY 0.003039
9PY 0.003046
10PY 0.002949
11PY 0.002783
12PY 0.002576
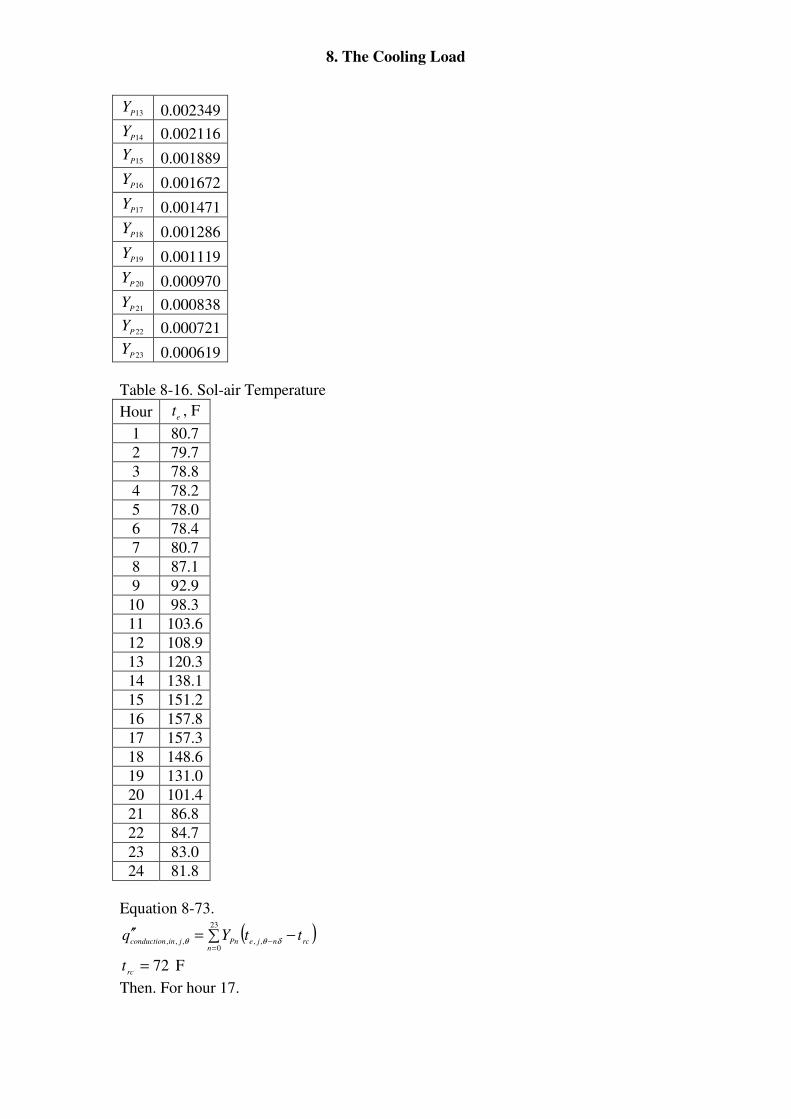
8. The Cooling Load
13PY 0.002349
14PY 0.002116
15PY 0.001889
16PY 0.001672
17PY 0.001471
18PY 0.001286
19PY 0.001119
20PY 0.000970
21PY 0.000838
22PY 0.000721
23PY 0.000619
Table 8-16. Sol-air Temperature
Hour et , F
1 80.7
2 79.7
3 78.8
4 78.2
5 78.0
6 78.4
7 80.7
8 87.1
9 92.9
10 98.3
11 103.6
12 108.9
13 120.3
14 138.1
15 151.2
16 157.8
17 157.3
18 148.6
19 131.0
20 101.4
21 86.8
22 84.7
23 83.0
24 81.8
Equation 8-73.
( )∑ −=′′=
−
23
0,,,,,
nrcnjePnjinconduction
ttYq δθθ
72=rc
t F
Then. For hour 17.
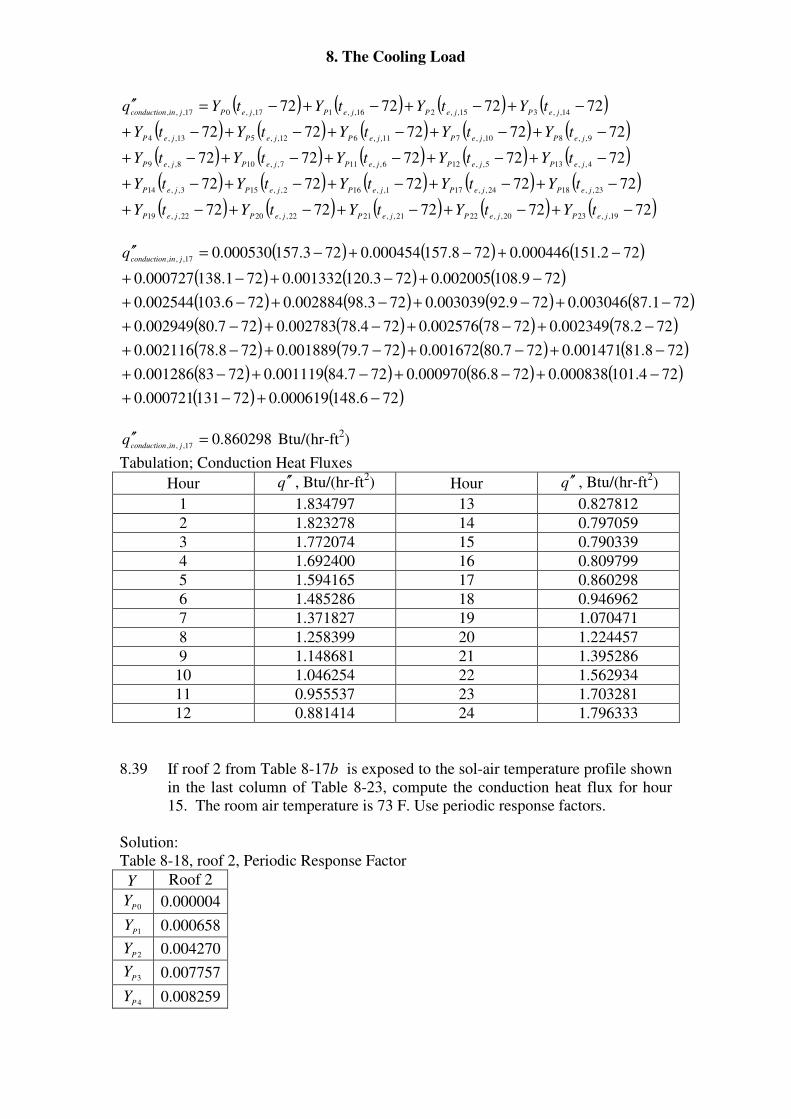
8. The Cooling Load
( ) ( ) ( ) ( )( ) ( ) ( ) ( ) ( )( ) ( ) ( ) ( ) ( )( ) ( ) ( ) ( ) ( )( ) ( ) ( ) ( ) ( )7272727272
7272727272
7272727272
7272727272
72727272
19,,2320,,2221,,2122,,2022,,19
23,,1824,,171,,162,,153,,14
4,,135,,126,,117,,108,,9
9,,810,,711,,612,,513,,4
14,,315,,216,,117,,017,,,
−+−+−+−+−+
−+−+−+−+−+
−+−+−+−+−+
−+−+−+−+−+
−+−+−+−=′′
jePjePjePjePjeP
jePjePjePjePjeP
jePjePjePjePjeP
jePjePjePjePjeP
jePjePjePjePjinconduction
tYtYtYtYtY
tYtYtYtYtY
tYtYtYtYtY
tYtYtYtYtY
tYtYtYtYq
( ) ( ) ( )
( ) ( ) ( )( ) ( ) ( ) ( )( ) ( ) ( ) ( )( ) ( ) ( ) ( )( ) ( ) ( ) ( )( ) ( )726.148000619.072131000721.0
724.101000838.0728.86000970.0727.84001119.07283001286.0
728.81001471.0727.80001672.0727.79001889.0728.78002116.0
722.78002349.07278002576.0724.78002783.0727.80002949.0
721.87003046.0729.92003039.0723.98002884.0726.103002544.0
729.108002005.0723.120001332.0721.138000727.0
722.151000446.0728.157000454.0723.157000530.017,,,
−+−+
−+−+−+−+
−+−+−+−+
−+−+−+−+
−+−+−+−+
−+−+−+
−+−+−=′′jinconduction
q
860298.017,,,
=′′jinconduction
q Btu/(hr-ft2)
Tabulation; Conduction Heat Fluxes
Hour q ′′ , Btu/(hr-ft2) Hour q ′′ , Btu/(hr-ft
2)
1 1.834797 13 0.827812
2 1.823278 14 0.797059
3 1.772074 15 0.790339
4 1.692400 16 0.809799
5 1.594165 17 0.860298
6 1.485286 18 0.946962
7 1.371827 19 1.070471
8 1.258399 20 1.224457
9 1.148681 21 1.395286
10 1.046254 22 1.562934
11 0.955537 23 1.703281
12 0.881414 24 1.796333
8.39 If roof 2 from Table 8-17b is exposed to the sol-air temperature profile shown
in the last column of Table 8-23, compute the conduction heat flux for hour
15. The room air temperature is 73 F. Use periodic response factors.
Solution:
Table 8-18, roof 2, Periodic Response Factor
Y Roof 2
0PY 0.000004
1PY 0.000658
2PY 0.004270
3PY 0.007757
4PY 0.008259
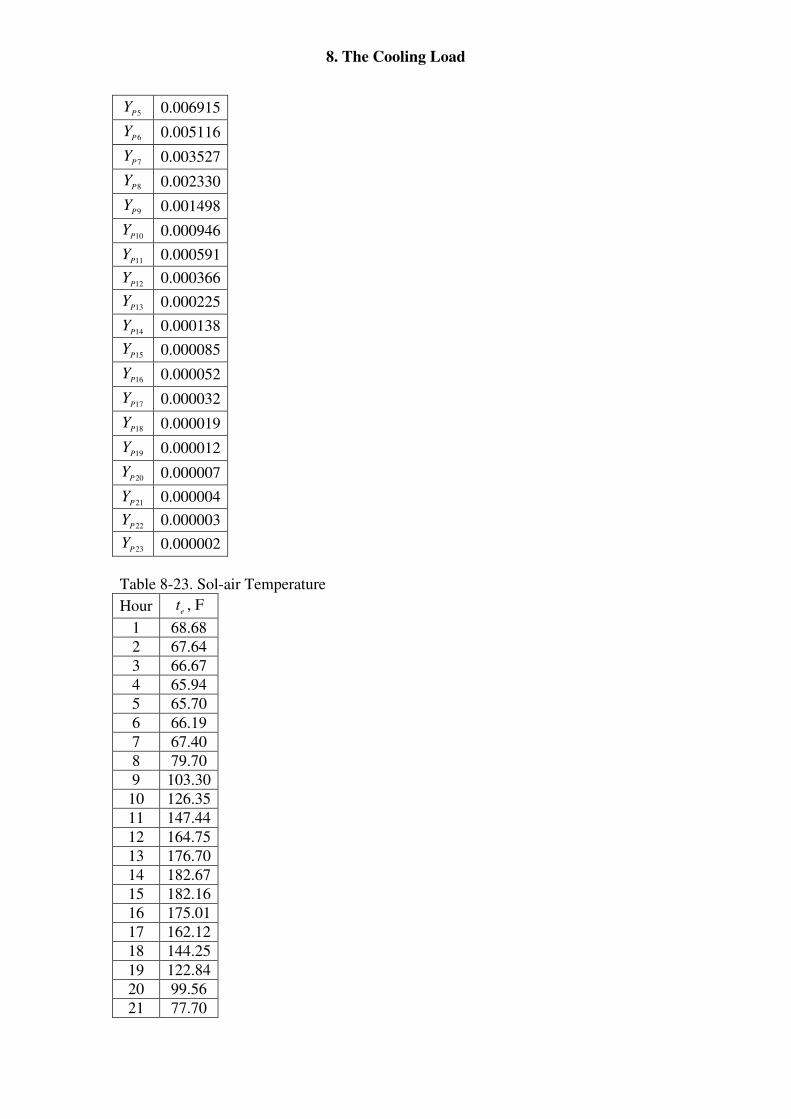
8. The Cooling Load
5PY 0.006915
6PY 0.005116
7PY 0.003527
8PY 0.002330
9PY 0.001498
10PY 0.000946
11PY 0.000591
12PY 0.000366
13PY 0.000225
14PY 0.000138
15PY 0.000085
16PY 0.000052
17PY 0.000032
18PY 0.000019
19PY 0.000012
20PY 0.000007
21PY 0.000004
22PY 0.000003
23PY 0.000002
Table 8-23. Sol-air Temperature
Hour et , F
1 68.68
2 67.64
3 66.67
4 65.94
5 65.70
6 66.19
7 67.40
8 79.70
9 103.30
10 126.35
11 147.44
12 164.75
13 176.70
14 182.67
15 182.16
16 175.01
17 162.12
18 144.25
19 122.84
20 99.56
21 77.70
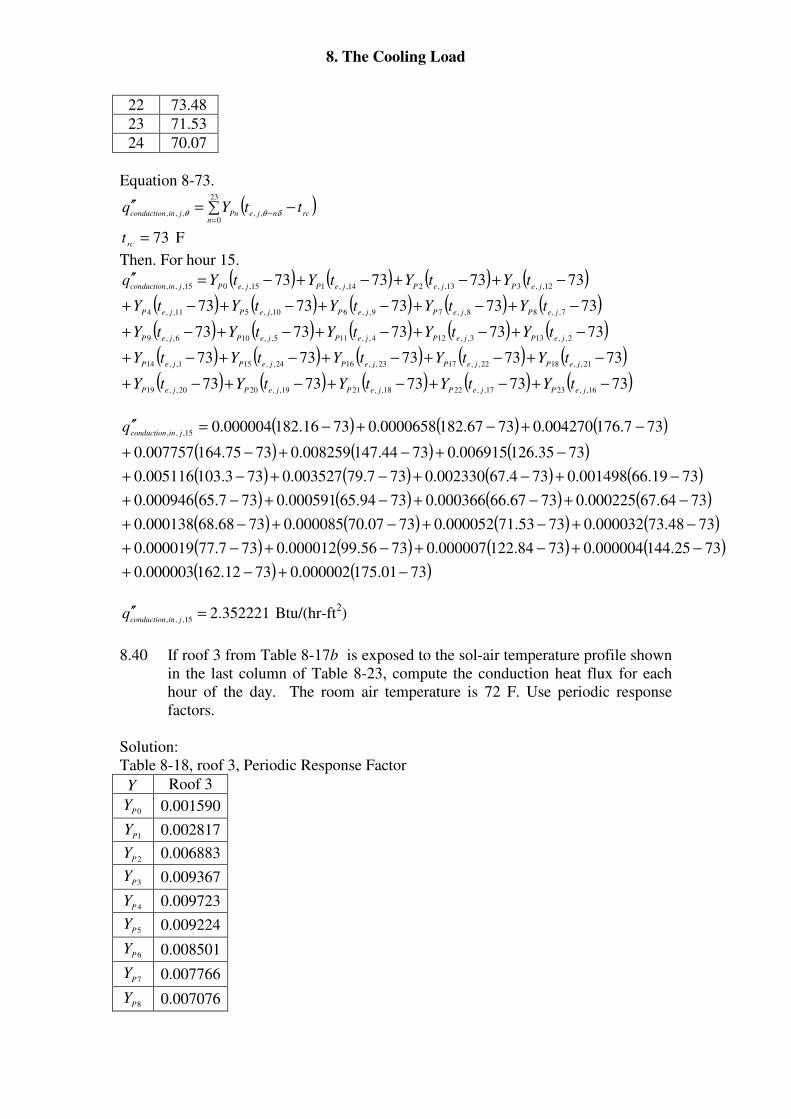
8. The Cooling Load
22 73.48
23 71.53
24 70.07
Equation 8-73.
( )∑ −=′′=
−
23
0,,,,,
nrcnjePnjinconduction
ttYq δθθ
73=rc
t F
Then. For hour 15.
( ) ( ) ( ) ( )( ) ( ) ( ) ( ) ( )( ) ( ) ( ) ( ) ( )( ) ( ) ( ) ( ) ( )( ) ( ) ( ) ( ) ( )7373737373
7373737373
7373737373
7373737373
73737373
16,,2317,,2218,,2119,,2020,,19
21,,1822,,1723,,1624,,151,,14
2,,133,,124,,115,,106,,9
7,,88,,79,,610,,511,,4
12,,313,,214,,115,,015,,,
−+−+−+−+−+
−+−+−+−+−+
−+−+−+−+−+
−+−+−+−+−+
−+−+−+−=′′
jePjePjePjePjeP
jePjePjePjePjeP
jePjePjePjePjeP
jePjePjePjePjeP
jePjePjePjePjinconduction
tYtYtYtYtY
tYtYtYtYtY
tYtYtYtYtY
tYtYtYtYtY
tYtYtYtYq
( ) ( ) ( )
( ) ( ) ( )( ) ( ) ( ) ( )( ) ( ) ( ) ( )( ) ( ) ( ) ( )( ) ( ) ( ) ( )( ) ( )7301.175000002.07312.162000003.0
7325.144000004.07384.122000007.07356.99000012.0737.77000019.0
7348.73000032.07353.71000052.07307.70000085.07368.68000138.0
7364.67000225.07367.66000366.07394.65000591.0737.65000946.0
7319.66001498.0734.67002330.0737.79003527.0733.103005116.0
7335.126006915.07344.147008259.07375.164007757.0
737.176004270.07367.1820000658.07316.182000004.015,,,
−+−+
−+−+−+−+
−+−+−+−+
−+−+−+−+
−+−+−+−+
−+−+−+
−+−+−=′′jinconduction
q
352221.215,,,
=′′jinconduction
q Btu/(hr-ft2)
8.40 If roof 3 from Table 8-17b is exposed to the sol-air temperature profile shown
in the last column of Table 8-23, compute the conduction heat flux for each
hour of the day. The room air temperature is 72 F. Use periodic response
factors.
Solution:
Table 8-18, roof 3, Periodic Response Factor
Y Roof 3
0PY 0.001590
1PY 0.002817
2PY 0.006883
3PY 0.009367
4PY 0.009723
5PY 0.009224
6PY 0.008501
7PY 0.007766
8PY 0.007076
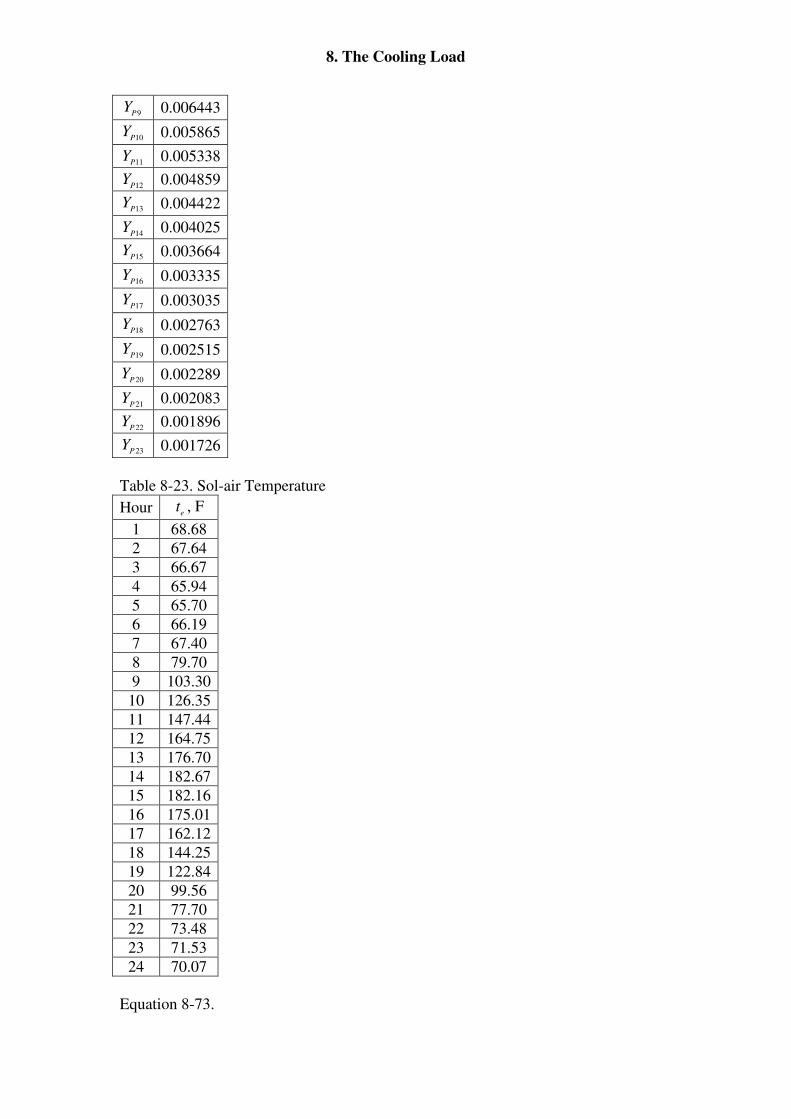
8. The Cooling Load
9PY 0.006443
10PY 0.005865
11PY 0.005338
12PY 0.004859
13PY 0.004422
14PY 0.004025
15PY 0.003664
16PY 0.003335
17PY 0.003035
18PY 0.002763
19PY 0.002515
20PY 0.002289
21PY 0.002083
22PY 0.001896
23PY 0.001726
Table 8-23. Sol-air Temperature
Hour et , F
1 68.68
2 67.64
3 66.67
4 65.94
5 65.70
6 66.19
7 67.40
8 79.70
9 103.30
10 126.35
11 147.44
12 164.75
13 176.70
14 182.67
15 182.16
16 175.01
17 162.12
18 144.25
19 122.84
20 99.56
21 77.70
22 73.48
23 71.53
24 70.07
Equation 8-73.
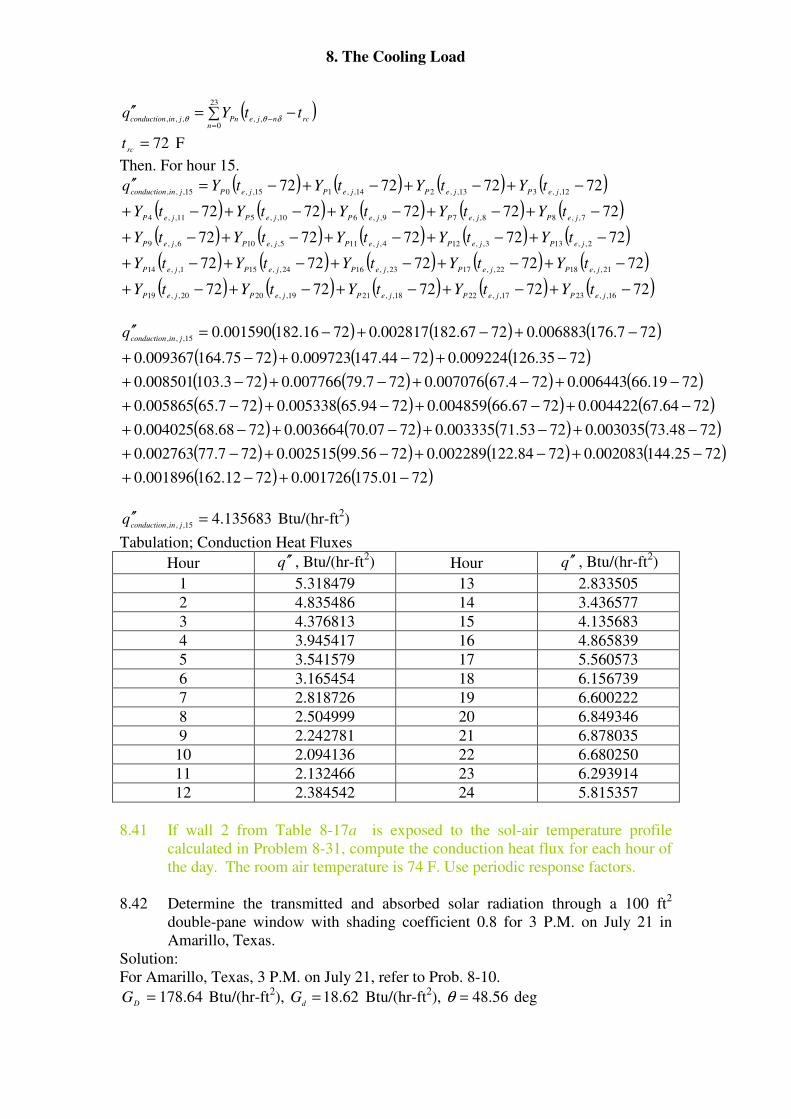
8. The Cooling Load
( )∑ −=′′=
−
23
0,,,,,
nrcnjePnjinconduction
ttYq δθθ
72=rc
t F
Then. For hour 15.
( ) ( ) ( ) ( )( ) ( ) ( ) ( ) ( )( ) ( ) ( ) ( ) ( )( ) ( ) ( ) ( ) ( )( ) ( ) ( ) ( ) ( )7272727272
7272727272
7272727272
7272727272
72727272
16,,2317,,2218,,2119,,2020,,19
21,,1822,,1723,,1624,,151,,14
2,,133,,124,,115,,106,,9
7,,88,,79,,610,,511,,4
12,,313,,214,,115,,015,,,
−+−+−+−+−+
−+−+−+−+−+
−+−+−+−+−+
−+−+−+−+−+
−+−+−+−=′′
jePjePjePjePjeP
jePjePjePjePjeP
jePjePjePjePjeP
jePjePjePjePjeP
jePjePjePjePjinconduction
tYtYtYtYtY
tYtYtYtYtY
tYtYtYtYtY
tYtYtYtYtY
tYtYtYtYq
( ) ( ) ( )
( ) ( ) ( )( ) ( ) ( ) ( )( ) ( ) ( ) ( )( ) ( ) ( ) ( )( ) ( ) ( ) ( )( ) ( )7201.175001726.07212.162001896.0
7225.144002083.07284.122002289.07256.99002515.0727.77002763.0
7248.73003035.07253.71003335.07207.70003664.07268.68004025.0
7264.67004422.07267.66004859.07294.65005338.0727.65005865.0
7219.66006443.0724.67007076.0727.79007766.0723.103008501.0
7235.126009224.07244.147009723.07275.164009367.0
727.176006883.07267.182002817.07216.182001590.015,,,
−+−+
−+−+−+−+
−+−+−+−+
−+−+−+−+
−+−+−+−+
−+−+−+
−+−+−=′′jinconduction
q
135683.415,,,
=′′jinconduction
q Btu/(hr-ft2)
Tabulation; Conduction Heat Fluxes
Hour q ′′ , Btu/(hr-ft2) Hour q ′′ , Btu/(hr-ft
2)
1 5.318479 13 2.833505
2 4.835486 14 3.436577
3 4.376813 15 4.135683
4 3.945417 16 4.865839
5 3.541579 17 5.560573
6 3.165454 18 6.156739
7 2.818726 19 6.600222
8 2.504999 20 6.849346
9 2.242781 21 6.878035
10 2.094136 22 6.680250
11 2.132466 23 6.293914
12 2.384542 24 5.815357
8.41 If wall 2 from Table 8-17a is exposed to the sol-air temperature profile
calculated in Problem 8-31, compute the conduction heat flux for each hour of
the day. The room air temperature is 74 F. Use periodic response factors.
8.42 Determine the transmitted and absorbed solar radiation through a 100 ft2
double-pane window with shading coefficient 0.8 for 3 P.M. on July 21 in
Amarillo, Texas.
Solution:
For Amarillo, Texas, 3 P.M. on July 21, refer to Prob. 8-10.
64.178=D
G Btu/(hr-ft2), 62.18=
dG Btu/(hr-ft
2), 56.48=θ deg
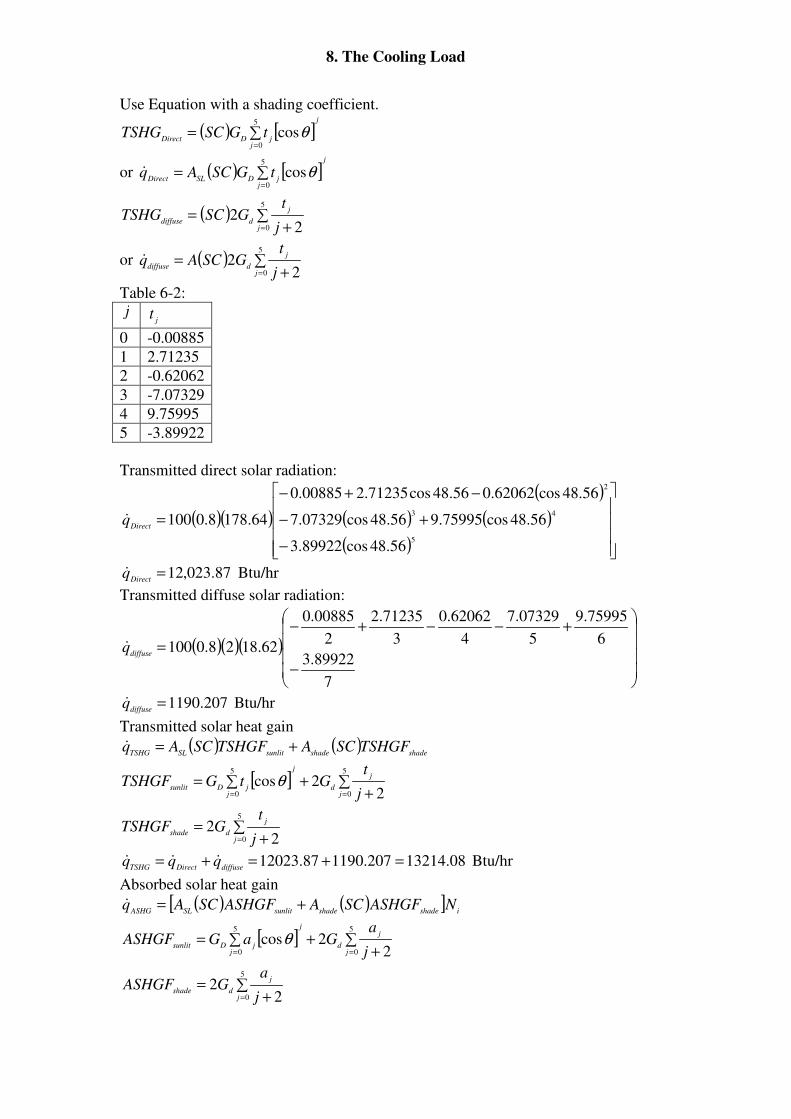
8. The Cooling Load
Use Equation with a shading coefficient.
( ) [ ]j
jjDDirect
tGSCTSHG ∑==
5
0
cosθ
or ( ) [ ]j
jjDSLDirect
tGSCAq ∑==
5
0
cosθ&
( ) ∑+
==
5
0 22
j
j
ddiffusej
tGSCTSHG
or ( ) ∑+
==
5
0 22
j
j
ddiffusej
tGSCAq&
Table 6-2: j
jt
0 -0.00885
1 2.71235
2 -0.62062
3 -7.07329
4 9.75995
5 -3.89922
Transmitted direct solar radiation:
( )( )
( )
( ) ( )
( )
−
+−
−+−
=5
43
2
56.48cos89922.3
56.48cos75995.956.48cos07329.7
56.48cos62062.056.48cos71235.200885.0
64.1788.0100Direct
q&
87.023,12=Direct
q& Btu/hr
Transmitted diffuse solar radiation:
( )( )( )
−
+−−+−
=
7
89922.3
6
75995.9
5
07329.7
4
62062.0
3
71235.2
2
00885.0
62.1828.0100diffuse
q&
207.1190=diffuse
q& Btu/hr
Transmitted solar heat gain
( ) ( )shadeshadesunlitSLTSHG
TSHGFSCATSHGFSCAq +=&
[ ] ∑+
+∑===
5
0
5
0 22cos
j
j
d
j
jjDsunlit
j
tGtGTSHGF θ
∑+
==
5
0 22
j
j
dshadej
tGTSHGF
08.13214207.119087.12023 =+=+=diffuseDirectTSHG
qqq &&& Btu/hr
Absorbed solar heat gain
( ) ( )[ ]ishadeshadesunlitSLASHG
NASHGFSCAASHGFSCAq +=&
[ ] ∑+
+∑===
5
0
5
0 22cos
j
j
d
j
jjDsunlit
j
aGaGASHGF θ
∑+
==
5
0 22
j
j
dshadej
aGASHGF
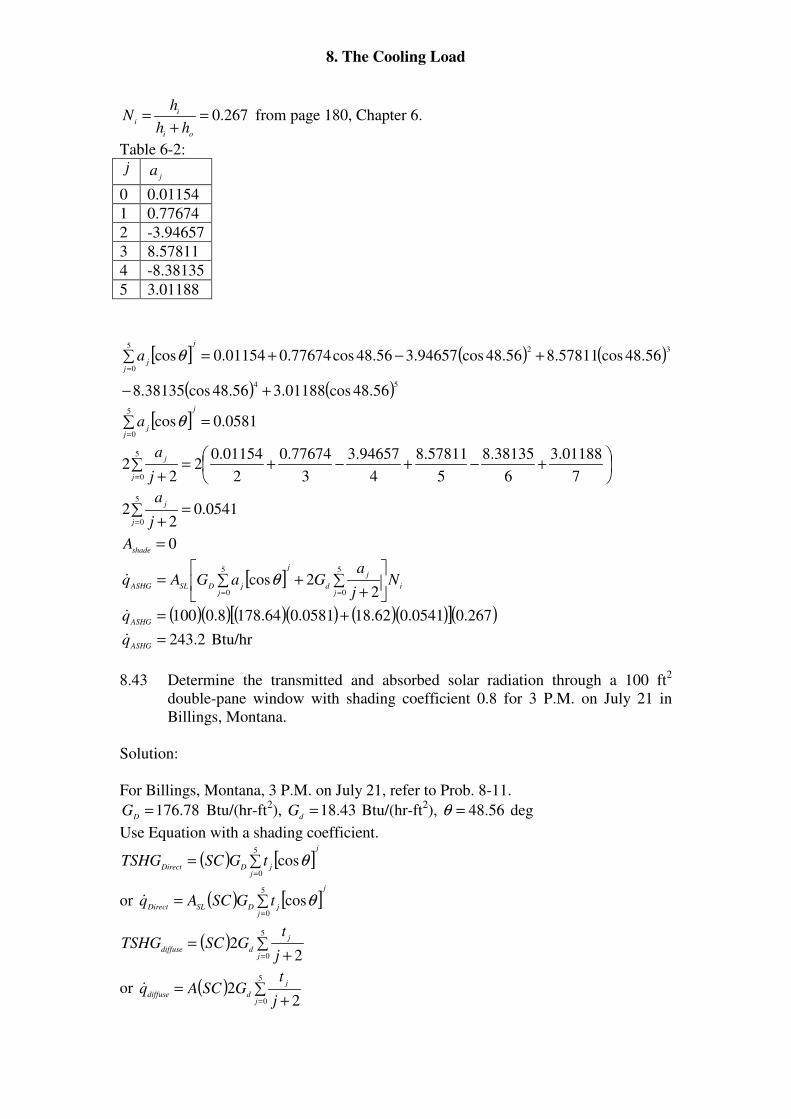
8. The Cooling Load
267.0=+
=oi
i
ihh
hN from page 180, Chapter 6.
Table 6-2: j
ja
0 0.01154
1 0.77674
2 -3.94657
3 8.57811
4 -8.38135
5 3.01188
[ ] ( ) ( )
( ) ( )54
325
0
56.48cos01188.356.48cos38135.8
56.48cos57811.856.48cos94657.356.48cos77674.001154.0cos
+−
+−+=∑=
j
jj
a θ
[ ] 0581.0cos5
0
=∑=
j
jj
a θ
+−+−+=∑
+= 7
01188.3
6
38135.8
5
57811.8
4
94657.3
3
77674.0
2
01154.02
22
5
0j
j
j
a
0541.02
25
0
=∑+=j
j
j
a
0=shade
A
[ ]i
j
j
d
j
jjDSLASHG
Nj
aGaGAq
∑
++∑=
==
5
0
5
0 22cosθ&
( )( ) ( )( ) ( )( )[ ]( )267.00541.062.180581.064.1788.0100 +=ASHG
q&
2.243=ASHG
q& Btu/hr
8.43 Determine the transmitted and absorbed solar radiation through a 100 ft2
double-pane window with shading coefficient 0.8 for 3 P.M. on July 21 in
Billings, Montana.
Solution:
For Billings, Montana, 3 P.M. on July 21, refer to Prob. 8-11.
78.176=D
G Btu/(hr-ft2), 43.18=
dG Btu/(hr-ft
2), 56.48=θ deg
Use Equation with a shading coefficient.
( ) [ ]j
jjDDirect
tGSCTSHG ∑==
5
0
cosθ
or ( ) [ ]j
jjDSLDirect
tGSCAq ∑==
5
0
cosθ&
( ) ∑+
==
5
0 22
j
j
ddiffusej
tGSCTSHG
or ( ) ∑+
==
5
0 22
j
j
ddiffusej
tGSCAq&
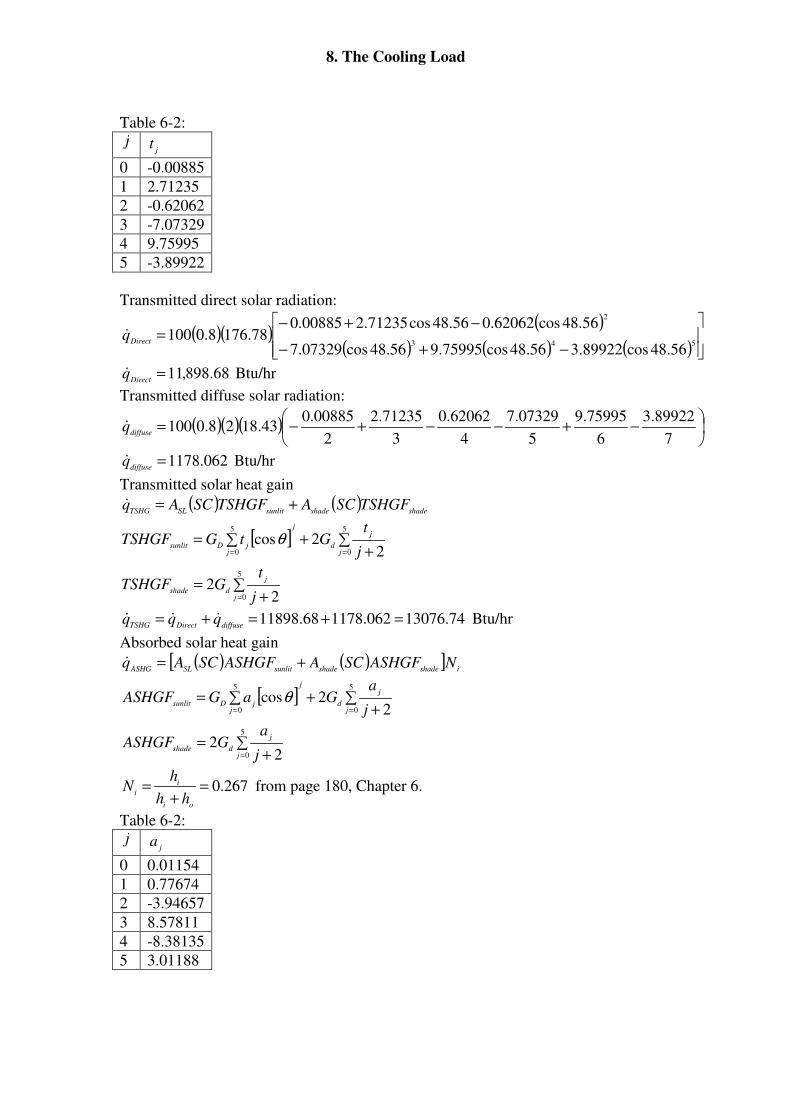
8. The Cooling Load
Table 6-2: j
jt
0 -0.00885
1 2.71235
2 -0.62062
3 -7.07329
4 9.75995
5 -3.89922
Transmitted direct solar radiation:
( )( )( )
( ) ( ) ( )
−+−
−+−=
543
2
56.48cos89922.356.48cos75995.956.48cos07329.7
56.48cos62062.056.48cos71235.200885.078.1768.0100
Directq&
68.898,11=Direct
q& Btu/hr
Transmitted diffuse solar radiation:
( )( )( )
−+−−+−=
7
89922.3
6
75995.9
5
07329.7
4
62062.0
3
71235.2
2
00885.043.1828.0100
diffuseq&
062.1178=diffuse
q& Btu/hr
Transmitted solar heat gain
( ) ( )shadeshadesunlitSLTSHG
TSHGFSCATSHGFSCAq +=&
[ ] ∑+
+∑===
5
0
5
0 22cos
j
j
d
j
jjDsunlit
j
tGtGTSHGF θ
∑+
==
5
0 22
j
j
dshadej
tGTSHGF
74.13076062.117868.11898 =+=+=diffuseDirectTSHG
qqq &&& Btu/hr
Absorbed solar heat gain
( ) ( )[ ]ishadeshadesunlitSLASHG
NASHGFSCAASHGFSCAq +=&
[ ] ∑+
+∑===
5
0
5
0 22cos
j
j
d
j
jjDsunlit
j
aGaGASHGF θ
∑+
==
5
0 22
j
j
dshadej
aGASHGF
267.0=+
=oi
i
ihh
hN from page 180, Chapter 6.
Table 6-2: j
ja
0 0.01154
1 0.77674
2 -3.94657
3 8.57811
4 -8.38135
5 3.01188
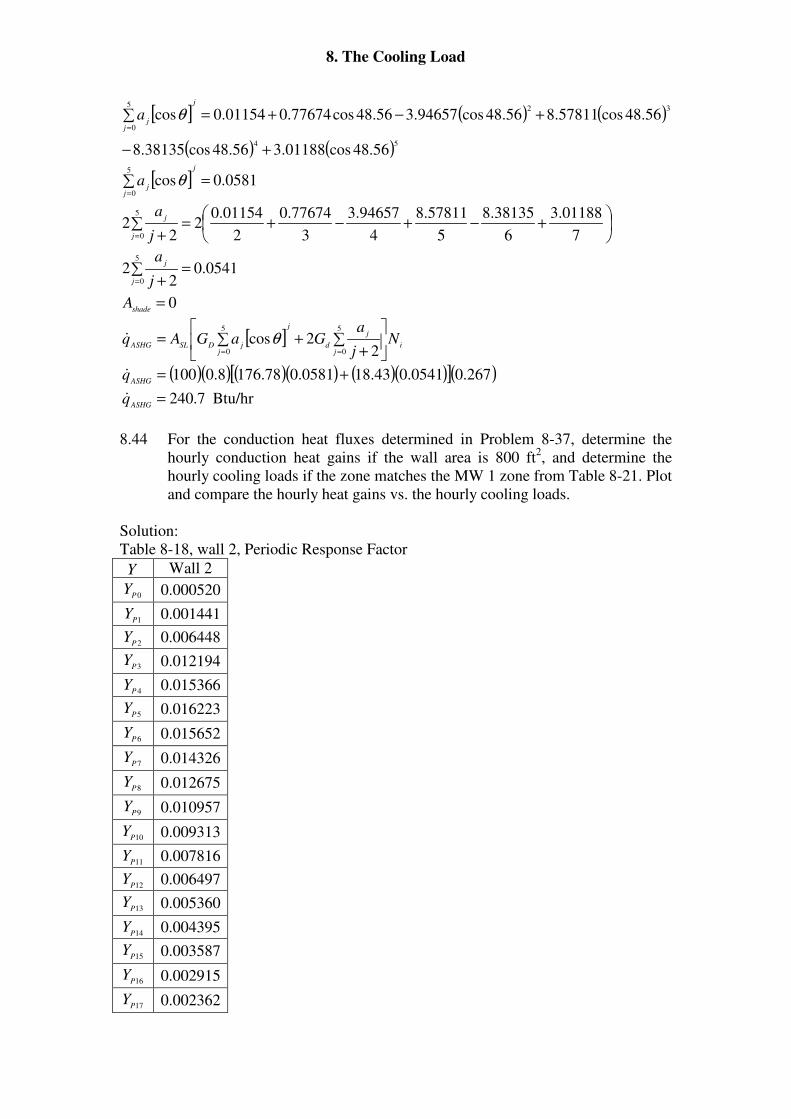
8. The Cooling Load
[ ] ( ) ( )
( ) ( )54
325
0
56.48cos01188.356.48cos38135.8
56.48cos57811.856.48cos94657.356.48cos77674.001154.0cos
+−
+−+=∑=
j
jj
a θ
[ ] 0581.0cos5
0
=∑=
j
jj
a θ
+−+−+=∑
+= 7
01188.3
6
38135.8
5
57811.8
4
94657.3
3
77674.0
2
01154.02
22
5
0j
j
j
a
0541.02
25
0
=∑+=j
j
j
a
0=shade
A
[ ]i
j
j
d
j
jjDSLASHG
Nj
aGaGAq
∑
++∑=
==
5
0
5
0 22cosθ&
( )( ) ( )( ) ( )( )[ ]( )267.00541.043.180581.078.1768.0100 +=ASHG
q&
7.240=ASHG
q& Btu/hr
8.44 For the conduction heat fluxes determined in Problem 8-37, determine the
hourly conduction heat gains if the wall area is 800 ft2, and determine the
hourly cooling loads if the zone matches the MW 1 zone from Table 8-21. Plot
and compare the hourly heat gains vs. the hourly cooling loads.
Solution:
Table 8-18, wall 2, Periodic Response Factor
Y Wall 2
0PY 0.000520
1PY 0.001441
2PY 0.006448
3PY 0.012194
4PY 0.015366
5PY 0.016223
6PY 0.015652
7PY 0.014326
8PY 0.012675
9PY 0.010957
10PY 0.009313
11PY 0.007816
12PY 0.006497
13PY 0.005360
14PY 0.004395
15PY 0.003587
16PY 0.002915
17PY 0.002362
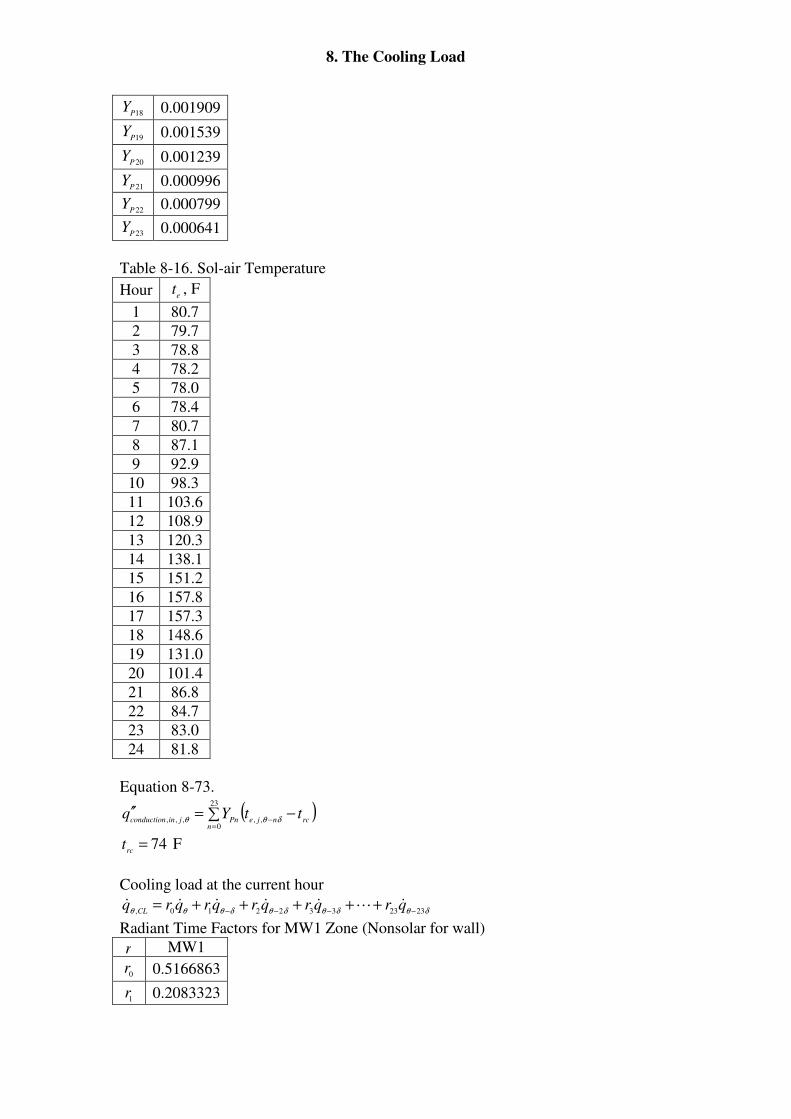
8. The Cooling Load
18PY 0.001909
19PY 0.001539
20PY 0.001239
21PY 0.000996
22PY 0.000799
23PY 0.000641
Table 8-16. Sol-air Temperature
Hour et , F
1 80.7
2 79.7
3 78.8
4 78.2
5 78.0
6 78.4
7 80.7
8 87.1
9 92.9
10 98.3
11 103.6
12 108.9
13 120.3
14 138.1
15 151.2
16 157.8
17 157.3
18 148.6
19 131.0
20 101.4
21 86.8
22 84.7
23 83.0
24 81.8
Equation 8-73.
( )∑ −=′′=
−
23
0,,,,,
nrcnjePnjinconduction
ttYq δθθ
74=rc
t F
Cooling load at the current hour
δθδθδθδθθθ 2323332210, −−−−+++++= qrqrqrqrqrq
CL&L&&&&&
Radiant Time Factors for MW1 Zone (Nonsolar for wall)
r MW1
0r 0.5166863
1r 0.2083323
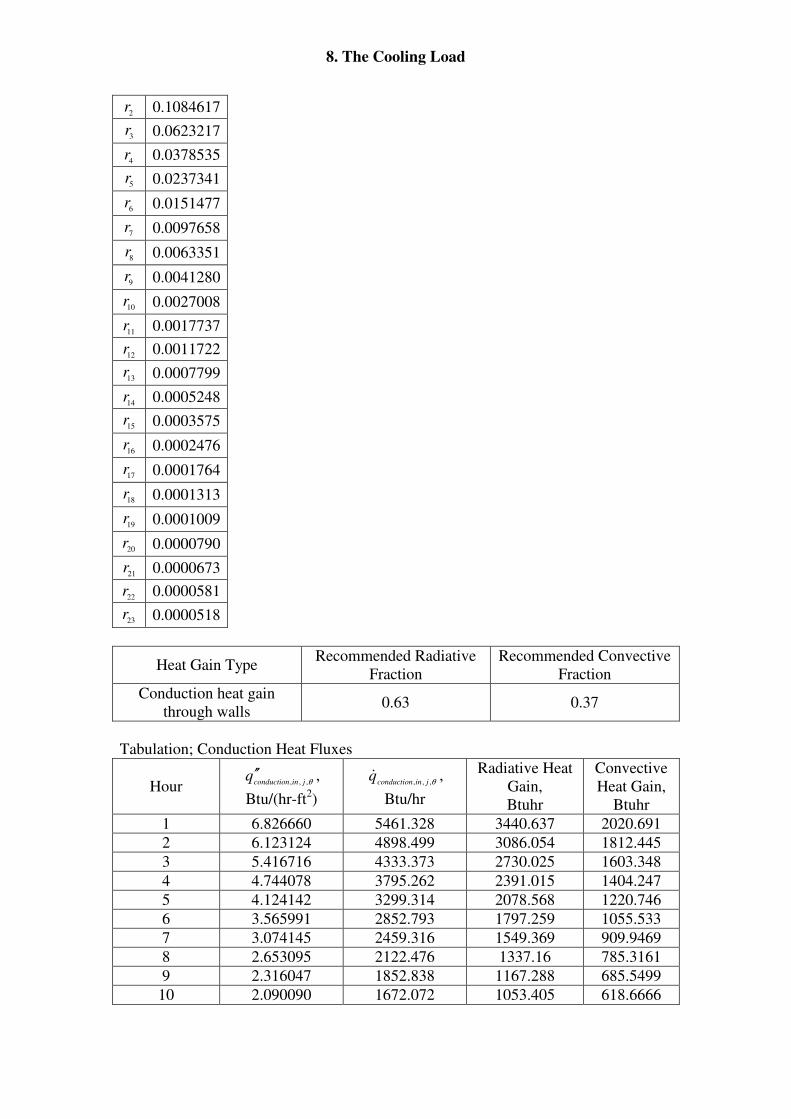
8. The Cooling Load
2r 0.1084617
3r 0.0623217
4r 0.0378535
5r 0.0237341
6r 0.0151477
7r 0.0097658
8r 0.0063351
9r 0.0041280
10r 0.0027008
11r 0.0017737
12r 0.0011722
13r 0.0007799
14r 0.0005248
15r 0.0003575
16r 0.0002476
17r 0.0001764
18r 0.0001313
19r 0.0001009
20r 0.0000790
21r 0.0000673
22r 0.0000581
23r 0.0000518
Heat Gain Type Recommended Radiative
Fraction
Recommended Convective
Fraction
Conduction heat gain
through walls 0.63 0.37
Tabulation; Conduction Heat Fluxes
Hour θ,,, jinconductionq ′′ ,
Btu/(hr-ft2)
θ,,, jinconductionq& ,
Btu/hr
Radiative Heat
Gain,
Btuhr
Convective
Heat Gain,
Btuhr
1 6.826660 5461.328 3440.637 2020.691
2 6.123124 4898.499 3086.054 1812.445
3 5.416716 4333.373 2730.025 1603.348
4 4.744078 3795.262 2391.015 1404.247
5 4.124142 3299.314 2078.568 1220.746
6 3.565991 2852.793 1797.259 1055.533
7 3.074145 2459.316 1549.369 909.9469
8 2.653095 2122.476 1337.16 785.3161
9 2.316047 1852.838 1167.288 685.5499
10 2.090090 1672.072 1053.405 618.6666
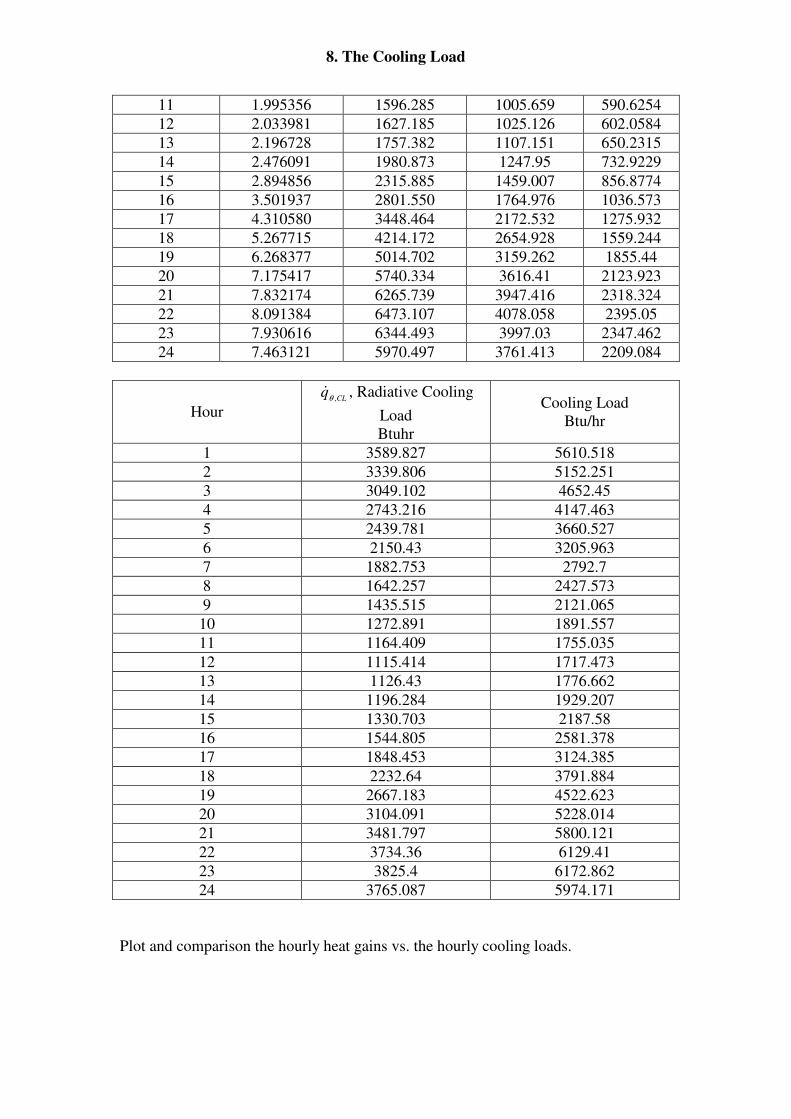
8. The Cooling Load
11 1.995356 1596.285 1005.659 590.6254
12 2.033981 1627.185 1025.126 602.0584
13 2.196728 1757.382 1107.151 650.2315
14 2.476091 1980.873 1247.95 732.9229
15 2.894856 2315.885 1459.007 856.8774
16 3.501937 2801.550 1764.976 1036.573
17 4.310580 3448.464 2172.532 1275.932
18 5.267715 4214.172 2654.928 1559.244
19 6.268377 5014.702 3159.262 1855.44
20 7.175417 5740.334 3616.41 2123.923
21 7.832174 6265.739 3947.416 2318.324
22 8.091384 6473.107 4078.058 2395.05
23 7.930616 6344.493 3997.03 2347.462
24 7.463121 5970.497 3761.413 2209.084
Hour CL
q,θ
& , Radiative Cooling
Load
Btuhr
Cooling Load
Btu/hr
1 3589.827 5610.518
2 3339.806 5152.251
3 3049.102 4652.45
4 2743.216 4147.463
5 2439.781 3660.527
6 2150.43 3205.963
7 1882.753 2792.7
8 1642.257 2427.573
9 1435.515 2121.065
10 1272.891 1891.557
11 1164.409 1755.035
12 1115.414 1717.473
13 1126.43 1776.662
14 1196.284 1929.207
15 1330.703 2187.58
16 1544.805 2581.378
17 1848.453 3124.385
18 2232.64 3791.884
19 2667.183 4522.623
20 3104.091 5228.014
21 3481.797 5800.121
22 3734.36 6129.41
23 3825.4 6172.862
24 3765.087 5974.171
Plot and comparison the hourly heat gains vs. the hourly cooling loads.
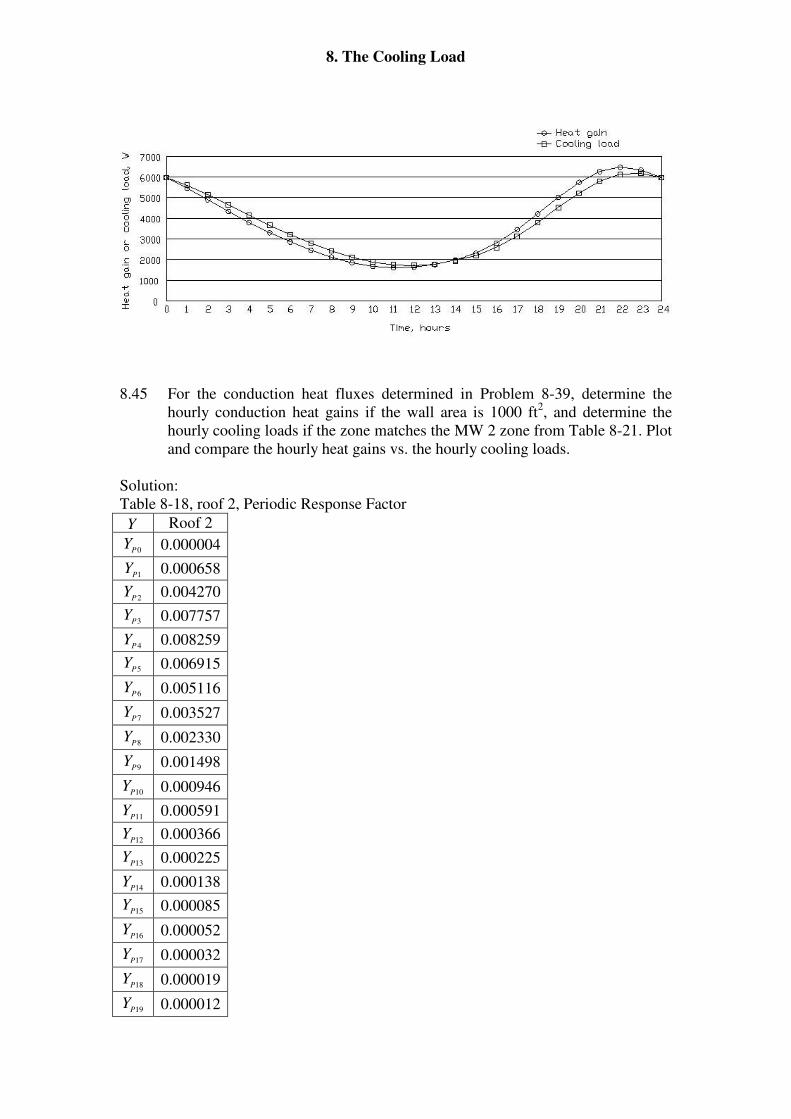
8. The Cooling Load
8.45 For the conduction heat fluxes determined in Problem 8-39, determine the
hourly conduction heat gains if the wall area is 1000 ft2, and determine the
hourly cooling loads if the zone matches the MW 2 zone from Table 8-21. Plot
and compare the hourly heat gains vs. the hourly cooling loads.
Solution:
Table 8-18, roof 2, Periodic Response Factor
Y Roof 2
0PY 0.000004
1PY 0.000658
2PY 0.004270
3PY 0.007757
4PY 0.008259
5PY 0.006915
6PY 0.005116
7PY 0.003527
8PY 0.002330
9PY 0.001498
10PY 0.000946
11PY 0.000591
12PY 0.000366
13PY 0.000225
14PY 0.000138
15PY 0.000085
16PY 0.000052
17PY 0.000032
18PY 0.000019
19PY 0.000012
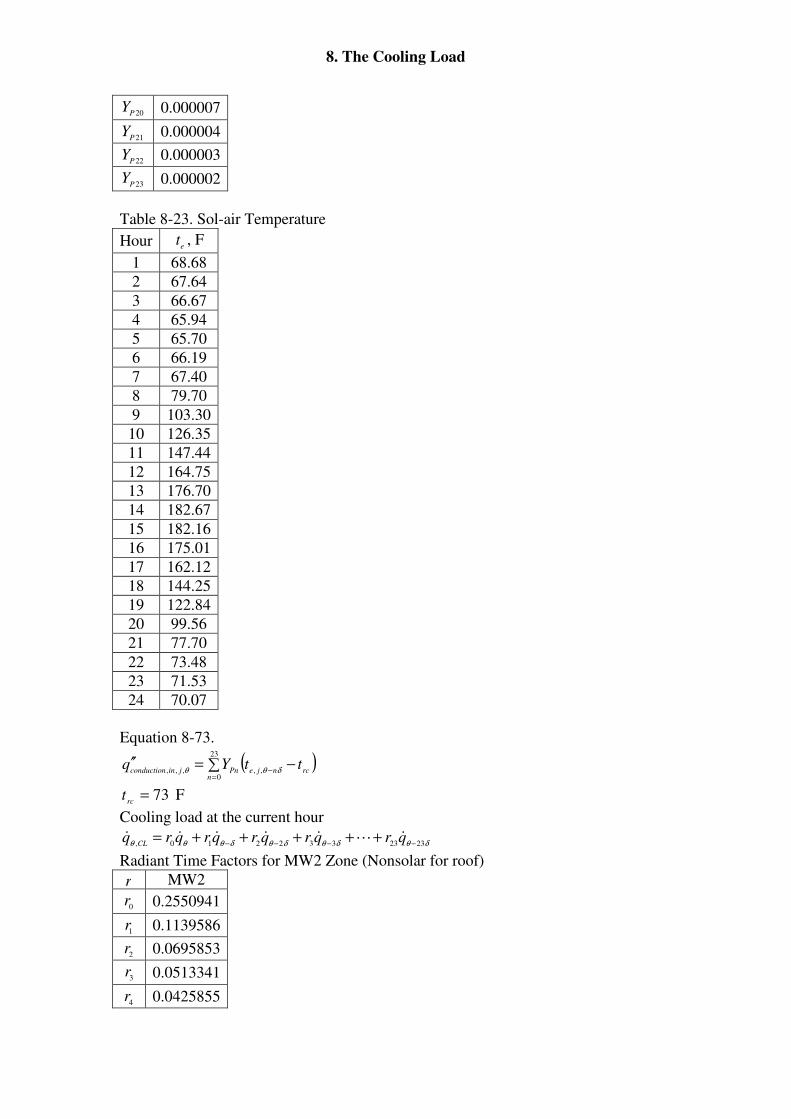
8. The Cooling Load
20PY 0.000007
21PY 0.000004
22PY 0.000003
23PY 0.000002
Table 8-23. Sol-air Temperature
Hour et , F
1 68.68
2 67.64
3 66.67
4 65.94
5 65.70
6 66.19
7 67.40
8 79.70
9 103.30
10 126.35
11 147.44
12 164.75
13 176.70
14 182.67
15 182.16
16 175.01
17 162.12
18 144.25
19 122.84
20 99.56
21 77.70
22 73.48
23 71.53
24 70.07
Equation 8-73.
( )∑ −=′′=
−
23
0,,,,,
nrcnjePnjinconduction
ttYq δθθ
73=rc
t F
Cooling load at the current hour
δθδθδθδθθθ 2323332210, −−−−+++++= qrqrqrqrqrq
CL&L&&&&&
Radiant Time Factors for MW2 Zone (Nonsolar for roof)
r MW2
0r 0.2550941
1r 0.1139586
2r 0.0695853
3r 0.0513341
4r 0.0425855
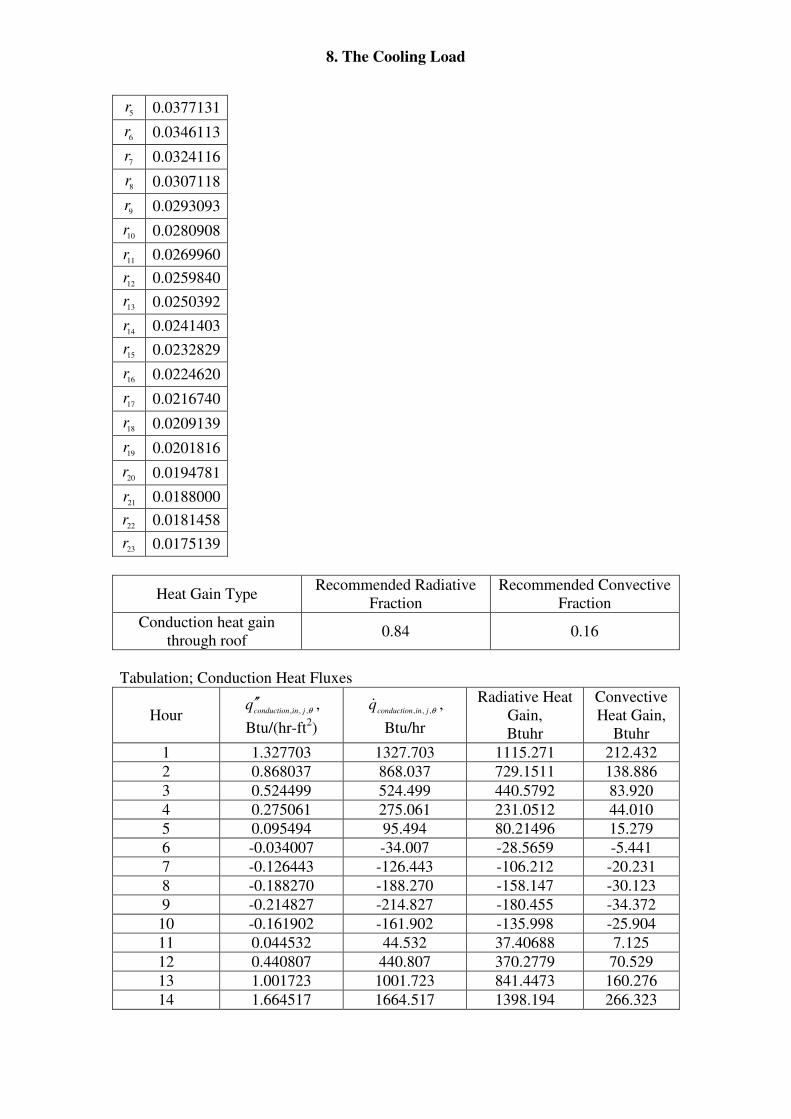
8. The Cooling Load
5r 0.0377131
6r 0.0346113
7r 0.0324116
8r 0.0307118
9r 0.0293093
10r 0.0280908
11r 0.0269960
12r 0.0259840
13r 0.0250392
14r 0.0241403
15r 0.0232829
16r 0.0224620
17r 0.0216740
18r 0.0209139
19r 0.0201816
20r 0.0194781
21r 0.0188000
22r 0.0181458
23r 0.0175139
Heat Gain Type Recommended Radiative
Fraction
Recommended Convective
Fraction
Conduction heat gain
through roof 0.84 0.16
Tabulation; Conduction Heat Fluxes
Hour θ,,, jinconductionq ′′ ,
Btu/(hr-ft2)
θ,,, jinconductionq& ,
Btu/hr
Radiative Heat
Gain,
Btuhr
Convective
Heat Gain,
Btuhr
1 1.327703 1327.703 1115.271 212.432
2 0.868037 868.037 729.1511 138.886
3 0.524499 524.499 440.5792 83.920
4 0.275061 275.061 231.0512 44.010
5 0.095494 95.494 80.21496 15.279
6 -0.034007 -34.007 -28.5659 -5.441
7 -0.126443 -126.443 -106.212 -20.231
8 -0.188270 -188.270 -158.147 -30.123
9 -0.214827 -214.827 -180.455 -34.372
10 -0.161902 -161.902 -135.998 -25.904
11 0.044532 44.532 37.40688 7.125
12 0.440807 440.807 370.2779 70.529
13 1.001723 1001.723 841.4473 160.276
14 1.664517 1664.517 1398.194 266.323
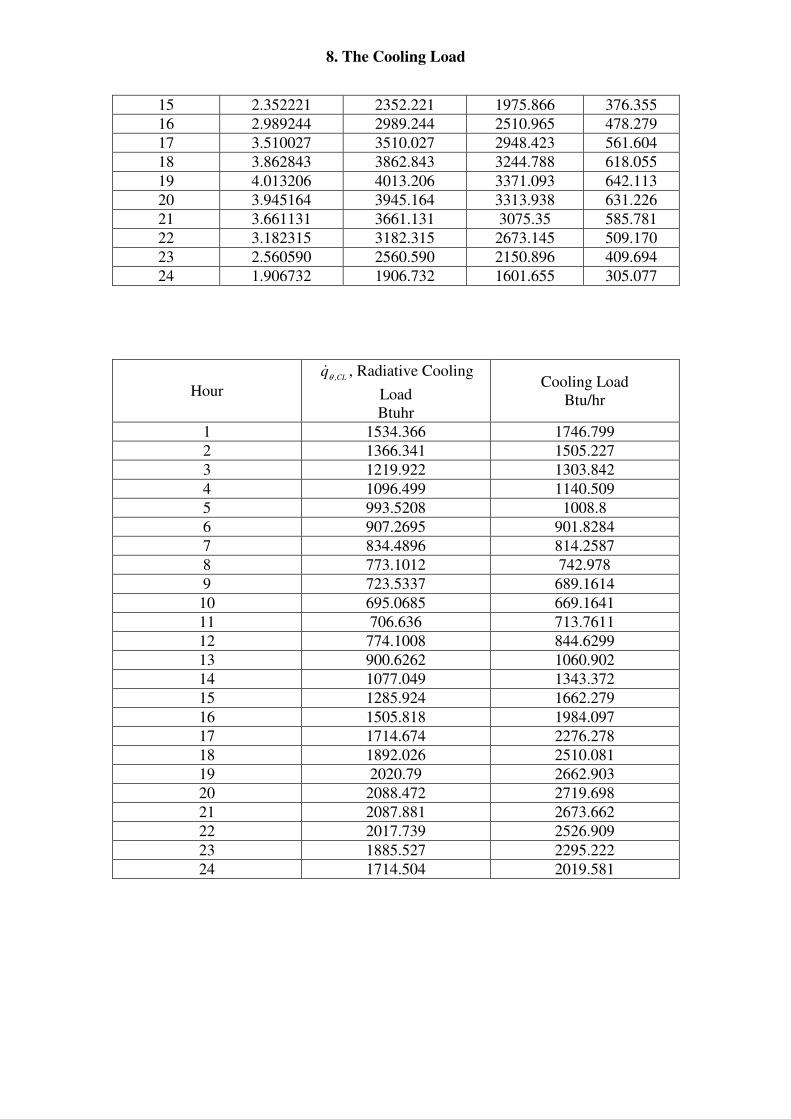
8. The Cooling Load
15 2.352221 2352.221 1975.866 376.355
16 2.989244 2989.244 2510.965 478.279
17 3.510027 3510.027 2948.423 561.604
18 3.862843 3862.843 3244.788 618.055
19 4.013206 4013.206 3371.093 642.113
20 3.945164 3945.164 3313.938 631.226
21 3.661131 3661.131 3075.35 585.781
22 3.182315 3182.315 2673.145 509.170
23 2.560590 2560.590 2150.896 409.694
24 1.906732 1906.732 1601.655 305.077
Hour CL
q,θ
& , Radiative Cooling
Load
Btuhr
Cooling Load
Btu/hr
1 1534.366 1746.799
2 1366.341 1505.227
3 1219.922 1303.842
4 1096.499 1140.509
5 993.5208 1008.8
6 907.2695 901.8284
7 834.4896 814.2587
8 773.1012 742.978
9 723.5337 689.1614
10 695.0685 669.1641
11 706.636 713.7611
12 774.1008 844.6299
13 900.6262 1060.902
14 1077.049 1343.372
15 1285.924 1662.279
16 1505.818 1984.097
17 1714.674 2276.278
18 1892.026 2510.081
19 2020.79 2662.903
20 2088.472 2719.698
21 2087.881 2673.662
22 2017.739 2526.909
23 1885.527 2295.222
24 1714.504 2019.581
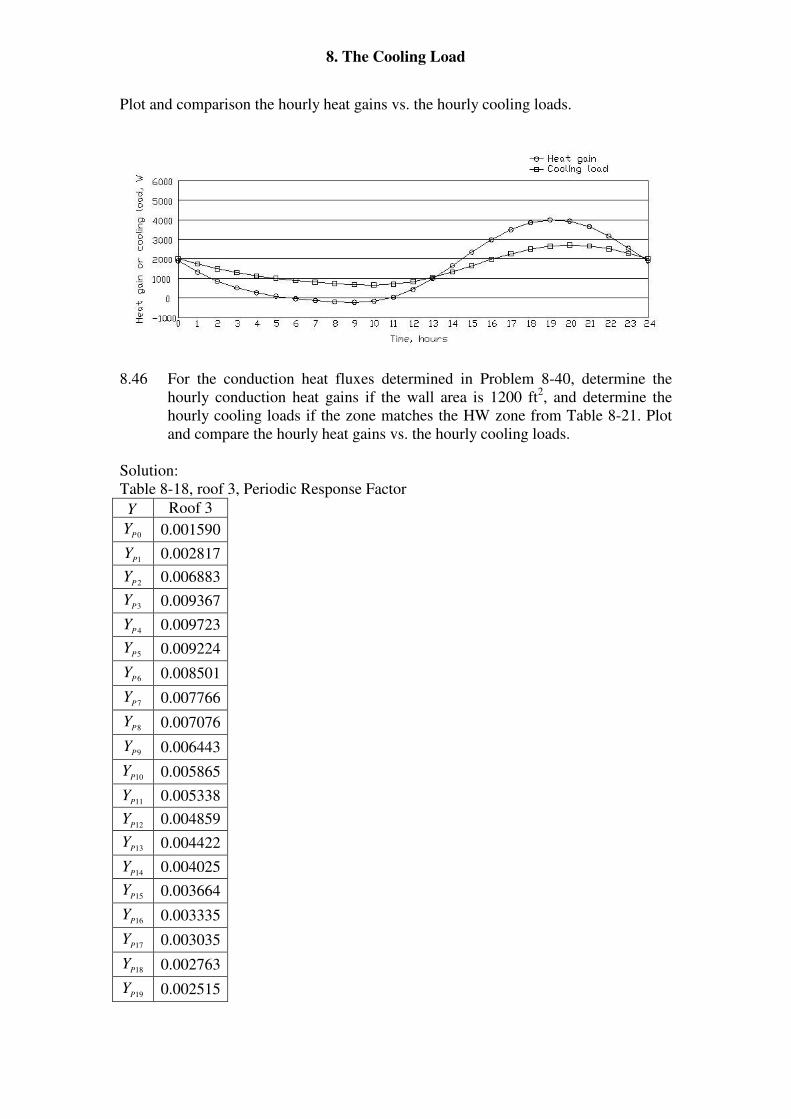
8. The Cooling Load
Plot and comparison the hourly heat gains vs. the hourly cooling loads.
8.46 For the conduction heat fluxes determined in Problem 8-40, determine the
hourly conduction heat gains if the wall area is 1200 ft2, and determine the
hourly cooling loads if the zone matches the HW zone from Table 8-21. Plot
and compare the hourly heat gains vs. the hourly cooling loads.
Solution:
Table 8-18, roof 3, Periodic Response Factor
Y Roof 3
0PY 0.001590
1PY 0.002817
2PY 0.006883
3PY 0.009367
4PY 0.009723
5PY 0.009224
6PY 0.008501
7PY 0.007766
8PY 0.007076
9PY 0.006443
10PY 0.005865
11PY 0.005338
12PY 0.004859
13PY 0.004422
14PY 0.004025
15PY 0.003664
16PY 0.003335
17PY 0.003035
18PY 0.002763
19PY 0.002515

8. The Cooling Load
20PY 0.002289
21PY 0.002083
22PY 0.001896
23PY 0.001726
Table 8-23. Sol-air Temperature
Hour et , F
1 68.68
2 67.64
3 66.67
4 65.94
5 65.70
6 66.19
7 67.40
8 79.70
9 103.30
10 126.35
11 147.44
12 164.75
13 176.70
14 182.67
15 182.16
16 175.01
17 162.12
18 144.25
19 122.84
20 99.56
21 77.70
22 73.48
23 71.53
24 70.07
Equation 8-73.
( )∑ −=′′=
−
23
0,,,,,
nrcnjePnjinconduction
ttYq δθθ
72=rc
t F
Cooling load at the current hour
δθδθδθδθθθ 2323332210, −−−−+++++= qrqrqrqrqrq
CL&L&&&&&
Radiant Time Factors for HW Zone (Nonsolar for roof)
r HW
0r 0.2241915
1r 0.0768588
2r 0.057783
3r 0.0501948
4r 0.0456539
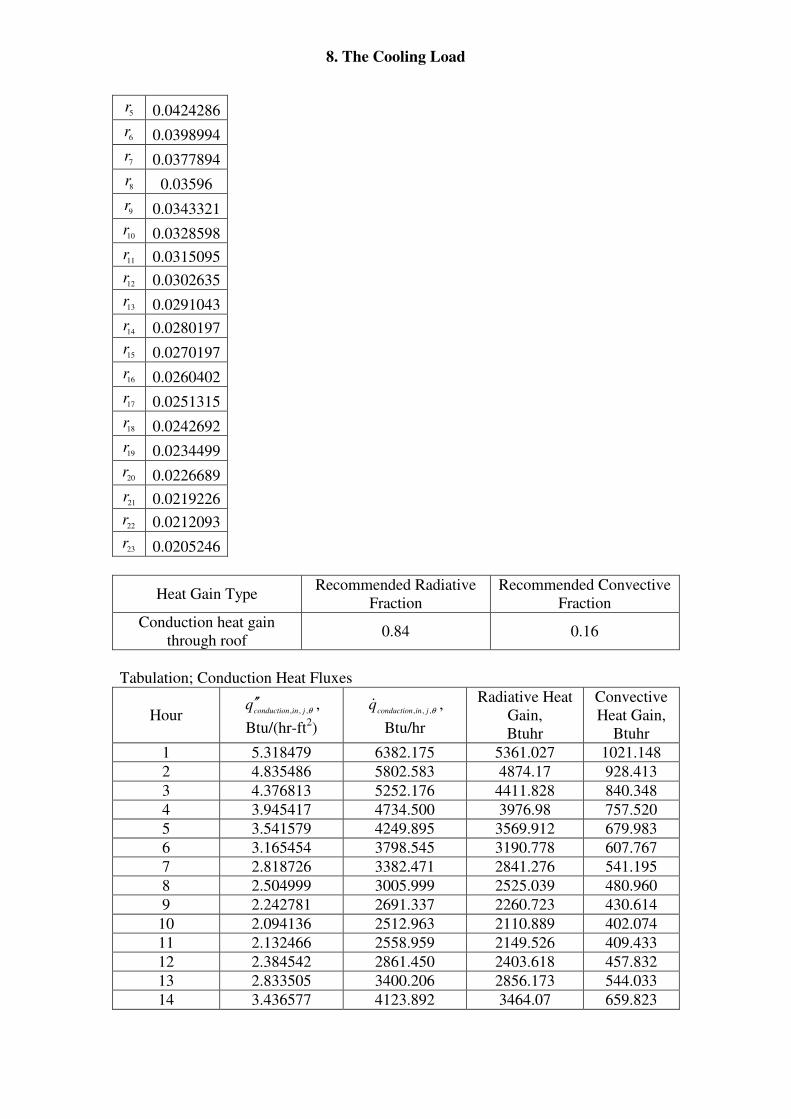
8. The Cooling Load
5r 0.0424286
6r 0.0398994
7r 0.0377894
8r 0.03596
9r 0.0343321
10r 0.0328598
11r 0.0315095
12r 0.0302635
13r 0.0291043
14r 0.0280197
15r 0.0270197
16r 0.0260402
17r 0.0251315
18r 0.0242692
19r 0.0234499
20r 0.0226689
21r 0.0219226
22r 0.0212093
23r 0.0205246
Heat Gain Type Recommended Radiative
Fraction
Recommended Convective
Fraction
Conduction heat gain
through roof 0.84 0.16
Tabulation; Conduction Heat Fluxes
Hour θ,,, jinconductionq ′′ ,
Btu/(hr-ft2)
θ,,, jinconductionq& ,
Btu/hr
Radiative Heat
Gain,
Btuhr
Convective
Heat Gain,
Btuhr
1 5.318479 6382.175 5361.027 1021.148
2 4.835486 5802.583 4874.17 928.413
3 4.376813 5252.176 4411.828 840.348
4 3.945417 4734.500 3976.98 757.520
5 3.541579 4249.895 3569.912 679.983
6 3.165454 3798.545 3190.778 607.767
7 2.818726 3382.471 2841.276 541.195
8 2.504999 3005.999 2525.039 480.960
9 2.242781 2691.337 2260.723 430.614
10 2.094136 2512.963 2110.889 402.074
11 2.132466 2558.959 2149.526 409.433
12 2.384542 2861.450 2403.618 457.832
13 2.833505 3400.206 2856.173 544.033
14 3.436577 4123.892 3464.07 659.823
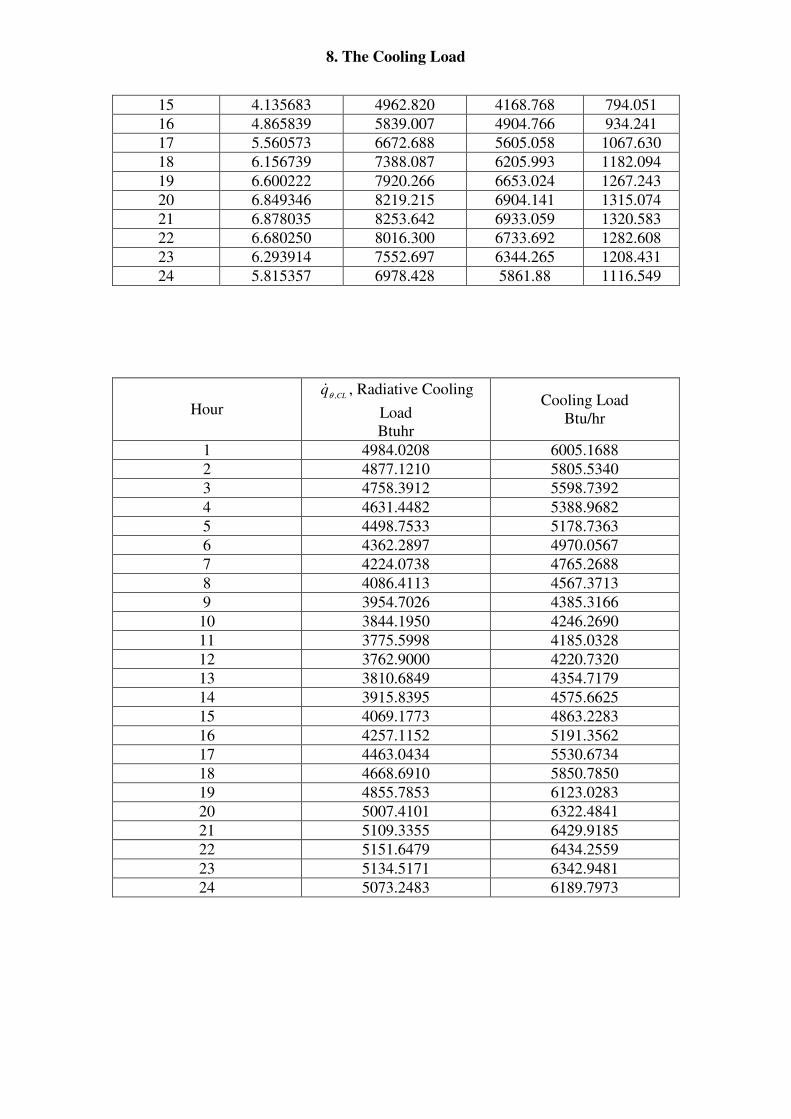
8. The Cooling Load
15 4.135683 4962.820 4168.768 794.051
16 4.865839 5839.007 4904.766 934.241
17 5.560573 6672.688 5605.058 1067.630
18 6.156739 7388.087 6205.993 1182.094
19 6.600222 7920.266 6653.024 1267.243
20 6.849346 8219.215 6904.141 1315.074
21 6.878035 8253.642 6933.059 1320.583
22 6.680250 8016.300 6733.692 1282.608
23 6.293914 7552.697 6344.265 1208.431
24 5.815357 6978.428 5861.88 1116.549
Hour CL
q,θ
& , Radiative Cooling
Load
Btuhr
Cooling Load
Btu/hr
1 4984.0208 6005.1688
2 4877.1210 5805.5340
3 4758.3912 5598.7392
4 4631.4482 5388.9682
5 4498.7533 5178.7363
6 4362.2897 4970.0567
7 4224.0738 4765.2688
8 4086.4113 4567.3713
9 3954.7026 4385.3166
10 3844.1950 4246.2690
11 3775.5998 4185.0328
12 3762.9000 4220.7320
13 3810.6849 4354.7179
14 3915.8395 4575.6625
15 4069.1773 4863.2283
16 4257.1152 5191.3562
17 4463.0434 5530.6734
18 4668.6910 5850.7850
19 4855.7853 6123.0283
20 5007.4101 6322.4841
21 5109.3355 6429.9185
22 5151.6479 6434.2559
23 5134.5171 6342.9481
24 5073.2483 6189.7973
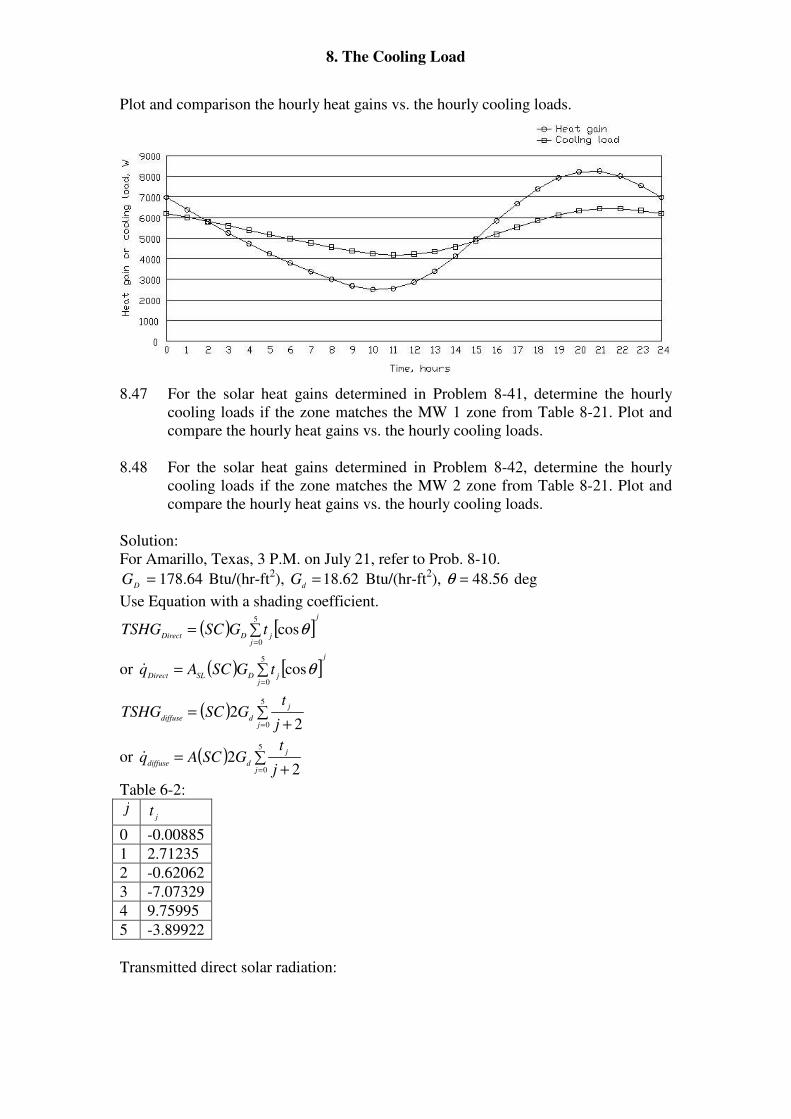
8. The Cooling Load
Plot and comparison the hourly heat gains vs. the hourly cooling loads.
8.47 For the solar heat gains determined in Problem 8-41, determine the hourly
cooling loads if the zone matches the MW 1 zone from Table 8-21. Plot and
compare the hourly heat gains vs. the hourly cooling loads.
8.48 For the solar heat gains determined in Problem 8-42, determine the hourly
cooling loads if the zone matches the MW 2 zone from Table 8-21. Plot and
compare the hourly heat gains vs. the hourly cooling loads.
Solution:
For Amarillo, Texas, 3 P.M. on July 21, refer to Prob. 8-10.
64.178=D
G Btu/(hr-ft2), 62.18=
dG Btu/(hr-ft
2), 56.48=θ deg
Use Equation with a shading coefficient.
( ) [ ]j
jjDDirect
tGSCTSHG ∑==
5
0
cosθ
or ( ) [ ]j
jjDSLDirect
tGSCAq ∑==
5
0
cosθ&
( ) ∑+
==
5
0 22
j
j
ddiffusej
tGSCTSHG
or ( ) ∑+
==
5
0 22
j
j
ddiffusej
tGSCAq&
Table 6-2: j
jt
0 -0.00885
1 2.71235
2 -0.62062
3 -7.07329
4 9.75995
5 -3.89922
Transmitted direct solar radiation:
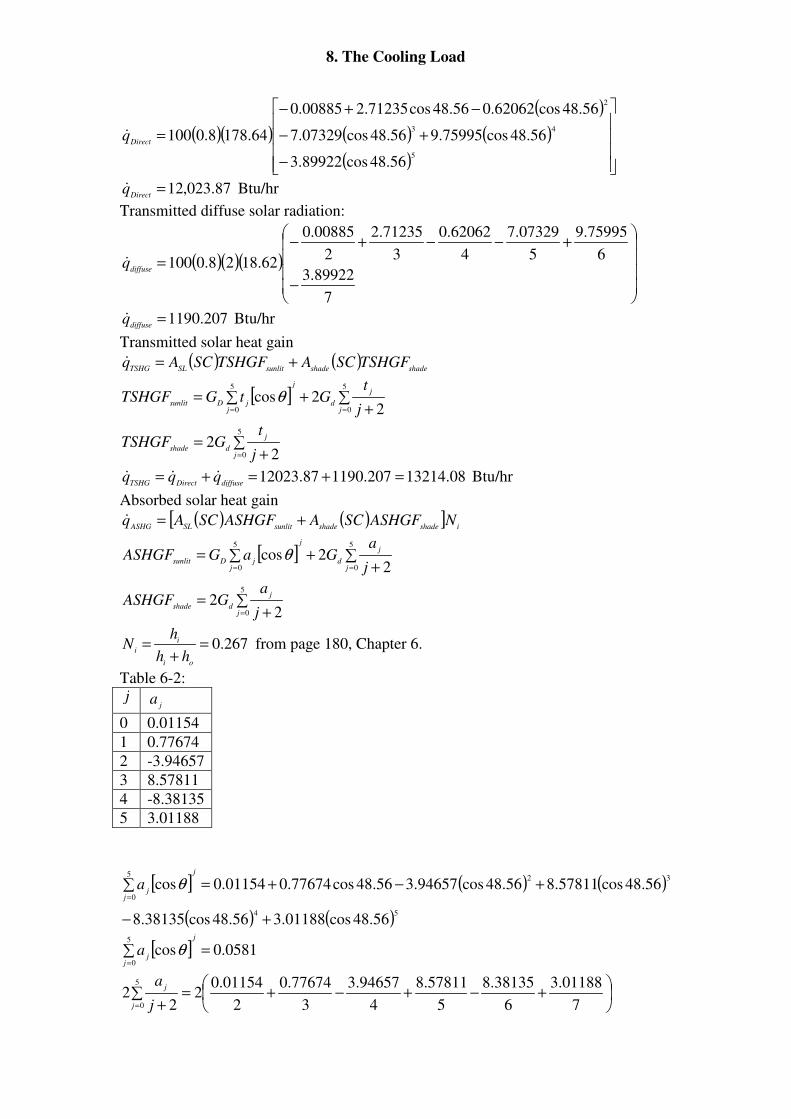
8. The Cooling Load
( )( )
( )
( ) ( )
( )
−
+−
−+−
=5
43
2
56.48cos89922.3
56.48cos75995.956.48cos07329.7
56.48cos62062.056.48cos71235.200885.0
64.1788.0100Direct
q&
87.023,12=Direct
q& Btu/hr
Transmitted diffuse solar radiation:
( )( )( )
−
+−−+−
=
7
89922.3
6
75995.9
5
07329.7
4
62062.0
3
71235.2
2
00885.0
62.1828.0100diffuse
q&
207.1190=diffuse
q& Btu/hr
Transmitted solar heat gain
( ) ( )shadeshadesunlitSLTSHG
TSHGFSCATSHGFSCAq +=&
[ ] ∑+
+∑===
5
0
5
0 22cos
j
j
d
j
jjDsunlit
j
tGtGTSHGF θ
∑+
==
5
0 22
j
j
dshadej
tGTSHGF
08.13214207.119087.12023 =+=+=diffuseDirectTSHG
qqq &&& Btu/hr
Absorbed solar heat gain
( ) ( )[ ]ishadeshadesunlitSLASHG
NASHGFSCAASHGFSCAq +=&
[ ] ∑+
+∑===
5
0
5
0 22cos
j
j
d
j
jjDsunlit
j
aGaGASHGF θ
∑+
==
5
0 22
j
j
dshadej
aGASHGF
267.0=+
=oi
i
ihh
hN from page 180, Chapter 6.
Table 6-2: j
ja
0 0.01154
1 0.77674
2 -3.94657
3 8.57811
4 -8.38135
5 3.01188
[ ] ( ) ( )
( ) ( )54
325
0
56.48cos01188.356.48cos38135.8
56.48cos57811.856.48cos94657.356.48cos77674.001154.0cos
+−
+−+=∑=
j
jj
a θ
[ ] 0581.0cos5
0
=∑=
j
jj
a θ
+−+−+=∑
+= 7
01188.3
6
38135.8
5
57811.8
4
94657.3
3
77674.0
2
01154.02
22
5
0j
j
j
a
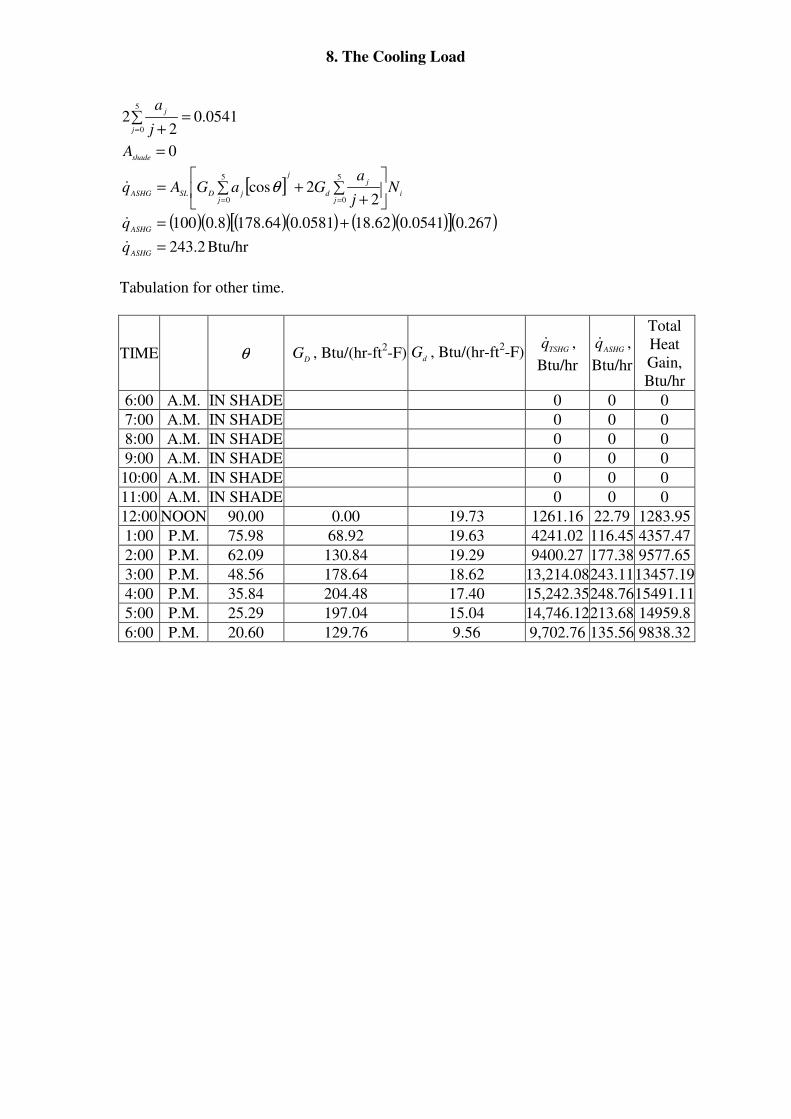
8. The Cooling Load
0541.02
25
0
=∑+=j
j
j
a
0=shade
A
[ ]i
j
j
d
j
jjDSLASHG
Nj
aGaGAq
∑
++∑=
==
5
0
5
0 22cosθ&
( )( ) ( )( ) ( )( )[ ]( )267.00541.062.180581.064.1788.0100 +=ASHG
q&
2.243=ASHG
q& Btu/hr
Tabulation for other time.
TIME θ DG , Btu/(hr-ft
2-F) d
G , Btu/(hr-ft2-F) TSHG
q& ,
Btu/hr
ASHGq& ,
Btu/hr
Total
Heat
Gain,
Btu/hr
6:00 A.M. IN SHADE 0 0 0
7:00 A.M. IN SHADE 0 0 0
8:00 A.M. IN SHADE 0 0 0
9:00 A.M. IN SHADE 0 0 0
10:00 A.M. IN SHADE 0 0 0
11:00 A.M. IN SHADE 0 0 0
12:00 NOON 90.00 0.00 19.73 1261.16 22.79 1283.95
1:00 P.M. 75.98 68.92 19.63 4241.02 116.45 4357.47
2:00 P.M. 62.09 130.84 19.29 9400.27 177.38 9577.65
3:00 P.M. 48.56 178.64 18.62 13,214.08243.11 13457.19
4:00 P.M. 35.84 204.48 17.40 15,242.35248.76 15491.11
5:00 P.M. 25.29 197.04 15.04 14,746.12213.68 14959.8
6:00 P.M. 20.60 129.76 9.56 9,702.76 135.56 9838.32
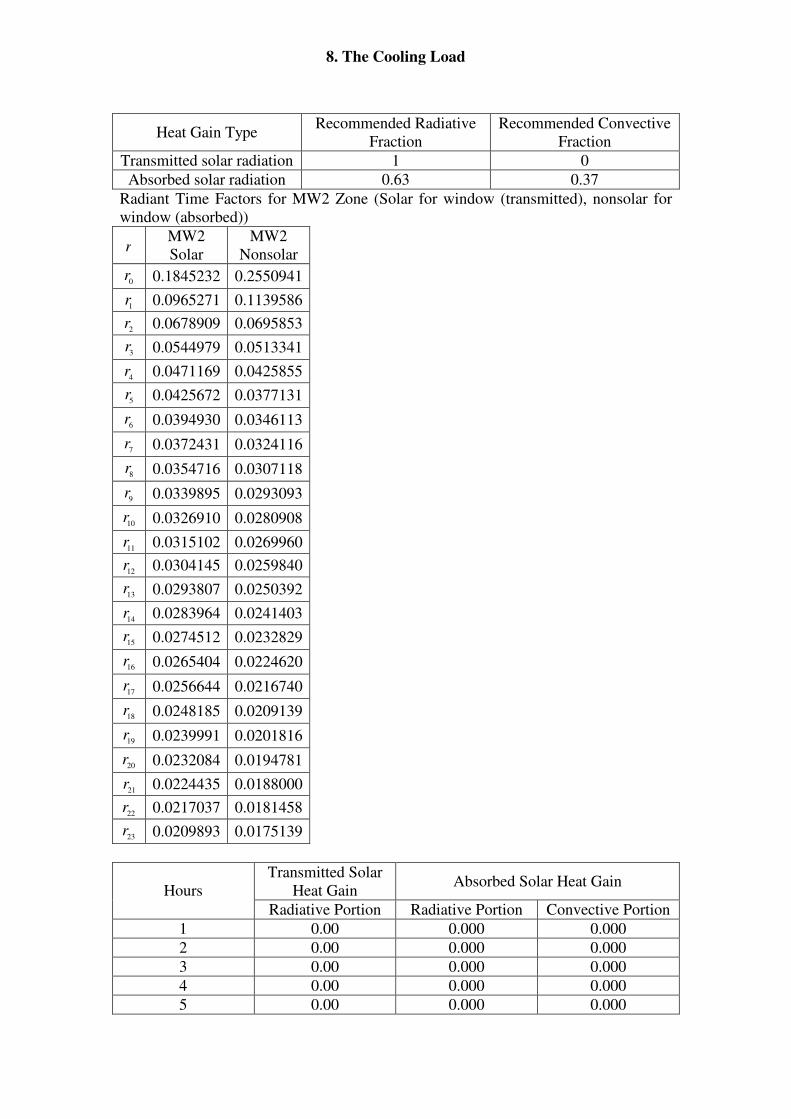
8. The Cooling Load
Heat Gain Type Recommended Radiative
Fraction
Recommended Convective
Fraction
Transmitted solar radiation 1 0
Absorbed solar radiation 0.63 0.37
Radiant Time Factors for MW2 Zone (Solar for window (transmitted), nonsolar for
window (absorbed))
r MW2
Solar
MW2
Nonsolar
0r 0.1845232 0.2550941
1r 0.0965271 0.1139586
2r 0.0678909 0.0695853
3r 0.0544979 0.0513341
4r 0.0471169 0.0425855
5r 0.0425672 0.0377131
6r 0.0394930 0.0346113
7r 0.0372431 0.0324116
8r 0.0354716 0.0307118
9r 0.0339895 0.0293093
10r 0.0326910 0.0280908
11r 0.0315102 0.0269960
12r 0.0304145 0.0259840
13r 0.0293807 0.0250392
14r 0.0283964 0.0241403
15r 0.0274512 0.0232829
16r 0.0265404 0.0224620
17r 0.0256644 0.0216740
18r 0.0248185 0.0209139
19r 0.0239991 0.0201816
20r 0.0232084 0.0194781
21r 0.0224435 0.0188000
22r 0.0217037 0.0181458
23r 0.0209893 0.0175139
Transmitted Solar
Heat Gain Absorbed Solar Heat Gain
Hours
Radiative Portion Radiative Portion Convective Portion
1 0.00 0.000 0.000
2 0.00 0.000 0.000
3 0.00 0.000 0.000
4 0.00 0.000 0.000
5 0.00 0.000 0.000
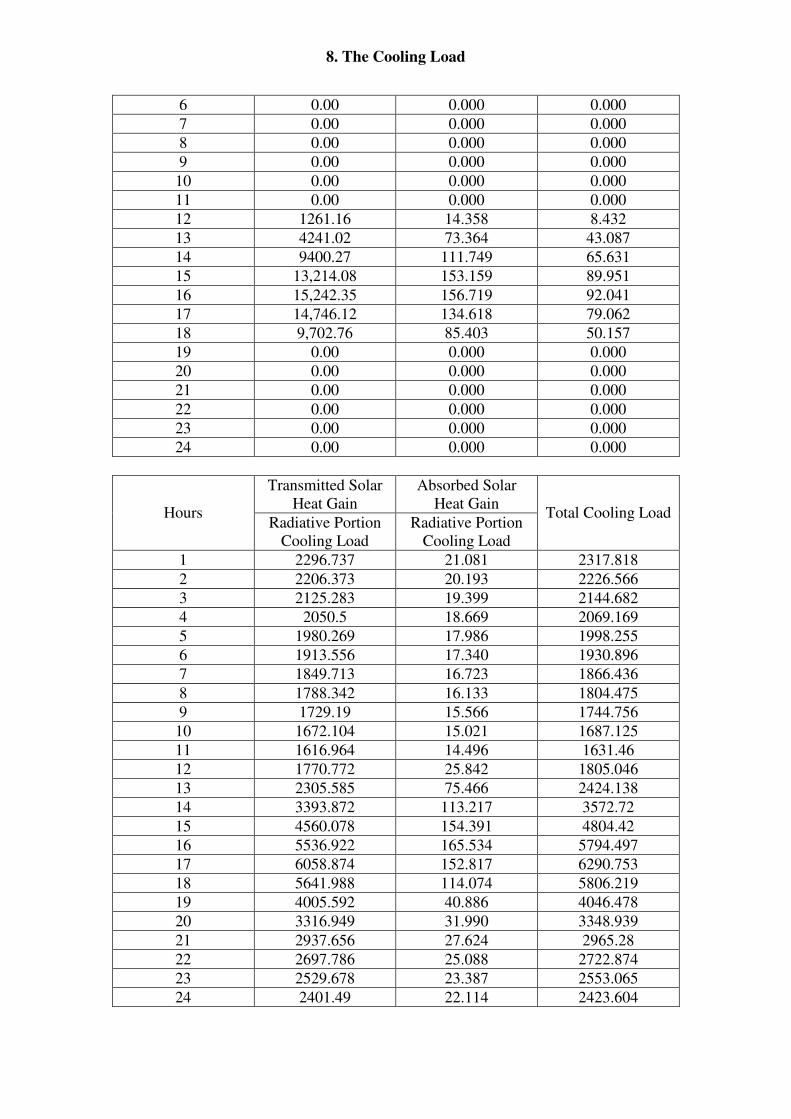
8. The Cooling Load
6 0.00 0.000 0.000
7 0.00 0.000 0.000
8 0.00 0.000 0.000
9 0.00 0.000 0.000
10 0.00 0.000 0.000
11 0.00 0.000 0.000
12 1261.16 14.358 8.432
13 4241.02 73.364 43.087
14 9400.27 111.749 65.631
15 13,214.08 153.159 89.951
16 15,242.35 156.719 92.041
17 14,746.12 134.618 79.062
18 9,702.76 85.403 50.157
19 0.00 0.000 0.000
20 0.00 0.000 0.000
21 0.00 0.000 0.000
22 0.00 0.000 0.000
23 0.00 0.000 0.000
24 0.00 0.000 0.000
Transmitted Solar
Heat Gain
Absorbed Solar
Heat Gain Hours
Radiative Portion
Cooling Load
Radiative Portion
Cooling Load
Total Cooling Load
1 2296.737 21.081 2317.818
2 2206.373 20.193 2226.566
3 2125.283 19.399 2144.682
4 2050.5 18.669 2069.169
5 1980.269 17.986 1998.255
6 1913.556 17.340 1930.896
7 1849.713 16.723 1866.436
8 1788.342 16.133 1804.475
9 1729.19 15.566 1744.756
10 1672.104 15.021 1687.125
11 1616.964 14.496 1631.46
12 1770.772 25.842 1805.046
13 2305.585 75.466 2424.138
14 3393.872 113.217 3572.72
15 4560.078 154.391 4804.42
16 5536.922 165.534 5794.497
17 6058.874 152.817 6290.753
18 5641.988 114.074 5806.219
19 4005.592 40.886 4046.478
20 3316.949 31.990 3348.939
21 2937.656 27.624 2965.28
22 2697.786 25.088 2722.874
23 2529.678 23.387 2553.065
24 2401.49 22.114 2423.604
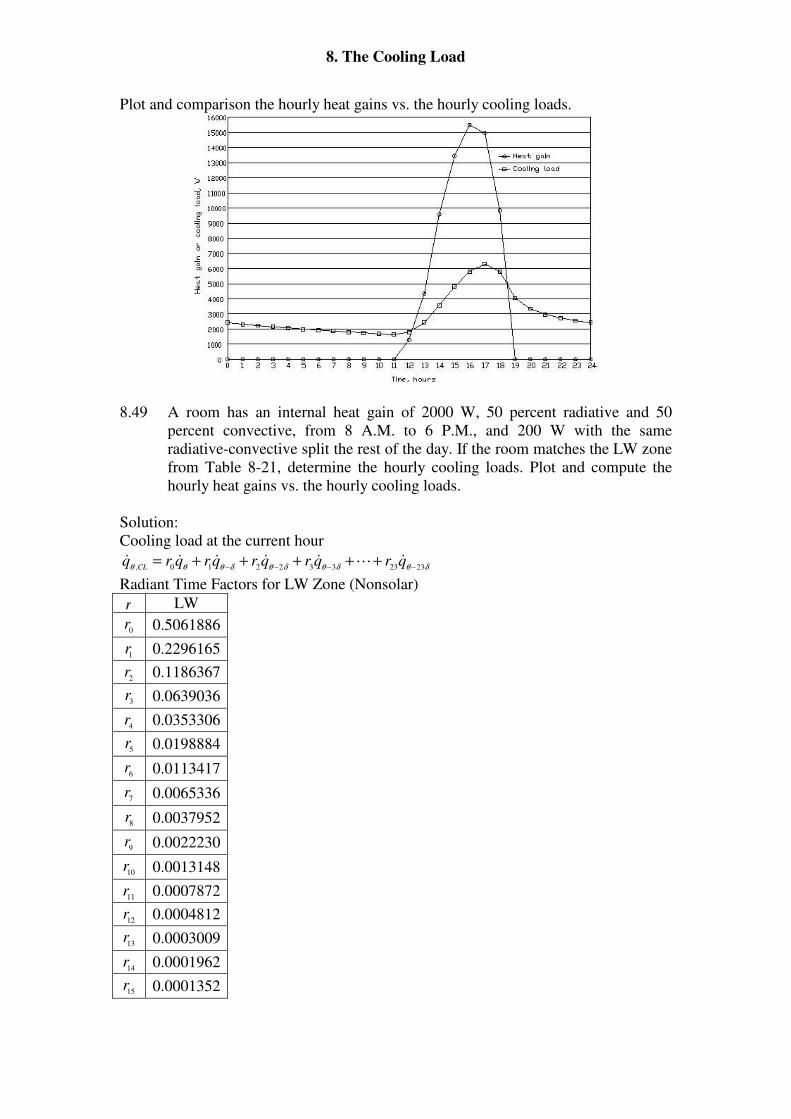
8. The Cooling Load
Plot and comparison the hourly heat gains vs. the hourly cooling loads.
8.49 A room has an internal heat gain of 2000 W, 50 percent radiative and 50
percent convective, from 8 A.M. to 6 P.M., and 200 W with the same
radiative-convective split the rest of the day. If the room matches the LW zone
from Table 8-21, determine the hourly cooling loads. Plot and compute the
hourly heat gains vs. the hourly cooling loads.
Solution:
Cooling load at the current hour
δθδθδθδθθθ 2323332210, −−−−+++++= qrqrqrqrqrq
CL&L&&&&&
Radiant Time Factors for LW Zone (Nonsolar)
r LW
0r 0.5061886
1r 0.2296165
2r 0.1186367
3r 0.0639036
4r 0.0353306
5r 0.0198884
6r 0.0113417
7r 0.0065336
8r 0.0037952
9r 0.0022230
10r 0.0013148
11r 0.0007872
12r 0.0004812
13r 0.0003009
14r 0.0001962
15r 0.0001352
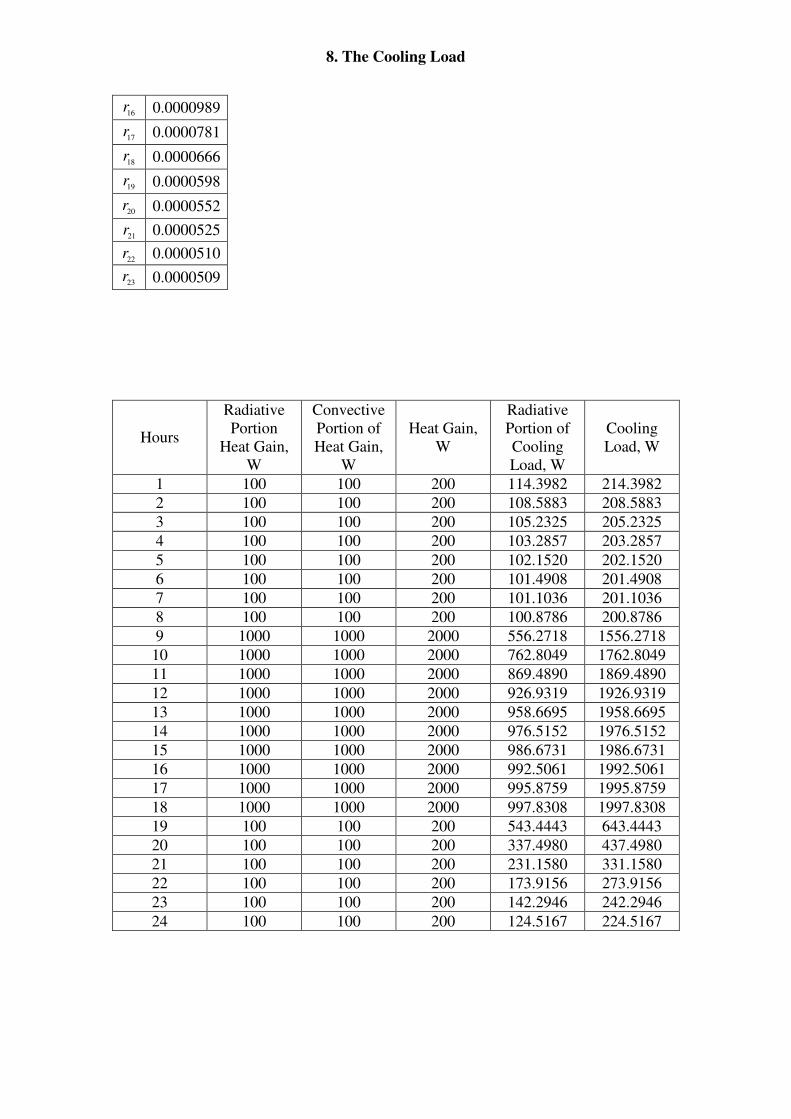
8. The Cooling Load
16r 0.0000989
17r 0.0000781
18r 0.0000666
19r 0.0000598
20r 0.0000552
21r 0.0000525
22r 0.0000510
23r 0.0000509
Hours
Radiative
Portion
Heat Gain,
W
Convective
Portion of
Heat Gain,
W
Heat Gain,
W
Radiative
Portion of
Cooling
Load, W
Cooling
Load, W
1 100 100 200 114.3982 214.3982
2 100 100 200 108.5883 208.5883
3 100 100 200 105.2325 205.2325
4 100 100 200 103.2857 203.2857
5 100 100 200 102.1520 202.1520
6 100 100 200 101.4908 201.4908
7 100 100 200 101.1036 201.1036
8 100 100 200 100.8786 200.8786
9 1000 1000 2000 556.2718 1556.2718
10 1000 1000 2000 762.8049 1762.8049
11 1000 1000 2000 869.4890 1869.4890
12 1000 1000 2000 926.9319 1926.9319
13 1000 1000 2000 958.6695 1958.6695
14 1000 1000 2000 976.5152 1976.5152
15 1000 1000 2000 986.6731 1986.6731
16 1000 1000 2000 992.5061 1992.5061
17 1000 1000 2000 995.8759 1995.8759
18 1000 1000 2000 997.8308 1997.8308
19 100 100 200 543.4443 643.4443
20 100 100 200 337.4980 437.4980
21 100 100 200 231.1580 331.1580
22 100 100 200 173.9156 273.9156
23 100 100 200 142.2946 242.2946
24 100 100 200 124.5167 224.5167
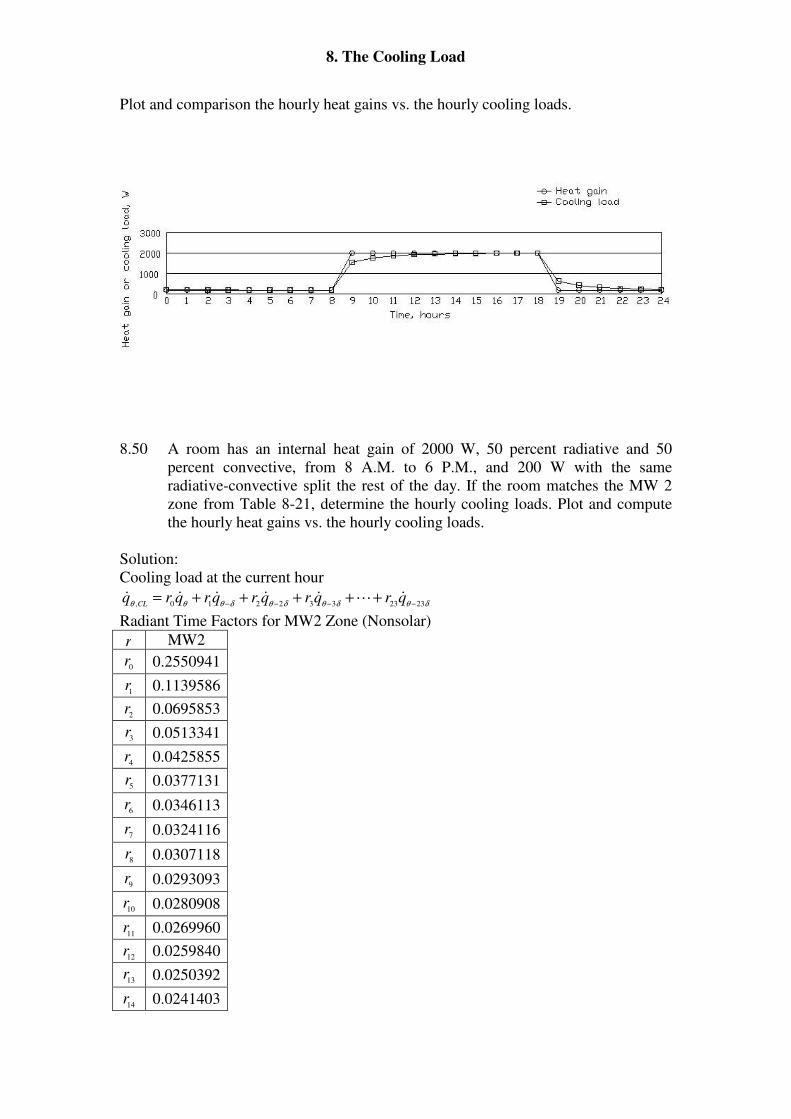
8. The Cooling Load
Plot and comparison the hourly heat gains vs. the hourly cooling loads.
8.50 A room has an internal heat gain of 2000 W, 50 percent radiative and 50
percent convective, from 8 A.M. to 6 P.M., and 200 W with the same
radiative-convective split the rest of the day. If the room matches the MW 2
zone from Table 8-21, determine the hourly cooling loads. Plot and compute
the hourly heat gains vs. the hourly cooling loads.
Solution:
Cooling load at the current hour
δθδθδθδθθθ 2323332210, −−−−+++++= qrqrqrqrqrq
CL&L&&&&&
Radiant Time Factors for MW2 Zone (Nonsolar)
r MW2
0r 0.2550941
1r 0.1139586
2r 0.0695853
3r 0.0513341
4r 0.0425855
5r 0.0377131
6r 0.0346113
7r 0.0324116
8r 0.0307118
9r 0.0293093
10r 0.0280908
11r 0.0269960
12r 0.0259840
13r 0.0250392
14r 0.0241403
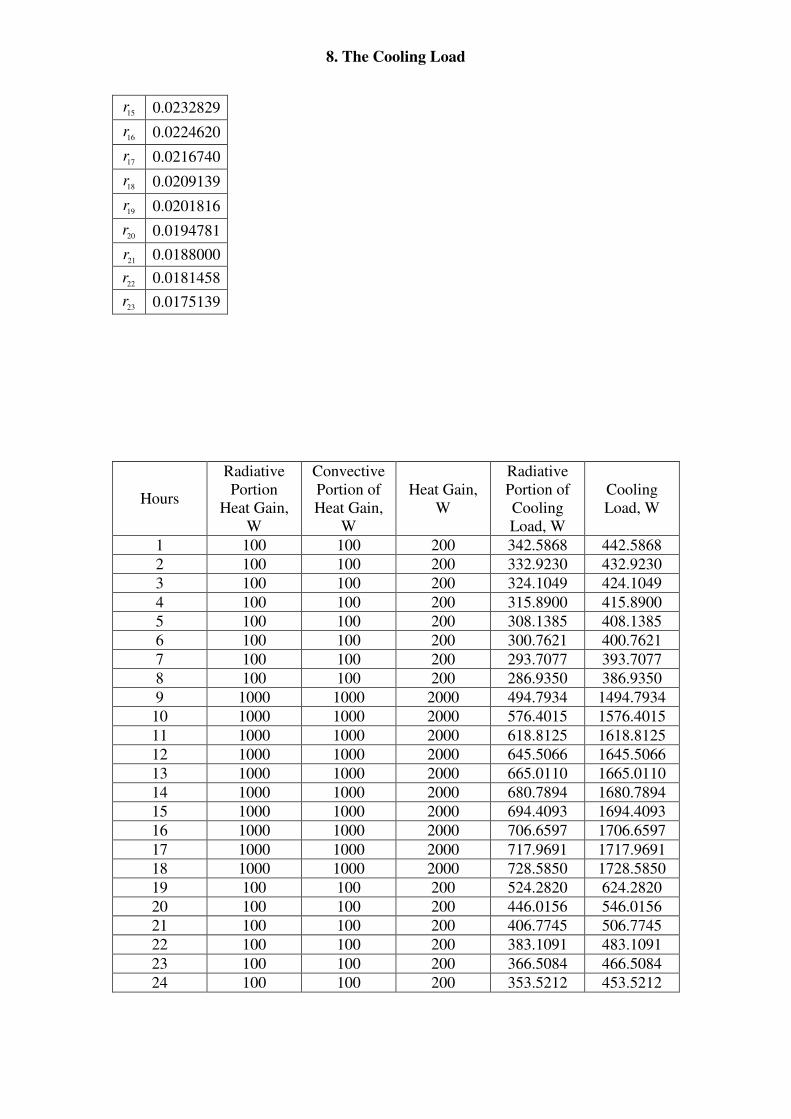
8. The Cooling Load
15r 0.0232829
16r 0.0224620
17r 0.0216740
18r 0.0209139
19r 0.0201816
20r 0.0194781
21r 0.0188000
22r 0.0181458
23r 0.0175139
Hours
Radiative
Portion
Heat Gain,
W
Convective
Portion of
Heat Gain,
W
Heat Gain,
W
Radiative
Portion of
Cooling
Load, W
Cooling
Load, W
1 100 100 200 342.5868 442.5868
2 100 100 200 332.9230 432.9230
3 100 100 200 324.1049 424.1049
4 100 100 200 315.8900 415.8900
5 100 100 200 308.1385 408.1385
6 100 100 200 300.7621 400.7621
7 100 100 200 293.7077 393.7077
8 100 100 200 286.9350 386.9350
9 1000 1000 2000 494.7934 1494.7934
10 1000 1000 2000 576.4015 1576.4015
11 1000 1000 2000 618.8125 1618.8125
12 1000 1000 2000 645.5066 1645.5066
13 1000 1000 2000 665.0110 1665.0110
14 1000 1000 2000 680.7894 1680.7894
15 1000 1000 2000 694.4093 1694.4093
16 1000 1000 2000 706.6597 1706.6597
17 1000 1000 2000 717.9691 1717.9691
18 1000 1000 2000 728.5850 1728.5850
19 100 100 200 524.2820 624.2820
20 100 100 200 446.0156 546.0156
21 100 100 200 406.7745 506.7745
22 100 100 200 383.1091 483.1091
23 100 100 200 366.5084 466.5084
24 100 100 200 353.5212 453.5212
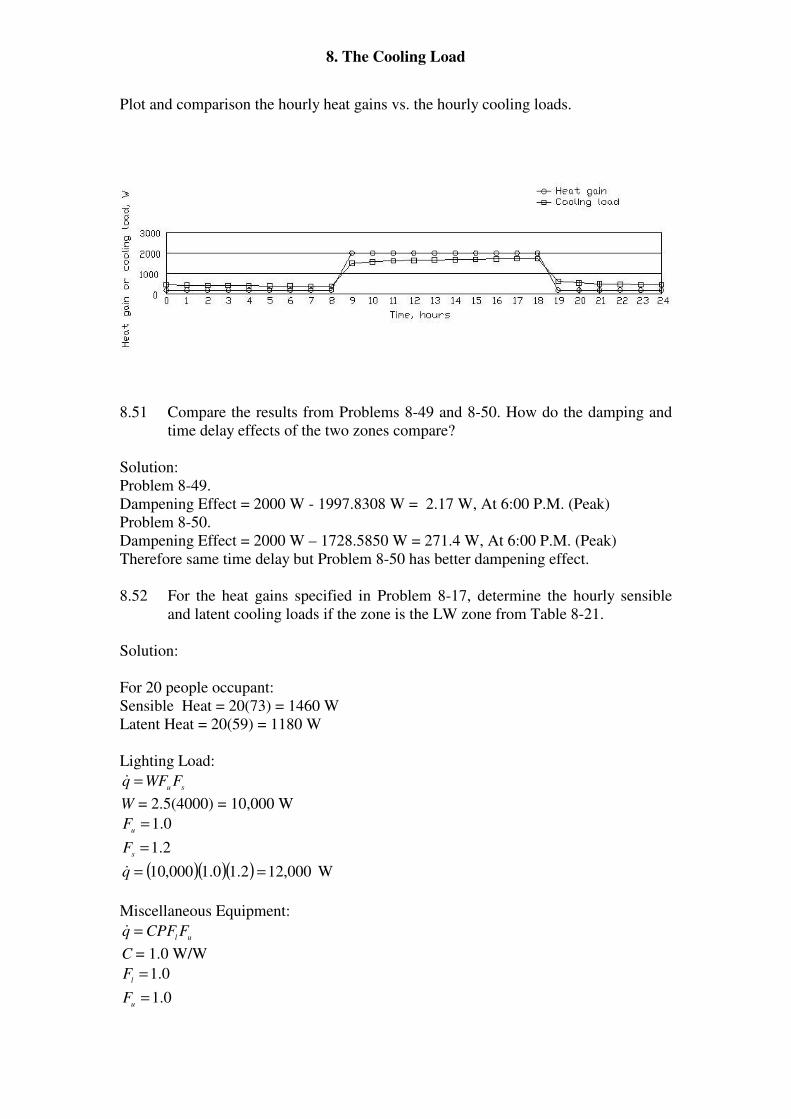
8. The Cooling Load
Plot and comparison the hourly heat gains vs. the hourly cooling loads.
8.51 Compare the results from Problems 8-49 and 8-50. How do the damping and
time delay effects of the two zones compare?
Solution:
Problem 8-49.
Dampening Effect = 2000 W - 1997.8308 W = 2.17 W, At 6:00 P.M. (Peak)
Problem 8-50.
Dampening Effect = 2000 W – 1728.5850 W = 271.4 W, At 6:00 P.M. (Peak)
Therefore same time delay but Problem 8-50 has better dampening effect.
8.52 For the heat gains specified in Problem 8-17, determine the hourly sensible
and latent cooling loads if the zone is the LW zone from Table 8-21.
Solution:
For 20 people occupant:
Sensible Heat = 20(73) = 1460 W
Latent Heat = 20(59) = 1180 W
Lighting Load:
suFWFq =&
W = 2.5(4000) = 10,000 W
0.1=u
F
2.1=s
F
( )( )( ) 000,122.10.1000,10 ==q& W
Miscellaneous Equipment:
ulFCPFq =&
C = 1.0 W/W
0.1=l
F
0.1=u
F

8. The Cooling Load
)4000)(0.1(=P = 4000 W
( )( )( )( )0.10.140000.1=q& = 4000 W
Tabulation: (Sensible and latent heat gain)
Sensible Heat Gain, W Latent Heat Gain, W
Occupants 1460 1180
Lighting 12,000 0
Equipment 4,000 0
Total 17,460 1180
Tabulation: (Radiative and convective portions of sensible heat gain) Ref. to Table 8-
20.
Radiative Convective
Percentage Watts Percentage Watts
Occupants 70 1022 30 438
Lighting 59 7080 41 4920
Equipment 70 2800 30 1200
Total 10,902 6,558
Cooling load at the current hour
δθδθδθδθθθ 2323332210, −−−−+++++= qrqrqrqrqrq
CL&L&&&&&
Radiant Time Factors for LW Zone (Nonsolar)
r LW
0r 0.5061886
1r 0.2296165
2r 0.1186367
3r 0.0639036
4r 0.0353306
5r 0.0198884
6r 0.0113417
7r 0.0065336
8r 0.0037952
9r 0.0022230
10r 0.0013148
11r 0.0007872
12r 0.0004812
13r 0.0003009
14r 0.0001962
15r 0.0001352
16r 0.0000989
17r 0.0000781
18r 0.0000666
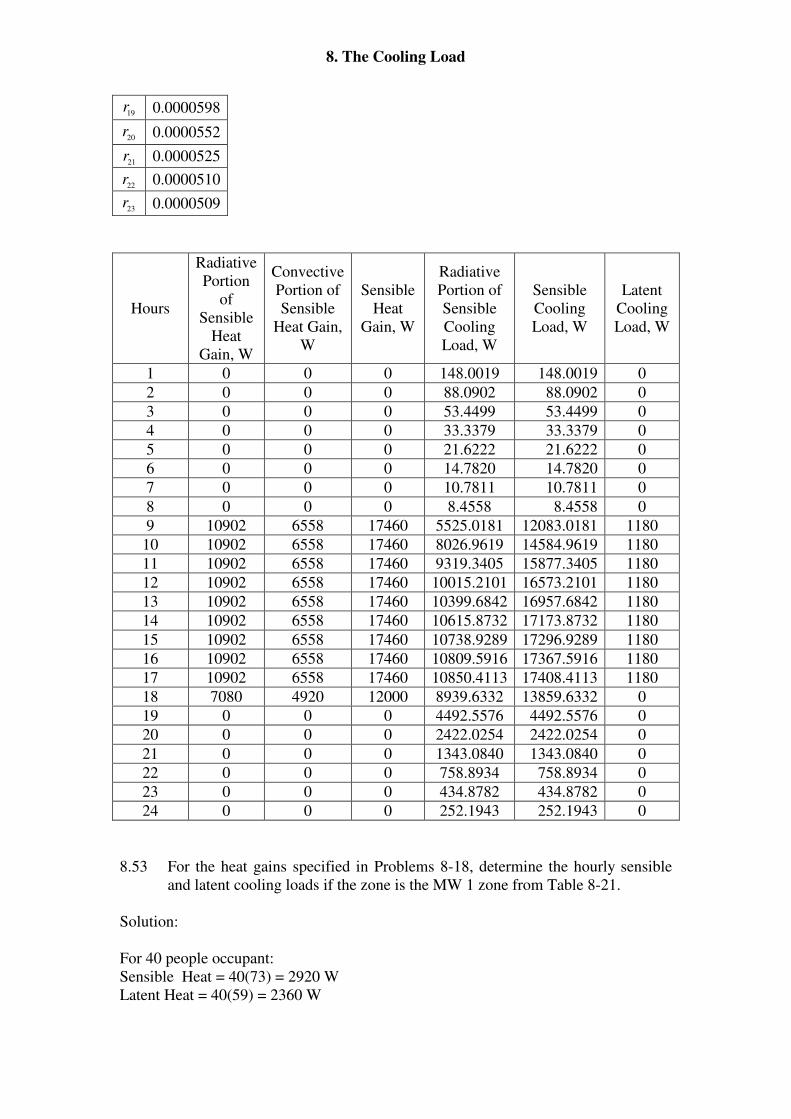
8. The Cooling Load
19r 0.0000598
20r 0.0000552
21r 0.0000525
22r 0.0000510
23r 0.0000509
Hours
Radiative
Portion
of
Sensible
Heat
Gain, W
Convective
Portion of
Sensible
Heat Gain,
W
Sensible
Heat
Gain, W
Radiative
Portion of
Sensible
Cooling
Load, W
Sensible
Cooling
Load, W
Latent
Cooling
Load, W
1 0 0 0 148.0019 148.0019 0
2 0 0 0 88.0902 88.0902 0
3 0 0 0 53.4499 53.4499 0
4 0 0 0 33.3379 33.3379 0
5 0 0 0 21.6222 21.6222 0
6 0 0 0 14.7820 14.7820 0
7 0 0 0 10.7811 10.7811 0
8 0 0 0 8.4558 8.4558 0
9 10902 6558 17460 5525.0181 12083.0181 1180
10 10902 6558 17460 8026.9619 14584.9619 1180
11 10902 6558 17460 9319.3405 15877.3405 1180
12 10902 6558 17460 10015.2101 16573.2101 1180
13 10902 6558 17460 10399.6842 16957.6842 1180
14 10902 6558 17460 10615.8732 17173.8732 1180
15 10902 6558 17460 10738.9289 17296.9289 1180
16 10902 6558 17460 10809.5916 17367.5916 1180
17 10902 6558 17460 10850.4113 17408.4113 1180
18 7080 4920 12000 8939.6332 13859.6332 0
19 0 0 0 4492.5576 4492.5576 0
20 0 0 0 2422.0254 2422.0254 0
21 0 0 0 1343.0840 1343.0840 0
22 0 0 0 758.8934 758.8934 0
23 0 0 0 434.8782 434.8782 0
24 0 0 0 252.1943 252.1943 0
8.53 For the heat gains specified in Problems 8-18, determine the hourly sensible
and latent cooling loads if the zone is the MW 1 zone from Table 8-21.
Solution:
For 40 people occupant:
Sensible Heat = 40(73) = 2920 W
Latent Heat = 40(59) = 2360 W
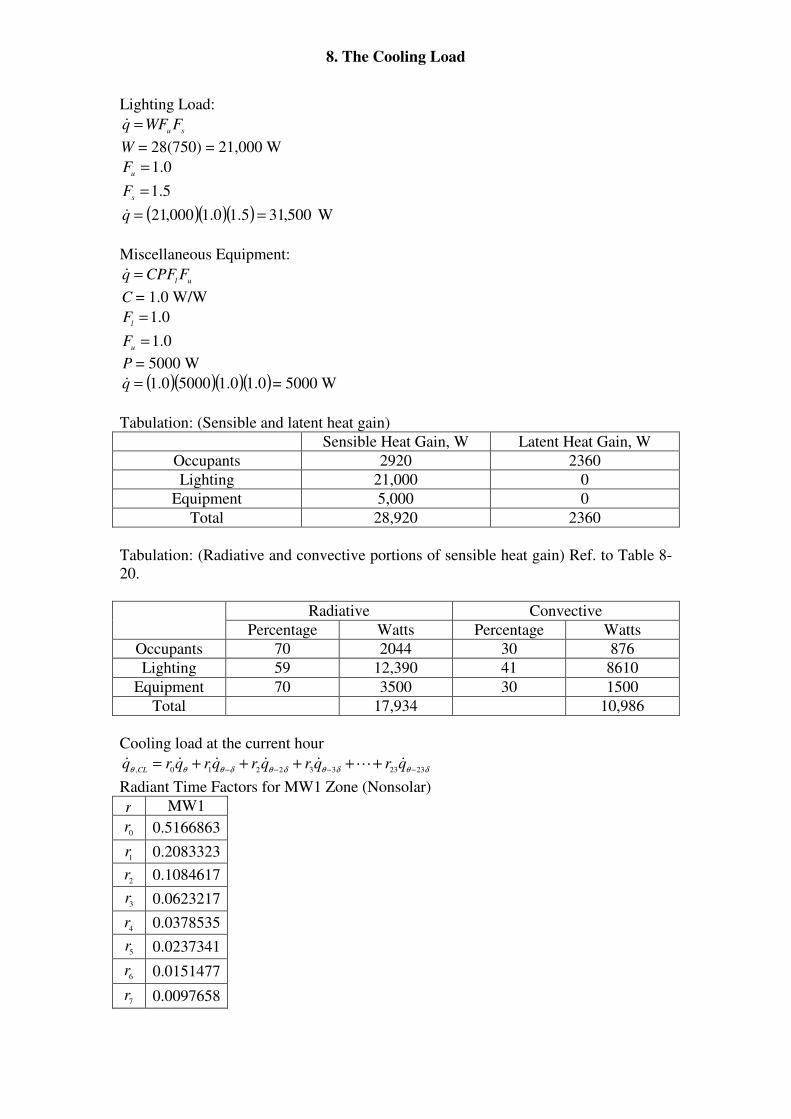
8. The Cooling Load
Lighting Load:
suFWFq =&
W = 28(750) = 21,000 W
0.1=u
F
5.1=s
F
( )( )( ) 500,315.10.1000,21 ==q& W
Miscellaneous Equipment:
ulFCPFq =&
C = 1.0 W/W
0.1=l
F
0.1=u
F
P = 5000 W
( )( )( )( )0.10.150000.1=q& = 5000 W
Tabulation: (Sensible and latent heat gain)
Sensible Heat Gain, W Latent Heat Gain, W
Occupants 2920 2360
Lighting 21,000 0
Equipment 5,000 0
Total 28,920 2360
Tabulation: (Radiative and convective portions of sensible heat gain) Ref. to Table 8-
20.
Radiative Convective
Percentage Watts Percentage Watts
Occupants 70 2044 30 876
Lighting 59 12,390 41 8610
Equipment 70 3500 30 1500
Total 17,934 10,986
Cooling load at the current hour
δθδθδθδθθθ 2323332210, −−−−+++++= qrqrqrqrqrq
CL&L&&&&&
Radiant Time Factors for MW1 Zone (Nonsolar)
r MW1
0r 0.5166863
1r 0.2083323
2r 0.1084617
3r 0.0623217
4r 0.0378535
5r 0.0237341
6r 0.0151477
7r 0.0097658
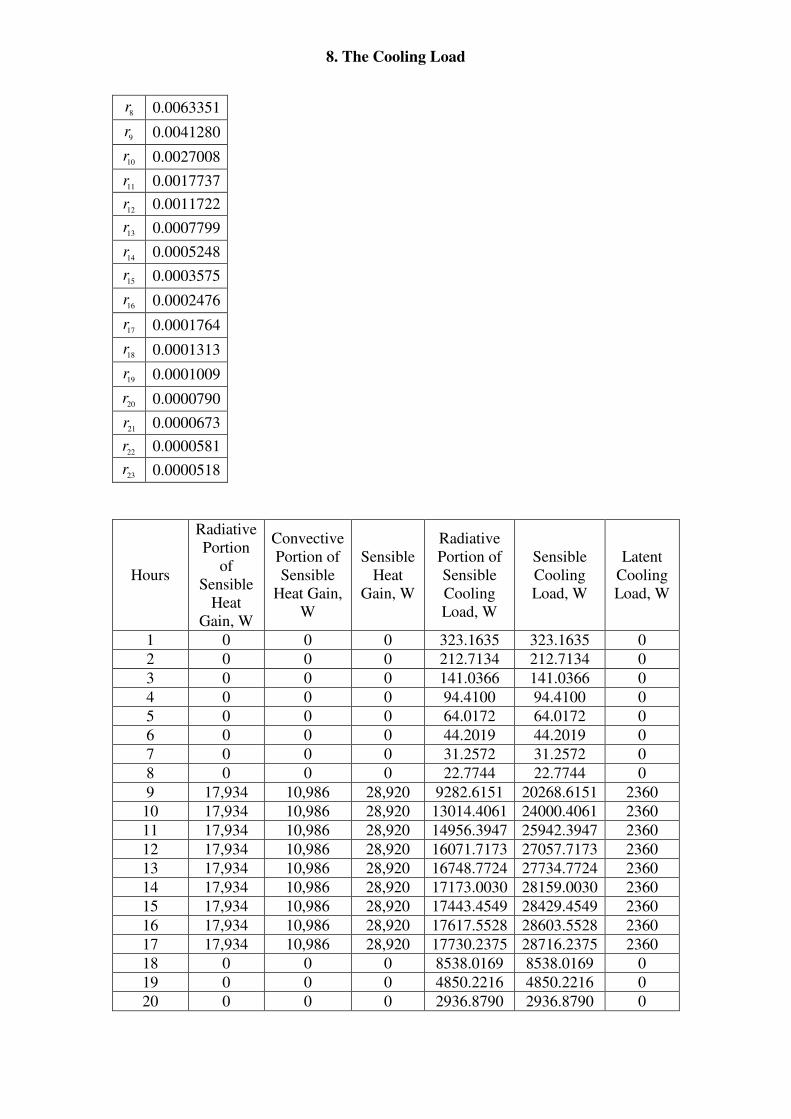
8. The Cooling Load
8r 0.0063351
9r 0.0041280
10r 0.0027008
11r 0.0017737
12r 0.0011722
13r 0.0007799
14r 0.0005248
15r 0.0003575
16r 0.0002476
17r 0.0001764
18r 0.0001313
19r 0.0001009
20r 0.0000790
21r 0.0000673
22r 0.0000581
23r 0.0000518
Hours
Radiative
Portion
of
Sensible
Heat
Gain, W
Convective
Portion of
Sensible
Heat Gain,
W
Sensible
Heat
Gain, W
Radiative
Portion of
Sensible
Cooling
Load, W
Sensible
Cooling
Load, W
Latent
Cooling
Load, W
1 0 0 0 323.1635 323.1635 0
2 0 0 0 212.7134 212.7134 0
3 0 0 0 141.0366 141.0366 0
4 0 0 0 94.4100 94.4100 0
5 0 0 0 64.0172 64.0172 0
6 0 0 0 44.2019 44.2019 0
7 0 0 0 31.2572 31.2572 0
8 0 0 0 22.7744 22.7744 0
9 17,934 10,986 28,920 9282.6151 20268.6151 2360
10 17,934 10,986 28,920 13014.4061 24000.4061 2360
11 17,934 10,986 28,920 14956.3947 25942.3947 2360
12 17,934 10,986 28,920 16071.7173 27057.7173 2360
13 17,934 10,986 28,920 16748.7724 27734.7724 2360
14 17,934 10,986 28,920 17173.0030 28159.0030 2360
15 17,934 10,986 28,920 17443.4549 28429.4549 2360
16 17,934 10,986 28,920 17617.5528 28603.5528 2360
17 17,934 10,986 28,920 17730.2375 28716.2375 2360
18 0 0 0 8538.0169 8538.0169 0
19 0 0 0 4850.2216 4850.2216 0
20 0 0 0 2936.8790 2936.8790 0
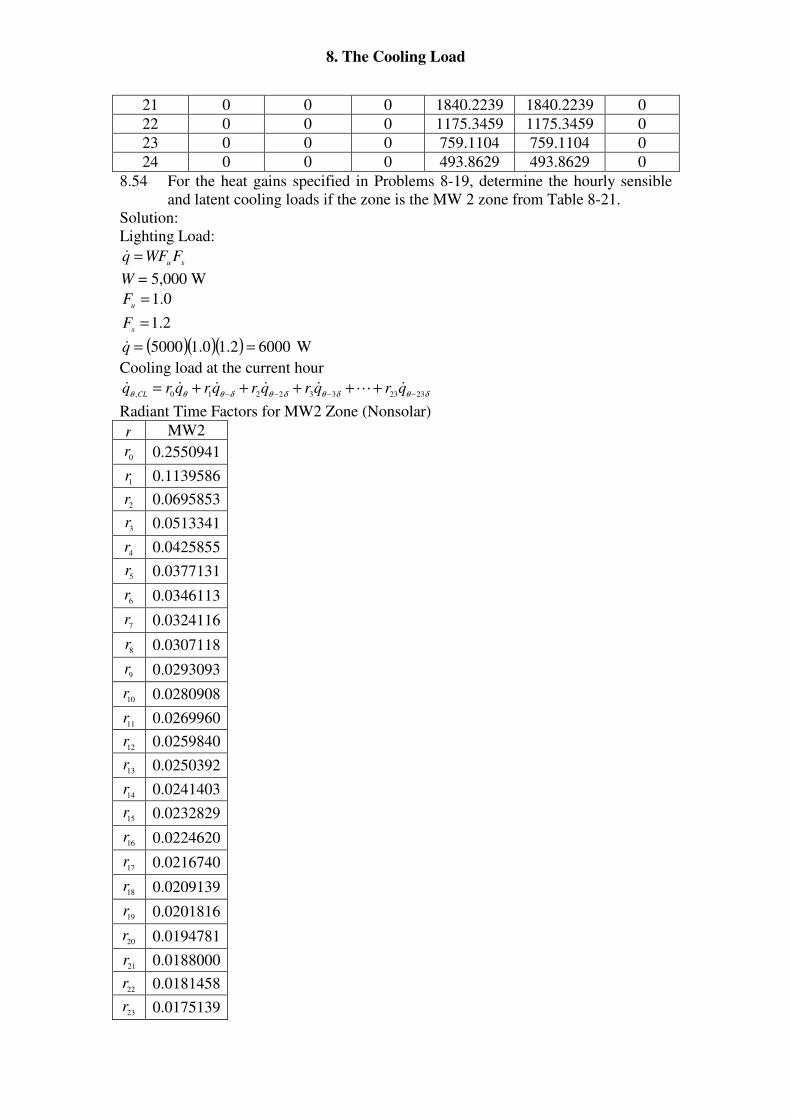
8. The Cooling Load
21 0 0 0 1840.2239 1840.2239 0
22 0 0 0 1175.3459 1175.3459 0
23 0 0 0 759.1104 759.1104 0
24 0 0 0 493.8629 493.8629 0
8.54 For the heat gains specified in Problems 8-19, determine the hourly sensible
and latent cooling loads if the zone is the MW 2 zone from Table 8-21.
Solution:
Lighting Load:
suFWFq =&
W = 5,000 W
0.1=u
F
2.1=s
F
( )( )( ) 60002.10.15000 ==q& W
Cooling load at the current hour
δθδθδθδθθθ 2323332210, −−−−+++++= qrqrqrqrqrq
CL&L&&&&&
Radiant Time Factors for MW2 Zone (Nonsolar)
r MW2
0r 0.2550941
1r 0.1139586
2r 0.0695853
3r 0.0513341
4r 0.0425855
5r 0.0377131
6r 0.0346113
7r 0.0324116
8r 0.0307118
9r 0.0293093
10r 0.0280908
11r 0.0269960
12r 0.0259840
13r 0.0250392
14r 0.0241403
15r 0.0232829
16r 0.0224620
17r 0.0216740
18r 0.0209139
19r 0.0201816
20r 0.0194781
21r 0.0188000
22r 0.0181458
23r 0.0175139
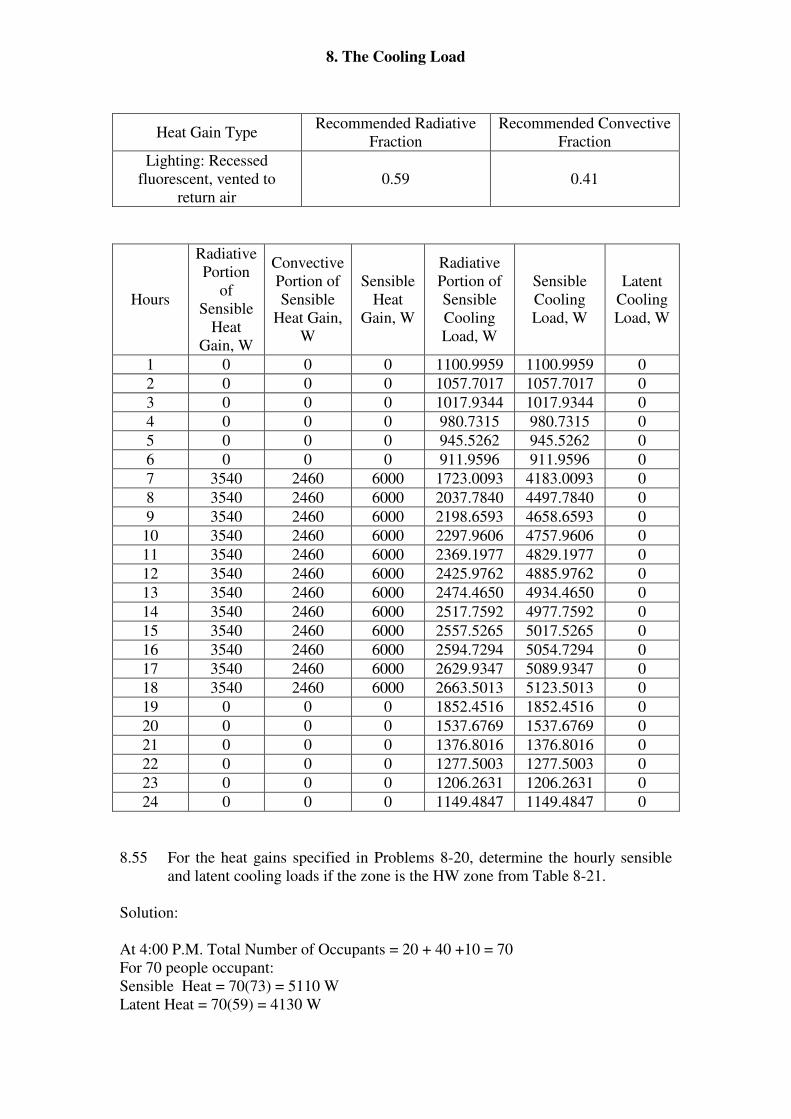
8. The Cooling Load
Heat Gain Type Recommended Radiative
Fraction
Recommended Convective
Fraction
Lighting: Recessed
fluorescent, vented to
return air
0.59 0.41
Hours
Radiative
Portion
of
Sensible
Heat
Gain, W
Convective
Portion of
Sensible
Heat Gain,
W
Sensible
Heat
Gain, W
Radiative
Portion of
Sensible
Cooling
Load, W
Sensible
Cooling
Load, W
Latent
Cooling
Load, W
1 0 0 0 1100.9959 1100.9959 0
2 0 0 0 1057.7017 1057.7017 0
3 0 0 0 1017.9344 1017.9344 0
4 0 0 0 980.7315 980.7315 0
5 0 0 0 945.5262 945.5262 0
6 0 0 0 911.9596 911.9596 0
7 3540 2460 6000 1723.0093 4183.0093 0
8 3540 2460 6000 2037.7840 4497.7840 0
9 3540 2460 6000 2198.6593 4658.6593 0
10 3540 2460 6000 2297.9606 4757.9606 0
11 3540 2460 6000 2369.1977 4829.1977 0
12 3540 2460 6000 2425.9762 4885.9762 0
13 3540 2460 6000 2474.4650 4934.4650 0
14 3540 2460 6000 2517.7592 4977.7592 0
15 3540 2460 6000 2557.5265 5017.5265 0
16 3540 2460 6000 2594.7294 5054.7294 0
17 3540 2460 6000 2629.9347 5089.9347 0
18 3540 2460 6000 2663.5013 5123.5013 0
19 0 0 0 1852.4516 1852.4516 0
20 0 0 0 1537.6769 1537.6769 0
21 0 0 0 1376.8016 1376.8016 0
22 0 0 0 1277.5003 1277.5003 0
23 0 0 0 1206.2631 1206.2631 0
24 0 0 0 1149.4847 1149.4847 0
8.55 For the heat gains specified in Problems 8-20, determine the hourly sensible
and latent cooling loads if the zone is the HW zone from Table 8-21.
Solution:
At 4:00 P.M. Total Number of Occupants = 20 + 40 +10 = 70
For 70 people occupant:
Sensible Heat = 70(73) = 5110 W
Latent Heat = 70(59) = 4130 W

8. The Cooling Load
At 6:00 P.M. Total Number of Occupants = 0
Sensible Heat = 0 W
Latent Heat = 0 W
Radiative Convective
Percentage Watts/occupant Percentage Watts/occupant
Occupants 70 51.1 30 21.9
Cooling load at the current hour
δθδθδθδθθθ 2323332210, −−−−+++++= qrqrqrqrqrq
CL&L&&&&&
Cooling load at the current hour
δθδθδθδθθθ 2323332210, −−−−+++++= qrqrqrqrqrq
CL&L&&&&&
Radiant Time Factors for HW Zone (Nonsolar for roof)
r HW
0r 0.2241915
1r 0.0768588
2r 0.057783
3r 0.0501948
4r 0.0456539
5r 0.0424286
6r 0.0398994
7r 0.0377894
8r 0.03596
9r 0.0343321
10r 0.0328598
11r 0.0315095
12r 0.0302635
13r 0.0291043
14r 0.0280197
15r 0.0270197
16r 0.0260402
17r 0.0251315
18r 0.0242692
19r 0.0234499
20r 0.0226689
21r 0.0219226
22r 0.0212093
23r 0.0205246
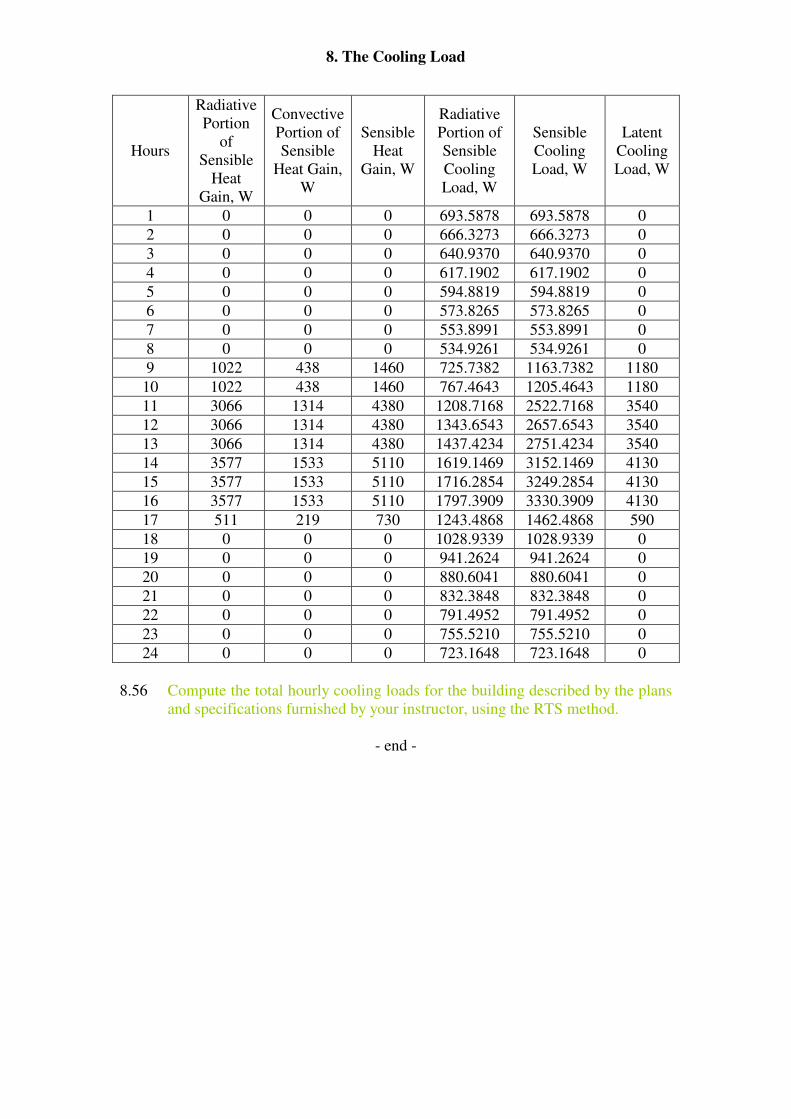
8. The Cooling Load
Hours
Radiative
Portion
of
Sensible
Heat
Gain, W
Convective
Portion of
Sensible
Heat Gain,
W
Sensible
Heat
Gain, W
Radiative
Portion of
Sensible
Cooling
Load, W
Sensible
Cooling
Load, W
Latent
Cooling
Load, W
1 0 0 0 693.5878 693.5878 0
2 0 0 0 666.3273 666.3273 0
3 0 0 0 640.9370 640.9370 0
4 0 0 0 617.1902 617.1902 0
5 0 0 0 594.8819 594.8819 0
6 0 0 0 573.8265 573.8265 0
7 0 0 0 553.8991 553.8991 0
8 0 0 0 534.9261 534.9261 0
9 1022 438 1460 725.7382 1163.7382 1180
10 1022 438 1460 767.4643 1205.4643 1180
11 3066 1314 4380 1208.7168 2522.7168 3540
12 3066 1314 4380 1343.6543 2657.6543 3540
13 3066 1314 4380 1437.4234 2751.4234 3540
14 3577 1533 5110 1619.1469 3152.1469 4130
15 3577 1533 5110 1716.2854 3249.2854 4130
16 3577 1533 5110 1797.3909 3330.3909 4130
17 511 219 730 1243.4868 1462.4868 590
18 0 0 0 1028.9339 1028.9339 0
19 0 0 0 941.2624 941.2624 0
20 0 0 0 880.6041 880.6041 0
21 0 0 0 832.3848 832.3848 0
22 0 0 0 791.4952 791.4952 0
23 0 0 0 755.5210 755.5210 0
24 0 0 0 723.1648 723.1648 0
8.56 Compute the total hourly cooling loads for the building described by the plans
and specifications furnished by your instructor, using the RTS method.
- end -
Related Documents