Copyright © 2009 by The McGraw-Hill Companies, Inc. All rights reserved. McGraw-Hill/Irwin Financial Statement Analysis K R Subramanyam John J Wild

Welcome message from author
This document is posted to help you gain knowledge. Please leave a comment to let me know what you think about it! Share it to your friends and learn new things together.
Transcript

Copyright © 2009 by The McGraw-Hill Companies, Inc. All rights reserved.McGraw-Hill/Irwin
Financial Statement
Analysis
K R SubramanyamJohn J Wild

8-2
8CHAPTER
Return on Invested Capital and Profitability Analysis

8-3
Return on Invested Capital
• Joint analysis is where one measure is assessed relative to another – Explain???Financial statement analysis involves
assesing risk and return.• Return on invested capital (ROIC) or
Return on Investment (ROI) is an important joint analysis -
Importance of Joint Analysis

8-4
Return on Invested CapitalROI Relation
• ROI relates income, or other performance measure, to a company’s level and source of financing
• ROI allows comparisons with alternative investment opportunities
• Riskier investments expected to yield a higher ROI
• ROI impacts a company’s ability to succeed, attract financing, repay creditors,and reward owners

8-5
Return on Invested Capital - ROIC
• It refers to the relation between income and invested capital.
• It measure the company success in using finance to generate profit.
• Company performance can be measured by its revenue, net income and assets growth.

8-6
Return on Invested CapitalApplication / Importance of ROI
(2) measuring profitability
(3) Measure for planning and
control
(1)measuring managerial
effectiveness
(2)measuring Profitability
(3)measure for planning and
control
ROI is applicable to:

8-7
Return on Invested CapitalMeasuring Managerial Effectiveness
• Management is responsible for all company activities
• It makes financing, investing and operating decisions• ROI is a measure of managerial effectiveness in business activities• ROI depends on the skill, resourcefulness,
ingenuity, and motivation of management

8-8
Return on Invested CapitalMeasuring Profitability
• ROI is an indicator of company profitability and company`s long term
financing strength.
• ROI relates key summary measures: profits with financing
• ROI conveys return on invested capital from different financing perspectives
(Creditors and shareholders).

8-9
Return on Invested CapitalMeasuring for Planning and Control
ROI assists managers with:
• Planning• Budgeting• Coordinating activities• Evaluating opportunities• Control

8-10
Components of ROI• Return on invested capital is defined as:
Income
Invested Capital
8-11
Components of ROIInvested Capital Defined
• No universal measureof invested capital
• Different measures of invested capital reflect user’s different perspectives

8-12
Components of ROIAlternative Measures of Invested Capital
Common Measures:
• Net Operating Assets (operating and non-operating components)
• Stockholders’ Equity

8-13
Components of ROI• Perspective is that of the company
as a whole • Called return on net operating
assets (RNOA)
RNOA: measures operating efficiency/
performance reflects return on net operating
assets (excluding financial assets/liabilities)
Net Operating Assets
net operating Profit after Taxaverage Operating Assets

8-14
Components of ROICommon Equity Capital
• Perspective is that of common equity holders
• Captures the effect of leverage (debt) capital on equity holder return
• Excludes all debt financing and preferred equity
net income less preferred dividendsaverage common equity

8-15
Components of ROIComputing Invested Capital
•Usually computed using average capital available for the period•Typically add beginning and ending invested capital
amounts and divide by 2• More accurate computation is to average interim amounts — quarterly divided by 4 or
monthly divided by 12.
8-16
Components of ROIAdjustments to Invested Capital and Income Numbers
Many accounting numbers require analytical adjustment—see prior chapters
Some numbers not reported in financial statements need to be included
Such adjustments are necessary for effective analysis of return on invested capital

8-17
Components of ROIReturn on Net Operating Assets -- RNOA
NOPAT(Beginning NOA + Ending NOA) / 2
Where
• NOPAT = Operating income x (1- tax rate)
• NOA = net operating assets

8-18
Components of ROI
BALANCE SHEETOperating assets ..................... OALess operating liabilities ........ (OL)
Net operating assets.............. NOA
Financial liabilities .................. FLLess financial assets ............. (FA)Net financial obligations......... NFOStockholders’ equity................ SE
Net financing ................ NFO + SE
Operating and nonoperating activities - Distinction
NFO = Non-operating Liab. – non-operating assetsNOA = NFO + stockholders equity

8-19
Components of ROIReturn on Common Equity -- ROCE
Net income - Preferred dividends(Beginning equity + Ending equity) / 2
Where
• Equity is stockholder’s equity less preferred stock

8-20
Analyzing Return on Net Operating Assets-RNOA
Disaggregating RNOA
Return on operating assets = Operating Profit margin x Operating Asset turnover
NOA Avg.Sales
SalesNOPAT
NOA Avg.NOPAT
Operating Profit margin: measures operating profitability relative to sales
Operating Asset turnover (utilization): measures effectiveness in generating sales from operating assets

8-21Analyzing Return on Assets-ROA

8-22
Effect of Operating Leverage on RNOA
OA = operating assetsOLLEV = operating liabilities leverage ratio (Average operating liabilities / Average NOA)
8-23
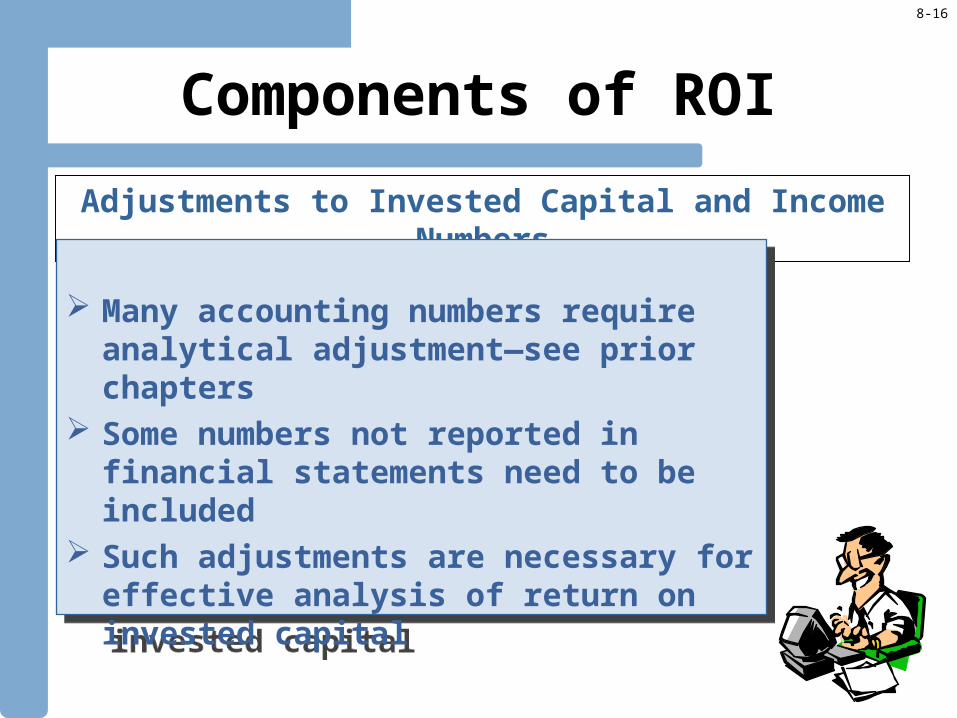
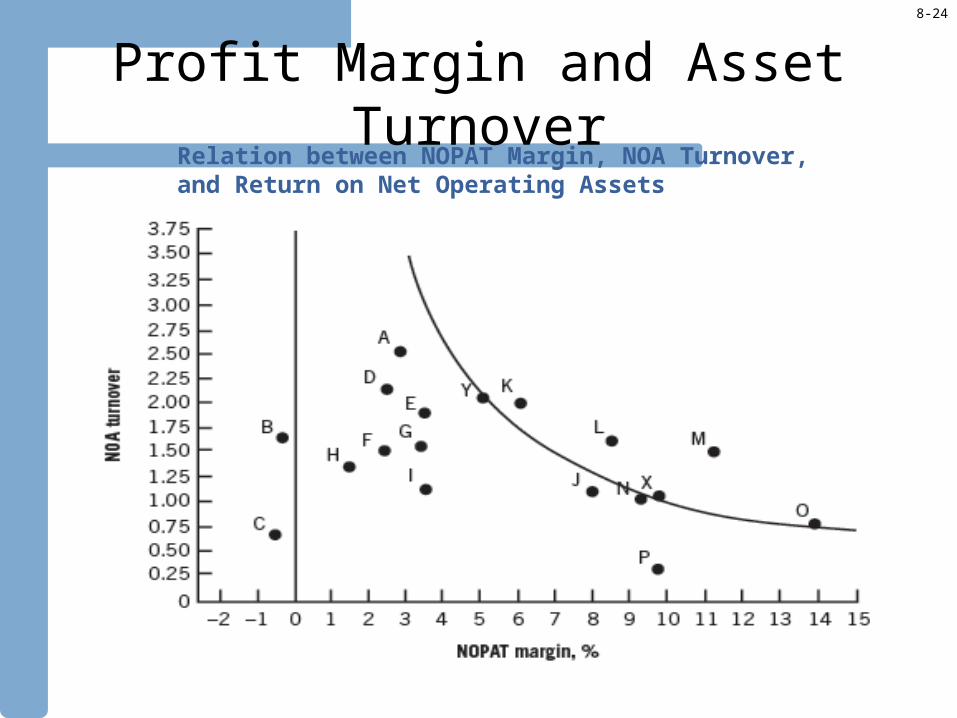
Profit Margin and Asset Turnover• Profit margin and asset turnover are
interdependent– Profit margin is a function of sales and operating
expenses• (selling price x units sold)
– Turnover is also a function of sales • (sales/assets)
$5,000,000 $10,000,000 $10,000,000$500,000 $500,000 $100,000
$5,000,000 $5,000,000 $1,000,00010% 5% 1%
1 2 1010% 10% 10%
NOPATSalesAnalysis of Return on Net Operating Assets
Return on net operating assetsNOA turnoverNOPAT marginNOA
8-24
Profit Margin and Asset TurnoverRelation between NOPAT Margin, NOA Turnover, and Return on Net Operating Assets

8-25
Profit Margin and Asset Turnover
Net operating Asset Turnover v/s Net operating Profit Margin for Selected Industries
8-26
Analyzing Return on Assets-ROA
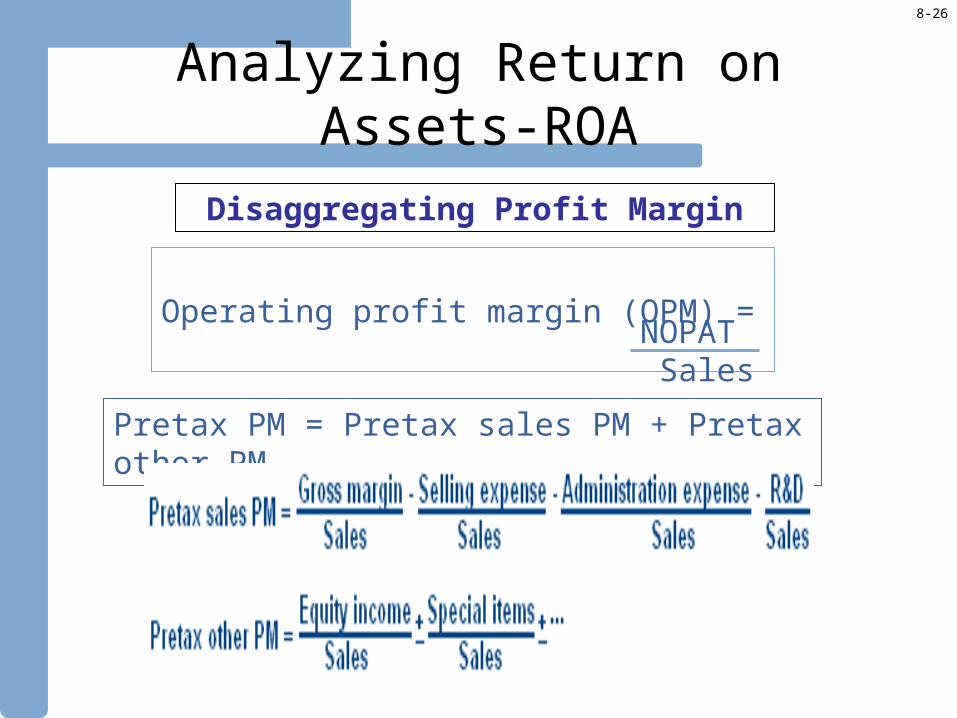
Disaggregating Profit Margin
Operating profit margin (OPM) = NOPAT Sales
Pretax PM = Pretax sales PM + Pretax other PM
8-27
Analyzing Return on Assets-ROA
• Gross profit margin vary across industries depending on factors like competition and differences in factors of production.
• What affect gross profit margin?????• Gross Profit Margin: Reflects the gross profit as a percent of
sales– Reflects company’s ability to increase or maintain selling
price– Declining margins may indicate that competition has
increased or that the company’s products have become less competitive, or both
• Selling Expenses• General and Administrative Expenses
Disaggregating Profit Margin

8-28
Analyzing Return on Assets-ROA
Disaggregation of Asset Turnover
• Asset turnover measures the intensity with which companies utilize assets
• Relevant measure is the amount of sales generated
Salesaverage net operating assets
8-29
Analyzing Return on Assets-ROA
• Accounts Receivable turnover: Reflects how many times receivables are collected on average. – Accompanying ratio: Average collection period
• Inventories turnover: Reflects how many times inventories are collected on average – Accompanying ratio: Average inventory days outstanding
• Long-term Operating Asset turnover: Reflects the productivity of long-term operating assets
• Accounts Payable turnover: Reflects how quickly accounts payable are paid, on average – Accompanying ratio: Average payable days outstanding
Disaggregation of Asset Turnover

8-30
Analyzing Return on Assets-ROA
Disaggregation of Asset Turnover
Accounts payable turnover = Cost of goods sold/Average accounts payableAverage payable days outstanding = Accounts payable/Average daily cost of goods soldNet operating working capital turnover = Net sales/Average net operating working capital
Inventory turnover = Cost of goods sold/Average inventoryAverage inventory days outstanding = Inventory/Average daily cost of goods soldLong-term operating asset turnover = Sales/Average long-term operating assets
Accounts receivable turnover = Sales/Average accounts receivableAverage collection period = Accounts receivable/Average daily sales

8-31
Analyzing Return on Common Equity-ROCE
where ROCE is equal to net income available to common shareholders (after preferred dividends) divided by the beginning-of-period common equity
This can be restated in terms of future ROCE:
Role in Equity Valuation

8-32
Analyzing Return on Common Equity-ROCEDisaggregating ROCE

8-33
Analyzing Return on Common Equity-ROCE
• Leverage refers to the extent of invested capital from other than common shareholders• If suppliers of capital (other than common
shareholders) receive less than ROA, then common shareholders benefit; the reverse occurs when suppliers of capital receive more than ROA• The larger the difference in returns between common equity and other capital suppliers, the more successful (or unsuccessful) is the trading on the equity
Leverage and ROCE

8-34
Analyzing Return on Common Equity-ROCE
Alternate View of ROCE Disaggregation

8-35
Analyzing Return on Common Equity-ROCE
equity rs’stockholde common Averagepayout Dividenddividends PreferredincomeNet =rate growth Equity
Assessing Equity Growth
• Assumes earnings retention and a constant dividend payout
• Assesses common equity growth rate through earnings retention

8-36
Analyzing Return on Common Equity-ROCE
Assessing Equity Growth
Assumes internal growth depends on both earnings retention and return earned on the earnings retained
rate)Payout (1 ROCE = rategrowth equity eSustainabl
Related Documents