93 Chapter V Trade costs and facilitation in APEC and ASEAN: delivering the goods? By Ben Shepherd 53 Introduction Trade facilitation is a popular idea in the Asia-Pacific region. It is one of the more prominent initiatives in regional integration programmes, in particular APEC and ASEAN. Both groups recognize that tariffs are just the tip of the iceberg (cost) when it comes to international and regional trade. So reducing trade costs and facilitating exports and imports must be about much more than just tariff cuts. This is the importance of ―broad sense‖ trade facilitation, i.e. policies designed to reduce the transaction costs of international trade. APEC has been particularly forthright in its commitment to trade facilitation. In the 2001 Shanghai Declaration, APEC leaders committed to reduce trade transaction costs by 5 per cent over the following five years. In 2005 at Busan, they pledged an additional 5 per cent cut. Implicitly, there must have been a consensus within APEC that the Shanghai goal had been reached. So it is remarkable that there is no analytical work to support this conclusion. A mid-term review (Woo, 2004) examined the nature and extent of trade facilitation initiatives undertaken by individual member economies, but did not conduct a quantitative assessment of the trade cost reductions those steps might have brought about. This paper is a first attempt to fill that analytical gap, and answer the question: ―has trade facilitation been delivering the goods?‖. To do so, it uses a newly developed methodology to measure trade costs in APEC and ASEAN between 1995 and 2008, and 2001 and 2007, respectively. It shows that there has been some encouraging progress towards the Shanghai target among APEC members. There has also been some movement in ASEAN, although data limitations make it harder to assess its full extent. In both cases, however, performance varies markedly across countries. To better understand the role of trade facilitation in bringing about these changes in trade costs, ―back of the envelope‖ decomposition into tariff and non-tariff components is undertaken. In both APEC and ASEAN, tariff reductions have played an important role in reducing overall trade costs. Progress on non-tariff trade costs has been much less impressive. This finding raises serious questions as to the effectiveness of trade facilitation efforts in the Asia-Pacific region, which should be clearly focused on non-tariff trade costs. The next section briefly overviews trade facilitation initiatives in APEC and ASEAN. It also discusses the most important recent literature on their effectiveness. Section B discusses the paper‘s methodology and dataset. It then presents overall results, decomposes them into tariff and non-tariff trade costs, and interprets them in terms of the trade facilitation objectives of APEC and ASEAN. Section C concludes, and discusses some possible policy implications. 53 This paper is part of an ongoing research project on trade costs supported by the Groupe d‘Economie Mondiale at Sciences Po, and conducted jointly with Sébastien Miroudot to whom the author is grateful for many helpful discussions.

Welcome message from author
This document is posted to help you gain knowledge. Please leave a comment to let me know what you think about it! Share it to your friends and learn new things together.
Transcript

93
Chapter V
Trade costs and facilitation in APEC and ASEAN: delivering the goods?
By Ben Shepherd53
Introduction
Trade facilitation is a popular idea in the Asia-Pacific region. It is one of the more
prominent initiatives in regional integration programmes, in particular APEC and ASEAN.
Both groups recognize that tariffs are just the tip of the iceberg (cost) when it comes to
international and regional trade. So reducing trade costs and facilitating exports and imports
must be about much more than just tariff cuts. This is the importance of ―broad sense‖ trade
facilitation, i.e. policies designed to reduce the transaction costs of international trade.
APEC has been particularly forthright in its commitment to trade facilitation. In the
2001 Shanghai Declaration, APEC leaders committed to reduce trade transaction costs by 5
per cent over the following five years. In 2005 at Busan, they pledged an additional 5 per cent
cut. Implicitly, there must have been a consensus within APEC that the Shanghai goal had
been reached. So it is remarkable that there is no analytical work to support this conclusion.
A mid-term review (Woo, 2004) examined the nature and extent of trade facilitation
initiatives undertaken by individual member economies, but did not conduct a quantitative
assessment of the trade cost reductions those steps might have brought about.
This paper is a first attempt to fill that analytical gap, and answer the question: ―has
trade facilitation been delivering the goods?‖. To do so, it uses a newly developed
methodology to measure trade costs in APEC and ASEAN between 1995 and 2008, and 2001
and 2007, respectively. It shows that there has been some encouraging progress towards the
Shanghai target among APEC members. There has also been some movement in ASEAN,
although data limitations make it harder to assess its full extent. In both cases, however,
performance varies markedly across countries.
To better understand the role of trade facilitation in bringing about these changes in
trade costs, ―back of the envelope‖ decomposition into tariff and non-tariff components is
undertaken. In both APEC and ASEAN, tariff reductions have played an important role in
reducing overall trade costs. Progress on non-tariff trade costs has been much less impressive.
This finding raises serious questions as to the effectiveness of trade facilitation efforts in the
Asia-Pacific region, which should be clearly focused on non-tariff trade costs.
The next section briefly overviews trade facilitation initiatives in APEC and ASEAN.
It also discusses the most important recent literature on their effectiveness. Section B
discusses the paper‘s methodology and dataset. It then presents overall results, decomposes
them into tariff and non-tariff trade costs, and interprets them in terms of the trade facilitation
objectives of APEC and ASEAN. Section C concludes, and discusses some possible policy
implications.
53 This paper is part of an ongoing research project on trade costs supported by the Groupe
d‘Economie Mondiale at Sciences Po, and conducted jointly with Sébastien Miroudot to
whom the author is grateful for many helpful discussions.

94
A. Experience with reducing trade costs in APEC and ASEAN
This section briefly reviews the various trade facilitation initiatives undertaken by
APEC and ASEAN.54 It then examines the available evidence on the extent to which these
initiatives have borne fruit in terms of lower trade transaction costs in the region.
1. Trade facilitation in APEC and ASEAN
APEC was brought into existence to promote the long-term goal of free and open
trade and investment in the Asia-Pacific region. According to the group‘s 1994 Bogor Goals,
industrialized member economies are supposed to reach this goal by 2010, with developing
member economies to follow by 2020. Notwithstanding APEC‘s initial focus on tariff
reductions, the Bogor Goals recognize that traditional trade liberalization is a necessary but
not sufficient condition for achieving free and open trade. Trade facilitation also has an
important role to play in eliminating administrative and other impediments to international
trade flows. It also fits well with member economies‘ preference for non-discriminatory
measures: APEC is not designed as a traditional free trade agreement, but rather as a
cooperative forum in which member economies can jointly engage on a path of unilateral
reforms that are as compatible as possible with the broader objective of global free trade.
One of the most ambitious steps taken by APEC member economies was in 2001. At
their Shanghai meeting, leaders agreed to reduce trade transaction costs by 5 per cent over the
following five years. With the aim of providing a roadmap for achieving that goal, APEC‘s
Trade Facilitation Action Plan (TFAP) was released the following year. The TFAP
established a set of trade facilitation measures covering four areas: customs procedures;
standards and conformity assessment; business mobility; and electronic commerce. Member
economies use their Individual Action Plans (IAPSs) to provide annual progress reports. The
next section reviews the extent of member economies‘ TFAP implementation based on their
IAP reports.
ASEAN is another important regional grouping from a trade policy point of view,
even though its membership is much more limited than APEC‘s. The overarching trade
objective for ASEAN is now the ASEAN Economic Community. It is intended to bring
together existing arrangements on liberalizing trade, investment and services. An ASEAN
single market is supposed to be in place by 2015. Although progress on trade costs in
ASEAN was initially very slow, it has accelerated somewhat since the mid- to late-1990s. As
in APEC, trade facilitation and behind-the-border measures are an important part of the
overall approach.
2. Trade facilitation and trade costs: the evidence so far
In 2004, APEC‘s Committee on Trade and Investment considered the results of a mid-
term review of progress under the TFAP (Woo, 2004). The review provided a comprehensive
assessment of actions taken by member economies under the four pillars of APEC‘s trade
facilitation program. On a qualitative level, it showed evidence of substantial progress. Of the
54 This section draws on the comprehensive review of East Asian trade facilitation initiatives
in Pomfret and Sourdin (2009).

95
1,300 action items identified under the TFAP, member economies had selected over 90 per
cent for implementation. Of those, about half had already been completed by the time of the
mid-term review. The percentage of completed items was highest in customs, and lowest in
the ―other‖ categories (including electronic commerce). (See table 1.)
However, these overall figures obscure considerable variation at the country level and
shows that some member economies have been far more active than others in choosing TFAP
action items for implementation. The degree of success in implementation – i.e., progress
versus completion – also varies markedly across the region. One standout example is the
United States, which has selected only 19 TFAP items, and has not reported implementation
of any of them. The mid-term review (Woo, 2004) provides a comprehensive assessment of
country efforts in each of the four main TFAP areas.
Although there is evidence that APEC member economies have pursued important
items on their trade facilitation agenda – albeit with varying degrees of assiduity and success
– there are far fewer indications of the extent to which these efforts have translated into lower
trade costs. Member economies are not required to submit quantitative evidence showing that
measures they have undertaken actually reduce trade costs. Even the TFAP mid-term review
(Woo, 2004) lacks any quantitative investigation of the extent to which member economies‘
implementation efforts are taking them closer to the goal of a 5 per cent reduction in trade
transaction costs.
Wilson and others (2003) provide a first assessment of the possible extent to which
improved trade facilitation in APEC could boost trade within the region. They measure trade
facilitation using four dimensions: port efficiency; the customs environment; the regulatory
environment; and e-business usage. Although not directly drawn from the four pillars listed in
APEC‘s TFAP, there is nonetheless some overlap between the two, particularly in relation to
customs and e-business. Using a gravity model, the authors find that intra-APEC trade is
particularly sensitive to the quality of ports, and the level of regulatory barriers. They suggest
that these areas should be particular priorities for trade facilitation moving forward. Simple
counterfactuals are consistent with improved trade facilitation being associated with a major
boost in intra-APEC trade, and consequently growth in per capita incomes.

96
Table 1. Progress on trade facilitation by APEC member economies
No. of Items Selected No. of Items Implemented No. of Items Completed
Cust
oms
Standards Mobilit
y
E-
Commerce
Custo
ms
Standar
ds
Mobil
ity
E-
Commerce
Custo
ms
Standar
ds
Mobil
ity
E-
Commerce
Australia 42 19 6 10 40 19 6 10 31 17 6 0
Brunei
Darussalam
45 12 4 6 35 12 4 6 26 8 3 3
Canada 39 16 6 11 39 16 6 11 30 13 5 3
Chile 42 20 6 11 40 11 4 8 31 4 3 1
China 60 20 6 11 45 12 5 4 43 7 3 1
Hong Kong, China 33 19 6 9 33 19 6 9 31 13 2 2
Indonesia 39 14 6 6 30 11 5 4 - - - -
Japan 60 20 6 11 56 18 5 10 54 11 4 10
Republic of Korea 46 11 6 12 45 10 5 12 44 9 5 10
Malaysia 46 20 6 11 46 20 6 11 35 11 5 10
Mexico 60 20 6 11 50 16 6 7 23 2 2 7
New Zealand 42 56 17 6 40 55 15 4 31 53 12 3
Papua New Guinea 57 20 6 11 - - - - - - - -
Peru 38 14 2 - 34 7 2 - 34 2 2 -
Philippines 12 5 2 5 28 3 2 3 37 9 3 7
Russian Federation 44 20 3 16 36 19 3 10 13 8 3 2
Singapore 39 11 5 8 39 11 5 8 38 10 5 8
Taiwan Province
of China
40 26 6 11 39 24 4 11 32 20 4 4
Thailand 53 20 6 11 45 18 5 11 32 6 2 6
United States 17 - - 2 - - - - - - - -
Viet Nam 49 20 6 11 21 11 5 6 19 10 2 5
Total 903 383 117 190 741 312 99 145 584 213 71 82
Source: Helble and others, 2007.

97
Shepherd and Wilson (2009) use a similar methodology to examine the effects of
trade facilitation in South-East Asia, focusing on ASEAN members. They measure trade
facilitation using the same four dimensional approach as in Wilson and others (2004).
They find that intra-ASEAN trade is particularly sensitive to infrastructure quality, and
the use of information and communication technologies (ICTs). In line with the results
from Wilson and others (2004), the authors find that improvements in trade facilitation
have significant potential to boost intra-regional trade.
Although Wilson and others (2004) and Shepherd and Wilson (2009) provide
substantial evidence on the sensitivity of trade flows with respect to trade facilitation,
they do not undertake any direct analysis of the extent to which trade costs have fallen in
the region in recent years. Nor do they reach any conclusions as to the effectiveness of
trade facilitation in supporting trade cost reductions.
In light of this gap in the literature, Pomfret and Sourdin (2009) take a different
approach. They focus much more directly on the issue of trade costs. They use Australian
data on CIF and FOB trade values to estimate trade costs for Asian countries trading with
Australia. Their measure essentially captures international shipping costs, which are an
important part of the overall cost of moving goods between countries. For Asian APEC
member economies, they find a reduction in trade costs from 6.1 per cent to 4.3 per cent
ad valorem between 2001 and 2006 (a roughly 30 per cent change), and then to 4.1 per
cent in 2007. For ASEAN, the comparable figures are 7 per cent in 2001, 4.3 per cent in
2005, and 3.9 per cent in 2007, so about a 45 per cent change from 2001-2007. These
changes are quantitatively important, but need to be kept in perspective: they only relate
to international transport costs, and do not capture the broader range of trade costs that are
central in the trade facilitation literature.
B. Trade costs in APEC and ASEAN, 1995-2008
This section extends the work reviewed in the previous section by using a broader
measure of trade costs to analyse the extent of progress on trade facilitation in the region.
Whereas the CIF/FOB measure used by Pomfret and Sourdin (2009) essentially captures
international shipping costs, the broader measure of trade costs used here includes the full
range of costs involved in moving goods between countries. It is strongly grounded in
recent trade theory, and potentially provides the basis for a comprehensive approach to
trade facilitation.
1. Methodology and data
Starting from the standard, theory-consistent gravity model of Anderson and Van
Wincoop (2003), Novy (2009) develops a comprehensive measure of bilateral trade
costs.55 Equation 1 presents that measure in ad valorem equivalent terms. It is the
geometric average of bilateral trade costs for exports from country i to country j and from
country j to country i, expressed relative to domestic trade costs in each country (
and
55 In fact, Novy (2009) shows that basically the same measure can be derived from a wide
variety of theoretical models of international trade. The interpretation of some parameters
changes depending on the model used, but the overall approach remains very similar.

98
respectively). To calculate it, all that is required is data on domestic production relative
to exports in both countries (
and
). The parameter s is the elasticity of substitution
among varieties in a sector, assuming the Anderson and Van Wincoop-based derivation
of Novy‘s measure of trade costs.
(1)
Intuitively, Novy‘s measure captures the fact that if a country‘s trade costs vis-à-
vis the rest of the world fall, then a part of its production that was previously consumed
domestically will instead be shipped overseas. Trade costs are thus closely related to the
extent to which a country trades with itself rather than other countries, and data on this
kind of relative openness can be used to make inferences about the level of trade costs
and their variation over time.
This approach has three main advantages over the readily available alternatives.
Firstly, it represents a comprehensive measure of the full range of trade costs, namely the
costs of moving goods between countries relative to the costs of moving them within
countries. It captures international shipping—as in work using CIF/FOB ratios—but also
a much wider variety of cost factors. (See Anderson and Van Wincoop, 2004 for a full
review.) It takes account of all factors that make it harder to ship goods between rather
than inside countries, for example: border infrastructure; customs and clearance
procedures; access to trade finance; differences in business and investment climates; and
behind-the-border regulatory measures, including standards and conformity assessments,
which have asymmetric impacts on local versus foreign producers. Even the effects of
regulatory measures that are discriminatory in fact but not in law are included in this
measure of trade costs.
The second advantage of Novy‘s measure is that its data requirements are
minimal. As a result, it is feasible to obtain measures of trade costs across a wide variety
of countries and time periods. Thirdly, it relies on a theory-based rearrangement of data,
rather than econometric estimation. It thus does not suffer from the possibility of omitted
variables bias, which plagues gravity model estimates.56
The remainder of the paper presents results for calculated as the ad valorem
equivalent of trade costs between APEC member economies, ASEAN member countries,
and the world as a whole.57 Trade flows – exports and imports with the world –are
sourced from UN Comtrade via WITS. GDP data are taken from the World Development
56 Novy (2009) shows that even allowing for measurement error does not introduce
substantial uncertainty into measures of trade costs inferred using equation (1). 57 Future work in this research project will separately identify intra- and extra-bloc trade
costs, in order to assess the extent to which discrimination among trading partners might
be an issue. Given APEC‘s aim of consistency with multilateral liberalization efforts,
however, it is pertinent to start by calculating trade costs vis-à-vis the world as a whole.

99
Indicators. Domestic production is proxied by GDP less total exports.58 Since GDP is
calculated on a value added basis, but and should be gross shipments, as
calculated here tends to understate the true level of trade costs. Estimates of ad valorem
equivalents should therefore be regarded as lower bounds.
The elasticity of substitution s is set equal to 8, which is a common rule of thumb
(Novy, 2009). Although ad valorem equivalents are quite sensitive to the value chosen for
s, using indices relative to a base year reduces that problem to economically insignificant
levels. The index number approach also makes the value added versus gross shipments
problem less serious, on the assumption that the ratio of the two remains relatively stable
through time. The next section presents results using both methods.
2. APEC trade cost reductions: was the Shanghai goal met?
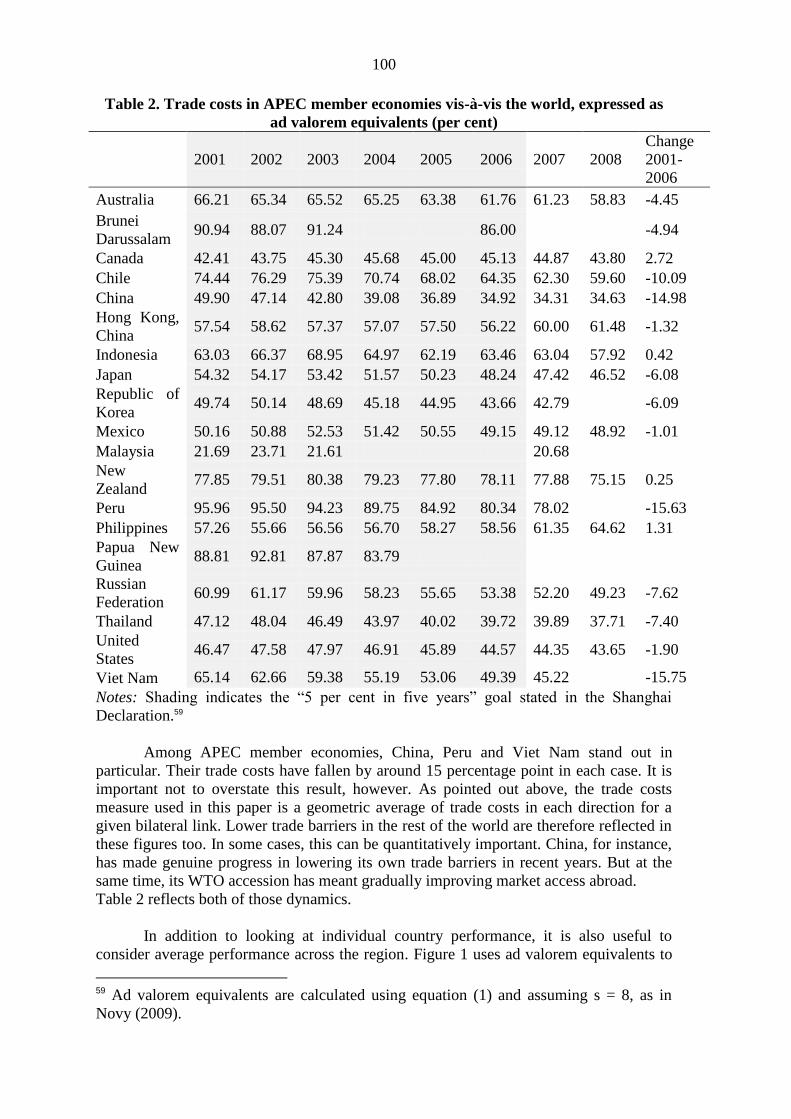
Table 2 presents ad valorem equivalents of trade costs in APEC member
economies, calculated using equation (1). On the surface, these estimates might appear
very high, for example, they are an order of magnitude greater than the trade costs
calculated by Pomfret and Sourdin (2009) using CIF/FOB ratios,. However, it is
important to be aware of the differences between the two measures. CIF/FOB ratios do
not capture impediments to international trade other than those directly associated with
shipping the goods. However, the trade facilitation literature has identified many other
factors that also impact trade flows, and those findings are reflected in APEC‘s approach
to trade facilitation, which encompasses a wide range of policy areas.
A partial reality check for the figures presented in table 2 is provided by Anderson
and Van Wincoop (2004). Those authors conducted a comprehensive review of the
gravity modeling literature, and identified a set of factors – policy-related and ―natural‖ –
that have been robustly found to have significant trade impacts. Their back-of-the-
envelope aggregate measure of international trade costs based on the evidence reviewed
suggested an ad valorem equivalent of approximately 55 per cent. The numbers presented
here are quite similar to that benchmark.
As can be seen from the table, a number of APEC member economies have
experienced significant reductions in trade costs over the Shanghai Declaration‘s 2001-
2006 timeline. The final column of the table shows the absolute (percentage point) change
in ad valorem trade costs over that period. Eight member economies have met or
exceeded the 5 per cent goal, with another two very close to it. On the other hand, six
member economies still had a considerable extra distance to travel in 2006; there is even
evidence of slight backsliding in some cases.
58 The research project of which this paper is a part of, is currently compiling comparable
data on production and trade across a wide range of countries. However, it is not possible
to present results for APEC and ASEAN using these data at the present time.
100
Table 2. Trade costs in APEC member economies vis-à-vis the world, expressed as
ad valorem equivalents (per cent)
2001 2002 2003 2004 2005 2006 2007 2008
Change
2001-
2006
Australia 66.21 65.34 65.52 65.25 63.38 61.76 61.23 58.83 -4.45
Brunei
Darussalam 90.94 88.07 91.24 86.00 -4.94
Canada 42.41 43.75 45.30 45.68 45.00 45.13 44.87 43.80 2.72
Chile 74.44 76.29 75.39 70.74 68.02 64.35 62.30 59.60 -10.09
China 49.90 47.14 42.80 39.08 36.89 34.92 34.31 34.63 -14.98
Hong Kong,
China 57.54 58.62 57.37 57.07 57.50 56.22 60.00 61.48 -1.32
Indonesia 63.03 66.37 68.95 64.97 62.19 63.46 63.04 57.92 0.42
Japan 54.32 54.17 53.42 51.57 50.23 48.24 47.42 46.52 -6.08
Republic of
Korea 49.74 50.14 48.69 45.18 44.95 43.66 42.79 -6.09
Mexico 50.16 50.88 52.53 51.42 50.55 49.15 49.12 48.92 -1.01
Malaysia 21.69 23.71 21.61 20.68
New
Zealand 77.85 79.51 80.38 79.23 77.80 78.11 77.88 75.15 0.25
Peru 95.96 95.50 94.23 89.75 84.92 80.34 78.02 -15.63
Philippines 57.26 55.66 56.56 56.70 58.27 58.56 61.35 64.62 1.31
Papua New
Guinea 88.81 92.81 87.87 83.79
Russian
Federation 60.99 61.17 59.96 58.23 55.65 53.38 52.20 49.23 -7.62
Thailand 47.12 48.04 46.49 43.97 40.02 39.72 39.89 37.71 -7.40
United
States 46.47 47.58 47.97 46.91 45.89 44.57 44.35 43.65 -1.90
Viet Nam 65.14 62.66 59.38 55.19 53.06 49.39 45.22 -15.75
Notes: Shading indicates the ―5 per cent in five years‖ goal stated in the Shanghai
Declaration.59
Among APEC member economies, China, Peru and Viet Nam stand out in
particular. Their trade costs have fallen by around 15 percentage point in each case. It is
important not to overstate this result, however. As pointed out above, the trade costs
measure used in this paper is a geometric average of trade costs in each direction for a
given bilateral link. Lower trade barriers in the rest of the world are therefore reflected in
these figures too. In some cases, this can be quantitatively important. China, for instance,
has made genuine progress in lowering its own trade barriers in recent years. But at the
same time, its WTO accession has meant gradually improving market access abroad.
Table 2 reflects both of those dynamics.
In addition to looking at individual country performance, it is also useful to
consider average performance across the region. Figure 1 uses ad valorem equivalents to
59 Ad valorem equivalents are calculated using equation (1) and assuming s = 8, as in
Novy (2009).

101
summarize APEC‘s performance as a whole. In simple average terms, APEC‘s trade costs
with the rest of the world fell from 61 per cent to 56 per cent ad valorem over the 2001-
2006 period. APEC appears to have met its 5 per cent in five years goal, but only just
barely. A GDP weighted average reinforces this impression: trade costs fell from 50 per
cent to 46 per cent, i.e. slightly less than the 5 per cent goal.
A more generous metric than percentage point changes in ad valorem equivalents
is to look at percentage changes in trade costs relative to the 2001 benchmark level. This
approach has the added benefit of being much less sensitive to the choice of the elasticity
parameter s.
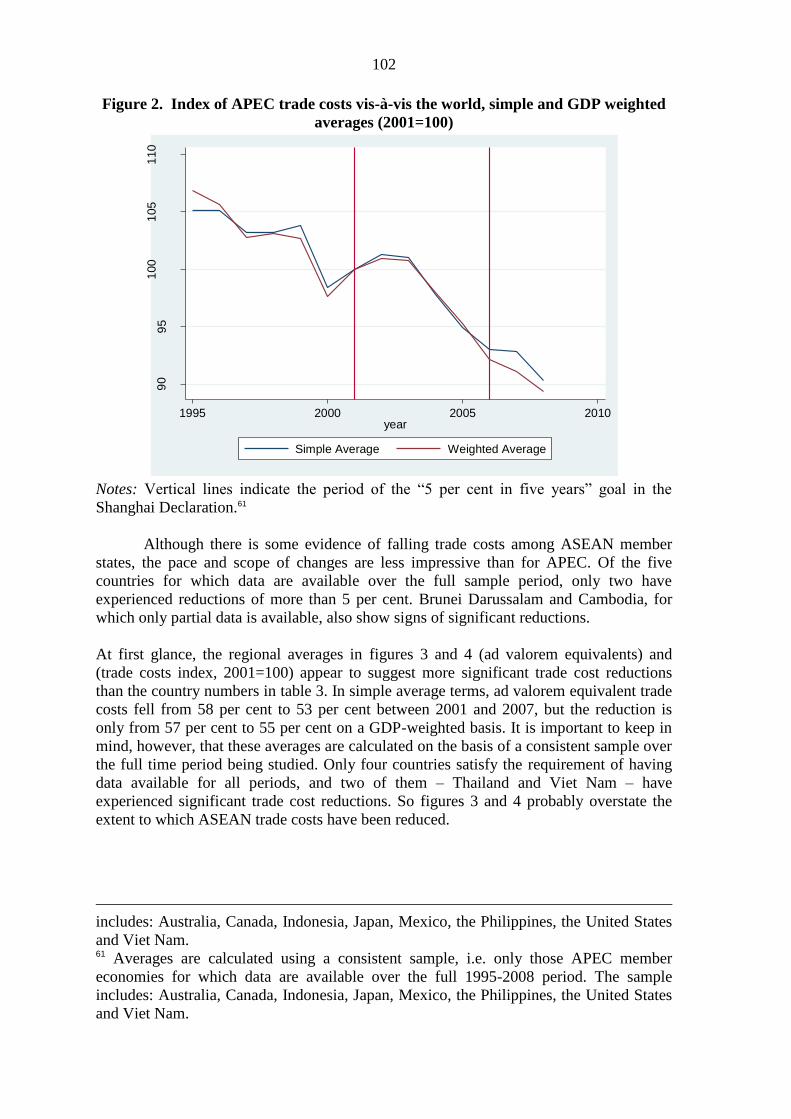
Figure 2 presents results, with trade costs expressed as an index number. Results
from the simple and GDP weighted averages are much closer in this case: they both
indicate a fall in the trade costs index from 100 in 2001 to 92 or 93 in 2006, i.e. a 7 per
cent-8 per cent reduction. If the ―5 per cent in five years‖ criterion is interpreted as a
relative, rather than absolute, objective then there is clear evidence that APEC as a whole
has achieved this aim.
3. Trade cost reductions in ASEAN
This section examines the evolution of trade costs in ASEAN over the period
2001-2007. This shorter time interval reflects data limitations; but as table3 shows, even
this restriction only makes it possible to obtain partial results for seven out of ten ASEAN
member countries.
Figure 1. APEC trade costs vis-à-vis the world in per cent ad valorem equivalent
terms, simple and GDP weighted averages
Note: Vertical lines indicate the period of the ―5 per cent in five years‖ goal in the
Shanghai Declaration.60
60 Averages are calculated using a consistent sample, i.e. only those APEC member
economies for which data are available over the full 1995-2008 period. The sample
45
50
55
60
65
1995 2000 2005 2010year
Simple Average GDP Weighted Average
102
Figure 2. Index of APEC trade costs vis-à-vis the world, simple and GDP weighted
averages (2001=100)
Notes: Vertical lines indicate the period of the ―5 per cent in five years‖ goal in the
Shanghai Declaration.61
Although there is some evidence of falling trade costs among ASEAN member
states, the pace and scope of changes are less impressive than for APEC. Of the five
countries for which data are available over the full sample period, only two have
experienced reductions of more than 5 per cent. Brunei Darussalam and Cambodia, for
which only partial data is available, also show signs of significant reductions.
At first glance, the regional averages in figures 3 and 4 (ad valorem equivalents) and
(trade costs index, 2001=100) appear to suggest more significant trade cost reductions
than the country numbers in table 3. In simple average terms, ad valorem equivalent trade
costs fell from 58 per cent to 53 per cent between 2001 and 2007, but the reduction is
only from 57 per cent to 55 per cent on a GDP-weighted basis. It is important to keep in
mind, however, that these averages are calculated on the basis of a consistent sample over
the full time period being studied. Only four countries satisfy the requirement of having
data available for all periods, and two of them – Thailand and Viet Nam – have
experienced significant trade cost reductions. So figures 3 and 4 probably overstate the
extent to which ASEAN trade costs have been reduced.
includes: Australia, Canada, Indonesia, Japan, Mexico, the Philippines, the United States
and Viet Nam. 61 Averages are calculated using a consistent sample, i.e. only those APEC member
economies for which data are available over the full 1995-2008 period. The sample
includes: Australia, Canada, Indonesia, Japan, Mexico, the Philippines, the United States
and Viet Nam.
90
95
100
105
110
1995 2000 2005 2010year
Simple Average Weighted Average

103
Table 3. Trade costs in ASEAN member states vis-à-vis the world, expressed as ad
valorem equivalents (per cent)62
2001 2002 2003 2004 2005 2006 2007
Absolute
Change
(2001-
2007)
Brunei
Darussalam 90.94 88.07 91.24 86.00
Indonesia 63.16 66.45 69.02 65.02 62.19 63.54 63.13 -0.03
Cambodia 98.36 93.01 94.21 90.24
Malaysia 21.95 23.93 21.97 21.30 -0.65
Philippines 57.31 55.72 56.65 56.75 58.32 58.72 61.46 4.15
Thailand 47.27 48.24 46.70 44.13 40.02 39.97 40.27 -7.00
Viet Nam 65.14 62.67 59.46 55.38 53.30 49.83 45.44 -19.71
Figure 3. ASEAN trade costs vis-à-vis the world in percent ad valorem equivalent
terms, simple and GDP weighted averages63
62 Ad valorem equivalents are calculated using equation (1) and assuming s = 8, as in
Novy (2009). 63 Averages are calculated using a consistent sample, i.e. only those ASEAN member
economies for which data are available over the full 1995-2008 period. The sample
includes: Indonesia, the Philippines, Thailand and Viet Nam.
52
54
56
58
60
2000 2002 2004 2006 2008Year
Simple Average GDP Weighted Average

104
Figure 4. Index of ASEAN trade costs vis-à-vis the world, simple and GDP weighted
averages (2001=100)64
4. What role for trade facilitation?
Since the trade cost measures discussed thus far are very broad in terms of what
they capture, it would be inaccurate to ascribe the full cost reductions calculated in the
previous section to trade facilitation. Lower tariffs could also have played an important
role in lowering overall trade costs. It is important to push the data a little further in order
to assess the relative importance of tariffs and trade facilitation, used here in the broad
sense – consistent with APEC‘s approach – of measures designed to reduce costs, other
than tariff cuts.
Data on applied tariffs are available from UNCTAD‘s TRAINS database via
WITS. Since trade costs in Table 2 are in ad valorem equivalent terms, it is possible to
obtain a rough decomposition of the total into tariff and non-tariff elements by subtracting
the geometric mean of a country‘s tariffs on foreign imports and the tariffs its exports
face abroad. This decomposition is important because the Shanghai goal should in theory
apply to non-tariff trade costs only. Results are presented in table 4, which suppresses
numbers for all but the starting and ending years in the interests of readability. Full results
are available on request.
64 Averages are calculated using a consistent sample, i.e. only those ASEAN member
economies for which data are available over the full 1995-2008 period. The sample
includes: Indonesia, the Philippines, Thailand and Viet Nam.
90
95
100
105
2000 2002 2004 2006 2008Year
Simple Average GDP Weighted Average

105
Table 4. Changes in tariff and non-tariff trade costs in APEC, 2001-2006
2001 2006 Absolute Change
Total Tariff
Non-
Tariff Total Tariff
Non-
Tariff Total Tariff
Non-
Tariff
Australia 66.21 4.22 61.99 61.76 2.90 58.86 -4.45 -1.32 -3.13
Brunei
Darussalam 90.94 4.06 86.88 86.00 2.29 83.70 -4.94 -1.76 -3.18
Canada 42.41 1.06 41.35 45.13 0.70 44.42 2.72 -0.36 3.08
Chile 74.44 5.97 68.47 64.35 1.44 62.92 -10.09 -4.53 -5.56
China 49.90 8.40 41.50 34.92 4.07 30.85 -14.98 -4.32 -10.66
Hong Kong,
China 57.54 56.22 0.00 56.22 -1.32
Indonesia 63.03 4.70 58.34 63.46 4.14 59.32 0.42 -0.56 0.98
Japan 54.32 3.53 50.79 48.24 2.44 45.80 -6.08 -1.10 -4.99
Rep. of
Korea 49.74 43.66 5.48 38.17 -6.09
Malaysia 21.69 3.46 18.23 2.44 -1.02
Mexico 50.16 3.61 46.55 49.15 1.14 48.00 -1.01 -2.47 1.46
New Zealand 77.85 78.11 3.77 74.33 0.25
Papua New
Guinea 88.81 0.90
Peru 95.96 80.34 2.58 77.75 -15.63
Philippines 57.26 3.01 54.25 58.56 2.17 56.40 1.31 -0.84 2.14
Russian
Federation 60.99 4.96 56.04 53.38
Thailand 47.12 6.76 40.36 39.72 4.03 35.69 -7.40 -2.73 -4.67
United States 46.47 3.23 43.24 44.57 2.09 42.48 -1.90 -1.14 -0.76
Viet Nam 65.14 11.48 53.66 49.39 7.45 41.94 -15.75 -4.03 -11.72
Table 4 shows that tariff reductions at home and overseas have played a
significant role in lowering trade costs in a number of countries. However, there is also a
group of countries for which non-tariff trade costs have fallen substantially. Four
countries – Chile, China, Japan and Viet Nam – meet or exceed the 5 per cent target.
Thailand comes quite close to doing so. Significant backsliding, in the sense of increases
in non-tariff trade costs, is evident for Canada and the Philippines.
Unsurprisingly in light of table 4, regional average progress on non-tariff trade
costs has been disappointing. Figure 5 shows at most a 1.5 per cent decline in non-tariff
trade costs. The difference between the simple and GDP-weighted bases is insignificant
in this case. Using the looser criterion of a 5 per cent reduction in trade costs compared
with the 2001 baseline results is slightly more encouraging. (Due to data limitations, the
overall situation in ASEAN is more difficult to assess. But the available evidence in table
5 suggests that trade facilitation – in the sense of reducing non-tariff trade costs – has
played a relatively minor role. Only for Viet Nam is there evidence of a substantial fall in
non-tariff trade costs. There is even some evidence of backsliding in other countries,
particularly in the Philippines. Figure 6 shows that the non-tariff trade costs index has
fallen from 100 to around 97 from 2001 to 2006, i.e. roughly a 3 per cent reduction.

106
Figure 5. APEC non-tariff trade costs vis-à-vis the world in percent ad valorem
equivalent terms, simple and GDP weighted averages65
Figure 6. Index of APEC non-tariff trade costs vis-à-vis the world, simple and GDP
weighted averages (2001=100)66
65 Averages are calculated using a consistent sample, i.e. only those APEC member
economies for which data are available over the full 1995-2008 period. The sample
includes: Australia, Canada, Indonesia, Japan, Mexico, the Philippines, United States and
Viet Nam. 66 Averages are calculated using a consistent sample, i.e. only those APEC member
economies for which data are available over the full 1995-2008 period. The sample
includes: Australia, Canada, Indonesia, Japan, Mexico, the Philippines, the United States
and Viet Nam.
44
46
48
50
52
2001 2002 2003 2004 2005 2006year
Simple Average GDP-Weighted Average
96
98
100
102
104
2001 2002 2003 2004 2005 2006year
Simple Average GDP-Weighted Average

107
Regional averages (figures 7 and 8) are difficult to interpret due the small number
of countries (three), for which all required data are available. Although the two simple
average curves suggest that there have been some reductions in non-tariff trade costs, the
GDP-weighted averages are more suggestive of very little change having taken place.
Analysing the graphs together with table 5 tends to indicate that whatever changes in non-
tariff trade costs have taken place have probably been relatively minor.
Table 5. Changes in tariff and non-tariff trade costs in ASEAN, 2001-2006
2001 2007 Absolute Change
Total
Tarif
f
Non-
Tariff Total Tariff
Non-
Tariff Total Tariff
Non-
Tariff
Brunei
Darussalam 90.94 4.06 86.88 2.00 -2.06
Indonesia 63.16 4.71 58.45 63.13 3.74 59.40 -0.03 -0.98 0.95
Cambodia 98.36 11.46 86.90 8.99 -2.47
Lao PDR 6.84 3.50 -3.34
Myanmar 6.67 4.36 -2.30
Malaysia 21.95 3.49 18.46 21.30 2.57 18.73 -0.65 -0.92 0.27
Philippines 57.31 3.01 54.30 61.46 2.67 58.79 4.15 -0.34 4.49
Thailand 47.27 6.81 40.46 40.27 -7.00
Viet Nam 65.14 11.49 53.65 45.44 7.75 37.69 -19.71 -3.75
-
15.96
Figure 7. ASEAN non-tariff trade costs vis-à-vis the world in percent ad valorem
equivalent terms, simple and GDP weighted averages
52
54
56
58
60
2000 2002 2004 2006 2008Year
Simple Average GDP-Weighted Average

108
Figure 8. Index of ASEAN non-tariff trade costs vis-à-vis the world, simple and
GDP weighted averages (2001=100)
C. Conclusions and policy implications
This paper has used a new theory-consistent methodology to provide some first
measures of trade costs in APEC and ASEAN. The extent to which trade costs fall over
time—and in particular, non-tariff trade costs – is an important metric of the success of
trade facilitation programs. Previous analytical work shows that trade flows are sensitive
to improvements in trade facilitation and provides an idea of the economic gains to be
had. But this is the first ex post assessment of the success or otherwise of particular trade
facilitation programmes. In particular, it is the first rigorous attempt to bring APEC‘s
Shanghai goal – a 5 per cent reduction in trade costs over five years – into contact with
the data.
In the case of APEC, there is some evidence indicating that the Shanghai goal was
more or less achieved on a regional average basis. However, individual country
performance varies considerably. Some countries, such as China, Peru and Viet Nam,
have experienced major reductions in trade costs, on the order of 15 per cent ad valorem,
but others have essentially stayed still, or even regressed slightly.
In interpreting these results, it is important to keep in mind that changes in tariff
policy seem to have a lot to do with the changes observed in overall levels of trade costs.
Progress on non-tariff trade costs is generally much less impressive. In most cases, it falls
well below the Shanghai target of 5 per cent in five years. This finding is important, since
the 5 per cent goal relates to the ―transaction costs of international trade‖. It is a trade
facilitation objective, not a tariff reduction objective. On this basis, it is difficult to
conclude that APEC‘s trade facilitation programme has been a complete success.
Results for ASEAN are harder to interpret, since data limitations are far more
problematic. But as in the APEC case, there is some evidence of significant reductions in
the level of overall trade costs. However, tariffs again seem to play an important role.
There is little evidence of widespread reductions in non-tariff trade costs.
95
100
105
110
2000 2002 2004 2006 2008Year
Simple Average GDP-Weighted Average
109
It is also important to keep in mind that results for both regions are based on
aggregate GDP and trade flow data. Future research will need to use production data,
rather than value added, in order to produce more accurate measures of trade costs. It will
also be important to move from aggregate to sectoral data, to gauge the extent to which
different product groups have benefitted, or otherwise, from increased attention to trade
facilitation.
What do these results mean for the future of trade facilitation policies in the Asia-
Pacific region? There are two main implications. Firstly, attention should be clearly
focused on non-tariff trade costs and measures designed to reduce them. A broad
approach to trade facilitation is essential, and is reflected in numerous APEC statements.
But the evidence suggests that there might be a significant gap between intentions and
implementation. Secondly, it is important to set up clear metrics by which progress on
trade facilitation can be assessed. Taking APEC as an example, the IAP process and the
mid-term review (Woo, 2004) focuses on inputs to trade facilitation rather than outputs. A
country appears successful if it takes steps to implement a large number of measures. But
not all measures are created equal. Some have much stronger economic impacts than
others. Politically difficult though it may be some type of prioritization is required.
Ideally, future progress reviews would include a quantitative assessment of the extent to
which trade costs in the region have fallen over time.
In addition to the methodology adopted in this paper, there is now a wide variety
of international data sources on trade facilitation. Examples include the Doing Business
project, the World Bank‘s Logistics Performance Index, and the World Economic
Forum‘s Global Enabling Trade Index. Although none of these measures gives a perfect
picture of the trade facilitation environment, each of them provides some useful
information. Their easy availability means that the private sector and civil society can
also play a useful role in making sure that there is a closer match between intentions and
implementation.

110
References
Anderson, J.E. and E. Van Wincoop (2003). ―Gravity with gravitas: a solution to the
border puzzle‖, American Economic Review, vol. 93, No. 1, pp. 170-192.
_____ (2004). ―Trade costs‖, Journal of Economic Literature, vol. 42, No. 3, pp. 691-751.
Helble, M., B. Shepherd and J.S. Wilson (2007). ―Transparency and trade facilitation in
the Asia-Pacific: estimating the gains from reform (Canberra, Department of
Foreign Affairs and Trade).
Novy, Dennis (2009). ―Gravity redux: measuring international trade costs with panel
data‖. Warwick Economic Research Paper No. 861 (Coventry, Department of
Economics, University of Warwick), available from
http://www2.warwick.ac.uk/fac/soc/economics/staff/academic/novy/redux.pdf.
Pomfret, R. and P. Sourdin (2009). ―Have Asian trade agreements reduced trade costs?‖,
Journal of Asian Economics, vol. 20, No. 3, pp. 255-268.
Shepherd, B. and J.S. Wilson (2009). ―Trade facilitation in ASEAN member countries:
measuring progress and assessing priorities‖, Journal of Asian Economics, vol. 20,
No. 4, pp. 367-383.
Wilson, J.S., C.L. Mann and T. Otsuki (2003). ―Trade facilitation and economic
development: measuring the impact, Policy Research Working Paper No. 2988,
(Washington D.C., World Bank).
Woo, Yuen-Pau (2004). APEC‘s Trade Facilitation Action Plan: A Mid-Term
Assessment – A report prepared for the APEC Committee on Trade and
Development (Van Couver, Asia-Pacific Foundation of Canada).
Related Documents