15 Chapter Two THE U.S. DEFENSE AEROSPACE INDUSTRY: HOW GLOBALIZED IS IT? INTRODUCTION To analyze the implications of a globalizing U.S. defense aerospace industry for the Air Force, we must first address two questions: • What do we mean by “globalization”? • How globalized is the U.S. defense aerospace industry? In the ongoing debate over how to define globalization, some ob- servers make a clear distinction between the process of becoming a “global” industry and that of becoming merely an “international” one. For example, Frankenstein (1996) argues that a truly global company has design, manufacturing, and marketing capabilities in multiple locations around the world, while an international company buys components and markets products abroad but locates its pri- mary design and manufacturing capabilities in its home country. According to this view, increases in cross-border trade flows might indicate the “internationalization” of an industry, but there must be deeper business relationships between domestic and foreign firms before it can be described as “globalized.” We take a broader view of globalization in this report, encompassing both “global” and “international” companies in our definition of what it means for the defense aerospace industry to be globalized. We believe a broad view is appropriate because even if trade were the only form of international activity in which defense aerospace firms

Welcome message from author
This document is posted to help you gain knowledge. Please leave a comment to let me know what you think about it! Share it to your friends and learn new things together.
Transcript

15
Chapter Two
THE U.S. DEFENSE AEROSPACE INDUSTRY: HOWGLOBALIZED IS IT?
INTRODUCTION
To analyze the implications of a globalizing U.S. defense aerospaceindustry for the Air Force, we must first address two questions:
• What do we mean by “globalization”?
• How globalized is the U.S. defense aerospace industry?
In the ongoing debate over how to define globalization, some ob-servers make a clear distinction between the process of becoming a“global” industry and that of becoming merely an “international”one. For example, Frankenstein (1996) argues that a truly globalcompany has design, manufacturing, and marketing capabilities inmultiple locations around the world, while an international companybuys components and markets products abroad but locates its pri-mary design and manufacturing capabilities in its home country.According to this view, increases in cross-border trade flows mightindicate the “internationalization” of an industry, but there must bedeeper business relationships between domestic and foreign firmsbefore it can be described as “globalized.”
We take a broader view of globalization in this report, encompassingboth “global” and “international” companies in our definition ofwhat it means for the defense aerospace industry to be globalized.We believe a broad view is appropriate because even if trade were theonly form of international activity in which defense aerospace firms

16 U.S. Government Policy and the Defense Aerospace Industry
participated, it would still give rise to significant policy issues.Nevertheless, we recognize that the effectiveness of particular gov-ernment policies in managing globalization will depend on the na-ture of that globalization. For example, policies designed to restrictthe foreign outsourcing of widgets are unlikely to deal effectivelywith issues raised by U.S.-foreign collaboration on major weaponsystem development programs. Therefore, a key objective of thischapter is to review the available evidence not only on the magnitudebut also on the character of U.S. defense aerospace industry global-ization.
When defined broadly, the most visible manifestation of globaliza-tion can probably be found in the growing cross-border purchaseand sale, by number and by value, of goods, services, and financialassets. We know from widely available aggregate data on interna-tional trade and investment that according to these measures, theU.S. economy at the start of the 21st century is more globalized thanever before (Council of Economic Advisers [CEA], 2000).Unfortunately, the changes in the nature of international businessrelationships and activities that have almost certainly accompaniedthis increase in cross-border trade and investment are hard to track,primarily because there are so few data sources that capture them.There are no widely accepted definitions for many of the terms usedto describe them.
Nevertheless, recent studies of defense companies by Bitzinger(1999) and GAO (2000c) indicate that global linkages among defensefirms are becoming deeper and more complex. Our own case studyevidence—which uses a typology of cross-border relationships andactivities common to the defense aerospace industry—suggests thataerospace firms, too, are responding to the imperatives of globaliza-tion by creating innovative cross-border business structures.1 Whatthese new structures may imply in terms of Air Force objectives forthe defense industrial base, however, is not yet well understood.
Finally, the increasingly multinational character of the U.S. industrialworkforce is also an important feature of globalization, although it isnot always recognized as such because of a severe lack of data. One
______________ 1See Chapter Five for a discussion of these cases.

The U.S. Defense Aerospace Industry: How Globalized Is It? 17
source of information is the National Science Foundation’s biennialSurvey of Doctorate Recipients (National Science Foundation, 2001).This survey indicates that of roughly 630,000 U.S.-trained doctoralscientists and engineers in the United States in 1999, just over 10percent were non–U.S. citizens.2 In the field of aerospace/aeronautical engineering, however, non–U.S. citizens constituted13.7 percent of doctorate holders, while the proportion of non–U.S.citizens who held doctorates in information sciences was 27.3percent.3 Unfortunately, these data provide no insight into thenumber of foreign-born scientists and engineers working in theUnited States who did not receive degrees from U.S. universities, andthey cannot tell us how many are employed in the military aerospaceindustrial base. We therefore do not pursue them further in this re-port. Nevertheless, the fact that the military aerospace industrialbase, like the United States as a whole, relies to a significant extenton noncitizens to fill highly skilled technical positions may have im-portant implications for U.S. national security.
DEFENSE AEROSPACE GLOBALIZATION: DATA SOURCESAND TERMINOLOGY
Defense Aerospace Trade
There is little statistical data specific to the production and con-sumption of or trade in defense aerospace systems and subsystems—or at least little at useful levels of disaggregation.4 Nevertheless,several sources do provide data that shed light on the extent of trade-related globalization of the defense aerospace industry. Each sourcehas its own strengths and weaknesses, but the perspectives theyprovide fall into three major categories:
______________ 2The survey covers all persons under the age of 76 who hold a doctorate in science orengineering from a U.S. institution, where “science” includes the social sciences andpsychology as well as the physical, information, and mathematical sciences.3For comparison purposes, the U.S. Bureau of the Census estimates that the propor-tion of non–U.S. citizens in the total U.S. population was 6.5 percent in March 2000(U.S. Department of Commerce, Bureau of the Census, 2000).4As far as we know, no comprehensive DoD databases relevant to these issues exist.

18 U.S. Government Policy and the Defense Aerospace Industry
• Production, consumption, and international trade in aerospaceproducts, both civil and military (e.g., the U.S. Department ofCommerce’s International Trade Administration [ITA] and theAerospace Industries Association [AIA]);5
• The production and international transfer of conventional ar-maments, including both aerospace and nonaerospace equip-ment (e.g., DoS, the International Institute for Strategic Studies[IISS], and the Stockholm International Peace Research Institute[SIPRI]);6
• Government expenditures on and procurement of products andservices related to national defense (e.g., AIA, DoS, IISS, NATO).
The data on aerospace products have the advantage of being specificto aerospace while also distinguishing between finished (or“complete”) products and production inputs.7 This is important be-cause a growing number of cross-border transactions involve theoutsourcing of production inputs to unrelated foreign suppliers aswell as shipments between the internationally located business unitsof the same firm (Hummels et al., 2001; Fernald and Greenfield,2001). This vertical specialization of trade—or “intra-industry”trade—raises complex national security issues when applied to de-fense industries, but unfortunately breakouts for civil and militaryaerospace products are not always available. Shipment data, for ex-ample, distinguish between complete civil and military aircraft butnot between civil and military engines or aircraft parts.
Another major problem with most aerospace data is that they cap-ture only inputs formally classified within the “aerospace” categoriesof the U.S. Standard Industrial Classification (SIC) system or the
______________ 5ITA and AIA provide data to each other; both also get data from the Bureau of theCensus, U.S. Department of Commerce.6The Bureau of Verification and Compliance within DoS now issues World MilitaryExpenditures and Arms Transfers. The U.S. Arms Control and Disarmament Agency,which has merged with DoS, issued previous editions.7Finished aerospace products include fixed-wing aircraft, helicopters, and space ve-hicles, while inputs range from commodity goods such as tubes, pipes, and hoses tomore specialized equipment such as launching gear and gas turbine engines for air-craft. These data cover only merchandise goods, which is unfortunate because tradein engineering and other technical services is likely to be an important feature ofaerospace industry globalization.
The U.S. Defense Aerospace Industry: How Globalized Is It? 19
North American Industrial Classification System (NAICS).8 Com-modity inputs such as many types of fasteners and hoses are notincluded. Even more problematic from a policy perspective is thefact that certain high-cost, high-technology inputs to the aerospaceindustry also cannot be analyzed using published ITA data. Radar,navigation, and guidance systems, for example, all fall within thenon-aerospace-specific category “search and navigation equipment”and thus are not analyzed here.
The data on conventional arms production and transfers have theadvantage of being specific to defense, and although they are notspecific to aerospace, they are dominated by it.9 The three sourceswe analyze differ slightly in their coverage. SIPRI collects data onmajor conventional weapon systems that are voluntarily transferredfrom one country to the armed forces, paramilitary forces, or intelli-gence agencies of another country.10 Weapon systems covered in-clude complete aircraft, armored vehicles, artillery, radar systems,missiles, and ships. DoS and IISS add small arms, ammunition andother ordnance, uniforms, some dual-use equipment, and somemilitary services to this definition but do not include the value ofarms obtained by subnational groups.11 IISS’s figures for the UnitedStates derive from DoS, but its export figures are often higher be-cause of generally higher estimates of U.S. direct commercial sales(IISS, 2000, p. 288). No data on trade in inputs to weapon systemproduction are publicly available.
The data on aerospace production and consumption, defense ex-penditures, and government procurement provide a context for thetrade and transfer data. Specifically, they allow us to establish the
______________ 8The NAICS formally replaced the SIC system in 1997.9According to SIPRI (2000), for example, eight of the world’s top ten arms-producingcompanies ranked by 1998 sales were involved in the production of aircraft or missilesor both.10As described in a report by SIPRI (2001), “This includes weapons deliveredillegally—without proper authorization by the government of the supplier or recipientcountry—but excludes captured weapons and weapons obtained through defectors.”SIPRI data are obtained from open sources rather than directly from governments.11See DoS (April 2000, p. 205) for a fuller description of the items these two sourcesdefine as conventional arms.
20 U.S. Government Policy and the Defense Aerospace Industry
significance of foreign suppliers and markets relative to U.S. suppli-ers and markets for U.S. defense aerospace firms.
The sources for data on aerospace products use standard definitionsof merchandise exports and imports: Exports are shipments to andimports are shipments from firms or units of firms located across anational border, including both complete products and intermediateinputs. The nationalities of particular buyers and sellers are irrele-vant; for example, U.S. exports consist of all shipments from theUnited States to destinations outside the United States, and U.S. im-ports are all shipments to the United States from sources outside theUnited States. The sources for conventional armament data gener-ally refer to “transfers” and “deliveries” rather than to “trade” and“shipments” because they include aid and gifts as well as commercialsales (SIPRI, 2001). The terms “export” and “import” are sometimesused with respect to arms transfers, but these data do not capture allcross-border sales related to the weapon industry. Rather, theycapture the narrower set of finished-product transactions that in-volve suppliers and recipients of different nationalities.
A distinguishing feature of international trade in defense aerospaceis that so much of it is governed by “offset” agreements—that is, byconditions negotiated by foreign governments with U.S. companiesseeking to export major systems to their countries (PresidentialCommission on Offsets in International Trade, 2001).12 Commontypes of defense offset transactions, which are almost always de-signed to benefit national firms in the recipient country, include thefollowing:
• Subcontracts related to the manufacture and assembly of systemparts and components;
• Licensed coproduction of the system;
• Counterpurchases of unrelated goods;
• Related or unrelated technology transfers and training;
• Related or unrelated credit transfers; and
______________ 12Much less is known about the nature and extent of commercial, as opposed to de-fense, offsets because there is no government requirement for reporting them.
The U.S. Defense Aerospace Industry: How Globalized Is It? 21
• Related or unrelated investment.
According to data collected by the Commerce Department’s Bureauof Export Administration (BXA), between 1980 and 1998 the value ofdefense offset agreements ranged from 34 to 98 percent of total de-fense export sales.13 According to the Presidential Commission onOffsets in International Trade (2001), 89 percent of defense offsets(measured by value) from 1993 to 1998 were associated withaerospace exports. Offset agreements complicate the analysis of de-fense aerospace industry globalization because they induce U.S.firms to engage in cross-border transactions in which they might nototherwise elect to participate. In particular, U.S. investment in for-eign aerospace firms is likely to be larger than it would be were off-sets not so prevalent. It is likely that U.S. aerospace exports benefitconsiderably from offset arrangements.
Defense Aerospace Investment
Statistical data relevant to the international investment activities andbusiness relationships of U.S. defense aerospace firms are evenscarcer than data on their cross-border trade. In this report, wemake use of publicly available data from four sources:
• Economy-wide data on cross-border investment activity involv-ing U.S. firms (e.g., the U.S. Department of Commerce’s Bureauof Economic Analysis [BEA]);
• Data on domestic and international M&As involving U.S. firms(Mergerstat);
• Data on foreign acquisitions of U.S. defense firms (Ciardello,2001); and
• Data on U.S. industry involvement in defense acquisition pro-grams worldwide (Bitzinger, 1999).
______________ 13The “value” of defense offset transactions is measured as the amount of offset creditawarded to U.S. exporters by the nations receiving the offsets. It generally does notrepresent an actual cost to the exporter. See Presidential Commission on Offsets inInternational Trade (2001, pp. 6–8).

22 U.S. Government Policy and the Defense Aerospace Industry
The first data source provides official U.S. government estimates offoreign direct investment in the United States and U.S. direct in-vestment abroad, spanning all industries and sectors, includingnonmanufacturing sectors such as agriculture and services. Thesedata provide useful benchmark statistics to which the investmentactivities of defense aerospace firms may be compared, but the pub-lished industry breakdowns are too broad to offer any further in-sights.
The second source consists of privately collected data on domesticand international M&As involving U.S. firms. M&As, defined below,represent a subset of investment activities that have particularsignificance for the Air Force because they involve changes inownership and thus control. Once again, the publicly available datafrom these sources are not specific either to defense or to aerospace,but they provide a useful benchmark.14
Ciardello (2001) reports the number of foreign acquisitions, mergers,and takeovers reviewed by the Committee on Foreign Investment inthe United States (CFIUS) under the Exon-Florio Amendment to theDefense Production Act of 1950. Exon-Florio requires that restric-tions be imposed on foreign acquisitions, mergers, or takeovers thathave the potential to threaten U.S. national security. Notification ofproposed transactions to CFIUS is provided voluntarily by the partiesconcerned.15 Threats to national security are broadly defined to in-clude threats to U.S. technology leadership as well as threats to theU.S. domestic industry’s capability and capacity to meet nationaldefense requirements (see Chapter Four), but Ciardello focuses oncases that are defense-related.
Finally, the Defense Budget Project’s (DBP’s) GlobalizationDatabase, described in Bitzinger (1999), provides a perspective ondefense-related cross-border investment that comes close to ourown. Covering the period 1961 to 1995, the DBP database containstwo types of information: a classification and listing of cross-borderdefense acquisition programs and activities, and a classification and
______________ 14Mergerstat does offer limited data on aerospace-related M&A activity for a fee.15CFIUS member agencies may also refer proposed transactions to the committeethat they perceive as posing a possible threat to national security (U.S. Department ofthe Treasury, undated).

The U.S. Defense Aerospace Industry: How Globalized Is It? 23
listing of the types of cross-border business relationships that havebeen formed to carry out those programs and activities.16 Breakoutsby system type—including aircraft and guided missiles—are pro-vided. The database also distinguishes industry-initiated relation-ships from government-initiated arrangements in which firms ofdifferent nationalities share R&D and/or production responsibilities,usually in proportion to the financial contributions of their respec-tive governments.
The U.S. Department of Commerce’s BEA as well as Mergerstat andCiardello (2001) all use definitions that derive from U.S. governmentsources.17 According to U.S. official usage, for example, the term di-rect investment—which implies a degree of operational involvementin a firm’s operation—requires an ownership stake of at least 10 per-cent of the voting securities of an incorporated business enterprise oran equivalent interest in an unincorporated business enterprise.18
This quantitative criterion applies both to foreign direct investmentin the United States and to U.S. direct investment abroad. By defini-tion, a foreign affiliate is a foreign business in which there is U.S. di-rect investment; a U.S. affiliate is a U.S. business in which there isforeign direct investment. A majority-owned foreign affiliate hascombined ownership by all U.S. parents of over 50 percent; the samepercentage criterion applies to the U.S. affiliates of foreign parents.
Both internationally and domestically, one company’s establishmentof a controlling interest in another company is called an“acquisition”; the company acquired is often called a “subsidiary.”In most cases, U.S. firms’ foreign subsidiaries are also technicallytheir foreign affiliates and vice versa. In cases where 10 percentownership does not confer a controlling interest, however, an affili-ate is not also a subsidiary, and where less than 10 percent does, a
______________ 16Unfortunately, the DBP database does not always distinguish between these twotypes of information. Although the DBP database includes the cross-border activitiesof and relationships among a global spectrum of defense firms, we are interested onlyin those that involve U.S. firms.17U.S. usage of investment vocabulary is not uniformly consistent with that of othercountries. For an overview of key U.S. terms, see BEA (2000a, p. 58).18In the United States, anything below the 10 percent threshold constitutes portfolioinvestment. In some other countries, however, foreigners must own 25 percent of thevoting stock before their investment is termed “direct.”

24 U.S. Government Policy and the Defense Aerospace Industry
subsidiary is not also an affiliate. In the case where a single companypurchases 100 percent of another company’s voting stock, the com-pany that has been taken over is called a “wholly owned subsidiary”of the purchasing company. A merger is a special type of acquisitionin which two companies become one by exchanging shares.1 9
Measures of cross-border direct investment are usually larger thanmeasures of cross-border M&As because the former include the con-tinuing flow of equity, debt, and reinvested earnings between parentsand their already established foreign affiliates.
While the term direct investment implies some degree of managerialcontrol or operational involvement, it does not speak to the nature orintent of the business relationship that generated the investment. A10 percent stake may allow a firm to create or participate in a varietyof enterprises for a variety of reasons, ranging from a joint venturethat targets a specific product to a wholly owned foreign subsidiarythat targets an entire market segment. Further, there are many ac-tivities or programs, including simple cross-border trade, that couldin theory be conducted within a particular business relationship.
Of special interest, therefore, is our fourth data source, the DBPGlobalization Database, which lists international cooperative activi-ties and business relationships formed specifically for the purpose ofdeveloping and/or producing major weapon systems and compo-nents. Unfortunately, this database does not contain financial orcost information on the programs it lists, and it does not always dis-tinguish the activities of firms—such as selling the rights to one firmto assemble or manufacture a weapon system that a different firmhas developed—from their relationships, such as that between aprime and its subcontractors or between the parent companies in ajoint venture. As a result, the DBP database cannot be used either tocompare the relative importance (by value) of alternative businessarrangements and activities or to determine which types of businessrelationships have most often been associated with which types ofactivities. Nevertheless, as far as we know it is the only source thatprovides quantitative evidence of the increasingly “global” as op-
______________ 19Mergers between companies located across national borders often result in thecreation of a wholly owned subsidiary in the home country of one of the original com-panies.

The U.S. Defense Aerospace Industry: How Globalized Is It? 25
posed to “international” character of the U.S. defense aerospaceindustry.
A Typology of Defense Aerospace Activities and Relationships
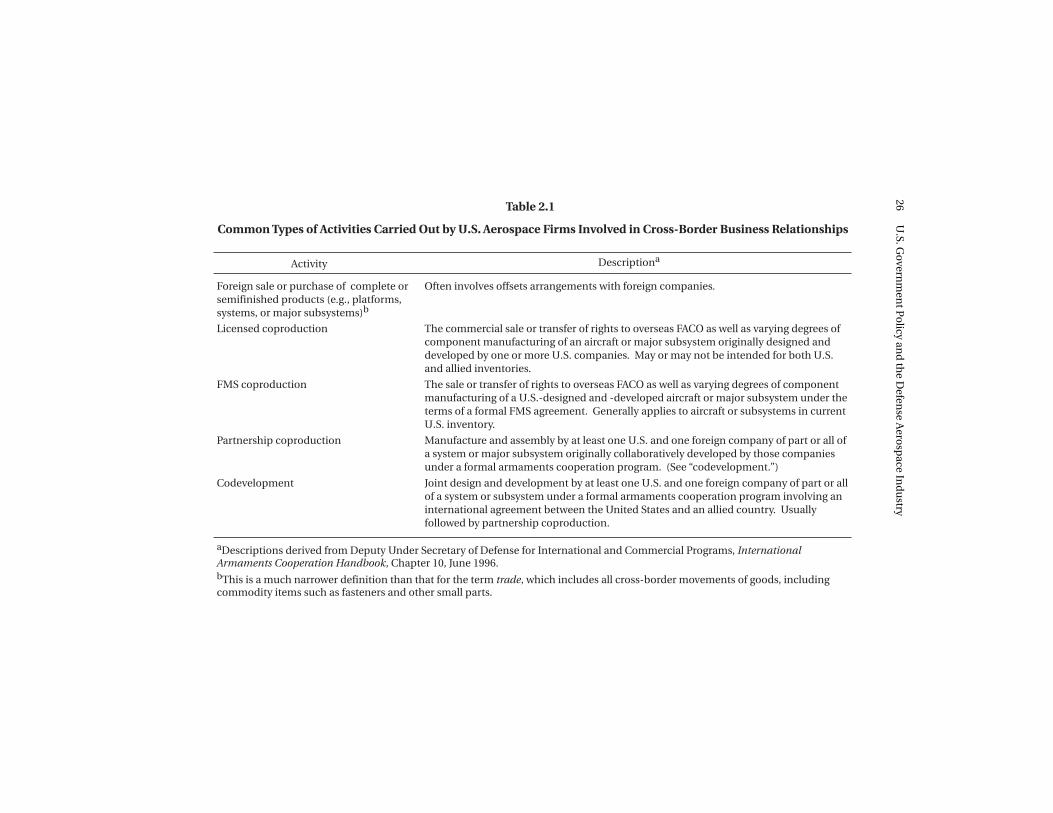
To better understand recent globalization trends in the defenseaerospace industry and the role played by legislation, policy, andguidance in shaping those trends, we have developed a typology thatdistinguishes between the joint or cooperative activities of firms lo-cated across national borders and the business relationships theyestablish in order to facilitate those activities. For our purposes, themost relevant activities carried out by U.S. defense aerospace firmsare those shown in Table 2.1, which borrows terminology from theInternational Armaments Cooperation Handbook (Deputy UnderSecretary of Defense for International and Commercial Programs,1996).20 In brief, these are
• Cross-border shipments of platforms, systems, or major subsys-tems;
• Licensed coproduction;
• “Partnership” coproduction;21
• Foreign Military Sales (FMS) coproduction; and
• Codevelopment.
With respect to the export of finished equipment, an important issueis the extent to which system or subsystem subcontracts or other
______________ 20All of these activities can also include adapting, modifying, or upgrading existingcomplete or semifinished products.21We use the term partnership coproduction as opposed to cooperative production inorder to distinguish the former from other forms of cooperative production. Bothterms are defined in Chapter 19 of the International Armaments CooperationHandbook (Deputy Under Secretary of Defense for International and CommercialPrograms, 1996, p. x).
26U
.S. Go
vernm
ent P
olicy an
d th
e Defen
se Aero
space In
du
stry
Foreign sale or purchase of complete or semifinished products (e.g., platforms, systems, or major subsystems)b
Often involves offsets arrangements with foreign companies.
Licensed coproduction The commercial sale or transfer of rights to overseas FACO as well as varying degrees of component manufacturing of an aircraft or major subsystem originally designed and developed by one or more U.S. companies. May or may not be intended for both U.S. and allied inventories.
FMS coproduction The sale or transfer of rights to overseas FACO as well as varying degrees of component manufacturing of a U.S.-designed and -developed aircraft or major subsystem under the terms of a formal FMS agreement. Generally applies to aircraft or subsystems in current U.S. inventory.
Partnership coproduction Manufacture and assembly by at least one U.S. and one foreign company of part or all of a system or major subsystem originally collaboratively developed by those companies under a formal armaments cooperation program. (See “codevelopment.”)
Codevelopment Joint design and development by at least one U.S. and one foreign company of part or all of a system or subsystem under a formal armaments cooperation program involving an international agreement between the United States and an allied country. Usually followed by partnership coproduction.
Activity Descriptiona
Table 2.1
Common Types of Activities Carried Out by U.S. Aerospace Firms Involved in Cross-Border Business Relationships
aDescriptions derived from Deputy Under Secretary of Defense for International and Commercial Programs, International Armaments Cooperation Handbook, Chapter 10, June 1996.bThis is a much narrower definition than that for the term trade, which includes all cross-border movements of goods, including commodity items such as fasteners and other small parts.

The U.S. Defense Aerospace Industry: How Globalized Is It? 27
offset agreements are involved.22 A key issue with respect to all ofthe activities is whether the equipment in question is intended forboth U.S. and allied inventories, thereby furthering equipmentstandardization and interoperability objectives.
All three forms of coproduction involve the transfer of rights to finalassembly and checkout (FACO) of U.S.-developed equipment to aforeign country. They are termed coproduction rather than produc-tion in order to emphasize their collaborative nature: Even forstraightforward licensing arrangements, it has rarely if ever been thecase that the developer of a system as complicated as a fighter jet hassold its FACO rights to a foreign company and simply walked away.Licensed coproduction differs from FMS coproduction in two key re-spects. First, licensed coproduction may or may not involve a systemor subsystem that is in the inventories of the U.S. armed services,while FMS coproduction always involves articles used by the U.S.armed services. This distinction is important because it relates to thecrucial question of equipment standardization and interoperabilitywith U.S. allies. Second, licensed coproduction involves a directcommercial sale from the developer; FMS coproduction arrange-ments are negotiated under the terms of an FMS Letter of Offer andAcceptance (LOA) issued by the U.S. government. Thus, with FMScoproduction the U.S. government formally handles the details forprocuring the equipment as an agent of the foreign government,thereby further promoting interaction and interoperability with anally. Partnership coproduction is a special type of coproduction thatrepresents the production phase of an international cooperative re-search, development, and acquisition (ICRD&A) agreement. The firstphase of an ICRD&A agreement is commonly referred to as codevel-opment. In partnership coproduction arrangements, FACO is gen-erally carried out in both of the participating countries. Partnershipcoproduction thus implies a qualitatively more profound level ofcollaboration, since both R&D and production are shared among twoor more allies.
These international collaborative activities can be supported by sev-eral different types of cross-border business relationships. As shown
______________ 22In cases where the offset required for the sale of a U.S.-developed system involvestransfer of rights to overseas FACO, the activity is classified as coproduction and not asa cross-border shipment.

28 U.S. Government Policy and the Defense Aerospace Industry
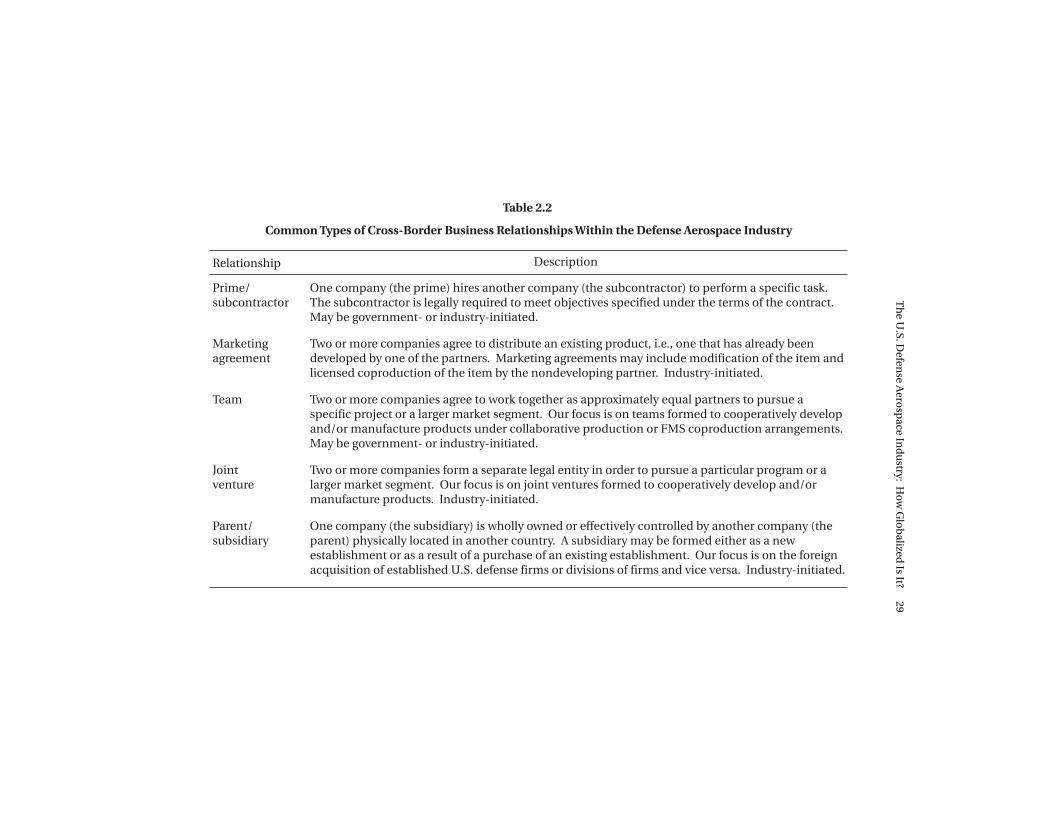
in Table 2.2, the most common relationships among defenseaerospace companies fall into the following categories:
• Prime/subcontractor;
• Marketing agreement;
• Team;
• Joint venture; and
• Parent/subsidiary.
All of the relationships are also more or less common among domes-tic firms within a purely national context.
Prime/subcontractor arrangements are traditional business relation-ships found throughout many industries. Under these arrange-ments, the system designer/integrator (the prime contractor) hiresother firms to manufacture—and, increasingly, to design and de-velop—particular subsystems and components. Primes possess finaldecisionmaking authority for the overall design, development, inte-gration, and (usually) final assembly of the aircraft and are responsi-ble for marketing the finished aircraft. Primes may choose to workwith foreign subcontractors for a number of reasons, but marketaccess considerations are often just as or more important to themthan cost considerations. Much of the international trade in defenseaerospace subsystems, parts, and components takes place betweensubcontractors and primes located across national borders.
In the international arena, marketing agreements represent a set ofarrangements whereby a firm in one country acquires the right tomarket and distribute a system or subsystem developed by a firm inanother country. International marketing agreements are often setup to allow foreign firms to access national markets in which legaland/or political conditions heavily favor domestic firms. These typesof agreements often involve significant modification of the originalsystem, either by the original developer or by the foreign marketer ofthe system, and tend to be carried out through licensed coproduc-tion. They are often industry-initiated.
Teams are created when companies agree to work together to pursuea particular project or an entire market segment. An important char-
Th
e U.S. D
efense A
erosp
ace Ind
ustry: H
ow
Glo
balized
Is It?29
Prime/subcontractor
One company (the prime) hires another company (the subcontractor) to perform a specific task. The subcontractor is legally required to meet objectives specified under the terms of the contract. May be government- or industry-initiated.
Marketingagreement
Two or more companies agree to distribute an existing product, i.e., one that has already been developed by one of the partners. Marketing agreements may include modification of the item and licensed coproduction of the item by the nondeveloping partner. Industry-initiated.
Team Two or more companies agree to work together as approximately equal partners to pursue a specific project or a larger market segment. Our focus is on teams formed to cooperatively develop and/or manufacture products under collaborative production or FMS coproduction arrangements. May be government- or industry-initiated.
Jointventure
Two or more companies form a separate legal entity in order to pursue a particular program or a larger market segment. Our focus is on joint ventures formed to cooperatively develop and/or manufacture products. Industry-initiated.
Parent/subsidiary
One company (the subsidiary) is wholly owned or effectively controlled by another company (the parent) physically located in another country. A subsidiary may be formed either as a new establishment or as a result of a purchase of an existing establishment. Our focus is on the foreign acquisition of established U.S. defense firms or divisions of firms and vice versa. Industry-initiated.
Relationship Description
Table 2.2
Common Types of Cross-Border Business Relationships Within the Defense Aerospace Industry

30 U.S. Government Policy and the Defense Aerospace Industry
acteristic of teams—as opposed to, say, parent/subsidiary relation-ships—is that international teams are not formally subject to CFIUSreview (see Chapter Four).23 Teams formed to target entire marketsegments are sometimes called “strategic alliances.” Decision-making authority within teams is shared; who decides what and howdepends on rules established by the team members or, if the teamwas initiated by governments, sometimes by the participatinggovernments. We are most interested in teams that are formed forpurposes of codevelopment and partnership coproduction or forFMS coproduction.
Finally, international subsidiaries and joint ventures are each createdwhen a parent company in one country either acquires an existingforeign firm or establishes a new affiliate in a foreign country—or, inother words, engages in direct investment abroad. For many but notall legal purposes, both subsidiaries and joint ventures are indepen-dent entities from the parent companies that control them. In thepast, international joint ventures were generally formed in order totarget specific weapon system programs; more recently they also ap-pear to serve as “test runs” for the potential merger of their parentcompanies. Foreign subsidiaries are established or acquired for anumber of reasons, including access to foreign technology, access toa foreign market, and economies of scope and scale. Although jointventures and parent/subsidiary relationships are both industry-initi-ated, a key difference between them is the nature of managementcontrol. While subsidiaries are controlled by a single parent, jointventures must answer to two. Because corporate parents can haveconflicting—or just different—goals and priorities, joint venturesfrequently do not have a long life-span.
______________ 23It is sometimes difficult to distinguish between teams and more formalprime/subcontractor relationships. On the JSF program, for example, NorthropGrumman and BAE Systems are formally subcontractors but are often described aspart of a Lockheed-led team.
The U.S. Defense Aerospace Industry: How Globalized Is It? 31
U.S. TRADE IN AEROSPACE AND ARMS: STATISTICALEVIDENCE
Trade in Aerospace Products: A Statistical Snapshot
In absolute terms, according to AIA (2000), U.S. exports of aerospaceproducts in 1999 totaled just over $62 billion, while imports stood atless than half that amount, at $25 billion. The export orientation ofU.S. aerospace producers is evident when exports and imports aremeasured in relation to total U.S. production and apparentconsumption of aerospace products: Between 1997 and 1999, U.S.aerospace exports on average accounted for roughly 44 percent oftotal U.S. aerospace product shipments, while U.S. aerospaceimports accounted for roughly 22 percent of all U.S. aerospaceconsumption (ITA, 2000).24 As shown in Figure 2.1, compared withseveral other high-technology and manufacturing industries over thesame period, the difference between import and export shares placesthe aerospace industry squarely at the export-dependent end of thespectrum.
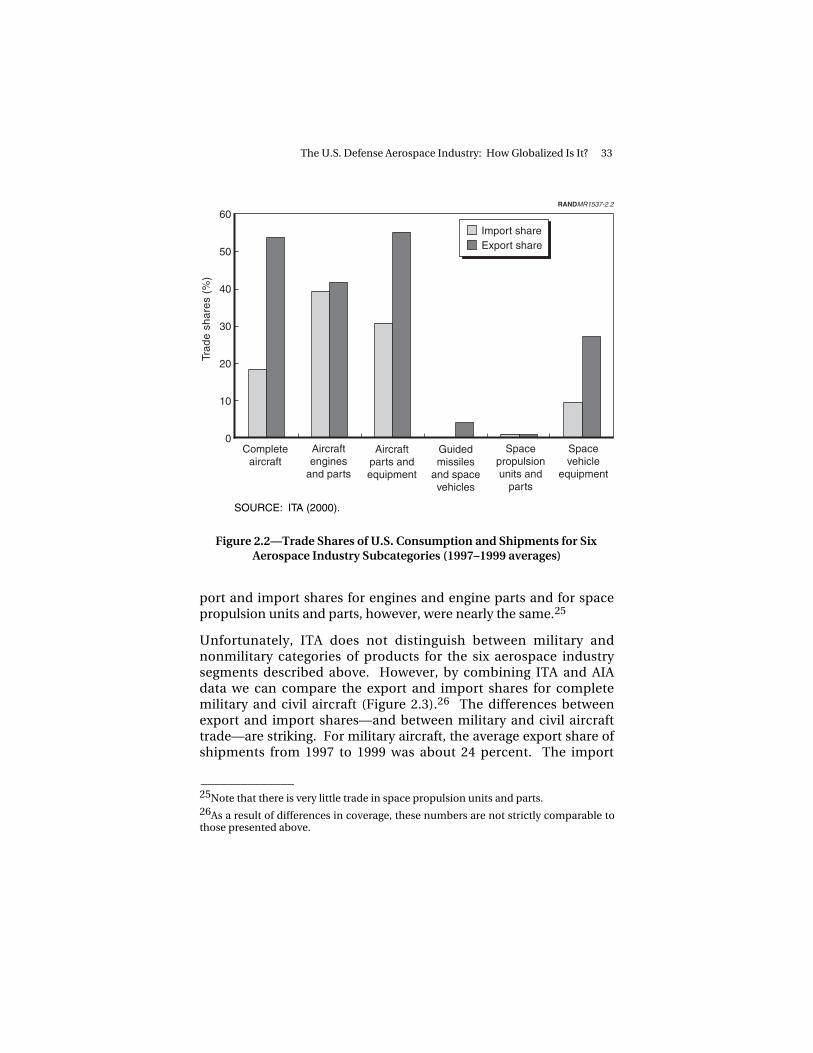
More detailed data, however, reveal some divergence within the in-dustry. ITA (2000) divides the U.S. aerospace industry into sixsegments:
• Complete aircraft, accounting for about 47 percent of all U.S.aerospace shipments by value in 1999;
• Aircraft engines and their parts, accounting for about 18 percentof shipments;
• Aircraft parts and equipment, accounting for about 20 percent ofshipments;
• Guided missiles and finished space vehicles, accounting forabout 11 percent of shipments;
• Space propulsion units and parts, accounting for about 3 percentof shipments; and
______________ 24Following the ITA, export dependence ratios are calculated by dividing exports bytotal shipments (production), while import penetration ratios are derived by dividingimports by “apparent consumption”—that is, by the sum of total shipments and totalimports less total exports.

32 U.S. Government Policy and the Defense Aerospace Industry
SOURCE: ITA (2000).
RANDMR1537-2.1
Import shareExport share
Tra
de s
hare
s (%
)
Aer
ospa
ce
Mea
surin
g an
dco
ntro
lling
dev
ices
Med
ical
inst
rum
ents
Tel
ecom
mun
icat
ion
and
navi
gatio
n eq
uipm
ent
Pro
duct
ion
mac
hine
ry
Ele
ctric
al e
quip
men
tan
d tu
rbin
es
Aut
omot
ive
part
s
Gen
eral
com
pone
nts
Mic
roel
ectr
onic
s
Hou
seho
ld a
pplia
nces
Mac
hine
tool
s
Pho
togr
aphi
ceq
uipm
ent
Com
pute
rs a
ndpe
riphe
rals
Mot
or v
ehic
les
and
bodi
es
45
40
35
30
25
20
15
10
5
0
50
Figure 2.1—Trade Shares of U.S. Consumption and Shipments for SelectedManufacturing Industries (1997–1999 averages)
• Space vehicle equipment, accounting for about 2 percent ofshipments.
As shown in Figure 2.2, between 1997 and 1999 the average differ-ence between export and import shares was widest for complete air-craft, where the export share of product shipments was about 54 per-cent and the import share of consumption about 18 percent. Theexport and import shares for aircraft parts and equipment, spacevehicle equipment, and guided missiles and space vehicles also di-verged significantly, with the export shares all much higher. The ex-
The U.S. Defense Aerospace Industry: How Globalized Is It? 33
Trad
e sh
ares
(%
)
SOURCE: ITA (2000).
60
50
40
30
20
10
0
Import shareExport share
RANDMR1537-2.2
Completeaircraft
Aircraftengines
and parts
Aircraftparts andequipment
Guidedmissiles
and spacevehicles
Spacepropulsionunits and
parts
Spacevehicle
equipment
Figure 2.2—Trade Shares of U.S. Consumption and Shipments for SixAerospace Industry Subcategories (1997–1999 averages)
port and import shares for engines and engine parts and for spacepropulsion units and parts, however, were nearly the same.25
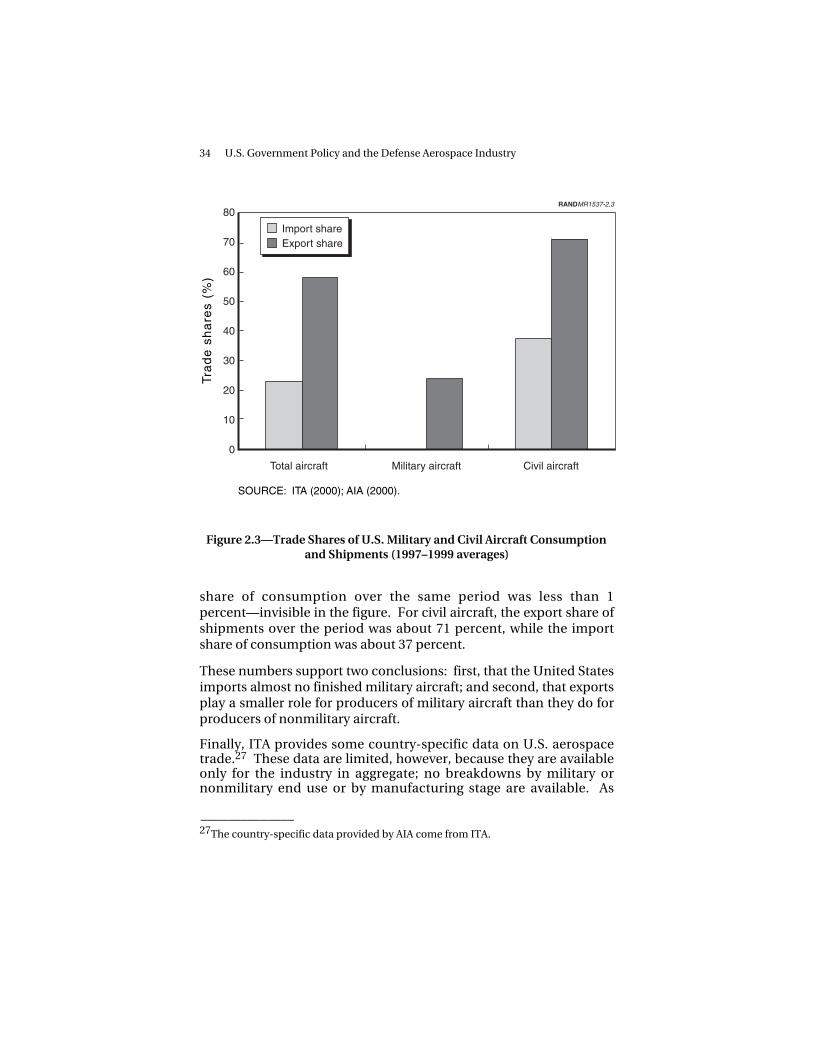
Unfortunately, ITA does not distinguish between military andnonmilitary categories of products for the six aerospace industrysegments described above. However, by combining ITA and AIAdata we can compare the export and import shares for completemilitary and civil aircraft (Figure 2.3).26 The differences betweenexport and import shares—and between military and civil aircrafttrade—are striking. For military aircraft, the average export share ofshipments from 1997 to 1999 was about 24 percent. The import
______________ 25Note that there is very little trade in space propulsion units and parts.26As a result of differences in coverage, these numbers are not strictly comparable tothose presented above.
34 U.S. Government Policy and the Defense Aerospace Industry
SOURCE: ITA (2000); AIA (2000).
Import shareExport share
RANDMR1537-2.3Tr
ad
e s
ha
res
(%)
80
70
60
50
40
30
20
10
0
Total aircraft Civil aircraftMilitary aircraft
Figure 2.3—Trade Shares of U.S. Military and Civil Aircraft Consumptionand Shipments (1997–1999 averages)
share of consumption over the same period was less than 1percent—invisible in the figure. For civil aircraft, the export share ofshipments over the period was about 71 percent, while the importshare of consumption was about 37 percent.
These numbers support two conclusions: first, that the United Statesimports almost no finished military aircraft; and second, that exportsplay a smaller role for producers of military aircraft than they do forproducers of nonmilitary aircraft.
Finally, ITA provides some country-specific data on U.S. aerospacetrade.27 These data are limited, however, because they are availableonly for the industry in aggregate; no breakdowns by military ornonmilitary end use or by manufacturing stage are available. As
______________ 27The country-specific data provided by AIA come from ITA.

The U.S. Defense Aerospace Industry: How Globalized Is It? 35
shown in Table 2.3, the top export market for U.S. aerospace prod-ucts in 1998 was the United Kingdom, followed by Japan, SaudiArabia, France, and Germany. With respect to imports, the topsupplier to the U.S. market in 1998 was France; the UK, Canada,Japan, and Germany round out the top five.28
Trade in Conventional Arms: A Statistical Snapshot
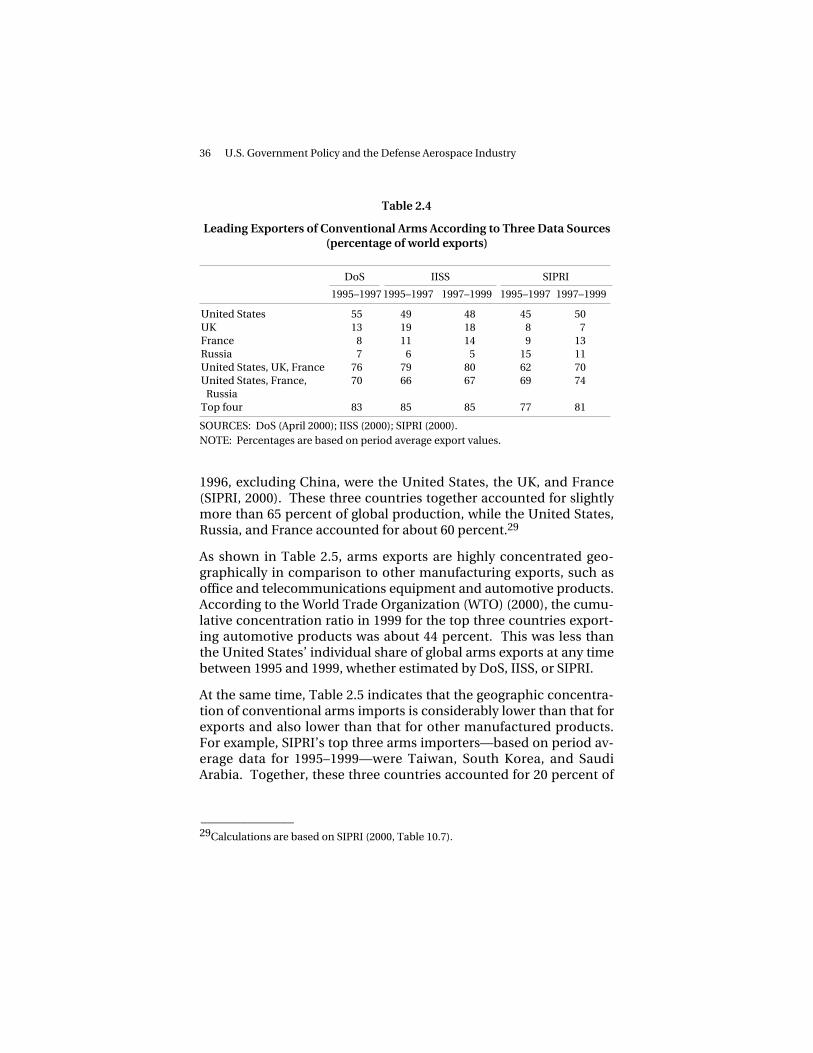
The three primary sources of data on the global arms market (that is,conventional arms production and transfers) all agree that theUnited States is the world’s leading exporter and producer of con-ventional arms (Table 2.4). Between 1995 and 1999, U.S. producersaccounted for roughly half of all world exports and about the sameshare of world production. The top four exporting countries—theUnited States, the UK, France, and Russia—accounted for between75 and 85 percent of the global market, depending on the data sourceand time period chosen. Delivery data for 1997–1999 from IISS, forexample, identify the world’s top three exporters as the UnitedStates, UK, and France, together accounting for about 80 percent ofall conventional arms exports over that period (IISS, 2000). The topexporters were also the top producers overall: SIPRI finds, forexample, that the world’s three largest arms-producing countries in
Table 2.3
U.S. Trade Patterns in Aerospace, 1998
Exports Imports
Value($M)
Share(%)
Value($M)
Share(%)
United Kingdom 7248 12 France 5539 25Japan 5922 10 United Kingdom 4635 21Saudi Arabia 4946 8 Canada 4445 20France 4100 7 Japan 1878 8Germany 4048 7 Germany 1841 8Top five 26,264 44 Top five 18,338 82
SOURCES: ITA (2000); AIA (2000).
______________ 28France’s position as the top exporter of aerospace products to the United States isprobably due to shipments of commercial transports. Airbus Industries’ primaryassembly plant is located in Toulouse.
36 U.S. Government Policy and the Defense Aerospace Industry
Table 2.4
Leading Exporters of Conventional Arms According to Three Data Sources(percentage of world exports)
DoS IISS SIPRI
1995–1997 1995–1997 1997–1999 1995–1997 1997–1999
United States 55 49 48 45 50UK 13 19 18 8 7France 8 11 14 9 13Russia 7 6 5 15 11United States, UK, France 76 79 80 62 70United States, France,
Russia70 66 67 69 74
Top four 83 85 85 77 81
SOURCES: DoS (April 2000); IISS (2000); SIPRI (2000).NOTE: Percentages are based on period average export values.
1996, excluding China, were the United States, the UK, and France(SIPRI, 2000). These three countries together accounted for slightlymore than 65 percent of global production, while the United States,Russia, and France accounted for about 60 percent.29
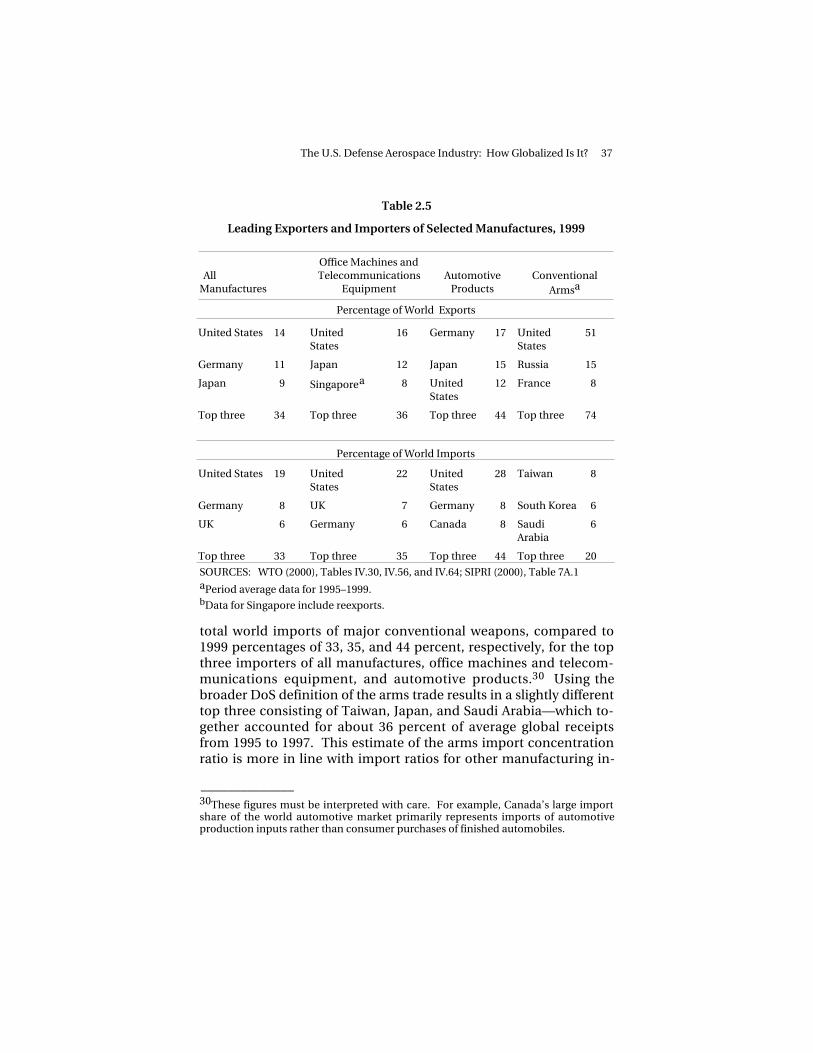
As shown in Table 2.5, arms exports are highly concentrated geo-graphically in comparison to other manufacturing exports, such asoffice and telecommunications equipment and automotive products.According to the World Trade Organization (WTO) (2000), the cumu-lative concentration ratio in 1999 for the top three countries export-ing automotive products was about 44 percent. This was less thanthe United States’ individual share of global arms exports at any timebetween 1995 and 1999, whether estimated by DoS, IISS, or SIPRI.
At the same time, Table 2.5 indicates that the geographic concentra-tion of conventional arms imports is considerably lower than that forexports and also lower than that for other manufactured products.For example, SIPRI’s top three arms importers—based on period av-erage data for 1995–1999—were Taiwan, South Korea, and SaudiArabia. Together, these three countries accounted for 20 percent of
______________ 29Calculations are based on SIPRI (2000, Table 10.7).
The U.S. Defense Aerospace Industry: How Globalized Is It? 37
Table 2.5
Leading Exporters and Importers of Selected Manufactures, 1999
AllManufactures
Office Machines andTelecommunications
EquipmentAutomotive
ProductsConventional
Armsa
Percentage of World Exports
United States 14 UnitedStates
16 Germany 17 UnitedStates
51
Germany 11 Japan 12 Japan 15 Russia 15
Japan 9 Singaporea 8 UnitedStates
12 France 8
Top three 34 Top three 36 Top three 44 Top three 74
Percentage of World Imports
United States 19 UnitedStates
22 UnitedStates
28 Taiwan 8
Germany 8 UK 7 Germany 8 South Korea 6
UK 6 Germany 6 Canada 8 SaudiArabia
6
Top three 33 Top three 35 Top three 44 Top three 20
SOURCES: WTO (2000), Tables IV.30, IV.56, and IV.64; SIPRI (2000), Table 7A.1aPeriod average data for 1995–1999.bData for Singapore include reexports.
total world imports of major conventional weapons, compared to1999 percentages of 33, 35, and 44 percent, respectively, for the topthree importers of all manufactures, office machines and telecom-munications equipment, and automotive products.30 Using thebroader DoS definition of the arms trade results in a slightly differenttop three consisting of Taiwan, Japan, and Saudi Arabia—which to-gether accounted for about 36 percent of average global receiptsfrom 1995 to 1997. This estimate of the arms import concentrationratio is more in line with import ratios for other manufacturing in-
______________ 30These figures must be interpreted with care. For example, Canada’s large importshare of the world automotive market primarily represents imports of automotiveproduction inputs rather than consumer purchases of finished automobiles.

38 U.S. Government Policy and the Defense Aerospace Industry
dustries but is still significantly lower than any of the estimated geo-graphic concentration ratios for arms exports.
For the United States, the combined share for the top three exportdestinations identified by SIPRI—which also happen to be Taiwan,South Korea, and Saudi Arabia—averaged roughly 38 percent be-tween 1995 and 1999. If treated as a single entity, the EuropeanUnion accounted for 22 percent of all U.S. deliveries over this pe-riod—a surprisingly low figure given America’s historical focus onpromoting transatlantic NATO equipment standardization and in-teroperability through collaborative programs and exports. Thebroader DoS estimates place Saudi Arabia, Taiwan, and Japan as thetop three destinations for U.S. arms exports from 1995 to 1997.According to DoS, these three countries accounted for approximately37 percent of U.S. deliveries to foreign countries (DoS, April 2000).
In contrast to its critical role as a major exporter of conventionalarms, the United States plays a relatively modest role as an importer.From 1995 to 1997, the United States accounted for no more than 3percent of the world’s imports on average (DoS, Bureau ofVerification and Compliance, 2000). Yet over the same period, theUnited States accounted for about 34 percent of the world’s totaldefense expenditures. Unfortunately, the U.S. share of globalweapon procurement—a more accurate measure of the demand forconventional arms—is unclear because reliable worldwide data onweapon procurement are unavailable.31 Between 1997 and 1999,however, the U.S. share of NATO’s total defense expenditures and itsshare of budgeted equipment procurement were both roughly equalto 60 percent, while the United States accounted for no more thanabout 14 percent of NATO’s total arms imports (IISS, 2000); NATO,2000b; DoS, April 2000).32
Those weapon systems that are bought by the United States appearto come mostly from European NATO allies and non-NATO WesternEurope. SIPRI does not provide geographic breakdowns for U.S.receipts of arms from abroad, but according to DoS, European NATO
______________ 31Data on defense expenditures are an inexact proxy for procurements because theycover a broad range of nonprocurement activities.32SIPRI (2000) puts the U.S. share of NATO imports at about 12 percent for the period1995–1997 but drops it to 7.3 percent on average from 1997 to 1999.
The U.S. Defense Aerospace Industry: How Globalized Is It? 39
allies plus non-NATO Western Europe accounted for roughly three-quarters of all U.S. imports from 1997 to 1999. The UK aloneaccounted for almost 30 percent of total U.S. arms receipts. Exportsto the United States amounted to about 7 percent of European andNATO countries’ total arms exports over the 1997–1999 period; in thecase of the UK, the United States accounted for 10 percent of totaltransfers. Nevertheless, one European government agency estimatesthat between 1995 and 1999, the value of U.S. defense exports toEurope was more than eight times greater than the value ofEuropean exports to the United States.33
INTERNATIONAL INVESTMENT INVOLVING U.S. FIRMS:STATISTICAL EVIDENCE
Broad Trends in International Investment Activity
A number of data sources help place cross-border investment involv-ing aerospace firms in the broader context of the global economyand defense-related industries. According to BEA (July 2001), in 1999the U.S. affiliates of foreign companies accounted for a record 6.4percent of total private-industry gross domestic product (GDP), con-tinuing a four-year upward trend.34 Direct investment inflows—which include equity, debt, and reinvested earnings flows to existingaffiliates as well as investments in new acquisitions—were strong, in-creasing by 25 percent between 1999 and 2000.35 Foreign companiesand their U.S. affiliates increased their outlays for new and existingU.S. businesses by 17 percent over the same period. This unprece-dented level of foreign spending to establish or acquire U.S. busi-nesses is consistent with a worldwide increase in M&A activity inwhich U.S. firms were both the leading purchasers and the leadingsellers (BEA, June 2001; KPMG, 2001).36
______________ 33This estimate was provided to the authors from a British Ministry of Defence official.34See BEA (August 2001, p. 141) for details on the calculation methodology for private-industry GDP.35Estimated on a current cost basis. See BEA (July 2001, p. 7) for definitions.36A KPMG finance survey suggests that for the decade of the 1990s, the United Statesaccounted for about 22 percent of the value of all cross-border purchases of compa-nies and 30 percent of the value of all cross-border sales (KPMG, 2001).

40 U.S. Government Policy and the Defense Aerospace Industry
By country of ultimate beneficial owner, BEA (June 2001) reports thatEuropean investors accounted for 75 percent of total outlays to ac-quire or establish U.S. businesses in 1998–2000. British investors ledthe pack, spending more than three times as much as investors fromthe country with the next-largest outlays, the Netherlands.37 In fact,British investors accounted for fully one-third of new direct invest-ment outlays over the period.
Strong financial ties between the United States and the UK are alsoevidenced in the data on U.S. direct investment abroad, where theUK is the destination of choice for many U.S. firms seeking foreignaffiliates. The UK was a focal point for new U.S. investment in 1998,accounting for about 18 percent of the number, 35 percent of the as-set value, and 32 percent of the sales of all newly acquired or estab-lished majority-owned foreign affiliates in 1998. According to BEA(2000b, pp. 33–34), the UK is favored by U.S. investors “because of itslanguage and its cultural similarities with the United States, its rela-tively low level of market regulation . . . and its duty-free access tocustomers in other member countries of the European Union.”Overall, total U.S. net financial outflows to all foreign affiliates wereat a near record in 2000, reflecting numerous large acquisitionsabroad. Net equity capital outflows (as opposed to intercompanydebt or reinvested earnings) represented roughly one-third of the to-tal (BEA, July 2001).
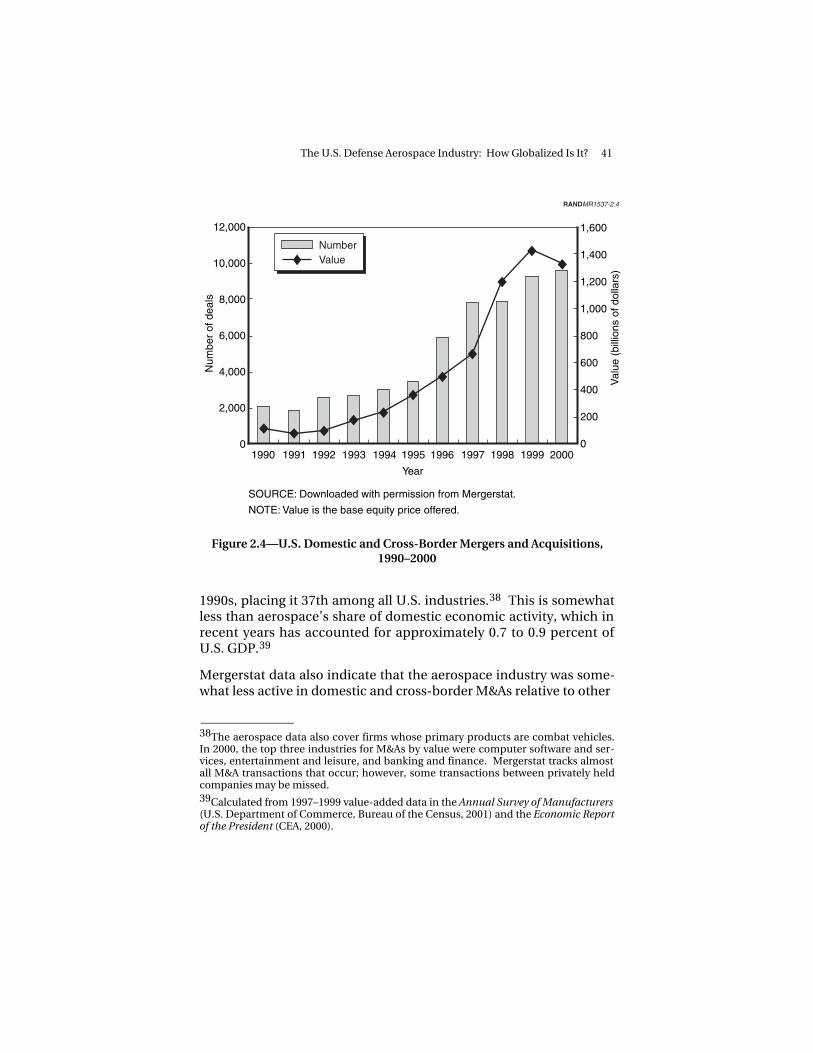
Mergerstat data point to an economy-wide increase in the M&A ac-tivities of all U.S. firms in terms of both numbers and value while alsoproviding some information on the activities of aerospace firms.Figure 2.4 shows the rise in U.S. overall domestic and cross-borderM&A activity over the past decade. According to Mergerstat, the U.S.aerospace industry accounted for less than one-quarter of a percentof the value of all U.S. domestic and cross-border M&As during the
______________ 37According to BEA (June 2001, p. 28), the “ultimate beneficial owner is that person,proceeding up a U.S. affiliate’s ownership chain, that is not owned more than 50percent by another person.”
The U.S. Defense Aerospace Industry: How Globalized Is It? 41
SOURCE: Downloaded with permission from Mergerstat.
NOTE: Value is the base equity price offered.
Year
12,000
10,000
8,000
6,000
4,000
2,000
0
1,600
1,400
1,200
1,000
800
600
400
200
01990 1991 1992 1993 1994 1995 1996 1997 1998 1999 2000
Num
ber
of d
eals
Val
ue (
billi
ons
of d
olla
rs)
NumberValue
RANDMR1537-2.4
Figure 2.4—U.S. Domestic and Cross-Border Mergers and Acquisitions,1990–2000
1990s, placing it 37th among all U.S. industries.38 This is somewhatless than aerospace’s share of domestic economic activity, which inrecent years has accounted for approximately 0.7 to 0.9 percent ofU.S. GDP.39
Mergerstat data also indicate that the aerospace industry was some-what less active in domestic and cross-border M&As relative to other
______________ 38The aerospace data also cover firms whose primary products are combat vehicles.In 2000, the top three industries for M&As by value were computer software and ser-vices, entertainment and leisure, and banking and finance. Mergerstat tracks almostall M&A transactions that occur; however, some transactions between privately heldcompanies may be missed.39Calculated from 1997–1999 value-added data in the Annual Survey of Manufacturers(U.S. Department of Commerce, Bureau of the Census, 2001) and the Economic Reportof the President (CEA, 2000).
42 U.S. Government Policy and the Defense Aerospace Industry
SOURCE: Downloaded with permission from Mergerstat.NOTE: Value is the base equity price offered.
NumberValue
RANDMR1537-2.5
180
160
140
120
100
80
60
40
20
0
Num
ber
of d
eals
Num
ber
of d
eals
Val
ue (
billi
ons
of d
olla
rs)
25
20
15
10
5
0
Aer
ospa
cean
d de
fens
e
Mot
or v
ehic
les
and
part
s
Ele
ctric
aleq
uipm
ent
Ele
ctro
nics
Hou
seho
ldap
plia
nces
Indu
stria
l and
farm
equ
ipm
ent
Inst
rum
ents
and
phot
ogra
phic
equ
ipm
ent
Com
pute
rs a
ndof
fice
equi
pmen
t
Oth
ertr
ansp
orta
tion
Figure 2.5—Domestic and Cross-Border Mergers and Acquisitions, SelectedU.S. Manufacturing Industries (1995–1999 averages)
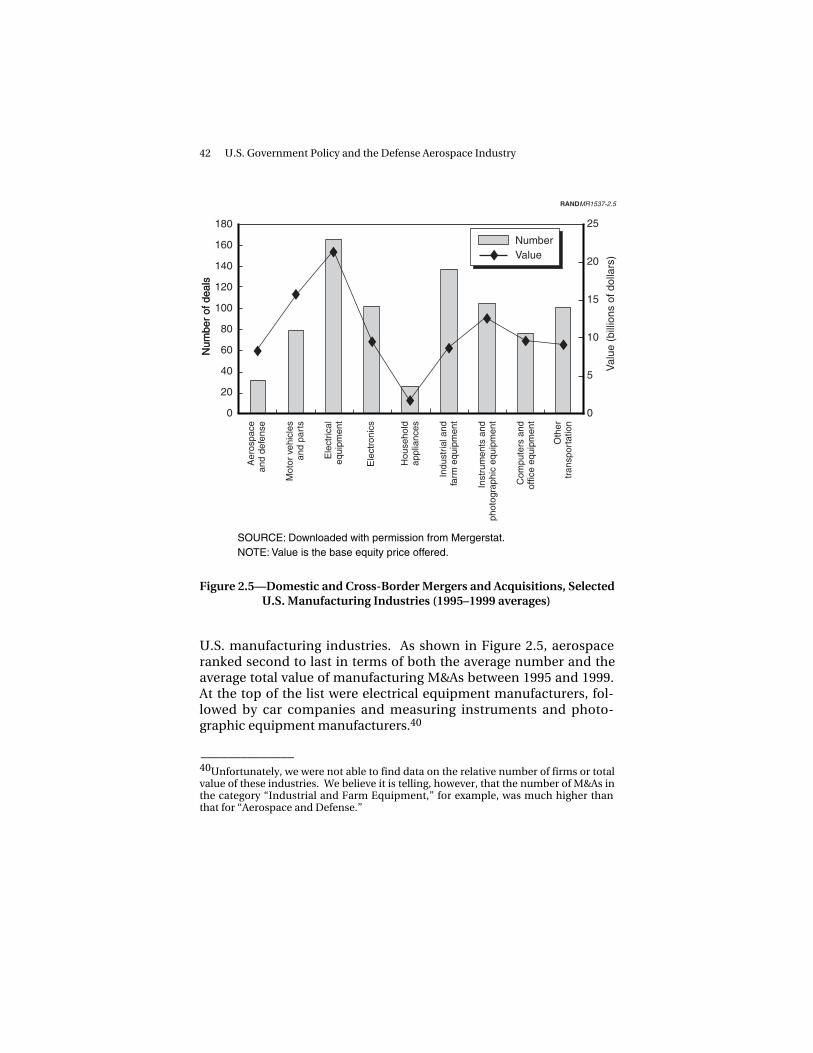
U.S. manufacturing industries. As shown in Figure 2.5, aerospaceranked second to last in terms of both the average number and theaverage total value of manufacturing M&As between 1995 and 1999.At the top of the list were electrical equipment manufacturers, fol-lowed by car companies and measuring instruments and photo-graphic equipment manufacturers.40
______________ 40Unfortunately, we were not able to find data on the relative number of firms or totalvalue of these industries. We believe it is telling, however, that the number of M&As inthe category “Industrial and Farm Equipment,” for example, was much higher thanthat for “Aerospace and Defense.”

The U.S. Defense Aerospace Industry: How Globalized Is It? 43
International Investment in Defense-Related Industries
In a recent DoD study, Ciardello (2001) provides information on asubset of defense-related, though not necessarily aerospace-related,foreign direct investment in the United States. The Ciardello datadistinguish between total and specifically “defense-related” casesfrom 1996 to 2000. Of 322 CFIUS cases filed and reviewed by DoDover the past five years, the data identify 235, or nearly three-quarters, as defense-related. As shown in Figure 2.6, the number ofcases reviewed has increased—though not dramatically—in recentyears. This probably points to an increase in the total number ofdefense-related foreign acquisitions.
Figure 2.7 shows the distribution of defense-related CFIUS casesfrom 1996 through 2000 for the top three countries of origin. Overthis five-year period, the UK, France, and the Netherlands accountedfor almost two-thirds of the cases. At about 46 percent of the total,Figure 2.7 shows the distribution of defense-related CFIUS casesfrom 1996 through 2000 for the top three countries of origin. Overthis five-year period, the UK, France, and the Netherlands accountedfor almost two-thirds of the cases. At about 46 percent of the total,the UK accounted for the largest number of cases, followed byFrance at roughly 12 percent and the Netherlands at approximately 6percent.
Ciardello (2001) also presents data on measures designed to elimi-nate possible security violations resulting from transactions that putU.S. firms under foreign ownership, control, or influence (FOCI).These measures, which are described in more detail in Chapter Four,mitigate foreign influence and control for companies performingU.S. classified work. As shown in Figure 2.8, the UK accounts for thelargest single country share of FOCI mitigation measures, about 48percent. This is consistent with the UK’s dominant share of defense-related CFIUS activity as well as with its role as the single largest for-eign direct investor in the U.S. economy.
Finally, the DBP’s Globalization Database, described in Bitzinger(1999), distinguishes between licensed production—which is as-sumed to involve minimal collaboration—and more collaborative

44 U.S. Government Policy and the Defense Aerospace Industry
SOURCE: Ciardello (2001).Year
RANDMR1537-2.6
Total casesDefense-related cases
60
50
40
30
20
10
0
70
80
70
Num
ber
of c
ases
1996 1997 1998 1999 2000
Figure 2.6—Total and Defense-Related CFIUS Reviews, 1996–2000
SOURCE: Ciardello (2001).Year
60
50
40
30
20
10
0
70
Sha
res
of tr
ansa
ctio
ns (
%)
RANDMR1537-2.7
UKFranceNetherlands
1996 1997 1998 1999 2000
Figure 2.7—Shares of Defense-Related CFIUS Transactions for Top ThreeCountries, 1996–2000

The U.S. Defense Aerospace Industry: How Globalized Is It? 45
United Kingdom0.48
Other0.03
Bermuda0.01 Canada
0.07 Denmark0.04
France0.05
Germany0.07
Israel0.04
Japan0.03
Netherlands0.08
Singapore0.01
Spain0.01Sweden
0.01Switzerland0.07
SOURCE: Ciardell (2001).
RANDMR1537-2.8
Figure 2.8—Country Shares of 75 FOCI Negation Measures
activities such as marketing agreements, coproduction, and codevel-opment.41 Within the last category, the data further distinguish be-tween relationships initiated by governments (where company workshares are often allocated according to governmental shares of theprogram budget) and those initiated by industry (where cost mini-mization strategies are presumably more likely to be followed).Programs covered include RDT&E and production programs for largeweapon systems such as aircraft, missiles, and armored vehicles, as
______________ 41Coproduction activities are defined as the “joint production of a common weaponsystem” (Bitzinger, 1999, p. 311). The DBP data do not distinguish between FMS co-production and partnership coproduction programs, but both are assumed to requiremore complex cross-border business relationships than simple licensed productionactivities.

46 U.S. Government Policy and the Defense Aerospace Industry
well as for major components such as radar systems and jet engines(Bitzinger, 1999, p. 331).
Figure 2.9, which uses DBP data, shows the declining numbers oftraditional licensed-production arrangements relative to U.S. partic-ipation in international aircraft and missile codevelopment andcoproduction programs (as defined by Bitzinger). To convey a bettersense of long-term trends, program startups are organized into five-year cohorts. We see that prior to about 1981, licensed productionwas the dominant form of international collaboration in armamentICRD&A programs. Beginning in the early 1980s, however, licensedproduction began to decline in importance relative to codevelop-ment, partnership coproduction, and FMS coproduction.42 By 1991–1995, licensed production program startups constituted less thanhalf the total.
Program start dates
SOURCE: Bitzinger (1999).
1961–1965 1966–1970 1971–1975 1976–1980 1981–1985 1986–1990 1991–1995
RANDMR1537-2.9
Licensed production
Codevelopment andcoproduction
35
30
25
20
15
10
5
0
Num
ber
of p
rogr
ams
Figure 2.9—Cross-Border Collaborative Activities of U.S. Firms in MilitaryAircraft and Missiles
______________ 42These figures represent startups only; some programs may not have been com-pleted.
The U.S. Defense Aerospace Industry: How Globalized Is It? 47
35
30
25
20
15
10
5
0
Num
ber
of p
rogr
ams
Program start dates
SOURCE: Bitzinger (1999).
1966–1970 1971–1975 1976–1980 1981–1985 1986–1990 1991–1995
RANDMR1537-2.10
Government-initiated
Industry-initiated
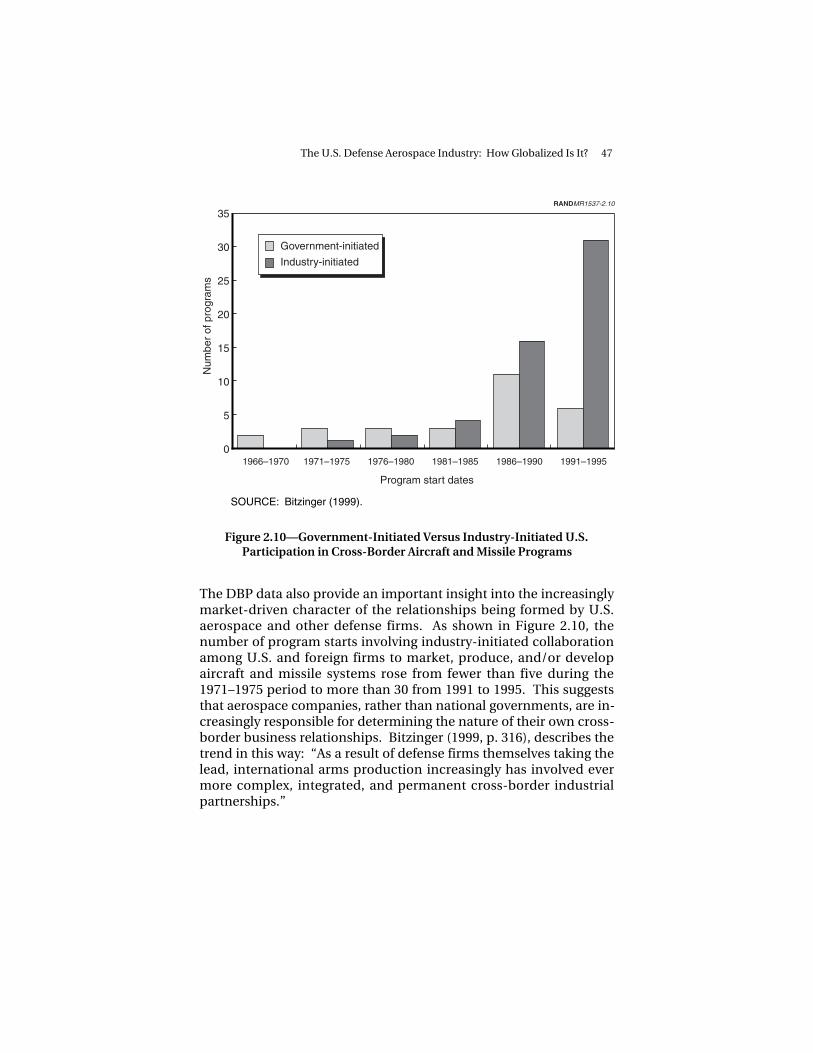
Figure 2.10—Government-Initiated Versus Industry-Initiated U.S.Participation in Cross-Border Aircraft and Missile Programs
The DBP data also provide an important insight into the increasinglymarket-driven character of the relationships being formed by U.S.aerospace and other defense firms. As shown in Figure 2.10, thenumber of program starts involving industry-initiated collaborationamong U.S. and foreign firms to market, produce, and/or developaircraft and missile systems rose from fewer than five during the1971–1975 period to more than 30 from 1991 to 1995. This suggeststhat aerospace companies, rather than national governments, are in-creasingly responsible for determining the nature of their own cross-border business relationships. Bitzinger (1999, p. 316), describes thetrend in this way: “As a result of defense firms themselves taking thelead, international arms production increasingly has involved evermore complex, integrated, and permanent cross-border industrialpartnerships.”
48 U.S. Government Policy and the Defense Aerospace Industry
SUMMARY OF STATISTICAL EVIDENCE
Although there is relatively little statistical data specific to defenseaerospace systems and subsystems, aggregate data on the produc-tion, consumption, and trade of aerospace products—as well as onthe production and international transfers of conventional arma-ments—reveal certain patterns that help inform our analysis of de-fense aerospace industry globalization. For aerospace products, ourmajor findings are as follows:
• The U.S. aerospace industry has a strong export orientation rela-tive to other U.S. manufacturing industries.
• Nonmilitary producers are more internationally active than aremilitary producers.
• With the exception of aircraft engines and space propulsionunits, levels of import penetration in the U.S. aerospace industryare low.
• The United States imports almost no finished military aircraft.
• In 1998, the top two destinations for U.S. combined civil andmilitary aerospace products were the UK and Japan; the leadingsuppliers to U.S. industry were France and the UK.
For conventional armaments, we found the following:
• The United States leads the world in both the export and theproduction of conventional arms.
• Exports and production of conventional arms are highly concen-trated geographically relative to other manufacturing industries.
• Global imports are fairly diffuse geographically.
• The United States leads the world in defense expenditures butreceives relatively few conventional arms transfers from abroad.
• U.S. purchases of foreign armaments come overwhelmingly fromEurope, primarily from the UK.
With respect to financial flows, aggregate data on foreign direct in-vestment in the United States as well as U.S. direct investmentabroad indicate the following:
The U.S. Defense Aerospace Industry: How Globalized Is It? 49
• U.S. firms are both the leading purchasers of foreign firms andthe leading targets of foreign acquirers.
• Europeans, led by the British, are the most active foreign in-vestors in U.S. businesses, while the UK is the most popular des-tination for new U.S. investment abroad.
• The number and value of U.S. domestic and cross-border merg-ers rose dramatically during the 1990s.
Data on selected foreign direct investments in U.S. defense compa-nies and on international collaborative activities suggest that
• There has been a slight increase in CFIUS reviews of foreign de-fense acquisitions in recent years.
• Two-thirds of the cases reviewed by CFIUS involved British,French, or Dutch firms, with British firms alone accounting foralmost half the cases.
• Traditional licensed production arrangements are declining inimportance relative to U.S. participation in codevelopment andcoproduction programs (as defined by Bitzinger, 1999).
• Aerospace companies, rather than national governments, are in-creasingly responsible for determining the nature of their owncross-border relationships.
Our analysis of the statistical data confirms two frequently stated ob-servations about the U.S. defense aerospace industry: Its productsare highly competitive on world markets, and it is not very reliant onforeign suppliers. Although the data on cross-border investment indefense cannot automatically be extrapolated to aerospace firms,they are also consistent with the observation that U.S. defense firmsare partnering with foreign firms in a variety of ways for a variety ofactivities. British firms are frequently their partners of choice.
What these statistical snapshots cannot tell us is how patterns oftrade and investment in defense aerospace have changed over time;how they have been affected by changes in the U.S. regulatory envi-ronment or in DoD policy; or what sorts of opportunities and chal-lenges these changes pose to the Air Force. For example, the statisti-cal data do not reveal to what extent offset agreements—such as

50 U.S. Government Policy and the Defense Aerospace Industry
counterpurchases of goods, technology transfers, credit transfers,and various forms of investment—have been imposed on would-beexporters. Nor do they record the capabilities or degree of sophisti-cation of defense aerospace exports and imports. With the exceptionof Bitzinger (1999), the data do not provide any information aboutthe companies that develop and produce air-based weapon sys-tems—for example, who their suppliers and partners are or to whatextent they rely on foreign inputs, foreign technology, or foreignmarkets. Finally, the data do not provide sufficient information toassess whether and how much current patterns might change in theabsence of existing U.S. government legislation, regulations, andstatutes.
In the section that follows, we present a brief historical overview ofsome of the major trends in U.S. defense aerospace system trade andcross-border business relationships. With this short descriptive sur-vey, we hope to deepen our understanding of the changes that aretaking place both in the United States and overseas, thereby helpingidentify key issues the Air Force must address with respect to shapingand managing those changes.
DEFENSE AEROSPACE GLOBALIZATION: HISTORICALTRENDS
Trends in U.S. Defense Aerospace Exports
As revealed by the statistical snapshot above, the United States is theworld’s undisputed leader in arms exports, laying claim to more thanhalf of the global market. Yet the characteristics and requirements ofthe arms export market have changed significantly over the decadessince the end of World War II. These changes in arms export marketshave greatly contributed to the evolution of the more complex busi-ness relationships we observe today.
For approximately the first two decades following World War II, U.S.contractors typically exported finished defense goods—includingcomplete military aircraft—even to industrially sophisticatedWestern European markets. In the 1950s, for example, the RepublicF-84 and the North American F-86 were widely exported as complete

The U.S. Defense Aerospace Industry: How Globalized Is It? 51
aircraft to countries with historically robust military aircraft indus-tries, such as France.43
By the late 1960s, however, many European countries as well asJapan increasingly insisted on coproducing U.S.-designed militaryaircraft under license rather than importing finished products. Oneof the most important early programs involved the coproduction ofthe Lockheed F-104G (a specially modified variant of the F-104A) bya consortium of European countries that included Germany, Italy,Belgium, and the Netherlands.44 Initially, Lockheed provided com-plete aircraft. Next, knockdown kits of parts of aircraft for FACOoverseas were provided along with extensive technical manufactur-ing process and engineering assistance. Over time, however, theEuropean partners began to build more and more of the F-104G andits subcomponents indigenously while simultaneously undertakingFACO. Some European coproducers, such as the Germans, even be-gan to modify and develop their own manufacturing processes forvarious parts of the U.S.-designed aircraft.45
By the 1970s, Western European countries with a long history of in-digenous aircraft development were no longer interested in import-ing finished U.S. military aircraft or in coproducing them. Instead,France, Germany, the UK, and Italy moved toward the developmentand production of indigenous or collaboratively developed Europeancombat aircraft, including the French Mirage III/5/2000 series, theBritish/French Jaguar, the British/German/Italian Tornado, and theFrench/German Alpha Jet.46 Although “second-tier” EuropeanNATO countries such as Belgium and the Netherlands continued tocoproduce U.S. aircraft (e.g., the Northrop F-5 and theLockheed/General Dynamics F-16), it had become clear that with thepossible exception of highly specialized, low-production platforms,the leading European countries were unlikely ever again to buy or
______________ 43Many of these exports were elements of U.S. military assistance programs toEuropean allies still recovering from the ravages of World War II.44The F-104 was also coproduced in Canada and Japan.45From an interview with a German government defense procurement official.46Sweden maintained its long tradition of developing its own indigenous fighter de-signs throughout the jet era but imported some U.S. components and subsystems.
52 U.S. Government Policy and the Defense Aerospace Industry
coproduce a wholly U.S.-developed fighter or other first-line combataircraft.47
In the 1960s and 1970s, U.S. companies did continue to export fin-ished combat aircraft to developing countries such as Turkey; thesedeals often involved specially designed, lower-capability exportcombat aircraft such as the Northrop F-5. By the 1980s and 1990s,however, even developing countries began to demand and receivefirst-line U.S. combat aircraft. They also began insisting on offsets,including coproduction and technology transfer. With Europeanmanufacturers competing with increasing vigor for every third-country sale of combat aircraft, competitive pressure on U.S. manu-facturers grew more intense. In order to sell its F-16 to Turkey in the1980s, for example, General Dynamics (now Lockheed Martin)agreed to coproduce and to establish a manufacturing facility out-side Ankara that duplicated on a smaller scale its vast production fa-cilities in Fort Worth, Texas. General Dynamics also agreed to seekout and train Turkish firms to manufacture even some of the mostsophisticated components of the fire control radar and other elec-tronics.48
Table 2.6 shows some typical examples of the more complex busi-ness activities involved in recent export sales. The Greek Air Force’sthird purchase lot of F-16s, concluded in the spring of 1999, includesoffsets in the form of related subcontracts and involves an upgradedlong-range variant with conformal fuel tanks (F-16 Block 50+) that isnot in the U.S. Air Force inventory. The sale was a commercial dealrather than part of a government-sponsored FMS program. TheIsraeli Air Force, which already operates the largest fleet of F-16soutside the U.S. Air Force, decided to purchase more of a speciallymodified Block 50+ variant in July 1999. The Israeli variant incorpo-rates major airframe modifications not seen on U.S. Air Force F-16s,including conformal fuel tanks and, on some two-seat models, a
______________ 47European purchases of specialized U.S.-developed aircraft include the FrenchNavy’s purchase of the Grumman E-2C airborne early warning (AEW) aircraft andboth French and British purchases of the Boeing E-3 Airborne Warning and ControlSystem (AWACS).48Turkey later gained the right to produce F-16s for a third-country sale to Egypt. Asof this writing, 13 foreign countries are involved in offset agreements that include co-production of the F-16 or supplier relationships on the program.

The U.S. Defense Aerospace Industry: How Globalized Is It? 53
Table 2.6
Examples of Recent U.S. Military Aerospace System Exports
System PurchaserConditions of Sale or
Prospective Sale
F-16 Korea, Greece, Israel Offsets, modifications
E-3 AWACS France, UK Offsets of 130 percent
F-16C/D Block 60+ United Arab Emirates Major modification R&D
F-X program South Korea Baseline 70 percent industrial off-set; other technology transfer andassistance
special humped dorsal spine stretching from the cockpit to the verti-cal stabilizer. This special spine is used for the installation of Israelielectronic warfare (EW) systems and other avionics. According toone report, an upgraded radar jointly developed by U.S. and Israeliindustry will also be installed. Up to one-quarter of the manufactur-ing work will be conducted in Israel (Dworkin, 1999).49 These modi-fications are intended to transform the Israeli two-seat variant of theF-16 into a long-range interdictor, or a “poor man’s” F-15E. The air-craft will thus be used for different types of missions than are typicalfor standard U.S. Air Force F-16s. Lockheed subsequently sold thesame dorsal hump airframe modification to Singapore, but with dif-ferent avionics.
The United Arab Emirates (UAE) F-16 deal finally approved in thesummer of 2000, which called for 60 dramatically upgraded Block60+ fighters, is particularly revealing. The UAE F-16 will includemostly new avionics, the most important of which will be an activeelectronically scanned array (AESA) fire control radar developed byNorthrop Grumman Electronic Systems. The new radar and avionicswill make the UAE F-16 more capable in some respects than any F-16in the U.S. Air Force inventory. This program is also of interest be-cause its final approval was delayed more than one year as a result ofa dispute over the transfer of sensitive software source code to thepurchaser.
______________ 49Although the Israeli F-16I is a specially modified variant not used in the U.S. AirForce inventory, it is still considered an FMS coproduction arrangement because U.S.military assistance funds will be used to purchase the aircraft.

54 U.S. Government Policy and the Defense Aerospace Industry
Finally, the competition for the Korean F-X future fighter, which wasnearing its climax in late 2001, illustrates the intensity of competitionbetween U.S and European contractors for the few large fighter-aircraft export deals that remain. It also illustrates how these com-petitions lead to extraordinary offers of offsets and technology trans-fer to the buyer. The finalists in this competition in late 2001 wereBoeing St. Louis with its F-15K; the British/German/Italian/SpanishEurofighter consortium with its Typhoon; Dassault Aviation with itsRafale; and Russia’s Rosvorgenia with its Sukhoi Su-37. A baselinerequirement established by the Korean government was at least a 70percent direct industrial offset arrangement. In addition, KoreanPresident Kim Dae Jung stated in March 2001 that Korea intended tobegin the development of a new-generation indigenous fighter by2005, implying that the winner of the F-X competition should offertechnology and design and engineering assistance in achieving thisgoal.
Not surprisingly, all four competitors claimed that their offset pack-ages would exceed the 70 percent baseline, with each insisting that itwould transfer the most technology and know-how if chosen. Inaddition, each argued that its proposal would do the most to supportKorea’s efforts to develop a new-generation indigenous fighter by2015. Dassault, for example, offered a direct partnership with KoreanAerospace Industries in manufacturing a significant percentage ofthe Rafale for the French armed forces and other foreign buyers aswell as for the Korean Air Force. The French also argued that theirtechnology transfer package was aimed specifically at aiding the de-velopment of a Korean indigenous fighter in 15 years. Boeing wentone step further and “guaranteed the development of an indigenousfighter by 2015” if its F-15K was chosen (Kim, 2001).
The severe competitive pressures associated with programs such asthe F-X—where foreign governments are able to demand generousdirect offsets and significant technology transfer from firms and con-sortia that believe they must win to remain economically viable—hasresulted in heavy lobbying by U.S. primes and industry associationsto further liberalize U.S. export regulations and procedures. In thecase of the Boeing F-15, which lost a hard-fought battle with theLockheed F-16 for the Israeli fighter program in July 1999, a loss inthe Korean program could mean the permanent shutdown of the F-15 production line, and with it the disappearance of a significant
The U.S. Defense Aerospace Industry: How Globalized Is It? 55
percentage of the work performed at its St. Louis facilities.50 With somuch at stake, it is not surprising that competing prime contractorsare now routinely offering extremely generous offset and technologytransfer incentives—and that U.S. firms bitterly complain about theexport and technology transfer restrictions under which they mustoperate in this area compared to their European competitors.51
Trends in U.S. Defense Aerospace Imports
Several points can be made with respect to the post–World War IIhistory of U.S. imports of finished combat aircraft, which stands instark contrast to U.S. export history:
• Imports are rare.
• They are usually UK-developed.
• They usually involve significant modification by U.S. contractors.
• They are largely coproduced in the United States.
With the possible exception of the British Aerospace (now BAESystems) AV-8A Harrier, the United States has never deployed a first-line jet fighter/attack aircraft developed in a foreign country. In theearly 1950s, the U.S. Air Force did procure a version of the EnglishElectric Canberra twin-engine jet bomber. Called the B-57 in U.S. AirForce service, the Canberra was built under license by MartinAircraft. However, most of the versions built in the United Stateswere significantly modified to meet U.S. requirements.
The only combat aircraft in U.S. service to be built largely overseaswas the AV-8A Harrier. As a result of U.S. Marine Corps require-ments, however, this aircraft was also modified. The follow-on AV-8B Harrier II is a radically modified Harrier developed primarily by
______________ 50The pressure on Boeing to win the F-X competition became even greater followingthe October 26, 2001, announcement that Lockheed Martin had been selected overBoeing to lead the development of the JSF.51On the other hand, European producers claim that U.S. firms (in this case Boeing)have a significant advantage because of the close security relationship between theUnited States and Korea, as well as the fact that purchase of the F-15K would providethe Korean Air Force with greater standardization and interoperability with U.S.forces.
56 U.S. Government Policy and the Defense Aerospace Industry
McDonnell Douglas (now Boeing) and coproduced with BAE Systemsfor both the UK and the United States. Indeed, the AV-8B Harrier IIis virtually an all-new aircraft in design and materials. Similarly, theT-45 Goshawk, the U.S. Navy’s advanced jet trainer version of theBAE Hawk Royal Air Force trainer/light attack aircraft, includes nu-merous modifications to meet U.S. Navy requirements. Coproducedby BAE Systems and Boeing St. Louis (the prime contractor), it en-tered service in the early 1990s.
The Joint Primary Aircraft Training System (JPATS), which later be-came the Raytheon Beech T-6 Texan II, was intended to be a lightlymodified off-the-shelf nondevelopmental item (NDI) from a foreigncontractor teamed with a U.S. firm for coproduction in the UnitedStates. The goal was to reduce procurement costs and eliminate de-velopment costs. The Swiss Pilatus PC-9 won the original competi-tion, but Navy and Air Force requirements as well as developmentalproblems evolved in such a way that they ultimately led to majormodifications of the original aircraft.52 The resulting RaytheonBeech T-6A Texan II is practically an all-new aircraft that is manufac-tured at the Raytheon Beech Wichita plant. This program, too, wouldappear to illustrate that when the United States imports a foreignplatform—which it rarely does—it often modifies that platform sosignificantly that anticipated benefits from the elimination of devel-opment costs are substantially reduced. Table 2.7 shows several ex-amples of recent foreign-developed military aircraft and otheraerospace system imports to the United States.
In areas other than complete combat aircraft, there have been sev-eral instances in which the United States has imported off-the-shelfforeign items. Often, U.S. firms have later developed long-termstrategic relationships with the foreign partner to upgrade and fur-ther market such items. Prime examples include the originalPopeye/HAVE NAP air-to-ground missile developed by the Israeli
______________ 52Each of the seven competing foreign developers was teamed with a U.S. contractor;for example, Pilatus was teamed with Beech/Raytheon.
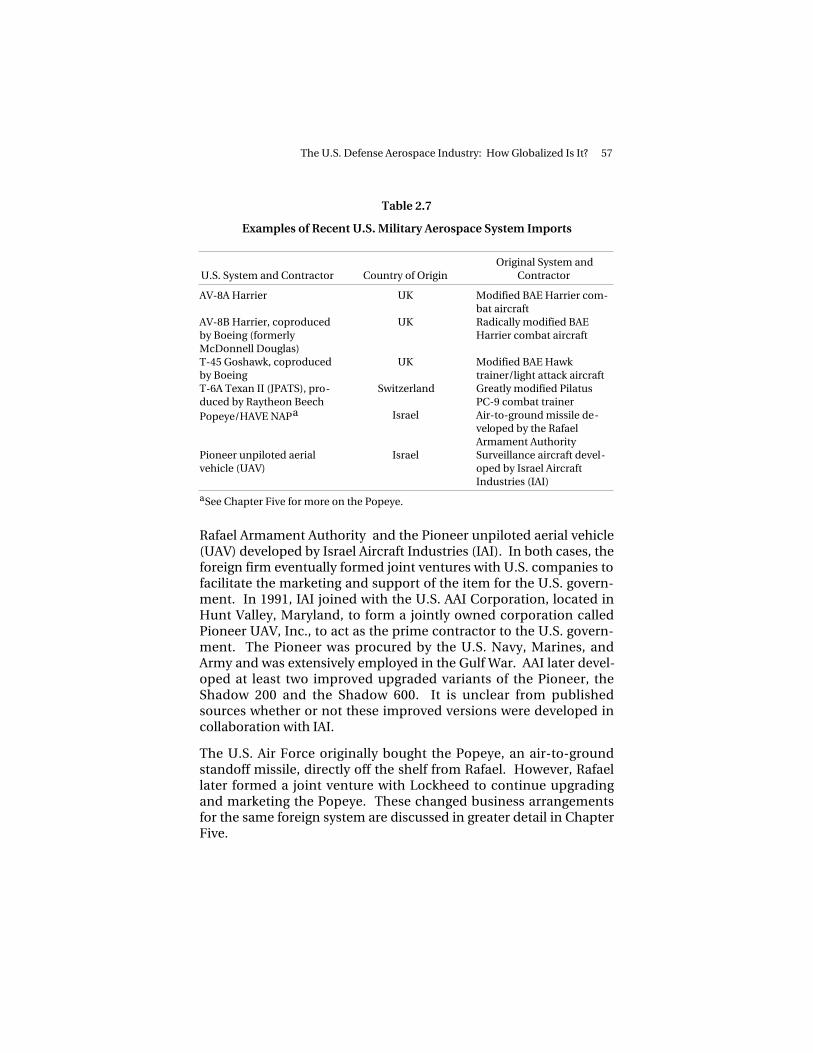
The U.S. Defense Aerospace Industry: How Globalized Is It? 57
Table 2.7
Examples of Recent U.S. Military Aerospace System Imports
U.S. System and Contractor Country of OriginOriginal System and
Contractor
AV-8A Harrier UK Modified BAE Harrier com-bat aircraft
AV-8B Harrier, coproducedby Boeing (formerlyMcDonnell Douglas)
UK Radically modified BAEHarrier combat aircraft
T-45 Goshawk, coproducedby Boeing
UK Modified BAE Hawktrainer/light attack aircraft
T-6A Texan II (JPATS), pro-duced by Raytheon Beech
Switzerland Greatly modified PilatusPC-9 combat trainer
Popeye/HAVE NAPa Israel Air-to-ground missile de-veloped by the RafaelArmament Authority
Pioneer unpiloted aerialvehicle (UAV)
Israel Surveillance aircraft devel-oped by Israel AircraftIndustries (IAI)
aSee Chapter Five for more on the Popeye.
Rafael Armament Authority and the Pioneer unpiloted aerial vehicle(UAV) developed by Israel Aircraft Industries (IAI). In both cases, theforeign firm eventually formed joint ventures with U.S. companies tofacilitate the marketing and support of the item for the U.S. govern-ment. In 1991, IAI joined with the U.S. AAI Corporation, located inHunt Valley, Maryland, to form a jointly owned corporation calledPioneer UAV, Inc., to act as the prime contractor to the U.S. govern-ment. The Pioneer was procured by the U.S. Navy, Marines, andArmy and was extensively employed in the Gulf War. AAI later devel-oped at least two improved upgraded variants of the Pioneer, theShadow 200 and the Shadow 600. It is unclear from publishedsources whether or not these improved versions were developed incollaboration with IAI.
The U.S. Air Force originally bought the Popeye, an air-to-groundstandoff missile, directly off the shelf from Rafael. However, Rafaellater formed a joint venture with Lockheed to continue upgradingand marketing the Popeye. These changed business arrangementsfor the same foreign system are discussed in greater detail in ChapterFive.

58 U.S. Government Policy and the Defense Aerospace Industry
CONCLUSION
In conclusion, aerospace exporting on the weapon system platformlevel, which once involved the relatively straightforward sale andtransfer of finished goods from the supplier/developer to the pur-chaser, has evolved to encompass a wide variety of complex businessarrangements involving a range of activities, including countertrade,offsets, coproduction, foreign investment, marketing agreements,major cooperative R&D and modification efforts, and significanttechnology transfer issues. Major trends in U.S. combat aircraft ex-ports since the 1950s include the following:
• A move away from lower-capability export aircraft and othersystems to high-end aircraft and systems closer in capabilities tothose in the U.S. inventory;
• The growing importance of industrial and technological offsets;
• An increasing trend toward FMS and licensed coproduction ofthe purchased item in the purchasing country;
• The increasing importance of direct commercial sales comparedto U.S. government–administered FMS;
• The emergence of significantly modified variants developed byU.S. contractors, sometimes in collaboration with foreign con-tractors, solely for the use of foreign customers; and
• Growing involvement of the purchaser in R&D, combined withincreased demand for access to U.S. technology.
Nevertheless, U.S. primes often believe they are at a disadvantagewhen competing with European contractors because of the percep-tion of more restrictive and bureaucratic procedures imposed by theU.S. government for export control, technology transfer, and offsets.
On the import side, the U.S. government appears to have benefitedfrom the rare cases in which it has imported major systems. In thecase of the original Harrier, the United States benefited by buying offthe shelf a unique technology developed overseas. Building on thattechnology, the United States subsequently developed much morecapable variants. In both cases, standardization and interoperabilitywere enhanced with a key ally, the UK. In the case of the Popeye andthe Pioneer UAV, the U.S. armed forces were able to gain quick ac-
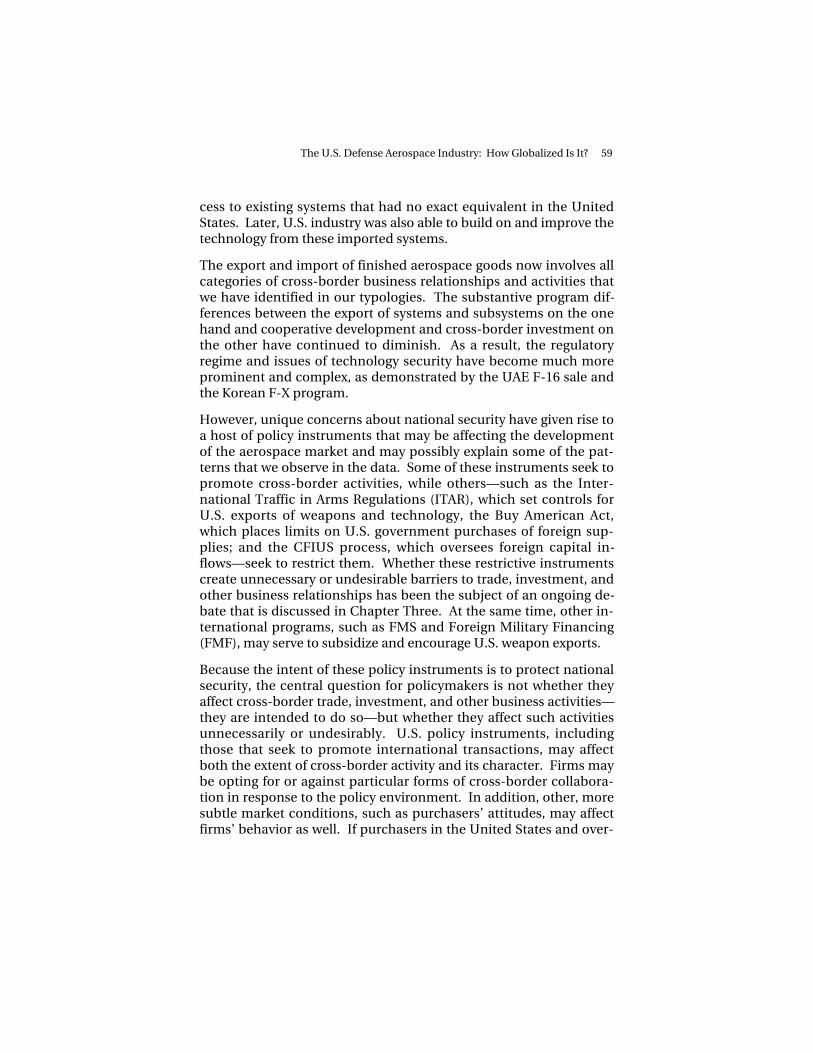
The U.S. Defense Aerospace Industry: How Globalized Is It? 59
cess to existing systems that had no exact equivalent in the UnitedStates. Later, U.S. industry was also able to build on and improve thetechnology from these imported systems.
The export and import of finished aerospace goods now involves allcategories of cross-border business relationships and activities thatwe have identified in our typologies. The substantive program dif-ferences between the export of systems and subsystems on the onehand and cooperative development and cross-border investment onthe other have continued to diminish. As a result, the regulatoryregime and issues of technology security have become much moreprominent and complex, as demonstrated by the UAE F-16 sale andthe Korean F-X program.
However, unique concerns about national security have given rise toa host of policy instruments that may be affecting the developmentof the aerospace market and may possibly explain some of the pat-terns that we observe in the data. Some of these instruments seek topromote cross-border activities, while others—such as the Inter-national Traffic in Arms Regulations (ITAR), which set controls forU.S. exports of weapons and technology, the Buy American Act,which places limits on U.S. government purchases of foreign sup-plies; and the CFIUS process, which oversees foreign capital in-flows—seek to restrict them. Whether these restrictive instrumentscreate unnecessary or undesirable barriers to trade, investment, andother business relationships has been the subject of an ongoing de-bate that is discussed in Chapter Three. At the same time, other in-ternational programs, such as FMS and Foreign Military Financing(FMF), may serve to subsidize and encourage U.S. weapon exports.
Because the intent of these policy instruments is to protect nationalsecurity, the central question for policymakers is not whether theyaffect cross-border trade, investment, and other business activities—they are intended to do so—but whether they affect such activitiesunnecessarily or undesirably. U.S. policy instruments, includingthose that seek to promote international transactions, may affectboth the extent of cross-border activity and its character. Firms maybe opting for or against particular forms of cross-border collabora-tion in response to the policy environment. In addition, other, moresubtle market conditions, such as purchasers’ attitudes, may affectfirms’ behavior as well. If purchasers in the United States and over-

60 U.S. Government Policy and the Defense Aerospace Industry
seas are more comfortable buying domestically, it may be difficult forU.S. firms to enter foreign markets and for foreign firms to enter U.S.markets.
A key step in developing an Air Force strategy for managing global-ization is to better understand why, in practice, certain types of activ-ities seem to be associated with certain types of business relation-ships. It is of particular interest to clarify whether these relationshipsand activities generally support the three overarching Air Force ob-jectives identified in Chapter One: enhanced market sector compe-tition (with its attendant benefits, price reduction, and technical in-novation), standardization or interoperability with key allies, andpreservation of national security. This question is the focus of thechapter that follows.
Related Documents