Copyright 2004 McGraw-Hill Australia Pty Ltd PPTs t/a Fundamentals of Corporate Finance 3e Ross, Thompson, Christensen, Westerfield and Jordan Slides prepared by Sue Wright 2-1 Chapter Two Financial Statement Analysis

Welcome message from author
This document is posted to help you gain knowledge. Please leave a comment to let me know what you think about it! Share it to your friends and learn new things together.
Transcript
Copyright 2004 McGraw-Hill Australia Pty Ltd
PPTs t/a Fundamentals of Corporate Finance 3e
Ross, Thompson, Christensen, Westerfield and Jordan
Slides prepared by Sue Wright
2-1
Chapter Two
Financial Statement Analysis
2-2
2.1 The Statement of Financial Position
(Balance Sheet)
2.2 The Statement of Financial Performance
(Income Statement)
2.3 Liquidity
2.4 Book Value & Market Value
2.5 Financial Ratios
2.6 Test Questions & True/False Questions
Chapter Organization

2-3
The Balance Sheet
• The balance sheet is a snapshot of the firm’s
assets and liabilities at a given point in time.
• It is a convenient means of organizing and
summarizing what a firm owns (its assets), what a
firm owes (its liabilities), and the difference
between the two (the firm’s equity) at a given
point in time.
• the left-hand side lists the assets of the firm, and
the right-hand side lists the liabilities and Equity
2-4
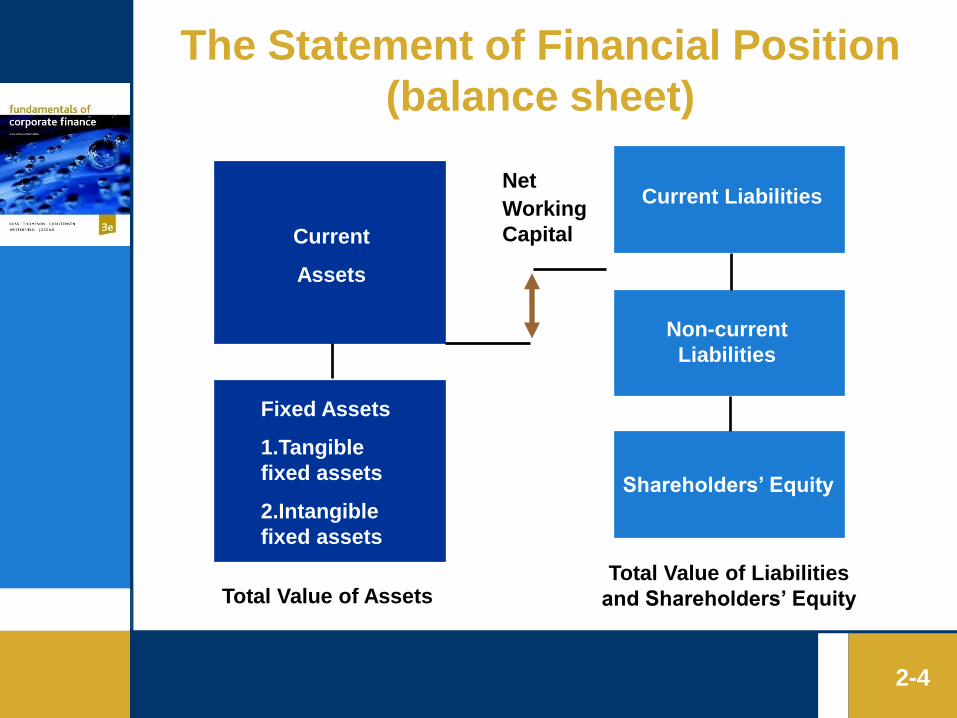
The Statement of Financial Position
(balance sheet)
Current
Assets
Fixed Assets
1.Tangible
fixed assets
2.Intangible
fixed assets
Net
Working
Capital
Current Liabilities
Non-current
Liabilities
Shareholders’ Equity
Total Value of AssetsTotal Value of Liabilities
and Shareholders’ Equity
Assets: The Left-Hand Side
• Assets are classified as either current or fixed.
• A fixed asset is one that has a relatively long life.
Fixed assets can be either tangible, such as a truck
or a computer, or intangible, such as a trademark or
patent.
• Current asset has a life of less than one year. This
means that the asset will convert to cash within 12
months. For example, inventory would normally be
purchased and sold within a year and is thus
classified as a current asset. Obviously, cash itself is
a current asset. Accounts receivable (money owed
to the firm by its customers) is also a current asset.
2-5
Liabilities and Owners’ Equity: The Right-Hand Side
• The firm’s liabilities are the first thing listed on
the right-hand side of the balance sheet.
• These are classified as either current or long-term.
Current liabilities, like current assets, have a life
of less than one year (meaning they must be paid
within the year) and are listed before long-term
liabilities. Accounts payable (money the firm
owes to its suppliers) is one example of a current
liability.
• A debt that is not due in the coming year is
classified as a long-term liability
2-6
• the difference between the total value of the assets
(current and fixed) and the total value of the liabilities
(current and long-term) is the shareholders’ equity,
also called common equity or owners’ equity.
• This feature of the balance sheet is intended to reflect
the fact that, if the firm were to sell all of its assets
and use the money to pay off its debts, then whatever
residual value remained would belong to the
shareholders.
• So, the balance sheet ―balances‖ because the value of
the left-hand side always equals the value of the right-
hand side.
2-7
Liabilities and Owners’ Equity: The Right-Hand Side
The Balance Sheet Equation
• the value of the firm’s assets is equal to the sum of
its liabilities and shareholders’ equity
• This is the balance sheet identity, or equation, and it
always holds because shareholders’ equity is defined
as the difference between assets and liabilities.
2-8
Assets = Liabilities + Shareholders’ equity
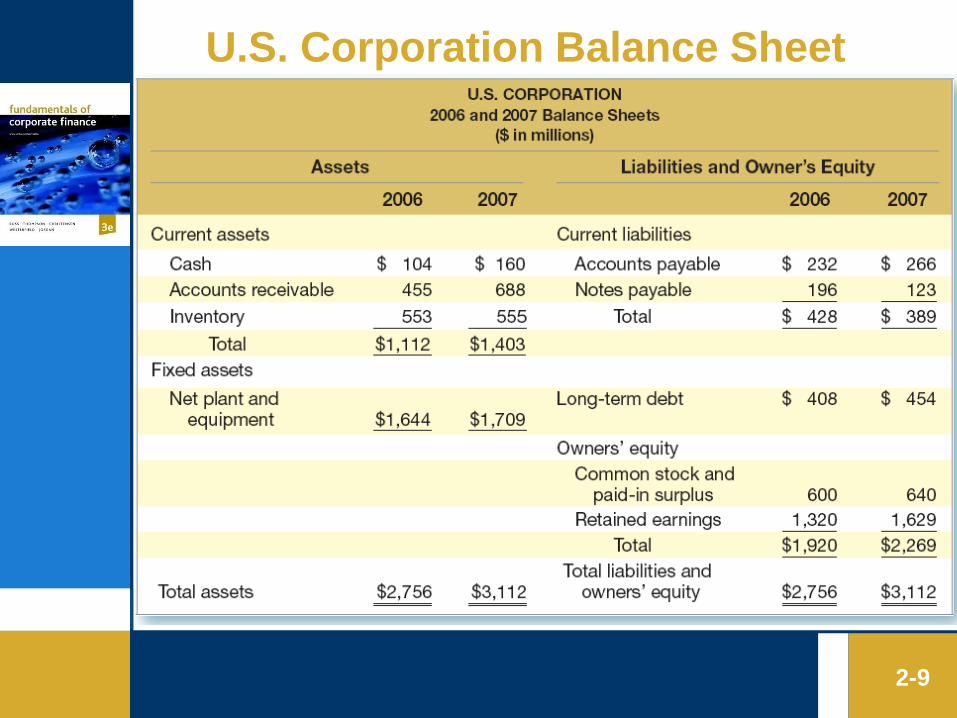
U.S. Corporation Balance Sheet
2-9
2-10
Liquidity
Liquidity refers to the speed and ease with which an
asset can be converted to cash. Gold is a relatively
liquid asset; a custom manufacturing facility is not.
Liquidity actually has two dimensions: ease of
conversion versus loss of value.
Any asset can be converted to cash quickly if we cut
the price enough. A highly liquid asset is therefore
one that can be quickly sold without significant loss
of value. An illiquid asset is one that cannot be
quickly converted to cash without a substantial price
reduction.
2-11
Liquidity (cont.)
Assets are normally listed on the balance sheet in order
of decreasing liquidity, meaning that the most liquid
assets are listed first.
Current assets are relatively liquid and include cash and
those assets that we expect to convert to cash over the
next 12 months. Accounts receivable, for example,
represents amounts not yet collected from customers on
sales already made. Naturally, we hope these will
convert to cash in the near future.
Liquidity is valuable. The more liquid a business is, the
less likely it is to experience Financial distress (that is,
difficulty in paying debts or buying needed assets).
2-12
Debt versus Equity
To the extent that a firm borrows money, it usually gives first
claim to the firm’s cash flow to creditors.
Equity holders are only entitled to the residual value, the
portion left after creditors are paid. The value of this residual
portion is the shareholders’ equity in the firm, which is just
the value of the firm’s assets less the value of the firm’s
liabilities:
Shareholders’ equity =Assets - Liabilities
The use of debt in a firm’s capital structure is called financial
leverage. The more debt a firm has (as a percentage of
assets), the greater is its degree of financial leverage. So,
financial leverage increases the potential reward to
shareholders, but it also increases the potential for financial
distress and business failure.
2-13
Market Value versus Book Valueo Generally Accepted Accounting Principles (GAAP) require
audited financial statements to show assets at historical cost
or book value.
o Market value is the price at which the assets, liabilities, or
equity can actually be bought or sold.
o The shareholders’ equity figure on the balance sheet and the
true value of the stock need not be related. For financial
managers, then, the accounting value of the stock is not an
especially important concern; it is the market value that
matters. Henceforth, whenever we speak of the value of an
asset or the value of the firm, we will normally mean its
market value.
o So, when we say the goal of the financial manager is to increase
the value of the stock, we mean the market value of the stock.
2-14
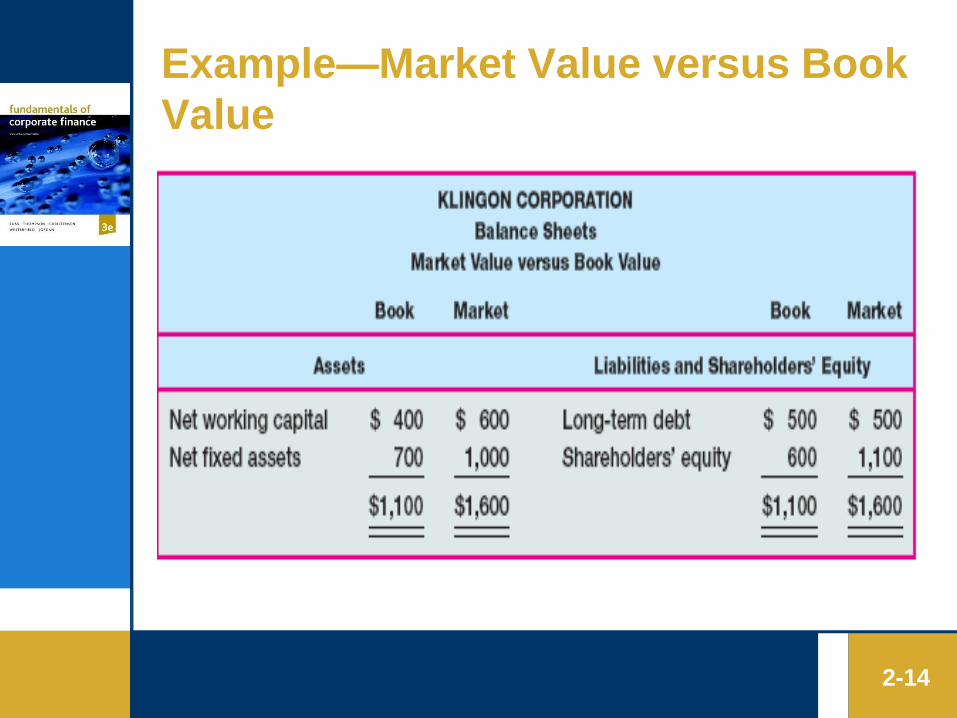
Example—Market Value versus Book
Value
2-15
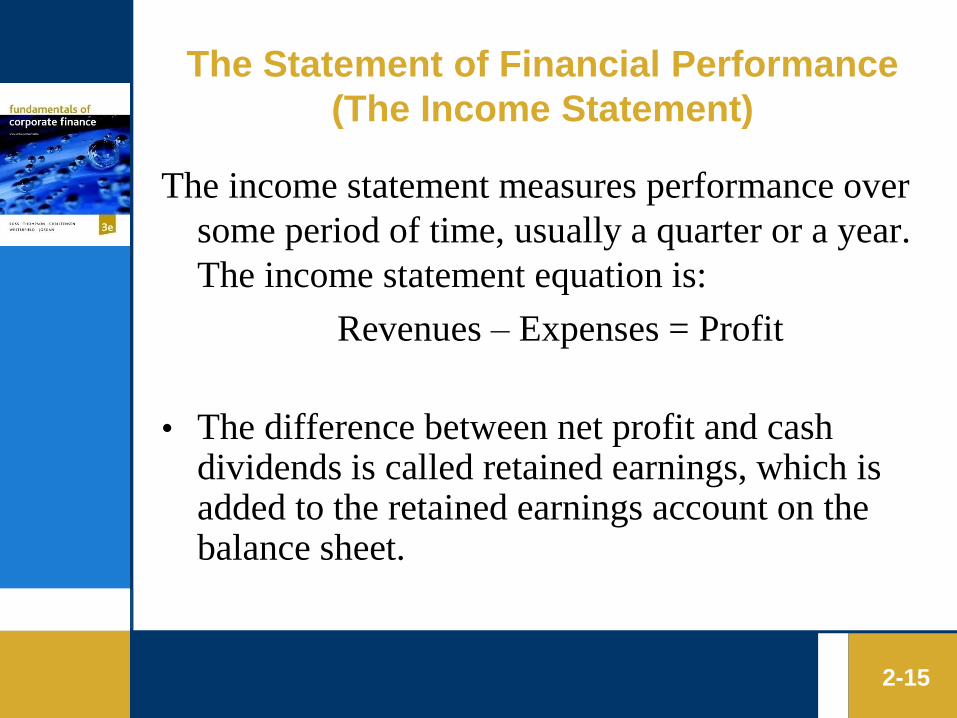
The Statement of Financial Performance
(The Income Statement)
The income statement measures performance over
some period of time, usually a quarter or a year.
The income statement equation is:
Revenues – Expenses = Profit
• The difference between net profit and cash dividends is called retained earnings, which is added to the retained earnings account on the balance sheet.
2-16
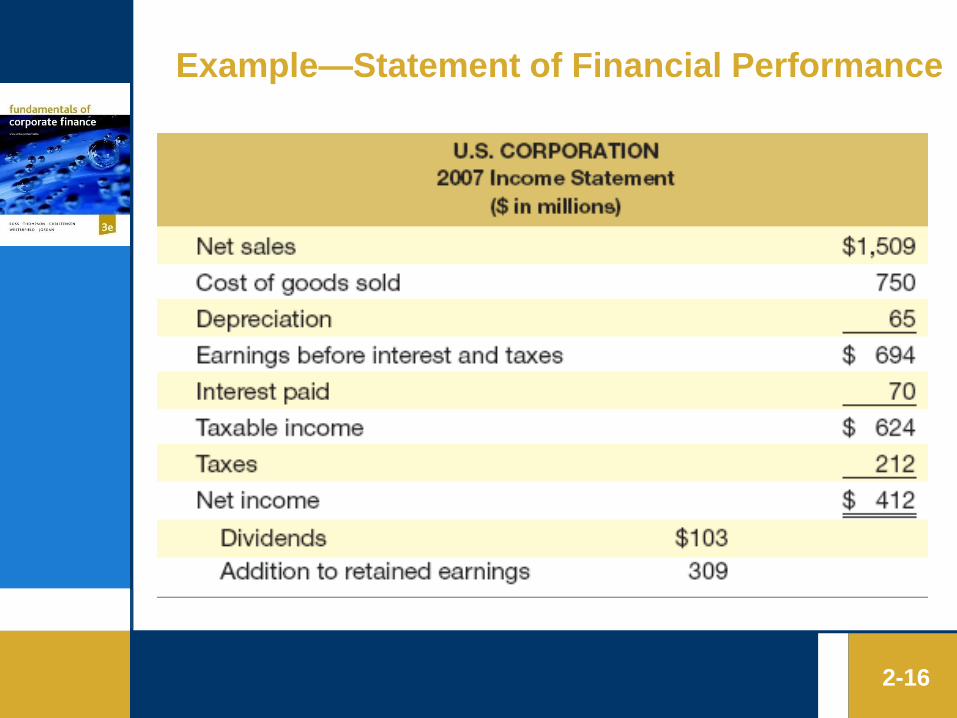
Example—Statement of Financial Performance
Financial Ratios
A way of avoiding the problems involved in
comparing companies of different sizes is to
calculate and compare financial ratios
Such ratios are ways of comparing and
investigating the relationships between different
pieces of financial information. Using ratios
eliminates the size problem because the size
effectively divides out
2-17
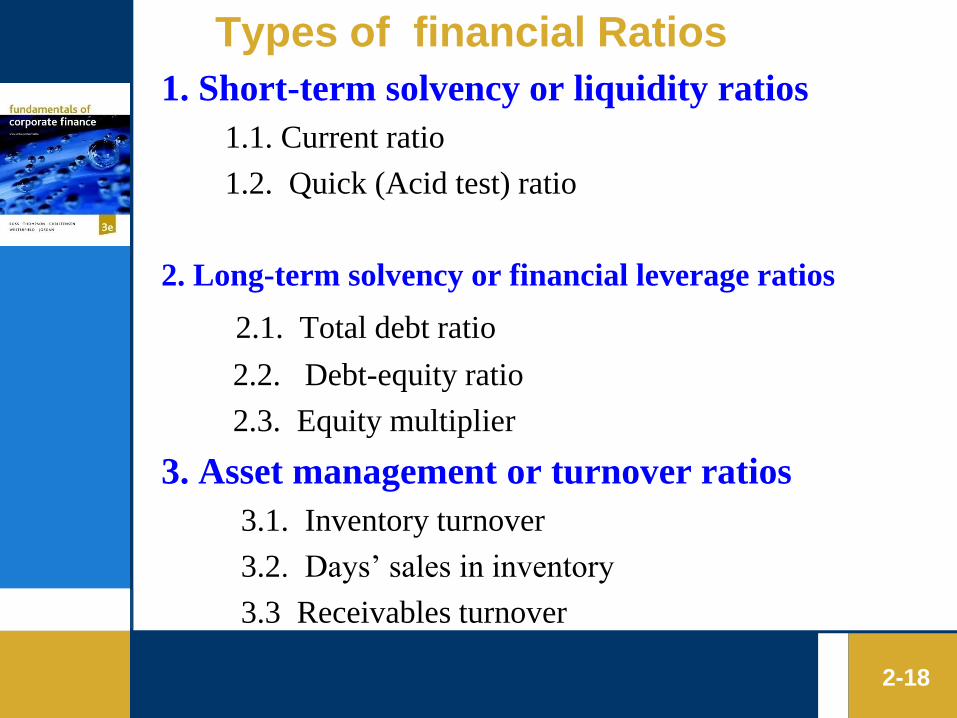
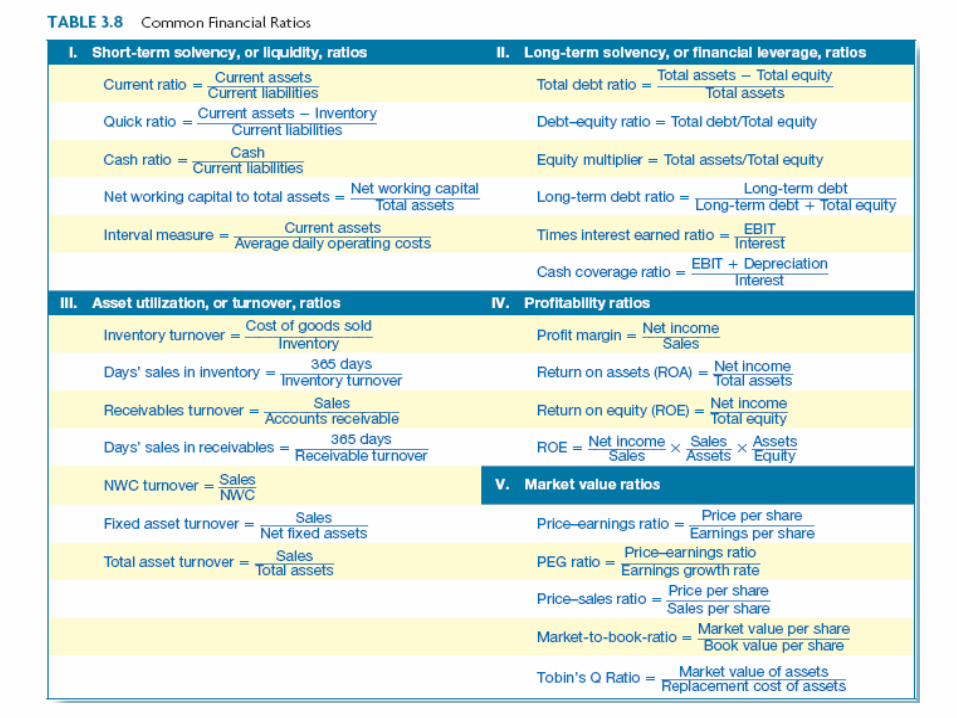
Types of financial Ratios
1. Short-term solvency or liquidity ratios
1.1. Current ratio
1.2. Quick (Acid test) ratio
2. Long-term solvency or financial leverage ratios
2.1. Total debt ratio
2.2. Debt-equity ratio
2.3. Equity multiplier
3. Asset management or turnover ratios
3.1. Inventory turnover
3.2. Days’ sales in inventory
3.3 Receivables turnover
2-18
Types of financial Ratios (cont.)
4. Profitability ratios
4.1. Profit margin
4.2. Return on assets (ROA)
4.3. Return on equity (ROE)
5. Market value ratios
5.1. Price-earnings ratio (P/E)
5.2. Market-to-book ratio (P/B)
2-19
1. Short-term solvency or liquidity ratios
• As the name suggests, short-term solvency ratios as a
group are intended to provide information about a firm’s
liquidity, and these ratios are sometimes called liquidity
measures.
• The primary concern is the firm’s ability to pay its bills
over the short run without undue stress. Consequently,
these ratios focus on current assets and current
liabilities.
• liquidity ratios are particularly interesting to short-term
creditors. Because financial managers are constantly
working with banks and other short term lenders, an
understanding of these ratios is essential.
2-20
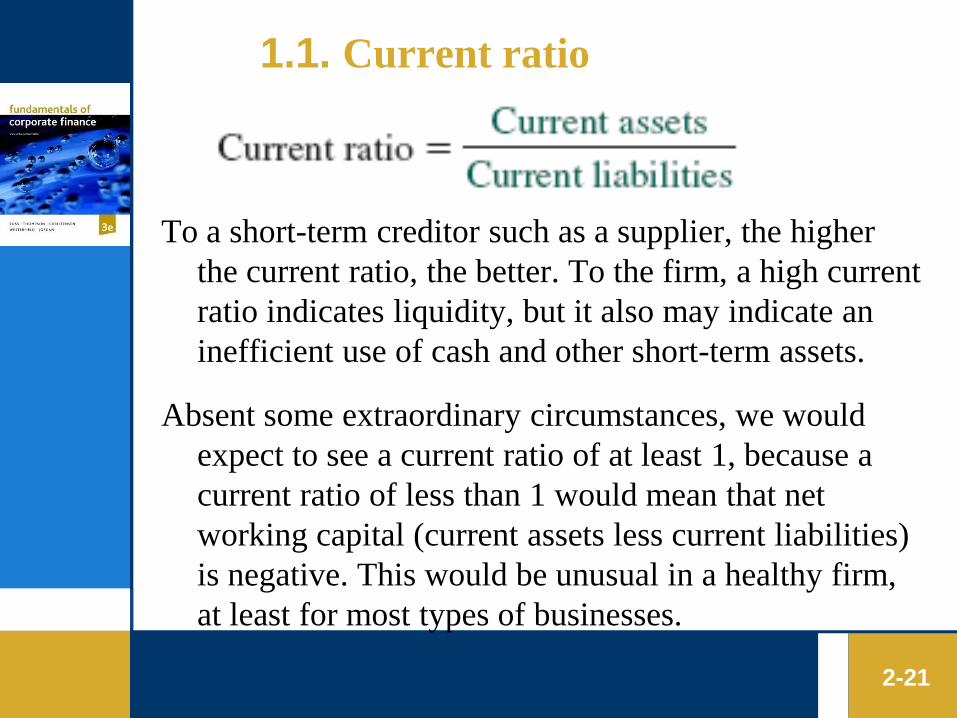
1.1. Current ratio
To a short-term creditor such as a supplier, the higher
the current ratio, the better. To the firm, a high current
ratio indicates liquidity, but it also may indicate an
inefficient use of cash and other short-term assets.
Absent some extraordinary circumstances, we would
expect to see a current ratio of at least 1, because a
current ratio of less than 1 would mean that net
working capital (current assets less current liabilities)
is negative. This would be unusual in a healthy firm,
at least for most types of businesses.
2-21
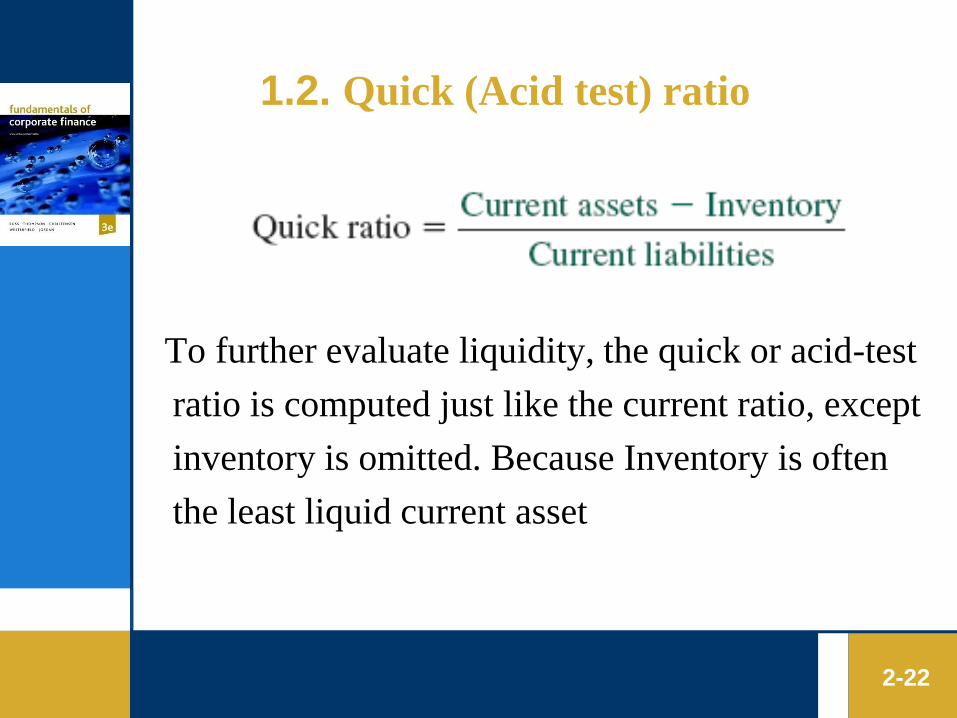
1.2. Quick (Acid test) ratio
To further evaluate liquidity, the quick or acid-test
ratio is computed just like the current ratio, except
inventory is omitted. Because Inventory is often
the least liquid current asset
2-22
2. Long-term solvency ratios
(financial leverage ratios)
Long-term solvency ratios are intended to
address the firm’s long-run ability to meet its
obligations, or, more generally, its financial
leverage.
These are sometimes called financial leverage
ratios or just leverage ratios
2-23
2.1. Total debt ratio
The total debt ratio takes into account all debts of
all maturities to all creditors. It can be defined in
several ways, the easiest of which is:
2-24
2.2. Debt-equity ratio
2-25
2.3. Debt-equity ratio
3. Asset management or turnover ratios
• The measures are sometimes called asset
utilization ratios.
• The specific ratios we discuss can all be
interpreted as measures of turnover. What they
are intended to describe is how efficiently or
intensively a firm uses its assets to generate
sales.
2-26

3.1. Inventory turnover
In a sense, X corporation sold off or turned over the
entire inventory 3.2 times.
As long as we are not running out of stock and
thereby forgoing sales, the higher this ratio is, the
more efficiently we are managing inventory.
2-27
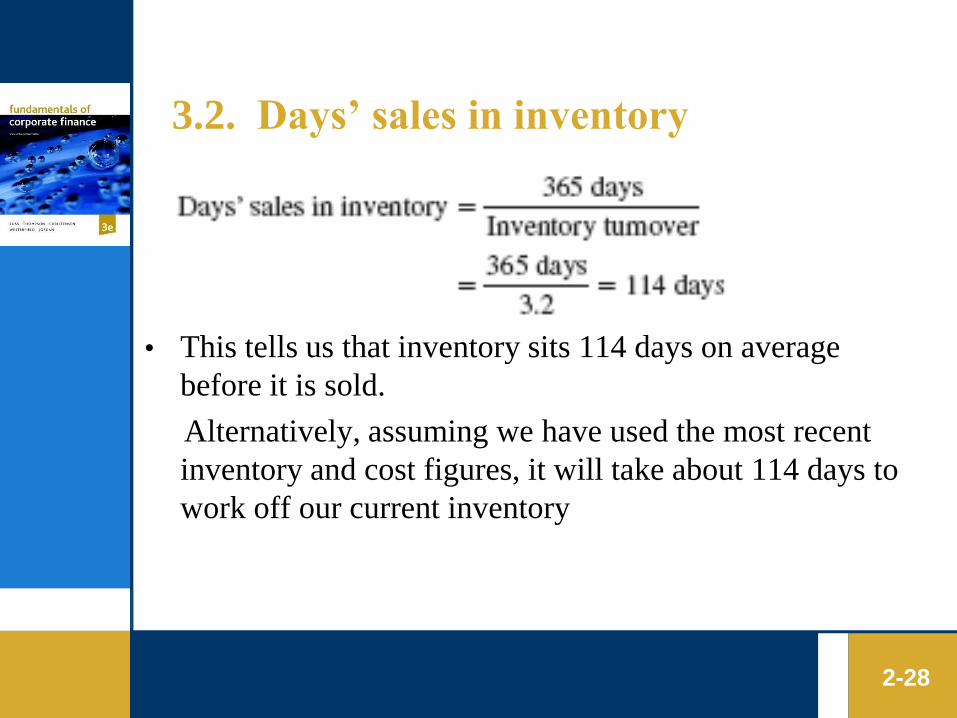
3.2. Days’ sales in inventory
• This tells us that inventory sits 114 days on average
before it is sold.
Alternatively, assuming we have used the most recent
inventory and cost figures, it will take about 114 days to
work off our current inventory
2-28
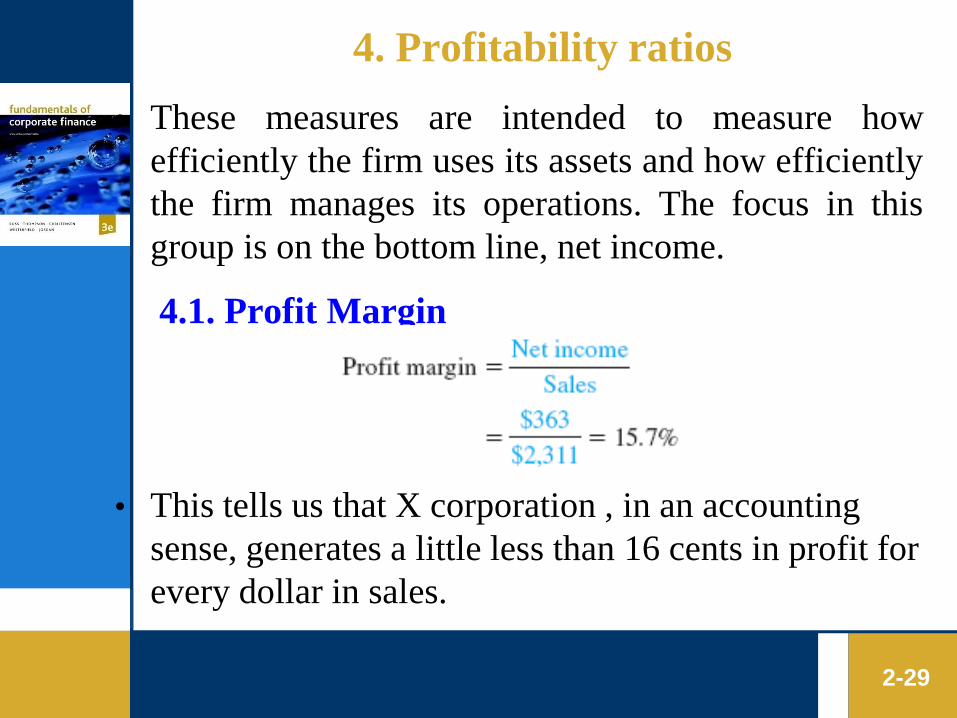
4. Profitability ratios
• These measures are intended to measure how
efficiently the firm uses its assets and how efficiently
the firm manages its operations. The focus in this
group is on the bottom line, net income.
• This tells us that X corporation , in an accounting
sense, generates a little less than 16 cents in profit for
every dollar in sales.
2-29
4.1. Profit Margin

4.2. Return on assets (ROA)
Return on assets (ROA) is a measure of profit per
dollar of assets.
4.3. Return on Equity (ROE)
Return on equity (ROE) is a measure of how the
stockholders fared during the year. ROE is the
true bottom-line measure of performance
2-30
5. Market value ratios
Our final group of measures is based, in part, on
information not necessarily contained in
financial statements—the market price per share
of the stock.
Obviously, these measures can only be calculated
directly for publicly traded companies.
5.1. Price-earnings ratio (P/E)
5.2. Market-to-book ratio (P/B)
2-31
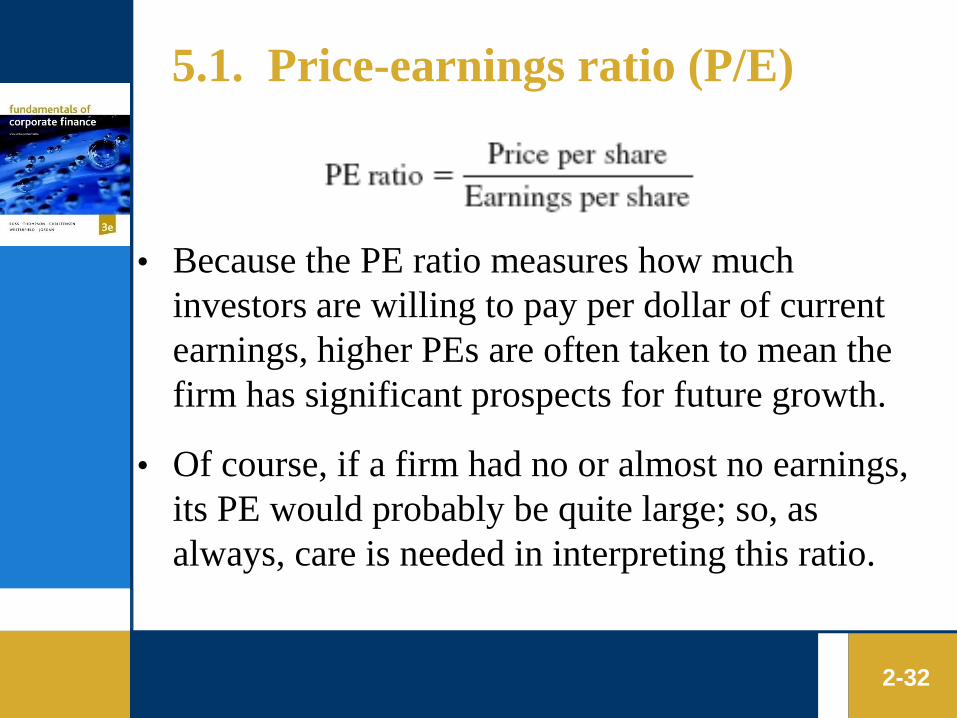
5.1. Price-earnings ratio (P/E)
• Because the PE ratio measures how much
investors are willing to pay per dollar of current
earnings, higher PEs are often taken to mean the
firm has significant prospects for future growth.
• Of course, if a firm had no or almost no earnings,
its PE would probably be quite large; so, as
always, care is needed in interpreting this ratio.
2-32
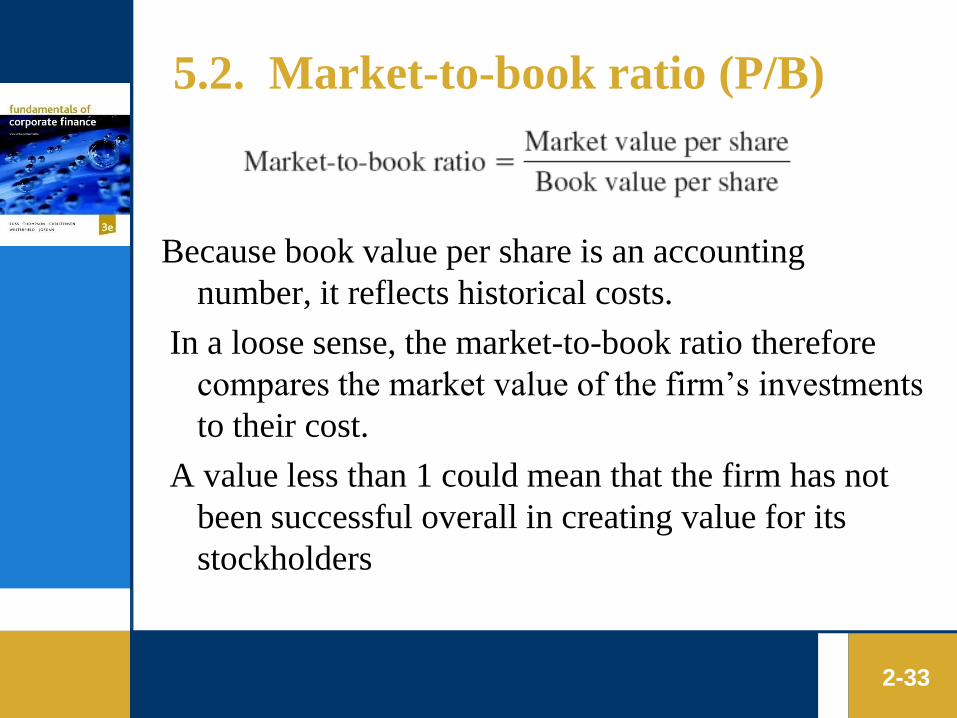
5.2. Market-to-book ratio (P/B)
Because book value per share is an accounting
number, it reflects historical costs.
In a loose sense, the market-to-book ratio therefore
compares the market value of the firm’s investments
to their cost.
A value less than 1 could mean that the firm has not
been successful overall in creating value for its
stockholders
2-33
Copyright 2004 McGraw-Hill Australia Pty Ltd
PPTs t/a Fundamentals of Corporate Finance 3e
Ross, Thompson, Christensen, Westerfield and Jordan
Slides prepared by Sue Wright
2-34
Choosing a Benchmark
• Given that we want to evaluate a division or a
firm based on its financial statements, a basic
problem immediately comes up. How do we
choose a benchmark, or a standard of
comparison?
• Time-Trend Analysis
• Peer Group Analysis
Copyright 2004 McGraw-Hill Australia Pty Ltd
PPTs t/a Fundamentals of Corporate Finance 3e
Ross, Thompson, Christensen, Westerfield and Jordan
Slides prepared by Sue Wright
2-35
Time-Trend Analysis
One standard we could use is history. Suppose we
found that the current ratio for a particular firm is
2.4 based on the most recent financial statement
information.
Looking back over the last 10 years, we might
find that this ratio had declined fairly steadily over
that period.
2-36
Peer Group Analysis
The second means of establishing a benchmark is to
identify firms similar in the sense that they
compete in the same markets, have similar assets,
and operate in similar ways. In other words, we
need to identify a peer group.
There are obvious problems with doing this since no
two companies are identical. Ultimately, the
choice of which companies to use as a basis for
comparison is subjective.
2-37
Problems with Financial Statement Analysis
1. One particularly severe problem is that many
firms are conglomerates, owning more or less
unrelated lines of business.
2. different firms use different accounting
procedures—for inventory, for example. This
makes it difficult to compare statements
2-38
Problems with Financial Statement Analysis
(cont.)
3. different firms end their fiscal years at different
times. For firms in seasonal businesses, this can
lead to difficulties in comparing balance sheets
because of fluctuations in accounts during the
year
4. for any particular firm, unusual or transient
events, such as a one-time profit from an asset
sale, may affect financial performance. In
comparing firms, such events can give
misleading signals.
2-39
Test Questions
1. Five areas that financial ratios concentrate on
are:
1. liquidity, profitability, debt, efficiency, market
related
2. profitability, strategy, liquidity, auditing, share
prices
3. liquidity, current ratio, quick ratio, interest cover,
dividend cover
4. market related, share prices, dividend policy, debt
policy, strategy
2-40
Test Questions
2. Ratios that measure the ability of the company to
pay its short-term debts are called:
1. debt ratios
2. liquidity ratios
3. profitability ratios
4. none of the above.
2-41
Test Questions
3. The quick ratio is defined as:
1. current assets divided by current liabilities
2. current assets divided by total debt
3. current assets less inventory, divided by total
liabilities
4. current assets less inventory, divided by current
liabilities
2-42

Test Questions
4. Return on sales, return on assets and return on
equity are examples of:
1. liquidity ratios
2. profitability ratios
3. efficiency ratios
4. market-related ratios
2-43
Test Questions
5. Net income divided by shareholders’ equity is
the definition of:
1. return on sales
2. return on assets
3. return on equity
4. none of the above.
2-44
Test Questions
6. The debt to equity ratio measures;
1. the likelihood of the company going bankrupt in the
short term
2. the efficiency of the company
3. the relative proportions of debt and equity in the
capital structure
4. liquidity
2-45
Test Questions
7. To measure the efficiency with which inventory
is used the following ratio should be used:
1. inventory turnover ratio
2. inventory holding period
3. lower of cost or market valuation of inventory
4. a or b, but not c
2-46
Test Questions
8. Earnings per share is affected by:
1. net income
2. number of shares
3. dividends
4. a & b, but not c
2-47
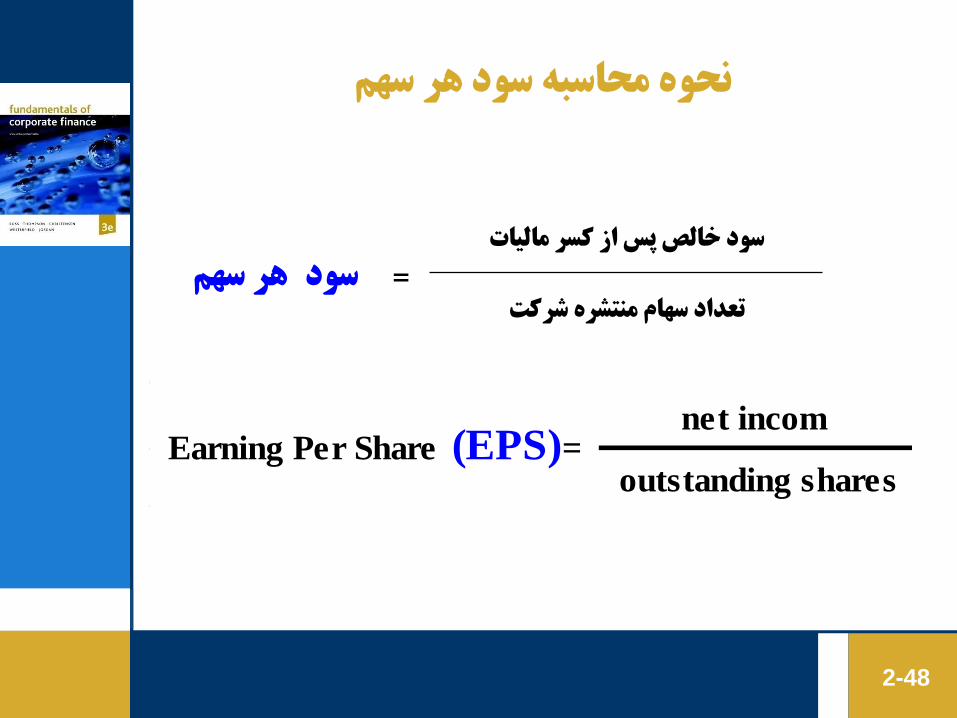
نحوه محاسبه سود هر سهم
سود خالص پس از کسر مالیاتهر سهمسود =
تعداد سهام منتشره شرکت
2-48
net incom
outstanding sharesEarning Per Share (EPS)=
Test Questions
9. Total asset turnover, receivables turnover and
inventory turnover ratios measure:
1. liquidity
2. profitability
3. efficiency
4. debt
2-49
Test Questions
10 . The stock price multiplied by the number of
shares outstanding is called:
1. market centralization
2. market capitalization
3. market stabilization
4. market compensation
2-50
Copyright 2004 McGraw-Hill Australia Pty Ltd
PPTs t/a Fundamentals of Corporate Finance 3e
Ross, Thompson, Christensen, Westerfield and Jordan
Slides prepared by Sue Wright
2-51
Test Questions
11. Sahand Company has current assets that
consist of cash: $20,000, receivables: $70,000
and inventory: $90,000. Current liabilities are
$75,000. The current ratio is:
1. 2.4
2. 2.2
3. 2
4. 0.41
2-52
Test Questions
12. Which of the following balance sheet
equations is incorrect?
1. Assets - Liabilities = Shareholders' Equity
2. Assets = Liabilities + Shareholders' Equity
3. Assets - Current Liabilities = Long Term
Liabilities
4. Assets - Current Liabilities = Long Term
Liabilities + Shareholders' Equity
2-53
Test Questions
13. The statement of financial position is also
known as the
1.balance sheet.
2.income statement.
3.statement of cash flows.
4.statement of stockholder's equity.
2-54
True or False Questions
Are the following statements true or false?
1. Financial statements can assist you in monitoring
your business’ financial health.
2. Current assets are those assets which form part of
the infrastructure of the business.
3. Current liabilities are those amounts owed which
need to be paid within a short period of time (i.e.
usually within 12 months).
2-55
True or False Questions
Are the following statements true or false?
4. Ratio analysis helpful to assessing profitability,
liquidity and financial stability.
5. Financial statements generally show trends,
relationships, strengths and weaknesses in key
areas of your business.
2-56
True or False Questions
Are the following statements true or false?
6. If your business sales for the period are $20,000
and the profit is $5,000. The profit margin for the
period is 25%.
7. Liquidity and efficiency are used synonymously in
ratio analysis.
2-57
True or False Questions
Are the following statements true or false?
8. Day's Sales in Inventory is equal to Ending
Inventory / Cost of Goods Sold.
9.The profit margin indicates the amount of net
income for every dollar in sales.
2-58
Concept Questions
1. What is the balance sheet identity?
2. What is liquidity?
3. Explain the difference between accounting value
and market value. Which is more important to the
financial manager?
4. What are the five groups of ratios? Give two or
three examples of each kind
5. Distinguish between fixed assets and current
assets.
2-59
Related Documents