88 CHAPTER THREE: RESULTS 3.1. Histopathology 3.1.1 Introduction The histology of normal colon tissue and the histopathology of colon cancer tissue had to be elucidated before experimental results could be analysed. Mayer’s haematoxylin was used in conjunction with the eosin counterstain as it clearly identifies nuclei after bluing in running water, while eosin stains the cytoplasm various shades of pink, thereby allowing for differentiation of the various tissues (Luna, 1960). 3.1.2 Normal colon tissue The normal colon tissue is composed of the epithelium, lamina propria, muscularis mucosae (which altogether constitute the mucosa), submucosa, muscularis propria, subserosa and serosa. A single layer of absorptive and goblet columnar cells lines the surface and the crypts of Lieberkühn (figure 3.1). The tubules are evenly arranged parallel to each other and contain endocrine, regenerative and Paneth cells, which are thought to be secreted antimicrobial elements. Lymphoid-glandular complexes are part of the mucosa associated lymphoid tissue and can be found scattered randomly in the mucosa, often protruding into the submucosa (Owen and Kelly, 1994; Levine and Haggitt, 1997). The lamina propria is composed of connective tissue occurring between the surface epithelium and the muscularis mucosae, containing plasma cells, lymphocytes (mostly T-cell), macrophages and eosinophils. The muscularis mucosa is a sheet of smooth muscle cells separating the lamina propria from the submucosa. The submucosal

Welcome message from author
This document is posted to help you gain knowledge. Please leave a comment to let me know what you think about it! Share it to your friends and learn new things together.
Transcript

88
CHAPTER THREE: RESULTS
3.1. Histopathology
3.1.1 Introduction
The histology of normal colon tissue and the histopathology of colon cancer tissue
had to be elucidated before experimental results could be analysed. Mayer’s
haematoxylin was used in conjunction with the eosin counterstain as it clearly
identifies nuclei after bluing in running water, while eosin stains the cytoplasm
various shades of pink, thereby allowing for differentiation of the various tissues
(Luna, 1960).
3.1.2 Normal colon tissue
The normal colon tissue is composed of the epithelium, lamina propria, muscularis
mucosae (which altogether constitute the mucosa), submucosa, muscularis propria,
subserosa and serosa. A single layer of absorptive and goblet columnar cells lines the
surface and the crypts of Lieberkühn (figure 3.1). The tubules are evenly arranged
parallel to each other and contain endocrine, regenerative and Paneth cells, which are
thought to be secreted antimicrobial elements. Lymphoid-glandular complexes are
part of the mucosa associated lymphoid tissue and can be found scattered randomly in
the mucosa, often protruding into the submucosa (Owen and Kelly, 1994; Levine and
Haggitt, 1997).
The lamina propria is composed of connective tissue occurring between the surface
epithelium and the muscularis mucosae, containing plasma cells, lymphocytes (mostly
T-cell), macrophages and eosinophils. The muscularis mucosa is a sheet of smooth
muscle cells separating the lamina propria from the submucosa. The submucosal

89
layer is composed of loose connective tissue with blood vessels and nerves. The
muscularis propria has an inner circular layer and an outer longitudinal layer of
muscle. The subserosa is composed of connective tissue occurring in between the
muscularis propria and the serosa, which is a mesothelial layer (Owen and Kelly,
1994; Levine and Haggitt, 1997).
Figure 3.1: Normal colonic tissue showing the crypts of Lieberkühn (CL) in the
lamina propria and mucin pools (MU) (x100).
3.1.3 Tumour classification
Tumours are classified into levels of differentiation based on the percentage of
dysplastic tissue that form glands compared to those that do not form glands. The
majority of tumours in the colon can be classified as well to moderately differentiated,
consisting of irregular glands lined with tall columnar or cuboidal epithelium, often
with necrotic debris in the lumina. The World Health Organization (WHO) grades
adenocarcinomas as follows:
MU
CL

90
Grade X – grade cannot be established
Grade 1 – well differentiated where more than 95% of the tumour has formed glands
(figure 3.4)
Grade 2 – moderately differentiated where 50-95% of the tumour has glandular
formation (figure 3.3)
Grade 3 – poorly differentiated where 5-49% of the tumour is composed of glands
Grade 4 – undifferentiated where less than 5% of the tumour has formed glands
(Hamilton and Aaltonen, 2000; figure 3.2).
Figure 3.2: Poorly differentiated adenocarcinoma (AC) as characterised by lack of
glandular formation. Mucin pools (MP) occur scattered throughout the diseased
tissue as well as areas of necrotic debris (ND) (x100).
AC
MP
ND

91
Figure 3.3: Moderately differentiated adenomatous glands (AG) in muscularis propria
(MP) adjacent to the subserosa (SS). This level of differentiation is characterised by
intermediate formation of well differentiated (WD) and poorly differentiated (PD)
glandular structure (A=x100; B=x400).
Figure 3.4: Well differentiated adenocarcinoma characterised by good glandular
structure. This is typified by lumen (LU) formation; the epithelium shows crowded
cells as seen by dense nuclei (N) and this is typical of cancer (x400).
A B
AG
MP
SSPD
WD
LU
N

92
An adenoma by definition is a benign epithelial neoplasm with tubular and/or villous
architecture, which exhibits dysplasia both structurally and cytologically. All
adenomas have at least low grade dysplasia. In neoplastic progression an adenoma
showing high grade dysplasia or adenocarcinoma in situ, where the basement
membrane is still intact, advances into an adenoma with intramucosal carcinoma,
where there is invasion of the lamina propria. When the submucosa is invaded, the
carcinoma has advanced to adenoma with invasive carcinoma (figure 3.5), and
beyond this stage the carcinoma is classified as metastatic (figure 3.6) (Cooper et al.,
1998).
Figure 3.5: Well differentiated adenocarcinoma (AC) in the smooth muscle (SM) of
the submucosa. The formation of glands as seen by lumen (LU) formation
characterises this level of differentiation (x100).
SM
LU
AC

93
Figure 3.6: Well differentiated adenocarcinoma (AC) in smooth muscle (SM) in
muscularis propria adjacent to the fat cells of the subserosa (SS) (x100). As the
dysplastic glands have penetrated beyond the submucosa, it is now classified as an
invasive carcinoma.
Figure 3.7: Moderately differentiated adenomatous glands in the submucosa typified
by both poorly (PD) and well differentiated (WD) structures (x100). Necrotic debris
(ND) can be seen in the lumens of the glandular structures, indicative of apoptosis
occurring in the vicinity.
SS
AC
SM
PD
WD
ND

94
Figure 3.8: Well differentiated adenomatous glands (AG) in the submucosa adjacent
to the muscularis mucosa (MM) and crypts of Lieberkühn (CL) (x100). The
dysplastic glands are not classified as invasive as they have not penetrated beyond the
submucosal layer.
3.1.4 Summary
This histopathology section formed the essential background needed to familiarise
oneself with the normal and cancerous colon tissues, particularly as colon cancer
occurs at different levels of differentiation. It allowed for the identification of the
different tissue layers, the main cell types, normal and dysplastic structures and
progressive changes with advancing cancer stages. The haematoxylin and eosin
stained sections allowed for changes to be studied and will prove invaluable in further
sections where localisation studies are performed.
MM
CL
AG
95
3.2 Quantitative PCR
The aim of this experiment was to quantify the three DWNN transcripts in DNA
extracted from a cancerous colon cell line (HT29) and compare the levels to those
present in the DNA extracted from a normal kidney cell line (Graham 293). This
would allow for conclusions to be drawn as to what degree the DWNN transcripts are
expressed in cancerous cells. Forward and reverse primers for 5’ DWNN-13, 3’
DWNN-200 and exon 16 were employed. The LightCycler measures the fluorescent
signals produced during the log-linear or exponential increase phase of the PCR
reaction. Real-time PCR is both fast and accurate, and the LightCycler eliminates the
need for additional purification or analysis, and reduces the risk of contamination as
the optical tubes and reaction plates are closed during the process. The SYBR Green
fluorescent dye is used which is specific only for double-stranded DNA therefore only
PCR product is fluoresced. As the number of PCR cycles increase, the more double-
stranded PCR product formed and the higher the fluorescence. The reference gene
GADPH was used as a positive control for both cell-lines as it is constitutively
expressed in all cells.
Results showed that firstly, the GADPH gene was found at the highest levels in both
the normal and cancerous cell-lines (figure 3.9). The 5’ DWNN-13, which is the full-
length DWNN gene, was shown to be present at the highest concentration. This is to
be expected as all three transcripts would be synthesized. The gene showed a clear
upregulation in colon cancer cells compared to the normal undiseased cells, and this
finding is confirmed in the successive experiments. The next highest level of
amplification was seen with the exon 16 DNA in the colon cancer cells, followed by
the RBBP6 region. This is contradictory as the RBBP6 primers amplify the length of

96
DNA, which includes the exon 16, therefore RBBP6 should be found at higher
concentrations than exon 16. However, in normal cells RBBP6 was found at higher
concentrations than exon 16 (figure 3.9).
Normal GADPH Cancer GADPH Normal DWNN Cancer DWNN
Cancer E16 Cancer RBBP6 Normal E16 Normal RBBP6
Figure 3.9: Amplification of the DWNN transcripts via real-time PCR in a normal
kidney cell-line and a colon cancer cell-line.
3.2.1 Summary
Quantitative PCR showed that the DWNN gene, 3’ DWNN 200 and exon 16 were all
upregulated in colon cancer cells compared to normal undiseased cells. This suggests
that the DWNN transcripts must play a role in cancer progression and the following
experiments aim to elucidate if this role promotes or hinders the disease.

97
3.3 In situ hybridisation
As there are three transcripts of the DWNN gene, it has yet to be determined whether
all three forms are equally involved in apoptosis and expressed at similar levels, or if
there is a particular transcript/s that is the key player/s in apoptosis. This was
ascertained by colorimetric and fluorescent in situ hybridisation (ISH, FISH), which
employs a labelled DNA probe which binds to complementary mRNA and
localisation is detected under light and fluorescent microscopy.
3.3.1 Probe synthesis of the 1.1kb transcript
3.3.1.1 Ligation and transformation
The p21C4 DNA clone complementary to the 3’ end of the 1.1kb DWNN mRNA was
ligated into the pGEM T-Easy vector using the Promega Ligafast kit. This vector
system is used as it has a multiple cloning site allowing for the EcoR1 enzyme to cut
at two sites, the SP6 promoter region and the T7 promoter region, thereby releasing
the insert from the vector. The PST enzyme was used to linearise the vector as it only
cuts at SP6 promoter region. It is also convenient because it has 3’-thymidine
overhangs, which allows for correct ligation of the PCR product. With the action of
Taq polymerase, the PCR product had an adenosine base added to the 3’ ends.
E. coli MC1061 competent cells were transformed with the vector containing the
insert, incubated with the nutrient-rich Luria broth to promote growth and plated on
Ampicillin agar plates. As the pGEM T-Easy vector has an ampicillin-resistant
domain, the only colonies that were able to grow on the plates were the cells that had
taken up the vector. The positive colonies were able to grow again on new ampicillin
agar plates; this was done to confirm the results from the first plates. The positive

98
colonies were grown overnight in Luria broth containing ampicillin to increase the
concentration of colonies for mini-prepping.
3.3.1.2 DNA isolation & linearisation
Mini-prepping was performed to isolate the pGEM T-Easy vectors containing the
DNA inserts from the competent cells into which it had been ligated. This was
accomplished by using the Promega WizardPlus SV Miniprep DNA Purification
System kit. This step was necessary to attain a purer form of the insert of interest. At
this point the insert still had to be linearised. This was done by using the PST
enzyme. The vector was also cut with the EcoR1 enzyme to establish if the insert was
present; this would be clarified by running the two digests on an agarose gel together
with the uncut clone from the mini-prep and a DNA marker.

99
1 2 3 4 5
Lane 1: DNA ladder
Lane 3: uncut clone
Lane 4: clone cut with EcoR1 with released 13kDa insert
Lane 5: clone cut with PST
Figure 3.10: Agarose gel showing restriction digestion
The PST band is isolated from the gel and the DNA purified. Spectrophotometric
readings are taken to ascertain the purity and concentration of the DNA before
labelling. The calculation of the purified linearised clone was calculated at 260µg/ml.
500bp
insert

100
3.3.1.3 Digoxigenin labelling of probe
The Digoxigenin system results in the synthesis of an RNA probe, which is
complementary to the 1.1kb transcript, isolated in the steps above. The probe is in the
5’ to 3’ orientation limiting it to only bind to the 3’ end of the complementary mRNA.
The Digoxigenin system results in a colorimetric reaction. The labelled probe
hydrogen bonds to complementary mRNA. Anti-Digoxigenin binds to the
Digoxigenin on the probe. Alkaline phosphatase in turn binds to anti-Digoxigenin
and upon addition of the substrate NBT/BCIP a purple/blue colour change occurs as
alkaline phosphatase cleaves the substrate. The more copies of DWNN there are, the
deeper the shade of blue therefore it is a quantitative technique.
cleavage
substrate
alkaline phosphatase anti-Dig Dig-labelled RNA probe 5’ DIG DIG DIG complementary mRNA
Figure 3.11: Diagrammatic representation of in situ hybridisation
Dilutions of the labelled probe were run with a labelled control to ascertain the
minimal concentration at which the probe could be detected. Using 14µl of the PST-
cut clone of the 1.1kb mRNA, labelling with Digoxigenin showed that this
concentration was 10ρg/µl. For in situ hybridisation therefore, the probe was diluted
to this concentration.
AP
NBT/BCIP
3’
101
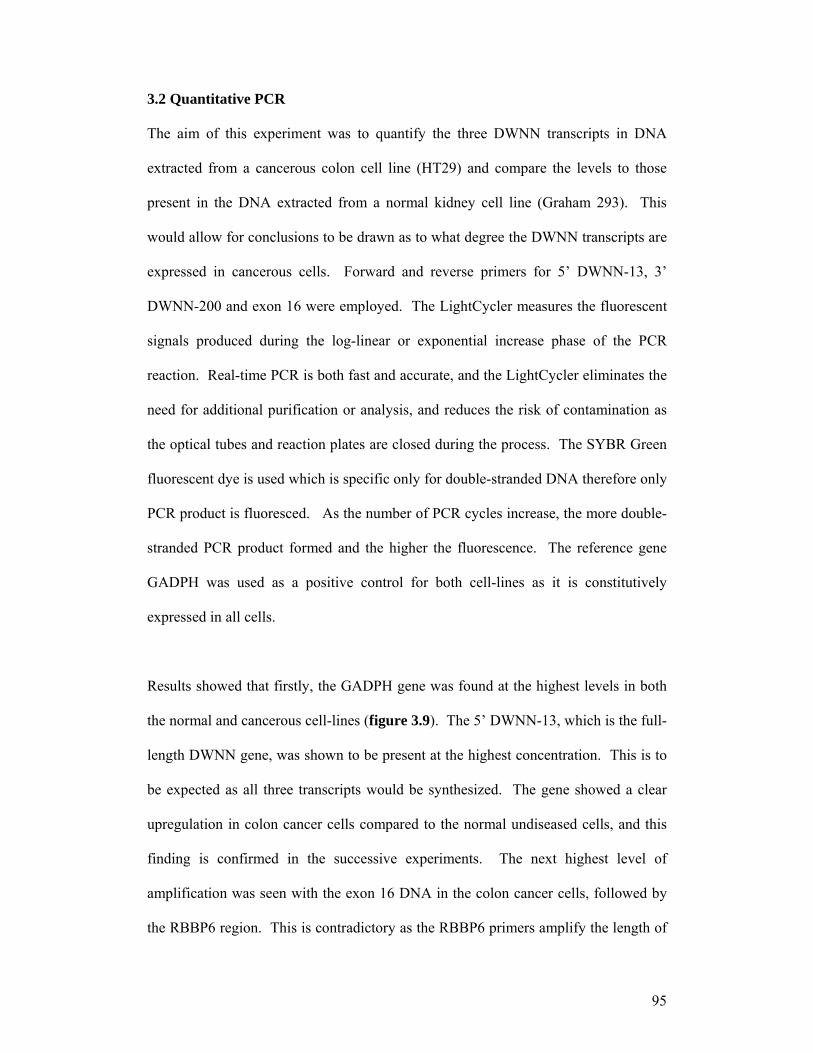
3.3.1.4 Colorimetric ISH images
Figure 3.12: Negative control of colon cancer tissue showing moderately
differentiated adenomatous glands (AG) in the submucosa as denoted by nuclear and
cytoplasmic counterstaining (x400).
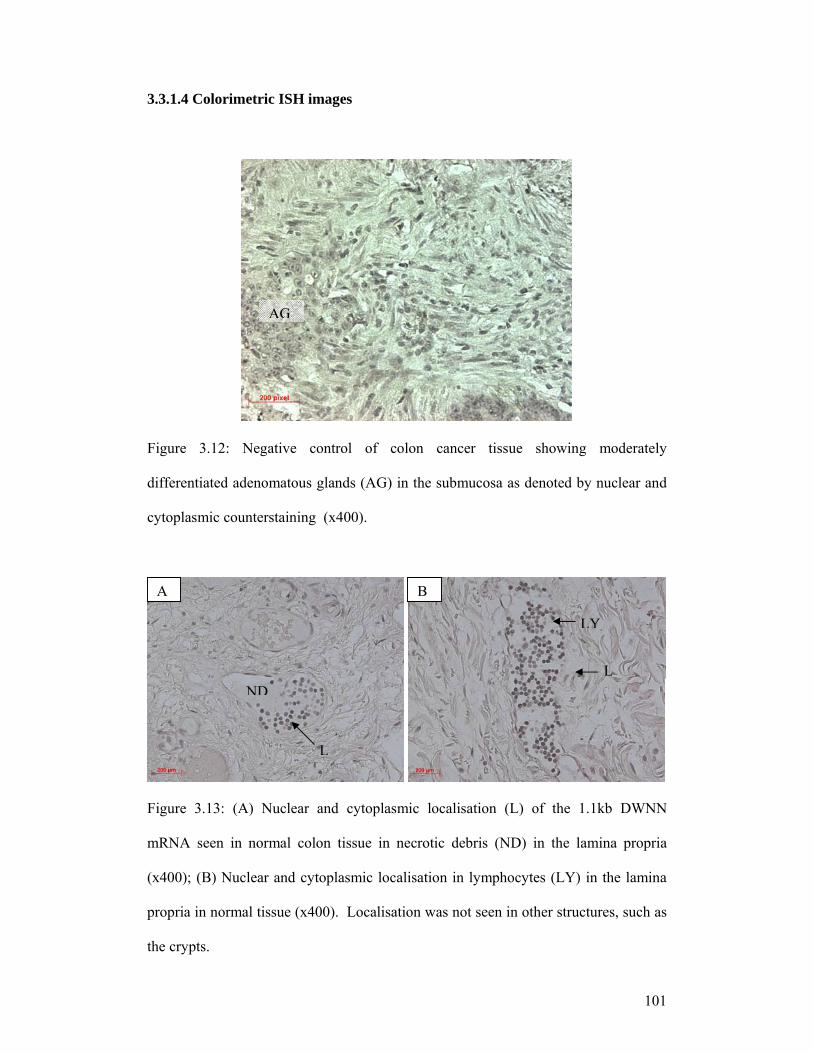
Figure 3.13: (A) Nuclear and cytoplasmic localisation (L) of the 1.1kb DWNN
mRNA seen in normal colon tissue in necrotic debris (ND) in the lamina propria
(x400); (B) Nuclear and cytoplasmic localisation in lymphocytes (LY) in the lamina
propria in normal tissue (x400). Localisation was not seen in other structures, such as
the crypts.
A B
AG
LY
NDL
L

102
A
Figure 3.14: Localisation (L) of the 1.1kb mRNA in the subserosa (identifiable by fat
cells - F) adjacent to poorly differentiated adenocarcinoma (AC) suggesting a
relationship between the DWNN transcript and the carcinomatous tissue. Only by
looking at the results from apoptosis detection can it be established whether the
transcript aids or hinders cancer progression (A= x100; B= x400).
Figure 3.15: Localisation (L) of the 1.1kb mRNA in lymphocytes in necrotic debris
(ND) in lumen (LU) of moderately differentiated adenomatous glands (AG) in
submucosa suggesting that the DWNN transcript is involved in cell death (A = x400;
B = x1000). At higher magnification, it can be seen that the localisation is nuclear
(B).
A B
AC
F
L
A B
AG
LU
L
L
ND
F

103
Figure 3.16: Localisation (L) of the 1.1kb mRNA in moderately differentiated
adenocarcinoma (AC) in subserosa, again implying a relationship between the gene
and carcinomatous cells (A= x400; B= x1000). Higher magnification shows this
localisation to be nuclear (B).
Figure 3.17: Localisation (L) of the 1.1kb DWNN mRNA in muscularis mucosae
(MM) adjacent to well differentiated adenomatous glands (x400). Although not
directly in the gland, the tissue is itself dysplastic as evident from the distorted
histopathology, and localisation of the gene supports the hypothesis that the transcript
is somehow associated with the disease state.
L
MM
A
L
AC
L
B

104
Figure 3.18: Nuclear localisation (L) of the 1.1kb mRNA in a poorly differentiated
adenomatous gland and localisation in adjacent dysplastic muscularis mucosa (x400).
Figure 3.19: Localisation of the 1.1kb mRNA in dysplastic lamina propria (x400).
L

105
3.3.1.5 FISH images
Figure 3.20: Negative control whereby the probe complementary to the 1.1kb DWNN
mRNA was omitted from the reaction, hence the lack of fluorescent labelling in the
well differentiated adenocarcinoma in the muscularis propria (x400).
Figure 3.21: Localisation of 1.1kb mRNA in lymphocytes (LY) in normal lamina
propria (LP) surrounding crypts of Lieberkühn (CL) (A) and cytoplasmic localisation
(L) in adjacent muscularis propria mucosa (MM) (B) (x400).
A B
LY
CL
LP L
MM
AC

106
Figure 3.22: In A, cytoplasmic localisation (L) of the 1.1kb mRNA is observed in
well differentiated adenocarcinoma (AC) in the muscularis propria (MP), and in B
there is cytoplasmic and nuclear localisation in the surrounding muscularis propria
(x400).
Figure 3.23 A: Cytoplasmic localisation (L) of the 1.1kb mRNA in moderately
differentiated adenocarcinoma (AC) in the muscularis propria (MP); B: nuclear and
cytoplasmic localisation is also observed in the surrounding muscularis propria
(x400).
L
AC
MP
L
MP
AC
MPA B
MPAC
L
A B
AC
MP
L L
AC
L

107
Figure 3.24: Cytoplasmic localisation (L) of the 1.1kb mRNA seen in the muscularis
propria (MP). Localisation in the adjacent poorly differentiated adenocarcinoma (AC)
was not observed (x400).
Figure 3.25: Cytoplasmic localisation (L) of the 1.1kb DWNN mRNA in the
submucosa (SM) surrounding moderately differentiated adenomatous glands (AG)
(x400).
L
MP
AC
L
LAG
SM

108
3.3.1.6 Summary
By synthesizing a labelled RNA probe that is only able to bind to the 1.1kb DWNN
mRNA, it was concluded by colorimetric and fluorescent means exactly where in the
normal and cancerous tissue the mRNA is found. Although the mRNA was localised
in normal undiseased colon tissue, the levels were upregulated in cancerous tissue,
particularly in the nuclei of lymphocytes in all three grades of the adenomatous glands
and the adenocarcinomas. The mRNA was also upregulated in the dysplastic tissues
adjacent to these structures and in necrotic debris in the lumen of the glands. As the
debris was as a result of cell death, it implies that the gene plays a role in this process.
From this experiment it can therefore be concluded that the 1.1kb DWNN mRNA is
upregulated in dysplastic structures, tissues and carcinomas in colon cancer.

109
3.3.2 In situ hybridisation of the 6.1kb + E16 mRNA
3.3.2.1 Probe synthesis
The DIG-labelled RNA probe complementary to the 3’ end of the 6.1kb mRNA
transcript of DWNN i.e. the complete long form of the gene (6.1kb + E16), was
synthesized and labelled according to the same procedure as mentioned in 3.3.1. An
agarose gel confirmed the insert of interest before labelling was performed. Similar to
the probe complementary to the 1.1kb mRNA, this probe was synthesized in the 5’ to
3’ direction so that it is only able to bind to the 3’ end of the complementary DWNN
mRNA.
3.3.2.2 Colorimetric ISH images
Figure 3.26: Normal colon tissue showing nuclear localisation (L) of 6.1kb + E16
mRNA in lamina propria surrounding crypts of Lieberkühn (CL) (A = x400; B =
x1000). Nuclear localisation was also seen under high magnification.
A B
CL
LP
L
L
L
L

110
Figure 3.27: Nuclear localisation (NL) of 6.1kb + E16 mRNA in well differentiated
adenocarcinoma (AC) in muscularis propria (MP) and in adjacent single invasive cells
(IC) (x1000).
Figure 3.28: Nuclear localisation (NL) of the 6.1kb + E16 mRNA in moderately
differentiated adenocarcinoma (AC) in muscularis propria (x1000). Cytoplasmic and
nuclear localisation was also seen in adjacent lymphocytes and single invasive cells.
NL
NL
ICAC
MP
AC
NL
NL

111
Figure 3.29 A, B: Cytoplasmic (CYL) and nuclear (NL) localisation (L) of the 6.1kb
+ E16 mRNA transcript in lymphocytes adjacent to poorly differentiated
adenocarcinoma in muscularis propria (MP) (A = x400; B = x1000).
Figure 3.30 A, B: Cytoplasmic (CYL) and nuclear (NL) localisation (L) of 6.1kb +
E16 mRNA in lymphocytes (LY) adjacent to moderately differentiated adenomatous
glands in submucosa (SM) (A = x400; B = x1000).
A B
L
SMCYL
NL
SM
A B
L
MP
MP
CYL
NL

112
3.3.2.3 FISH images
Figure 3.31: Negative control in a poorly differentiated adenocarcinoma case where
the probe complementary to the 6.1kb + E16 mRNA was omitted, resulting in no
fluorescent labelling (x400).
Figure 3.32: Cytoplasmic localisation (L) of 6.1kb + E16 mRNA in lamina propria
(LP) in normal tissue in between the crypts of Lieberkühn (CL) (x400).
L
CL
LP
AC

113
Figure 3.33: Nuclear and cytoplasmic localisation (L) of the 6.1kb + E16 mRNA in
the submucosa (SM) surrounding moderately differentiated adenomatous glands (AG)
(x400).
Figure 3.34: In A, cytoplasmic localisation (L) of 6.1kb + E16 mRNA is observed in
moderately differentiated adenomatous glands (AG) in the submucosa (SM) and in B,
cytoplasmic localisation in surrounding submucosal tissue (x400).
AG
AG
AG
SM L
L
L
SM
A B
L
LAG

114
Figure 3.35: Minimal localisation (L) of 6.1kb + E16 mRNA in well differentiated
adenocarcinoma (AC) in the muscularis propria (MP) (x400).
3.3.2.4 Summary
The RNA probe complementary to the 3’ end of the 6.1kb mRNA localises the
complete long form of the DWNN gene. Localisation studies showed an upregulation
of this mRNA in colon cancer tissues compared to normal colon tissue, particularly in
lymphocytes adjacent to adenomatous glands and adenocarcinomas, as well as in the
dysplastic glands and carcinomas. The 1.1kb mRNA, however, showed greater
upregulation than the 6.1kb mRNA, and this is an unexpected result as one would
anticipate the 6.1kb mRNA to be found at higher levels since this transcript contains
the binding sites for the tumour suppressors, p53 and Rb.
L
ACMP

115
3.3.3 In situ hybridisation of the exon 16 mRNA
A probe complementary to exon 16 of the 6.1kb + E16 mRNA was synthesized. By
comparing the results from ISH of the 6.1kb + E16 mRNA (section 3.2.2) with these
results, it is possible to estimate the extent of localisation of the 6.1kb – E16 mRNA.
3.3.3.1 Colorimetric ISH images
Figure 3.36: Cytoplasmic and nuclear localisation (L) of exon 16 mRNA in
lymphocytes in dysplastic lamina propria (LP) surrounding the crypts of Lieberkühn
(CL) in normal colon tissue (x400).
CL
LP
L
L

116
Figure 3.37: Nuclear localisation (L) of the exon 16 mRNA in lymphocytes in the
necrotic debris (ND) in the lumen of a well differentiated adenomatous gland (AG)
and in the submucosa (SM) (x400).
Figure 3.38A: Cytoplasmic and nuclear localisation (L) of exon 16 mRNA in
moderately differentiated adenocarcinoma (AC) and in the surrounding muscularis
propria (MP); B: cytoplasmic and nuclear localisation (L) in lymphocytes in the fat
cells (F) of the subserosa and in the muscularis propria (MP) (x400).
A B
L
L
MP
AC
L
L
F
MP
L
L
AG SM
ND

117
Figure 3.39: Localisation (L) in lymphocytes in dysplastic muscularis propria (MP)
adjacent to well differentiated adenocarcinoma (x400).
3.3.3.2 Summary
The exon 16 mRNA showed localisation mainly in the lymphocytes occurring in well
and moderately differentiated adenocarcinomas, well differentiated adenomatous
glands and their surrounding dysplastic tissue. Localisation was also observed in
necrotic debris found within the lumens of adenomatous glands. Although it is
difficult based on this “subtractive” method to estimate the localisation of the 6.1kb –
E16 mRNA this way, this experiment allowed for the identification of sites of
localisation of the exon 16 mRNA and when correlated with the results from
quantitative PCR, it serves to confirm to a degree that the 6.1kb – E16 mRNA is
found at lower levels in cancerous tissue than the 6.1kb + E16 mRNA. This suggests
that exon 16 plays a significant role in the functioning of the 6.1kb mRNA in diseased
tissues.
LL
MP

118
3.4 Immunocytochemistry (DWNN)
This technique was used to localize the expression of the DWNN gene, to establish in
which parts of the tissue the proteins were expressed, and to what extent, if any, they
were upregulated in diseased tissues compared to normal tissue.
Immunocytochemistry determines the localization of DWNN proteins by using the
labelled rabbit antihuman DWNN primary antibody to mark specific antigens found
on the protein. The biotinylated mouse antirabbit secondary antibody, which reacts
with peroxidase conjugated streptavidin, binds to the primary antibody, which has
attached itself to the complementary DWNN protein. The chromogen 3, 3’-
diaminobenzidine (DAB) is cleaved by peroxidase, resulting in a brown-coloured
precipitate developing at the site of the antigen location.
Biotin is a small molecule that is strongly bound by the avidin and streptavidin
proteins. The preformed complex used here consists of a molecule of streptavidin
with three molecules of biotin-labelled peroxidase. As the secondary antibody is also
labelled with biotin, the free biotin-binding site on the streptavidin binds to this
antibody. This results in three molecules of the streptavidin-peroxidase complex
bound per biotin-labelled antibody. Endogenous biotin that may be present is blocked
by heat treatment for more accurate results.
Two different antibodies are used: 1 is specific for the protein expressed by the 5’ end
of the 1.1kb mRNA i.e. the 5’ end of the 13kDa protein and will therefore localise to
all DWNN proteins; the second is specific only to the protein expressed by the
RBBP6 region of the 6.1kb mRNA and will only localise these proteins.
L

119
streptavidin + peroxidase
2° biotinylated antibody
1° antibody
antigen
DWNN protein
Figure 3.40: Diagrammatic representation of the reactions involved in
immunocytochemistry
3.4.1 Localisation of the DWNN protein
Figure 3.41: Negative control where diaminobenzidine has been excluded, hence the
lack of labelling (x400). This section shows well differentiated adenocarcinoma (AC)
in the muscularis propria (MP).
AC
diaminobenzidine
MP

120
Figure 3.42: Positive control showing nuclear and cytoplasmic localisation of the
DWNN protein in the semeniferous tubules (ST) of the testes (x400). As it has
previously been ascertained that DWNN is highly expressed in this tissue, this is the
standard to which experimental results are compared to determine if labelling is
positive.
Figure 3.43: Normal undiseased colon showing nuclear and cytoplasmic localisation
of the DWNN protein in lamina propria (LP) in between the crypts of Lieberkühn
(CL) (x400) indicating that the gene is expressed in normal tissue.
ST
LP
CL

121
Figure 3.44: Cytoplasmic localisation of the DWNN protein in poorly differentiated
adenomatous glands (AG) in the lamina propria (x400). Expression of the gene in
dysplastic tissues further verifies its involvement in cancer progression.
Figure 3.45A, B: Cytoplasmic localisation (L) of the DWNN protein in lymphocytes
(LY) (A = x400; B = x1000).
AG
A B
L L
L
LY

122
Figure 3.46: Nuclear and cytoplasmic localisation of the DWNN protein in well
differentiated adenomatous glands (AG) in submucosa (x400), suggesting that
DWNN expression has a significant relationship with dysplastic tissue. As in ISH, it
can only be determined if the protein aids in cancer progression or inhibits it after
examining the results from apoptosis detection.
Figure 3.47: Cytoplasmic localisation of the DWNN protein in the crypts of
Lieberkühn (CL) in dysplastic lamina propria (x400). The protein is expressed in the
proliferative zone of the crypts (i.e. the lower third).
AG
CL

123
Figure 3.48A, B: Cytoplasmic localisation of the DWNN protein in blood vessel
(BV) in subserosa (SS) (A = x400; B = x1000).
BV
SS
A B

124
3.4.2 Localisation of the RBBP6 protein
Figure 3.49: Cytoplasmic localisation (L) of the RBBP6 protein in the crypts of
Lieberkühn (CL) in the lamina propria (LP) of normal colon tissue (x400).
Figure 3.50: Cytoplasmic localisation (L) of the RBBP6 protein in moderately
differentiated adenomatous glands (AG) in the submucosa (SM) (x400).
LP
CL
L
L
SM
AG

125
Figure 3.51: Cytoplasmic localisation (L) of the RBBP6 protein in well differentiated
adenomatous glands (AG) and in the surrounding submucosa (SM) (x400).
Figure 3.52: Cytoplasmic localisation (L) of the RBBP6 protein in moderately
differentiated adenocarcinoma (AC) in the muscularis propria (MP) (x400).
L L
AGSM
LL
AC
MP

126
Figure 3.53: Cytoplasmic localisation (L) of the RBBP6 protein in the muscularis
propria (MP) surrounding well differentiated adenocarcinoma (AC) (x400).
Figure 3.54: Cytoplasmic localisation (L) of the RBBP6 protein in well differentiated
adenocarcinoma (AC) in A; and in B cytoplasmic localisation (L) of the RBBP6
protein in the surrounding muscularis propria (MP) (x400).
L
AC
MP
A B
LL
MP
AC MP

127
3.4.3 Image analysis of DWNN protein
Image analysis was performed to determine the labelling intensity of
diaminobenzidine localising the DWNN protein in nine colonic structures. A digital
image is made up of pixels with a grey scale ranging from 1 to 256.
Diaminobenzidine labelling falls between 160 and 256. Areas of structures showing
labelling were divided into three or four sectors to attain a higher n value and the total
number of pixels representing high immunolabelling was calculated per µm2. The
average for each structure was then calculated and this was then multiplied by 100 to
obtain a comprehensible value. The average deviations were also calculated, denoted
by error bars in the graph (figure 3.55)
Figure 3.55: Average immunolabeling of DAB per area
NEG – negative control
NLP – normal epithelial tissue
PDAG – poorly differentiated adenomatous glands
MDAG – moderately differentiated adenomatous glands
0
20
40
60
80
100
120
NEG NLP PDAG MDAG WDAG PDAC DYS NECR LYMP BV
Ave
rage
pix
els/
um2

128
WDAG – well differentiated adenomatous glands
PDAC – poorly differentiated adenocarcinoma
DYS – dysplastic tissue
NECR – necrotic debris
LYMP – lymphocytes
BV – blood vessel
From this analysis it can be ascertained in which structures the DWNN protein is
upregulated in comparison to the negative control and the normal colon tissue.
Diaminobenzidine labelling was seen in the negative control, suggesting that the
secondary antibody in conjunction with peroxidase, has resulted in the cleavage of
this substrate. However, results can still be interpreted by subtracting this value of the
negative control from the labelling of each structure. To determine the level of
protein upregulation, labelling in each structure is compared to that of the normal
colon tissue, as denoted by NET (normal epithelial tissue). From this, it can be
observed that there was no upregulation of the DWNN protein in poorly differentiated
adenocarcinomas (PDAC) as it showed the same level of labelling as the normal
tissue.
There was a slight upregulation in the moderately differentiated adenomatous glands
(MDAG) and even more upregulation in the dysplastic tissues (DYS). Significantly
more upregulation of the protein could be seen in the poorly (PDAG) and well
differentiated adenomatous glands (WDAG), necrotic debris (NECR) and the blood
vessels (BV). The highest level of upregulation of the DWNN protein was shown to
be in the lymphocytes (LYMP), as also observed in the images.

129
3.4.4 Summary
Immunocytochemistry allowed for the DWNN protein to be localised in normal and
cancerous tissues and from this it was observed that there was an upregulation of
DWNN expression in cancerous structures and their neighbouring dysplastic tissues.
Not only was the expression particularly significant in dysplastic structures, such as
adenocarcinoma, but it was only seen in the proliferative zone of the crypts in
dysplastic lamina propria implying that these proliferating cells were expressing the
gene in the abnormal tissue. Image analysis showed increased upregulation in well
and poorly differentiated adenomatous glands, necrotic debris, blood vessels and in
the lymphocytes.
Localisation of the protein expressed by the RBBP6 region of the 6.1kb DWNN
mRNA did not show a level of upregulation as high as that of the DWNN protein.
Low levels of localisation were observed in moderately and well differentiated
adenomatous glands and moderately and well differentiated adenocarcinomas, as well
as in the surrounding dysplastic tissues. These results suggest that although the
RBBP6 protein is found in these cancerous structures, it is the 13kD DWNN protein
that plays the major role in colon cancer.
With ISH and ICC it can only be concluded that the mRNA and the DWNN protein
are upregulated in dysplastic structures and tissues, but at this point it cannot be said
what role DWNN plays in cancer progression.

130
3.5 TUNEL
Terminal deoxynucleotide transferase-mediated deoxyuridine triphosphate biotin
nick-end labelling, or TUNEL, was applied to visualise where in the tissues apoptosis
was occurring. By comparing the results from in situ hybridisation and
immunocytochemistry, it could then be ascertained if DWNN expression was directly
correlated with the apoptotic process. If a significant relationship was found, it could
be deduced whether the gene (and the particular transcript probed for) was pro- or
anti-apoptotic.
During apoptosis endogenous endonucleases result in the formation of DNA
fragments which are partially responsible for the morphological changes seen in the
nuclei of apoptotic cells. These fragments are in the region of 180 to 200 base pairs.
The tissue sections are first treated with Proteinase K, which digests cross-linked
proteins to increase cell permeability and contact with the DNA. The DeadEndTM
Colorimetric TUNEL system adds biotinylated deoxyuridine at the 3’-OH DNA ends
of each fragment by application of the enzyme, terminal deoxynucleotidyl transferase
(TdT). The nontemplate-dependent DNA polymerase, Tdt, acts by catalysing the
incorporation of deoxyribonucleotide triphosphates to the 3’ ends of double or single-
stranded DNA. Horseradish-peroxidase-labelled streptavidin binds to the biotinylated
nucleotides. Addition of the peroxidase substrate, hydrogen peroxide, and the
diaminobenzidine (DAB) chromogen result in apoptotic nuclei staining dark brown.

131
HRP streptavidin biotinylated nucleotide TdT 3’-OH end of fragment DNA fragment
Figure 3.56: Diagrammatic representation of reactions occurring in TUNEL
3.5.1 TUNEL images
Figure 3.57: Normal undiseased tissue showing few labelling sites in crypts of
Lieberkühn (CL) in the lamina propria (LP) (x400).
OH
CL
LP

132
Figure 3.58: Nuclear labelling in poorly differentiated adenocarcinoma (AC) in the
muscularis propria (MP) and nuclear and cytoplasmic labelling in necrotic debris
(ND) (x400), indicating sites of apoptosis. As nuclear and cytoplasmic localisation of
the DWNN transcript was observed here as well, it can be deduced that this transcript
is a pro-apoptotic gene.
Figure 3.59A, B: Nuclear and cytoplasmic labelling in moderately differentiated
adenomatous glands (AG) in the submucosa (SM) (x400). In ISH nuclear and
cytoplasmic labelling was also observed here, further evidence of the transcript being
pro-apoptotic. Localisation of the DWNN protein in this case was seen in the nuclei
of an adenocarcinoma in the subserosa.
A B
AC
MP
ND
SM
AG
AG

133
Figure 3.60: Nuclear labelling in moderately differentiated adenocarcinoma (AC) in
muscularis propria (A= x100; B= x400). Immunocytochemistry showed DWNN
protein expression in the same area, thereby indicating that it is pro-apoptotic.
Figure 3.61: Nuclear and cytoplasmic labelling in necrotic debris in the lumen (LU) of
a moderately differentiated adenocarcinoma (AC) in the muscularis propria (MP)
(x400). mRNA localisation showed the transcript in the adenocarcinoma nuclei and
in adjacent lymphocytes. The protein expressed in the cytoplasm of these dysplastic
glands.
A B
ACAC
LU
MP
AC
134
3.5.2 Summary
The TUNEL method labels DNA fragments and is therefore an effective technique for
apoptosis detection. By comparing the results obtained from ISH and ICC, it could be
concluded that apoptosis was occurring in the same regions as the 13kDa mRNA and
DWNN protein, namely in the adenocarcinomas, adenomatous glands and necrotic
debris in the lumens of dysplastic glands. Localisation was also seen in lymphocytes
adjacent to adenocarcinomas, as these T-cells are involved in cell death. TUNEL
therefore allows for conclusions to be drawn as to the role of DWNN in cancerous
tissue, which is pro-apoptotic.

135
3.6 Ki-67 proliferation assay
This technique was applied to ascertain the site of proliferation in the cancerous colon
tissue. Proliferation normally occurs in the lower third of the crypts of Lieberkühn.
One would expect to see extensive proliferation in dysplastic structures such as the
adenomatous glands. Proliferation markers are helpful in allowing for differentiation
between rapidly growing tumours from slower growing tumours (Saeger, 2004).
Cells in the G1, G2, S and M-phase of the cell cycle express the Ki-67 antigen and
this is a commonly used proliferative marker which has been shown to have a
substantial association with invasiveness (Ishida et al. 2004; Zhao et al. 1999). The
Ki-67 goat polyclonal immunoglobulin-G (Santa Cruz Biotechnology) was used in
conjunction with a biotinylated donkey anti-goat immunoglobulin-G antibody and a
biotinylated staining system to produce a colorimetric reaction.
3.6.1 Ki-67 images
Figure 3.62A, B: Cytoplasmic and nucleic proliferation occurring in poorly
differentiated adenomatous glands (AG) in the submucosa (SM) indicating cell
division in the carcinomatous tissue (A = x100; B = x400).
A B
SM
AG
SM
AG

136
Figure 3.63A & B: Nuclear staining indicating nuclear proliferation in poorly
differentiated adenocarcinoma (AC) in the muscularis propria (MP) (x400). Nuclear
proliferation is also seen in the dysplastic muscularis propria.
Figure 3.64: Nuclear localisation in moderately differentiated adenocarcinoma (AC)
in muscularis propria (MP) (A) and nuclear localisation in dysplastic muscularis
propria (B) (x400).
A B
A B
MP
AC
AC
AC MP
MP

137
Figure 3.65A, B: Ki-67 localisation in nuclei of crypts of Lieberkühn (CL) and
nuclear staining in interstitial cells of the lamina propria (LP) in well differentiated
adenocarcinoma (A = x100; B = x400).
3.6.2 Summary
From this assay, it could be seen that proliferation was heightened in poorly,
moderately and well differentiated adenomatous glands. This indicates increased cell
division of cancerous cells, typical of this disease. However, mRNA and protein
localisation was not correlated with proliferation in the same area and as apoptosis is
occurring simultaneously with gene expression, this suggests that the gene is pro-
apoptotic.
A BLP
CL
CL

138
3.7 Bcl-2 assay
Bcl-2 is an inhibitor of apoptosis and overexpression of this oncoprotein occurs
commonly in colon cancer (Yang et al. 1999). The aim of this experiment was to
verify if DWNN was pro-apoptotic, as deduced from TUNEL, or if Bcl-2 was
localised at the same sites as the mRNA and protein. The Bcl-2 mouse monoclonal
immunoglobulin-G (Santa Cruz Biotechnology) was used in conjunction with a
biotinylated goat anti-mouse immunoglobulin-G antibody and a biotinylated staining
system, which resulted in a colorimetric reaction.
3.7.1 Bcl-2 images
Figure 3.66A, B: Bcl-2 localisation (L) in tissue in between well differentiated
adenocarcinoma (AC) in the muscularis propria (A = x100; B = x400). As Bcl-2 is an
inhibitor of apoptosis and the gene was not found to be upregulated in this area, both
by ISH and by ICC, it can be concluded that this particular transcript of DWNN is
pro-apoptotic.
A B
AC AC
L
L

139
Figure 3.67A, B: Bcl-2 localisation (L) in moderately differentiated adenocarcinoma
(AC) in muscularis propria (A = x400; B = x1000). Under higher magnification, this
localisation can be identified as nuclear (B). Once again neither DWNN mRNA nor
DWNN protein was upregulated in these areas therefore there is no correlation.
Figure 3.68A, B: Nuclear localisation of Bcl-2 in moderately differentiated
adenomatous glands (AG) in submucosa (SM) (A = x400, B = x1000).
A B
A B
L
L
L
L
AC
L
L L
L
SM AGAG
140
3.7.2 Summary
Suppression of apoptosis is seen in dysplastic zones of the tissues and this is to be
expected, as apoptosis inhibition is one of the key factors promoting cancer
progression. However, it is important to note that although Bcl-2 is localised in the
vicinity of the DWNN mRNA and protein, at the particular areas where DWNN
shows upregulation (from ISH and ICC) Bcl-2 is down-regulated and vice versa. In
fact, from TUNEL studies it was verified that apoptosis was upregulated in these
areas of DWNN upregulation therefore the gene is proposed to be pro-apoptotic.

141
3.8 Helicobacter pylori localisation
A number of investigations have identified the correlation between Helicobacter
pylori infection and colon cancer. The mechanism for this is thought to be that H.
pylori infection raises gastrin levels, which decrease the threshold for colon cancer
development (Noshirwaim et al. 2000). Using antibodies raised against H. pylori,
immunocytochemistry was carried out to localise H. pylori protein in normal and
diseased tissue to establish whether this relationship holds true and how it relates to
apoptosis occurrence. It was also done to establish whether any relationship could be
found with DWNN expression.
3.8.1 H. pylori ICC images
Figure 3.69A, B: Normal colon tissue showing abundant localisation (L) of H. pylori
protein in lamina propria (LP) in between crypts of Lieberkühn (CL) in A, and
localisation in lymphocytes (LY) adjacent to this area in B (A, B = x400). Although
this case has no signs of cancer precursors, this test for the bacteria has given a
positive result.
A B
L L
CL
LPLL
LY

142
Figure 3.70: Localisation (L) in lymphocytes (LY) in muscularis propria (MP)
adjacent to adenocarcinoma (x400).
Figure 3.71A, B: H. pylori localisation (L) in poorly differentiated adenocarcinoma
(AC) in muscularis propria (MP) (A, B = x400).
L
L
LY
MP
A B
MP
ACL
MP
AC
L

143
Figure 3.72: Cytoplasmic localisation (L) in lumen (LU) of moderately differentiated
adenocarcinoma (AD) in muscularis propria (x400).
Figure 3.73A, B: Localisation (L) of H. pylori in well differentiated adenocarcinoma
(AC) in the muscularis propria (MP) and in adjacent lymphocytes (LY) (A = x400; B
= x1000).
A B
MP
ACACL
L LY
LY
L
L
L
LU
AD
144
3.8.2 Summary
The group 1 carcinogenic bacteria, Helicobacter pylori, cause cancer via the initiation
of chronic inflammation, which may result in lifelong inflammation (Mahady et al.,
2002; Parsonnet, 1995). Previous studies have shown a high percentage of control
cases, a greater percentage of patients with colonic polyps and an even greater
percentage of colon cancer patients testing positively for the bacteria (Meucci et al.,
1997; Breuer-Katschinski et al., 1999). Similarly, the normal colon tissue in this
study showed significant localisation of H. pylori, yet there were no signs of polyps.
In the diseased cases, localisation was found in all three grades of the
adenocarcinomas and in adjacent lymphocytes.
Related Documents