CHAPTER 3 – NATURAL GAS DEMAND 253 Protection Agency (EPA) rules on coal-fired gen- eration, and implementation of a price for carbon, if any.* e assessments of natural gas supply and demand for this report were prepared separately. An integrated supply-demand study was not devel- oped. In lieu of an integrated study, a very high estimate of total potential natural gas demand was prepared that, in addition to residential, commer- cial, industrial, power, and natural gas transmis- sion demand, also includes potential direct and indirect natural gas demand for vehicles, exports to Mexico, and LNG exports. † is high total poten- tial natural gas demand, which should not be con- sidered a projection, was used to “stress test” the gas supply assessment. e “stress test” involved comparing a range of potential natural gas sup- ply to a range of potential natural gas demand to assess the adequacy of natural gas supply to meet natural gas demand. e comparison shows that the 2035 high potential natural gas demand of 133 Bcf/d could be supplied. Based on a 2011 Mas- sachusetts Institute of Technology (MIT) study, e Future of Natural Gas, this high natural gas demand potential could be supplied at a current estimated wellhead production cost range in 2007 dollars of $4.00 to $8.00 per million British ther- mal units (MMBtu), as shown in Figure ES-3 in the Executive Summary, based on current expectations of cost performance and assuming adequate access Abstract e application of technology developed in North America has dramatically changed the out- look for North American natural gas supply from one that is supply constrained and expected to rely on significant liquefied natural gas (LNG) imports, to one that has created an opportunity for natural gas to play a larger role in the transition to a lower carbon fuel mix. To assess the range of potential North American natural gas demand, a “study of studies” method- ology was used. Trends and drivers of demand by sector, including energy efficiency, technologi- cal change, and policy and regulatory impacts, were examined. As a consequence of this analy- sis, several policy recommendations were made on increasing energy efficiency, promoting efficient and reliable markets, increasing effectiveness of energy policies, and conducting carbon capture and sequestration research and development. A benefit of a “study of studies” approach is that it widens the range of assumptions used and, con- sequently, the range of natural gas demand out- looks. e range of natural gas demand outlooks for North America in 2030 was 67 to 104 billion cubic feet per day (Bcf/d) compared to a 2010 level of 74 Bcf/d. Most of the range in demand comes from the power sector where assumptions vary widely on electricity demand growth, the impact of non-greenhouse gas (GHG) Environmental † e potential for direct and indirect natural gas demand for vehicles was prepared independently of the NPC Future Transportation Fuels study, because it will not be completed until after this report is published. * See Chapter Four, “Carbon and Other Emissions in the End-Use Sector,” for a description of the non-GHG EPA rules and definition of a price on carbon. Chapter ree Natural Gas Demand

Welcome message from author
This document is posted to help you gain knowledge. Please leave a comment to let me know what you think about it! Share it to your friends and learn new things together.
Transcript

Chapter 3 – NatUraL GaS DeMaND 253
Protection Agency (EPA) rules on coal-fired gen-eration, and implementation of a price for carbon, if any.*
The assessments of natural gas supply and demand for this report were prepared separately. An integrated supply-demand study was not devel-oped. In lieu of an integrated study, a very high estimate of total potential natural gas demand was prepared that, in addition to residential, commer-cial, industrial, power, and natural gas transmis-sion demand, also includes potential direct and indirect natural gas demand for vehicles, exports to Mexico, and LNG exports.† This high total poten-tial natural gas demand, which should not be con-sidered a projection, was used to “stress test” the gas supply assessment. The “stress test” involved comparing a range of potential natural gas sup-ply to a range of potential natural gas demand to assess the adequacy of natural gas supply to meet natural gas demand. The comparison shows that the 2035 high potential natural gas demand of 133 Bcf/d could be supplied. Based on a 2011 Mas-sachusetts Institute of Technology (MIT) study, The Future of Natural Gas, this high natural gas demand potential could be supplied at a current estimated wellhead production cost range in 2007 dollars of $4.00 to $8.00 per million British ther-mal units (MMBtu), as shown in Figure ES-3 in the Executive Summary, based on current expectations of cost performance and assuming adequate access
Abstract
The application of technology developed in North America has dramatically changed the out-look for North American natural gas supply from one that is supply constrained and expected to rely on significant liquefied natural gas (LNG) imports, to one that has created an opportunity for natural gas to play a larger role in the transition to a lower carbon fuel mix.
To assess the range of potential North American natural gas demand, a “study of studies” method-ology was used. Trends and drivers of demand by sector, including energy efficiency, technologi-cal change, and policy and regulatory impacts, were examined. As a consequence of this analy-sis, several policy recommendations were made on increasing energy efficiency, promoting efficient and reliable markets, increasing effectiveness of energy policies, and conducting carbon capture and sequestration research and development.
A benefit of a “study of studies” approach is that it widens the range of assumptions used and, con-sequently, the range of natural gas demand out-looks. The range of natural gas demand outlooks for North America in 2030 was 67 to 104 billion cubic feet per day (Bcf/d) compared to a 2010 level of 74 Bcf/d. Most of the range in demand comes from the power sector where assumptions vary widely on electricity demand growth, the impact of non-greenhouse gas (GHG) Environmental
† The potential for direct and indirect natural gas demand for vehicles was prepared independently of the NPC Future Transportation Fuels study, because it will not be completed until after this report is published.
* See Chapter Four, “Carbon and Other Emissions in the End-Use Sector,” for a description of the non-GHG EPA rules and definition of a price on carbon.
Chapter Three
Natural Gas Demand

254 prUDeNt DeVeLOpMeNt: realizing the potential of North america’s abundant Natural Gas and Oil resources
to resources for development (Figure ES-10).‡ Of course, natural gas prices for end users will reflect many other factors, including costs to gather, pro-cess, and deliver natural gas to end users; returns on investments for production, distribution, and storage; mandated regulatory fees and taxes; and other market factors.
The outline of the Demand chapter is as follows:
y Summary
− Back to the Future: Two Decades of Natural Gas Studies
− Range of U.S. and Canadian Natural Gas Demand Projections
− Potential U.S. and Canadian Total Natural Gas Requirements Compared to Natural Gas Supply
y U.S. Power Generation Natural Gas Demand
y U.S. Residential and Commercial Natural Gas, Distillate, and Electricity Demand
y U.S. Industrial Natural Gas and Electricity Demand
y U.S. Transmission Natural Gas Demand
y Full Fuel Cycle Analysis
y Canadian Natural Gas and Electricity Demand
y A View on 2050 Natural Gas Demand
y Potential Vehicle Natural Gas and Electricity Demand
y LNG Exports
y Exports to Mexico
y U.S. Liquids Demand
y Policy Recommendations
y Description of Projection Cases.
natural gas in a carbon-constrained world to two key metrics:
y The role of energy efficiency in reducing demand for natural gas and electricity, thereby reducing all emissions including CO2.
y Opportunities for natural gas to displace more carbon-intensive fuels, primarily coal in the power sector and oil in the transportation sector, either directly by natural gas vehicles (NGVs) or indirectly by plug-in electric vehicles (PEVs), and distillate used for heating in the residential and commercial sectors.1
To answer the framing questions, the DTG used a “study of studies” approach by examining a wide range of demand studies and data from public sources, mak-ing no attempt to produce a new, consensus outlook. Additionally, the DTG examined aggregated propri-etary data collected via a confidential survey of pri-vate organizations, primarily oil and gas companies
1 PEVs include battery-only vehicles like the Nissan Leaf or plug-in hybrids with an onboard generator that uses gasoline or diesel like the Chevrolet Volt and a new version of the Toy-ota Prius. It does not include non-plug-in hybrids like previous versions of the Toyota Prius.
Summary
Secretary of Energy Steven Chu in his study request of September 16, 2009, made three statements that are particularly relevant for this study:
y “All energy uses and supply sources must be reex-amined in order to enable the transition towards a lower carbon, more sustainable energy mix.”
y “Accordingly, I request the National Petroleum Council to reassess the North American resources production supply chain and infrastructure potential, and the contribution that natural gas can make in a transition to a lower carbon fuel mix.”
y “Of particular interest is the Council’s advice on policy options that would allow prudent devel-opment of North American natural gas and oil resources consistent with government objectives of environmental protection, economic growth and national security.”
In answering its framing questions, discussed in the text box at the end of this Summary, the Demand Task Group (DTG) focused its analysis on the role of
‡ MIT Energy Initiative, The Future of Natural Gas: An Interdisciplinary MIT Study, 2011.

Chapter 3 – NatUraL GaS DeMaND 255
A “study of studies” seeks balance by reviewing studies from differing points of view. A review of many studies not only can help to uncover any limi-tations applicable to a particular study, but can also identify the relative importance of key assumptions.
The DTG looked at both natural gas and electric-ity demand because the latter is a major driver of gas demand for power generation. In addition, three white papers were prepared covering exports to Mex-ico, LNG exports, and U.S. liquids demand.2
Users of projections need to be particularly wary of the circularity inherent in some demand projections: assumptions equal conclusions; conclusions equal assumptions. The DTG endeavored to keep that in mind in reviewing studies.
The assessments of natural gas supply and demand for this report were prepared separately. An integrated supply-demand study was not developed. In lieu of an integrated study, a high estimate of total potential natural gas demand that also includes potential direct and indirect natural gas demand for vehicles, exports to Mexico, and LNG exports was prepared and used to “stress test” the natural gas supply finding.
Back to the Future: Two Decades of Natural Gas Studies
In 1992, 1993, and 2003, the National Petroleum Council (NPC) conducted three major studies of nat-ural gas supply and demand.3 The purpose of these
2 White Paper #3-6, “Natural Gas Exports to Mexico,” was pre-pared by the Resource & Supply Task Group, with input from the Demand Task Group.
3 For a description of cases, see “Description of Projection Cases” at the end of this Demand chapter.
and specialized consulting groups. The proprietary data were collected by a third party and aggregated to disguise individual responses. Proprietary studies were aggregated by type of forecaster: consultants; international oil companies; independent oil and gas companies; and oil and gas companies (an aggregation of international and independent oil and gas compa-nies). For proprietary studies that provided more than one outlook, the data were also aggregated by maximum, median, and minimum outlooks.
The primary benefits of a “study of studies” are twofold. First, work can be completed more quickly by using off-the-shelf studies instead of creating a new one. Second, a broader range of outlooks and analyses can be incorporated, bringing a wider array of assumptions and results into consideration. How-ever, the value of any particular study needs to be put in perspective. Demand studies are based on numerous assumptions on future policies, invest-ment decisions, costs, and economic relationships. Econometric relationships used by most forecasting models have built into them numerous assumptions, including past relationships that are a prologue for future relationships. Demand studies come in sev-eral forms:
y Business as usual projections (or reference cases) such as the Energy Information Administra-tion’s (EIA’s) Annual Energy Outlook (AEO) Ref-erence Cases that focus on the factors that shape the U.S. energy system over the long term under the assumption that current laws and regulations remain unchanged throughout the projection
y Single point forecasts that incorporate assump-tions on various future inputs
y Scenarios that are designed to test alternate future story lines such as a carbon cap and trade program or different rates of technological progress
y Sensitivity analyses that test the impact of chang-ing a key assumption such as the determinants of the price of natural gas or the endowment of shale gas resources
y Goal-seeking studies to find alternative pathways to achieve a particular goal, such as a 50% reduc-tion in CO2 emissions by 2035
y Advocacy studies such as those prepared by asso-ciations that discuss the merits of a particular industry’s situation or the impact from a proposed policy change.
CONCLUSIONS
ASSUMPTIONS
KY Recycle Graphic - Demand Pg. 3-6

256 prUDeNt DeVeLOpMeNt: realizing the potential of North america’s abundant Natural Gas and Oil resources
energy efficiency) were not borne out by actual trends in later years. There are often future sur-prises that change the landscape from what a study assumed. Examples of this include the swift rise of China within global industrial and energy markets, which has had a strong effect on the energy land-scape.
y The inherent uncertainty of a single reference case was recognized from the start and led to preparing multiple scenarios in the 1992 and subsequent NPC natural gas studies. This resulted in a range of demand bounded by a maximum and a minimum case useful for “stress testing” the industry’s ability to meet demand and identifying policy recommen-dations commensurate with the challenges facing the industry.
y For the 2007 NPC study, a survey of existing projec-tions, or a “study of studies,” was used to broaden coverage and bring a wider array of assumptions and results into consideration.
Range of U.S. and Canadian Natural Gas Demand Projections
The analysis of public and proprietary studies found a wide range of future natural gas demand for the United States and a narrower range for Canada. Delivered natural gas excludes exports to Mexico as well as LNG exports.
previous NPC studies was to identify measures to pro-mote efficient natural gas markets and to propose a menu of policy choices focused upon advancing the environment, energy security, and economic well-being. An evaluation of these NPC studies provides some lessons learned and the “big” things that these studies have missed.4,5 Key observations on the out-comes from prior NPC studies of the natural gas mar-ket include:
y Past projections of the range of demand for natu-ral gas were generally accurate enough to be useful for testing policies and indicating necessary incre-ments of supply required (see Figure 3-1). Though increasing reliance on unconventional natural gas was featured in each NPC study, the focus was on coalbed methane and tight sands formations, while the potential role of shale gas was limited.
y While the models employed to prepare the stud-ies worked reasonably well, assumptions about the price of oil and gas, gross domestic product (GDP) growth rates, and trends in energy intensity (or
4 See Demand Task Group White Paper #3-5, “What Are the ‘Big’ Things That Past Studies Missed?”, which examines the 1992, 1999, and 2003 NPC studies addressing natural gas supply and demand and the 2007 Hard Truths study that examined world energy demand.
5 For a retrospective review of past EIA Annual Energy Outlooks, see: http://www.eia.gov/iaf/analysispaper/ retrospective/retrospective_review.html.
The last section of this Demand chapter, “Description of Projection Cases,” contains a brief description of the outlook cases used in this chapter, particularly for figure legends. Gener-ally, AEO2010 and AEO2011 refer to projections developed by the Energy Information Administra-tion (EIA) as part of their 2010 and 2011 Annual Energy Outlooks. EIA WM and EIA KL refer to EIA projections developed as part of the EIA’s analysis of the Waxman-Markey (American Clean Energy and Security Act of 2009) and Kerry-Lieberman (American Power Act of 2010) cap and trade bills. The analyses of the Waxman-Markey and Kerry-Lieberman bills were based on the AEO2009 and AEO2010 Reference Cases, respectively. RFF Cases were from Resources for the Future studies and
the MIT cases were from Massachusetts Institute of Technology studies. Proprietary cases are the result of the aggregation of proprietary projec-tions. The public accounting firm Argy, Wiltse & Robinson, P.C. (Argy) received and aggregated the projections to protect respondents’ confidentiality. Numerous firms, including oil and gas companies and energy consulting firms, were requested to fill in demand data templates and return them to Argy.
Much of the analytical work done by the DTG was completed before the issuance of the EIA AEO2011 Reference Case and sensitivities. Consequently, much of the analysis and charts use data from the AEO2010 cases. However, data from the AEO2011 Reference Case have been added to most charts.
Projection Cases

Chapter 3 – NatUraL GaS DeMaND 257
vehicle demand for proprietary cases was not pro-vided. The potential for direct and indirect natural gas demand from the vehicle sector is discussed later in the “Potential Vehicle Natural Gas and Electricity Demand” section.
Drivers of Natural Gas Demand Under Existing Policies
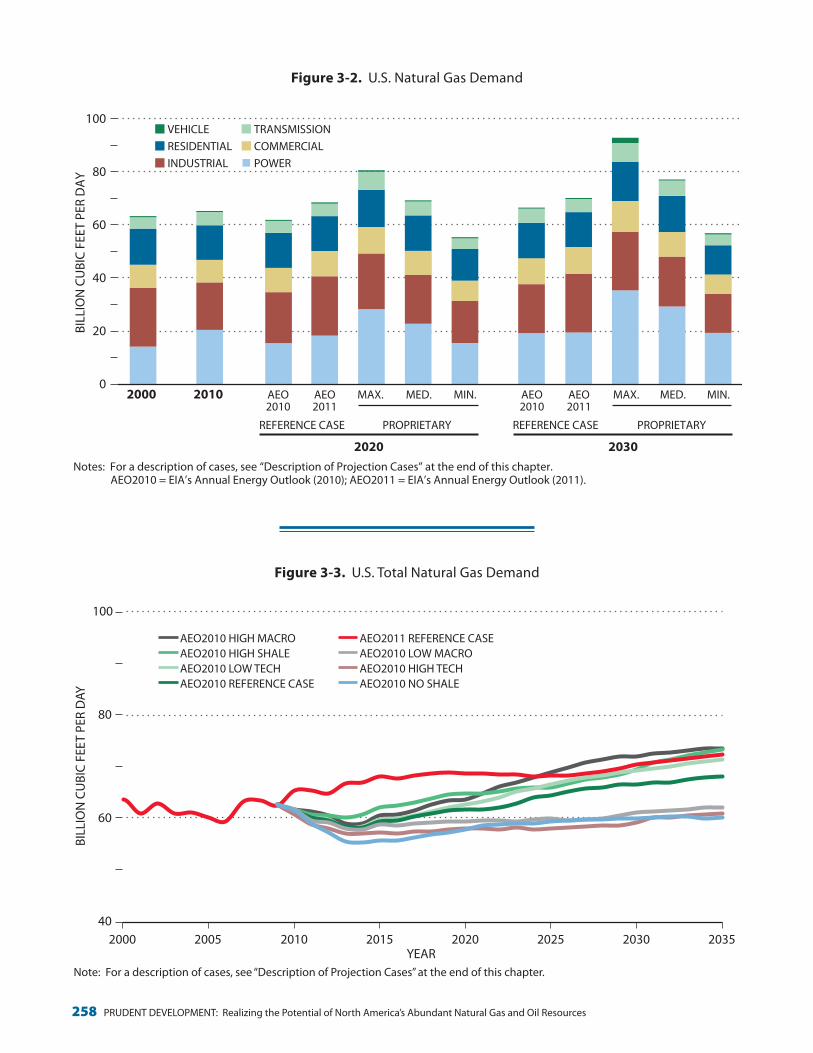
Under the AEO Reference Cases, the primary driver of natural gas demand (including the indi-rect effect from electricity demand growth) is the growth rate of the economy as shown in the differ-ence between the AEO2010 High Macro and Low Macro Cases (or high and low economic growth cases) compared to the AEO2010 Reference Case (see Figure 3-3). Energy efficiency improvement has a significant moderating influence on residential and commercial demand for natural gas and electricity, as shown in the difference between the AEO2010 High Tech and Low Tech Cases (or high and low efficiency gain cases).
The application of technology has unlocked shale gas and changed the conversation about the role of natural gas in a carbon-constrained world. The
Range of U.S. Natural Gas Demand Projections
For 2010, U.S. delivered natural gas demand is estimated at 65.2 Bcf/d (23.8 trillion cubic feet per year [Tcf/yr]) (see Figure 3-2). For 2030 projections of U.S. delivered natural gas demand ranges from 59.6 Bcf/d (21.8 Tcf/yr) to 89.9 Bcf/d (32.8 Tcf/yr). For the United States, most of the variation in pro-jected natural gas demand comes from the power sector, which ranges from 19.2 Bcf/d (7.0 Tcf/yr) to 35.3 Bcf/d (12.9 Tcf/yr). The variation in power gen-eration natural gas demand mostly flows from varia-tion in policy assumptions that will affect the fuel and technology mix of future generation capacity or will affect dispatch economics (i.e., whether natural gas-fired generation will be scheduled ahead of coal-fired generation). U.S. vehicle natural gas demand ranges from the inconsequential in most projections to almost 2 Bcf/d in 2030 for the Proprietary Maxi-mum Outlook.6 Electric vehicle demand in publicly available outlooks was minimal. Data on electric
6 The Proprietary Maximum, Median, and Minimum Cases rep-resent the maximum, median, and minimum cases for all of the proprietary cases aggregated by an independent third party.
Figure 3–1. Retrospective on U.S. Natural Gas Demand: 20 Years of National Petroleum Council (NPC) Studies
30
40
50
60
70
80
90
100
1960 1970 1980 1990 2000 2010 2020 2030
BILL
ION
CU
BIC
FEET
PER
DAY
YEAR
2003 – NPC REACTIVE PATH 2007 – NPC HARD TRUTHS MIN 1992 – NPC CASE I 2003 – NPC BALANCED FUTURE 2011 – AGGOGMIN
HISTORY TO 2010 1999 – NPC REFERENCE 2007 – NPC HARD TRUTHS MAX
1992 – NPC CASE II 2011 – AGGOGMAX
Note: For a description of cases, see “Description of Projection Cases” at the end of this chapter.
Figure 3-1. retrospective on U.S. Natural Gas Demand: 20 Years of National petroleum Council (NpC) Studies
258 prUDeNt DeVeLOpMeNt: realizing the potential of North america’s abundant Natural Gas and Oil resources
0
20
40
60
80
100
BILL
ION
CU
BIC
FEET
PER
DA
Y
Figure 3-2. U.S. Natural Gas Demand
ALSO used as Figure ES-7
AEO2010
AEO2011
REFERENCE CASE
MAX. MED. MIN.
2030
PROPRIETARY
AEO2010
AEO2011
REFERENCE CASE
MAX. MED. MIN.
2020
PROPRIETARY
2010 2000
VEHICLE TRANSMISSION RESIDENTIAL COMMERCIAL INDUSTRIAL POWER
Notes: For a description of cases, see “Description of Projection Cases” at the end of this chapter. AEO2010 = EIA’s Annual Energy Outlook (2010); AEO2011 = EIA’s Annual Energy Outlook (2011).
DO NOT OVERWRITE ES-7 WITH THIS FIGURE -SLIGHT DIFFERENCE IN NOTES @ BOTTOM
Figure 3-2. U.S. Natural Gas Demand
Figure 3-3. U.S. Total Natural Gas Demand
40
60
80
100
2000 2005 2010 2015 2020 2025 2030 2035
BILL
ION
CU
BIC
FEET
PER
DAY
YEAR
AEO2010 HIGH MACROAEO2010 HIGH SHALEAEO2010 LOW TECHAEO2010 REFERENCE CASE
AEO2011 REFERENCE CASEAEO2010 LOW MACROAEO2010 HIGH TECHAEO2010 NO SHALE
Note: For a description of cases, see “Description of Projection Cases” at the end of this chapter.
Figure 3-3. U.S. total Natural Gas Demand

Chapter 3 – NatUraL GaS DeMaND 259
Range of Canadian Natural Gas Demand Projections
For 2010, projections of Canadian delivered natural gas demand are estimated at 9.1 Bcf/d (3.3 Tcf/yr). For 2030, Canadian delivered natural gas demand ranges from 7.4 Bcf/d (2.7 Tcf/yr) to 13.7 Bcf/d (5.0 Tcf/yr). For Canada, most of the variation comes from the industrial sector and is pri-marily related to oil sands (see Figure 3-4). Develop-ment of the Canadian oil sands could require from 2.6 to 5.2 Bcf/d of natural gas by 2035 compared to 2010 consumption of 1.6 Bcf/d.8 With Canadian coal generation capacity being only 11% of total genera-tion, versus 31% for the United States, the ability of natural gas to displace coal in Canada is much more limited and, therefore, so is the range of power gen-eration natural gas demand outlooks.
8 Canadian oil sands requirements for natural gas were obtained from the Resource & Supply Task Group.
difference between the AEO2010 Reference Case and the AEO2010 High Shale Case, and the differ-ence between the AEO2010 Reference Case and the AEO2011 Reference Case (which includes a larger gas resource base among other changes) helps to dem-onstrate that the successful development of low cost shale gas should result in higher natural gas demand (see Figure 3-3). In the AEO2011 Reference Case, natural gas’s share of total energy for the period 2010 through 2035 increases to 24.3%, up 1.9% from the AEO2010 Reference Case. Partly as a result, cumula-tive CO2 emissions for the period 2010 through 2035 from energy are 1,271 million MtCO2e (metric tons of carbon dioxide equivalent) (or 1%) lower under the AEO2011 Reference Case than under the AEO2010 Reference Case.7
7 The EIA’s AEO2010 included a Reference Case and many sen-sitivities, including a high shale case and a no shale case. The EIA’s AEO2011 early Reference Case was available in December 2010 for use in this study, but the final Reference Case and sensitivities from the AEO2011 were not available until most of the analytical work was completed.
Notes: For a description of cases, see “Description of Projection Cases” at the end of this chapter. NEB = National Energy Board of Canada.
2000 2010 MAX. MED. MIN.
PROPRIETARY
MAX. MED. MIN.
PROPRIETARY
BILL
ION
CU
BIC
FEET
PER
DA
Y
0
4
8
12
16
BASE HIGH LOW
Figure 3-4. Canadian Natural Gas Demand
2030 2020
NEB OIL PRICE
RESIDENTIAL COMMERCIAL POWER INDUSTRIAL
Figure 3-4. Canadian Natural Gas Demand

260 prUDeNt DeVeLOpMeNt: realizing the potential of North america’s abundant Natural Gas and Oil resources
be completed after this one, this study examined high-potential-demand cases for NGVs and PEVs from published sources. For purposes of “stress testing” natural gas supply, potential U.S. and Cana-dian natural gas demand for vehicles is the sum of:
− NGV natural gas demand of 4.5 Bcf/d by 2035, assuming sales penetration rates for heavy-duty vehicles (HDVs) of 40% by 2035
− PEV natural gas demand of 7.6 Bcf/d by 2035, assuming 100% of the electricity is supplied by natural gas generation and assuming sales penetration rates for light-duty vehicles (LDVs) of 40% and 57% by 2030 and 2050, respectively.
y 4 Bcf/d – Exports to Mexico based on AEO2011 Reference Case.
y 5 Bcf/d – LNG exports at the initial liquefaction capacity of the first three projects that filed for permits.
The high potential total natural gas requirements for 2035 is not a projection, but a very high estimate of potential natural gas requirements used to “stress test” the natural gas resource base ability to meet all
Potential U.S. and Canadian Total Natural Gas Requirements Compared to Natural Gas Supply
The range of potential total natural gas requirement for the United States and Canada for 2035 is 72 Bcf/d (26 Tcf/yr) to 133 Bcf/d (49 Tcf/yr) (see Figure 3-5). The high potential total natural gas requirement is the sum of:
y 111 Bcf/d – Highest outlook for U.S. and Canadian total delivered natural gas demand excluding vehi-cles. U.S. and Canadian demand for 2035 are based on an extrapolation of 2020 to 2030 Proprietary Maximum and Minimum cases.
y 13 Bcf/d – Very high potential for increased use of natural gas to displace oil in the transportation sec-tor. The NPC Future Transportation Fuels (FTF) study is examining the potential market penetra-tion of NGVs and PEVs that could create some nat-ural gas demand for NGVs, and indirectly for power generation to meet electricity demand from PEVs, as well as fuel cell electric vehicles, using hydrogen reformed from natural gas. Since the FTF study will
Notes: 2035 – Development facilitated by access to new areas, balanced regulation, sustained technology development, higher resource size.
2035 – Development constrained by lack of access, regulatory barriers, low exploration activity, lower resource size.
0
50
100
150
BILL
ION
CU
BIC
FEET
PER
DA
Y
Figure 3-5. Range of Potential North American Natural Gas Requirements
HIGH DEMANDSUPPLY2010 2035
SUPPLY (UNCONSTRAINED) SUPPLY (CONSTRAINED)
LIQUEFIED NATURAL GAS EXPORTS
VEHICLE DEMAND EXPORTS TO MEXICO
CANADIAN DEMAND
U.S. DEMAND
DEMAND LOW DEMAND SUPPLY
Figure 3-5. North american Natural Gas production Could Meet high Demand

Chapter 3 – NatUraL GaS DeMaND 261
The CO2 emissions intensity of the U.S. economy would decline as natural gas is substituted for coal in the power sector or for oil in the vehicle sector. In addition, growth in NGVs or PEVs could improve U.S. energy security by reducing reliance on oil imports (other than from Canada).
u.S. POWEr GENEraTION NaTuraL GaS DEmaND
Natural gas power generation has significant advan-tages over other power generation technologies includ-ing low upfront capital costs, short construction lead times, low heat rates (high efficiency), reason-able energy production costs, a well-established track record of performance and operational flexibility, and a significantly lower environmental emissions profile compared to other intermediate and base load fossil resources.10 In addition, natural gas combined cycle
10 Heat rate is the quantity of Btu necessary to generate 1 kilo-watt hour.
potential sources of natural gas demand. It appears that the 2035 high potential natural gas demand of 133 Bcf/d can be supplied. Based on the 2011 MIT Study, The Future of Natural Gas, this high natural gas demand potential could be supplied at a current esti-mated wellhead production cost range in 2007 dollars of $4.00 to $8.00 per MMBtu, as shown in Figure ES-3 in the Executive Summary, based on current expec-tations of cost performance and assuming adequate access to resources for development (Figure ES-10).9 This wellhead development cost should not be read as an expected market price, since many factors deter-mine the price to the consumer in competitive mar-kets. Most of the increase in North American natural gas requirements comes from displacement of coal in the power sector and oil in the transportation sector, which are likely to require significant policy support to be achieved.
9 MIT Energy Initiative, The Future of Natural Gas: An Interdisci-plinary MIT Study, 2011.
To address the Secretary’s request, the Demand Task Group proposed to answer the following fram-ing questions as part of the NPC Integrated Study Plan – April 29, 2010:
y What are the “big” things that past projections have missed?
y What is the range of publicly available natural gas demand projections and what accounts for the differences between projections?
y How could technology and energy efficiency affect future natural gas demand?
y What are the key drivers of demand for natural gas and electricity by sector (residential, com-mercial, industrial, and transmission [fuel to gather, process, and deliver natural gas])?
− Which demand drivers are the most important?
− What is the future range for each demand driver?
− How could abundant natural gas resources affect future natural gas demand?
− How could a carbon-constrained world affect major demand drivers?
− What regulatory policy action may signifi-cantly affect natural gas demand?
− Vehicle demand would be based upon and coordinated with the NPC Future Transporta-tion Fuels Study.
y How might various generation capacity portfo-lios and carbon programs impact power genera-tion natural gas demand?
The focus of this study was on natural gas and oil. Therefore, it was decided at the beginning to limit the analysis of the power sector to those issues that would have the greatest impact on power generation natural gas demand. Not included in the analysis were power generation issues that have an indirect impact on natural gas demand such as smart grids, peak day capacity requirements, time-of-day pric-ing, electric transmission and distribution losses, and need for transmission capacity. The impact of proposed EPA regulations and carbon programs was limited to a review of their potential impact on natural gas demand. Not considered within the scope was an analysis of the merits, benefits, and costs or effectiveness of such proposed regulations or programs.
Demand Task Group Framing Questions

262 prUDeNt DeVeLOpMeNt: realizing the potential of North america’s abundant Natural Gas and Oil resources
Drivers of Power Generation Natural Gas Demand
Natural gas demand from the power sector is driven primarily by three factors:
y Total electricity demand net of electrical efficiency gains
y The fuel and technology mix of future generation capacity
y Delivered cost of fuel to generators plus any costs for carbon and other emissions, and, most impor-tantly, the spread between delivered cost of natural gas and coal.
Power Generation Natural Gas Demand Projections
The outlook for power generation natural gas demand can be generally characterized as depending on the following (see Figure 3-7):
y Net growth in electricity demand.
− Increase in electricity demand from growth in
(NGCC) plants have the flexibility to operate effi-ciently over a wide range of utilization rates, allowing them to transition over time into different sections of the dispatch curve. They can, for instance, move from a high to intermediate capacity factor resource to more of a peaking role if technological or market changes to dispatch profiles for the industry suggest such a move is prudent.
Natural Gas Demand Summary
For 2010, U.S. power generation natural gas demand is estimated at 20.5 Bcf/d, accounting for 33% of U.S. total natural gas demand.11 Power generation natural gas demand for 2030 is expected to range from 11.3 to 35.3 Bcf/d (see Figure 3-6).12 Generally for this chap-ter, ranges of demand projections for 2030 will be used rather than 2035, as the aggregated proprietary cases usually ended in 2030 and often had a wider range than other projections.
11 Includes only natural gas consumed by power generators. Does not include related natural gas transmission fuel needed to deliver the natural gas to the power generator.
12 This excludes natural gas used by end users for on-site generation.
Figure 3-6. U.S. Power Natural Gas Demand
0
10
20
30
40
2000 2005 2010 2015 2020 2025 2030 2035
BILL
ION
CU
BIC
FEET
PER
DAY
YEARNote: For a description of cases, see “Description of Projection Cases” at the end of this chapter.
AGGOGMAXEIA KL NOINTL LTDALTEIA WM NOINTL LTDALTAGGOGMEDIANAEO2010 HIGH SHALEAEO2010 LOW TECH
AEO2010 HIGH MACROAEO2010 REFERENCE CASEAEO2011 REFERENCE CASEAGGOGMINEIA KL BASICAEO2010 LOW MACRO
AEO2010 HIGH TECHAEO2010 NO SHALEEIA WM BASICAGGCONSULTANTMAXAGGCONSULTANTMEDIANAGGCONSULTANTMIN
Figure 3-6. U.S. power Natural Gas Demand

Chapter 3 – NatUraL GaS DeMaND 263
y If the United States chooses to establish a price for carbon, then some natural gas generation could dis-patch ahead of some coal generation.14
y To achieve a deep reduction (over 80%) in CO2 emis-sions from the power sector, carbon capture and sequestration (CCS) for gas- and coal-fired genera-tion may be needed depending on the time frame for achieving a deep reduction in CO2 emissions. Under a deep CO2 reduction program, coal and natural gas generation would be expected to decline from peak levels; however, CCS would reduce the decline.
Figure 3-7 is illustrative. The size of the steps and time at which they occur will vary. Even whether the steps are up or down is dependent on many variables.
14 See http://www.ipcc.ch/pdf/assessment-report/ar4/wg3/ar4- wg3-annex1.pdf. Generally, the term “price on carbon” refers to the recognition of the negative externalities of GHG emis-sions and the associated economic value of reducing or avoid-ing one metric ton of GHG in carbon dioxide equivalent (1 MtCO2e). In this report, there is no differentiation between an explicit carbon price (e.g., under a cap and trade or carbon tax policy) and an implied carbon cost (e.g., specific regulatory limitations on the amounts of emissions).
population and gross domestic product (GDP) and rate of the adoption of new electrical devices
− Decrease in electricity demand from improve-ment in energy efficiency of electrical devices and buildings
y Low natural gas prices that enable gas-fired genera-tion to displace some coal-fired generation.
y Implementation of proposed non-GHG EPA rules that will likely lead to retirement of some coal gen-eration.13
y Construction of more gas-fired generation, as cur-rently it has the lowest levelized cost of electric-ity (LCOE) before taking into account mandates for renewable generation, production tax credits for wind, loan guarantees for nuclear, or emis-sions costs. LCOE represents the present value of the total cost of building and operating a generat-ing plant over its financial life, converted to equal annual payments and amortized over expected annual generation for an assumed utilization rate.
13 Subsequent to the completion of the analytical work behind this report, one of the proposed rules was implemented.
Figure 3-7. Illustrative Steps to Future Power Generation Natural Gas Demand
DIR
ECTI
ON
TIME
POPU
LATI
ON
AN
D G
DP
GRO
WTH
AN
D N
EW
ELEC
TRIC
APP
LIA
NCE
S
ENER
GY
EFFI
CIEN
CY
NET
GRO
WTH
IN
ELEC
TRIC
ITY
DEM
AN
D
LOW
NAT
URA
L G
AS
PRIC
ES
NO
N-G
REEN
HO
USE
GA
S EP
A R
ULE
S
LOW
NAT
URA
L G
AS
GEN
ERAT
ION
LEVE
LIZE
D C
OST
OF
ELEC
TRIC
ITY
PRIC
E O
N C
ARB
ON
ELE
CTR
ICIT
YD
EMA
ND
FEE
DBA
CK E
FFEC
TS
PRIC
E O
N C
ARB
ON
DIS
PATC
HA
ND
INVE
STM
ENT
EFFE
CTS
DEE
P RE
DU
CTI
ON
IN C
O2 EM
ISSI
ON
S W
ITH
CA
RBO
N C
APT
URE
AN
D S
TORA
GE
Figure 3-7. Illustrative Steps to Future power Generation Natural Gas Demand

264 prUDeNt DeVeLOpMeNt: realizing the potential of North america’s abundant Natural Gas and Oil resources
generation capacity, adding new generation capacity will likely increase the overall retail cost of electricity. The second factor is a price on carbon that, depend-ing on the specific terms and conditions of a carbon program, is likely to increase generation costs and, consequently, electricity prices.
Low Natural Gas Prices Enabling Displacement of Some Coal Generation
Generally, power generation in wholesale markets is dispatched or scheduled based on variable costs. Dispatch or variable costs are the sum of cost of fuel (which is a function of the delivered cost of fuel and a unit’s heat rate); variable operation and maintenance expenses; and emissions allowance costs, if any.16 Until the last couple of years, natural gas-fired gen-eration had higher variable costs than coal-fired generation meaning that more emission-intensive coal plants were dispatched before the less emission-intensive gas plants. With the low natural gas prices seen since early 2009, the variable dispatch cost of some coal-fired generation has exceeded that of NGCC
16 Heat rate is the quantity of Btu required to generate 1 kWh.
Growth in Electricity Demand
In the residential, commercial, and industrial sec-tors, total electricity demand is driven by the rate of GDP growth, demographics (population growth and migration), improvement in electricity efficiency, the penetration rate for new electrical devices, and the relative level of electricity prices. All of the studies reviewed had electricity demand continuing to grow, driving a likely increase in power generation natural gas demand (see Figure 3-8).
Implementation of a price on carbon is more likely to reduce total electricity demand than to increase it. Two factors will likely drive end-user electricity prices higher, thus increasing incentives to improve elec-tricity energy efficiency. The first factor is the addi-tion of new generation capacity or transmission and distribution capacity built either to meet an increase in electricity demand or to replace retired generation capacity.15 Since new generation capacity generally costs more than the depreciated cost of existing
15 The EPA’s proposed non-GHG regulations may result in retire-ment of some generation.
Figure 3-8. U.S. Total Electricity Demand
3,000
3,500
4,000
4,500
5,000
5,500
2000 2005 2010 2015 2020 2025 2030 2035
BILL
ION
KIL
OW
ATT
HO
URS
YEAR
Note: For a description of cases, see “Description of Projection Cases” at the end of this chapter.
AEO2010 HIGH MACROAEO2010 LOW TECHAEO2010 HIGH SHALEAEO2010 REFERENCE CASEAEO2011 REFERENCE CASE
AEO2010 NO SHALEEIA KL BASICEIA WM BASICAEO2010 HIGH TECHAEO2010 LOW MACRO
EIA KL NOINTL LTDALTEIA WM NOINTL LTDALTAGGOGMAXAGGOGMEDIANAGGOGMIN
Figure 3-8. U.S. total electricity Demand

Chapter 3 – NatUraL GaS DeMaND 265
y Mercury (Hg) and other hazardous air pollutants and acid gases
y Coal combustion products (ash) y Cooling water intake.
There is significant uncertainty about the ultimate impact that the proposed EPA regulations will have on natural gas demand because of the lack of clarity on what the final rules will be for multiple regulations, on what the final implementation deadlines will be, on what waivers might be granted by the EPA on imple-mentation deadlines, and what the investment deci-sions of generators and their regulators, if applicable, will be. Many factors – such as age and efficiency of generating units, extent of capital cost depreciation, installed emissions controls, relative prices of natu-ral gas and coal, whether the generator operates in a merchant market, and other things – may affect plant owners’ decisions about whether to retire units. Some studies indicate that the units most likely to be retired are older, smaller, and less-efficient units lack-ing modern pollution controls. Some of these would likely be retired anyway in coming years. However, the Brattle Group’s December 8, 2010, report on the Potential Coal Plant Retirements Under Emerging Envi-ronmental Regulations indicates that some relatively new coal-fired merchant generation may be retired because the merchant generator cannot recover incre-mental capital costs from adding emissions controls, either through an increase in capacity payments, or in the case of energy-only markets, through wholesale electric prices. These factors contribute to the EPA regulations’ uncertain impacts on natural gas demand going forward.
Levelized Cost of Electricity Favors Gas-Fired Generation
Currently, on an LCOE basis, new NGCC capacity has a lower cost than all but conventional hydro, as shown in Figure 3-10. This LCOE analysis excludes the impact of grants, production tax credits, and loan guarantees, as well as costs of emissions and other environmental impacts. Some load serving entities also consider consumer energy efficiency gains or demand response and interruptible services as viable alternatives to building new generation capacity.21
21 For instance, the PJM and ISO-New England grid operators allow energy efficiency and demand response providers to bid into capacity their capacity markets. Such providers are com-pensated for reduced demand in a manner comparable to that provided to suppliers of electricity.
generation. This displacement of coal has increased natural gas demand from the power sector by about 2.7 Bcf/d since then.17 Unless natural gas prices remain low or coal prices increase, the displacement of coal by natural gas in generation may not last for very long. Based on 2007 data, the Congressional Research Service has estimated, on an unconstrained basis, that there is the potential to increase NGCC natural gas demand by 12.7 Bcf/d through the displacement of existing coal-fired generation while reducing CO2 emission by 382 million MtCO2e per year.18
More displacement of coal generation by gas gen-eration is unlikely to be realized unless natural gas prices decrease below recent levels or unless deliv-ered coal prices increase above recent levels. If poli-cymakers desire to make greater use of natural gas to displace coal, then there are a couple of mechanisms to accomplish such a goal. One way is to narrow the spread between natural gas and coal prices by insti-tuting a price on carbon. Another way that does not use a direct price mechanism to displace more coal generation would be to dispatch based on emissions, not variable costs. These latter two options fall in the category of regulatory or policy drivers.
Implementation of Proposed Non-GHG EPA Rules
Implementation of various proposed non-GHG EPA regulations affecting power generation will likely lead to an increase in natural gas demand and in gas-fired generation capacity. A review of several stud-ies suggests this could lead to an increase in power generation natural gas demand of up to 12.9 Bcf/d (4.7 Tcf/yr), with an average of 6.0 Bcf/d (2.2 Tcf/yr) (see Figure 3-9).19 Proposed non-GHG EPA regula-tions include those for20:
y Sulfur dioxide (SO2) and nitrogen oxide (NOx)
17 See Bentek Energy, Market Alert, “Power Burn Head Fake Catches Market Off Guard,” August 3, 2010, page 22.
18 Congressional Research Service, Displacing Coal with Generation from Existing Natural Gas-Fired Power Plants, January 10, 2010.
19 The Carbon and Other Emissions Subgroup analyzed several studies of the impact of EPA rules; the sample included research from private consultants, investment banks, trade associa-tions, and the North American Electric Reliability Corporation. The average impact was a closure of 58 GW of coal capacity.
20 See Chapter Four, “Carbon and Other Emissions in the End-Use Sectors,” for a description of the non-GHG EPA Rules.

266 prUDeNt DeVeLOpMeNt: realizing the potential of North america’s abundant Natural Gas and Oil resources
Capital costs can vary significantly between stud-ies. Often the variation in capital costs is a func-tion of when the cost estimate was prepared. Capital costs for most energy projects increased significantly through 2008, and then modestly retreated. Studies prepared in 2009 or earlier were generally based on costs before the 2008 run-up. LCOEs can also vary significantly between studies because of variations in assumed energy prices used to estimate fuel cost per MWh, whereas the heat rate part of the fuel cost equa-tion generally is not a cause of major variation (see Table 3-1).23
Although LCOE for natural gas technologies is very competitive as they have relatively low capital costs, natural gas technologies usually have the highest dis-patch cost as variable costs, primarily fuel costs, are higher than other technologies (see Figure 3-11). The dilemma is: if you build it, it may not run at a high capacity utilization rate.
23 Fuel cost per MWh is the product of delivered cost of fuel per MMBtu and the heat rate (Btu required to generate a kWh).
These two sources are often cheaper than new gen-eration capacity. For instance, in a 2009 review of 14 state energy efficiency programs, the Ameri-can Council for an Energy-Efficient Economy found costs of $16 to $33, averaging $25, per megawatt hour (MWh) saved, which is lower than all the sup-ply options in Figure 3-10.22 Furthermore, efficiency gains have zero dispatch cost. The data on LCOE, however, cover only the costs for new generation capacity. Figure 3-10 provides a single point estimate based on data from the AEO2011 Reference Case.
Capital cost uncertainties are significant for some generation technologies, especially those where the production volume is low or where there has been a significant time lapse since some capacity was built. In contrast, the capital costs for new NGCCs and wind are relatively certain, as a very large number of these units have been built over the last few years.
22 Katherine Friedrich, Maggie Eldridge, Dan York, Patti Witte, and Marty Kushler (2009) “Saving Energy Cost-Effectively: A National Review of the Cost of Energy Saved Through Utility-Sector Energy Efficiency Programs,” American Council for an Energy-Efficient Economy, Report Number U092.
326295
25458
2.2
700 700
496
70 6850
1014.7
120.4
AVERAGEMAXIMUM
MINIMUM
Figure 3-9. Impact of Proposed Non-Greenhouse Gas EPA RulesWAS Figure 8; ALSO Fig. CS-13
COAL RETIREMENT(GIGAWATTS)
COAL RETIREMENT(TERAWATT
HOURS)
INCREMENTAL GASDEMAND (TRILLION
CUBIC FEET)
INCREASED GASGENERATION
(TERAWATT HOURS)
CO2 REDUCTIONS(MILLION METRIC TONS
CO2 EQUIVALENT)
Notes: EPA = Environmental Protection Agency. Only to scale within each statistic of interest.
Figure 3-9. Impact of proposed Non-GhG epa rules

Chapter 3 – NatUraL GaS DeMaND 267
DOLLARS PER MEGAWATT HOUR
Notes: Based on AEO2011 Reference Case data. Gas price, $5.11 per MMBtu (2009$) for 2020. Coal price, $2.16 per MMBtu (2009$) for 2020. No emissions costs for sulfur dioxide, nitrogen oxide, or carbon dioxide. Capacity factors: Base load, 80%; Intermittent renewables, 30%; natural gas combustion turbine, 10%. NGCC = natural gas combined cycle; BFB = bubbling �uidized bed; CCS = carbon capture and sequestration; IGCC = integrated gasi�cation combined cycle; MSW = municipal solid waste.
NATURAL GASCOALNON-FOSSIL
Figure 3-10. Levelized Cost of Electricity
0 50 100 150 200 250 300 350
CONVENTIONAL HYDRO
ADVANCED NGCC
BIOMASS BFB
ADVANCED PULVERIZED COAL
ADVANCED NGCC WITH CCS
GEOTHERMAL-BINARY
IGCC
WIND ONSHORE
ADVANCED NUCLEAR
IGCC WITH CCS
ADVANCED PULVERIZED COAL WITH CCS
ADVANCED COMBUSTION TURBINE
BIOMASS COMBINED CYCLE
MSW–LANDFILL
FUEL CELLS
CONCENTRATINGSOLAR POWER
PHOTOVOLTAIC
WIND OFFSHORE
Figure 3-10. Levelized Cost of electricity
0 20 40 60 80 100
NATURAL GASCOALNON-FOSSIL
CONVENTIONAL HYDRO
ADVANCED NGCC
BIOMASS BFB
ADVANCED PULVERIZED COAL
ADVANCED NGCC WITH CCS
GEOTHERMAL–BINARY
IGCC
WIND ONSHORE
ADVANCED NUCLEAR
IGCC WITH CCS
ADVANCED PULVERIZED COAL WITH CCS
ADVANCED COMBUSTION TURBINE
BIOMASS COMBINED CYCLE
MSW–LANDFILL
FUEL CELLS
CONCENTRATING SOLAR POWER
PHOTOVOLTAIC
WIND OFFSHORE
Figure 3-11. Dispatch Cost of Electricity
DOLLARS PER MEGAWATT HOUR
Notes: Based on AEO2011 Reference Case data. Gas price, $5.11 per MMBtu (2009$) for 2020. Coal price, $2.16 per MMBtu (2009$) for 2020. No emissions costs for sulfur dioxide, nitrogen oxide, or carbon dioxide. Capacity factors: Base load, 80%; intermittent renewables, 30%; natural gas combustion turbine, 10%. NGCC = natural gas combined cycle; BFB = bubbling �uidized bed; CCS = carbon capture and sequestration; IGCC = integrated gasi�cation combined cycle; MSW = municipal solid waste.
Figure 3-11. Dispatch Cost of electricity

268 prUDeNt DeVeLOpMeNt: realizing the potential of North america’s abundant Natural Gas and Oil resources
Table 3-1. Comparative CapeX and heat rates for Select Coal and Natural Gas power technologies
Technology CAPEX ($/kW) Heat Rate (Btu/kWh)
aeO2010 Supercritical pulverized Coal (pC) $2,223 9,200
aeO2011 r. W. Beck advanced pC $3,167 8,800
rice University Scrubbed Coal New Department of energy (DOe) Source (2005$) $1,939 9,200
rice University Scrubbed Coal New Industry Sources (2005$) $3,080
National energy technology Laboratory (NetL) pC Subcritical total Overnight Cost (2007$) $1,996 9,277
NetL pC Supercritical total Overnight Cost (2007$) $2,024
aeO2011 r. W. Beck advanced pC with Carbon Capture and Sequestration (CCS) $5,099 12,000
rice University Scrubbed Coal New with CCS DOe Source (2005$) $2,993 11,061
rice University Scrubbed Coal New with CCS Industry Sources (2005$) $4,846
NetL pC Subcritical with CCS total Overnight Cost (2007$) $3,610 13,046
NetL pC Supercritical with CCS total Overnight Cost (2007$) $3,570 12,002
aeO2010 Integrated Gasification Combined Cycle (IGCC) $2,569 8,765
aeO2011 r. W. Beck IGCC $3,565 8,700
rice University IGCC DOe Source (2005$) $2,241 8,765
rice University IGCC Industry Sources (2005$) $3,714
NetL IGCC General electric energy (Gee) r+Q total Overnight Cost (2007$) $2,447 8,765
NetL IGCC Conocophillips (Cop) e-Gas FSQ total Overnight Cost (2007$) $2,351 8,585
NetL IGCC Shell total Overnight Cost (2007$) $2,716 8,099
aeO2010 IGCC with CCS $2,776 10,781
aeO2011 r. W. Beck IGCC with CCS $5,348 10,700
rice University IGCC with CCS DOe Source (2005$) $3,294 10,781
rice University IGCC with CCS Industry Sources (2005$) $5,480
NetL IGCC with CCS Gee r+Q total Overnight Cost (2007$) $3,334 10,458
NetL IGCC with CCS Cop e-Gas FSQ total Overnight Cost (2007$) $3,465 10,998
NetL IGCC with CCS Shell total Overnight Cost (2007$) $3,904 10,924
aeO2010 advanced Natural Gas Combined Cycle (NGCC) $968 6,752
aeO2011 r. W. Beck advanced NGCC $1,003 6,430
rice University advanced NGCC DOe Source (2005$) $893 6,752
rice University advanced NGCC Industry Sources (2005$) $996
NetL advanced F Class NGCC total Overnight Cost (2007$) $718 6,798
aeO2010 advanced NGCC with CCS $1,932 8,613
aeO2011 r. W. Beck advanced NGCC with CCS $2,060 7,525
rice University advanced NGCC with CCS DOe Source (2005$) $1,781 8,613
rice University advanced NGCC with CCS Industry Sources (2005$) $1,850
NetL advanced F Class NGCC with CCS total Overnight Cost (2007$) $1,497 7,968
Sources: energy Information administration, annual energy Outlook 2010 (aeO2010) reference Case and annual energy Outlook 2011 (aeO2011) reference Case.
r. W. Beck, Inc. task 692, Subtask 2.6 – review of power plant Cost and performance assumptions for NeMS.
rice University (James a Baker III Institute for public policy), Energy Market Consequences of Emerging Renewable and Carbon Dioxide Abatement Policies in the United States, august 13, 2010.
National energy technology Laboratory (NetL), Cost and Performance Baseline for Fossil Energy Plants Volume 1: Bituminous coal and Natural Gas to Electricity Revision 2, November 2010.

Chapter 3 – NatUraL GaS DeMaND 269
0 50 100 150 200 250 300 350 400 450
AEO2010 REFERENCE CASE
AEO2010 HIGH SHALE
AEO2010 NO SHALE
RFF BASELINE
RFF ABUNDANT SHALE
EIA KL BASIC
EIA KL HIGH SHALE
EIA KL HIGH COST
EIA KL NOINTL LTDALT
RFF LOW CARBON POLICY BASELINE
RFF LOW CARBON POLICY WITH ABUNDANT SHALE
RFF LOW CARBON POLICY WITH ABUNDANT SHALE AND LIMITS ON NUCLEAR AND RENEWABLE
GIGAWATTS
NGCC WITH CCS
NEW COAL WITH CCS
COAL CCS RETROFIT
NATURAL GAS CT
NGCC WITHOUT CCS
COAL WITHOUT CCS
BIOMASS
SOLAR
GEOTHERMAL
WIND
NUCLEAR
Notes: For a description of cases, see “Description of Projection Cases” at the end of this chapter. RFF cases are for 2030. NGCC = natural gas combined cycle; CCS = carbon capture and sequestration; CT = combustion turbines.
Figure 3-12. U.S. Generation Capacity Additions through 2030 or 2035
Figure 3-12. U.S. Generation Capacity additions through 2030 or 2035
Projections of Generation Capacity and Generation by Technology and Fuel
The fuel and technology mix of power generation capacity additions through 2035 for EIA Cases and 2030 for the Resources for the Future (RFF) Cases vary significantly, reflecting the impact that policy can have on capacity additions (see Figure 3-12).24
Given the differences between studies in power generation capacity additions, it is not surprising that there are significant variations in generation by fuel and technology that lead to a wide variation in projec-tions for power generation natural gas demand (see Figure 3-13).25 Given the damage to the Fukushima Daiichi nuclear facility in Japan from the March 2011 Richter 9.0 earthquake and tsunami, it should be noted that none of the studies reviewed had a decrease in U.S. nuclear generation capacity from today’s lev-els. Although it is too early to assess what the impact might be on the future of U.S. nuclear generation, any reduction in future forecasts of nuclear generation capacity would likely be offset to some extent by more gas-fired generation capacity.
Impact of a Price on Carbon on Natural Gas Demand
If the United States chooses to establish a price for carbon, more natural gas generation could likely dispatch ahead of some coal generation, increas-ing power generation natural gas demand.26,27 Since coal is more carbon intensive than natural gas, a price on carbon could affect dispatch eco-nomics by increasing the generation cost of coal by more than the generation cost of natural gas. A price on carbon most likely would increase power generation gas demand, but could decrease total natural gas demand depending on specific terms and conditions of a carbon program, natural gas supply, CO2 price, inter-fuel competition, and economy-wide price/demand feedback effects
24 These were the cases for which power generation capacity additions through at least 2030 were available.
25 These were the cases for which generation by fuel was available through 2030 or 2035.
26 For a discussion of price on carbon, see Chapter Four.
27 Generally, natural gas and coal are the fuels on the margin for power generation. Nuclear, hydro, and renewables generally dispatch before coal and gas. See Figure 3-11.

270 prUDeNt DeVeLOpMeNt: realizing the potential of North america’s abundant Natural Gas and Oil resources
0 1 2 3 4 5 6
2008
AEO2010 REFERENCE CASE
AEO2010 HIGH SHALE
AEO2010 NO SHALE
EIA KL BASIC
EIA KL HIGH GAS
EIA KL HIGH COST
EIA KL NOINTL LTDALT
MIT NO CLIMATE POLICY
MIT WITH CLIMATE POLICY
MIT REGULATORY EMISSIONS REDUCTIONS
RFF BASELINE
RFF ABUNDANT SHALE
RFF LOW CARBON POLICY BASELINE
RFF LOW CARBON POLICY WITH ABUNDANT SHALE
RFF LOW CARBON POLICY WITH ABUNDANT SHALEWITH LIMITS ON NUCLEAR AND RENEWABLE
TERAWATT HOURS
GAS WITH CCS COAL WITH CCS
OIL WITHOUT CCS GAS WITHOUT CCS COAL WITHOUT CCS
RENEWABLESNUCLEARHYDRO
Figure 3-13. U.S. Generation by Fuel 2030 or 2035
Notes: For a description of cases, see “Description of Projection Cases” at the end of this chapter. RFF cases are for 2030. CCS = carbon capture and sequestration.
Figure 3-13. U.S. Generation by Fuel for 2030 or 2035 (see Figure 3-14). For the studies reviewed that had a price on carbon, the typical feedback effects for natural gas relative to a reference or business-as-usual case are:
y Natural gas demand will tend to increase relative to other fossil fuels in the electric sector, par-ticularly with respect to coal, due to natural gas’s favorable environmental and efficiency attributes.
y Higher power generation natural gas demand could lead to higher end-user natural gas prices that through the price elasticity effect could lead to a reduction in residential, commercial, and indus-trial natural gas demand. Most, but not all, stud-ies expect total natural gas demand to increase.
y Higher generation costs for coal and natural gas could increase wholesale and retail electricity prices that, depending on the price for carbon, may lead to a reduction in electricity demand through the price elasticity effect.
y Lower electricity demand could lower natural gas and coal demand as natural gas and coal genera-tion are usually on the margin for dispatch and that in turn leads to slightly lower natural gas and coal prices, but not enough to offset the impact from putting a price on carbon.
y An improvement in the LCOE for natural gas-fired generation versus coal-fired generation that could increase natural gas’s share of total future genera-tion capacity that could in turn lead to higher nat-ural gas demand from the power sector.
y An increase in demand for greater energy effi-ciency in both generation and end use that could result in lower natural gas demand.
Depending on specific terms and conditions of a carbon program, one of the likely feedback effects of putting a price on carbon will be an increase in natural gas and electricity prices for end users (see Figure 3-15). All other things being equal, higher natural gas and electricity prices for North Ameri-can industrial end users will likely reduce their com-petitiveness unless international competitors are also subject to commensurate energy cost increases, assuming all other factors are held constant. These impacts need to be fully considered in any cost benefit analysis of a proposed carbon program.

Chapter 3 – NatUraL GaS DeMaND 271
A cost for second generation gas with CCS is not yet available.
NGCC with CCS should have significantly lower emissions of NOx, SO2, Hg, and ash as well as sig-nificantly lower CO2 emissions, transportation, and sequestration requirements (see Figure 3-16). The lower CO2 emissions are a function of the differences in carbon content of the fuels and heat rates, both of which favor natural gas. The total heat rate for CCS is greater than for non-CCS, as CCS has large parasitic electric requirements. The heat rate for advanced pul-verized coal with CCS is 12,000 British thermal units per kilowatt hour (Btu/kWh) compared to 8,800 Btu/kWh without CCS. The heat rate for NGCC with CCS is 7,525 Btu/kWh compared to 6,430 Btu/kWh without CCS (see Figure 3-16).29 Given that natural gas CCS has significant emissions advantages over coal CCS, CCS research and development efforts should include both natural gas and coal. At present, federal research
29 Based on AEO2011 Reference Case data and 2010 technology documentation report by R. W. Beck, Inc., and SAIC, prepared for the EIA, Task 692, Subtask 2.6 – Review of Power Plant Cost and Performance Assumptions for NEMS.
Carbon Capture and Sequestration
Those studies that looked at a deep reduction in CO2 (over 80%) assumed that CCS would be available for coal and gas-fired generation (see Figures 3-12 and 3-13).
NGCC with CCS may have a lower LCOE per MWh than coal with CCS (see Figure 3-10). A recent Department of Energy (DOE) Office of Fossil Energy analysis shows that first generation CCS technology for natural gas has a lower first-year cost of electric-ity than first generation CCS technology for coal at natural gas prices up to $8 (2010$) per MMBtu.28 This analysis used a low delivered coal price of $1.64 per MMBtu whereas the estimated delivered price of coal for 2010 is $2.30 per MMBtu. The analysis also shows that second generation CCS technology for coal has a first-year cost of electricity that is over $25 per MWh lower than first generation CCS technology for coal.
28 Sources: National Energy Technology Laboratory (NETL) Today – Cost and Performance Baseline for Fossil Energy Plants (NETL/2010) and NETL 2nd Generation based on multiple NETL technology pathway study reports.
Figure 3-14. Total U.S. Natural Gas Demand and CO2 Price for 2030
0
100
200
20 21 22 23 24 25 26 27 28 29
2008
DO
LLA
RS P
ER M
ETRI
C TO
N O
F CO
2 EQ
UIV
ALE
NT
TRILLION CUBIC FEET
2010 AEO2010 REFERENCE CASE FOR 2030
EIA WMBASIC EIA KL
BASIC
EIA KLNOINTL LTDALT
EIA WMNOINTL LTDALT
Note: For a description of cases, see “Description of Projection Cases” at the end of this chapter.
Figure 3-14. total U.S. Natural Gas Demand and CO2 price for 2030

272 prUDeNt DeVeLOpMeNt: realizing the potential of North america’s abundant Natural Gas and Oil resources
Figure 3-16. Natural Gas and Coal CO2 Emissions with and without CCS
0
1,000
2,000
ADVANCEDPULVERIZED
COAL
IGCC ADVANCEDNGCC
ADVANCEDPULVERIZEDCOAL WITH
CCS
IGCC WITHCCS
ADVANCEDNGCC WITH
CCS
POU
ND
S PE
R M
EGAW
ATT
HO
UR
CO2 EMISSIONS CO2 STORAGE
Notes: CCS = carbon capture and sequestration; IGCC = integrated gasi�cation combined cycle; NGCC = natural gas combined cycle. Source: Energy Information Administration’s AEO2011 Reference Case.
Figure 3-16. Natural Gas and Coal CO2 emissions with and without CCS
Figure 3-15. Impact of Carbon Cases on End-User Natural Gas and Electricity Prices
0
20
40
60
2010 AEO2010REFERENCE CASE
EIA WM BASIC EIA WM NOINTLLTDALT
EIA KL BASIC EIA KL NOINTLLTDALT
2008
DO
LLA
RS P
ER M
ILLI
ON
BTU
RESIDENTIAL NATURAL GASCOMMERCIAL NATURAL GASINDUSTRIAL NATURAL GAS
RESIDENTIAL ELECTRICITYCOMMERCIAL ELECTRICITYINDUSTRIAL ELECTRICITY
2030 Note: For a description of cases, see “Description of Projection Cases” at the end of this chapter.
Figure 3-15. Impact of Carbon Cases on end-User Natural Gas and electricity prices

Chapter 3 – NatUraL GaS DeMaND 273
Both natural gas transmission pipelines and electric transmission grids operate under different complex systems of rules and regulations that have evolved over decades, largely independent of each other. The prospects that natural gas will become an even larger supply source for power generation and the increas-ing need for natural gas generation to backstop inter-mittent renewable generation will further complicate these respective operating and regulatory systems.
The market rules and service arrangements that govern these two markets, however, differ from one another so that inefficiencies occur. For instance, in many power markets, generators must request natu-ral gas transportation capacity a day before electric grid operators determine which generation plants will be needed to meet the market demand in a near-term upcoming period. As a result, power generators must schedule pipeline capacity before being scheduled for generation commitment or attempt to find pipeline capacity and gas supplies after other potential gas transportation users have already scheduled capacity. This mismatch in the timing of processes results in an inefficient market and use of resources. Further, while the gas day is uniform across their industry, and pipeline shippers can transport gas across time zones and across different pipelines seamlessly, the electric industry does not have a uniform electric day.
An example of the increasing interdependence of natural gas and electric power is what happened in February 2011 in the Southwest when more than 50 electricity generation units stopped working over-night because of severe weather, reducing capacity by 7,000 megawatts and leading to rolling power out-ages. Other power plants found their fuel supplies curtailed by local distribution companies under nat-ural gas priority rules that were last updated in the early 1970s. Some of the controlled electric outages also idled natural gas pipeline compressor stations, reducing pipeline pressure and hampering the ability of natural gas generation plants to get the fuel they needed. This incident highlights the need to resolve certain issues that sit at the intersection of gas and electric deliverability, and wholesale electric market reliability.
The natural gas industry’s reliance on electricity is also increasing. Increased use by pipelines of elec-tric compression to meet air quality requirements in some areas has increased the need for reliable electric service to be able to provide reliable natu-ral gas service. Another example is the dependence
and development and pilot project dollars for carbon capture are focused mostly on coal, although much of the research is also applicable to natural gas.30
Additional investment in demonstration projects for first generation carbon capture technologies is not likely to yield a substantial reduction in costs. The Global CCS Institute does not find scope for significant cost reductions because the component technologies are all commercially mature.31 The cost reductions from building first generation technology demonstration plants could average between 9.7% and 17.6% depending on the technology. These cost reductions represent decreased risk in the existing technologies and do not consider other improvements such as implementing new technologies for capture or economies of scale savings in transportation and stor-age. The reason for these small cost decreases is that the majority of the capital costs are well known for proven technologies. Furthermore, the DOE Office of Fossil Energy analysis mentioned above also shows that second generation CCS technology for coal has a first-year cost of electricity that is over $25 per MWh lower than first generation CCS technology for coal.
Harmonization of U.S. Natural Gas and Power Markets
In the past decade, the U.S. natural gas and power industries have become more interdependent. From 2000 to 2010, the use of natural gas for generation increased from 16 to 24% of total electric sector gen-eration. For the same period, natural gas demand for power generation grew from 14 to 20 Bcf/d, increasing power generation share of total natural gas demand from 22 to 31%. Renewable generation, excluding con-ventional hydro, has increased from 2% of total gen-eration in 2000 to 4% in 2010. With an expectation of strong future growth in intermittent renewable gen-eration driven by state-mandated Renewable Portfolio Standards and federal subsidies for wind, it has also become increasingly clear that natural gas infrastruc-ture and supply will be impacted in multiple ways.32
30 National Energy Technology Laboratory, NGCC with CCS: Applicability of NETL’s Coal RD&D Program, January 27, 2011.
31 Global CCS Institute, Strategic Analysis of the Global Status of Carbon and Storage, Report 2: Economic Assessment of Carbon Capture and Storage Technologies, 2009, page 80.
32 See http://www.eia.gov/energy_in_brief/renewable_portfolio_ standards.cfm and http://www.eia.gov/analysis/requests/ subsidy/.

274 prUDeNt DeVeLOpMeNt: realizing the potential of North america’s abundant Natural Gas and Oil resources
generation or to replace coal-fired generation that might be retired because of proposed non-GHG EPA regulations.
y The natural gas network is becoming increasingly reliant on electric service to provide reliable gas ser-vice and the electric network is becoming increas-ingly reliant on gas service to provide reliable elec-tric service.
Firm Pipeline Transportation Capacity
Interstate gas pipelines are designed based on the firm contractual commitments made by shippers that support the project. Interstate gas pipelines do not have “reserve capacity,” which electric utilities have. For over a decade now, the Federal Energy Regula-tory Commission (FERC) has generally required pipe-line shippers who need new capacity and will benefit from that capacity, to pay for that capacity. Produc-ers wanting to connect new supply have to contract for any new pipeline capacity needed. Buyers want-ing new delivery capacity have to contract for any new pipeline capacity needed. Further, the FERC has held pipelines at risk for any unsubscribed capacity.34 Gen-erally, the costs of new capacity are not allocated to existing customers.
There are no operational impediments to natu-ral gas pipelines serving electric generators, pro-vided that the generator has contracted for the appropriate pipeline transportation service. Most peaking generators contract only for interruptible transportation service or rely on the capacity release market to transport gas on the pipeline.35 If during peak demand periods, pipeline firm transportation customers use their full contractual entitlements and the pipeline’s capacity is fully subscribed, then inter-ruptible transportation will not be available. For example, a January 2004 cold snap in New England highlighted that most merchant generators do not have firm pipeline transportation and firm gas supply. With record peak electricity demand during the cold snap, pipelines’ firm transportation shippers used their full contractual entitlements and the pipelines
34 Under the FERC’s at-risk policy, costs allocated to unsubscribed or unsold capacity are borne by the pipeline’s stockholders, not its customers. This prevents a pipeline from shifting costs to other customers if they are unable to sell the capacity.
35 Capacity release occurs when a firm shipper who is not utiliz-ing its firm capacity releases its firm entitlements to another shipper for a specified period subject to any specified recall rights.
of many gas processing plants on electric service as demonstrated by gas processing plants being offline in February 2011 in the Southwest and in the aftermath of hurricanes Katrina and Rita in 2005, and Ike and Gustav in 2008. If natural gas cannot be processed, pipelines may not accept gas for delivery if acceptance would adversely affect their operations.
Clearly, the natural gas and power industries are becoming increasingly interdependent. And that interdependency is expected to continue to increase in the future. As natural gas and power industries have become more interdependent, various issues have surfaced including:
y How merchant generators can recover costs asso-ciated with firm pipeline capacity and firm gas supply.33 Merchant generators, even those operat-ing in markets with capacity payments, are very reluctant to acquire firm transportation and natu-ral gas supply, because they cannot recover the fixed costs associated with firm supply. Yet many of these merchant generators sell firm electricity and their generation capacity is considered firm for reserve margin purposes.
y The operating day and time lines for scheduling natural gas and electricity are different and incon-sistent with each other.
y The electric day for scheduling across regions is not standardized.
y A lack of harmonization between natural gas and power markets on how to deal with intraday varia-tions in demand. Intraday changes in electric-ity demand requires generation that can quickly respond to unexpected changes in requirements that are not necessarily compatible with either the terms and conditions of natural gas service, the nat-ural gas intraday nomination processes, or capacity priority rights.
y Very few generators subscribe to either pipeline “no notice” or other services that can be tailored to gen-erators’ needs.
y Potential transmission constraints to the use of existing NGCC plants to displace coal-fired
33 Firm pipeline capacity means that a shipper has a contract with a pipeline for firm transportations service under the pipeline’s approved tariff. Firm transportation is generally not subject to interruption except in the event of a force majeure or a maintenance outage. Under a firm transportation contract the pipeline is only obligated to deliver natural gas that it has received.

Chapter 3 – NatUraL GaS DeMaND 275
tion pipeline capacity or short-term capacity release because under wholesale power market rules, there generally is no assurance that they can recover the fixed costs associated with either firm transportation or firm gas supply. For merchant markets with capac-ity payments, such payments seldom fully compen-sate for the fixed cost of generation capacity, let alone cover the fixed costs of having firm pipeline transpor-tation contracts.
Operating Day and Time Lines for Scheduling
For over a decade now, U.S. and Canadian natural gas interstate pipelines have operated under a com-mon set of standards developed by the North Ameri-can Energy Standards Board (NAESB) under the aus-pices of the FERC. These standards were developed to improve market transparency and efficiency by facili-tating computer-to-computer communication for, among other things, scheduling flows of natural gas. All pipelines use a gas day that begins at 9 a.m. central time. In addition, a common set of pipeline location codes were implemented. Scheduling processes have been standardized. On the other hand, the electric industry does not have a set of North America-wide or even interconnection-wide standards for when the electric day starts. Moreover, the times for schedul-ing electricity vary by specific RTO and these are not consistent with standardized natural gas scheduling processes. Thus, the process for scheduling electric-ity is neither consistent with the standardized natu-ral gas scheduling process nor consistent with other RTOs (see Figures 3-17 and 3-18).
As a consequence of these inconsistent time lines, the owner of a gas-fired generator must either buy gas without knowing if its power will be scheduled, or submit a power bid before knowing if the gas can be purchased and scheduled. The cost of covering the risk created by the inconsistency in time lines must be reflected in generators’ power offers. During periods when or regions where power and natural gas pipe-line capacity are not constrained and demand is not volatile, this is a manageable risk. However, when pipeline capacity is constrained, the risk is high as gas-fired generators may be exposed to substantial balancing penalties from pipelines and local distribu-tion companies (LDCs).
Intraday time lines are also inconsistent, such as between the natural gas and electric scheduling pro-cesses. The intraday gas market is generally much
did not have excess capacity available to schedule for interruptible transportation customers. While the pipelines met their firm contractual obligations, and all firm transportation customers received transporta-tion service, customers relying on interruptible trans-portation did not. As a consequence, 6,000 megawatts of natural gas-fired generation was unavailable to run because the operators chose to rely on interruptible transportation, which is only available after the pipe-line has met all of its firm contractual requirements.36 The loss of this generation jeopardized the reliability of the ISO-New England electric grid.
The January 2004 cold snap in New England also demonstrates how local spot gas prices can increase as merchant generators and other non-firm shippers bid against each other to acquire a shrinking supply of pipeline capacity. The result is not only higher local natural gas prices, but higher local wholesale power market prices. Electric grid service reliability also can be threatened, which again happened in New England in 2004. As power-generation gas demand increases, the possibility of constraints could spread to other markets during other times of heavy demand.
To ensure reliability of power service during the winter in regions with substantial heating loads, gen-erators need to be able to access gas supplies quickly in order to respond to system dispatch orders by (1) holding both firm pipeline capacity and firm gas supply, purchasing appropriate services from inter-state pipelines, or (2) having dual fuel capability – i.e., the ability to burn a fuel other than natural gas such as distillate. Unless wholesale power markets allow gen-erators to recover the cost of firm pipeline capacity or of dual fuel capability, generators will not enter into long-term pipeline contracts that are a prerequisite for pipelines to provide firm service nor will they build dual fuel capability. An alternative approach would be for grid operators, such as the regional transmission operators (RTOs) and independent system operators (ISOs), to hold some quantity of firm pipeline trans-portation capacity on behalf of the market to ensure that electric reliability could be preserved during coincident peak periods.
As noted above, most generators, particularly those selling into unbundled wholesale electric mar-kets, choose less-expensive interruptible transporta-
36 ISO-New England Final Report on Electricity Supply Condi-tions in New England During the January 14-16, 2004 “Cold Snap,” October 12, 2004.

276 prUDeNt DeVeLOpMeNt: realizing the potential of North america’s abundant Natural Gas and Oil resources
Better-coordinated natural gas and power time lines could help reduce power generator risks. However, given that gas processes are based on national standards, but power processes vary by region, it will take significant efforts to develop uniform, consistent gas and power time lines for North America.
In 2006, NAESB filed a report on Gas and Elec-tric Interdependency with the FERC that included a proposed standard energy day. NAESB under-took a process to review potential modifications to the gas nomination schedule as a way to improve gas-electric consideration. In 2008, NAESB reported to the FERC that while several proposals were advanced, none achieved a sufficient consen-sus. However, recent events in the Southwest have led the NAESB to file with the FERC to reactivate discussions.
Firm Pipeline Service
Regulated utility generators that do have the ability to recover costs associated with firm transportation
less liquid than the electric market, adding to the risk associated with real-time offers. All of this is com-plicated by the operation of electric generating units (especially gas-fired units), which can be brought online with relatively short notice and/or can change generation output levels very frequently to adjust for changes in power requirement on the grid. These changes can be related to other generating units unexpectedly going offline, changes in load, and/or changes to intermittent renewable generation output. These frequent and sometimes dramatic changes in gas-fired generation requirements can put stress on the pipeline system. Although pipe-lines have various mechanisms for dealing with these changes, including the use of storage, compression and/or line pack, their tariffs typically call for gas to be used at an even 24-hour or ‘ratable’ flow, if pipe-line operations could be adversely affected.37
37 Line pack is the volume of gas in a pipeline. Line pack will vary as the pressure within the pipeline varies between mini-mum and maximum operating pressures. Hourly variations in demand are generally met by variations in line pack. On a daily basis, however, variations in line pack need to be either restored or depleted by either withdrawing or injecting from natural gas storage.
Figure 3-17. Electric Day versus Gas Day
NORTH AMERICAN GAS DAY – 9 AM TO 9 AM – CCT
PACIFIC – MIDNIGHT TO MIDNIGHT PST
ELECTRIC DAY
GAS DAY
CENTRAL – MIDNIGHT TO MIDNIGHT CCT
EASTERN – MIDNIGHT TO MIDNIGHT EST
MOUNTAIN – MIDNIGHT TO MIDNIGHT MST
12 AM 12 AM 3 AM12 PM6 AM 6 PM3 AM 9 AM 3 PM 9 PM
Note: Central Clock Time (CCT) means Central Standard Time (CST), except when Daylight Saving Time is in e�ect, when it means one hour in advance of CST.
Figure 3-17. electric Day versus Gas Day

Chapter 3 – NatUraL GaS DeMaND 277
Figu
re 3
-18.
Ele
ctric
Sch
edul
e ve
rsus
Gas
Nom
inat
ion
Sche
dule
for D
ay A
head
Mar
kets
SCH
EDU
LIN
G F
OR
ORG
AN
IZED
MA
RKET
S –
RTO
s A
ND
ISO
s
Sche
dulin
g - P
ostin
g - F
low
NY
ISO
CA
ISO
MIS
O
ISO
-NE
PJM
ELEC
TRIC
DA
Y (M
IDN
IGH
T TO
MID
NIG
HT)
Cent
ral C
lock
Tim
e (C
CT)
12
AM6
AM 1
2 PM
6 PM
12
AM6
AM 1
2 PM
6 PM
12
AM
SCH
EDU
LIN
G F
OR
ALL
NO
RTH
AM
ERIC
AN
NAT
URA
L G
AS
PIPE
LIN
ES
TIM
ELY
NO
MIN
ATIO
NEV
ENIN
G N
OM
INAT
ION
INTR
ADAY
1 N
OM
INAT
ION
INTR
ADAY
2 N
OM
INAT
ION
GA
S D
AY
(9 A
M T
O 9
AM
)
Not
es:
Cent
ral C
lock
Tim
e (C
CT) m
eans
Cen
tral
Sta
ndar
d Ti
me
(CST
) exc
ept w
hen
Day
light
Sav
ing
Tim
e is
in e
�ect
,
whe
n it
mea
ns o
ne h
our i
n ad
vanc
e of
CST
. All
times
are
con
vert
ed to
CCT
.
NYI
SO =
New
Yor
k In
depe
nden
t Sys
tem
Ope
rato
r; CA
ISO
= C
alifo
rnia
Inde
pend
ent S
yste
m O
pera
tor;
M
ISO
= M
idw
est I
ndep
ende
nt S
yste
m O
pera
tor;
ISO
-NE
= In
depe
nden
t Sys
tem
Ope
rato
r New
Eng
land
.
1
2 3 4 5
4 am
- 10
am
- 12
am
to 1
2 am
12 p
m -
3 pm
- 12
am
to 1
2 am
11 a
m -
3 pm
- 12
am
to 1
2 am
10 a
m -
2 pm
- 5
pm to
9 a
m
11:3
0 am
- 4:
30 p
m -
9 am
to 9
am
5 pm
- 9
pm -
9 pm
to 9
am
1 26
10 a
m -
2 pm
- 12
am
to 1
2 am
6 pm
- 10
pm
- 9
am to
9 a
m3 4
11 a
m -
3 pm
- 12
am
to 1
2 am
5
7 8 9
6
78
9
CLO
SE F
OR
BID
S O
R N
OM
INAT
ON
S TO
PO
STIN
G O
F SC
HED
ULE
D F
LOW
FLO
W
Figu
re 3
-18.
ele
ctric
Sch
edul
e ve
rsus
Gas
Nom
inat
ion
Sche
dule
for D
ay-a
head
Mar
ket

278 prUDeNt DeVeLOpMeNt: realizing the potential of North america’s abundant Natural Gas and Oil resources
two other firm transportation services to address the issue of hourly takes: enhanced firm transporta-tion and “no-notice” service. The typical enhanced firm transportation allows shippers to take up to 1/16th of the maximum daily quantity in an hour. The typical “no-notice” service further allows ship-pers to take service without a nomination and to take up to 1/16th of the maximum daily quantity in an hour, addressing not only the ratable take issue but also the no bump issue. However, enhanced firm transportation and “no-notice” service are more expensive than standard firm transportation as they require more line pack and/or storage to provide the services.39
In fact, some interstate gas pipelines have begun to develop services designed to meet the needs of gas-fired electric generators to access gas supplies quickly in response to electric system dispatch orders.
A practicable obstacle to providing more flexible firm service, such as hourly firm service, that is not subject to the no bump rule, is that the staff that schedules natural gas for many gas suppliers and buyers are not available on a 24/7/365 basis.
Firming Up Intermittent Renewables
As intermittent renewable generation capacity increases, the power sector is increasingly focused on natural gas-fired generation with its flexible operating characteristics to accommodate day-to-day variations in renewable generation and to firm up intraday varia-tions between scheduled renewable generation (based on a wind forecast) and actual renewable generation or firming requirement. At the heart of all of these issues is how costs should be allocated, whether for main-taining enough pipeline capacity to serve an increase in power generation load, or for compensating genera-tors for backing up intermittent renewable generation.
This issue of who pays for the infrastructure to support renewable energy has been raised in the context of new electric transmission lines for transporting expanded renewables generation. On November 18, 2010, the FERC issued a Notice of Proposed Rulemaking RM10-11-000 that would amend its requirements for electric transmission planning and cost allocation. In this Notice of Proposed Rulemaking, the FERC seeks to address
39 Some pipelines offer “no-notice” service only to former sales customers.
have found that standard firm transportation may not fully meet their needs for two reasons:
y The use of alternate receipt or delivery points by other firm shippers can restrict the ability of an electric generator holding firm transportation from being able to schedule its firm capacity in any of the three intraday scheduling cycles. This can happen when another firm shipper schedules gas from an alternate receipt point and/or to an alter-nate delivery point in the timely nomination cycle, which results in gas flows that exceed the capacity of certain points on the interstate pipeline system. When these flows exceed the capacity at a point or points on the interstate pipeline system, it creates a constraint. This constraint then restricts the abil-ity of a shipper having firm transportation that is scheduled to flow through the constraint to make any changes (increases or decreases) to its sched-uled quantities in any subsequent scheduling cycle for that particular gas day. This is often referred to as the “No Bump Rule.” Therefore, a shipper having firm transportation that serves an electric generat-ing facility that is scheduled to flow through a con-straint has to manage with the amount of gas that it schedules in the timely cycle and cannot make any changes without losing its firm rights. To the extent that the shipper did not schedule its full pri-mary capacity to a point, the remaining capacity is rendered unavailable for that gas day.
y As stated earlier, standard firm transportation gen-erally limits hourly flows to 1/24th of the maximum daily quantity – e.g., pro rata or ratable flow; how-ever, both natural gas and electricity demand do vary considerably over the course of a day. Typically, natural gas demand, especially in the winter, peaks in the early morning and bottoms out just before sunset. Typically, electric demand, especially in the summer, peaks in late afternoon or early evening and bottoms out just before sunrise. For both mar-kets, the pro rata take requirement does not meet basic market requirements. However, pipelines are required to allow non-ratable hourly takes so long as operations are not adversely affected. Most of the time, non-ratable takes can be accommodated, but there is a risk that they may not always be accommodated.38 As a result, many pipelines offer
38 Non-ratable take is met by varying the quantity of line pack at a particular point. However, variations in line pack are limited by the size of the pipe and allowable variation in pressure at a particular point, as well as operating requirements to meet firm contractual obligations.

Chapter 3 – NatUraL GaS DeMaND 279
The study goes on to conclude that to ensure adequate backup generation for electric system reli-ability and that other pipeline customers are not adversely affected by backup generation, regulators should consider adopting policies that:
y Identify generation units that are providing firm-ing service
y Provide a mechanism for cost recovery for genera-tors, including the recovery of firm pipeline trans-portation and storage costs
y Support tariffs that ensure the recovery of costs of pipeline services that meet the needs of firming generation.
Curtailment Rules
Curtailment of interstate pipeline capacity is gener-ally done on a pro rata basis based on shippers’ firm entitlements. In contrast, state or LDC level curtail-ment rules may curtail industrial customers before “human needs” customers such as homes, hospitals, and schools. Unfortunately, in some cases power generators are lumped in with industrial load. Cur-tailment of power generators could adversely affect “human needs” customers, as most such customers need electricity to operate their natural gas equip-ment. Also, curtailment of power generators could adversely affect the delivery of natural gas if process-ing plants, pipelines, or distributors use electric com-pression. This is an area that state regulators and LDC ought to examine to ensure reliability of service.
Transparency
Unexpected changes in demand or supply are driv-ers of price volatility. One way to reduce volatility is to minimize surprises by increasing transparency of supplier operations.40 The FERC has done this by requiring interstate pipelines to post on the web extensive data on their operations. Increasing the transparency of power and transmission operations could also add predictability and reduce surprises.
Transmission Issues
Much has been written about transmission bot-tlenecks related to wind generation. As previously
40 A well insulated home with efficient HVAC has a smaller range of demand for heating and cooling energy (whether electric or direct gas) than inefficient house. Improving thermal integrity of buildings can reduce demand volatility thereby reducing price volatility.
perceived deficiencies in its transmission planning process and cost allocation requirements that may inhibit the development of new transmission facili-ties. The central debate is whether electric consum-ers should be burdened with the costs of new electric facilities from which they receive little or no mean-ingful benefit given a standard that the cost of trans-mission projects be allocated in a fashion “reasonably proportionate to measurable economic and reliability benefits.” Recent decisions in Southwest Power Pool, 131 FERC ¶ 61,252 and in Midwest Independent Transmission System Operator, 133 FERC ¶ 61,221, involve cost allocation methodologies that, at their heart, spread the costs of certain, significant high voltage transmission facilities over the regional transmission operator’s respective footprint.
On March 16, 2011, the Interstate Natural Gas Association of America Foundation released a new study, Firming Renewable Electric Power Generators: Opportunities and Challenges for Natural Gas Pipe-lines. The study examined the amount of firm trans-portation capacity that would have to be built to support the forecasted growth in renewable energy and the regulatory policy issues that would have to be addressed to ensure the cost of this new capacity was recovered. The highlights of the study include:
y In the next 15 years, 105 gigawatts (GW) of renew-able power generation is forecast to be constructed, of which 88 GW could be new intermittent wind generation.
y The natural gas-fired generation, most likely a com-bustion turbine, needed over the next 15 years to firm up wind generation could be approximately 33 GW, generating some 45,500 gigawatt hours (GWh) of electricity.
y Almost 5 Bcf/d of incremental delivery capability could be required over the next 15 years to pro-vide the new gas-fired firming generation with firm natural gas supply. But at an expected load factor of only 15%, natural gas demand might increase by only 0.75 Bcf/d over the next 15 years.
y The total capital cost of the natural gas infrastruc-ture to support firming requirements could range from about $2 billion to $15 billion. Utilization of the new gas pipeline infrastructure is expected to be quite low, around 15% or less. The implied unit cost of firm transportation capacity ($/MMBtu) at a 15% utilization rate would be over six times greater than the cost at a full rate of utilization.

280 prUDeNt DeVeLOpMeNt: realizing the potential of North america’s abundant Natural Gas and Oil resources
U.S. Residential EnergyFor 2010, U.S. residential energy demand, exclud-
ing vehicles, is estimated at 22,132 trillion Btu (see Figure 3-19).44 Residential energy demand includes not only fuel consumed on site, but indirect energy consumption consisting of:
y Natural gas transmission fuel consumed in lease (gathering), processing, and delivering natural gas to the end user, about 8.5%.45 Figure 3-19 includes only the residential sector’s share.
y Energy used to generate electricity (i.e., to convert Btu to kWh) and transmission and distribution (T&D) losses incurred in delivering the electric-ity to the end user. See text box, “Generation and T&D Energy Losses,” for more detail. Figure 3-19 includes only the residential sector’s share.
As discussed under “Full Fuel Cycle Analysis” later in this chapter, information on direct and indirect energy requirements and emissions would assist policymak-ers and end users in making informed choices about total energy consumption, efficiency, and emissions.
Energy efficiency improvements have weakened the link between economic and population growth and energy demand. There remains significant techno-logical potential for efficiency improvements for both natural gas and electricity to reduce long-term demand and emissions.46 Much of this potential is available from better implementation of currently available technologies and techniques (including operations and maintenance practices), while improved technology is needed to obtain further improvements. Beyond the great energy efficiency potential from implement-ing existing technologies and practices, significant efficiency improvements can arise from new tech-nologies that would emerge from investment in research and development. Also, such impediments as information gaps and uncertainty, split incentives (e.g., landlord-tenant problem), and related finan-cial issues would need to be addressed to achieve the potential.
44 Renewable energy includes wood, and petroleum includes liq-uefied petroleum gases such as propane.
45 It does not include any methane leakages from production to end user, as those data are not available from the EIA.
46 American Council for an Energy-Efficient Economy. “The Technical, Economic, and Achievable Potential for Energy Effi-ciency in the U.S.: A Meta-Analysis of Recent Studies,” 2004. Also, DOE/EIA National Energy Modeling System (NEMS) technology assessments.
discussed, since early 2009, lower natural gas prices have resulted in over 2.7 Bcf/d of incremental natural gas demand from displacement of coal-fired genera-tion.41 However, little has been published on possible transmission bottlenecks related to increased use of existing NGCC plants to further displace or replace coal-fired generation. A Congressional Research Ser-vice (CRS) study estimated the potential for coal-to-gas displacement at 12.7 Bcf/d.42 However, that esti-mate assumed that there are no electric transmission barriers to inhibit use of existing NGCCs. The CRS study estimated the displacement potential for NGCC plants within 25 miles of a coal plant at a more limited 3.5 Bcf/d. This study, as well as others reviewed, including the ones analyzing the impact of proposed non-GHG EPA regulations on coal plants, did not address potential transmission bottlenecks to maxi-mizing coal displacement.
u.S. rESIDENTIaL aND COmmErCIaL NaTuraL GaS, DISTILLaTE, aND ELECTrICITy DEmaND
Since 1970, residential and commercial total energy demand, excluding energy used for vehicles, has been driven by growth in electricity sales and associated generation related energy losses from converting Btu to kWh and delivering the electricity to the end user. Growth in electricity demand has been driven by increasing electricity use per customer as we continue to develop new electric devices that have more than offset improvements in electrical efficiency for exist-ing devices.43 In contrast to electricity, natural gas used directly in the residential and commercial sector has remained level since 1970, as efficiency improve-ments have contributed to lower gas use per customer, thereby offsetting growth in demand attributable to a 71% increase in the total number of natural gas customers.
41 Bentek Energy, Market Alert, “Power Burn Head Fake Catches Market Off Guard,” August 3, 2010.
42 Congressional Research Service, Displacing Coal with Gen-eration from Existing Natural Gas Fired Power Plants, Janu-ary 19, 2010, page 10 estimate of 4,775,104,647 MMBtu of natural gas.
43 The U.S. DOE/EIA March 2011 Residential Energy Consump-tion Survey shows an increase in residential electricity use for appliances and electronics from 1.77 to 3.25 quadrillion Btu over the past three decades despite federal mandatory effi-ciency standards.

Chapter 3 – NatUraL GaS DeMaND 281
− High macroeconomic growth
− High gas resources (smallest increase in demand).
y Decreases
− Low gas resources (smallest decrease in demand)
− Low macroeconomic growth
− High technology (more efficiency gains and greatest decrease in demand).
Studies with a price on carbon usually had lower residential natural gas demand than those that did not.
U.S. Residential Distillate Demand
U.S. Northeast residential distillate demand of 1.4 Bcf/d equivalent accounts for 80% of U.S. resi-dential distillate demand (see Figure 3-23). This dis-tillate demand represents an area where conversion from an oil furnace to a natural gas furnace could help increase energy efficiency, reduce greenhouse gas emissions, and reduce oil imports. A new natural
U.S. Residential Natural Gas Demand
U.S. residential natural gas demand for 2010 is estimated at 13.0 Bcf/d, accounting for about 21% of U.S. total natural gas demand (see Figure 3-20).47 For 2030, residential natural gas demand is expected to range from 10.7 to 14.7 Bcf/d driven by household growth (which is a function of population growth) and continued decline in gas demand per household (which is a function of energy efficiency improvements) (see Figures 3-21 and 3-22). Only about 61% of house-holds have residential natural gas service.
Major drivers of residential natural gas demand from highest increase to greatest decrease are:
y Increases
− Low technology (less efficiency gains and greatest increase in demand)
47 Includes only natural gas consumed by residential end users. Does not include related natural gas transmission fuel needed to deliver the natural gas to the residential end user.
Figure 3-19. U.S. Residential Energy Consumption by Fuel
0
10,000
20,000
1950 1960 1970 1980 1990 2000 2010 2020 2030
TRIL
LIO
N B
TU
YEAR
Note: Renewable energy includes wood, and petroleum includes lique�ed gases such as propane.Source: Energy Information Administration.
2035
GENERATION LOSSELECTRIC TRANSMISSION AND DISTRIBUTION ENERGY LOSS
ELECTRICITY SALESNATURAL GAS TRANSMISSION FUELSNATURAL GASRENEWABLE ENERGYPETROLEUMCOAL
Figure 3-19. U.S. residential energy Consumption by Fuel

282 prUDeNt DeVeLOpMeNt: realizing the potential of North america’s abundant Natural Gas and Oil resources
present challenges. When service costs are prohibi-tive, a customer’s contribution in aid of construction to extend service lines can further increase the cus-tomer’s first-cost burden. Consumers often make purchase decisions based on first cost, whereas the economic and carbon-related benefits accrue over the lifetime of the gas-using equipment. Prudent policy could provide better alignment of long-term economic and environmental benefits of natural gas with the short-term costs of the equipment and ser-vice extension.
gas furnace will likely require fewer Btu than an exist-ing distillate furnace due to higher efficiency of new furnaces.48
However, there are many obstacles to conversion. High appliance first cost, low population density rates, and regulatory impediments to recover costs from extending natural gas service to certain areas
48 The average oil furnace is 48% efficient, but a new natural gas furnace is currently 85% efficient. A pending DOE rule would increase this to 90% efficient.
Figure 3-20. U.S. Residential Natural Gas Demand
10
12
14
16
2000 2005 2010 2015 2020 2025 2030 2035
BILL
ION
CU
BIC
FEET
PER
DAY
YEAR
Note: For a description of cases, see “Description of Projection Cases” at the end of this chapter.
AEO2010 LOW TECHAEO2010 HIGH MACROAEO2010 HIGH SHALEAEO2011 REFERENCE CASEAEO2010 REFERENCE CASEAEO2010 NO SHALE
EIA KL BASICAEO2010 LOW MACROEIA KL NOINTL LTDALTAEO2010 HIGH TECHAGGOGMAXAGGOGMEDIAN
EIA WM BASICEIA WM NOINTL LTDALTAGGOGMIN
Figure 3-20. U.S. residential Natural Gas Demand
Generation and T&D Energy Losses shown in Figures 3-19, 3-27, and 3-35 consist of the energy used to generate electricity (i.e., to convert Btu to kWh) and transmission and distribution losses incurred in delivering the electricity to the end user. For 2010, it took on average 10,192 Btu of coal, natural gas, oil, and uranium to generate 1 kWh, which is equal to 3,412 Btu. The thermal
loss on conversion of 6,780 Btu per kWh is likely to decline as new more efficient fossil fuel generation or renewable generation is built. In addition to the thermal losses from conversion, there are also losses incurred in the transmission and distribu-tion of electricity. Based on EIA data, on average, about 6.5% of the kWh generated is lost transmit-ting and distributing electricity.
Generation and T&D Energy Losses

Chapter 3 – NatUraL GaS DeMaND 283
Figure 3-22. U.S. Residential Natural Gas Demand per Household
20
40
60
80
1970 1980 1990 2000 2010 2020 2030
THO
USA
ND
CU
BIC
FEET
PER
HO
USE
HO
LD
YEARNote: For a description of cases, see “Description of Projection Cases” at the end of this chapter.
AGGOGMAXAEO2010 LOW TECHAGGOGMEDIANAEO2010 HIGH SHALEAEO2010 REFERENCE CASE
AEO2011 REFERENCE CASEEIA KL NOINTL LTDALTAGGOGMINAEO2010 HIGH MACROAEO2010 NO SHALE
EIA WM BASICEIA KL BASICAEO2010 LOW MACROEIA WM NOINTL LTDALTAEO2010 HIGH TECH
Figure 3-22. U.S. residential Natural Gas Demand per household
Figure 3-21. U.S. Residental Natural Gas Demand Drivers
0
1.0
2.0
1970 1980 1990 2000 2010 2020 2030
IND
EX O
F 1
FOR
1970
YEAR
HOUSEHOLDSPOPULATIONRESIDENTIAL NATURAL GAS DEMANDRESIDENTIAL NATURAL GAS DEMANDPER HOUSEHOLD
2035
Source: Energy Information Administration’s AEO2010 Reference Case.
Figure 3-21. U.S. residential Natural Gas Demand Drivers

284 prUDeNt DeVeLOpMeNt: realizing the potential of North america’s abundant Natural Gas and Oil resources
have residential electric service. Historically, electric-ity demand from new electrical devices has grown faster than energy efficiency improvements for exist-ing electrical devices. Unlike natural gas demand, the range for electricity demand is narrower and generally upward.
Major drivers of residential electricity demand from highest increase to greatest decrease are:
y Increases
− High macroeconomic growth (greatest increase in demand)
− Low technology (less efficiency gains)
− High gas resources (smallest increase in demand).
y Decreases
− Low gas resources (smallest decrease in demand)
− Low macroeconomic growth
− High technology (more efficiency gains and greatest decrease demand).
Studies with a price for carbon usually have lower residential electricity demand than those that did not.
U.S. Commercial Electricity Demand
U.S. residential electricity demand for 2010 is esti-mated at 1,388 billion kWh, accounting for about 38% of U.S. total electricity demand (see Figure 3-24).49 For 2035, residential electricity demand is expected to range from 1,446 to 1,844 billion kWh, driven by customer growth (which is a function of population growth) and the introduction of new residential elec-trical devices, and offset in part by continued energy efficiency improvements for existing electrical devices (see Figures 3-25 and 3-26).50 Almost all households
49 Includes only electricity consumed by residential end users. Does not include related generation and T&D losses to deliver the electricity to the residential end user.
50 The U.S. DOE/EIA March 2011 Residential Energy Consump-tion Survey shows an increase in residential electricity use for appliances and electronics from 1.77 to 3.25 quadrillion Btu over the past three decades despite federal mandatory efficiency standards for some electrical appliances. Many electrical devices such as TVs and computers are not subject to federal efficiency standards. Some electrical equipment categories, such as general lighting, are subject to standards that are just having their first set of standards promulgated or implemented. Some standards have not been updated in years.
Figure 3-23. U.S. Residential Distillate Demand
0
1
2
3
1989 1994 1999 2004
BILL
ION
CU
BIC
FEET
PER
DAY
EQ
UIV
ALE
NT
YEAR
OTHER U.S.VERMONTRHODE ISLAND
NEW HAMPSHIREMAINENEW JERSEY
CONNECTICUTPENNSYLVANIAMASSACHUSETTS
NEW YORK
Source: Energy Information Administration.
2009
Figure 3-23. U.S. residential Distillate Demand

Chapter 3 – NatUraL GaS DeMaND 285
Figure 3-24. U.S. Residential Electricity Demand
0
1,000
2,000
2000 2005 2010 2015 2020 2025 2030 2035
BILL
ION
KIL
OW
ATT
HO
URS
YEAR
Note: For a description of cases, see “Description of Projection Cases” at the end of this chapter.
AEO2010 HIGH MACROAEO2010 LOW TECHAEO2010 HIGH SHALEAEO2010 REFERENCE CASE
AEO2010 NO SHALEEIA KL BASICAEO2010 LOW MACROEIA WM BASIC
AEO2010 HIGH TECHEIA KL NOINTL LTDALTEIA WM NOINTL LTDALT
Figure 3-24. U.S. residential electricity Demand
Figure 3-25. U.S. Residential Electricity Demand Drivers
0
1.0
2.0
3.0
4.0
1970 1980 1990 2000 2010 2020 2030
IND
EX O
F 1
FOR
1970
YEAR
RESIDENTIAL ELECTRICITY DEMANDHOUSEHOLDSPOPULATIONRESIDENTIAL ELECTRICITY DEMAND PER HOUSEHOLD
Source: Energy Information Administration’s AEO2010 Reference Case.
Figure 3-25. U.S. residential electricity Demand Drivers

286 prUDeNt DeVeLOpMeNt: realizing the potential of North america’s abundant Natural Gas and Oil resources
As discussed under “Full Fuel Cycle Analysis” later in this chapter, information on direct and indirect energy requirements and emissions would assist poli-cymakers and end-use customers in making informed choices about total energy consumption, efficiency, and emissions.
Energy efficiency improvements have weakened the link between economic and population growth and energy demand. There remains significant tech-nological potential for efficiency improvements for both natural gas and electricity to reduce long-term demand and emissions.53 Much of this potential is available from better implementation of currently available technologies and techniques (includ-ing operations and maintenance practices), while improved technology is needed to obtain further improvements. Beyond the great energy efficiency potential from implementing existing technologies
53 American Council for an Energy-Efficient Economy. “The Technical, Economic, and Achievable Potential for Energy Effi-ciency in the U.S.: A Meta-Analysis of Recent Studies,” 2004. Also, DOE/EIA National Energy Modeling System (NEMS) technology assessments.
U.S. Commercial Energy
For 2010, U.S. commercial energy demand, exclud-ing vehicles, is estimated at 19,068 trillion Btu (see Figure 3-27).51 Commercial energy demand includes not only fuel consumed on site, but indirect energy consumption consisting of:
y Natural gas transmission fuel consumed in lease (gathering), processing, and delivering natural gas to the end user, about 8.5%.52 Figure 3-27 includes only the commercial sector’s share.
y Energy used to generate electricity (i.e., to con-vert Btu to kWh) and transmission and distribu-tion losses incurred in delivering the electricity to the end user. See text box, “Generation and T&D Energy Losses,” earlier in this chapter for more detail. Figure 3-27 includes only the commercial sector’s share.
51 Renewable energy includes wood, and petroleum includes liq-uefied petroleum gases such as propane.
52 It does not include any methane leakages from production to end user, as those data are not available from the EIA.
Figure 3-26. U.S. Residential Electricity Demand per Household
0
6,000
8,000
10,000
12,000
14,000
1970 1980 1990 2000 2010 2020 2030
KILO
WAT
T H
OU
RS P
ER H
OU
SEH
OLD
Note: For a description of cases, see “Description of Projection Cases” at the end of this chapter.
AEO2010 LOW TECHAEO2010 HIGH SHALEAEO2010 HIGH MACROAEO2010 REFERENCE CASEAEO2011 REFERENCE CASE
AEO2010 NO SHALEEIA WM BASICEIA KL BASICAEO2010 LOW MACROAEO2010 HIGH TECH
EIA WM NOINTL LTDALTEIA KL NOINTL LTDALT
YEAR
Figure 3-26. U.S. residential electricity Demand per household

Chapter 3 – NatUraL GaS DeMaND 287
For 2030, commercial natural gas demand is expected to range from 7.3 to 11.5 Bcf/d, driven by economic and customer growth (which is a function of popula-tion growth) and continued decline in gas demand per customer (which is a function of energy efficiency improvements) (see Figures 3-29 and 3-30).
Major drivers of commercial natural gas demand from highest increase to greatest decrease are:
y Increases
− High macroeconomic growth (greatest increase)
− High gas resources
− Low technology (less efficiency gains and smallest increase).
y Decreases
− Low macroeconomic growth (smallest decrease)
− Low gas resources
− High technology (more efficiency gains and greatest decrease).
Studies with a price for carbon usually had lower com-mercial natural gas demand than those that did not.
and practices, significant efficiency improvements can arise from new technologies that would emerge from investment in research and development.
Since the early 1970s, growth in commercial energy demand has come from growth in the demand for elec-tricity and the generation and T&D losses incurred in providing that electricity.
More than half of the energy consumed in the United States is consumed in buildings when the energy used to generate electricity and the fuels used or lost during transmission are included.54
U.S. Commercial Natural Gas Demand
U.S. commercial natural gas demand for 2010 is estimated at 8.5 Bcf/d, accounting for about 14% of U.S. total natural gas demand (see Figure 3-28).55
54 Overview of Commercial Buildings, 2003, http://www.eia.doe.gov/emeu/cbecs/cbecs2003/overview2.html.
55 Includes only natural gas consumed by commercial end users as reported by the EIA. Does not include related natural gas transmission fuel needed to deliver the natural gas to the com-mercial end user.
Figure 3-27. U.S. Commercial Energy Consumption by Fuel
0
10,000
20,000
TRIL
LIO
N B
TU
Note: Renewable energy includes wood, and petroleum includes lique�ed gases such as propane.Source: Energy Information Administration.
1950 1955 1965 1975 1985 1995 2005 2015 2025 2035
ELECTRIC TRANSMISSION AND DISTRIBUTION ENERGY LOSSGENERATION LOSSELECTRIC RETAIL SALESNATURAL GAS TRANSMISSION FUELNATURAL GASRENEWABLE ENERGYPETROLEUMCOAL
YEAR
Figure 3-27. U.S. Commercial energy Consumption by Fuel

288 prUDeNt DeVeLOpMeNt: realizing the potential of North america’s abundant Natural Gas and Oil resources
Figure 3-29. U.S. Commercial Natural Gas Demand Drivers
0
0.4
0.8
1.2
1.6
2.0
1970 1980 1990 2000 2010 2020 2030
IND
EX O
F 1
FOR
1970
YEAR
COMMERCIAL NATURAL GAS DEMANDCOMMERCIAL NATURAL GAS DEMAND PER PERSONPOPULATION
Source: Energy Information Administration’s AEO2010 Reference Case.
Figure 3-29. U.S. Commercial Natural Gas Demand Drivers
Figure 3-28. U.S. Commercial Natural Gas Demand
0
6
10
2000 2005 2010 2015 2020 2025 2030 2035
BILL
ION
CU
BIC
FEET
PER
DAY
YEAR
Note: For a description of cases, see “Description of Projection Cases” at the end of this chapter.
AGGOGMAXAEO2010 HIGH MACROAEO2010 HIGH SHALEAEO2010 REFERENCE CASEAEO2010 REFERENCE CASE
AEO2010 LOW TECHAEO2010 LOW MACROEIA KL BASICAEO2010 NO SHALEAEO2010 HIGH TECH
AGGOGMEDIANEIA KL NOINTL LTDALTEIA EIA WM BASICEIA WM NOINTL LTDALTAGGOGMIN
Figure 3-28. U.S. Commercial Natural Gas Demand

Chapter 3 – NatUraL GaS DeMaND 289
decisions based on first-cost, whereas the economic and carbon-related benefits accrue over the lifetime of the gas-using equipment. Prudent policy could provide better alignment of long-term economic and environmental benefits of natural gas with the short-term costs of the equipment and service extension.
An example of a required expansion to allow natural gas to replace fuel oil is the city of New York’s program that requires the conversion of 0.4 Bcf/day (average day, or 0.8 Bcf/day peak day) equivalent of fuel oil demand to low emission fuels such as natural gas. This will require a substantial expansion of pipeline capac-ity into Manhattan. The conversion program follows from an analysis of the health advantages of reduc-ing use of heavy fuel oils in the commercial sector by the Environmental Defense Fund. Texas Eastern Gas Transmission has proposed a 0.8 Bcf/day expansion to facilitate bringing gas supply from Pennsylvania to Manhattan.
U.S. Commercial Electricity Demand
U.S. commercial electricity demand for 2010 is estimated at 1,355 billion kWh, accounting for about
U.S. Commercial Distillate Demand
U.S. Northeast commercial distillate demand of 0.5 Bcf/d equivalent accounts for 47% of U.S. com-mercial distillate demand (see Figure 3-31). Com-mercial distillate demand is less concentrated in the Northeast than residential distillate demand, as a substantial portion of commercial distillate demand is for backup generation or commercial combined heat and power (CHP) for large buildings. This distillate demand represents an area where conversion from an oil furnace to a natural gas furnace can help increase energy efficiency, reduce greenhouse gas emissions, and reduce oil imports. A new natural gas furnace will likely require fewer Btu than an existing distillate fur-nace due to higher efficiency of new furnaces.
However, there are many obstacles to conversion. High appliance first cost, low population density rates, and regulatory impediments to recover costs from extending natural gas service to certain areas present challenges. When service costs are prohibitive, a cus-tomer’s contribution in aid of construction to extend service lines can further increase the customer’s first-cost burden. Consumers often make purchase
Figure 3-30. U.S. Commercial Natural Gas Demand per Person
0
6
12
1970 1980 1990 2000 2010 2020 2030
CUBI
C FE
ET P
ER P
ERSO
N
YEAR
Note: For a description of cases, see “Description of Projection Cases” at the end of this chapter.
AEO2010 LOW MACROAEO2010 HIGH SHALEAEO2010 REFERENCE CASEAEO2011 REFERENCE CASEAEO2010 LOW TECH
EIA KL BASICAEO2010 NO SHALEAEO2010 HIGH TECHAEO2010 HIGH MACROEIA KL NOINTL LTDALT
EIA WM BASICEIA WM NOINTL LTDALT
AGGOGMEDIANAGGOGMAX
AGGOGMIN
Figure 3-30. U.S. Commercial Natural Gas Demand per person

290 prUDeNt DeVeLOpMeNt: realizing the potential of North america’s abundant Natural Gas and Oil resources
Major drivers of commercial electricity demand from highest increase to greatest decrease are:
y Increases
− Low technology (less efficiency gains and greatest increase)
− High macroeconomic growth
− High gas resources (smallest increase).
y Decreases
− Low gas resources (smallest decrease)
− Low macroeconomic growth
− High technology (more efficiency gains and greatest decrease).
Studies with a price for carbon usually had lower commercial electricity demand than those that did not.
u.S. INDuSTrIaL NaTuraL GaS aND ELECTrICITy DEmaND
For 2010, U.S. industrial energy by fuel is fairly balanced between natural gas, electricity,
38% of U.S. total electricity demand.56 For 2035, com-mercial electricity demand is expected to range from 1,586 to 2,062 billion kWh, driven by economic and customer growth (which is a function of population growth) and the introduction of new commercial elec-tricity devices, and offset in part by continued energy efficiency improvements for existing electrical devices (see Figures 3-32, 3-33, and 3-34).57 Historically, new uses of electricity have grown faster than energy effi-ciency improvements for existing devices.58
56 Includes only electricity consumed by commercial end users. Does not include related generation and T&D losses to deliver the electricity to the commercial end user.
57 Savings taken or based on calculations by the American Coun-cil for an Energy-Efficient Economy. See especially John A. “Skip” Laitner, et al., The American Power Act and Enhanced Energy Efficiency Provisions: Impacts on the U.S. Economy, ACEEE Report E103, June 2010.
58 For the first four Commercial Buildings Energy Consump-tion Surveys [1979–1989], electricity intensity remained in a narrow range from 42 to 45 thousand Btu per square foot. In 1992, the electricity estimate dropped to 39,000 and then began a steady increase to 51,000 in 2003 as demand for more services that use electricity increased (http://www.eia.gov/emeu/cbecs/cbecs2003/overview2.html).
Figure 3-31. U.S. Commercial Distillate Demand
0
0.4
0.8
1.2
1.6
1989 1994 1999 2004 2009
BILL
ION
CU
BIC
FEET
PER
DAY
EQ
UIV
ALE
NT
YEAR
OTHER U.S.VERMONT
RHODE ISLANDNEW HAMPSHIRE
NEW JERSEYCONNECTICUT
MASSACHUSETTSMAINE
PENNSYLVANIANEW YORK
Source: Energy Information Administration.
Figure 3-31. U.S. Commercial Distillate Demand

Chapter 3 – NatUraL GaS DeMaND 291
Figure 3-32. U.S. Commercial Electricity Demand
0
1,000
2,000
2000 2010 2020 2030
BILL
ION
KIL
OW
ATT
HO
URS
YEAR
Note: For a description of cases, see “Description of Projection Cases” at the end of this chapter.
AEO2010 LOW TECHAEO2010 HIGH MACROAEO2010 HIGH SHALEAEO2010 REFERENCE CASEAEO2011 REFERENCE CASEAEO2010 NO SHALE
AEO2010 LOW MACROEIA KL BASICEIA WM BASICAEO2010 HIGH TECHEIA WM NOINTL LTDALTEIA KL NOINTL LTDALT
Figure 3-32. U.S. Commercial electricity Demand
Figure 3-33. U.S. Commercial Electricity Demand Drivers
0
2
4
6
1970 1980 1990 2000 2010 2020 2030
IND
EX O
F 1
FOR
1970
YEAR
COMMERCIAL ELECTRICITY DEMAND COMMERCIAL ELECTRICITY DEMAND PER PERSONPOPULATION
Source: Energy Information Administration’s AEO2010 Reference Case.
Figure 3-33. U.S. Commercial electricity Demand Drivers

292 prUDeNt DeVeLOpMeNt: realizing the potential of North america’s abundant Natural Gas and Oil resources
Industrial Natural Gas Demand
U.S. industrial natural gas demand for 2010 is esti-mated at 17.9 Bcf/d, accounting for about 29% of U.S. total natural gas consumption.59 For 2030, indus-trial natural gas demand is expected to range from 13.4 to 22.2 Bcf/d, driven by economic growth and offset by continued improvement in energy efficiency (see Figures 3-37 and 3-38).
Major drivers of industrial natural gas demand from highest increase to greatest decrease are:
y Increases
− High macroeconomic growth (greatest increase in demand)
− High gas resources
− High technology (higher growth in industrial activity that requires more energy and sometimes a shift to higher value and more energy-intensive products as well as higher efficiency gains)
59 Includes only natural gas consumed by industrial end users. Does not include related natural gas transmission fuel needed to deliver the natural gas to the industrial end user.
and petroleum (see Figure 3-35). About 54% of industrial energy is used for heat, light, and power, including purchased electricity and its associated generation and T&D losses (see Figure 3-36). Fuel uses account for another 32% of industrial energy, and feedstock accounts for 14%. The 14% feedstock component breaks down into petroleum, 6%; natural gas, 2%; and liquefied petro-leum gases (LPGs), 6%. Industrial energy used does not include fuel for vehicles. As with the residential and commercial sectors, there are opportunities to improve energy efficiency using existing technolo-gies and practices as well as for new processes and technologies.
Superficially, generation and transmission and distribution losses for the industrial sector appear significantly lower than for the residential and com-mercial sectors. This is because the industrial sec-tor generates a substantial portion of its electricity requirements on-site, meaning the thermal losses from converting Btu to kWh is part of the energy consumed for heat, light, and power. Furthermore, on-site generation does not have transmission and distribution losses.
Figure 3-34. U.S. Commercial Electricty Demand per Person
0
2,000
3,000
4,000
5,000
1970 1980 1990 2000 2010 2020 2030
KILO
WAT
T H
OU
RS P
ER P
ERSO
N
YEARNote: For a description of cases, see “Description of Projection Cases” at the end of this chapter.
AEO2010 LOW TECHAEO2010 LOW MACROAEO2010 HIGH SHALEAEO2010 REFERENCE CASEAEO2011 REFERENCE CASEAEO2010 NO SHALE
EIA WM BASICAEO2010 HIGH MACROEIA KL BASICEIA WM NOINTL LTDALTAEO2010 HIGH TECHEIA KL NOINTL LTDALT
Figure 3-34. U.S. Commercial electricty Demand per person

Chapter 3 – NatUraL GaS DeMaND 293
− Low technology (smallest increase in demand) (slower growth in industrial activity that requires less energy as well as less efficiency gains).
y Decreases
− Low gas resources (smallest decrease in demand)
− Low macroeconomic growth (greatest decrease in demand).
Typically, the studies reviewed that had a price for carbon had lower industrial natural gas demand than those that did not.
When the industrial sector uses natural gas as a feedstock or in the direct production of products, the value is leveraged over and over, resulting in a strong value-added proposition for the economy. U.S. firms rely on natural gas and oil-derived chemi-cals as building blocks for the production of electron-ics (including computers and cell phones), plastics, medicines (and medical equipment), cleaning prod-ucts, fertilizers, building materials, adhesives, and clothing. Consequently, a strong industrial sector is critical to a healthy economy. In a global business
Figure 3-35. U.S. Industrial Energy Demand
0
20
40
2007 2010 2015 2020 2025 2030 2035
QU
AD
RILL
ION
BTU
YEAR
ELECTRIC TRANSMISSION AND DISTRIBUTION ENERGY LOSS PURCHASED ELECTRICITY NATURAL GAS – OTHER NATURAL GAS FEEDSTOCK LIQUEFIED PETROLEUM GASES – HEAT AND POWER BIOFUELS HEAT AND COPRODUCTS PETROLEUM FEEDSTOCK
GENERATION LOSS NATURAL GAS TRANSMISSION NATURAL GAS HEAT AND POWER LIQUEFIED PETROLEUM GASES – FEEDSTOCKS RENEWABLES PETROLEUM – OTHER COAL
Source: Energy Information Administration’s AEO2010 Reference Case.
Figure 3-35. U.S. Industrial energy Demand
Figure 3-36. U.S. Industrial Energy by Use – 2010 Estimate
HEAT, LIGHT, AND POWER
54%
PETROLEUM FEEDSTOCK
6%
NATURAL GAS FEEDSTOCK
2%
LIQUEFIED PETROLEUM GASES FEEDSTOCK
6%
FUEL
32%
Source: Energy Information Administration’s AEO2010 Reference Case.
Figure 3-36. U.S. Industrial energy by Use – 2010 estimate

294 prUDeNt DeVeLOpMeNt: realizing the potential of North america’s abundant Natural Gas and Oil resources
Figure 3-38. U.S. Industrial Natural Gas Demand per GDP
0
0.4
0.8
2000 2005 2010 2015 2020 2025 2030 2035
BILL
ION
CU
BIC
FEET
PER
BIL
LIO
N D
OLL
ARS
OF
GD
P
YEAR
Note: For a description of cases, see “Description of Projection Cases” at the end of this chapter.
AGGOGMAXAGGOGMEDIANAEO2010 HIGH SHALEAEO2010 LOW MACROAEO2010 HIGH TECH
AEO2010 LOW TECHEIA WM BASICAEO2010 REFERENCE CASE AEO2011 REFERENCE CASE AEO2010 HIGH MACRO
EIA KL BASICAEO2010 NO SHALEEIA KL NOINTL LTDALTAGGOGMINEIA WM NOINTL LTDALT
Figure 3-38. U.S. Industrial Natural Gas Demand per Dollar of Gross Domestic product ($GDp)
Figure 3-37. U.S. Industrial Natural Gas Demand
0
15
25
2000 2005 2010 2015 2020 2025 2030 2035
BILL
ION
CU
BIC
FEET
PER
DAY
YEARNote: For a description of cases, see “Description of Projection Cases” at the end of this chapter.
AGGOGMAXAEO2010 HIGH MACROAEO2010 HIGH SHALEAEO2010 HIGH TECHAGGOGMEDIAN
AEO2010 LOW TECHAEO2010 REFERENCE CASE AEO2011 REFERENCE CASE EIA KL BASICAEO2010 NO SHALE
EIA KL NOINTL LTDALTEIA WM BASICAEO2010 LOW MACROAGGOGMINEIA WM NOINTL LTDALT
Figure 3-37. U.S. Industrial Natural Gas Demand

Chapter 3 – NatUraL GaS DeMaND 295
MtCO2e.60 Despite these significant gains from recy-cling, there are still significant quantities of these products that are not recycled each year.
Generally, when natural gas prices are low and decreasing, U.S. industrial natural gas demand is high and increasing. Conversely, when natu-ral gas prices are high and increasing, U.S. indus-trial natural gas demand is low and decreasing (see Figure 3-39). The availability of abundant natural gas resources at a low cost led to a higher oil to natu-ral gas price ratio, even before the recent unrest in the Middle East. This has led to an improvement in the international competitiveness of industries that use natural gas and natural gas liquids (NGLs) as a feedstock relative to foreign competitors that use oil-based naphtha as a feedstock or natural gas priced as a function of oil prices. To accommodate increasing levels of ethane production related to the growth in natural gas production, increased investment by the chemical industry will be required. The American Chemistry Council recently estimated that a 25%
60 U.S. EPA, “Source Environmental Benefits Calculator,” 2009 Data.
environment where companies have the ability to move capital around the world, a dependable, com-petitive supply of natural gas is critical to creating investment and jobs. Therefore, attention must be paid to ensure energy is used efficiently and there is adequate energy supply at reasonable cost to meet the growth demands of the industrial sector.
Recycling of energy-intensive products such as paper, steel, aluminum, glass, solvents, asphalt, con-crete, and plastic is a very powerful tool for reduc-ing energy consumption, greenhouse gas emissions, pollution, and wastes. Much energy is embodied in the material or expended in making the material, through the energy needed to extract, process, and distribute them. This includes water, which requires significant energy for collection, treatment, and dis-tribution. Further, some organic materials (such as manures from animal agriculture) can sometimes substitute for energy-intense (and often natural gas-based) synthetic fertilizers or energy can be recov-ered through direct combustion or digestion to bio-gas. In 2009, the estimated avoided greenhouse gas emissions from recycling totaled over 142.2 million
Figure 3-39. U.S. Natural Gas Industrial Demand versus Wellhead Price
0
2
4
6
8
0
4
8
12
1949 1959 1969 1979 1989 1999 2009
2005
DO
LLA
RS P
ER T
HO
USA
ND
CU
BIC
FEET
TRIL
LIO
N C
UBI
C FE
ET
YEAR
INDUSTRIAL DEMAND
WELLHEAD PRICE
Source: Energy Information Administration.
MARKET PENETRATION DEREGULATION PRE-SHALE FUEL USE ACT
Figure 3-39. U.S. Natural Gas Industrial Demand versus Wellhead price

296 prUDeNt DeVeLOpMeNt: realizing the potential of North america’s abundant Natural Gas and Oil resources
Industrial Electricity Demand
The U.S. industrial sector’s purchased electricity demand for 2010 is estimated at 868 billion kWh, accounting for about 24% of U.S. total electricity demand (see Figure 3-40).63 For 2035, industrial electricity demand is expected to range from 842 to 1,190 billion kWh, driven by economic growth and offset by continued energy efficiency improvements for existing applications and new industrial uses for electricity (see Figure 3-41). Historically, new uses for electricity have grown faster than energy effi-ciency improvements for existing uses.
Major drivers of industrial electricity demand from highest increase to greatest decrease are:
y Increases
− High macroeconomic growth (greatest increase in demand)
63 Includes only electricity consumed by industrial end users. Does not include related generation and T&D losses to deliver the electricity to the industrial end user.
increase in ethane supply could result in $16 billion in capital investment by the chemical industry. This would generate 17,000 new jobs in the U.S. chemical industry and 395,000 additional jobs outside the chemical industry and increase U.S. economic output by $132 billion.61
Outside of the chemical industry, other energy-intensive manufacturers are also increasing produc-tion or expanding. Recently, several ammonia manu-facturers have announced plans to restart idled units in the United States. PCS Nitrogen, Inc. will restart its ammonia plant in Geismar, Louisiana, and Pan-dora Methanol has begun the process of restarting its ammonia plant in Beaumont, Texas. Addition-ally, Nucor Corporation announced the construction of a $750 million iron making facility in Louisiana that will use direct reduction technology.62
61 American Chemistry Council, Shale Gas and New Petrochemicals Investment: Benefits for the Economy, Jobs, and US Manufactur-ing, March 2011.
62 See Nucor press release: http://www.nucor.com/investor/news/releases/?rid=1471666.
Figure 3-40. U.S. Industrial Electricity Demand
0
0.6
0.8
1.0
1.2
2000 2005 2010 2015 2020 2025 2030 2035
BILL
ION
MEG
AWAT
T H
OU
RS
YEAR
Note: For a description of cases, see “Description of Projection Cases” at the end of this chapter.
AEO2010 HIGH MACROAEO2010 HIGH TECHAEO2010 HIGH SHALEAEO2010 REFERENCE CASE
AEO2011 REFERENCE CASE AEO2010 NO SHALEAEO2010 LOW TECHEIA KL BASIC
EIA WM BASICAEO2010 LOW MACROEIA KL NOINTL LTDALTEIA WM NOINTL LTDALT
Figure 3-40. U.S. Industrial electricity Demand

Chapter 3 – NatUraL GaS DeMaND 297
productivity of production to reduce the energy required per added dollar of value.
Studies with a price on carbon usually had lower industrial electricity demand than those that did not. Energy-intensive industries in Europe have expressed concerns that expansion of the European Union Emissions Trading System should be done as part of a global framework; otherwise, their interna-tional competitiveness could be adversely affected.65
The industrial sector spends about five times as much on electricity as it does directly on natural gas, making electricity pricing very important to indus-try.66 Wholesale electric prices are very dependent on natural gas prices, making industrial activity highly sensitive to the natural gas market when both direct and indirect effects are considered. High, volatile natural gas prices from 1999 through 2008 played a
65 European Alliance of Energy Intensive Industries press release, May 6, 2010.
66 Calculated from EIA data on Industrial energy consumption and prices for natural gas and electricity for 2010, Short-Term Energy Outlook, March 2011.
− High gas resources
− High technology (higher growth in industrial activity that requires more energy and some-times a shift to higher value and more energy-intensive products as well as higher efficiency gains) (smallest increase in demand).
y Decreases
− Low gas resources (smallest decrease in demand)
− Low technology (slower growth in industrial activity that requires less energy)
− Low macroeconomic growth (greatest decrease in demand).
Unlike the residential and commercial sectors, the High Technology Case results in an increase in electricity demand, not a decrease. A higher pace of technology change spurs an increase in economic activity and a shift towards higher value, more energy-intensive products.64 However, greater tech-nological change can also increase the efficiency and
64 DOE/EIA AEO2010, High Technology Case compared to the Reference Case and Low Technology Case.
Figure 3-41. U.S. Industrial Electricity Demand per GDP
0
0.05
0.10
0.15
2000 2005 2010 2015 2020 2025 2030 2035
KILO
WA
TT H
OU
R PE
R D
OLL
AR
OF
GD
P
YEAR
Note: For a description of cases, see “Description of Projection Cases” at the end of this chapter.
AEO2010 HIGH TECHAEO2010 HIGH MACROAEO2010 HIGH SHALEAEO2010 REFERENCE CASE
AEO2011 REFERENCE CASE AEO2010 NO SHALEAEO2010 LOW MACROAEO2010 LOW TECH
EIA WM BASICEIA KL BASICEIA WM NOINTL LTDALTEIA KL NOINTL LTDALT
Figure 3-41. U.S. Industrial electricity Demand per Dollar of Gross Domestic product ($GDp)

298 prUDeNt DeVeLOpMeNt: realizing the potential of North america’s abundant Natural Gas and Oil resources
ing), processing plant, pipeline, and distribution facil-ities that reliably and efficiently delivers significant quantities of natural gas from the wellhead to end users throughout the entire continent. This elabo-rate system is the culmination of decades of invest-ment by countless participants and combines legacy components with state-of-the-art improvements (Figure 3-42).
Expansion of natural gas lease, plant, pipeline, and distribution infrastructure generally depends upon growth in the natural gas market or development of new sources of supply. Still, even in a flat-to-declining market, additional infrastructure assets will likely be required to accommodate natural shifts in the loca-tions of supply and demand. Most of the natural gas infrastructure capacity added in the last 30 years has been to deliver new supply to existing load or to load that has shifted regionally.
It is important to note that each lease, plant, pipe-line, and distribution supply and delivery system is unique. Consequently, a “one-size-fits-all” approach to seeking efficiency improvements will not work. This is because each system’s age, geographic location,
significant role in the relatively flat growth in indus-trial electricity during the 1999–2008 period as investment by industry in the United States dropped.
Industry has generally proven itself to be an efficient consumer of natural gas, responding to high prices by investing in new technology and shutting down assets that no longer compete. However, there are still many opportunities to improve energy efficiency. Some of the more promising technologies include CHP, low temperature heat recovery, use of oxygen to supple-ment or replace combustion air, biomass integrated gasifier combined cycle, and municipal solid waste used to fuel generation or CHP. Further investment in these and other technologies is needed for industry to thrive well into the future. The industrial sector has and is expected to continue to improve its effi-ciency in using electricity across all outlooks.
u.S. TraNSmISSION NaTuraL GaS DEmaND
The North American Natural Gas Transmission Sys-tem consists of an intricate network of lease (gather-
Note: LNG = lique�ed natural gas.Source: Energy Information Administration, O�ce of Oil and Gas.
LARGER DIAMETER PIPELINE
SMALLER DIAMETER PIPELINE
PRODUCERS(GATHERING)
GASPLANT
MARKETCENTERS/HUBS & INTERCONNECTS
PIPELINECOMPANY
LOCALDISTRIBUTION
COMPANY
PIPELINECOMPANY
STORAGE
STORAGE
IMPORTS END-USERCATEGORIESTRUCKED
RESIDENTIAL
COMMERCIAL
INDUSTRIAL
ELECTRICPOWER
GENERATORS
Figure 3-42. Natural Gas Transmission System
LNG
Figure 3-42. Natural Gas transmission System

Chapter 3 – NatUraL GaS DeMaND 299
Figures 3-43 and 3-44). As discussed below, these percentages have varied little over time and are not expected to do so in the future. CO2 emissions from this segment of the industry are tied to throughput.
It is reasonable to assume that natural gas con-sumption for transmission (lease and plant fuel, and pipeline and distribution fuel) for the United States will stay within the historical range of about 7.1% to 9.5% of throughput for the foresee-able future and to range between 4.1 and 6.1 Bcf/d through 2035.
Other Transmission Issues
The natural gas industry’s reliance on electricity is increasing. The use by pipelines of electric com-pression to meet air quality requirements in some areas make the need for reliable electric service an important component of reliable natural gas service. Another example is the dependence of many gas pro-cessing plants on electric service, as demonstrated by gas processing plants being offline in February of 2011 in the Southwest and in the aftermath of
original design, modifications, and shifting supply and transmission patterns are all distinct. Therefore, an improvement may be cost effective in one case, but not be feasible or economical in another case. Due to this reality, the greatest opportunity for maximizing either economics or efficiency is in the initial design and construction phase of a major facility. For exam-ple, new gas processing plants tend to be much more efficient than older legacy gas processing facilities. Though covered in the Other Transmission Issues portion of this study, legislative mandated safety enhancements will impact costs, particularly in high consequence populated areas.
U.S. Transmission Natural Gas Demand
Today, lease and plant fuel consumption for the United States is about 3.5 Bcf/d, or 6%, of dry gas production, while pipeline and distribution fuel con-sumption is about 1.7 Bcf/d, or 3%, of natural gas demand. Total natural gas transmission fuel (lease and plant, pipeline and distribution) is about 5.2 Bcf/d, or 8.5%, of throughput (total natural gas demand) (see
Figure 3-43. U.S. Total Natural Gas Transmission – Percentage of Throughput
0
6
8
10
2000 2005 2010 2015 2020 2025 2030 2035
Note: For a description of cases, see “Description of Projection Cases” at the end of this chapter.
PERC
ENT
YEAR
EIA WM BASICEIA WM NOINTL LTDALTAEO2010 HIGH TECHAEO2010 LOW MACRO
EIA KL BASICAEO2010 REFERENCE CASE AEO2011 REFERENCE CASE AEO2010 HIGH SHALE
AEO2010 LOW TECHAEO2010 HIGH MACROAEO2010 NO SHALEEIA KL NOINTL LTDALT
Figure 3-43. U.S. total Natural Gas transmission – percentage of throughput

300 prUDeNt DeVeLOpMeNt: realizing the potential of North america’s abundant Natural Gas and Oil resources
fuels such as coal, oil, and natural gas; energy losses in thermal combustion in power-generation plants; and energy losses in transmission and distribu-tion to homes, commercial buildings, and other end users.68, 69 An FFC analysis could be used in making and implementing certain energy-related policies at different levels of government (and by legislative and executive branch entities) to provide policymak-ers and end-use consumers with more complete and robust information on energy consumption and
emissions including CO2 emissions.
Figure 3-45 is an illustrative example of the applica-tion of an FFC analysis to gas and electric water heat-ers. For the natural gas value chain, the FFC analysis includes natural gas (methane) vented during produc-tion as well as transmission fuel used in gathering,
68 National Research Council, Review of Site (Point-of-use) and Full-Fuel-Cycle Measurement Approaches to DOE/EERE Building Appliance Energy-Efficiency Standards, May 2009.
69 DOE is also proposing to include vented gas. (Docket No [EERE-2010-BT-NO-0028A] Statement of Policy for Adopting Full-Fuel-Cycle Analyses into Energy Conservation Standards Program).
hurricanes Katrina and Rita in 2005, and Ike and Gustav in 2008. If natural gas cannot be processed, pipelines may not be able to accept gas for delivery if acceptance would adversely affect their operations.
Some parts of the transmission network are fairly old, especially distribution systems, and need to be adequately monitored and inspected to ensure reli-ability and to avoid incidents like the explosion at San Bruno.67 To the extent additional costs incurred to ensure integrity of the transmission network are passed along to end users, the resultant higher deliv-ered natural gas prices could, through the price elas-ticity effect, slightly reduce natural gas demand.
FuLL FuEL CyCLE aNaLySISA full fuel cycle (FFC) analysis measures energy
consumption including – in addition to site energy use – the energy consumed or vented (added to National Academy of Sciences definition) in the extraction, processing, and transport of primary
67 See Chapter Two, “Operations and Environment,” for more details on the San Bruno incident.
Figure 3-44. U.S. Total Natural Gas Transmission Fuel
0
4
8
2000 2005 2010 2015 2020 2025 2030 2035
BILL
ION
CU
BIC
FEET
PER
DAY
YEARNote: For a description of cases, see “Description of Projection Cases” at the end of this chapter.
AEO2010 HIGH MACRO AEO2010 HIGH SHALE AEO2010 HIGH TECH AEO2010 LOW MACRO
AEO2010 LOW TECH AEO2010 NO SHALE AEO2010 REFERENCE CASEAEO2011 REFERENCE CASE
EIA KL BASICEIA KL NOINTL LTDALT EIA WM BASICEIA WM NOINTL LTDALT
Figure 3-44. U.S. total Natural Gas transmission Fuel

Chapter 3 – NatUraL GaS DeMaND 301
More than half of energy consumed in the United States is consumed in buildings when one includes the energy used to generate electricity and the fuel used or lost during transmission (delivery and distribution) – i.e., an FFC analysis. Historically, energy consumption was reported by site. For the purposes of analyzing energy choices, the FFC meth-odology more comprehensively assesses energy con-sumption, energy efficiency, and emissions.
The fuel mix used to generate electricity varies by region and will change over time (seasonally, daily, and even hourly) (see Figure 3-46). Over longer periods, the generation mix shifts as new plants are built and old ones retired. This complicates devel-opment of a national FFC analysis for electrical applications.71 So comparing the FFC of an appli-ance with a 20-year life purchased in 2010 is subject to some uncertainty, as changes in the future mix of fuels and technologies used in generation will change.
71 The DOE generally is limited by statute to developing only a national standard.
processing, pipeline, and distribution.70 The electric value chain includes methane vented during mining, losses on converting Btu to kWh, and electric trans-mission and distribution losses. There are four vari-ants on the electric water heater based on the mix of generation used:
y Electricity generated by an NGCC plant
y Electricity generated by a coal plant
y Electricity generation based on average U.S. 2010 generation mix
y Electricity generation based on U.S. 2010 generation adjusted to increase renewables from 9.5% of total generation to 20.0%. If it takes 10 years to achieve such an increase, then this case reflects a FFC analy-sis for the midpoint of a 20-year asset.
The FFC analysis shows that a natural gas water heater uses less total energy and emits less CO2 than an electric water heater based on the four generation cases used.
70 Production data on natural gas- and coal-related methane emissions provided by the Emissions & Carbon Subgroup.
Figure 3-45. Illustrative Full Fuel Cycle for Water Heaters
0
200
400
600
0
2
4
NATURAL GASWATER HEATER
ELECTRIC WATERHEATER – COAL
ELECTRIC WATERHEATER – NATURAL
GAS COMBINEDCYCLE
ELECTRIC WATER HEATER – 2010
AVERAGE U.S.GENERATION
ELECTRIC WATERHEATER – 2010AVERAGE U.S.GENERATION
ADJUSTED TO 20%RENEWABLES
TOTA
L CO
2 EQ
UIV
ALE
NT
EMIS
SIO
NS
(PO
UN
DS)
TOTA
L R
EQU
IRED
INPU
T (M
ILLI
ON
BTU
)
NATURAL GAS TRANSMISSION FUELGENERATION FUEL ELECTRIC T&D LOSSES WATER HEATER EFFICIENCY LOSS PER ACEEE* MMBTU OUTPUT
CO2 EMISSIONS FOR REQUIRED INPUT
*Water e�ciency loss includes Btu and CO2 content of fuel plus upstream methane emissions. ACEEE = American Council for an Energy E�cient Economy.
Figure 3-45. Illustrative Full Fuel Cycle for Water heaters

302 prUDeNt DeVeLOpMeNt: realizing the potential of North america’s abundant Natural Gas and Oil resources
Figure 3-46. U. S. Generation by Fuel, by North American Electric Reliability Corporation (NERC) Subregion
PERC
ENT
020
4060
8010
0
TEXA
S RE
GIO
NA
L EN
TITY
FLO
RID
A R
ELIA
BILI
TY C
OO
RDIN
ATIN
G C
OU
NCI
L
MID
WES
T RE
LIA
BILI
TY C
OU
NCI
L/EA
ST
MID
WES
T RE
LIA
BILI
TY C
OU
NCI
L/W
EST
NO
RTH
EAST
NEW
YO
RK C
ITY-
WES
TCH
ESTE
R
LON
G IS
LAN
D
UPS
TATE
NEW
YO
RK
RELI
ABI
LITY
FIR
ST C
ORP
ORA
TIO
N/E
AST
RELI
ABI
LITY
FIR
ST C
ORP
ORA
TIO
N/M
ICH
IGA
N
RELI
ABI
LITY
FIR
ST C
ORP
ORA
TIO
N/W
EST
SERC
REL
IABI
LITY
CO
RPO
RATI
ON
/DEL
TA
SERC
REL
IABI
LITY
CO
RPO
RATI
ON
/GAT
EWAY
SERC
REL
IABI
LITY
CO
RPO
RATI
ON
/SO
UTH
EAST
ERN
SERC
REL
IABI
LITY
CO
RPO
RATI
ON
/CEN
TRA
L
VIRG
INIA
-CA
ROLI
NA
SOU
THW
EST
POW
ER P
OO
L/N
ORT
H
SOU
THW
EST
POW
ER P
OO
L/SO
UTH
SOU
THW
EST
CALI
FORN
IA
NO
RTH
WES
T PO
WER
PO
OL
ARE
A
ROCK
IES
REN
EWA
BLES
PUM
PED
STO
RAG
E/O
THER
NU
CLEA
RN
ATU
RAL
GA
S PE
TRO
LEU
MCO
AL
Sour
ce:
Ener
gy In
form
atio
n A
dmin
istr
atio
n.
Figu
re 3
-46.
U.S
. Gen
erat
ion
by F
uel,
by N
orth
am
eric
an e
lect
ric r
elia
bilit
y Co
rpor
atio
n (N
erC
) Sub
regi
on

Chapter 3 – NatUraL GaS DeMaND 303
pipeline and distribution fuel is included in the com-mercial segment whereas in the United States, it is included in pipeline and distribution fuel compo-nent of transmission.
Canadian commercial electricity demand is expected to grow as energy efficiency gains are more than offset by increasing commercial floor space, new electrical devices, and growth in air conditioning (see Figure 3-51). A general trend in the Canadian econ-omy towards an expanding service sector share rela-tive to the manufacturing sector is also driving this growth.
Canadian Industrial Natural Gas and Electricity Demand
Natural gas accounts for about 40% of the indus-trial sector fuel, and electricity accounts for about 15%. Industrial energy demand accounts for almost half of Canada’s total energy use. Industrial use also includes feedstock energy used by the chemical industry and off-road transportation. The majority of energy use in the industrial sector comes from six energy-intensive industries that are highly depen-dent on export markets. Therefore, the general state of the world economy is a major influence on Canadian energy consumption. The NEB is fore-casting slower growth between 2008 and 2020 than seen historically. The principal reasons for this are increasing global competition in commodity markets and a higher Canadian dollar.
Given the above, the NEB believes that industrial energy demand will increase at an average rate of 0.8% annually between now and 2020. The natural gas share is expected to remain near 40% of the energy mix. No major fuel switching trend is seen in the next 10 years (see Figure 3-52).
The proprietary aggregated oil and gas com-pany outlooks for Canadian industrial demand show a wide range compared to NEB outlooks (see Figure 3-53). The difference may be caused by where one classifies natural gas demand that is related to oil sands development.
The NEB outlooks for industrial electricity demand are relatively flat, reflecting a slowing in the GDP growth rate and increasing value of the Canadian dollar (see Figure 3-54). The recent recession caused a notable dip in industrial electricity demand.
CaNaDIaN NaTuraL GaS aND ELECTrICITy DEmaND
For 2010, Canadian natural gas and electricity were expected to provide 16% and 10%, respectively, of Canadian total end-use demand.72
Canadian Natural Gas Demand
Canadian natural gas demand is expected to grow from about 9.1 Bcf/d in 2010 to between 9.8 and 15.2 Bcf/d in 2030. Most of this demand growth is expected to come from consumption related to oil sands development, not power generation, as Can-ada has a large hydropower base, but limited coal generation capacity. This limits the opportunity for natural gas to displace coal-fired generation (see Figure 3-47).
Canadian Residential Natural Gas and Electricity Demand
As in the United States, residential natural gas and electricity demand increases are a function of popu-lation growth (somewhat higher in Canada) and the introduction of new residential electrical devices, offset in part by energy efficiency improvements. Canadian residential natural gas demand is expected to be relatively flat (see Figure 3-48). Canadian resi-dential electricity demand is expected to grow as electrical energy efficiency gains are more than off-set by the introduction of new electric devices (see Figure 3-49).
Canadian Commercial Natural Gas and Electricity Demand
As in the United States, commercial natural gas and electricity demand increases are a function of population and economic growth (somewhat higher in Canada), energy efficiency gains, and the intro-duction of new electrical devices. Canadian com-mercial natural gas demand is expected to be rela-tively flat (see Figure 3-50). The difference between the National Energy Board of Canada (NEB) out-looks and the proprietary outlooks is most likely due to how demand is classified in Canada. In Canada,
72 National Energy Board (Canada) 2009 Reference Case Sce-nario: Canadian Energy Demand and Supply to 2020.

304 prUDeNt DeVeLOpMeNt: realizing the potential of North america’s abundant Natural Gas and Oil resources
1.0
2.0
1.5
2.5
2000 2005 2010 2015 2020 2025 2030
BILL
ION
CU
BIC
FEET
PER
DAY
YEAR
Notes: For a description of cases, see “Description of Projection Cases” at the end of this chapter. NEB = National Energy Board of Canada.
Figure 3-48. Canadian Residential Natural Gas Demand
AGGOGMAXAGGOGMEDIAN
AGGOGMIN
NEB BASENEB HIGH PRICE
NEB LOW PRICE
Figure 3-48. Canadian residential Natural Gas Demand
Figure 3-47. Canadian Total Natural Gas Demand
0
5
10
15
2000 2005 2010 2015 2020 2025 2030
BILL
ION
CU
BIC
FEET
PER
DAY
YEAR
Notes: For a description of cases, see “Description of Projection Cases” at the end of this chapter. NEB = National Energy Board of Canada.
AGGOGMAXAGGOGMEDIAN
AGGOGMIN
NEB BASENEB HIGH PRICE
NEB LOW PRICE
Figure 3-47. Canadian total Natural Gas Demand

Chapter 3 – NatUraL GaS DeMaND 305
Figure 3-49. Canadian Residential Electricity Demand
100
140
160
180
2000 2005 2010 2015 2020
BILL
ION
KIL
OW
ATT
HO
URS
YEAR
NEB BASENEB HIGH PRICE
NEB LOW PRICE
Notes: For a description of cases, see “Description of Projection Cases” at the end of this chapter. NEB = National Energy Board of Canada.
Figure 3-49. Canadian residential electricity Demand
Figure 3-50. Canadian Commercial Natural Gas Demand
0
1
2
2000 2005 2010 2015 2020 2025 2030
BILL
ION
CU
BIC
FEET
PER
DAY
YEAR
Notes: For a description of cases, see “Description of Projection Cases” at the end of this chapter. NEB = National Energy Board of Canada.
AGGOGMAXAGGOGMEDIAN
AGGOGMIN
NEB BASENEB HIGH PRICE
NEB LOW PRICE
Figure 3-50. Canadian Commercial Natural Gas Demand

306 prUDeNt DeVeLOpMeNt: realizing the potential of North america’s abundant Natural Gas and Oil resources
Figure 3-51. Canadian Commercial Electricity Demand
120
140
160
180
2000 2005 2010 2015 2020
BILL
ION
KIL
OW
ATT
HO
URS
YEAR
NEB BASENEB HIGH PRICE
NEB LOW PRICE
Notes: For a description of cases, see “Description of Projection Cases” at the end of this chapter. NEB = National Energy Board of Canada.
Figure 3-51. Canadian Commercial electricity Demand
Figure 3-52. Canadian Industrial Energy Demand
0
2
4
6
2000 2005 2010 2015 2020
QU
AD
RILL
ION
BTU
YEAR
BIOFUELS AND EMERGING ENERGYCOAL, COKE, & COKE OVEN GAS
OTHER LPG & PETROLEUM FEEDSTOCKS REFINED PETROCHEMICAL PRODUCTSNATURAL GASELECTRICITY
Note: LPG = lique�ed petroleum gas.Source: National Energy Board of Canada 2009 Reference Case.
Figure 3-52. Canadian Industrial energy Demand
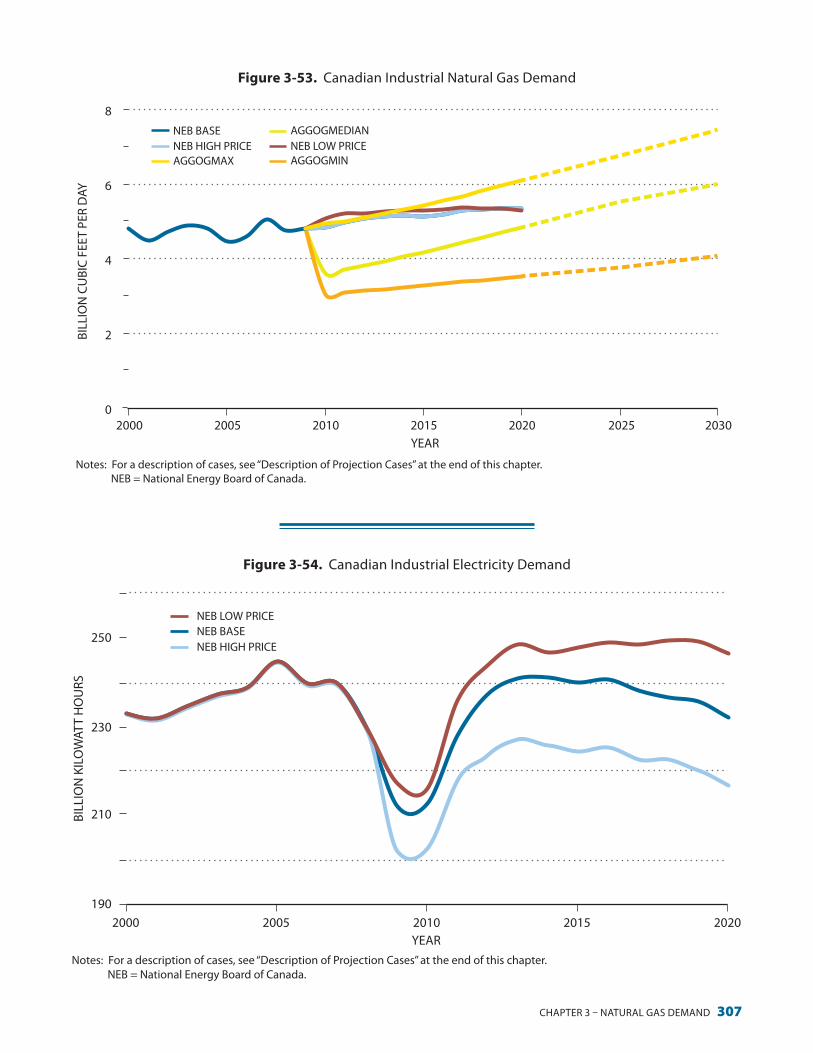
Chapter 3 – NatUraL GaS DeMaND 307
Figure 3-53. Canadian Industrial Natural Gas Demand
0
2
4
6
8
2000 2005 2010 2015 2020 2025 2030
BILL
ION
CU
BIC
FEET
PER
DAY
YEAR
Notes: For a description of cases, see “Description of Projection Cases” at the end of this chapter. NEB = National Energy Board of Canada.
AGGOGMAX
AGGOGMEDIAN
AGGOGMIN
NEB BASENEB HIGH PRICE NEB LOW PRICE
Figure 3-53. Canadian Industrial Natural Gas Demand
Figure 3-54. Canadian Industrial Electricity Demand
190
210
230
250
2000 2005 2010 2015 2020
BILL
ION
KIL
OW
ATT
HO
URS
YEARNotes: For a description of cases, see “Description of Projection Cases” at the end of this chapter. NEB = National Energy Board of Canada.
NEB BASENEB HIGH PRICE
NEB LOW PRICE
Figure 3-54. Canadian Industrial electricity Demand

308 prUDeNt DeVeLOpMeNt: realizing the potential of North america’s abundant Natural Gas and Oil resources
Canadian Power Generation Demand
Canadian total electricity demand is expected to grow primarily as a result of increases in electricity demand for the commercial and residential sectors (see Figure 3-55).
Natural gas demand related to producing oil sands is expected to be the single biggest source of growth in Canadian natural gas demand. The Unconven-tional Oil Subgroup of the Resource and Supply Task Group estimates that oil sands natural gas demand could grow from 1.6 Bcf/d in 2010 to a range of 2.6 to 5.2 Bcf/d in 2035 (see Table 3-2).
Figure 3-55. Canadian Total Electricity Demand
480
520
560
600
2000 2005 2010 2015 2020YEAR
BILL
ION
KIL
OW
ATT
HO
URS
Notes: For a description of cases, see “Description of Projection Cases” at the end of this chapter. NEB = National Energy Board of Canada.
NEB BASENEB HIGH PRICE
NEB LOW PRICE
Figure 3-55. Canadian total electricity Demand
Table 3-2. Natural Gas Demand for Oil Sands
2010 2020 2030 2035 2050
Oil Sands Forecast (Million Barrels per Day)
high 1.5 3.3 5.1 6.0 8.0
Middle 1.5 2.7 3.9 4.5 5.0
Low 1.5 2.1 2.7 3.0
Natural Gas Demand for Oil Sands (Billion Cubic Feet per Day)
high 1.6 2.9 4.5 5.2 6.9
Middle 1.6 2.4 3.5 4.0 4.4
Low 1.6 1.8 2.4 2.6
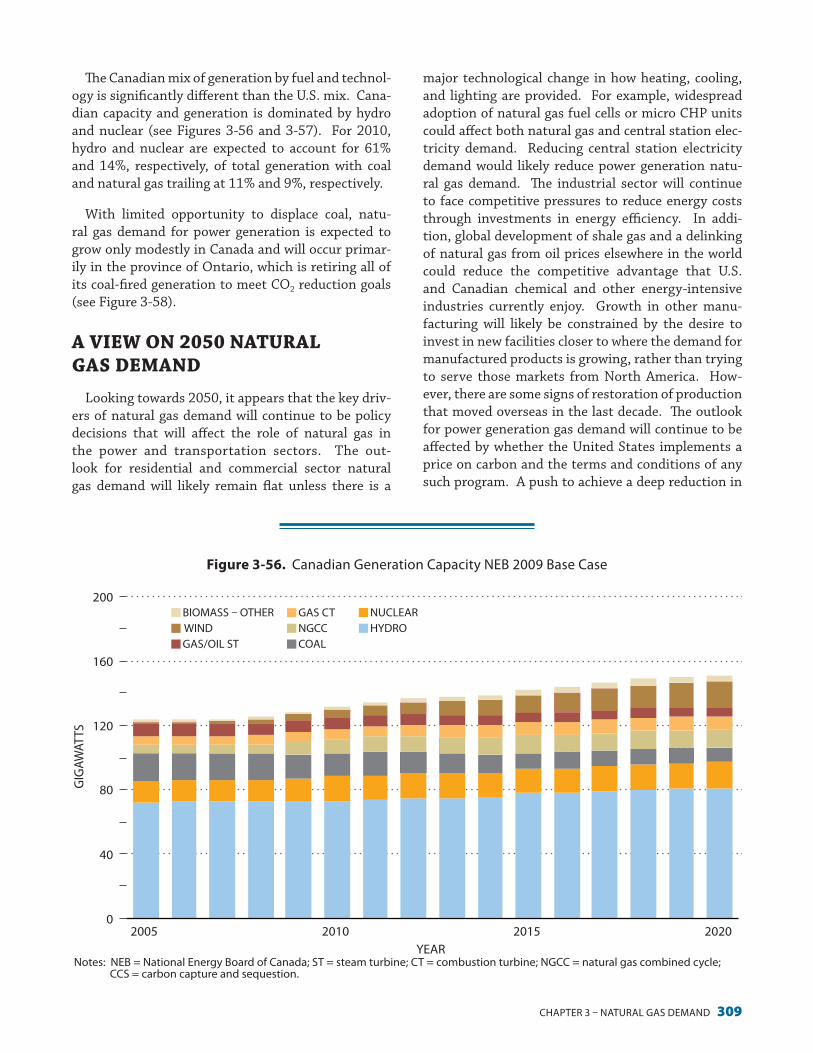
Chapter 3 – NatUraL GaS DeMaND 309
major technological change in how heating, cooling, and lighting are provided. For example, widespread adoption of natural gas fuel cells or micro CHP units could affect both natural gas and central station elec-tricity demand. Reducing central station electricity demand would likely reduce power generation natu-ral gas demand. The industrial sector will continue to face competitive pressures to reduce energy costs through investments in energy efficiency. In addi-tion, global development of shale gas and a delinking of natural gas from oil prices elsewhere in the world could reduce the competitive advantage that U.S. and Canadian chemical and other energy-intensive industries currently enjoy. Growth in other manu-facturing will likely be constrained by the desire to invest in new facilities closer to where the demand for manufactured products is growing, rather than trying to serve those markets from North America. How-ever, there are some signs of restoration of production that moved overseas in the last decade. The outlook for power generation gas demand will continue to be affected by whether the United States implements a price on carbon and the terms and conditions of any such program. A push to achieve a deep reduction in
The Canadian mix of generation by fuel and technol-ogy is significantly different than the U.S. mix. Cana-dian capacity and generation is dominated by hydro and nuclear (see Figures 3-56 and 3-57). For 2010, hydro and nuclear are expected to account for 61% and 14%, respectively, of total generation with coal and natural gas trailing at 11% and 9%, respectively.
With limited opportunity to displace coal, natu-ral gas demand for power generation is expected to grow only modestly in Canada and will occur primar-ily in the province of Ontario, which is retiring all of its coal-fired generation to meet CO2 reduction goals (see Figure 3-58).
a VIEW ON 2050 NaTuraL GaS DEmaND
Looking towards 2050, it appears that the key driv-ers of natural gas demand will continue to be policy decisions that will affect the role of natural gas in the power and transportation sectors. The out-look for residential and commercial sector natural gas demand will likely remain flat unless there is a
Figure 3-56. Canadian Generation Capacity NEB 2009 Base Case
0
40
80
120
160
200
2005 2010 2015 2020
GIG
AWAT
TS
YEAR
BIOMASS – OTHER WIND GAS/OIL ST
GAS CT NGCC COAL
NUCLEAR HYDRO
Notes: NEB = National Energy Board of Canada; ST = steam turbine; CT = combustion turbine; NGCC = natural gas combined cycle; CCS = carbon capture and sequestion.
Figure 3-56. Canadian Generation Capacity NeB 2009 Base Case

310 prUDeNt DeVeLOpMeNt: realizing the potential of North america’s abundant Natural Gas and Oil resources
Figure 3-58. Canadian Power Generation Natural Gas Demand
0
1.0
2.0
3.0
2000 2005 2010 2015 2020 2025 2030
BILL
ION
CU
BIC
FEET
PER
DAY
YEAR
AGGOGMAX
AGGOGMEDIAN
AGGOGMIN
NEB BASENEB HIGH PRICE NEB LOW PRICE
Notes: For a description of cases, see “Description of Projection Cases” at the end of this chapter. NEB = National Energy Board of Canada.
Figure 3-58. Canadian power Generation Natural Gas Demand
Figure 3-57. Canadian Generation NEB 2009 Base Case
0
200
400
600
800
2005 2010 2015 2020 YEAR
BIOMASS – OTHER SOLAR GEOTHERMAL
WIND GAS/OIL ST GAS CT
NGCCCOAL CCSCOAL
NUCLEAR HYDRO
GIG
AW
ATT
HO
URS
Notes: NEB = National Energy Board of Canada; ST = steam turbine; CT = combustion turbine; NGCC = natural gas combined cycle; CCS = carbon capture and sequestion.
Figure 3-57. Canadian Generation NeB 2009 Base Case

Chapter 3 – NatUraL GaS DeMaND 311
equivalent). This case results in natural gas providing 40% of the fuel for HDVs by 2035. For 2035, natural gas demand for HDVs is 4.5 Bcf/d (see Figure 3-59).
The DTG also reviewed the RFF LNG Trucks with Abundant Natural Gas (Scenario 6), which assumed that purchases of new HDV fueled by LNG as a share of total HDV purchases increased by 10% per year, reaching 100% of purchases in 2020.73 This results in 70% of all HDVs being fueled by LNG in 2030 with an associated natural gas demand of 11.2 Bcf/d.
PEV Electricity Demand
The DTG looked at one PEV study: an Electric Power Research Institute and National Resources Defense Council joint study done to assess potential reductions in GHG emissions if very rapid growth in PEVs for LDVs occurs.74 The DTG estimates of PEV-related natural gas demand are based on the medium PEV fleet penetration and medium electric sector CO2 intensity scenario. PEVs are assumed to be 40% of the LDV fleet by 2030 and 57% by 2050. Elec-tric demand is expected to grow to 316,560 GWh by 2030 and 548,061 GWh in 2050; but since most of the PEVs are hybrids that have on-board generators, not all gasoline or diesel fuel is displaced by electric-ity. The DTG prepared two estimates of natural gas demand that might result from the electricity require-ment for this scenario. A low estimate was prepared using natural gas generation share of total generation from the AEO2011 Reference Case, about 20%. A high estimate was calculated based on all the electric-ity required for PEVs being generated by NGCC plants with a heat rate of 7,000 Btu/kWh. The low and high estimates for U.S. natural gas demand for 2035 are 1.5 and 7.6 Bcf/d, respectively, and for 2050 are 2.1 and 10.5 Bcf/d, respectively.
Total Potential Natural Gas Demand for Vehicles
The range of potential direct and indirect natural gas demand for the studies is shown in Figure 3-57. For the purpose of “stress testing”
73 Resources for the Future, Abundant Shale Gas Resources: Long-Term Implications for U.S. Natural Gas Markets, August 2010.
74 Electric Power Research Institute and National Resources Defense Council, Environmental, Assessment of Plug-In Hybrid Electric Vehicles, “Volume 1: Nationwide Greenhouse Gas Emis-sions,” July 2007.
CO2 emissions from the power sector will likely mean that at some point, natural gas power generation demand for capacity without CCS would decline. As natural gas generation with CCS is added, natural gas power generation demand should stabilize, but likely at below peak levels.
POTENTIaL VEHICLE NaTuraL GaS aND ELECTrICITy DEmaND
The NPC Future Transportation Fuels study is examining the potential market penetration of NGVs and PEVs that could create some natural gas demand for NGVs, and indirectly for power generation to meet electricity demand from PEVs, as well as fuel cell electric vehicles using hydrogen reformed from natu-ral gas. Since the FTF study will be completed after this one, this study examined high-potential-demand cases for NGVs and PEVs from published sources.
For NGVs, the DTG looked at three public studies: EIA AEO2010 Reference Case; EIA 2010 sensitivity on heavy-duty vehicles; and an RFF study. The analysis also included a Proprietary Maximum Case, which had NGV natural gas demand of 2.0 Bcf/d for 2030. Except for the EIA AEO2010 Reference Case and its sensitivities, all of the other public studies are based on high-market penetration assumptions without any estimate of what it would take to achieve such pen-etrations. The only studies reviewed that competed gasoline and diesel vehicles against NGVs or PEVs were the AEO Cases.
NGV Natural Gas Demand
The DTG looked at two EIA NGV cases: the AEO2010 Reference Case and the AEO2010 2027 Phaseout with Expanded Market Potential. The AEO2010 Reference Case, which competes gasoline and diesel vehicles against NGVs and PEVs, has nom-inal NGV natural gas demand of 0.5 Bcf/d by 2035 (see Figure 3-59). The AEO2010 2027 Phaseout with Expanded Market Potential case incorporates lower incremental costs for all NGVs for all classes of heavy-duty vehicles that begin in 2011 and are phased out by 2027. The lower incremental costs include: zero incremental cost relative to their diesel-powered counterparts after accounting for incentives of about $80,000 per truck; tax incentives for natural gas refu-eling stations ($100,000 per new facility); and cred-its for natural gas fuel ($0.50 per gallon of gasoline

312 prUDeNt DeVeLOpMeNt: realizing the potential of North america’s abundant Natural Gas and Oil resources
LNG ExPOrTSA potential source of demand for U.S. and Canadian
natural gas production is LNG exports to global mar-kets. The United States has produced and exported LNG from its Kenai, Alaska, facility since 1969 using gas from the Cook Inlet near Anchorage. LNG was continuously produced from the 200 MMcf/d plant since its inception and sold to its long-term contract holders, Tokyo Gas and Tokyo Electric. The plant is expected to close in October 2011. The decision was based on low production volumes from the Cook Inlet that restricted liquefaction to approximately 80 MMcf/d and lack of interest in a contract exten-sion from the two buyers.
However, as a result of the substantial increase in U.S. and Canadian natural gas resources from unlocking shale gas resources, several new LNG export facilities have been proposed and some have filed for regulatory permits in both the United States and Canada.
natural gas supply, the DTG summed the results of one HDV and one LDV study. For HDV potential, the DTG used the AEO2010 2027 Phaseout with Expanded Market Case. U.S. natural gas demand for 2035 for this case is 4.5 Bcf/d. This estimate was increased by 8% to 4.9 Bcf/d to reflect Canadian HDV NGV demand potential based on the ratio of Canadian vehicles to U.S. vehicles.75 For LDVs, the DTG used the Electric Power Research Institute and National Resources Defense Council joint study on PEVs, assuming 100% of the electricity requirement was met by natural gas generation. U.S. natural gas demand for 2035 for this case is 7.6 Bcf/d. This estimate was increased by 8% to 8.2 Bcf/d to reflect Canadian LDV PEV demand potential based on the ratio of Canadian vehicles to U.S. vehicles. For pur-poses of “stress testing” North American natural gas supply, the DTG used the combined very high poten-tial HDV NGV and LDV PEV natural gas demand for 2035 of 13.1 Bcf/d.
75 Canadian vehicles are equal to 8% of U.S. vehicles.
Figure 3-59. Potential U.S. Direct and Indirect Natural Gas Demand for Vehicles
0
10
5
15
2010 2020 2030 2035
BILL
ION
CU
BIC
FEET
PER
DAY
YEARNotes: For a description of cases, see “Description of Projection Cases” at the end of this chapter. RFF = Resources for the Future; LNG = liquefied natural gas; LDVs = light-duty vehicles; PEVs = plug-in electric vehicles.
2040 2050
AEO2010 REFERENCE CASE AEO2010 2027 PHASEOUT WITH EXPANDED MARKET POTENTIAL
PROPRIETARY MAXIMUM RFF LNG TRUCKS WITH ABUNDANT NATURAL GAS LDVS PEVS 57% OF SALES BY 2050 GAS SHARE OF GENERATION
LDVS PEVS 57% OF SALES BY 2050 GAS GENERATION ONLY
Figure 3-59. potential U.S. Direct and Indirect Natural Gas Demand for Vehicles
Chapter 3 – NatUraL GaS DeMaND 313
4.3 Bcf/d for 2035. If Mexico decides to replace some of its LNG imports with pipeline imports from the United States, then Mexican demand for U.S. natural gas could be higher. On the other hand, Mexico has substantial natural gas resources that could be devel-oped under the right legal and regulatory structure.
For purposes of “stress testing” natural gas sup-plies, the DTG has assumed 2035 exports to Mexico of 4.3 Bcf/d.
u.S. LIQuIDS DEmaNDTotal U.S. liquids demand for 2010 is estimated
at about 19 million barrels per day. Liquids demand includes gasoline, distillate, residual fuel oil, LPGs, kerosene, jet fuel, and petrochemical feedstock. The transport and industrial sectors account for 72% and 22%, respectively, of total U.S. liquids demand (see Figure 3-60). The residential and commercial sectors, which use distillate and LPGs for heating, together account for about 2% of total U.S. liquids demand. The power sector accounts for only 1% of liquids demand.
As for the future, the transport sector is expected to account for essentially all of the growth in U.S. liq-uids demand. The FTF study is addressing the out-look for liquids demand from the transportation sec-tor. Residential, commercial, and industrial feedstock uses are expected to decline while industrial other (non-feedstock) uses are expected to increase slightly. Power sector liquids demand is expected to remain flat. Nearly 80% of industrial liquids demand is expected to come from LPGs (see Figure 3-61). The AEO2010 Reference Case does not fully reflect the impact of shale gas, which is likely to lead to higher LPG production.
Historically, one of the most important long-term drivers of energy demand is the rate of economic growth. This is also applicable to the demand for U.S. liquids. The impact of economic growth on U.S. liq-uids demand can be seen by comparing the AEO2010 Reference Case with AEO2010 High Macro and Low Macro sensitivities, which had real GDP growth rates of 2.4%, 3.0%, and 1.8%, respectively. The AEO2010 Reference Case had U.S. total liquids demand grow-ing from about 19 million barrels per day in 2010 to 22 million barrels per day per day in 2030 (see Figure 3-62). For the High and Low Macro Cases, 2035 total liquid demand was 25 million barrels per day) and 20 million barrels per day, respectively.
Given that liquefaction facilities can cost $2 to $3.5 billion depending on location and size, these LNG projects are unlikely to be developed unless they can obtain a long-term capacity agreement from a large creditworthy customer such as a major foreign buyer of LNG or a major oil and gas company. For producers, there is the potential of higher netbacks from buying U.S. or Canadian natural gas production at low North American natural gas prices, liquefying it, and selling as LNG at higher prices linked to oil prices. With the current high oil-to-natural gas price ratio, this is an attractive opportunity. However, only a very large, financially secure company can assume the financial risk that oil prices will remain high relative to natural gas and that LNG prices will continue to be linked to a high fraction of the oil price.
For purposes of “stress testing” natural gas sup-plies, the DTG has assumed that the maximum LNG export potential for United States and Canada is 5.0 Bcf/d, equivalent to the initial liquefaction capac-ity of the first three filed North American LNG export projects.
ExPOrTS TO mExICOA source of demand for U.S. natural gas produc-
tion is net exports to Mexico. EIA data show that net exports from the United States to Mexico have averaged 810 MMcf/d over the last five years (2005–2009). Import flows occur at 15 pipeline points along the Mexico-U.S. border with some points being bidirectional, capable of import and export. U.S. pipeline export capacity to Mexico is 3.3 Bcf/d and pipeline import capacity is 1.6 Bcf/d.
The current plan of the Secretaria de Energía – the Mexican Ministry of Energy (Sener) – shows roughly 500 MMcf/d of net imports from the United States by 2024 versus an average for 2009 of 855 MMcf/d. If one assumes that Petróleos Mexicanos (Pemex) produces natural gas to the level forecast by Sener, that LNG is imported to Mexico using a 50% capac-ity factor for their 2 Bcf/d of regasification capacity, and that most of the new power capacity additions are natural gas-fired, then the amount of natural gas to be imported from the United States by Mexico by 2024 is closer to 2.5 to 3.0 Bcf/d. This is consistent with the EIA AEO2010 Reference Case that projects U.S. net exports to Mexico at 2.3 Bcf/d in 2025 and 2.8 Bcf/d for 2035. The EIA AEO2011 Reference Case projects U.S. net exports to Mexico at 3.0 Bcf/d in 2025 and

314 prUDeNt DeVeLOpMeNt: realizing the potential of North america’s abundant Natural Gas and Oil resources
Figure 3-60. U.S. Liquids Demand
0
10
20
30
2007 2012 2017 2022 2027 2032
MIL
LIO
N B
ARR
ELS
PER
DAY
YEARSource: Energy Information Administration’s AEO2010 Reference Case.
TRANSPORTPOWER
INDUSTRIAL FEEDSTOCKINDUSTRIAL OTHERINDUSTRIAL RESIDENTIAL
COMMERCIAL
Figure 3-60. U.S. Liquids Demand
Figure 3-61. U.S. Industrial Liquids Demand
2007 2010 2015 2020 2025 2030 2035
MIL
LIO
N B
ARR
ELS
PER
DAY
YEAR
Source: Energy Information Administration’s AEO2010 Reference Case.
0
2
4
6RESIDUAL FUEL OILMOTOR GASOLINE
DISTILLATE FUEL OILPETROCHEMICAL FEEDSTOCKS
OTHER PETROLEUM INCLUDING ASPHALT LIQUEFIED PETROLEUM GASES
Figure 3-61. U.S. Industrial Liquids Demand

Chapter 3 – NatUraL GaS DeMaND 315
However, there are strict limits in quality provisions of pipeline tariffs on how much ethane can be left in the natural gas stream. Eventually, capacity to deal with ethane and LPGs may have to be built or develop-ment of new wet natural gas productive capacity may have to be limited.
Low ethane prices relative to natural gas, and/or any inadequacy of NGL gathering and processing infrastructure in liquids-rich shale plays, will tend to physically limit the development pace of shale gas, thereby curbing NGL production – which will feed back to NGL prices and demand.
POLICy rECOmmENDaTIONSDemand related policy recommendations can be
grouped into four major categories:
y Increase Energy Efficiency
y Promote Efficient and Reliable Markets
y Increase Effectiveness of Energy Policies
y Conduct Carbon Capture and Sequestration Research and Development.
Most of the range in 2035 total liquids demand occurs in the transport sector (about 70%) and in the indus-trial sector (about 29%).
For the industrial sector, LPG demand accounts for about 37% of the total range between high and low forecasts in industrial liquids demand (see Figure 3-63). Other types of petroleum (includes petroleum coke, asphalt, road oil, lubricants, still gas, and miscellaneous petroleum products) account for about 36% of the total range in industrial liquids demand.
How much non-transport liquids demand grows probably will depend on how much North American NGLs (LPGs and, more specifically, ethane, which comprises approximately half of all NGLs) are pro-duced, and what the prices are for natural gas.
Substitution of ethane and other LPGs for natural gas in industrial applications depends heavily on their relative prices. If the relative value of sending unpro-cessed wet natural gas to a consumer exceeds the value of extracting ethane, then in some cases a gas processing plant may not be built or may not be run.
Figure 3-62. U.S. Liquids Demand
0
AEO2010REFERENCE CASE
AEO2010HIGH MACRO
AEO2010LOW MACRO
YEAR
MIL
LIO
N B
ARR
ELS
PER
DAY
2010 2035
10
20
30
INDUSTRIAL
COMMERCIAL
RESIDENTIAL
TRANSPORT
POWER
Note: For a description of cases, see “Description of Projection Cases” at the end of this chapter.
Figure 3-62. U.S. Liquids Demand

316 prUDeNt DeVeLOpMeNt: realizing the potential of North america’s abundant Natural Gas and Oil resources
menting energy efficiency, all other energy resources and technologies involve trade-offs among economic, environmental, and energy security objectives.
The 2007 NPC Hard Truths report identified many energy efficiency policy options, most of which are still applicable today, as was corroborated in the cur-rent study as well. Implementing energy-efficient technologies can reduce the need to produce, deliver, and transform energy, thus avoiding emissions and resource use, mitigating environmental impacts, and enhancing energy security. For instance, if the United States used energy at 1973 efficiency levels in all sec-tors of the economy, about 56% more energy would be consumed today – equal to another 52 quadrillion Btu that otherwise would have had to be extracted, delivered, combusted, or otherwise harnessed to pro-duce usable energy for consumers’ needs. Increasing energy efficiency can thus provide long-term benefits.
Gas and electric utilities are natural entities to pro-vide some types of energy efficiency programs, such as installing weather-proofing or distributing appli-ance rebates, because those utilities have information about the consumption patterns of their customers,
Increase Energy Efficiency
There is large scope for improving energy efficiency across the residential, commercial, and industrial sectors using existing technologies and practices as well as through development of newer technologies and approaches. The range of policy options that can apply is large and include, among others, codes and standards, financial and tax incentives, utility rate-making processes, information and technical assis-tance, research and development, and putting a price on externalities (such as CO2).
Increase Residential and Commercial Energy Efficiency
Buildings constitute a major source of demand for power, heating, cooling, and lighting. In many situ-ations, avoiding energy consumption through instal-lation of more efficient appliances and equipment or improving a building shell can be the most cost- effective strategy for satisfying customers’ energy needs. Efficiency opportunities also arise in indus-trial and public facility (e.g., street lighting, water, and wastewater plants) operations. Compared to imple-
Figure 3-63. U.S. Industrial Liquids Demand
0
2
4
6 AEO2010HIGH MACRO
AEO2010LOW MACRO
MIL
LIO
N B
ARR
ELS
PER
DAY
2010
YEAR
2035
LIQUEFIEDPETROLEUM GASESOTHER PETROLEUMPETROCHEMICAL FEEDSTOCKSRESIDUAL FUEL OILDISTILLATE FUEL OILMOTOR GASOLINE
Note: For a description of cases, see “Description of Projection Cases” at the end of this chapter.
AEO2010REFERENCE CASE
Figure 3-63. U.S. Industrial Liquids Demand

Chapter 3 – NatUraL GaS DeMaND 317
building energy audits and commissioning, and tax and land use incentives. There are also federal and state opportunities for improving consumer energy information (such as labeling and disclosure), sup-porting training and technical assistance (to archi-tects, engineers, building trades, real estate profes-sionals), and advancing research, development, and demonstration (RD&D) and commercialization of relevant technologies.
Recommendation
The NPC makes the following recommenda-tions to support the adoption of energy effi-ciency in buildings, appliances, and equipment:
y The federal government should continue to support the updating of national model build-ing codes issued by the American National Standards Institute, American Society of Heat-ing, Refrigerating, and Air-Conditioning Engi-neers, the Illuminating Engineering Society of North America (commercial codes) and the International Code Council (residential codes) and to provide technical assistance, training, and other support for state and local enact-ment and enforcement of the updated codes.
y The federal government should continue to update energy efficiency standards for appli-ances and equipment over which it has statu-tory authority.
y The federal government should continue to update energy efficiency standards for appli-ances and equipment over which it has statu-tory authority.
y Federal and state governments should con-sider incentives for products and buildings that are more efficient than required by laws and standards, such as Energy Star qualifying products.
Increase Industrial Energy Efficiency
Another opportunity for energy savings comes from CHP facilities and waste heat recovery. Such facilities can function within industrial plants such as paper mills or chemical plants, and may also be found in large institutions such as universities or hospitals. CHP facilities produce steam for industrial purposes or heating and produce electricity as a secondary
have an ongoing relationship with them, and often have the expertise to implement energy efficiency programs. Moreover, treating energy efficiency as a resource in their portfolio of supply options can help utilities deliver supply for their customers at lower overall costs. In other cases, third parties such as local energy efficiency programs, weatherization provid-ers (for low-income households), state energy offices, and energy efficiency “utilities” (such as Efficiency Vermont) may be well-positioned to operate programs supporting private sector implementation of energy efficiency measures.
Significant energy savings have been achieved in the United States through building codes and appliance and equipment standards. Building codes are admin-istered by the 50 states and by thousands of local authorities. To help state and local governments, the federal government can further support the develop-ment and periodic update of national model energy codes, allowing and encouraging states to adopt the most recent such codes. The International Energy Conservation Code issued by the International Code Council develops national model energy codes for res-idential buildings. The American National Standards Institute, the American Society of Heating, Refriger-ating, and Air-Conditioning Engineers, and the Illu-minating Engineering Society of North America Stan-dard 90.1 serve as a basis for model energy codes for commercial buildings. These model codes are typically updated on a three-year schedule. The federal govern-ment can also provide technical assistance, training, and other measures to improve state and local ability to enact and enforce codes.
While building codes typically apply only to new structures or major renovations, appliance and equip-ment standards can reduce energy consumption in existing buildings and facilities. Efficient new appli-ances in the residential and commercial sectors could reduce energy consumption and, in turn, carbon emissions from these sectors by 12% and 7%, respec-tively.76 Full fuel cycle analysis could provide the basis for these appliance standards.
There are also opportunities for states and localities to advance building energy efficiency through other means, such as support for innovative energy retro-fit finance (e.g., revolving funds, property assessed clean energy finance), requirements for commercial
76 See Table 4-5 of Chapter Four, Carbon and Other Emissions in the End-Use Sectors.

318 prUDeNt DeVeLOpMeNt: realizing the potential of North america’s abundant Natural Gas and Oil resources
y Encourage investment in RD&D breakthrough technologies and by allowing annual write-off of all expenses associated with RD&D of breakthrough technologies, including everything from personnel costs to all physical and non-physical resources uti-lized.
y Increase the funding of the DOE Industrial Tech-nology Program.
y Actions to encourage greater use of CHP should not create any preferences, but should give CHP an opportunity to compete fairly with other sources of energy.
Recommendation
The NPC makes the following recommenda-tions to eliminate the barriers to CHP and thus increase the efficiency of electricity production in the United States:
y State and federal utility regulators should adopt, for both natural gas and electric utili-ties, the removal of barriers to CHP in inter-connection, power sales, and power transfers.
y Policymakers should include CHP and energy efficiency in any clean energy standard.
y The EPA should use output-based performance standards for emissions from power genera-tion, including CHP, as means to reflect inher-ent energy efficiency differences in power gen-eration technologies.
Increase Energy Efficiency Through Recycling
Further, much energy is embodied in materi-als in the energy needed to extract, process, trans-form, transport and, eventually, dispose of them. Reducing waste and scrap and effectively reus-ing and recycling those wastes and scrap that are produced are important means to save energy as well as materials and to improve productivity and reduce environmental impacts. Recycling of energy-intensive products such as paper, steel, aluminum, glass, solvents, asphalt, concrete, and plastic is a very powerful tool for reducing energy consump-tion, greenhouse gas emissions, and other pollu-tion and waste. Conservation and reuse of water also reduces significant energy costs of collection,
product for their own consumption or for sale. CHP can operate at nearly 70% energy-efficiency rates versus about 32% for baseload coal plants. Today, CHP accounts for almost 9% of electricity produced.
Greater use of CHP, as well as waste heat recovery, can provide a significant opportunity to lower pro-duction costs and thus improve the competitiveness of manufacturing, while providing larger societal benefits such as improving overall efficiency of power generation, lowering emissions, increasing reliability of the electric grid, and reducing transmission losses.
In many areas, regulatory barriers prevent oth-erwise economic investments in CHP. These barri-ers include rules relating to interconnecting CHP facilities to the grid, policies limiting the sale of CHP power to the market, problems with fair pricing, and the ability to enter into long-term contracts for the power output from CHP. Greater flexibility, for instance, is needed to allow manufacturing facilities to sell power to one another or in regulated states to wheel power from one facility to another. Addition-ally, typical environmental regulations also measure emissions of power combustion as a function of heat input (e.g., emissions per Btu consumed) rather than emissions associated with output (e.g., emissions per kilowatt-hour and useful thermal energy of output). This regulatory design disadvantages CHP units and other more-efficient technologies. Higher efficiency generally means lower fuel consumption and lower emissions of all pollutants.
Other ways to encourage greater industrial energy efficiency include:
y Greater support could be provided for technical assistance to help industry identify, assess, and implement cost-effective, competitiveness-improv-ing energy options; such existing programs include the DOE-supported regional Clean Energy Appli-cation Centers (formerly the CHP Applications Centers), Industrial Assessment Centers, National Institute of Standards and Technology Manufac-turing Extension Partnership, and other industrial resources.
y The federal government can support and partner with industry in RD&D of more efficient and pro-ductive industrial technologies.
y By lowering the cost of capital by providing grants, transferable investment tax credits, and low cost loan programs.
Chapter 3 – NatUraL GaS DeMaND 319
Promote Efficient and Reliable Energy Markets
Natural gas and electric stakeholders and their regu-lators should take steps to promote more efficient and reliable natural gas and electric markets. Also, market participants, including regulated utilities, should have access to tools to address or mitigate price volatility in fuels, (e.g., through long-term contracts for natural gas, use of hedging instruments by regulated entities like utilities, and investment in storage facilities).
Harmonization of Natural Gas and Power Markets
From 2000 to 2010, the use of natural gas for power generation has increased from 16 to 24% of total elec-tric sector generation. For the same period, natural gas demand for power generation grew from 14 to 20 Bcf/d, increasing power generation’s share of total natural gas demand from 22 to 31%.
The continued increased use of natural gas for power generation will be driven by three factors:
y A change in expectations about North American natural gas supply and costs due to the economic viability of shale gas development. Concerns about high and volatile natural gas prices, flat production, and increasing LNG imports have changed to fore-casts of lower and more stable natural gas prices and abundant North American natural gas supplies that could meet almost any natural gas demand requirement.78
y An expectation of strong growth in intermittent renewable generation capacity that increasingly requires backup by gas-fired generation to stabilize grid operations.
y An expectation of substantial retirements of coal-fired generation in the next few years as a conse-quence of implementation of EPA’s proposed non-GHG regulations, combined with lower natural gas price expectations.
However, growth in power generation natural gas demand should not be taken for granted. The increased use of natural gas for electricity production,
78 See for example, EIA AEO Reference Case wellhead price fore-cast for 2030 declined from $7.80 (2007$) per MMBtu for the 2009 Reference Case to $5.66 (2009$) for the 2011 Reference Case.
distribution, and treatment. Use of organic wastes (such as manures) can substitute in some cases for energy-intensive synthetic fertilizers, while in other cases energy can be recovered from biogas production or direct combustion. In 2009, the estimated avoided greenhouse gas emissions from recycling totaled over 142.2 million MtCO2e, about 3%, of 2009 total CO2 emissions.77 Despite these significant gains from recycling, there are still significant quantities of these products in the industrial, commercial, and residen-tial sectors that are not recycled each year. Federal and state policies that encourage materials efficiency and cost effective reuse and recycling would improve energy efficiency.
Align Utility Incentives and Efficiency Goals
Under traditional ratemaking policies, utilities that sell electric power or natural gas to end-use consum-ers have the incentive to sell more of their product to consumers: higher sales means higher revenues, which usually mean higher profits, and lower sales mean the opposite. To overcome this disincentive, ratemaking policies should align the financial inter-ests of both electric and gas utilities with those of their customers in providing cost-effective energy efficiency measures.
Recommendation
The NPC makes the following recommenda-tion to remove the disincentives for natural gas utilities and electric utilities to deploy energy-efficiency measures:
y State and federal utility regulators should adopt for utilities:
− Ratemaking policies to align utility financial incentives with the adoption of cost-effective energy-efficiency measures
− Goals and targets for the deployment of cost-effective energy efficiency so as to support the adoption of cost-effective energy efficiency measures on a timely basis.
77 U.S. EPA, “Source Environmental Benefits Calculator,” 2009 Data.

320 prUDeNt DeVeLOpMeNt: realizing the potential of North america’s abundant Natural Gas and Oil resources
leading to the rolling power outages. Other power plants found their fuel supplies curtailed by local dis-tribution companies under natural gas priority rules that were last updated in the early 1970s. Some of the controlled electric outages also idled natural gas pipeline compressor stations, reducing pipeline pres-sure and hampering the ability of natural gas genera-tion plants to get the fuel they needed. Both incidents highlight the need to resolve certain issues that sit at the intersection of gas and electric deliverability, and wholesale electric market reliability.
As natural gas and electric markets become more entwined, greater coordination between the two will be required. One way to enhance this coordination and to minimize surprises is to increase the trans-parency of operations. The FERC has done this for natural gas markets by requiring interstate pipelines to post on the web extensive data on their opera-tions. Increasing the information about generation and transmission operations would increase transpar-ency and would benefit the smooth functioning of the market.
Another interdependency issue that needs to be addressed is the recovery of costs incurred by pipe-lines in providing service to gas-fired generators and, in turn, the recovery of those costs by gas-fired gen-erators from electric customers. The diversity of vari-ous organized and non-organized wholesale power markets requires different approaches.
Finally, there is an expectation that any retirement related reduction in coal-fired generation can be met, to some extent, by existing gas-fired generation. However, none of the retirement studies examined whether there were any electric transmission bottle-necks to doing so.
Recommendation
The NPC recommends continuing the efforts to harmonize the interaction between the natural gas and electric markets:
y The Federal Energy Regulatory Commission, the North American Electric Reliability Cor-poration, the North American Energy Stan-dards Board, the National Association of Regulatory Utility Commissioners, and each formal wholesale market operated by the Regional Transmission Organizations, with
especially during peak periods in regional gas and electric markets, is raising concerns about poten-tial serious operational problems for both pipeline operators and power generators. Some power gen-erators have identified concerns about terms and conditions of natural gas services that are inhib-iting them from building and operating gas-fired generation plants. Conversely, some pipelines have stated that they are not being adequately compensated for providing service to gas-fired generators that are backstopping intermittent renewables. Accordingly, federal and state regulators and industry leaders are calling for more formalized coordination between the electric and gas sectors.
This will not be an easy task. Both the natural gas pipeline network and the electric transmission grid operate under different complex systems of rules and regulations that have evolved independently over decades. For example, the natural gas industry uses a standardized operating day, but the power sector has multiple operating days. Also, the scheduling rules and timelines for power generators, for day-ahead and real time markets may not synchronize between electric control areas or with pipeline capacity nomi-nation schedules or rights. Gas-fired generators who do not hold firm pipeline transportation frequently have to commit power to the regional electricity grid before they have the assurance of pipeline capacity. Additionally, peaking facilities, may find it uneco-nomical to purchase firm transportation service from pipelines due to their current inability to recover those costs in the marketplace. With the prospects that natural gas will become an even larger supply source for power generation, and with the increasing need for natural gas generation to backstop intermit-tent renewable generation, coordinating these respec-tive operating and regulatory systems will become increasingly complicated.
A January 2004 cold snap in New England high-lighted the fact that most merchant generators do not hold firm pipeline capacity and firm gas supply. During this period of record peak electricity demand, pipelines’ firm shippers of natural gas used the full contractual entitlements, most of which were held by local distribution companies, and the pipelines did not have excess capacity available to schedule for interruptible customers. Similarly in February 2011 in the Southwest, more than 50 electricity generation units stopped working overnight because of severe weather, reducing capacity by 6,000 megawatts and

Chapter 3 – NatUraL GaS DeMaND 321
in ways that introduce questions about the prudency of those original contract decisions. Even where var-ious contract instruments were used more recently for price hedging purposes, some utilities have been subject to hindsight review by state utility commis-sions and more recently have had to refund some hedging costs to ratepayers. These experiences with regulatory risk have made investment in gas-fired generation less attractive for utilities.
Recommendation
The NPC makes the following recommenda-tions to allow natural gas utilities and electric power utilities to manage their natural gas price risk:
y The NPC supports changes in regulatory policy that remove regulatory barriers from utilities managing their natural gas invest-ment portfolios using appropriate hedging approaches, including long-term contracts. Any such rules should not impede the ability of utilities to appropriately hedge their price risk.
y Regulators (such as state utility commis-sions) and other policymakers should allow market participants such as utilities to use mechanisms to mitigate and manage the impacts of price volatility. These mechanisms include long-term contracts for natural gas, use of hedging instruments by regulated enti-ties like utilities, and investment in storage facilities.
Increase Effectiveness of Energy Policies
Policies for increasing effectiveness of energy poli-cies are:
y Wider use of an FFC analysis when evaluating energy options
y Evaluations of benefits and costs of proposed regu-lations, including feedback effects, should be done in a transparent and creditable way to enhance pol-icy discussions
y Align the long-term benefits of converting from distillate to natural gas with the short-term costs of the conversion.
robust participation from market partici-pants, should:
− Develop policies, regulations, and stand-ardized business practices that improve the coordinated operations of the two industries and reduce barriers that hamper the operation of a well-functioning market
− Increase the transparency of wholesale electric power and natural gas markets
− Address the issue of what natural gas services generators should hold, including firm transport and storage, and what services pipeline and storage operators should provide to meet the requirements of electricity generators as well as compensation for such services for pipeline and storage operators and generators.
y Transmission operators should identify any transmission bottlenecks or power mar-ket rules that limit the ability of natural gas combined cycle plants to replace coal-fired generation.
Provide Utilities With Tools to Manage Price Volatility
Natural gas prices are currently low in compari-son to recent history, making gas-fired generation attractive relative to coal in some situations. One form of risk faced by builders of new natural gas-fired power plants is the perception that natural gas prices are more volatile than the prices of compet-ing fuels such as coal. This perception is grounded in historical experience when utilities made invest-ments in (or purchases of power from) natural gas-fired power generation technologies only to have the prices unexpectedly rise. The gas price increases cre-ated customer difficulties, as increased costs needed to be passed along to consumers of some tradition-ally regulated electric utilities. Some regulators and electric utilities may fear another spike in prices, and may be reluctant to engage in another era of gas-fired power generation investments. Also, in many states, the regulatory legacy resulting from out-of-market, take-or-pay contracts from several decades ago creates regulatory risk and a barrier for electric and gas utilities if they were to enter into long-term contracts for natural gas and then gas prices change

322 prUDeNt DeVeLOpMeNt: realizing the potential of North america’s abundant Natural Gas and Oil resources
Changes in Energy Policies Have Feedback Effects that Need to be Considered
Changes in policies and regulations, such as the proposed non-GHG EPA rules or implementation of a price for carbon, could increase natural gas and elec-tricity prices for all end users. For example, the retire-ment of a coal plant, relative to an alternative scenario of investment to bring the plant in compliance with new emission rules, would likely increase power gener-ation natural gas demand, thereby increasing natural gas prices while reducing coal demand and decreasing coal prices.80 Electric prices could be expected to go up as generators use more natural gas, which has a higher fuel cost per MWh than coal. Electric prices could go up even further if the retired generation needs to be replaced with new generation at today’s costs or if regulated utilities seek to recover any undepreciated costs of the plants being retired.81 Higher natural gas and electricity prices will have additional economic effects as residential, commercial, and industrial cus-tomers respond to higher energy prices, either by reducing energy demand or reducing other expendi-tures, and as such price changes promote investment in alternative energy supplies. The analysis of regu-latory or policy changes needs to take into account these economic costs, as well as the usual health ben-efits, in a comprehensive, transparent, and creditable manner to provide information about the merits of proposed regulatory and policy changes. Although federal departments and agencies are required to perform cost-benefit studies, these are typically pre-pared only on an incremental basis – i.e., for individ-ual rules. They generally do not reflect the combined effect of various proposed or pending regulations on a specific sector, such as the power or industrial sectors. The impact of major regulations should be evaluated where feasible using an economy-wide equilibrium model, in addition to the usual methods that rarely considers more tangible economic consequences, like its effects on employment, the price and reliability of energy, or the competitiveness of U.S. companies.82
80 The major increase in the gas resource base means that any increase in natural gas prices would likely be lower than what would have been expected before shale gas was unlocked.
81 Even old plants may have undepreciated costs flowing from prior life extension investments or prior environmental com-pliance investments.
82 Wall Street Journal Editorial, “The Cost of Lisa Jackson – Why the EPA Doesn’t Consider Job Losses When It Creates New Rules,” August 3, 2011.
Full Fuel Cycle Analysis
FFC analysis measures energy consumption and includes, in addition to site energy use, the energy consumed or vented (addition to National Academy of Sciences definition) in the extraction, processing, and transport of primary fuels such as coal, oil, and natu-ral gas; energy losses in thermal combustion in power-generation plants; and energy losses in transmission and distribution to homes and commercial buildings.
FFC analysis could be used in making and imple-menting certain energy-related policies at different levels of government (and by legislative and executive branch entities). An FFC analysis is a tool that is par-ticularly useful in understanding the complete impact of energy-related decisions on total energy consumed and total emissions, especially when comparing two or more fuel options to achieve the same end-use result.79 The FFC analysis tool could be applied in vari-ous decision-making settings, such as:
y Setting appliance and building efficiency standards
y Comparisons of different technological choices, such as a natural gas water heater to an electric water heater
y Home energy rating systems, such as the Home Energy Rating System (HERS) index.
y For more detail, see the “Full Fuel Cycle Analysis” section earlier in this chapter.
Recommendation
The NPC makes the following recommenda-tions for full fuel cycle analysis to enhance the evaluation of the environmental impact of energy choices:
y The federal government should complete development of and adopt methodologies for assessing full fuel cycle effects.
y As sound methodologies are established, regulators and other policymakers should use full fuel cycle analysis to inform regula-tory decisions and implementation of other policies where fuel and technology choices involve energy and environmental trade-offs.
79 National Research Council, Review of Site (Point-of-Use) and Full-Fuel-Cycle Measurement Approaches to DOE/EERE Build-ing Appliance Energy Efficiency Standards, National Academies Press, 2009.

Chapter 3 – NatUraL GaS DeMaND 323
utility to bear the first-cost burden to relieve the customer of the upfront cost associated with natu-ral gas.
y Defer customer contributions in aid of construction for natural gas main and service line extensions by creating a regulatory liability and amortizing pay-ments over time.
y Support utility infrastructure build-out as part of economic development programs through tax abatement, special pricing areas, direct contribu-tions, etc., to support business development, job creation, plant expansions, and customer fuel savings.
y Provide rebate programs for customers who upgrade to high-efficiency natural gas equipment.
y Eliminate taxes on the customer contribution-in-aid-of-construction for natural gas main and ser-vice line extensions.
Support Carbon Capture and Sequestration Research and Development
Studies that looked at achieving a deep reduction in CO2 emissions generally assumed that CCS for natural gas- and coal-fired generation was needed to achieve such a goal. However, a pre-condition to moving to commercialization is an expectation of a significant cost for CO2.
Direct and indirect policies to set a price for carbon emissions from fossil fuel combustion and delivery would value natural gas’s ability to provide energy with lower carbon emissions than other fossil fuels. However, if very deep reductions in carbon emissions are desired over the long run, fossil fuels, including natural gas, could play only a limited role in providing energy unless there is a means to capture and seques-ter the carbon emissions from burning fossil fuels. CCS could provide such a means.
Currently, CCS research is focused on coal although much of the research work is applicable to both natu-ral gas and coal. However, all fossil fuels would ben-efit from CCS, so CCS RD&D should be fuel neutral.83 Recent studies suggest that natural gas CCS has a lower cost of capture than coal CCS on a megawatt
83 National Energy Technology Laboratory, NGCC with CCS: Applicability of NETL’s Coal RD&D Program, January 27, 2011.
Further, the process of public notice and comment and review by the Office of Management and Budget does not always ensure neutral analysis of benefits and costs. It may not overcome natural tendencies of analysts to avoid reaching conclusions critical of policy choices of the political leadership.
Studies of the cost and benefit of proposed major regulatory or policy changes need to address the aggregate or cumulative effects of multiple regula-tions while taking into account feedback effects on all sectors of the economy. Cost-benefits studies should be developed in a transparent and creditable manner, including a possible review by an independent non-partisan agency such as the Congressional Budget Office. This would result in better and more credible information being available to both the government and the public about the impact of proposed and final rules.
Align the Long-Term Benefits and Short-Term Costs of Oil to Natural Gas Conversion Projects
There exists potential for use of natural gas to replace some portion of the 2.8 Bcf/d equivalent of U.S. distillate demand in the residential and com-mercial sectors to enhance energy security by low-ering foreign oil imports, and to reduce energy and related emissions. However, there are many obsta-cles. The first-cost burden on customers’ equipment purchases and on utilities to extend service restricts natural gas availability and limits this poten-tial. Consumers often make purchase decisions on the basis of first cost only, whereas economic and carbon-related benefits will occur over the life of gas-using equipment.
Prudent public policy would promote a better alignment of benefits and costs over the life of a con-version project, and innovative policies and regula-tory actions such as the following could help lower these barriers. To lessen the cost burden inhibiting natural gas conversions to replace distillate demand and main and service line extensions, state public utility commissions, and other government agen-cies could work with utilities to develop policies and implement innovative rate designs to improve project economics and enhance affordability for cus-tomers. Examples include:
y Lease utility-owned equipment to customers or provide similar financial mechanisms allowing the

324 prUDeNt DeVeLOpMeNt: realizing the potential of North america’s abundant Natural Gas and Oil resources
recommendations regarding advanced tech-nology for CCS:
y The federal government should work with the states, universities, and companies in the elec-tric, oil and gas, chemical, and manufacturing sectors to:
− Fund basic and applied research efforts on CCS, such as the cost of carbon
− Capture, geologic issues, and the separation of CO2 from combusted gases
− Develop some number of full-scale CCS demonstration projects on a range of technologies and applications
− Establish a legal and regulatory framework that is conducive to CCS
− Find mechanisms to support the use of anthropogenic CO2 without raising its cost to users in appropriate enhanced oil recovery applications
− Strive to be fuel, technology and sector neutral, and include a range of geologic storage options.
hour basis.84 The actual costs of capturing CO2 may be greater, however, because there is less concentra-tion of CO2 in the flue gases of natural gas genera-tion. Natural gas with CCS could have only 40% of the sequestration requirement that coal has for the same MWh of output.
To avoid unnecessarily precluding CCS options, CCS research should also be technology neutral (e.g., pre- and post-combustion capture or various capture technologies). Further, CCS research should not be limited to the power sector, but should be available to all sectors such as processing plants, refineries, and industry.
Recommendation
To keep the option open in the long run of using natural gas in a situation where deeper reductions in carbon emissions are desired or necessary, the NPC makes the following
84 AEO2011 Estimated Levelized Cost of New Electricity Genera-tion Technologies in 2016.
Description of Projection CasesaEO2011 reference CaseEIA Annual Energy Outlook 2011 focuses on the factors that shape the U.S. energy system over the long term, under the assumption that current laws and regulations remain unchanged throughout the projection. A GDP growth rate of 2.7% per year was used.
aEO2010 reference CaseEIA Annual Energy Outlook 2010 focuses on the fac-tors that shape the U.S. energy system over the long term, under the assumption that current laws and regulations then in effect remain unchanged through-out the projection. A GDP growth rate of 2.4% per year was used.
aEO2010 Low macroReal GDP grows at an average annual rate of 1.8% from 2008 to 2035, whereas the AEO2010 Reference Case used 2.4%. Other energy market assumptions are the same as in the Reference Case.
aEO2010 High macroReal GDP grows at an average annual rate of 3.0% from 2008 to 2035 whereas the AEO2010 Reference Case used 2.4%. Other energy market assumptions are the same as in the Reference Case.
aEO2010 Low Oil PriceWorld light, sweet crude oil prices are $51 per barrel (2008 dollars) in 2035, compared with $133 per barrel (2008 dollars) in the Reference Case. Other assump-tions are the same as in the Reference Case.
aEO2010 High Oil PriceWorld light, sweet crude oil prices are about $210 per barrel (2008 dollars) in 2035, compared with $133 per barrel (2008 dollars) in the Reference Case. Other assumptions are the same as in the Reference Case.
aEO2010 Low TechGreater cost and lower efficiency for more advanced equipment for all sectors and higher operating costs

Chapter 3 – NatUraL GaS DeMaND 325
aggConsultantminLowest results of proprietary consultant cases. Aggregation was done by an independent third-party aggregator.
EIa KL BasicEIA’s analysis of the Energy Market and Economic Impacts of the American Power Act of 2010 (Kerry-Lieberman). The EIA KL Basic Case represents an environment where key low-emissions technologies, including nuclear, fossil with CCS, and various renew-ables, are developed and deployed on a large scale in a time frame consistent with the emissions reduction requirements of the Act without encountering any major obstacles. It also assumes that the use of off-sets, both domestic and international, is not instan-taneous, but is also not severely constrained by cost, regulation, or the pace of negotiations with key coun-tries.
EIa KL High CostEIA KL High Cost case is similar to the EIA KL Basic case except that the overnight capital costs of nuclear, fossil with CCS (including CCS retrofit), and dedicated biomass generating technologies are assumed to be 50% higher than in the Reference Case.
EIa KL High GasEIA KL High Gas is similar to the EIA KL Basic case except that it assumes a larger resource for shale gas based on the High Shale Gas Resource sensitivity case in the AEO2010.
EIa KL NoIntl LtdaltThe EIA KL NoIntl LtdAlt case severely limits inter-national offsets and limits deployment of key tech-nologies, including nuclear, fossil with CCS, and dedicated biomass, to their Reference Case levels through 2035.
EIa Wm BasicEIA’s analysis of the American Clean Energy and Secu-rity Act of 2009 (Waxman-Markey). The EIA WM Basic represents an environment where key low-emis-sions technologies, including nuclear, fossil with CCS, and various renewables, are developed and deployed on a large scale in a time frame consistent with the emissions reduction requirements of the Act without encountering any major obstacles. It also assumes that the use of offsets, both domestic and interna-tional, is not severely constrained by cost, regulation, or the pace of negotiations with key countries cover-ing key sectors.
for fossil fuel, nuclear, and renewable generation tech-nologies.
aEO2010 High TechEarlier availability, lower cost, and greater efficiency for more advanced equipment for all sectors and lower operating costs for fossil fuel, nuclear, and renewable generation technologies.
aEO2010 No ShaleNo drilling is permitted in onshore, lower-48, low-permeability natural gas reservoirs after 2009 (i.e., no new tight gas or shale gas drilling).
aEO2010 High ShaleShale gas resources in the onshore, lower-48 are assumed to be higher than in the Reference Case.
aEO2010 2027 Phaseout with Base market PotentialIncorporates lower incremental costs for all classes of HDV NGVs (zero incremental cost relative to their diesel-powered counterparts after accounting for incentives), and tax incentives for natural gas refuel-ing stations ($100,000 per new facility), and for natu-ral gas fuel ($0.50 per gallon of gasoline equivalent) that begin in 2011 and are phased out by 2027.
aggOGmaxHighest results of proprietary oil and gas company cases. Aggregation was done by an independent third-party aggregator.
aggOGmedianMedian results of proprietary oil and gas company cases. Aggregation was done by an independent third-party aggregator.
aggOGminMinimum results of proprietary oil and gas company cases. Aggregation was done by an independent third-party aggregator.
aggConsultantmaxHighest results of proprietary consultant cases. Aggregation was done by an independent third-party aggregator.
aggConsultantmedianMedian results of proprietary consultant cases. Aggregation was done by an independent third-party aggregator.

326 prUDeNt DeVeLOpMeNt: realizing the potential of North america’s abundant Natural Gas and Oil resources
EIa Wm NoIntl LtdaltThe EIA WM NoIntl LtdAlt case severely limits inter-national offsets and limits deployment of key technol-ogies, including nuclear, fossil with CCS, and dedicated biomass, to their Reference Case levels through 2030.
mIT No Climate PolicyBase case with no climate policy from MIT’s The Future of Natural Gas: An Interdisciplinary MIT Study Interim Report 2010.
mIT With Climate PolicyWith a national economy wide price on carbon from MIT’s The Future of Natural Gas: An Interdisciplinary MIT Study Interim Report 2010.
mIT regulatory Emissions reductionsRenewable energy standard mandates 25% share of total generation by 2030 and forced retirement of coal plants equal to 55% of current coal generation is retired by 2050 from MIT’s The Future of Natural Gas: An Interdisciplinary MIT Study Interim Report 2010.
NEB BaseNational Energy Board of Canada’s 2009 Reference Case scenario.
NEB High PriceNational Energy Board of Canada’s 2009 Reference Case scenario with a high oil price.
NEB Low PriceNational Energy Board of Canada’s 2009 Reference Case scenario with a low oil price.
1992 NPC Case I1992 National Petroleum Council Study on Natural Gas, Reference Case I, assuming trend growth.
1992 NPC Case II1992 National Petroleum Council Study on Natu-ral Gas, Reference Case II, assuming low natural gas demand growth.
1999 – NPC reference1999 National Petroleum Council Study, Natural Gas: Meeting The Challenges of the Nation’s Growing Natural Gas Demand. The 1999 study was designed to test the capability of the supply and delivery systems to meet the then-public forecasts of an annual U.S. market demand for natural gas of 30+ Tcf early in this century.
2003 – NPC reactive Path2003 National Petroleum Council Study, Balancing Natural Gas Policy: Fueling the Demand of a Growing Economy, Reactive Path case.
2003 – NPC Balanced Future2003 National Petroleum Council Study, Balancing Natural Gas Policy: Fueling the Demand of a Growing Economy, Balanced Future case.
2007 – NPC Hard Truths max2007 National Petroleum Council study, Hard Truths: Facing the Hard Truths About Energy: A Comprehen-sive View to 2030 of Global Oil and Natural Gas, high demand from study of studies.
2007 – NPC Hard Truths min2007 National Petroleum Council study, Hard Truths: Facing the Hard Truths About Energy: A Comprehensive View to 2030 of Global Oil and Natural Gas, low demand from study of studies.
Proprietary maximumRepresents the highest of all of the proprietary cases that were aggregated by an independent third party (see Agg cases).
Proprietary mediumRepresents the medium of all of the proprietary cases that were aggregated by an independent third party (see Agg cases).
Proprietary minimumRepresents the lowest of all of the proprietary cases that were aggregated by an independent third party (see Agg cases).
rFF BaselineResources for the Future’s business-as-usual case using EIA AEO2009 Reference Case estimate of natu-ral gas resources (low).
rFF abundant ShaleResources for the Future’s higher natural gas resources case based on Potential Gas Committee 2009 resource estimate, not EIA AEO2009 Reference Case.
rFF Low Carbon Policy BaselineResources for the Future’s carbon policy case using EIA AEO2009 Reference Case estimate of natural gas resources (low).
rFF Low Carbon Policy With abundant ShaleResources for the Future’s carbon policy using higher Potential Gas Committee estimate of natural gas resources.
rFF Low Carbon Policy With abundant Shale, with Limits on Nuclear and renewableResources for the Future’s carbon policy using higher Potential Gas Committee estimate of natu-ral gas resources, but with limits on new nuclear and renewables.
Related Documents


