Chapter: The Nature of Science Table of Contents Section 3: Communicating with GraphsCommunicating with Graphs Section 1: The Methods of ScienceThe.
Jan 02, 2016
Welcome message from author
This document is posted to help you gain knowledge. Please leave a comment to let me know what you think about it! Share it to your friends and learn new things together.
Transcript

Chapter: The Nature of Science
Table of ContentsTable of Contents
Section 3: Communicating with Graphs
Section 1: The Methods of Science
Section 2: Standards of Measurement
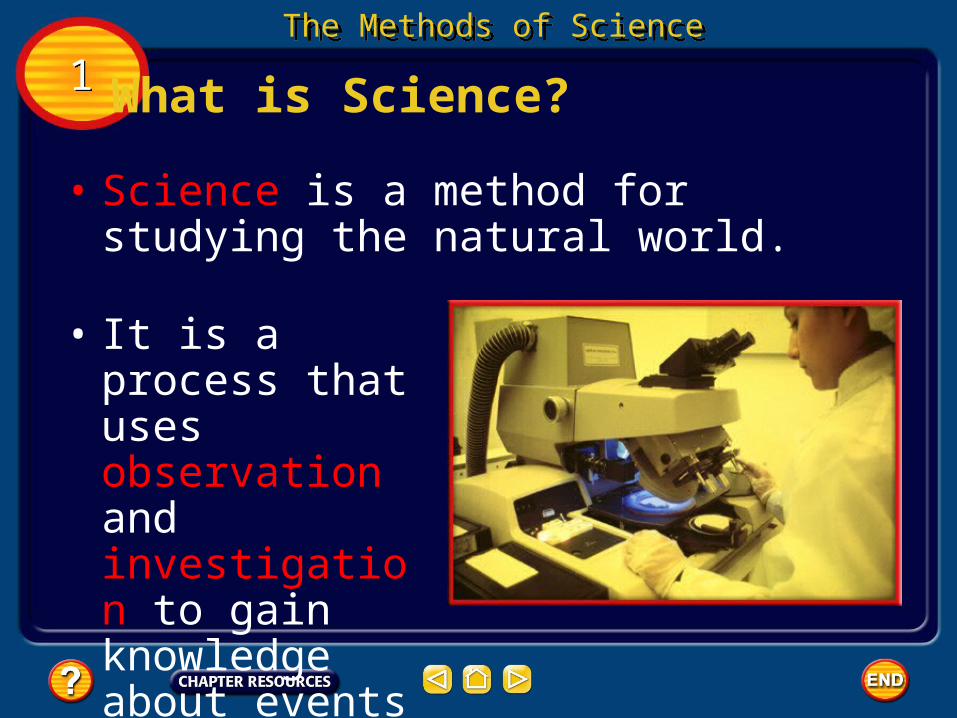
• Science is a method for studying the natural world.
• It is a process that uses observation and investigation to gain knowledge about events in nature.
What is Science? 11The Methods of ScienceThe Methods of Science
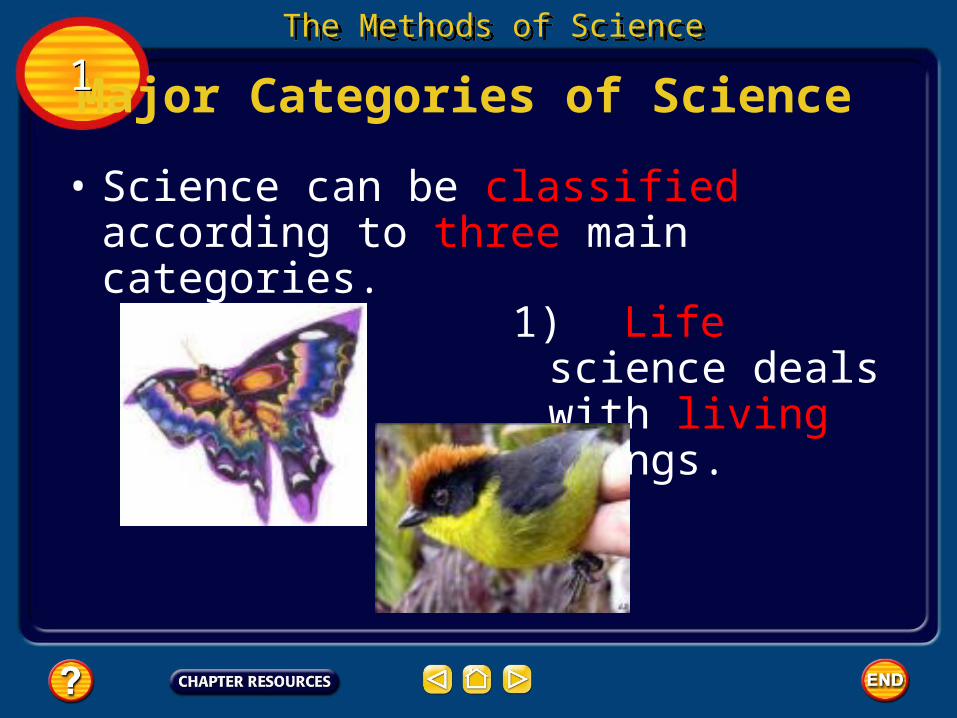
• Science can be classified according to three main categories.
Major Categories of Science
1) Life science deals with living things.
The Methods of ScienceThe Methods of Science
11

Major Categories of Science
2) Earth science investigates Earth and space.
The Methods of ScienceThe Methods of Science
11

Major Categories of Science
3) Physical science deals with matter and energy.
The Methods of ScienceThe Methods of Science
11

• Sometimes, a scientific study will overlap the categories.
Major Categories of Science
• One scientist, for example, might study the motions of the human body to understand how to build better artificial limbs.
The Methods of ScienceThe Methods of Science
11

• Scientific explanations help you understand the natural world.
Science Explains Nature
• As more is learned about the natural world, some of the earlier explanations might be found to be incomplete or new technology might provide more accurate answers.
The Methods of ScienceThe Methods of Science
11

• In the late eighteenth century, most scientists thought that heat was an invisible fluid with mass.
Science Explains Nature
• Scientists observed that heat seemed to flow like a fluid. However, the heat fluid idea did not explain everything.
The Methods of ScienceThe Methods of Science
11
Science Explains Nature
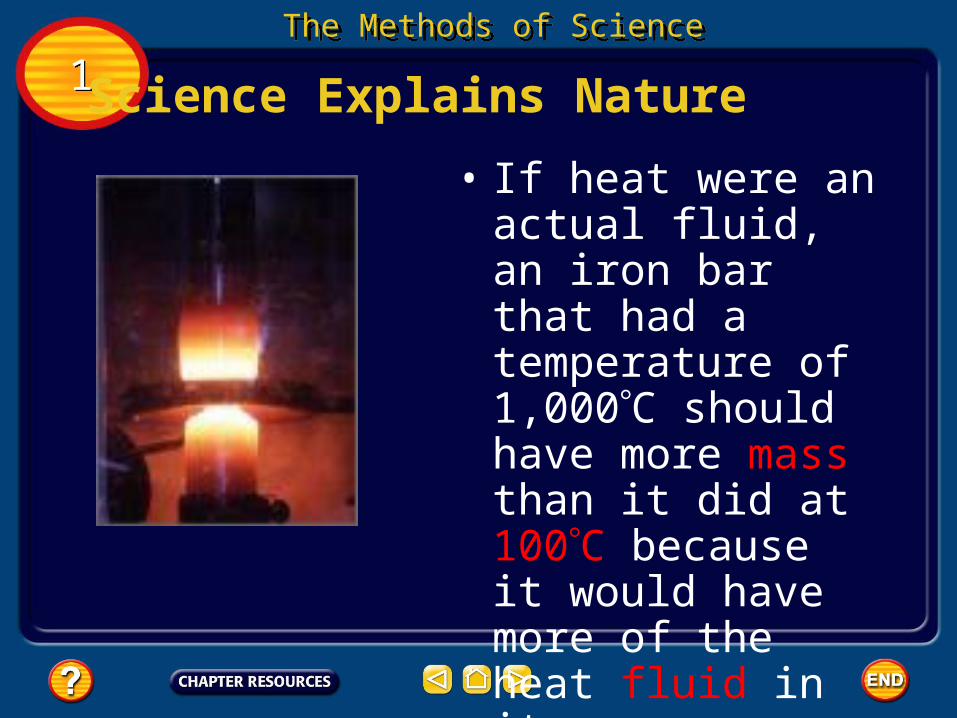
• If heat were an actual fluid, an iron bar that had a temperature of 1,000C should have more mass than it did at 100C because it would have more of the heat fluid in it.
The Methods of ScienceThe Methods of Science
11

Science Explains Nature
The Methods of ScienceThe Methods of Science
• When additional investigations showed no difference in mass, scientists had to change the explanation.
11

Investigations
The Methods of ScienceThe Methods of Science
• Scientists learn new information about the natural world by performing investigations, which can be done in many different ways.
• Some investigations involve simply observing something that occurs and recording the observations.
11

Investigations
The Methods of ScienceThe Methods of Science
• The result of these investigations can be either quantitative or qualitative.
11
Investigations
The Methods of ScienceThe Methods of Science
• If a result is quantitative, numbers have been obtained to allow the researcher to arrive at a conclusion.
11

Investigations
The Methods of ScienceThe Methods of Science
• If a result is qualitative, a quality judgment is made by the researcher.
• For example, students seem happier to have early release Fridays.
11

Scientific Methods
The Methods of ScienceThe Methods of Science
• An organized set of investigation procedures is called a scientific method.
11

The Methods of ScienceThe Methods of Science
1) Identify the Problem and form a Problem Question.
2) Form a hypothesis.
3) Perform an experiment to test this hypothesis.
4) Analyze the data.
5) Form a conclusion.
11Steps of the Scientific Method

Forming a Hypothesis
The Methods of ScienceThe Methods of Science
• A hypothesis is a possible explanation for a problem using what you know and what you observe.
11
• Some hypotheses can be tested by making observations while others can be tested by building a model and relating it to real-life situations.
Perform an experiment
The Methods of ScienceThe Methods of Science
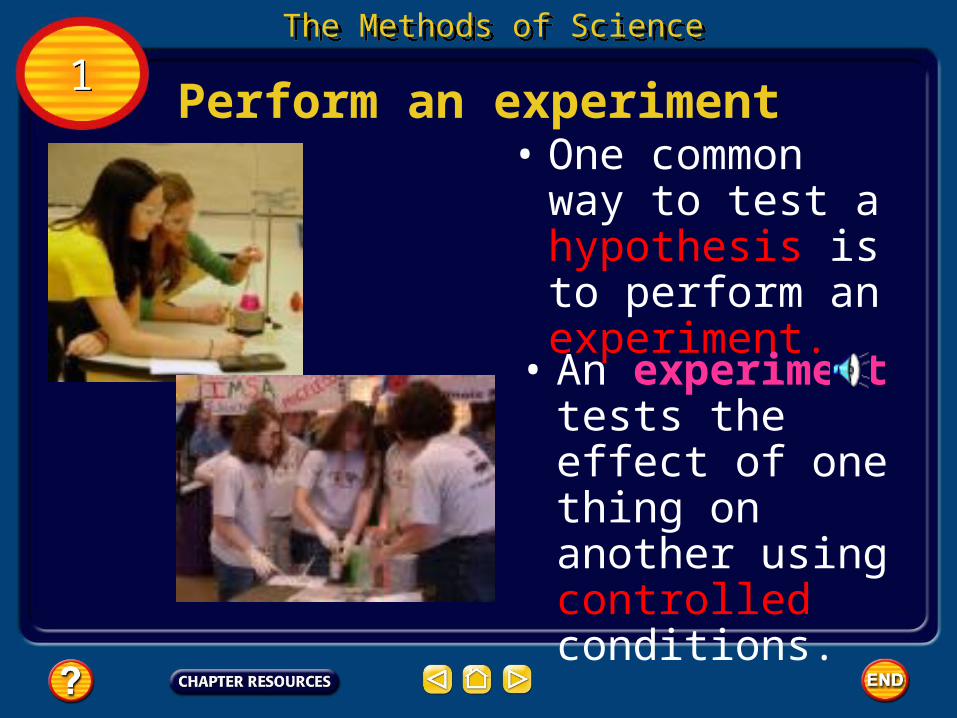
• One common way to test a hypothesis is to perform an experiment.
• An experiment tests the effect of one thing on another using controlled conditions.
11
Variables
The Methods of ScienceThe Methods of Science
• A variable is a quantity that can have more than a single value and can be classified as either independent or dependent.
11
Variables
The Methods of ScienceThe Methods of Science
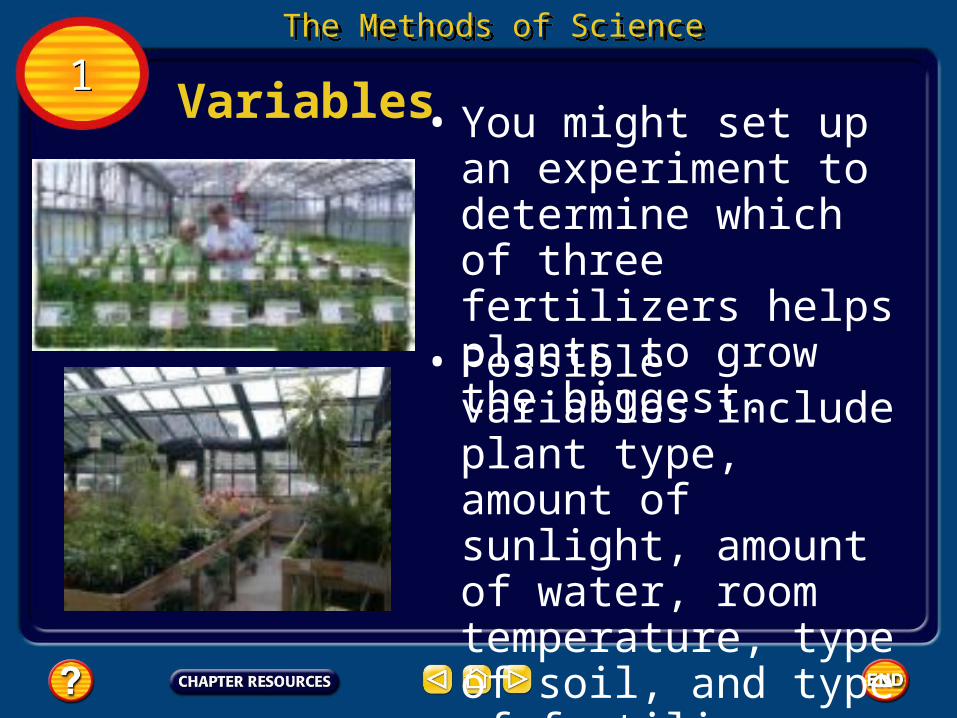
• You might set up an experiment to determine which of three fertilizers helps plants to grow the biggest.
• Possible variables include plant type, amount of sunlight, amount of water, room temperature, type of soil, and type of fertilizer.
11

Variables
The Methods of ScienceThe Methods of Science
• In this experiment, the amount of growth is the dependent variable because its value changes according to the changes in the other variables.
PlantAmount of
WaterAmount of Sun
Fertilizer Type
Height after two weeks
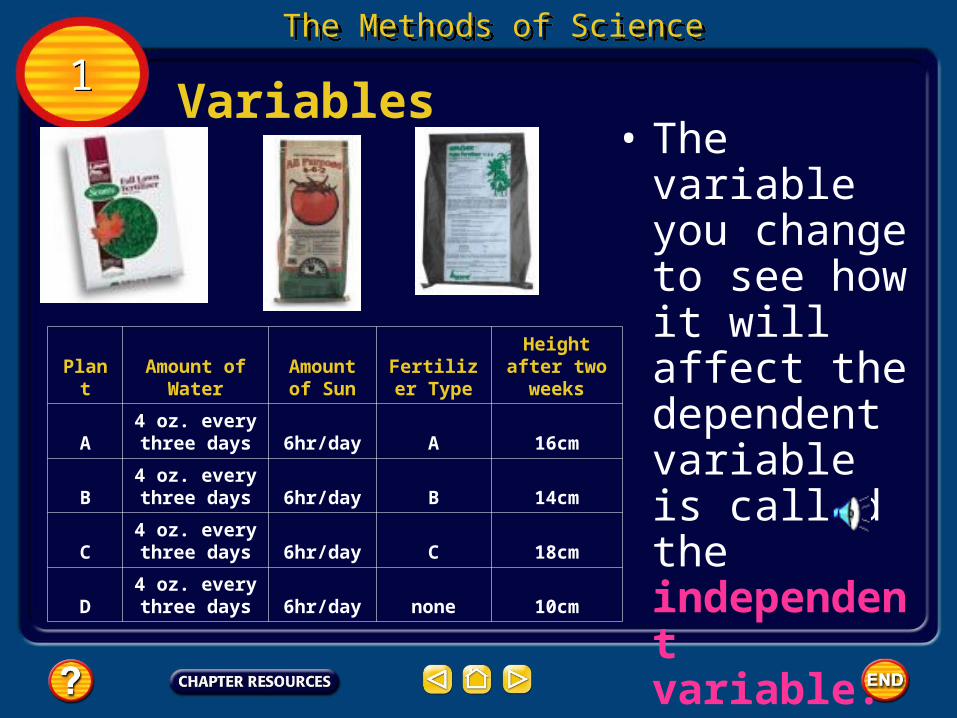
A4 oz. every three days 6hr/day A 16cm
B4 oz. every three days 6hr/day B 14cm
C4 oz. every three days 6hr/day C 18cm
D4 oz. every three days 6hr/day none 10cm
11
Variables
The Methods of ScienceThe Methods of Science
• The variable you change to see how it will affect the dependent variable is called the independent variable.
11
PlantAmount of
WaterAmount of Sun
Fertilizer Type
Height after two weeks
A4 oz. every three days 6hr/day A 16cm
B4 oz. every three days 6hr/day B 14cm
C4 oz. every three days 6hr/day C 18cm
D4 oz. every three days 6hr/day none 10cm
Constants and Controls
The Methods of ScienceThe Methods of Science
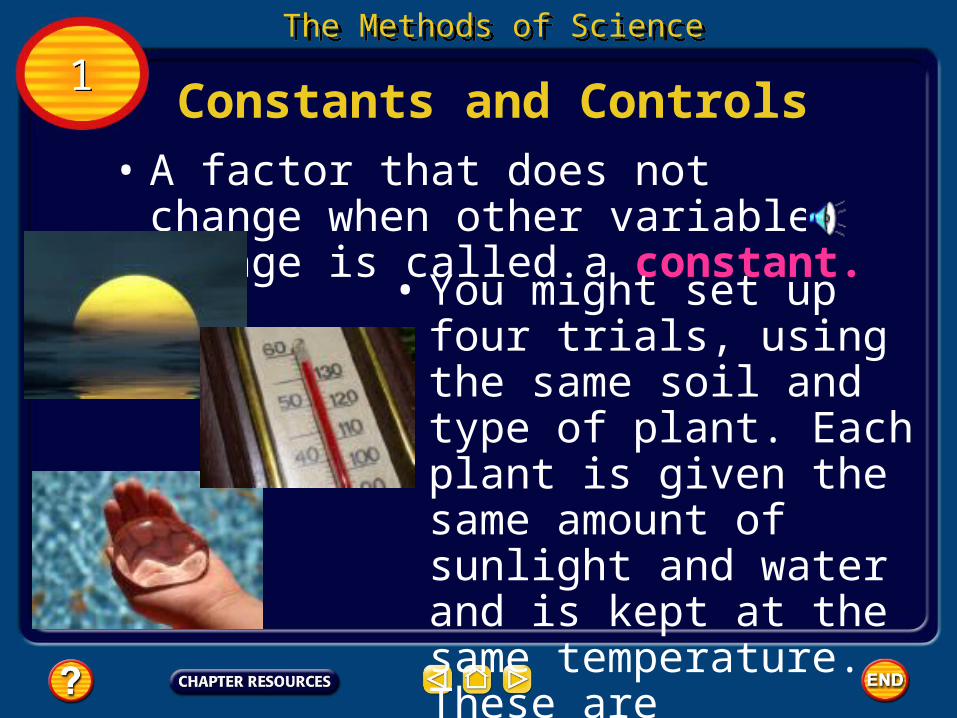
• A factor that does not change when other variables change is called a constant.
• You might set up four trials, using the same soil and type of plant. Each plant is given the same amount of sunlight and water and is kept at the same temperature. These are constants.
11

Constants and Controls
The Methods of ScienceThe Methods of Science
• The fourth plant is not fertilized.
• This plant is a control. A control is the standard by which the test results can be compared.
PlantAmount of
WaterAmount of
SunFertilizer
TypeHeight after two weeks
A4 oz. every three days 6hr/day A 16cm
B4 oz. every three days 6hr/day B 14cm
C4 oz. every three days 6hr/day C 18cm
D4 oz. every three days 6hr/day none 10cm
11

Constants and Controls
The Methods of ScienceThe Methods of Science
• If the unfertilized plant grows 1.5 cm, you might infer that the growth of the fertilized plants was due to the fertilizers.
11
PlantAmount of
WaterAmount of
SunFertilizer
TypeHeight after two weeks
A4 oz. every three days 6hr/day A 16cm
B4 oz. every three days 6hr/day B 14cm
C4 oz. every three days 6hr/day C 18cm
D4 oz. every three days 6hr/day none 10cm
Analyzing the Data
The Methods of ScienceThe Methods of Science
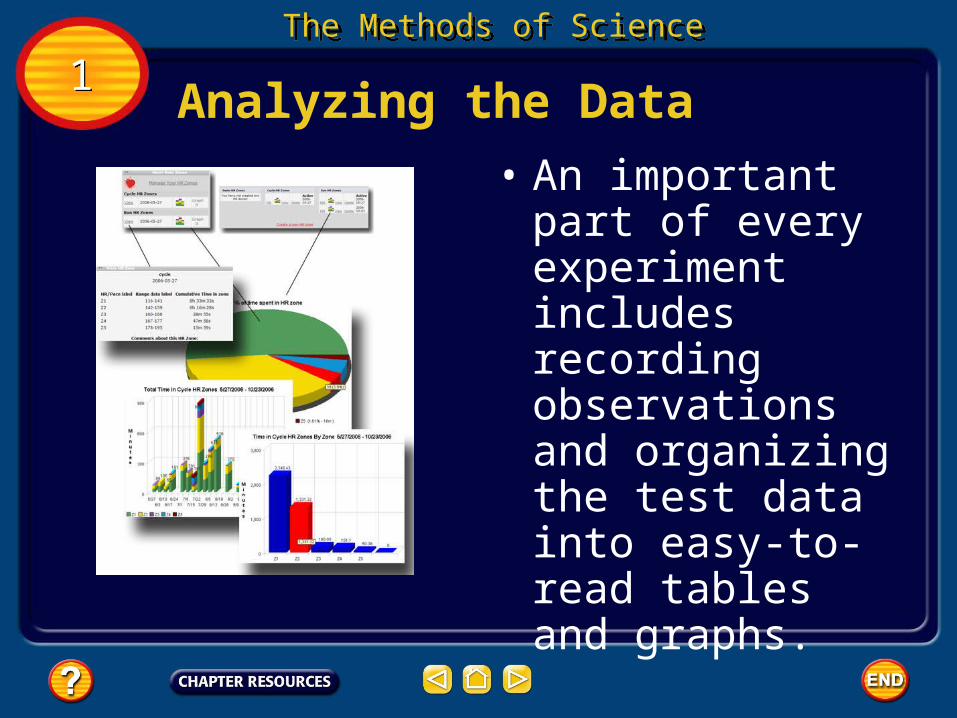
• An important part of every experiment includes recording observations and organizing the test data into easy-to-read tables and graphs.
11

Drawing Conclusions
The Methods of ScienceThe Methods of Science
• Based on the analysis of your data, you decide whether or not your hypothesis is supported.
• For the hypothesis to be considered valid and widely accepted, the experiment must result in the exact same data every time it is repeated.
11

Being Objective
The Methods of ScienceThe Methods of Science
• A bias occurs when what the scientist expects changes how the results are viewed.
• This expectation might cause a scientist to select a result from one trial over those from other trials.
11

Being Objective
The Methods of ScienceThe Methods of Science
• The experiment must be repeatable.
• Findings are supportable when other scientists perform the same experiment and get the same results.
11

Visualizing with Models
The Methods of ScienceThe Methods of Science
• Sometimes, scientists cannot see everything that they are testing.
• They might be observing something that is too large, too small, or takes too much time to see completely.
11
Visualizing with Models
The Methods of ScienceThe Methods of Science
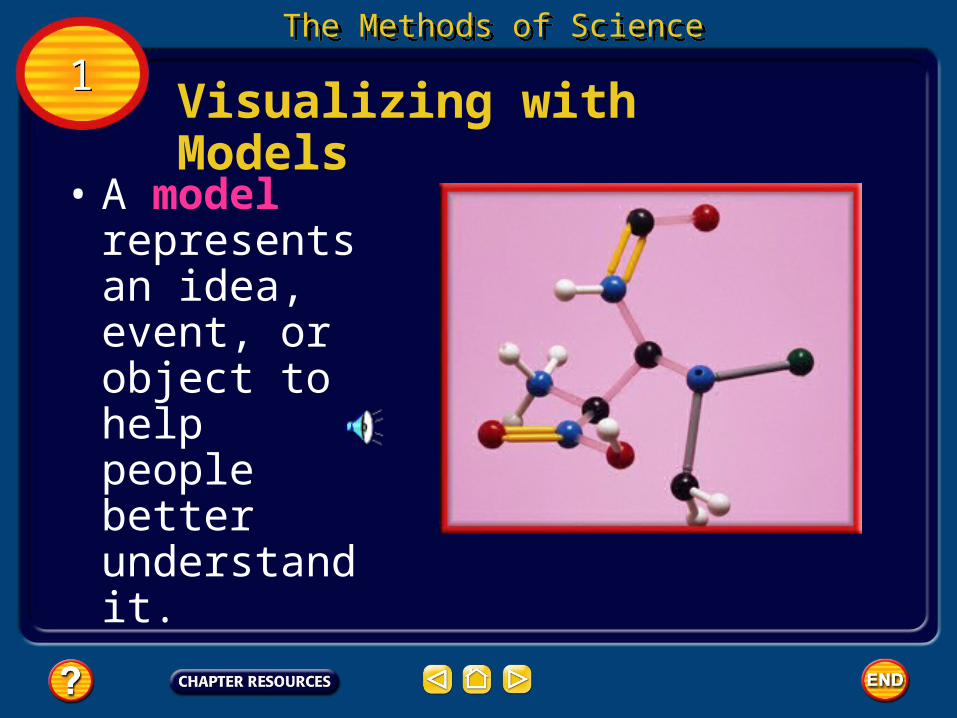
• A model represents an idea, event, or object to help people better understand it.
11

Models in History
The Methods of ScienceThe Methods of Science
• Lord Kelvin, who lived in England in the 1800s, was famous for making models.
• To model his idea of how light moves through space, he put balls into a bowl of jelly and encouraged people to move the balls around with their hands.
• Kelvin’s work to explain the nature of temperature and heat still is used today.
11

High-Tech Models
The Methods of ScienceThe Methods of Science
• Today, many scientists use computers to build models.
• NASA experiments involving space flight would not be practical without computers.
11

High-Tech Models
The Methods of ScienceThe Methods of Science
• Another type of model is a simulator.
11
• An airplane simulator enables pilots to practice problem solving with various situations and conditions they might encounter when in the air.
Scientific Theories and Laws
The Methods of ScienceThe Methods of Science
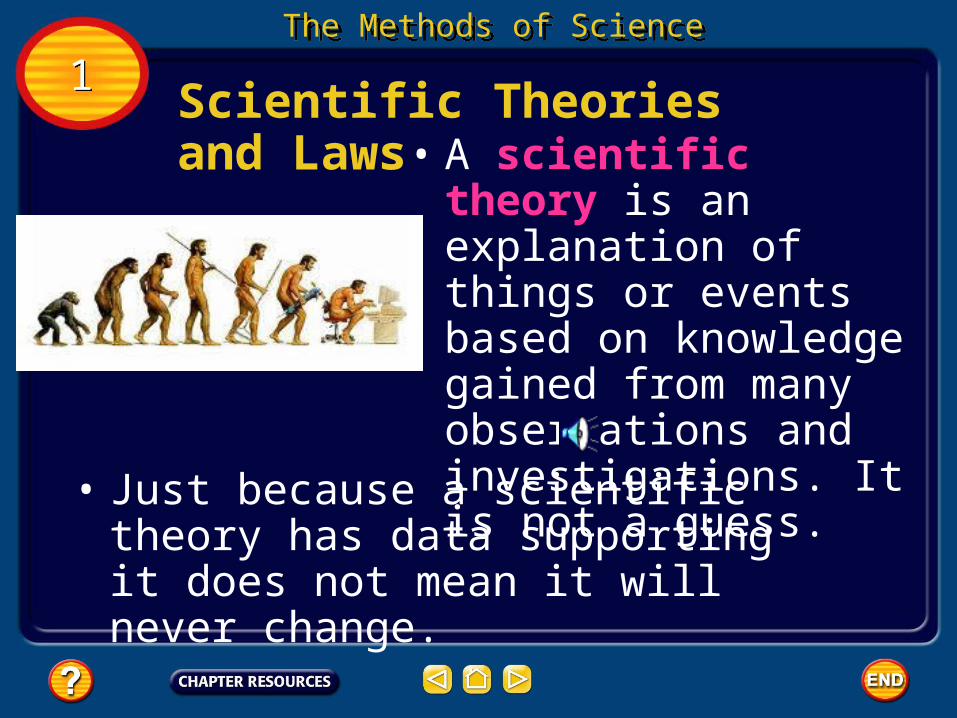
• A scientific theory is an explanation of things or events based on knowledge gained from many observations and investigations. It is not a guess.
• Just because a scientific theory has data supporting it does not mean it will never change.
11
Scientific Theories and Laws
The Methods of ScienceThe Methods of Science
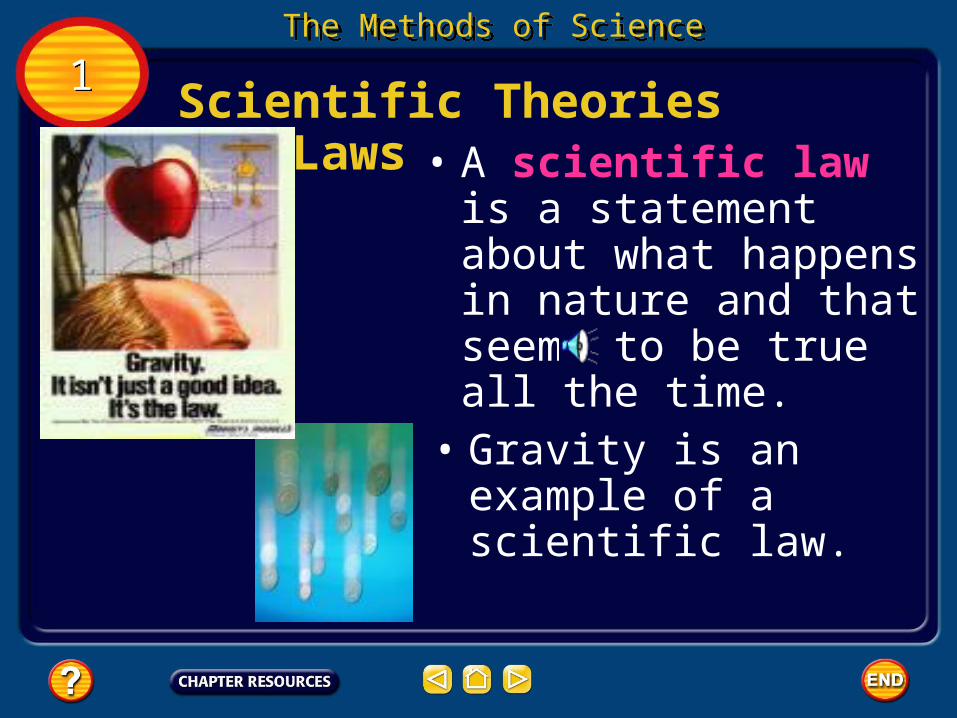
• A scientific law is a statement about what happens in nature and that seems to be true all the time.
• Gravity is an example of a scientific law.
11

Scientific Theories and Laws
The Methods of ScienceThe Methods of Science
• A theory can be used to explain a law.
• For example, many theories have been proposed to explain how the law of gravity works.
• Even so, there are few theories in science and even fewer laws.
11

Using Science—Technology
The Methods of ScienceThe Methods of Science
• Technology is the application of science to help people.
11

Using Science—Technology
The Methods of ScienceThe Methods of Science
• For example, when a chemist develops a new, lightweight material that can withstand great amounts of heat, science is used.
• When that material is used on the space shuttle, technology is applied.
11

Using Science—Technology
The Methods of ScienceThe Methods of Science
• Science and technology do not always produce positive results.
• The benefits of some technological advances, such as nuclear technology and genetic engineering, are subjects of debate.
11

Section CheckSection Check
The three main categories of science are life, earth, and physical.
What are the three main categories of science?
11Question 1
Answer

Section CheckSection Check
A common way to test a hypothesis is to perform an experiment.
11Question 2
Answer
What is a common way of testing a hypothesis?

Section CheckSection Check
A. standardB. independent variable C. experimentalD. control
Which of the following is the group in anexperiment in which all conditions are kept thesame?
11Question 3
Section CheckSection Check
The answer is D. Conditions are kept the samein the control group.
11Answer
Related Documents