CHAPTER SIX Tracking, Evaluating, and Reporting LBE Program Progress This chapter provides information on how to track, evaluate, and report on the performance of LBE programs and projects. CHAPTER SIX | Clean Energy Lead by Example Guide 161 DOCUMENT MAP CHAPTER ONE Introduction CHAPTER TWO Potential LBE Activities and Measures CHAPTER THREE Establish the LBE Program Framework CHAPTER FOUR Screen LBE Activities and Measures CHAPTER FIVE Develop LBE Program CHAPTER SIX Track, Evaluate, and Report on Progress is information is primarily intended to help states measure and improve their LBE programs and projects aſter they have been implemented. e tracking and benchmarking methods presented here can be used for other purposes, such as developing energy use base- lines to help in establishing LBE goals (see Chapter 2, Getting Started) and screening LBE activities and mea- sures to determine which are the most likely to meet LBE energy savings goals (see Chapter 4, Screening LBE Activities and Measures). An overview of the tracking, evaluating, and reporting process is summarized in Figure 6.1. e following four steps are involved: Step 1: Plan. ■ e tracking, evaluation, and reporting plan defines what will be tracked and evaluated, when to conduct the evaluation, and how to present the results to target audiences. (See Section 6.1, Step 1: Develop a Tracking, Evaluation, and Reporting Plan.) Step 2: Track and Benchmark. ■ Tracking is the process of recording and documenting the performance of key indicators (e.g., energy savings and cost savings), or changes in key indicators, associated with an LBE pro- gram or project. e benchmarking process involves comparing the energy use of a building or group of buildings with other structures with similar character- istics and/or assessing how energy use varies from a CHAPTER SIX CONTENTS Step 1: Develop a tracking, evaluating, and reporting 6.1. plan Step 2: Conduct energy and emissions tracking and 6.2. benchmarking Step 3: Conduct evaluations 6.3. Summary of tracking and evaluation approaches 6.4. Step 4: Report LBE program results 6.5. Related appendices: Appendix H, State LBE Tracking Tools and Resources. Provides information to help states identify and effectively use a variety of tracking tools, including tools for assessing building performance, emission inventory tools, energy savings tools and others. Appendix I, M&V Protocols and Guidance. Summarizes federal guidelines that are designed for determining savings from individual projects (e.g., IPMVP, FEMP M&V Guidelines, and ASHRAE Guideline 14) as well as state and utility Program M&V guidelines Appendix J, Resources for Reporting the Results of LBE Programs. Provides examples of how states have reported the results of their LBE programs and summarizes guidance on state reporting.

Welcome message from author
This document is posted to help you gain knowledge. Please leave a comment to let me know what you think about it! Share it to your friends and learn new things together.
Transcript
Chapter sIx
tracking, evaluating, and reporting lBe program progress
this chapter provides information
on how to track, evaluate, and report
on the performance of LBE programs
and projects.
Chapter Six | Clean energy Lead by example Guide 161
DO
Cu
ME
NT
MA
P Chapter one Introduction
Chapter tWo Potential LBE Activities and Measures
Chapter three Establish the LBE Program Framework
Chapter four Screen LBE Activities and Measures
Chapter fIve Develop LBE Program
Chapter sIx Track, Evaluate, and Report on Progress
This information is primarily intended to help states measure and improve their LBE programs and projects after they have been implemented. The tracking and benchmarking methods presented here can be used for other purposes, such as developing energy use base-lines to help in establishing LBE goals (see Chapter 2, Getting Started) and screening LBE activities and mea-sures to determine which are the most likely to meet LBE energy savings goals (see Chapter 4, Screening LBE Activities and Measures).
An overview of the tracking, evaluating, and reporting process is summarized in Figure 6.1. The following four steps are involved:
Step 1: Plan. ■ The tracking, evaluation, and reporting plan defines what will be tracked and evaluated, when to conduct the evaluation, and how to present the results to target audiences. (See Section 6.1, Step 1: Develop a Tracking, Evaluation, and Reporting Plan.)
Step 2: Track and Benchmark. ■ Tracking is the process of recording and documenting the performance of key indicators (e.g., energy savings and cost savings), or changes in key indicators, associated with an LBE pro-gram or project. The benchmarking process involves comparing the energy use of a building or group of buildings with other structures with similar character-istics and/or assessing how energy use varies from a
Chapter sIx Contents
Step 1: Develop a tracking, evaluating, and reporting 6.1. plan
Step 2: Conduct energy and emissions tracking and 6.2. benchmarking
Step 3: Conduct evaluations 6.3.
Summary of tracking and evaluation approaches6.4.
Step 4: Report LBE program results6.5.
related appendices:
Appendix H, State LBE Tracking Tools and Resources. Provides information to help states identify and effectively use a variety of tracking tools, including tools for assessing building performance, emission inventory tools, energy savings tools and others.
Appendix I, M&V Protocols and Guidance. Summarizes federal guidelines that are designed for determining savings from individual projects (e.g., IPMVP, FEMP M&V Guidelines, and ASHRAE Guideline 14) as well as state and utility Program M&V guidelines
Appendix J, Resources for Reporting the Results of LBE Programs. Provides examples of how states have reported the results of their LBE programs and summarizes guidance on state reporting.

baseline. (See Section 6.2, Step 2: Conduct Energy and Emissions Tracking and Benchmarking.)
Step 3: Evaluate ■ . Evaluation involves collecting and analyzing new data and using it in conjunction with in-formation gathered from the tracking and benchmark-ing process to assess the LBE program or project. (See Section 6.3, Step 3: Conduct Evaluations and Section 6.4, Summary of Tracking and Evaluation Approaches.)
Step 4: Report Progress ■ . Once an LBE program has been implemented, it is important to periodically report on the program results and use the evaluation results to to modify and improve the LBE program, as appropriate. Reports can be targeted to different audiences, includ-ing a high level executive summary for the public and political leaders, and a detailed assessment for state agency staff and others. (See Section 6.5, Step 4: Report LBE Program Results.)
Tracking LBE program and project data, conducting evaluations, and reporting results are critical to suc-cessful LBE efforts. These actions help states:
Assess the performance of the state’s LBE program and ■
projects.
Improve existing and future programs and projects. ■
Present findings and conclusions to the governor, ■
agency director, the public, and others.
The program performance metrics that states typically assess include energy savings (kWh) and cost savings. Some states also quantify and report demand sav-ings (kW),1 avoided air pollution and greenhouse gas (GHG) emissions, and other program benefits such as investment or job creation.2 Techniques for evaluating savings range from simple analyses with limited physi-cal measurements to the use of sophisticated surveys and analysis tools with real-time monitoring of energy and emissions data.
1 Demand is expressed in kW and refers to the power requirement of a system at a given time (e.g., a specific time of day), or the amount of power required to supply customers at a given time. For example, annual average demand savings are defined as total annual energy savings divided by the hours in the year. Peak demand reductions involve determining the maximum amount of demand reduction during a specified period of time (NAPEE, 2007).2 The LBE Guide focuses on the direct benefits of LBE programs, defined as energy savings (in kWH), demand savings (in kW), cost savings, and emission reductions. Additional information on how to assess these and other energy system benefits, environmental quality and related human health benefits, and economic benefits will be provided in EPA’s A Guidebook for Assessing the Multiple Benefits of Clean Energy (U.S. EPA, Forthcoming).
The remaining sections in this chapter provide guid-ance for those who are directly involved in carrying out tracking, evaluation, and reporting functions. For ad-ditional information on evaluation issues and methods, see the National Action Plan for Energy Efficiency’s Model Energy Efficiency Program Impact Evaluation Guide (NAPEE, 2007).
traCkIng anD evaluatIon termInology
Terms used for tracking and evaluation can have different meanings for different applications. Common definitions are described below.
Baseline ■ : Conditions, including energy consumption and related emissions, that would have occurred in the absence of a program or project or that existed prior to program implementation. The baseline period is also referred to as the business-as-usual (BAu), pre-implementation, or pre-installation period.
Benchmarking ■ : Establishing energy use, emissions, or generation characteristics best practices standards (e.g., miles per gallon, energy use per square foot, emissions per unit of energy consumed, percent renewables per agency) for the purposes of comparing the performance of existing operations and establishing targets for those operations. Automated benchmarking enables states to electronically upload building utility data into a performance rating system, such as ENERGY STAR. This capability allows governments to set up a system that automatically measures and tracks energy performance of all facilities, sets baselines, tracks CO2 emissions, and receives the benefits of a performance rating system with no manual data entry.
evaluation ■ : Conducting studies and activities aimed at determining the effects of a program or project. Evaluation can include any of a wide range of assessment activities associated with understanding or documenting program/project performance; assessing program -related markets and market operations; or assessing program-induced changes in energy efficiency markets, levels of demand or energy savings, and program cost-effectiveness.
Indicator ■ : A value or set of values that together or individually provide an indication of the status or direction of a project or program.
measurement and verification (m&v) ■ . Data collection, monitoring, and analysis associated with calculating gross energy and demand savings from individual sites or projects. M&V can be a subset of program impact evaluation. When M&V is used to evaluate projects as part of a program evaluation, the term EM&V can be used.
reporting period ■ : The time following implementation of a program or project during which savings are to be determined. The reporting period is also referred to as the post-implementation or post-installation period.
tracking ■ : Recording and documenting critical information or indicators that define the program and its quantitative and qualitative performance—used for baseline establishment, program management, and evaluation.
162 Clean energy Lead by example Guide | Chapter Six
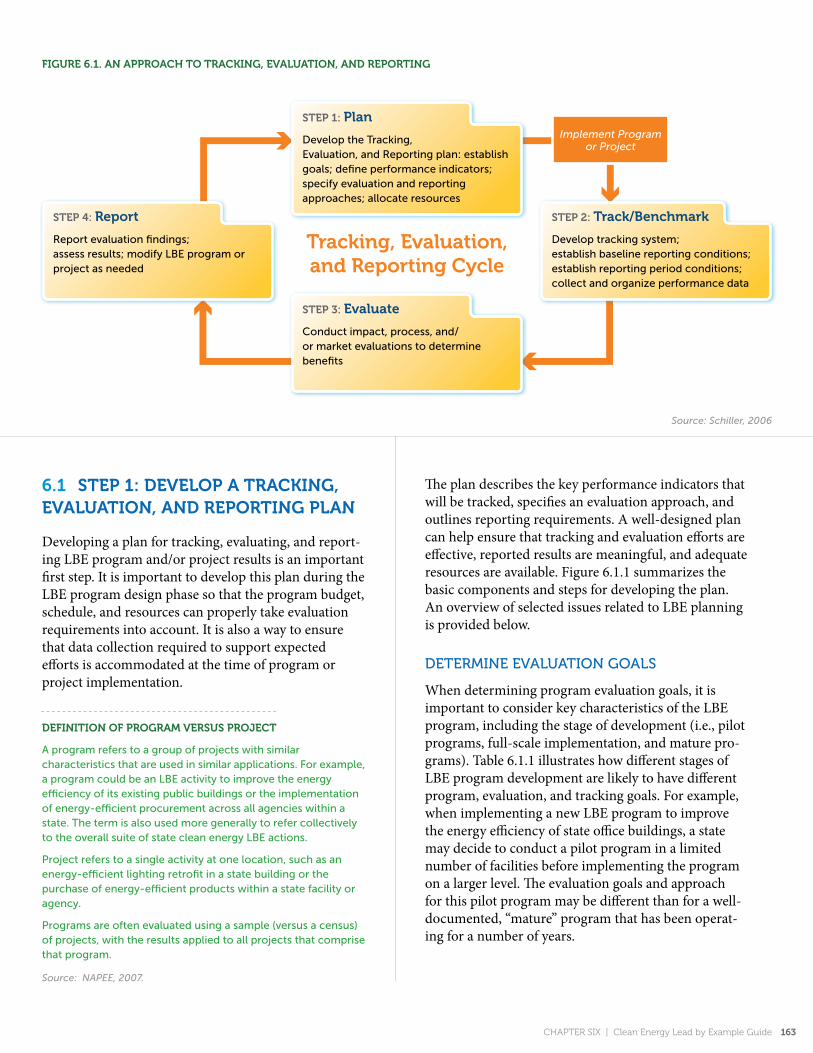
fIgure 6.1. an approaCh to traCkIng, evaluatIon, anD reportIng
6.1 step 1: Develop a traCkIng, evaluatIon, anD reportIng plan
Developing a plan for tracking, evaluating, and report-ing LBE program and/or project results is an important first step. It is important to develop this plan during the LBE program design phase so that the program budget, schedule, and resources can properly take evaluation requirements into account. It is also a way to ensure that data collection required to support expected efforts is accommodated at the time of program or project implementation.
The plan describes the key performance indicators that will be tracked, specifies an evaluation approach, and outlines reporting requirements. A well-designed plan can help ensure that tracking and evaluation efforts are effective, reported results are meaningful, and adequate resources are available. Figure 6.1.1 summarizes the basic components and steps for developing the plan. An overview of selected issues related to LBE planning is provided below.
dEtErMinE EvaLuation goaLS
When determining program evaluation goals, it is important to consider key characteristics of the LBE program, including the stage of development (i.e., pilot programs, full-scale implementation, and mature pro-grams). Table 6.1.1 illustrates how different stages of LBE program development are likely to have different program, evaluation, and tracking goals. For example, when implementing a new LBE program to improve the energy efficiency of state office buildings, a state may decide to conduct a pilot program in a limited number of facilities before implementing the program on a larger level. The evaluation goals and approach for this pilot program may be different than for a well-documented, “mature” program that has been operat-ing for a number of years.
DefInItIon of program versus proJeCt
A program refers to a group of projects with similar characteristics that are used in similar applications. For example, a program could be an LBE activity to improve the energy efficiency of its existing public buildings or the implementation of energy-efficient procurement across all agencies within a state. The term is also used more generally to refer collectively to the overall suite of state clean energy LBE actions.
Project refers to a single activity at one location, such as an energy-efficient lighting retrofit in a state building or the purchase of energy-efficient products within a state facility or agency.
Programs are often evaluated using a sample (versus a census) of projects, with the results applied to all projects that comprise that program.
Source: NAPEE, 2007.
Source: Schiller, 2006
Chapter Six | Clean energy Lead by example Guide 163
Implement Program or Project
tracking, evaluation, and reporting Cycle
step 1: plan
Develop the Tracking, Evaluation, and Reporting plan: establish goals; define performance indicators; specify evaluation and reporting approaches; allocate resources
step 3: evaluate
Conduct impact, process, and/or market evaluations to determine benefits
step 2: track/Benchmark
Develop tracking system; establish baseline reporting conditions; establish reporting period conditions; collect and organize performance data
step 4: report
Report evaluation findings; assess results; modify LBE program or project as needed
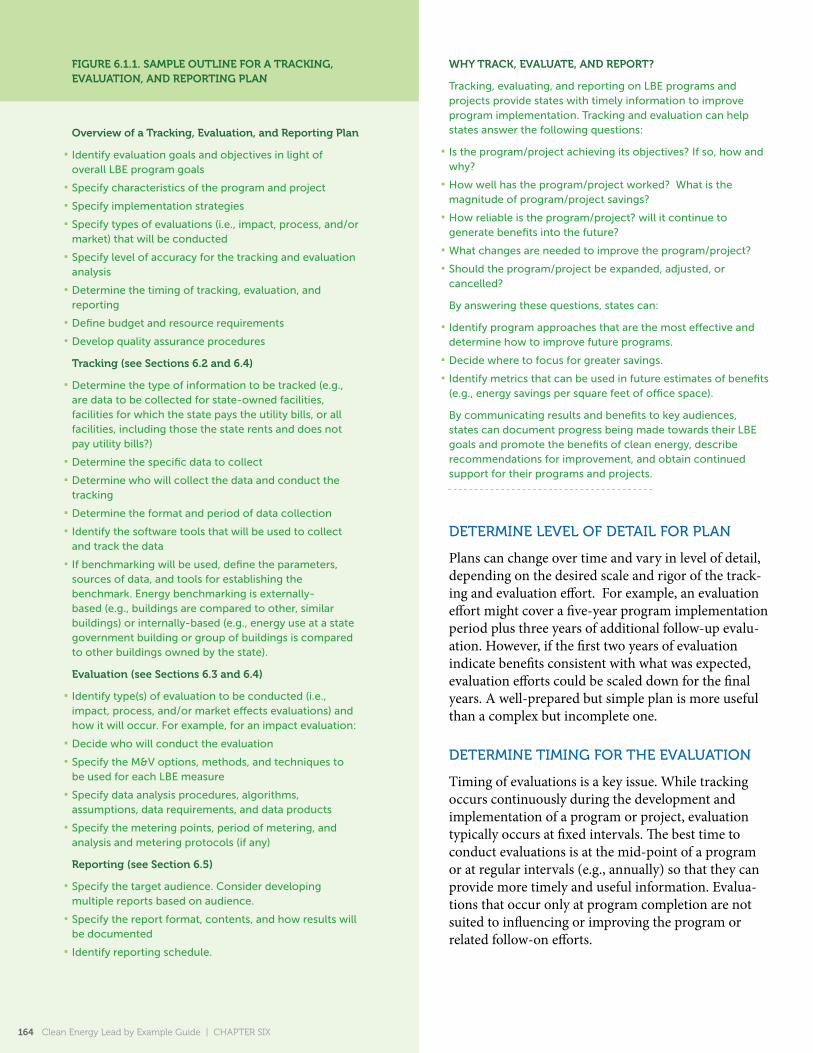
fIgure 6.1.1. sample outlIne for a traCkIng, evaluatIon, anD reportIng plan
overview of a tracking, evaluation, and reporting plan
Identify evaluation goals and objectives in light of ■
overall LBE program goals
Specify characteristics of the program and project ■
Specify implementation strategies ■
Specify types of evaluations (i.e., impact, process, and/or ■
market) that will be conducted
Specify level of accuracy for the tracking and evaluation ■
analysis
Determine the timing of tracking, evaluation, and ■
reporting
Define budget and resource requirements ■
Develop quality assurance procedures ■
tracking (see sections 6.2 and 6.4)
Determine the type of information to be tracked (e.g., ■
are data to be collected for state-owned facilities, facilities for which the state pays the utility bills, or all facilities, including those the state rents and does not pay utility bills?)
Determine the specific data to collect ■
Determine who will collect the data and conduct the ■
tracking
Determine the format and period of data collection ■
Identify the software tools that will be used to collect ■
and track the data
If benchmarking will be used, define the parameters, ■
sources of data, and tools for establishing the benchmark. Energy benchmarking is externally-based (e.g., buildings are compared to other, similar buildings) or internally-based (e.g., energy use at a state government building or group of buildings is compared to other buildings owned by the state).
evaluation (see sections 6.3 and 6.4)
Identify type(s) of evaluation to be conducted (i.e., ■
impact, process, and/or market effects evaluations) and how it will occur. For example, for an impact evaluation:
Decide who will conduct the evaluation ■
Specify the M&V options, methods, and techniques to ■
be used for each LBE measure
Specify data analysis procedures, algorithms, ■
assumptions, data requirements, and data products
Specify the metering points, period of metering, and ■
analysis and metering protocols (if any)
reporting (see section 6.5)
Specify the target audience. Consider developing ■
multiple reports based on audience.
Specify the report format, contents, and how results will ■
be documented
Identify reporting schedule. ■
Why traCk, evaluate, anD report?
Tracking, evaluating, and reporting on LBE programs and projects provide states with timely information to improve program implementation. Tracking and evaluation can help states answer the following questions:
Is the program/project achieving its objectives? If so, how and ■
why?
How well has the program/project worked? What is the ■
magnitude of program/project savings?
How reliable is the program/project? will it continue to ■
generate benefits into the future?
What changes are needed to improve the program/project? ■
Should the program/project be expanded, adjusted, or ■
cancelled?
By answering these questions, states can:
Identify program approaches that are the most effective and ■
determine how to improve future programs.
Decide where to focus for greater savings. ■
Identify metrics that can be used in future estimates of benefits ■
(e.g., energy savings per square feet of office space).
By communicating results and benefits to key audiences, states can document progress being made towards their LBE goals and promote the benefits of clean energy, describe recommendations for improvement, and obtain continued support for their programs and projects.
164 Clean energy Lead by example Guide | Chapter Six
dEtErMinE LEvEL of dEtaiL for pLan
Plans can change over time and vary in level of detail, depending on the desired scale and rigor of the track-ing and evaluation effort. For example, an evaluation effort might cover a five-year program implementation period plus three years of additional follow-up evalu-ation. However, if the first two years of evaluation indicate benefits consistent with what was expected, evaluation efforts could be scaled down for the final years. A well-prepared but simple plan is more useful than a complex but incomplete one.
dEtErMinE tiMing for thE EvaLuation
Timing of evaluations is a key issue. While tracking occurs continuously during the development and implementation of a program or project, evaluation typically occurs at fixed intervals. The best time to conduct evaluations is at the mid-point of a program or at regular intervals (e.g., annually) so that they can provide more timely and useful information. Evalua-tions that occur only at program completion are not suited to influencing or improving the program or related follow-on efforts.
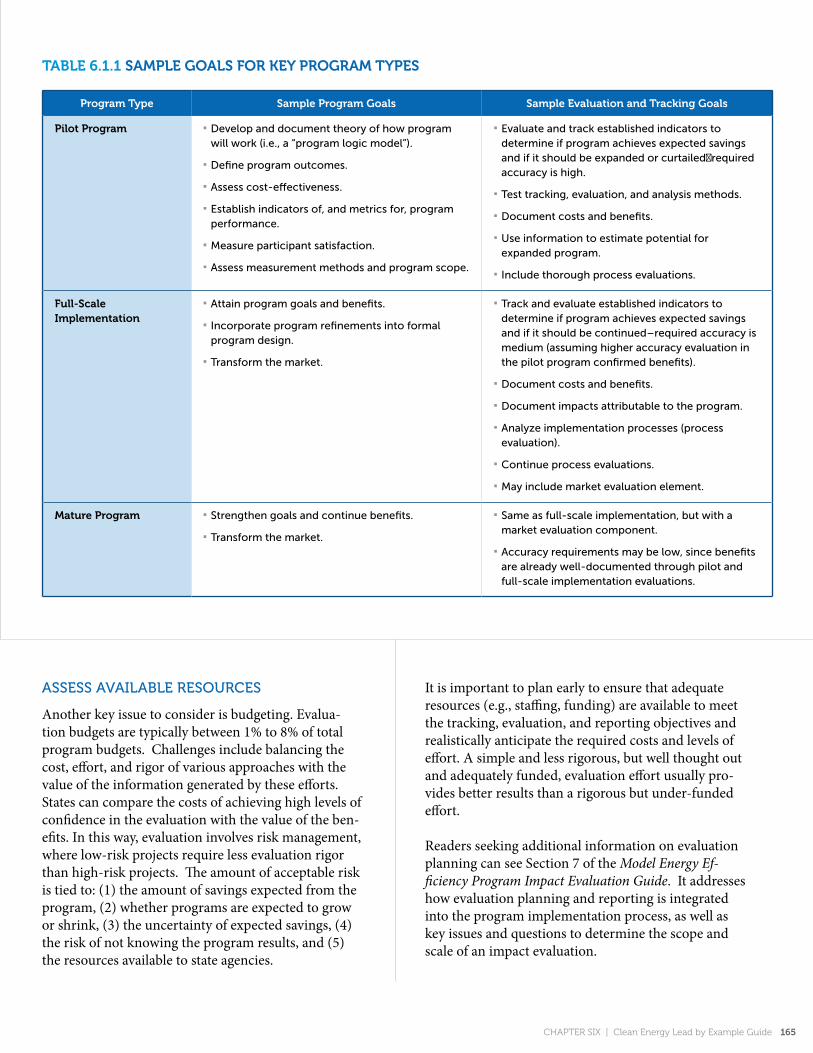
taBle 6.1.1 sample goals for key program types
program type sample program goals sample evaluation and tracking goals
pilot program Develop and document theory of how program ■
will work (i.e., a “program logic model”).
Define program outcomes. ■
Assess cost-effectiveness. ■
Establish indicators of, and metrics for, program ■
performance.
Measure participant satisfaction. ■
Assess measurement methods and program scope. ■
Evaluate and track established indicators to ■
determine if program achieves expected savings and if it should be expanded or curtailedrequired accuracy is high.
Test tracking, evaluation, and analysis methods. ■
Document costs and benefits. ■
use information to estimate potential for ■
expanded program.
Include thorough process evaluations. ■
full-scale Implementation
Attain program goals and benefits. ■
Incorporate program refinements into formal ■
program design.
Transform the market. ■
Track and evaluate established indicators to ■
determine if program achieves expected savings and if it should be continued–required accuracy is medium (assuming higher accuracy evaluation in the pilot program confirmed benefits).
Document costs and benefits. ■
Document impacts attributable to the program. ■
Analyze implementation processes (process ■
evaluation).
Continue process evaluations. ■
May include market evaluation element. ■
mature program Strengthen goals and continue benefits. ■
Transform the market. ■
Same as full-scale implementation, but with a ■
market evaluation component.
Accuracy requirements may be low, since benefits ■
are already well-documented through pilot and full-scale implementation evaluations.
Chapter Six | Clean energy Lead by example Guide 165
aSSESS avaiLaBLE rESourcES
Another key issue to consider is budgeting. Evalua-tion budgets are typically between 1% to 8% of total program budgets. Challenges include balancing the cost, effort, and rigor of various approaches with the value of the information generated by these efforts. States can compare the costs of achieving high levels of confidence in the evaluation with the value of the ben-efits. In this way, evaluation involves risk management, where low-risk projects require less evaluation rigor than high-risk projects. The amount of acceptable risk is tied to: (1) the amount of savings expected from the program, (2) whether programs are expected to grow or shrink, (3) the uncertainty of expected savings, (4) the risk of not knowing the program results, and (5) the resources available to state agencies.
It is important to plan early to ensure that adequate resources (e.g., staffing, funding) are available to meet the tracking, evaluation, and reporting objectives and realistically anticipate the required costs and levels of effort. A simple and less rigorous, but well thought out and adequately funded, evaluation effort usually pro-vides better results than a rigorous but under-funded effort.
Readers seeking additional information on evaluation planning can see Section 7 of the Model Energy Ef-ficiency Program Impact Evaluation Guide. It addresses how evaluation planning and reporting is integrated into the program implementation process, as well as key issues and questions to determine the scope and scale of an impact evaluation.
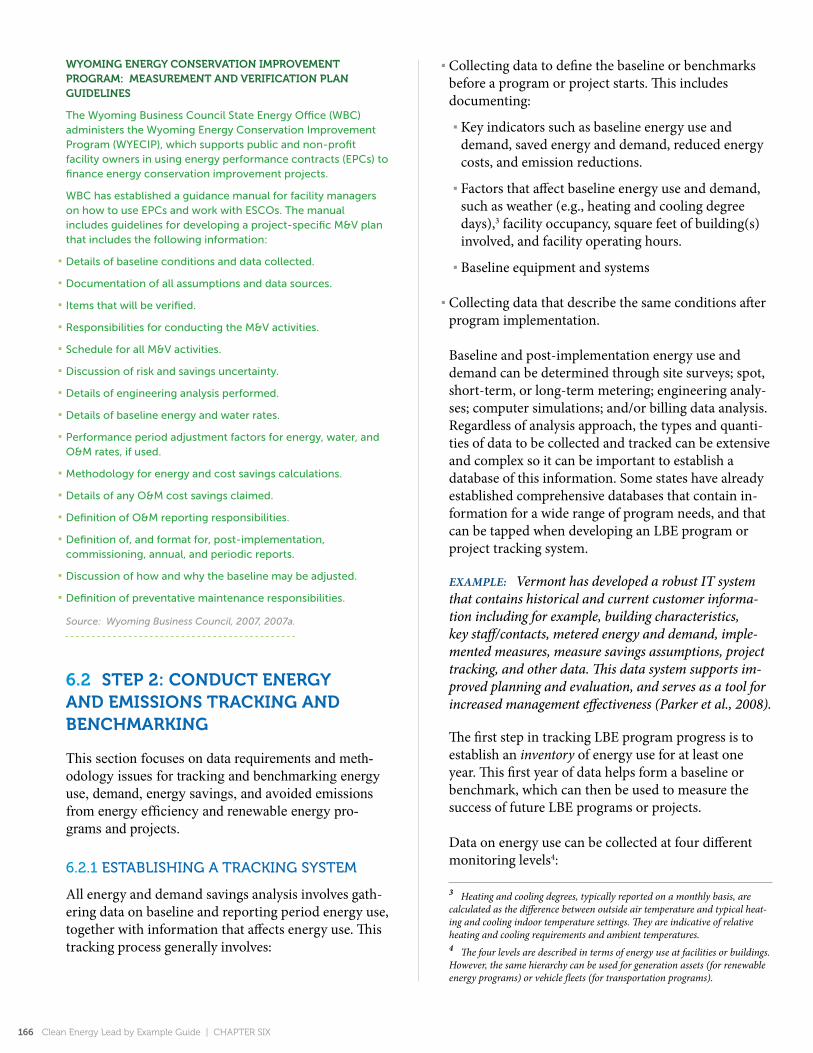
WyomIng energy ConservatIon Improvement program: measurement anD verIfICatIon plan guIDelInes
The Wyoming Business Council State Energy Office (WBC) administers the Wyoming Energy Conservation Improvement Program (WYECIP), which supports public and non-profit facility owners in using energy performance contracts (EPCs) to finance energy conservation improvement projects.
WBC has established a guidance manual for facility managers on how to use EPCs and work with ESCOs. The manual includes guidelines for developing a project-specific M&V plan that includes the following information:
Details of baseline conditions and data collected. ■
Documentation of all assumptions and data sources. ■
Items that will be verified. ■
Responsibilities for conducting the M&V activities. ■
Schedule for all M&V activities. ■
Discussion of risk and savings uncertainty. ■
Details of engineering analysis performed. ■
Details of baseline energy and water rates. ■
Performance period adjustment factors for energy, water, and ■
O&M rates, if used.
Methodology for energy and cost savings calculations. ■
Details of any O&M cost savings claimed. ■
Definition of O&M reporting responsibilities. ■
Definition of, and format for, post-implementation, ■
commissioning, annual, and periodic reports.
Discussion of how and why the baseline may be adjusted. ■
Definition of preventative maintenance responsibilities. ■
Source: Wyoming Business Council, 2007, 2007a.
166 Clean energy Lead by example Guide | Chapter Six
6.2 step 2: ConDuCt energy anD emIssIons traCkIng anD BenChmarkIng
This section focuses on data requirements and meth-odology issues for tracking and benchmarking energy use, demand, energy savings, and avoided emissions from energy efficiency and renewable energy pro-grams and projects.
6.2.1 EStaBLiShing a tracKing SyStEM
All energy and demand savings analysis involves gath-ering data on baseline and reporting period energy use, together with information that affects energy use. This tracking process generally involves:
Collecting data to define the baseline or benchmarks ■
before a program or project starts. This includes documenting:
Key indicators such as baseline energy use and ■
demand, saved energy and demand, reduced energy costs, and emission reductions.
Factors that affect baseline energy use and demand, ■
such as weather (e.g., heating and cooling degree days),3 facility occupancy, square feet of building(s) involved, and facility operating hours.
Baseline equipment and systems ■
Collecting data that describe the same conditions after ■
program implementation.
Baseline and post-implementation energy use and demand can be determined through site surveys; spot, short-term, or long-term metering; engineering analy-ses; computer simulations; and/or billing data analysis. Regardless of analysis approach, the types and quanti-ties of data to be collected and tracked can be extensive and complex so it can be important to establish a database of this information. Some states have already established comprehensive databases that contain in-formation for a wide range of program needs, and that can be tapped when developing an LBE program or project tracking system.
ExamplE: Vermont has developed a robust IT system that contains historical and current customer informa-tion including for example, building characteristics, key staff/contacts, metered energy and demand, imple-mented measures, measure savings assumptions, project tracking, and other data. This data system supports im-proved planning and evaluation, and serves as a tool for increased management effectiveness (Parker et al., 2008).
The first step in tracking LBE program progress is to establish an inventory of energy use for at least one year. This first year of data helps form a baseline or benchmark, which can then be used to measure the success of future LBE programs or projects.
Data on energy use can be collected at four different monitoring levels4:
3 Heating and cooling degrees, typically reported on a monthly basis, are calculated as the difference between outside air temperature and typical heat-ing and cooling indoor temperature settings. They are indicative of relative heating and cooling requirements and ambient temperatures.4 The four levels are described in terms of energy use at facilities or buildings. However, the same hierarchy can be used for generation assets (for renewable energy programs) or vehicle fleets (for transportation programs).

State Level: ■ State authorities gather information on energy consumption for all government agencies. Typi-cally, one state agency (e.g., the real estate/facilities or energy/environmental agency) takes the lead, setting up a reporting template and aggregating the data.
State Agency Level: ■ Facility managers collect the infor-mation necessary to monitor energy consumption for all facilities owned or leased by their agency.
Facility Level: ■ Agencies owning or leasing multiple buildings can collect data for each facility. This level is particularly suited for benchmarking, and captures the interactive effects of a particular project (e.g., en-ergy efficient lighting typically gives off less heat than conventional systems and may result in an increase in heating loads in winter). However, complications can occur if an agency does not pay for utilities in one or more of its rented facilities and/or rents space in a building without submeters.
Project Level: ■ Within facilities, it is possible to measure energy consumption by end use (e.g., lighting, cooling, ventilation, space heating, and appliances) to evalu-ate the impact of specific energy efficiency measures. While this level of monitoring requires project-specific evaluation processes, it yields more detailed, end-use level information about savings, cost-effectiveness, and savings potential, thereby helping states prioritize across individual strategies and measures. However, end-use level monitoring does not capture the interac-tive effects of whole building analysis.
The information to collect depends on the desired level of detail and type of system or software used. States collecting data on energy use and/or costs by for all government-owned facilities can follow one of two key approaches (both of which can be conducted by consultants or internal staff):
Collecting energy provider invoices and utility billings ■
that are paid by each state agency
Sending an energy consumption questionnaire to each ■
state agency.
While the first method is typically faster, the second method has the advantage of transferring more re-sponsibility to the state agency level, requiring them to collect and track their own energy consumption data.
Once energy consumption (and/or demand) informa-tion is gathered, states can use commercially available
energy accounting software to construct a database to store and display the data by multiple criteria, such as consumption by fuel type, by building or vehicle type, or by agency. Management of energy bills can also be subcontracted to private service and product providers (SPPs) that help organize and assess agency energy consumption, including organizing data into a data-base. These firms assess this information to provide the state with detailed information on energy costs and use, enabling identification of cost saving opportuni-ties, better management, and improved efficiency. A list of SPPs is provided in Appendix H, State LBE Tracking Tools and Resources.
massaChusetts’ Data ColleCtIon approaCh: energy anD Co2 Inventory
Massachusetts established an Energy and CO2 Inventory for FY 2002 for all state agencies. Fuel consumption data were gathered and analyzed to determine total government CO2 emissions, individual agency emissions, emissions from each fuel type, and emissions categorized by end-use function (i.e., buildings and transportation).
For fuel oil, gasoline, diesel, ethanol, compressed natural gas (CNG), and propane, data were collected centrally from purchasing records and vendor reports from state contracts. This was accomplished with the cooperation of the Operational Services Division, the state’s central purchasing agency. Electricity and natural gas data were more difficult to obtain, since statewide contracts for these energy types were not in place. When consumption data were not available, the procurement records of cost data from the state accounting system were used to estimate consumption for those agencies. The state is working to obtain more accurate agency-by-agency natural gas and electricity consumption data in the future.
Source: Massachusetts, 2004.
georgIa’s energy traCkIng system
The Georgia Environmental Facilities Authority issued an RFP to develop an energy accounting system to track and analyze energy consumption and costs for all state facilities. The goal is to secure an in-house system that enables the state to accurately report its energy consumption and identify, initiate, and manage facility-specific or agency-wide cost savings strategies. The system will enable benchmarking of buildings against similar buildings using the EPA Portfolio Manager tool. It will also feature the ability to:
Create groups of similar facilities (e.g., prisons, office buildings, dorms)
Compare facilities (within a group and between groups) according to criteria such as cost per kWh, cost per therm, energy expenditure per square foot, energy expenditure per occupant, and energy use per square foot per degree day basis.
Sources: Georgia, 2006a, 2006b, 2006c.
Chapter Six | Clean energy Lead by example Guide 167
Another option for states and municipalities is to track energy use and conduct building energy benchmarking using EPA’s Portfolio Manager tool, which rates facility performance relative to similar buildings nationwide based on EPA’s national energy performance rating system. Benchmarking enables states to rank their individual facilities on energy performance and to compare each facility with other buildings (and to it-self) over time. EPA has worked with SPPs to integrate the ENERGY STAR energy performance rating system into their efficiency assessments in order to directly calculate the ENERGY STAR score for eligible building types.5 By using Portfolio Manager, SPPs can apply the energy performance rating system without duplicating data entry efforts (see Section 6.2.3, Benchmarking and Assessing Potential Energy Savings for more informa-tion about benchmarking and Portfolio Manager).
Tracking total energy consumption and demand requires collecting information on all forms of energy,
5 The energy performance rating (measured from 1 to 100) indicates the percentile rank of the buildings compared to similar buildings nationwide. The rating system accounts for the impacts of year-to-year weather variations, building size, location, and several operating characteristics. Buildings with ratings of 75 or greater may qualify for the ENERGY STAR label.
including electricity, natural gas, propane, fuel oil, and gasoline. To assess energy use, states also distinguish between the energy consumed for building operation and the energy used for transportation. This distinction enables states to construct indicators related to energy use, such as building energy consumption and demand per square foot, and vehicle fuel use per mile.
To compare energy consumption data and accurately estimate energy and demand savings, states often account for the quantity of upstream energy that is consumed to produce the electricity consumed onsite. In this case, it is important to distinguish between site energy, which includes only the amount of energy con-sumed at the facility, and source energy, which includes the site energy plus the energy required to generate, transmit, and distribute electricity to a site (e.g., a building). Source energy can be a better measure than site energy for comparing total building energy use across fuel types since it enables a complete assessment of the impacts of clean energy in a building, including the associated environmental and economic impacts.6 EPA’s Portfolio Manager tool rates energy performance based on source energy.
If the electricity is purchased from the grid, site energy is converted to its source equivalent using standard site-source energy conversion factors such as those shown in Table 6.2.1. As illustrated in the table, for electricity use, the source energy consumed annu-ally by a building is about three times the site energy consumed annually by that building. Because the con-version factors are based on the national average, it is preferable to use more accurate state- or region-specific factors, which may be available from utilities, energy service providers, or state energy or public utility agen-cies (U.S. EPA, 2007a, 2007b).
6 EPA’s Portfolio Manager energy performance rating system is based on source energy (U.S. EPA, 2007).
energy aCCountIng
Energy accounting is the term used to describe the process of tracking energy consumption and costs on a regular basis.
CEC’s handbook, Energy Accounting: A Key Tool in Managing Energy Costs, provides background information about energy accounting, and describes energy accounting methodologies. Information on commercially available energy accounting software packages is also provided.
Source: CEC, 2000.
traCkIng reneWaBle energy ConsumptIon
Renewable energy can replace conventional energy sources through the installation of on-site renewable energy devices. For example, the installation of solar panels or solar hot water heaters results in reduced energy consumption from traditional providers. Consumption of on-site renewable energy is frequently accounted for separately and is treated as “direct” energy savings rather than being included in total energy consumption.
The CEC and the Western Governors’ Association is developing a renewable energy tracking system, the Western Renewable Energy Generation Information System (WREGIS), to track and account for renewable energy generation and registering RECs (CEC, 2006).
Information on WREGIS is at: http://www.energy.ca.gov/portfolio/wregis/index.html.
taBle 6.2.1 sIte anD sourCe energy ConversIon faCtorsa
fuel type site source
electricity 1 3.340
steam 1 1.45
a national averages do not account for regional electricity generation differences.
Source: U.S. EPA, 2007a.
168 Clean energy Lead by example Guide | Chapter Six
6.2.2 tracKing air EMiSSionS
Emissions from electricity generation and fuel combus-tion include criteria air pollutants and GHGs. Criteria air pollutants include the six most common air pol-lutants in the United States: carbon monoxide, lead, nitrogen dioxide, ozone, particulate matter, and sulfur dioxide. The primary GHG is CO2, although states also track other GHGs with high global warming potential, such as methane.
Air emissions are categorized as either direct or indi-rect. Direct emissions occur at the site being evaluated (e.g., from fuel combustion in boilers or gasoline used in a truck). Indirect emissions occur off-site (e.g., in a power plant that generates the electricity used in a facility). Indirect emissions are typically accounted
for through inventories of energy-using systems and equipment. GHG accounting standards, such as the DOE’s 1605b program (U.S. DOE, 2007) and the California Climate Action Registry (California Climate Action Registry, 2007) protocols provide methods for these calculations.
Once an energy use inventory has been constructed, it is possible to calculate emissions resulting from energy consumption by using emissions factors, which are expressed in units of emissions per unit of energy consumed or per volume consumed (e.g., pounds of NOx per kWh produced, pounds of CO per thousand gallons of gasoline consumed). Table 6.2.2 describes databases and tools for identifying emission factors and tracking air emissions.
taBle 6.2.2. tools anD resourCes for traCkIng aIr emIssIons anD IDentIfyIng emIssIon faCtors
portfolio manager: In addition to track-ing and benchmarking the energy use of facilities, Portfolio Manager uses EGrid, a comprehensive data source on the environ-mental characteristics of all domestic elec-tric power generation, to provide estimated carbon emissions for facilities based on their energy consumption.
emissions & generation resource Integrat-ed Database (egrID): This EPA tool provides a comprehensive data source on the envi-ronmental characteristics of all domestic electric power generation. It contains de-fault emission factors at varying levels of de-tail, including by generating company, state, North American Electric Reliability Council (NERC) region, and u.S. average. It provides numerous search options, including by indi-vidual power plants, generating companies, states, and regions of the power grid. The current version contains u.S. power plant emission totals for 1996 through 2000, and 2002 through 2004. Web site: http://www.epa.gov/cleanenergy/egrid/index.htm
model energy efficiency program Impact evaluation guide – Chapter 6, Calculating avoided air emissions: A resource of the Na-tional Action Plan for Energy Efficiency, this chapter describes two general approaches
for determining avoided air emissions: emis-sion factor and scenario analysis approaches. It presents several methods for calculating both direct onsite avoided emissions and re-ductions from grid-connected electric gen-erating units and describes considerations for selecting a calculation approach. Web site: http://www.epa.gov/cleanenergy/docu-ments/evaluation_guide.pdf
power profiler tool: This is a Web-based tool that generates reports on the air emis-sions rates of electricity consumption by ZIP code. Web site: www.epa.gov/cleanenergy/powerprofiler.htm
epa emission Inventory Improvement pro-gram (eIIp): The EIIP is sponsored jointly by EPA and the National Association of Clean Air Agencies (NACAA). It provides guidance on how to conduct emissions inventories and can be used as a reference for method-ological issues. Web site: http://www.epa.gov/ttn/chief/eiip/
ghg protocol: The World Resources In-stitute and the World Business Council for Sustainable Development (WRI/WBCSD) developed internationally-recognized GHG accounting standards and corresponding tools for developing local GHG invento-ries. The EPA Climate Leaders Program also provides guidance for developing local inventories based on the WRI/WBCSD pro-tocol. Web sites: http://www.ghgprotocol.org and http://www.epa.gov/climateleaders/resources/index.html
Chapter Six | Clean energy Lead by example Guide 169
Clean air and Climate protection (CaCp) software: This Windows-based software tool helps state and local governments develop GHG and criteria air pollutant emis-sions inventories and strategies to reduce GHG and air pollution emissions. It allows the user to create a cross-sector emissions inventory, including building, transport, and waste management sectors, and helps quantify the emissions reduction of existing and proposed measures. Web site: http://www.cacpsoftware.org/
Combined heat and power emissions Cal-culator: This tool compares the anticipated carbon, CO2, SO2, and NOx emissions from a CHP system to the emissions from a num-ber of systems using separate heat and pow-er, and calculates the emissions reductions achieved by the CHP system. It also presents the carbon equivalency of these emissions reductions in terms of acres of trees planted and number of cars removed from the road. Web site: www.epa.gov/chp
(Additional resources are available in Ap-pendix H, State LBE Tracking Tools and Resources.)
6.2.3 BEnchMarKing
Once a baseline description of energy consumption, demand, energy costs, and/or air emissions has been developed, states can use this information to identify potential energy savings from LBE programs and projects, set targets to reduce energy consumption, prioritize LBE projects, and track progress over time. One way to gauge the efficiency of energy use is to compare, or benchmark, an LBE project with similar projects. States can conduct the following types of benchmarking:
External Benchmarking. ■ External benchmarking in-volves comparing the building(s) being evaluated with other, similar buildings (e.g., other office buildings or K-12 schools). In addition to helping states track performance against similar facilities, the results can be used to compare energy performance against a national performance rating, identify best practices for improv-ing buildings performance, increase understanding of how to analyze and evaluate energy performance, and identify high-performing buildings. States can use the ENERGY, STAR Portfolio Manager tool, described in more detail on in the text box at right, to conduct this benchmark comparison for select building types. Portfolio Manager normalizes for weather and other buildings and operational characteristics, and provides a benchmark score on a scale of 1-100. Portfolio Man-ager data are based on a national Commercial Building Energy Consumption Survey (CBECS) survey con-ducted every four years by the Department of Energy’s Energy Information Administration, which includes data on building characteristics and energy use from thousands of buildings across the United States. (U.S. EPA, 2008; U.S. EPA, 2008a).
Internal Benchmarking. ■ With internal benchmark-ing, states can compare the energy use and demand (e.g., building efficiency), energy generation (e.g., via clean power), or emissions for the building or port-folio of buildings that they are evaluating with other state-owned or leased buildings. Energy performance benchmarks are typically defined in terms of energy use and/or demand per square foot, and can be as simple as the average energy consumption per square foot of all the state’s buildings. This comparison enables states to identify buildings with the greatest potential for improvement, establish best practices that can be replicated in other state-owned or leased facilities, and to track performance over time, States that commit to a 10% improvement in energy efficiency – regard-less of their starting levels of efficiency – can receive
assistance and recognition under the ENERGY STAR Challenge. (U.S. EPA, 2008; U.S. EPA, 2008a).
Energy Utilization Indices. ■ States can also conduct benchmarking based on developing their own bench-mark metrics (e.g., the energy use performance of fa-cilities in the top percentile of the existing state facility stock). For example, states can use energy accounting to develop information on performance or energy utiliza-tion indices (EUIs) for all buildings of interest based on such factors as building type (e.g., office buildings, hos-pitals, prisons), size (e.g., less than 10,000 square feet, between 10,000 and 100,000 square feet, and greater than 100,000 square feet), or vintage (e.g., pre-1960, be-tween 1960 and 1990, and newer than 1990). The state
portfolIo manager anD automateD BenChmarkIng
EPA’s Portfolio Manager is an on-line, interactive, software tool that allows the user to monitor and manage energy data. It uses basic building data (e.g., size, type, and annual energy use) to calculate energy performance compared to similar buildings nationwide. States can use this rating to determine whether a building has a high, low, or typical energy-use intensity compared to other buildings.
Data can be entered for individual or groups of buildings. Buildings can be grouped by various criteria, including by agency and by building manager. Portfolio Manager includes an easy-to-read facility summary page that provides detailed information for each building entered. The software also tracks changes in energy intensity (e.g., energy per square foot) over time.
To minimize the data entry associated with Portfolio Manager, a data transfer technique called automated benchmarking has recently been developed. This user-friendly capability uploads building utility bills directly into Portfolio Manager. This allows governments to set up a system that automatically measures and tracks energy performance of all facilities, sets baselines, and estimates CO2 emissions, with no manual data entry. EPA is collaborating with SPPs (which provide energy information, management, and bill handling services to states and other organizations) to offer ENERGY STAR benchmarking as part of their standard software package for planning, tracking, and managing energy costs.
California provides an example of a state that conducts automated benchmarking. The state owns 1,566 facilities across 34 state departments and about 16,000 buildings, and has adopted EPA’s Portfolio Manager as its benchmarking tool. To meet Green Building Executive Order S-20-04, the Department General Services, the California Energy Commission, and the state’s investor-owned utilities worked together to integrate automated benchmarking capabilities into the utility billing process. With this capability, it will be easier for facility managers to track energy consumption against the 2003 baseline, and help meet the state’s energy reduction goal of 20% by 2015.
Sources: U.S. EPA, 2007; ENERGY STAR, unpublished; and Miller, 2008.
170 Clean energy Lead by example Guide | Chapter Six
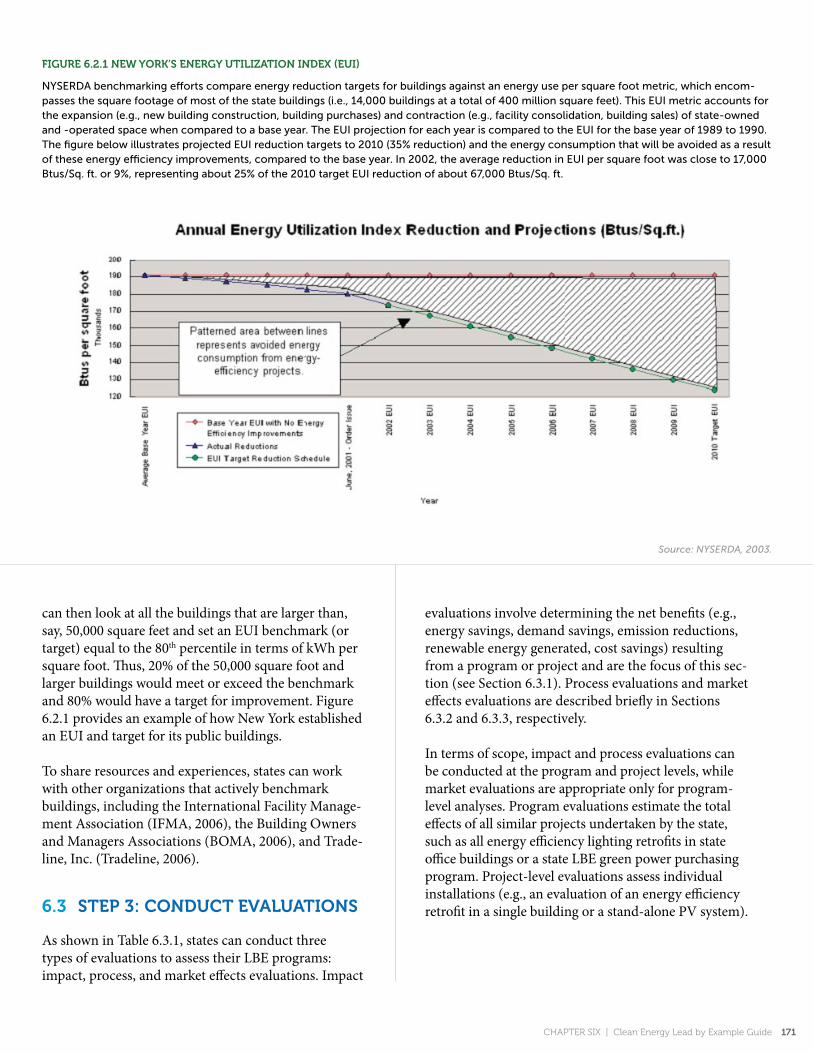
fIgure 6.2.1 neW york’s energy utIlIZatIon InDex (euI)
NYSERDA benchmarking efforts compare energy reduction targets for buildings against an energy use per square foot metric, which encom-passes the square footage of most of the state buildings (i.e., 14,000 buildings at a total of 400 million square feet). This EuI metric accounts for the expansion (e.g., new building construction, building purchases) and contraction (e.g., facility consolidation, building sales) of state-owned and -operated space when compared to a base year. The EuI projection for each year is compared to the EuI for the base year of 1989 to 1990. The figure below illustrates projected EuI reduction targets to 2010 (35% reduction) and the energy consumption that will be avoided as a result of these energy efficiency improvements, compared to the base year. In 2002, the average reduction in EuI per square foot was close to 17,000 Btus/Sq. ft. or 9%, representing about 25% of the 2010 target EuI reduction of about 67,000 Btus/Sq. ft.
Chapter Six | Clean energy Lead by example Guide 171
Source: NYSERDA, 2003.
can then look at all the buildings that are larger than, say, 50,000 square feet and set an EUI benchmark (or target) equal to the 80th percentile in terms of kWh per square foot. Thus, 20% of the 50,000 square foot and larger buildings would meet or exceed the benchmark and 80% would have a target for improvement. Figure 6.2.1 provides an example of how New York established an EUI and target for its public buildings.
To share resources and experiences, states can work with other organizations that actively benchmark buildings, including the International Facility Manage-ment Association (IFMA, 2006), the Building Owners and Managers Associations (BOMA, 2006), and Trade-line, Inc. (Tradeline, 2006).
6.3 step 3: ConDuCt evaluatIons
As shown in Table 6.3.1, states can conduct three types of evaluations to assess their LBE programs: impact, process, and market effects evaluations. Impact
evaluations involve determining the net benefits (e.g., energy savings, demand savings, emission reductions, renewable energy generated, cost savings) resulting from a program or project and are the focus of this sec-tion (see Section 6.3.1). Process evaluations and market effects evaluations are described briefly in Sections 6.3.2 and 6.3.3, respectively.
In terms of scope, impact and process evaluations can be conducted at the program and project levels, while market evaluations are appropriate only for program-level analyses. Program evaluations estimate the total effects of all similar projects undertaken by the state, such as all energy efficiency lighting retrofits in state office buildings or a state LBE green power purchasing program. Project-level evaluations assess individual installations (e.g., an evaluation of an energy efficiency retrofit in a single building or a stand-alone PV system).
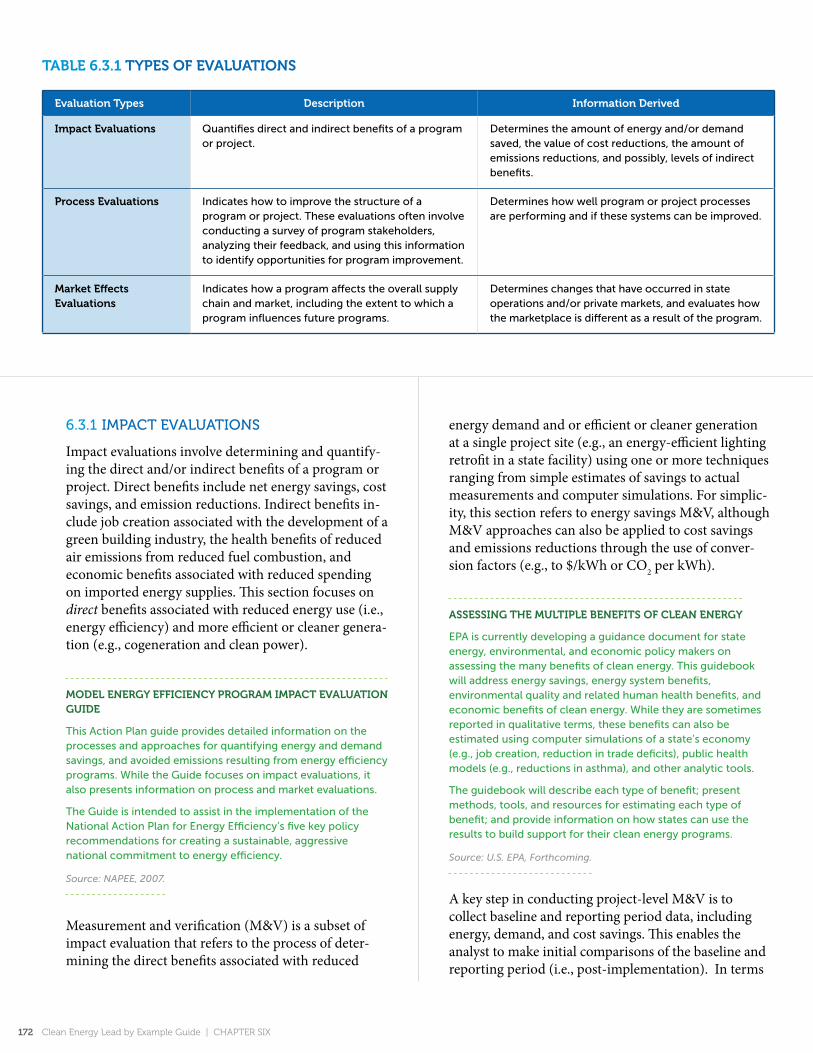
taBle 6.3.1 types of evaluatIons
evaluation types Description Information Derived
Impact evaluations Quantifies direct and indirect benefits of a program or project.
Determines the amount of energy and/or demand saved, the value of cost reductions, the amount of emissions reductions, and possibly, levels of indirect benefits.
process evaluations Indicates how to improve the structure of a program or project. These evaluations often involve conducting a survey of program stakeholders, analyzing their feedback, and using this information to identify opportunities for program improvement.
Determines how well program or project processes are performing and if these systems can be improved.
market effects evaluations
Indicates how a program affects the overall supply chain and market, including the extent to which a program influences future programs.
Determines changes that have occurred in state operations and/or private markets, and evaluates how the marketplace is different as a result of the program.
6.3.1 iMpact EvaLuationS
Impact evaluations involve determining and quantify-ing the direct and/or indirect benefits of a program or project. Direct benefits include net energy savings, cost savings, and emission reductions. Indirect benefits in-clude job creation associated with the development of a green building industry, the health benefits of reduced air emissions from reduced fuel combustion, and economic benefits associated with reduced spending on imported energy supplies. This section focuses on direct benefits associated with reduced energy use (i.e., energy efficiency) and more efficient or cleaner genera-tion (e.g., cogeneration and clean power).
moDel energy effICIenCy program ImpaCt evaluatIon guIDe
This Action Plan guide provides detailed information on the processes and approaches for quantifying energy and demand savings, and avoided emissions resulting from energy efficiency programs. While the Guide focuses on impact evaluations, it also presents information on process and market evaluations.
The Guide is intended to assist in the implementation of the National Action Plan for Energy Efficiency’s five key policy recommendations for creating a sustainable, aggressive national commitment to energy efficiency.
Source: NAPEE, 2007.
Measurement and verification (M&V) is a subset of impact evaluation that refers to the process of deter-mining the direct benefits associated with reduced
energy demand and or efficient or cleaner generation at a single project site (e.g., an energy-efficient lighting retrofit in a state facility) using one or more techniques ranging from simple estimates of savings to actual measurements and computer simulations. For simplic-ity, this section refers to energy savings M&V, although M&V approaches can also be applied to cost savings and emissions reductions through the use of conver-sion factors (e.g., to $/kWh or CO2 per kWh).
assessIng the multIple BenefIts of Clean energy
EPA is currently developing a guidance document for state energy, environmental, and economic policy makers on assessing the many benefits of clean energy. This guidebook will address energy savings, energy system benefits, environmental quality and related human health benefits, and economic benefits of clean energy. While they are sometimes reported in qualitative terms, these benefits can also be estimated using computer simulations of a state’s economy (e.g., job creation, reduction in trade deficits), public health models (e.g., reductions in asthma), and other analytic tools.
The guidebook will describe each type of benefit; present methods, tools, and resources for estimating each type of benefit; and provide information on how states can use the results to build support for their clean energy programs.
Source: U.S. EPA, Forthcoming.
172 Clean energy Lead by example Guide | Chapter Six
A key step in conducting project-level M&V is to collect baseline and reporting period data, including energy, demand, and cost savings. This enables the analyst to make initial comparisons of the baseline and reporting period (i.e., post-implementation). In terms
of reporting, results are typically presented for the first year of performance followed by regular interval (e.g., annual) M&V activities aimed at: (a) verifying the operation of the installed equipment/systems, (b) deter-mining current year savings, and (c) estimating results for subsequent years to assess the persistence of savings.
Numerous resources are available to help states evalu-ate the direct impacts from clean energy activities, including energy savings, cost savings, and emission reductions from LBE programs (see Appendix H, State LBE Tracking Tools and Resources.) Other indirect energy, economic, and environmental benefits can also be measured. Methods and tools for estimating these benefits are described in EPA’s forthcoming guidebook on Assessing the Multiple Benefits of Clean Energy (U.S. EPA, Forthcoming).
Measurement and verification Basics
Energy savings from an LBE project can be determined by comparing energy use before and after implementa-tion of an energy savings project, using the following equation:
Energy savings = (Baseline energy use) – (Reporting period energy use) ± (Adjustments)
Baseline Energy Use ■ is the energy consumption that would have occurred without implementing the project or program. It is sometimes referred to as “business-as-usual” (BAU) energy use.
Reporting Period Energy Use ■ is the energy consumption that occurs after the project or program is implement-ed. It is sometimes referred to as “post-installation” energy use.
Adjustments ■ ensure that baseline and post-installation energy use are measured under the same set of condi-tions (e.g., weather conditions, building occupancy, operating hours). For example, corrections for weather and occupancy may be required if the project involves heating or air-conditioning systems in a building (e.g., a more efficient air conditioner may consume more electricity after it is installed if the weather is warmer after installation as compared to before installation) or the number of occupants changes. On the other hand, weather does not influence the energy savings associated with most retrofits to industrial processes. Additional information on how to address these issues is provided below in Impact Evaluations – Savings Adjustments.
The basic approach to M&V is illustrated in Figures 6.3.1 and 6.3.2. Figure 6.3.1 presents a sample calculation of energy and cost savings from a school energy-efficient lighting project. Figure 6.3.2 illustrates the process of comparing energy use patterns of the pre-installation (baseline) period to the post-installation period.
One or more approaches can be used to estimate base-line and post-installation energy use, including:
Inspections ■ inspections can document the existence, characteristics, and operation of baseline or post-installation equipment and systems, as well as factors affecting energy use.
Engineering Methods ■ standard formulas and assump-tions can calculate the energy use of the baseline and post-installation energy systems.
Statistical Analyses ■ analyses can be conducted to compare “before” and “after” electric bills while tak-ing into consideration changes in weather, facility occupancy, factory operating hours, and other factors. These assessments often involve using multivariate statistical models.
Computer Simulation of System Performance ■ many computer models can predict the energy use of system performance, including F-Chart for active and pas-sive solar energy systems (F-CHART Software, 2005),
CalCulatIng the BaselIne
A first step in conducting impact evaluations is to establish a baseline. The baseline, also referred to as the “business-as-usual” scenario, defines the conditions, typically including energy consumption and may also include related demand and emission reductions that would have occurred without implementing a project or program.
Results are then calculated as the difference in energy use (and demand and emissions, as appropriate) between the baseline and the new project or program. The two primary options for determining baselines are:
project-specific baselines ■ . A project-specific baseline uses the circumstances associated with the project or program to define the baseline. With an energy efficiency project this might involve using historical energy use or emissions data for a particular facility. For a renewable energy generation project, the baseline might be associated with historical power purchases from a local distribution company.
multi-purpose or standards baselines ■ . For this type of baseline, energy use and emissions calculations are based on the energy codes or regulations that define energy use (e.g., state equipment efficiency standards) or conventional building practice guidelines.
Chapter Six | Clean energy Lead by example Guide 173
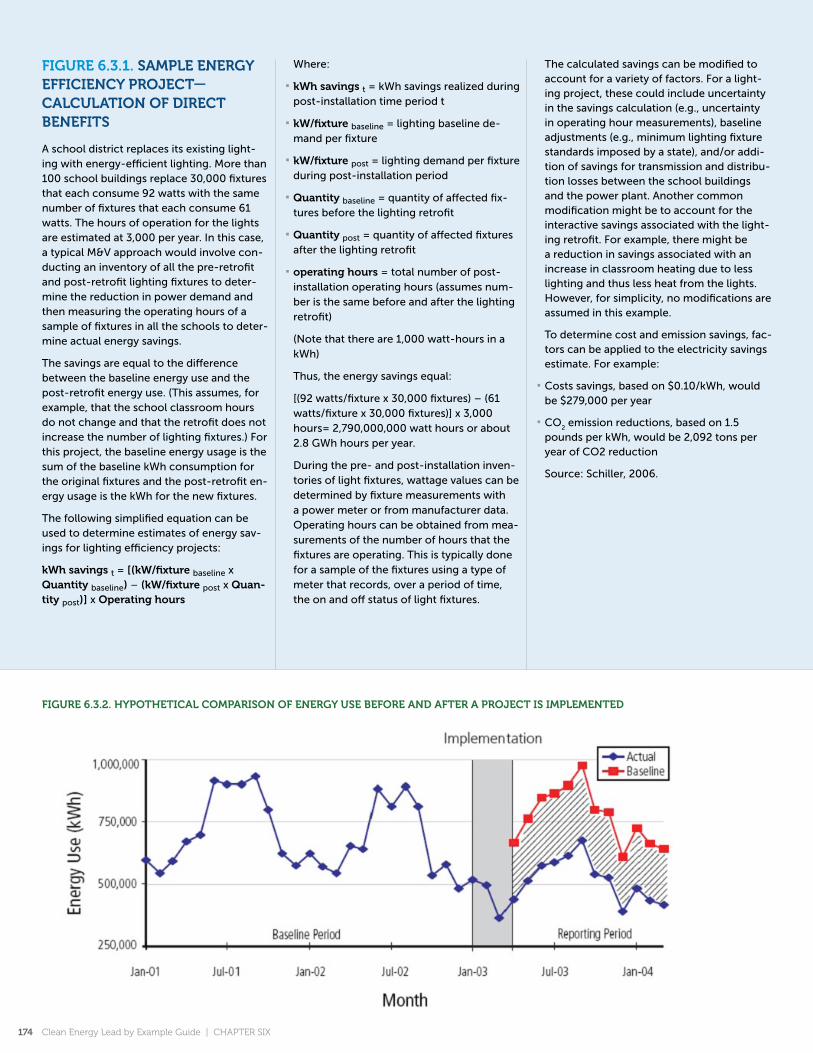
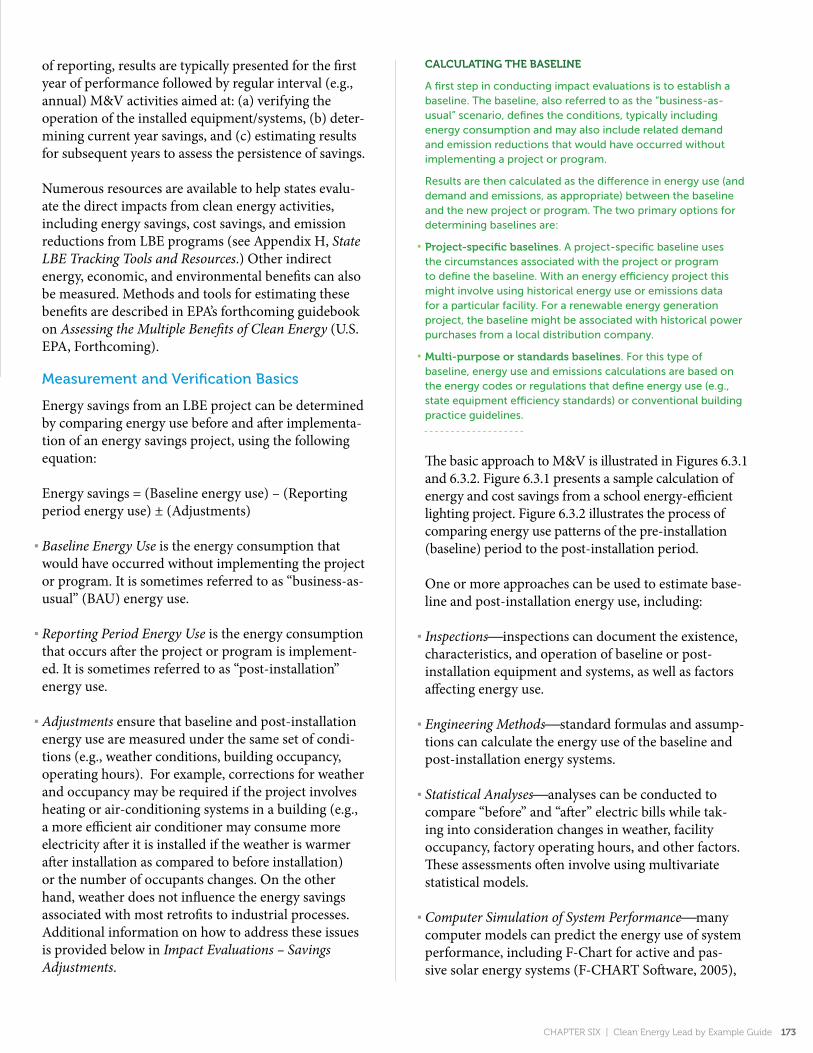
fIgure 6.3.1. sample energy effICIenCy proJeCt—CalCulatIon of DIreCt BenefIts
A school district replaces its existing light-ing with energy-efficient lighting. More than 100 school buildings replace 30,000 fixtures that each consume 92 watts with the same number of fixtures that each consume 61 watts. The hours of operation for the lights are estimated at 3,000 per year. In this case, a typical M&V approach would involve con-ducting an inventory of all the pre-retrofit and post-retrofit lighting fixtures to deter-mine the reduction in power demand and then measuring the operating hours of a sample of fixtures in all the schools to deter-mine actual energy savings.
The savings are equal to the difference between the baseline energy use and the post-retrofit energy use. (This assumes, for example, that the school classroom hours do not change and that the retrofit does not increase the number of lighting fixtures.) For this project, the baseline energy usage is the sum of the baseline kWh consumption for the original fixtures and the post-retrofit en-ergy usage is the kWh for the new fixtures.
The following simplified equation can be used to determine estimates of energy sav-ings for lighting efficiency projects:
kWh savings t = [(kW/fixture baseline x Quantity baseline) – (kW/fixture post x Quan-tity post)] x operating hours
Where:
kWh savings ■ t = kWh savings realized during post-installation time period t
kW/fixture ■ baseline = lighting baseline de-mand per fixture
kW/fixture ■ post = lighting demand per fixture during post-installation period
Quantity ■ baseline = quantity of affected fix-tures before the lighting retrofit
Quantity ■ post = quantity of affected fixtures after the lighting retrofit
operating hours ■ = total number of post-installation operating hours (assumes num-ber is the same before and after the lighting retrofit)
(Note that there are 1,000 watt-hours in a kWh)
Thus, the energy savings equal:
[(92 watts/fixture x 30,000 fixtures) – (61 watts/fixture x 30,000 fixtures)] x 3,000 hours= 2,790,000,000 watt hours or about 2.8 GWh hours per year.
During the pre- and post-installation inven-tories of light fixtures, wattage values can be determined by fixture measurements with a power meter or from manufacturer data. Operating hours can be obtained from mea-surements of the number of hours that the fixtures are operating. This is typically done for a sample of the fixtures using a type of meter that records, over a period of time, the on and off status of light fixtures.
The calculated savings can be modified to account for a variety of factors. For a light-ing project, these could include uncertainty in the savings calculation (e.g., uncertainty in operating hour measurements), baseline adjustments (e.g., minimum lighting fixture standards imposed by a state), and/or addi-tion of savings for transmission and distribu-tion losses between the school buildings and the power plant. Another common modification might be to account for the interactive savings associated with the light-ing retrofit. For example, there might be a reduction in savings associated with an increase in classroom heating due to less lighting and thus less heat from the lights. However, for simplicity, no modifications are assumed in this example.
To determine cost and emission savings, fac-tors can be applied to the electricity savings estimate. For example:
Costs savings, based on $0.10/kWh, would ■
be $279,000 per year
CO ■2 emission reductions, based on 1.5
pounds per kWh, would be 2,092 tons per year of CO2 reduction
Source: Schiller, 2006.
fIgure 6.3.2. hypothetICal ComparIson of energy use Before anD after a proJeCt Is ImplementeD
174 Clean energy Lead by example Guide | Chapter Six
DOE-2 for buildings (LBNL, 2006; U.S. DOE, 2006), and a number of other calculation tools (Texas A & M, 2006) These models are typically calibrated with actual performance data.
Metering ■ and Monitoringbaseline and post-instal-lation energy use can be measured and monitored through metering and accounting for non-energy fac-tors, such as weather conditions.
Integrative Methods ■ these methods combine some or all of the preceding approaches. For example, metering and engineering methods can calibrate computer simu-lations of baseline and post-installation buildings that receive efficiency retrofits.
Savings adjustments
Before considering how to adjust for changes in energy use from the baseline to the reporting period, it is im-portant to understand the factors that cause energy use to vary, including:
Building Area Change ■ : Changes in building size strong-ly influence energy consumption. If square footage is added to a facility, energy use is expected to increase.
Operations and Schedule Changes ■ : Changes in building occupancy or schedules for building and equipment operation affect energy use. If a building is open longer hours, more energy is used for heating, cooling, and lighting. If a school cafeteria brings in pre-cooked meals in disposable containers instead of cooking and dishwashing on site, kitchen energy use is reduced.
Weather ■ : Energy used for heating and cooling varies because of changing temperatures. Seasonal changes cause increased energy use for heating in the winter and increased use of electricity for cooling during the summer.
Variations in energy consumption due to the struc-tural or activity changes described above need to be factored out of the impacts calculation. This can be accomplished by collecting basic activity data such as the square footage of buildings, number of occupants, miles traveled per vehicle, and weather characteristics. Indicators such as energy consumption per square foot allow for normalization of facility energy consumption based on the area in which energy is consumed. Such indicators are useful for comparing energy consump-tion among various buildings, projects, or facilities.
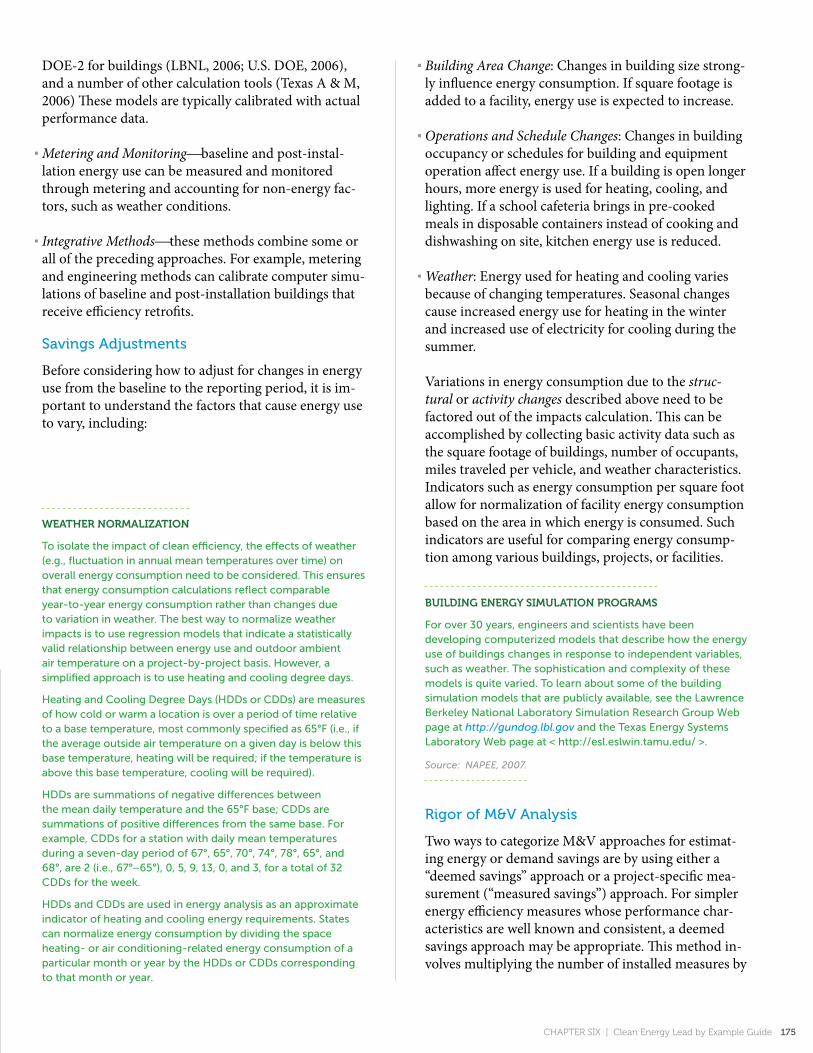
Weather normalIZatIon
To isolate the impact of clean efficiency, the effects of weather (e.g., fluctuation in annual mean temperatures over time) on overall energy consumption need to be considered. This ensures that energy consumption calculations reflect comparable year-to-year energy consumption rather than changes due to variation in weather. The best way to normalize weather impacts is to use regression models that indicate a statistically valid relationship between energy use and outdoor ambient air temperature on a project-by-project basis. However, a simplified approach is to use heating and cooling degree days.
Heating and Cooling Degree Days (HDDs or CDDs) are measures of how cold or warm a location is over a period of time relative to a base temperature, most commonly specified as 65°F (i.e., if the average outside air temperature on a given day is below this base temperature, heating will be required; if the temperature is above this base temperature, cooling will be required).
HDDs are summations of negative differences between the mean daily temperature and the 65°F base; CDDs are summations of positive differences from the same base. For example, CDDs for a station with daily mean temperatures during a seven-day period of 67°, 65°, 70°, 74°, 78°, 65°, and 68°, are 2 (i.e., 67°−65°), 0, 5, 9, 13, 0, and 3, for a total of 32 CDDs for the week.
HDDs and CDDs are used in energy analysis as an approximate indicator of heating and cooling energy requirements. States can normalize energy consumption by dividing the space heating- or air conditioning-related energy consumption of a particular month or year by the HDDs or CDDs corresponding to that month or year.
BuIlDIng energy sImulatIon programs
For over 30 years, engineers and scientists have been developing computerized models that describe how the energy use of buildings changes in response to independent variables, such as weather. The sophistication and complexity of these models is quite varied. To learn about some of the building simulation models that are publicly available, see the Lawrence Berkeley National Laboratory Simulation Research Group Web page at http://gundog.lbl.gov and the Texas Energy Systems Laboratory Web page at < http://esl.eslwin.tamu.edu/ >.
Source: NAPEE, 2007.
Chapter Six | Clean energy Lead by example Guide 175
rigor of M&v analysis
Two ways to categorize M&V approaches for estimat-ing energy or demand savings are by using either a “deemed savings” approach or a project-specific mea-surement (“measured savings”) approach. For simpler energy efficiency measures whose performance char-acteristics are well known and consistent, a deemed savings approach may be appropriate. This method in-volves multiplying the number of installed measures by

the estimated (or deemed) savings per measure, which are derived from validated historical evaluations.
As discussed earlier in this chapter, more rigorous M&V approaches may be appropriate for larger and more complex efficiency projects, projects with a significant amount of savings, and projects with sig-nificant savings uncertainties. One way to identify the appropriate level of rigor – and to increase transpar-ency – is to adopt a formal M&V protocol.such as the commonly-used International Performance Measure-ment and Verification Protocol (IPMVP).7 Many states base their M&V approaches on the IPMVP, coupled with their own requirements (e.g., the level of required accuracy and precision).
Regardless of the specific methods adopted, there are two key elements to the M&V process:
Verifying the potential to generate savings: ■ this involves confirming that (1) baseline conditions are properly defined, and (2) the proper equipment and systems were installed and are performing to specification. This is evaluated through a review of designs, pre-installa-tion savings estimates, and inspections.
Estimating energy savings ■ : energy savings are calcu-lated based on deemed savings values, energy bills, or calibrated computer simulation. As described above, it may be sufficient to verify the potential to generate
7 A 2007 version of the IPMVP was recently released; see http://www.evo-world.org/.
savings and then simply stipulate that the LBE project savings will be deemed savings. In other situations, it may be preferable to determine the measured savings using one of four IPMVP options (described in more detail in the next section). When selecting the M&V option to use for a LBE project, it is important to re-view the objectives of the impact evaluation.
Some states, particularly those with aggressive time-lines for implementing energy efficiency programs and with limited budgets, reach an advanced agreement on which LBE projects can be estimated using deemed savings and which projects require measured savings approaches. In general, deemed savings approaches are most reliable for technologies that:
Deliver energy savings independent of human factors, ■
such as contractor installation practices or consumer behavior (e.g., plug-in products).
Have a clear standard by which to compare efficient ■
and less efficient products [e.g., the Federal National Appliance Energy Conservation Act (NAECA) Stan-dard or ENERGY STAR designation].
Have been promoted by other efficiency programs; ■
have well-established usage patterns, measure life, and performance history; and where usage is not driven by weather.
the ipMvp and other M&v protocols
A variety of M&V protocols and procedures have been established, including national-level guidelines such as the IPMVP (which are designed for determining savings from individual projects) and state guidelines (which specify their jurisdictional requirements for M&V). Table 6.3.2 lists some of the key M&V protocols and guidance. More detailed information on each resource is provided in Appendix I, M&V Protocols and Guidelines.
The IPMVP provides a framework and definitions that can help states develop M&V plans for their projects (e.g., implementing individual energy efficiency measures in a facility, conducting a whole building analysis).8 It includes guidance on current best prac-tice techniques for determining energy savings and verifying the results of energy efficiency, renewable energy, and water efficiency projects in commercial
8 IPMVP covers project rather than program energy savings and describes what should be included in a project M&V plan. Some state programs, such as NYSERDA and the California Public Utilities Commission, already use the IPMVP.
“DeemeD” anD “measureD” savIngs
Deemed savings usually apply to the most common energy efficiency measures. Deemed savings are the per-unit energy savings that can be claimed from installing consistent and well-understood measures. Examples include agreed-to savings per fixture for a lighting retrofit or per vehicle for purchasing alternative fuel vehicles. Since they are stipulated and not subject to change, deemed savings can help simplify program planning and design. However, deemed savings can result in inaccurate estimates of savings if the projects or products do not perform as expected (e.g., if energy-efficient lights fail earlier than expected.)
Measured savings approaches typically result in a higher level of rigor through the application of end-use metering, billing regression analysis, or computer simulation. Measured savings approaches are usually used for custom measures and large-scale projects. These approaches add to administrative costs but may provide more accurate savings values.
Source: U.S. EPA, 2006a.
176 Clean energy Lead by example Guide | Chapter Six
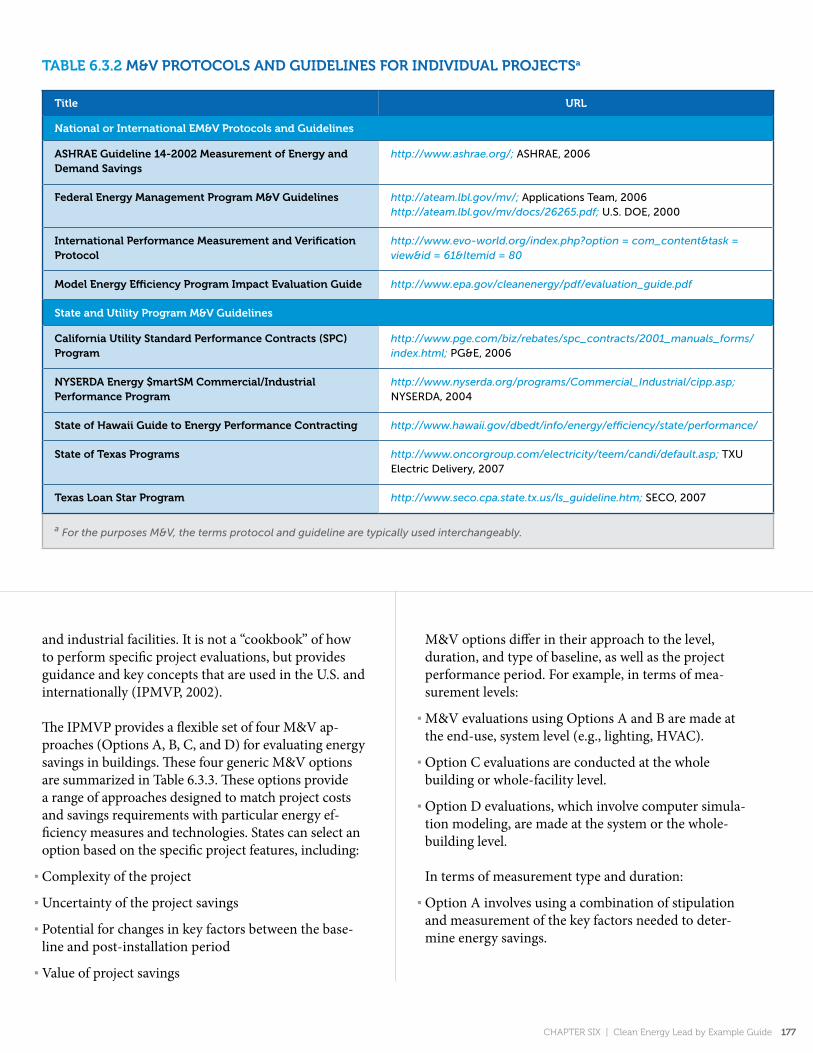
taBle 6.3.2 m&v protoCols anD guIDelInes for InDIvIDual proJeCtsa
title url
national or International em&v protocols and guidelines
ashrae guideline 14-2002 measurement of energy and Demand savings
http://www.ashrae.org/; ASHRAE, 2006
federal energy management program m&v guidelines http://ateam.lbl.gov/mv/; Applications Team, 2006 http://ateam.lbl.gov/mv/docs/26265.pdf; u.S. DOE, 2000
International performance measurement and verification protocol
http://www.evo-world.org/index.php?option = com_content&task = view&id = 61&Itemid = 80
model energy efficiency program Impact evaluation guide http://www.epa.gov/cleanenergy/pdf/evaluation_guide.pdf
state and utility program m&v guidelines
California utility standard performance Contracts (spC) program
http://www.pge.com/biz/rebates/spc_contracts/2001_manuals_forms/index.html; PG&E, 2006
nyserDa energy $martsm Commercial/Industrial performance program
http://www.nyserda.org/programs/Commercial_Industrial/cipp.asp; NYSERDA, 2004
state of hawaii guide to energy performance Contracting http://www.hawaii.gov/dbedt/info/energy/efficiency/state/performance/
state of texas programs http://www.oncorgroup.com/electricity/teem/candi/default.asp; TXu Electric Delivery, 2007
texas loan star program http://www.seco.cpa.state.tx.us/ls_guideline.htm; SECO, 2007
a For the purposes M&V, the terms protocol and guideline are typically used interchangeably.
Chapter Six | Clean energy Lead by example Guide 177
and industrial facilities. It is not a “cookbook” of how to perform specific project evaluations, but provides guidance and key concepts that are used in the U.S. and internationally (IPMVP, 2002).
The IPMVP provides a flexible set of four M&V ap-proaches (Options A, B, C, and D) for evaluating energy savings in buildings. These four generic M&V options are summarized in Table 6.3.3. These options provide a range of approaches designed to match project costs and savings requirements with particular energy ef-ficiency measures and technologies. States can select an option based on the specific project features, including:
Complexity of the project ■
Uncertainty of the project savings ■
Potential for changes in key factors between the base- ■
line and post-installation period
Value of project savings ■
M&V options differ in their approach to the level, duration, and type of baseline, as well as the project performance period. For example, in terms of mea-surement levels:
M&V evaluations using Options A and B are made at ■
the end-use, system level (e.g., lighting, HVAC).
Option C evaluations are conducted at the whole ■
building or whole-facility level.
Option D evaluations, which involve computer simula- ■
tion modeling, are made at the system or the whole-building level.
In terms of measurement type and duration:
Option A involves using a combination of stipulation ■
and measurement of the key factors needed to deter-mine energy savings.

Options B and C involve using spot, short-term, and ■
continuous measurements.
Option D may include spot, short-term, or continuous ■
measurements9 to calibrate the model.
9 Spot measurements are one-time measurements (e.g., of the power draw of a motor). Short-term measurements can take place for a week or two, such as determining the operating hours of lights in an office. Continuous metering involves measuring key factors, such as power consumption or outdoor tem-perature, throughout the term of the valuation, which may continue for years.
While these options are directly associated with energy efficiency projects, the basic concepts are also appli-cable to clean power, transportation, and distributed generation activities. Each option has advantages and disadvantages based on project-specific factors and the needs and expectations of the participants. While each option defines a savings determination approach, it should be noted that options A-D produce estimates of savings and not direct measurements. Since M&V
taBle 6.3.3 Ipmvp measurement anD verIfICatIon optIons
m&v optionhow savings are
Calculated Cost typical applications
option a. partially measured retrofit Isolation: Savings determined by partial field measurement of the energy use of the system to which a measure was applied, separate from the energy use of the rest of the facility. Focuses on physical assessment of equipment changes to ensure the installation is to specification. Key performance factors (e.g., lighting wattage or chiller efficiency) are determined with spot or short-term measurements. Operational factors (e.g., lighting operating hours or cooling ton-hours) are stipulated based on analysis of historical data or measurements. Performance factors and proper operation are measured or checked annually.
Engineering calculations using spot or short-term measurements, computer simulations, and/or historical data.
Dependent on number of measurement points. Approximately 1% to 5% of project construction cost of items subject to M&V.
Lighting retrofit where power draw is measured periodically. Operating hours of the lights are assumed to be one-half hour per day longer than a store’s open hours. used for simple project types where high accuracy is not required.
option B. retrofit Isolation: Savings determined after project completion by short-term or continuous measurements taken throughout the term of the contract at the device or system level. Performance and operations factors are monitored.
Engineering calculations using metered data.
Dependent on number and type of systems measured and the term of analysis/ metering. Typically 3% to 10% of project construction cost of items subject to M&V.
Application of controls to vary the load on a constant speed pump using a variable speed drive. Electricity use is measured by a kWh meter installed on the electrical supply to the pump motor. In the base year, this meter is in place for a week to verify constant loading. The meter is in place through the post-retrofit period to track variations in energy use.
used for simple project types where high accuracy is not required.
option C. Whole facility: After project completion, savings determined at the “whole-building” or facility level using current year and historical utility meter (gas or electricity) or sub-meter data. Short-term or continuous measurements are taken throughout the post-retrofit period.
Analysis of utility meter (or sub-meter) data using techniques from simple comparison to multivariate (hourly or monthly) regression analysis.
Dependent on number and complexity of parameters in analysis. Typically 1% to 10% of project construction cost of items subject to M&V.
Multifaceted energy management program affecting many systems in a building. Energy use is measured by gas and electric utility meters for a 12-month base year period and throughout the post-retrofit period.
used for comprehensive and/or multi-site project types. Varying levels of accuracy possible.
178 Clean energy Lead by example Guide | Chapter Six
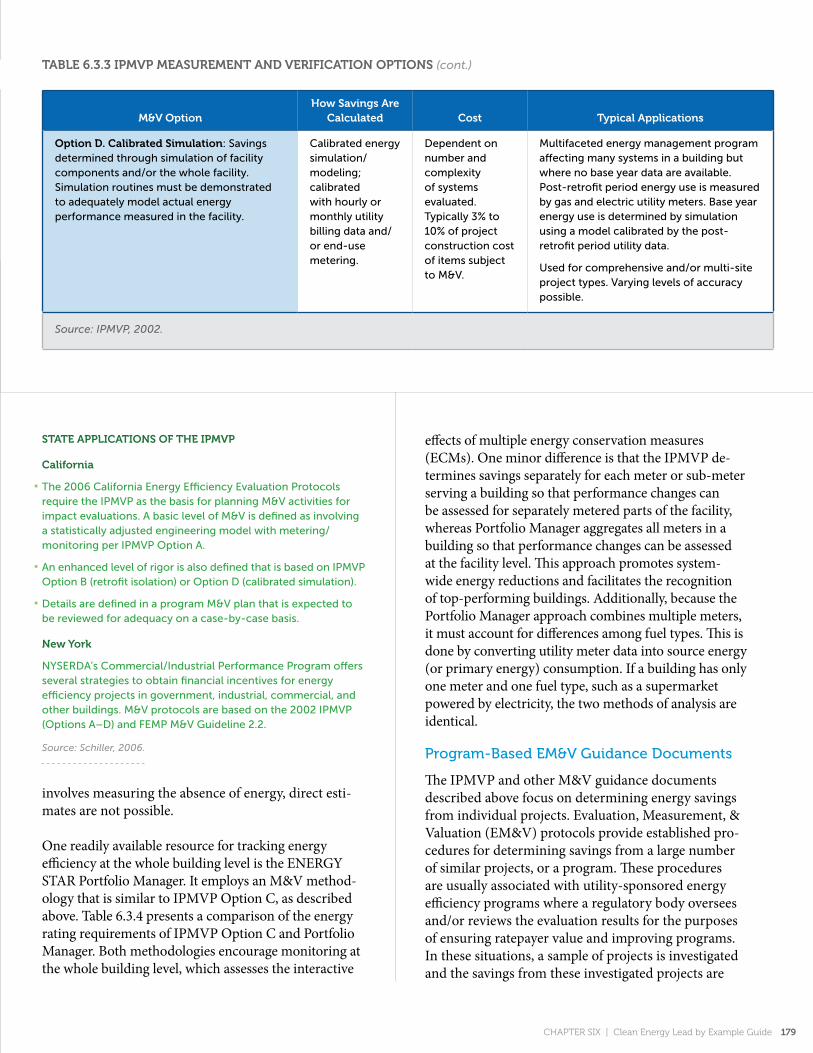
m&v optionhow savings are
Calculated Cost typical applications
option D. Calibrated simulation: Savings determined through simulation of facility components and/or the whole facility. Simulation routines must be demonstrated to adequately model actual energy performance measured in the facility.
Calibrated energy simulation/modeling; calibrated with hourly or monthly utility billing data and/or end-use metering.
Dependent on number and complexity of systems evaluated. Typically 3% to 10% of project construction cost of items subject to M&V.
Multifaceted energy management program affecting many systems in a building but where no base year data are available. Post-retrofit period energy use is measured by gas and electric utility meters. Base year energy use is determined by simulation using a model calibrated by the post-retrofit period utility data.
used for comprehensive and/or multi-site project types. Varying levels of accuracy possible.
Source: IPMVP, 2002.
taBle 6.3.3 Ipmvp measurement anD verIfICatIon optIons (cont.)
taBle 6.3.3 Ipmvp measurement anD verIfICatIon optIons
m&v optionhow savings are
Calculated Cost typical applications
option a. partially measured retrofit Isolation: Savings determined by partial field measurement of the energy use of the system to which a measure was applied, separate from the energy use of the rest of the facility. Focuses on physical assessment of equipment changes to ensure the installation is to specification. Key performance factors (e.g., lighting wattage or chiller efficiency) are determined with spot or short-term measurements. Operational factors (e.g., lighting operating hours or cooling ton-hours) are stipulated based on analysis of historical data or measurements. Performance factors and proper operation are measured or checked annually.
Engineering calculations using spot or short-term measurements, computer simulations, and/or historical data.
Dependent on number of measurement points. Approximately 1% to 5% of project construction cost of items subject to M&V.
Lighting retrofit where power draw is measured periodically. Operating hours of the lights are assumed to be one-half hour per day longer than a store’s open hours. used for simple project types where high accuracy is not required.
option B. retrofit Isolation: Savings determined after project completion by short-term or continuous measurements taken throughout the term of the contract at the device or system level. Performance and operations factors are monitored.
Engineering calculations using metered data.
Dependent on number and type of systems measured and the term of analysis/ metering. Typically 3% to 10% of project construction cost of items subject to M&V.
Application of controls to vary the load on a constant speed pump using a variable speed drive. Electricity use is measured by a kWh meter installed on the electrical supply to the pump motor. In the base year, this meter is in place for a week to verify constant loading. The meter is in place through the post-retrofit period to track variations in energy use.
used for simple project types where high accuracy is not required.
option C. Whole facility: After project completion, savings determined at the “whole-building” or facility level using current year and historical utility meter (gas or electricity) or sub-meter data. Short-term or continuous measurements are taken throughout the post-retrofit period.
Analysis of utility meter (or sub-meter) data using techniques from simple comparison to multivariate (hourly or monthly) regression analysis.
Dependent on number and complexity of parameters in analysis. Typically 1% to 10% of project construction cost of items subject to M&V.
Multifaceted energy management program affecting many systems in a building. Energy use is measured by gas and electric utility meters for a 12-month base year period and throughout the post-retrofit period.
used for comprehensive and/or multi-site project types. Varying levels of accuracy possible.
Chapter Six | Clean energy Lead by example Guide 179
involves measuring the absence of energy, direct esti-mates are not possible.
One readily available resource for tracking energy efficiency at the whole building level is the ENERGY STAR Portfolio Manager. It employs an M&V method-ology that is similar to IPMVP Option C, as described above. Table 6.3.4 presents a comparison of the energy rating requirements of IPMVP Option C and Portfolio Manager. Both methodologies encourage monitoring at the whole building level, which assesses the interactive
effects of multiple energy conservation measures (ECMs). One minor difference is that the IPMVP de-termines savings separately for each meter or sub-meter serving a building so that performance changes can be assessed for separately metered parts of the facility, whereas Portfolio Manager aggregates all meters in a building so that performance changes can be assessed at the facility level. This approach promotes system-wide energy reductions and facilitates the recognition of top-performing buildings. Additionally, because the Portfolio Manager approach combines multiple meters, it must account for differences among fuel types. This is done by converting utility meter data into source energy (or primary energy) consumption. If a building has only one meter and one fuel type, such as a supermarket powered by electricity, the two methods of analysis are identical.
program-Based EM&v guidance documents
The IPMVP and other M&V guidance documents described above focus on determining energy savings from individual projects. Evaluation, Measurement, & Valuation (EM&V) protocols provide established pro-cedures for determining savings from a large number of similar projects, or a program. These procedures are usually associated with utility-sponsored energy efficiency programs where a regulatory body oversees and/or reviews the evaluation results for the purposes of ensuring ratepayer value and improving programs. In these situations, a sample of projects is investigated and the savings from these investigated projects are
state applICatIons of the Ipmvp
California
The 2006 California Energy Efficiency Evaluation Protocols ■
require the IPMVP as the basis for planning M&V activities for impact evaluations. A basic level of M&V is defined as involving a statistically adjusted engineering model with metering/monitoring per IPMVP Option A.
An enhanced level of rigor is also defined that is based on IPMVP ■
Option B (retrofit isolation) or Option D (calibrated simulation).
Details are defined in a program M&V plan that is expected to ■
be reviewed for adequacy on a case-by-case basis.
new york
NYSERDA’s Commercial/Industrial Performance Program offers several strategies to obtain financial incentives for energy efficiency projects in government, industrial, commercial, and other buildings. M&V protocols are based on the 2002 IPMVP (Options A–D) and FEMP M&V Guideline 2.2.
Source: Schiller, 2006.
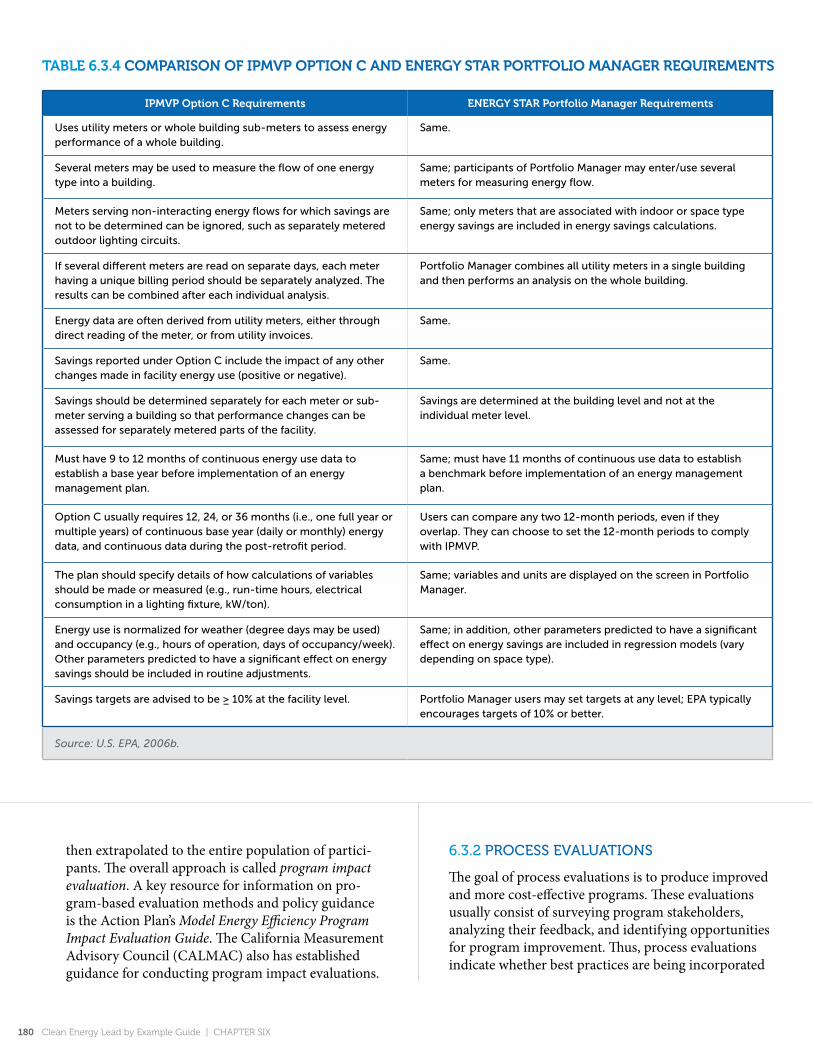
taBle 6.3.4 ComparIson of Ipmvp optIon C anD energy star portfolIo manager reQuIrements
Ipmvp option C requirements energy star portfolio manager requirements
uses utility meters or whole building sub-meters to assess energy performance of a whole building.
Same.
Several meters may be used to measure the flow of one energy type into a building.
Same; participants of Portfolio Manager may enter/use several meters for measuring energy flow.
Meters serving non-interacting energy flows for which savings are not to be determined can be ignored, such as separately metered outdoor lighting circuits.
Same; only meters that are associated with indoor or space type energy savings are included in energy savings calculations.
If several different meters are read on separate days, each meter having a unique billing period should be separately analyzed. The results can be combined after each individual analysis.
Portfolio Manager combines all utility meters in a single building and then performs an analysis on the whole building.
Energy data are often derived from utility meters, either through direct reading of the meter, or from utility invoices.
Same.
Savings reported under Option C include the impact of any other changes made in facility energy use (positive or negative).
Same.
Savings should be determined separately for each meter or sub-meter serving a building so that performance changes can be assessed for separately metered parts of the facility.
Savings are determined at the building level and not at the individual meter level.
Must have 9 to 12 months of continuous energy use data to establish a base year before implementation of an energy management plan.
Same; must have 11 months of continuous use data to establish a benchmark before implementation of an energy management plan.
Option C usually requires 12, 24, or 36 months (i.e., one full year or multiple years) of continuous base year (daily or monthly) energy data, and continuous data during the post-retrofit period.
users can compare any two 12-month periods, even if they overlap. They can choose to set the 12-month periods to comply with IPMVP.
The plan should specify details of how calculations of variables should be made or measured (e.g., run-time hours, electrical consumption in a lighting fixture, kW/ton).
Same; variables and units are displayed on the screen in Portfolio Manager.
Energy use is normalized for weather (degree days may be used) and occupancy (e.g., hours of operation, days of occupancy/week). Other parameters predicted to have a significant effect on energy savings should be included in routine adjustments.
Same; in addition, other parameters predicted to have a significant effect on energy savings are included in regression models (vary depending on space type).
Savings targets are advised to be ≥ 10% at the facility level. Portfolio Manager users may set targets at any level; EPA typically encourages targets of 10% or better.
Source: U.S. EPA, 2006b.
180 Clean energy Lead by example Guide | Chapter Six
then extrapolated to the entire population of partici-pants. The overall approach is called program impact evaluation. A key resource for information on pro-gram-based evaluation methods and policy guidance is the Action Plan’s Model Energy Efficiency Program Impact Evaluation Guide. The California Measurement Advisory Council (CALMAC) also has established guidance for conducting program impact evaluations.
6.3.2 procESS EvaLuationS
The goal of process evaluations is to produce improved and more cost-effective programs. These evaluations usually consist of surveying program stakeholders, analyzing their feedback, and identifying opportunities for program improvement. Thus, process evaluations indicate whether best practices are being incorporated
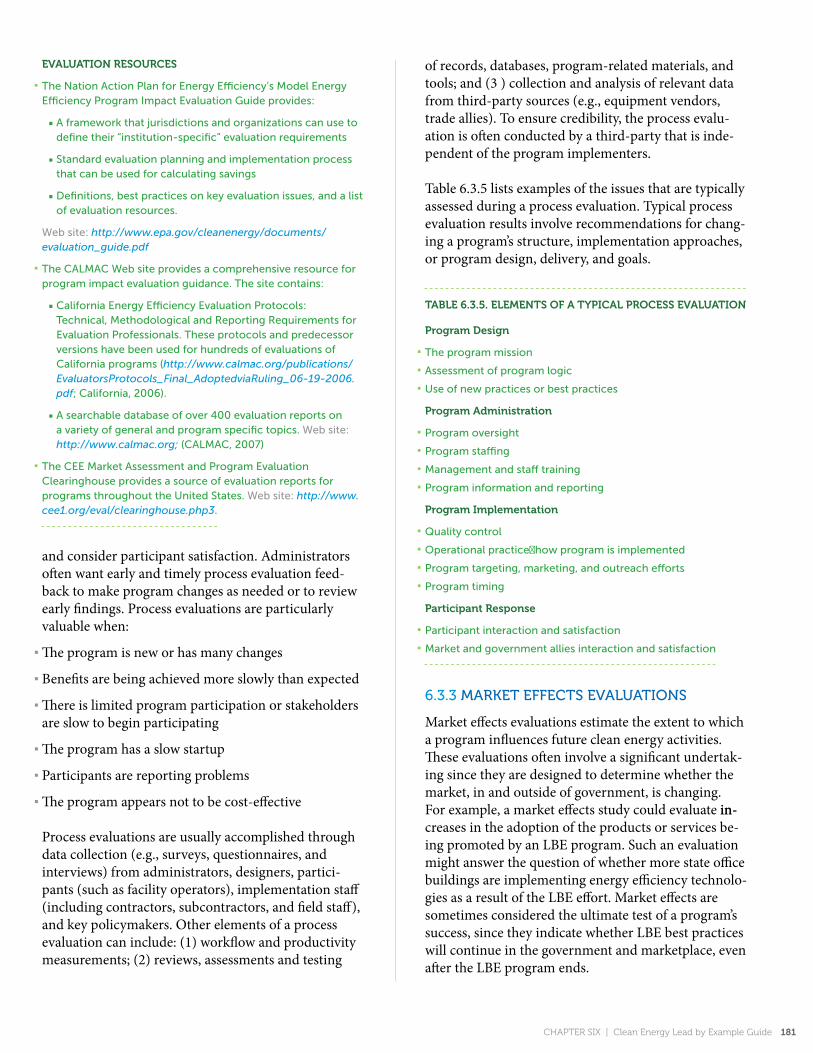
and consider participant satisfaction. Administrators often want early and timely process evaluation feed-back to make program changes as needed or to review early findings. Process evaluations are particularly valuable when:
The program is new or has many changes ■
Benefits are being achieved more slowly than expected ■
There is limited program participation or stakeholders ■
are slow to begin participating
The program has a slow startup ■
Participants are reporting problems ■
The program appears not to be cost-effective ■
Process evaluations are usually accomplished through data collection (e.g., surveys, questionnaires, and interviews) from administrators, designers, partici-pants (such as facility operators), implementation staff (including contractors, subcontractors, and field staff), and key policymakers. Other elements of a process evaluation can include: (1) workflow and productivity measurements; (2) reviews, assessments and testing
of records, databases, program-related materials, and tools; and (3 ) collection and analysis of relevant data from third-party sources (e.g., equipment vendors, trade allies). To ensure credibility, the process evalu-ation is often conducted by a third-party that is inde-pendent of the program implementers.
Table 6.3.5 lists examples of the issues that are typically assessed during a process evaluation. Typical process evaluation results involve recommendations for chang-ing a program’s structure, implementation approaches, or program design, delivery, and goals.
evaluatIon resourCes
The Nation Action Plan for Energy Efficiency’s Model Energy ■
Efficiency Program Impact Evaluation Guide provides:
A framework that jurisdictions and organizations can use to ■define their “institution-specific” evaluation requirements
Standard evaluation planning and implementation process ■that can be used for calculating savings
Definitions, best practices on key evaluation issues, and a list ■of evaluation resources.
Web site: http://www.epa.gov/cleanenergy/documents/evaluation_guide.pdf
The CALMAC Web site provides a comprehensive resource for ■
program impact evaluation guidance. The site contains:
California Energy Efficiency Evaluation Protocols: ■Technical, Methodological and Reporting Requirements for Evaluation Professionals. These protocols and predecessor versions have been used for hundreds of evaluations of California programs (http://www.calmac.org/publications/EvaluatorsProtocols_Final_AdoptedviaRuling_06-19-2006.pdf; California, 2006).
A searchable database of over 400 evaluation reports on ■a variety of general and program specific topics. Web site: http://www.calmac.org; (CALMAC, 2007)
The CEE Market Assessment and Program Evaluation ■
Clearinghouse provides a source of evaluation reports for programs throughout the united States. Web site: http://www.cee1.org/eval/clearinghouse.php3.
taBle 6.3.5. elements of a typICal proCess evaluatIon
program Design
The program mission ■
Assessment of program logic ■
use of new practices or best practices ■
program administration
Program oversight ■
Program staffing ■
Management and staff training ■
Program information and reporting ■
program Implementation
Quality control ■
Operational practicehow program is implemented ■
Program targeting, marketing, and outreach efforts ■
Program timing ■
participant response
Participant interaction and satisfaction ■
Market and government allies interaction and satisfaction ■
Chapter Six | Clean energy Lead by example Guide 181
6.3.3 MarKEt EffEctS EvaLuationS
Market effects evaluations estimate the extent to which a program influences future clean energy activities. These evaluations often involve a significant undertak-ing since they are designed to determine whether the market, in and outside of government, is changing. For example, a market effects study could evaluate in-in-creases in the adoption of the products or services be-ing promoted by an LBE program. Such an evaluation might answer the question of whether more state office buildings are implementing energy efficiency technolo-gies as a result of the LBE effort. Market effects are sometimes considered the ultimate test of a program’s success, since they indicate whether LBE best practices will continue in the government and marketplace, even after the LBE program ends.
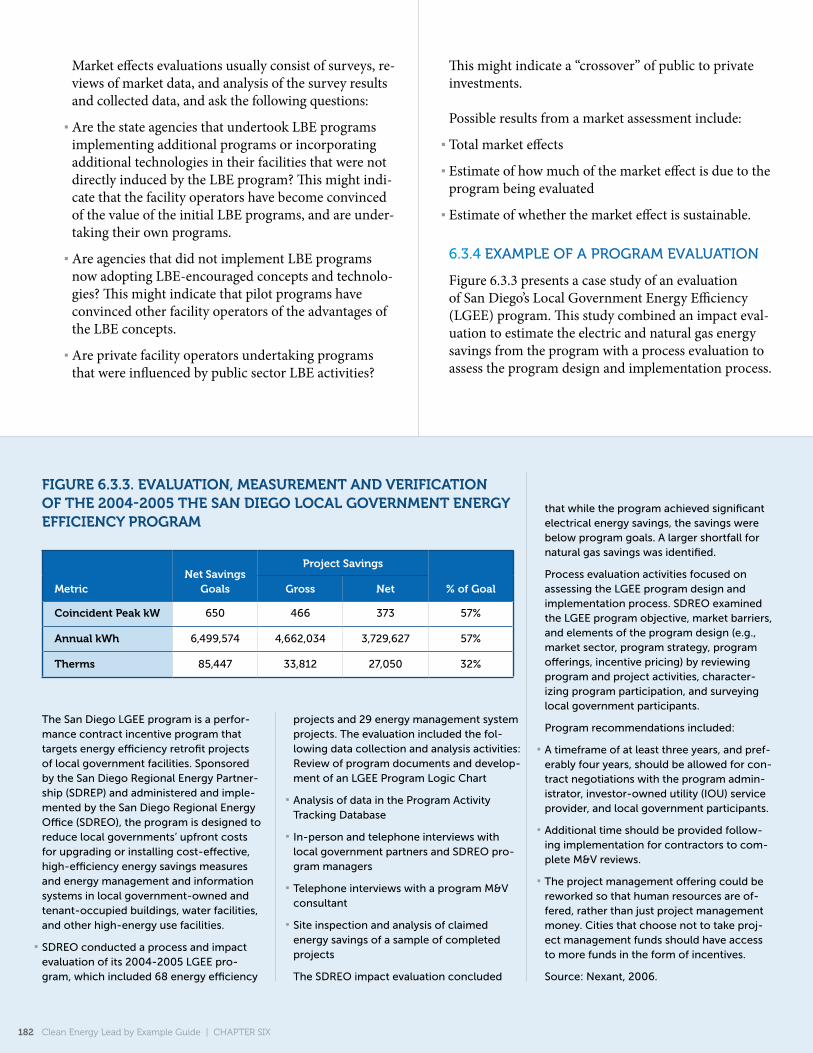
Market effects evaluations usually consist of surveys, re-views of market data, and analysis of the survey results and collected data, and ask the following questions:
Are the state agencies that undertook LBE programs ■
implementing additional programs or incorporating additional technologies in their facilities that were not directly induced by the LBE program? This might indi-cate that the facility operators have become convinced of the value of the initial LBE programs, and are under-taking their own programs.
Are agencies that did not implement LBE programs ■
now adopting LBE-encouraged concepts and technolo-gies? This might indicate that pilot programs have convinced other facility operators of the advantages of the LBE concepts.
Are private facility operators undertaking programs ■
that were influenced by public sector LBE activities?
This might indicate a “crossover” of public to private investments.
Possible results from a market assessment include:
Total market effects ■
Estimate of how much of the market effect is due to the ■
program being evaluated
Estimate of whether the market effect is sustainable. ■
6.3.4 ExaMpLE of a prograM EvaLuation
Figure 6.3.3 presents a case study of an evaluation of San Diego’s Local Government Energy Efficiency (LGEE) program. This study combined an impact eval-uation to estimate the electric and natural gas energy savings from the program with a process evaluation to assess the program design and implementation process.
fIgure 6.3.3. evaluatIon, measurement anD verIfICatIon of the 2004-2005 the san DIego loCal government energy effICIenCy program
The San Diego LGEE program is a perfor-mance contract incentive program that targets energy efficiency retrofit projects of local government facilities. Sponsored by the San Diego Regional Energy Partner-ship (SDREP) and administered and imple-mented by the San Diego Regional Energy Office (SDREO), the program is designed to reduce local governments’ upfront costs for upgrading or installing cost-effective, high-efficiency energy savings measures and energy management and information systems in local government-owned and tenant-occupied buildings, water facilities, and other high-energy use facilities.
SDREO conducted a process and impact ■
evaluation of its 2004-2005 LGEE pro-gram, which included 68 energy efficiency
projects and 29 energy management system projects. The evaluation included the fol-lowing data collection and analysis activities: Review of program documents and develop-ment of an LGEE Program Logic Chart
Analysis of data in the Program Activity ■
Tracking Database
In-person and telephone interviews with ■
local government partners and SDREO pro-gram managers
Telephone interviews with a program M&V ■
consultant
Site inspection and analysis of claimed ■
energy savings of a sample of completed projects
The SDREO impact evaluation concluded
that while the program achieved significant electrical energy savings, the savings were below program goals. A larger shortfall for natural gas savings was identified.
Process evaluation activities focused on assessing the LGEE program design and implementation process. SDREO examined the LGEE program objective, market barriers, and elements of the program design (e.g., market sector, program strategy, program offerings, incentive pricing) by reviewing program and project activities, character-izing program participation, and surveying local government participants.
Program recommendations included:
A timeframe of at least three years, and pref- ■
erably four years, should be allowed for con-tract negotiations with the program admin-istrator, investor-owned utility (IOu) service provider, and local government participants.
Additional time should be provided follow- ■
ing implementation for contractors to com-plete M&V reviews.
The project management offering could be ■
reworked so that human resources are of-fered, rather than just project management money. Cities that choose not to take proj-ect management funds should have access to more funds in the form of incentives.
Source: Nexant, 2006.
metricnet savings
goals
project savings
% of goalgross net
Coincident peak kW 650 466 373 57%
annual kWh 6,499,574 4,662,034 3,729,627 57%
therms 85,447 33,812 27,050 32%
182 Clean energy Lead by example Guide | Chapter Six

6.4 summary of traCkIng anD evaluatIon approaChes
Table 6.4.1 summarizes typical evaluation approaches, performance indicators, and data to be collected for different types of LBE programs. Note that the primary performance indicator is usually energy saved, with other indicators flowing from the energy savings.
6.5 step 5: report lBe program results
After a state’s LBE program is up and running, energy savings are being tracked, and the evaluation plan is in place, it is important for states to report on the ongoing results of its program. While reporting requirements are frequently imposed by the legislation or executive
taBle 6.4.1 summary of traCkIng anD evaluatIon approaChes By type of Clean energy program
program type and Description typical evaluation approaches
examples of performance Indicators to be tracked and
evaluatedData Collected to measure
primary Indicators
energy efficiency in new buildings designing new and renovated state-owned facilities that reduce energy use and minimize environmental impacts.
Impact, process, and market ■
evaluations.
Typical impact evaluations ■
compare energy use of energy efficient designs with standard buildings or existing building codesbenchmarking is often used.
Energy savings usually analyzed ■
with computer simulations.
Energy savings per square foot ■
Energy cost savings (and cost- ■
effectiveness)
Emissions reduced ■
“Sustainability” indicators ■
Emerging technology ■
indicators
Job creation ■
Number and characteristics of ■
buildings retrofitted or built
Energy efficient building ■
characteristics
Schedule ■
Program costs ■
Weather data ■
Building characteristics ■
Building occupancy ■
Energy costs ■
Emission factors per unit of ■
energy
Characteristics of standard ■
design buildings
energy efficiency in existing buildings implementation of energy conservation measures to improve the energy efficiency of existing state and local facilities.
Impact and process ■
evaluations.
Typical impact evaluations ■
compare energy use of retrofitted building with what energy use would have been without retrofitbenchmarking is often used.
Energy savings usually ■
calculated with deemed savings, some measurements, computer simulations, and/or utility bill analyses.
Energy savings per square foot ■
Energy cost savings (and cost- ■
effectiveness)
Emissions reduced ■
“Sustainability” indicators ■
Emerging technology ■
indicators
Job creation ■
Number and characteristics of ■
buildings retrofitted
Types of retrofits ■
Schedule ■
Program costs ■
Weather data ■
Building characteristics ■
Energy costs ■
Emission factors per unit of ■
energy
Chapter Six | Clean energy Lead by example Guide 183
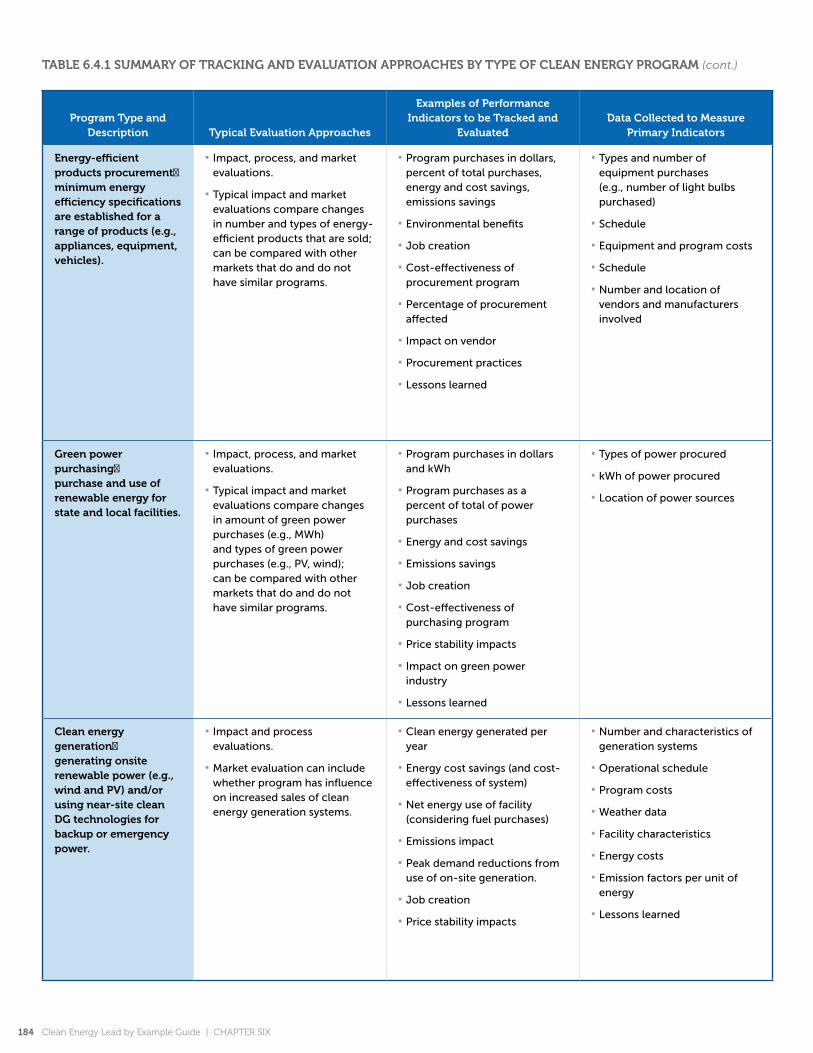
program type and Description typical evaluation approaches
examples of performance Indicators to be tracked and
evaluatedData Collected to measure
primary Indicators
energy-efficient products procurement minimum energy efficiency specifications are established for a range of products (e.g., appliances, equipment, vehicles).
Impact, process, and market ■
evaluations.
Typical impact and market ■
evaluations compare changes in number and types of energy-efficient products that are sold; can be compared with other markets that do and do not have similar programs.
Program purchases in dollars, ■
percent of total purchases, energy and cost savings, emissions savings
Environmental benefits ■
Job creation ■
Cost-effectiveness of ■
procurement program
Percentage of procurement ■
affected
Impact on vendor ■
Procurement practices ■
Lessons learned ■
Types and number of ■
equipment purchases (e.g., number of light bulbs purchased)
Schedule ■
Equipment and program costs ■
Schedule ■
Number and location of ■
vendors and manufacturers involved
green power purchasing purchase and use of renewable energy for state and local facilities.
Impact, process, and market ■
evaluations.
Typical impact and market ■
evaluations compare changes in amount of green power purchases (e.g., MWh) and types of green power purchases (e.g., PV, wind); can be compared with other markets that do and do not have similar programs.
Program purchases in dollars ■
and kWh
Program purchases as a ■
percent of total of power purchases
Energy and cost savings ■
Emissions savings ■
Job creation ■
Cost-effectiveness of ■
purchasing program
Price stability impacts ■
Impact on green power ■
industry
Lessons learned ■
Types of power procured ■
kWh of power procured ■
Location of power sources ■
Clean energy generation generating onsite renewable power (e.g., wind and pv) and/or using near-site clean Dg technologies for backup or emergency power.
Impact and process ■
evaluations.
Market evaluation can include ■
whether program has influence on increased sales of clean energy generation systems.
Clean energy generated per ■
year
Energy cost savings (and cost- ■
effectiveness of system)
Net energy use of facility ■
(considering fuel purchases)
Emissions impact ■
Peak demand reductions from ■
use of on-site generation.
Job creation ■
Price stability impacts ■
Number and characteristics of ■
generation systems
Operational schedule ■
Program costs ■
Weather data ■
Facility characteristics ■
Energy costs ■
Emission factors per unit of ■
energy
Lessons learned ■
taBle 6.4.1 summary of traCkIng anD evaluatIon approaChes By type of Clean energy program (cont.)
184 Clean energy Lead by example Guide | Chapter Six

order initiating the LBE activities, it should be under-taken by program managers regardless. The audience for LBE reporting varies by state but usually includes state agencies, including the budget agency and any advisory council; the governor; the state legislature; and the public.
Reporting requirements vary by state, but typically include some or all of the following:
A Narrative Description of the LBE Actions Taken Dur- ■
ing the Year. The State of Colorado Greening Govern-ment Status Report, for example, includes a description for each state agency of (1) new high performance building projects, (2) energy management activities, and (3) energy performance contracting (Colorado, 2006). Some states also include specific factors that contributed to program successes and the barriers and challenges faced during implementation (Washington, 2005). Other states provide in-depth descriptions of some of their key clean energy projects.
Data on Energy Use. ■ A key component of LBE reports is information on annual energy use compared to baseline energy use and LBE targets, by state facility, agency, or the entire state. For example, Wisconsin reports annual energy use in BTU/sq. ft./year for its baseline year and subsequent years. Data are provided for each state agency and school system, and for indi-vidual facilities (Wisconsin, 2006).
Additional Data Tracked by the State. ■ Some states also report detailed information on other data that they track to evaluate their LBE programs. In New York, for example, NYSERDA issues an annual energy report based on data provided by individual agencies that includes (New York, 2003):
Building square footage ■
Number of buildings ■
Energy use (in MMBTUs) and the percentage of ■
state energy use by fuel type
Estimated cost of energy by fuel type ■
NO ■x, SO2, and CO2 emissions and emission reduc-
tions by fuel type (other states track and report GHG emissions)
Average EUI in BTUs/sq. ft. for base year, reporting ■
year, and target year
Avoided cost savings ■
Peak electricity demand ■
Number of clean vehicles purchased ■
Renewable generation ■ both kWh purchased and generated on-site
Number of buildings that meet ENERGYSTAR ■
criteria
Summary of Findings from Program Evaluations. ■ State reports can also include a summary of the findings from any program evaluation that has been conducted. A complete analysis of evaluation results may be pro-vided as a separate document.
Recommendations for Revising the LBE Approach. ■ It is important to include any recommendations for chang-ing or adding new LBE activities to better meet LBE targets. In addition, tracking and evaluation methods can be reviewed and revised, as needed.
Appendix J, Resources for Reporting the Results of LBE Programs, provides additional information on ways that states are reporting the results of their LBE activi-ties. It includes state reports, tracking forms, agency survey forms, and additional guidance.
referenCes
Applications Team. ■ 2006. Measurement and Verification Documents. Available: http://ateam.lbl.gov/mv/. Accessed 1/9/2007.
ASHRAE. ■ 2006. Advancing HVAC&R to Serve Humanity and Promote a Sustainable World. Available: http://www.ashrae.org/. Accessed 1/9/2007.
BOMA. ■ 2006. National Association of Building Owners and Managers International Web site. Available: http://www.boma.org. Accessed: 12/28/2006.
California. ■ 2006. California Energy Efficiency Evaluation Protocols: Technical, Methodological, and Reporting Requirements for Evaluation Professionals. April. Available: http://www.calmac.org/publications/EvaluatorsProtocols_Final_AdoptedviaRuling_06-19-2006.pdf. Accessed 1/9/2007.
California Climate Action Registry. ■ 2007. California Climate Action Registry Web Site. Available: http://www.climateregistry.org/Default.aspx?refreshed=true. Accessed: May 8, 2007.
Chapter Six | Clean energy Lead by example Guide 185

CALMAC. ■ 2007. Welcome to CALifornia Measurement Advisory Council (CALMAC). Available: http://www.calmac.org. Accessed 1/9/2007.
CEC. ■ 2000. Energy Accounting: A Key Tool in Managing Energy Costs. California Energy Commission. January. Available: http://www.energy.ca.gov/reports/efficiency_handbooks/400-00-001B.PDF. Accessed: 12/16/2006.
CEC. ■ 2006. Western Renewable Energy Generation Information System. What is WREGIS? Available: http://www.energy.ca.gov/portfolio/wregis/index.html. Accessed 1/9/2007.
Colorado. ■ 2006. State of Colorado Greening Government Status Report. August. Available: http://www.colorado.gov/greeninggovernment/reports/Status_Report.pdf. Accessed: 12/16/2006.
Connecticut. ■ 2004. Energy Management in State Facilities: A New Direction. A Report Prepared Pursuant to Public Act 03-132. The Office of Policy & Management Strategic Management Division. February 3. Available: http://www.opm.state.ct.us/pdpd2/energy/PA_03-132_Report.doc. Accessed: 12/16/2006.
ENERGY STAR. Unpublished. ■ Automated Benchmarking With Energy Star Portfolio Manager – Opportunities For States.
F-Chart Software. 2005. F-Chart Software Web site. ■
Available: https://www.fchart.com/index.shtml. Accessed: 12/16/2006.
Georgia 2006a. Energy Accounting and Analysis for ■
Georgia State Government Request For Proposals (RFP). Issued by the Georgia Environmental Facilities Authority, Division of Energy Resources. February.
Georgia. ■ 2006b. Personal communication with Kevin Kelly, Georgia Environmental Facilities Authority. June 8, 2006.
Georgia. ■ 2006c. Georgia Environmental Facilities Authority (GEFA) EnergyCAP Tracking System Web site. Available: http://www.gefa.org/Index.aspx?page=184. Accessed: 2/28/2008.
IFMA 2006. International Facility Management ■
Association Web site. Available: http://www.ifma.com. Accessed: 12/28/2006.
IPMVP. ■ 2002. International Performance Measurement & Verification Protocol: Concepts and Options for Determining Energy and Water Savings, Volume 1. DOE/GO-10202-1554. March. International Performance Measurement & Verification Committee. Available: http://www.evo-world.org/index.php?option = com_content&task = view&id = 61&Itemid = 80. Accessed: 12/06/2006.
LBNL. ■ 2006. DOE-2. Lawrence Berkeley National Laboratory Simulation Research Group. DOE-2 Web site. Available: http://gundog.lbl.gov/dirsoft/d2whatis.html. Accessed: 12/16/2006.
Massachusetts. ■ 2004. Fiscal Year 2002 Massachusetts Greenhouse Gas Inventory for State Agencies. Massachusetts State Sustainability Program. February. Available: http://www.mass.gov/envir/Sustainable/pdf/MA_GHG_Inventory_FY02_web.pdf. Accessed: 12/16/2006.
Miller, J. ■ 2008. Memo on California’s Building Energy Use Data. February 14.
National Action Plan for Energy Efficiency (NAPEE). ■ 2007. Model Energy Efficiency Program Impact Evaluation Guide. Prepared by Steven R. Schiller, Schiller Consulting, Inc. Available: http://www.epa.gov/cleanenergy/documents/evaluation_guide.pdf. Accessed: December 7, 2007.
Nexant. ■ 2006. Final Report. Evaluation, Measurement & Verification of the 2004–2005 Local Government Energy Efficiency (LGEE) Program of the San Diego Regional Energy Office (SDREO). CPUC Program #1301-04. Submitted to SDREO. July 1.
NYSERDA. ■ 2003. Executive Order No. 111 “Green And Clean” State Buildings and Vehicles Annual Energy Report, July 2003. Prepared by New York State Energy Research and Development Authority and the Advisory Council on State Energy Efficiency. Available: http://www.nyserda.org/programs/pdfs/execorder111finalreport7-03.pdf. Accessed: 12/16/06.
NYSERDA. ■ 2004. Enhanced Commercial/Industrial Performance Program. Available: http://www.nyserda.org/programs/Commercial_Industrial/cipp.asp. Accessed 1/9/2007.
186 Clean energy Lead by example Guide | Chapter Six
Parker, S., B. Hamilton, and M. Wickenden. ■ 2008. What Does it Take to Turn Load Growth Negative? A View from the Leading Edge. Vermont Energy Investment Corporation and Efficiency Vermont for the 2008 ACEEE Summer Study on Energy Efficiency in Buildings. Accessed: 11/08/2008.
PG&E. 2006. 2001 SPC Program Manual and Forms. ■
Available: http://www.pge.com/biz/rebates/spc_contracts/2001_manuals_forms/index.html. Accessed 1/9/2007.
Schiller, S. ■ 2006. Personal communication with Steven Schiller, Independent Consultant. 12/5/06.
SECO. ■ 2007. LoanSTAR Technical Guidelines. Available: http://www.seco.cpa.state.tx.us/ls_guideline.htm. Accessed 1/9/2007.
Texas A&M. 2006. Texas A&M System Energy Systems ■
Lab. TEES, the Engineering Agency of the State of Texas Web site. Available: http://esl.eslwin.tamu.edu/resources/software.html. Accessed: 12/16/2006.
Tradeline. ■ 2006. Leading-Edge Resources for Facilities Planning and Management Web site. Available: http://www.tradelineinc.com/. Accessed: 12/28/2006.
TXU Electric Delivery. ■ 2007. Energy Efficiency Programs. Available: http://www.oncorgroup.com/electricity/teem/candi/default.asp. Accessed 1/9/2007.
U.S. DOE. ■ 2000. M&V Guidelines: Measurement and Verification for Federal Energy Projects. Version 2.2. DOE/GO-102000-0960. Available: http://ateam.lbl.gov/mv/docs/26265.pdf. Accessed 1/9/2007.
U.S. DOE. ■ 2006. DOE-2 Web site. Available: www.doe2.com. Accessed: 12/16/2006.
U.S. DOE. ■ 2007. Office of Energy Efficiency and Renewable Energy. Impact Evaluation Framework for Technology Deployment Programs. July. Available: http://www.eere.energy.gov/ba/pba/km_portal/docs/pdf/2007/impact_framework_tech_deploy_2007_main.pdf. Accessed: 2/20/2008.
U.S. DOE. ■ 2008. Energy Information Administration. Commercial Buildings Energy Consumption Survey - Commercial Energy Uses and Costs Web site. Available: http://www.eia.doe.gov/emeu/cbecs/. Accessed: 3/22/2008.
U.S. DOE. ■ 2007. The Office of Policy and International Affairs. Enhancing DOE’s Voluntary Reporting of Greenhouse Gases (1605(b)) Program Web Site. Available: http://www.pi.energy.gov/enhancingGHGregistry/index.html. Accessed: 5/8/2007.
U.S. EPA. ■ 2006a. Clean Energy-Environment Guide to Action: Policies, Best Practices, and Action Steps for States. April. Available: http://www.epa.gov/cleanenergy/pdf/gta/guide_action_full.pdf. Accessed: 12/16/2006.
U.S. EPA. ■ 2006b. Unpublished analysis conducted by EPA staff based on information contained in the ENERGY STAR Overview Web site (http://www.energystar.gov/index.cfm?c = evaluate_performance.bus_portfoliomanager) and IPMVP Library of Documents, Volume 1 (http://www.evo-world.org/index.php?option = com_content&task = view&id = 61&Itemid = 80).
U.S. EPA. ■ 2007. Portfolio Manager Tool. Available: http://www.energystar.gov/index.cfm?c = evaluate_performance.bus_portfoliomanager. Accessed: 1/9/2007.
U.S. EPA. ■ 2007a. ENERGY STAR Performance Ratings Methodology for Incorporating Source Energy Use. December. Available: http://www.energystar.gov/ia/business/evaluate_performance/site_source.pdf. Accessed: 2/23/2008.
U.S. EPA. ■ 2007b. Understanding Source and Site Energy Web site. Available: http://www.energystar.gov/index.cfm?c=evaluate_performance.bus_benchmark_comm_bldgs. Accessed: 2/23/2008.
U.S. EPA. ■ 2008. ENERGY STAR Building Upgrade Manual. Available: http://www.energystar.gov/index.cfm?c=business.bus_upgrade_manual. Accessed: 11/10/2008
U.S. EPA. ■ 2008a. Guidelines for Energy Management. Available: http://www.energystar.gov/index.cfm?c=guidelines.download_guidelines. Accessed: 11/10/208
U.S. Green Building Council. ■ 2006. What is LEED? Available: http://www.usgbc.org/. Accessed 1/9/2007.
Chapter Six | Clean energy Lead by example Guide 187
http://www.eere.energy.gov/ba/pba/km_portal/docs/pdf/2007/impact_framework_tech_deploy_2007_main.pdf
http://www.eere.energy.gov/ba/pba/km_portal/docs/pdf/2007/impact_framework_tech_deploy_2007_main.pdf

Washington. ■ 2005. State of Washington, Department of General Administration. Sustainability Progress Report, for the period of Year 2: July 1, 2004—June 30, 2005. October 15. Available: http://www.ga.wa.gov/Sustainability/2005SustainabilityReport.pdf. Accessed: 12/l6/2006.
Wisconsin. ■ 2006. Energy Use in State-Owned Facilities, Fiscal Year 2005. April. State of Wisconsin, Department of Administration. Available: http://www.doa.state.wi.us/docs_view2.asp?docid = 990. Accessed: 12/16/2006.
Wyoming Business Council. ■ 2007. Wyoming Energy Conservation Improvement Program: Program Manual. July 1. Available: http://www.wyomingbusiness.org/pdf/energy/1-WYECIP_Program_Manual_7-1-07.pdf. Accessed: 2/23/2008.
Wyoming Business Council. ■ 2007a. Wyoming Energy Conservation Improvement Program: Program Manual: Appendix 1K WYECIP Contract Attachment F, Measurement and Verification Plan Guidelines. May 22. Available: http://www.wyomingbusiness.org/pdf/energy/Appx_1K-WYECIP_Contract_Attach_FMandV_Plan_Guide.pdf. Accessed: 2/23/2008.
188 Clean energy Lead by example Guide | Chapter Six
Related Documents