Chapter One Science Skills

Welcome message from author
This document is posted to help you gain knowledge. Please leave a comment to let me know what you think about it! Share it to your friends and learn new things together.
Transcript

Chapter OneScience Skills
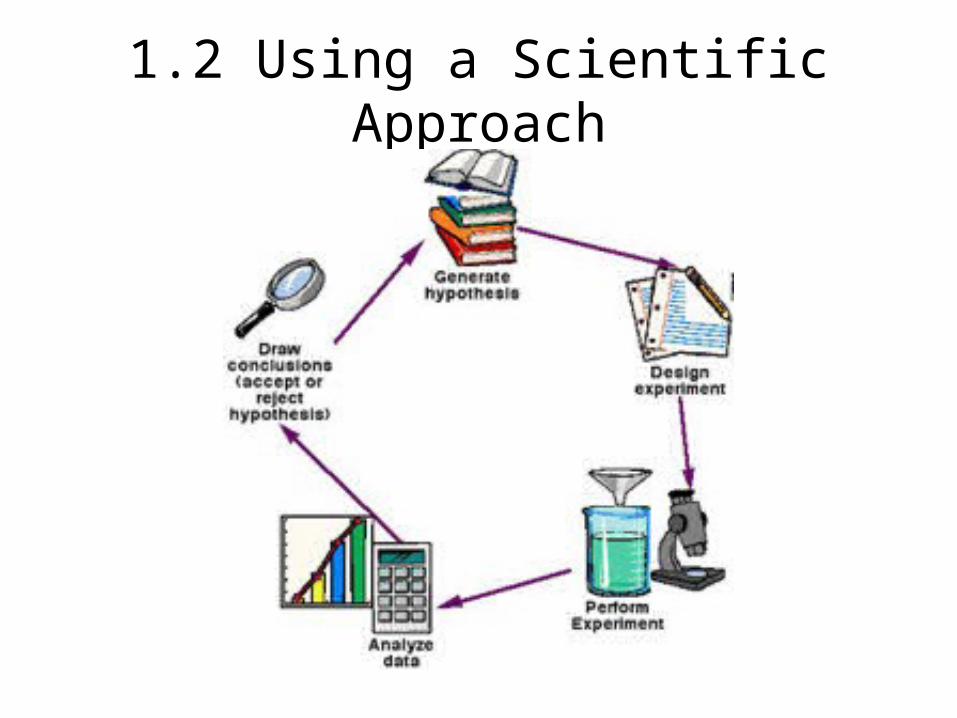
1.2 Using a Scientific Approach

Using a Scientific Approach
• Scientific Method: an organized plan for gathering, organizing, and communicating information– The goal of any scientific method is to
solve a problem or better understand an observed event.


Scientific Method
• It is important to remember that the scientific method can vary from case to case, but in general the following steps must be included:1. Making Observations/leads to Question2. Forming a Hypothesis3. Testing a Hypothesis4. Analyzing Data & Drawing Conclusions5. Developing a Theory
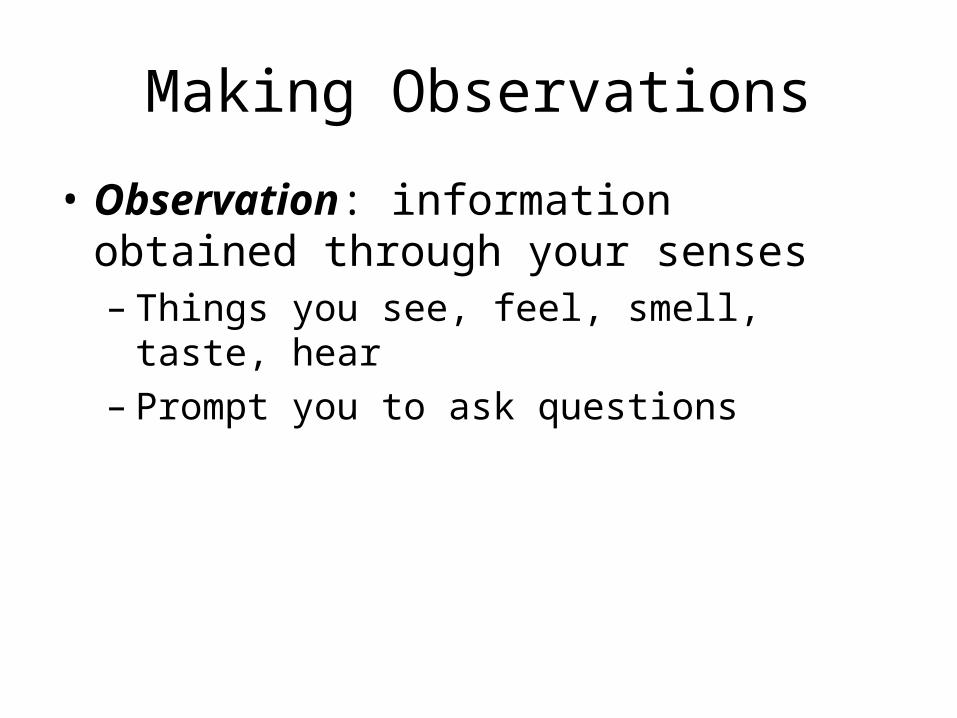
Making Observations
• Observation: information obtained through your senses– Things you see, feel, smell, taste, hear– Prompt you to ask questions
Forming a Hypothesis
• Hypothesis: a proposed answer to a question– STATEMENT, not a question!– A hypothesis must be testable– If/Then statement
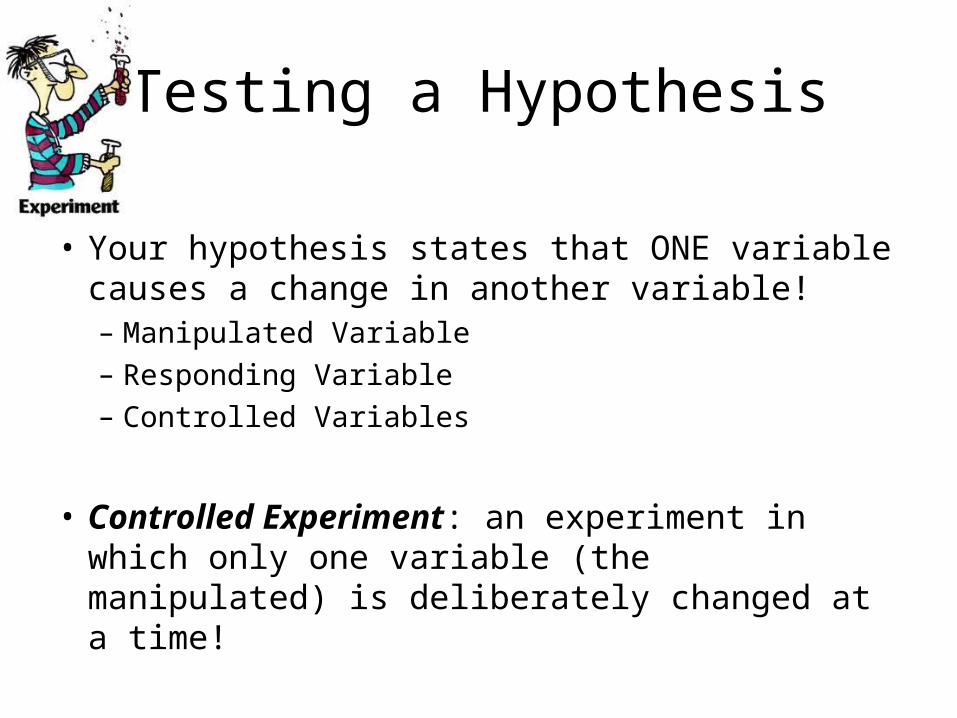
Testing a Hypothesis
• Your hypothesis states that ONE variable causes a change in another variable! – Manipulated Variable– Responding Variable– Controlled Variables
• Controlled Experiment: an experiment in which only one variable (the manipulated) is deliberately changed at a time!

VariablesHypothesis: If I run in the rain then I will stay drier than if I
walk.
• Manipulated: the variable that causes a change in another– Example: speed (pace)
• Responding: the variable changes in response to the manipulated– Example: amount of water accumulated
• Controlled: variables that must be kept constant in all trials– Example: amount of rain, wind speed, distance
Drawing Conclusions
• If your experiments (with several trials) support your hypothesis you have scientific evidence to support the hypothesis
• What happens if data do not support the hypothesis?–Revise hypothesis or propose a new
one• New experiments must then be designed to test the revised or new hypothesis

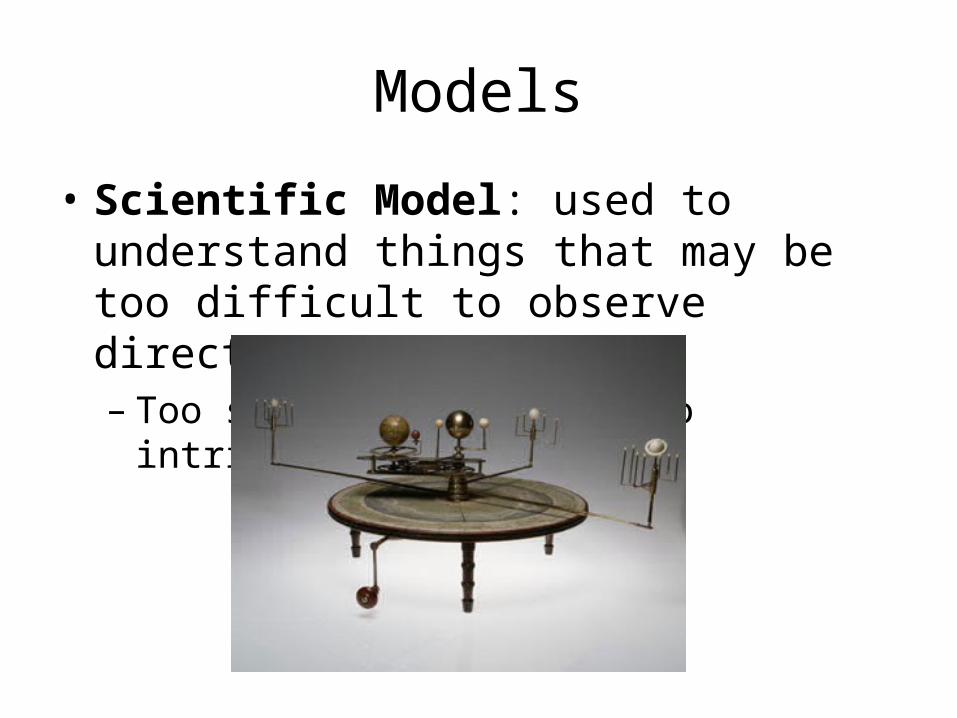
Models
• Scientific Model: used to understand things that may be too difficult to observe directly– Too small, too large, too intricate
1.3 Measurement

The Metric System• Several base units in the metric system, we will most
often use the following:
– Length: straight-line distance between two points• Base Unit = meter (m)
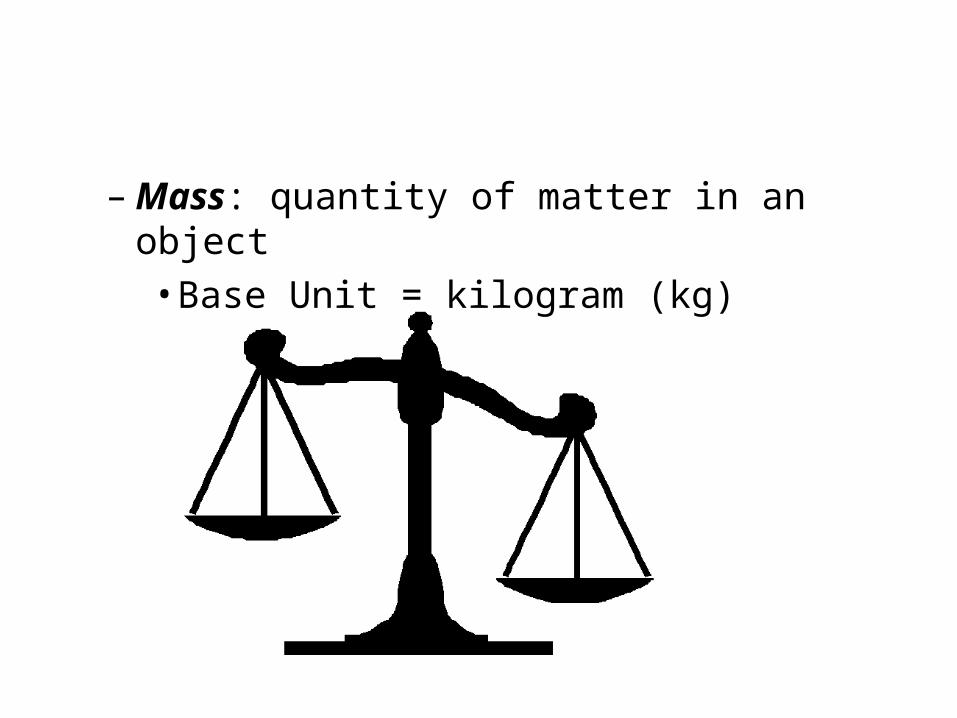
– Mass: quantity of matter in an object• Base Unit = kilogram (kg)
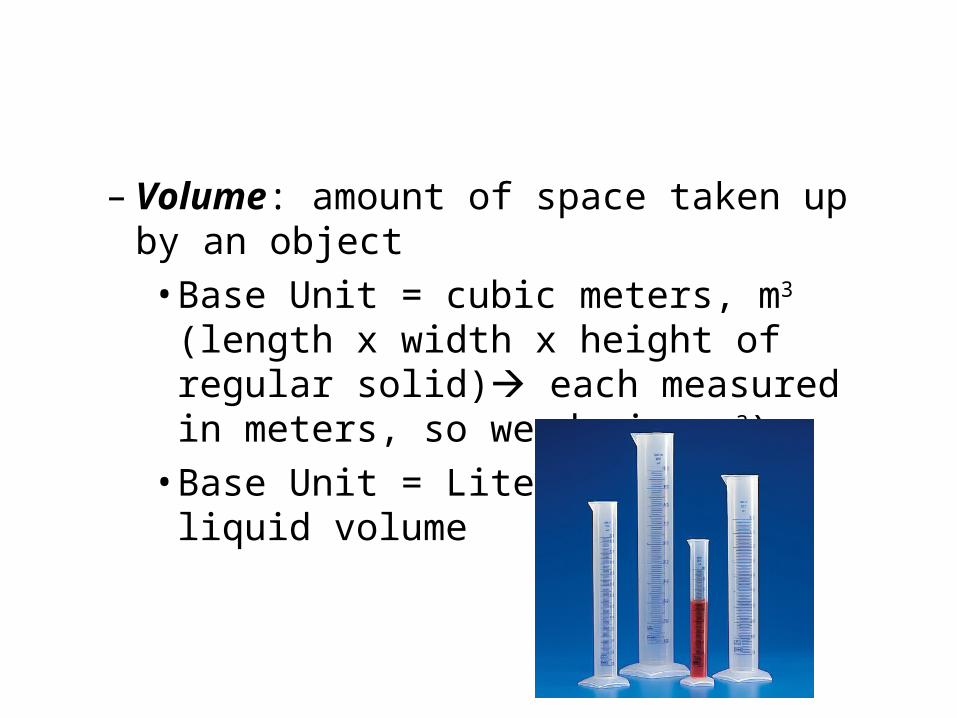
– Volume: amount of space taken up by an object• Base Unit = cubic meters, m3 (length x width x
height of regular solid) each measured in meters, so we derive m3)• Base Unit = Liters, L for liquid volume
• Density: the ratio of the mass of a substance to its volume (how tightly packed together particles are)
• D = mass(g)/volume(mL)
• Density can be used to test puritity
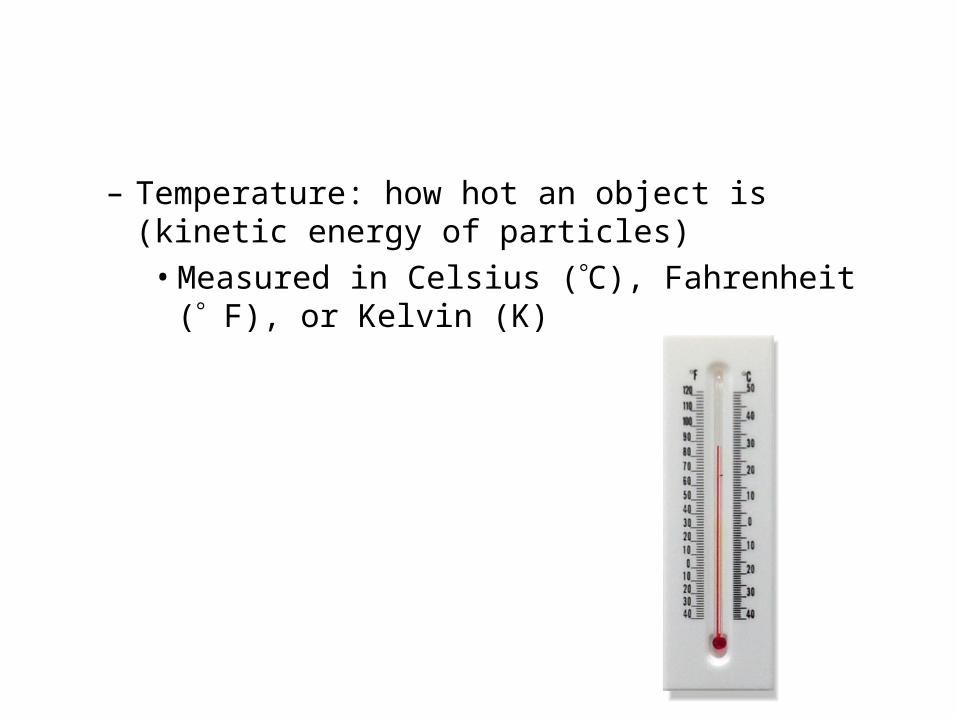
– Temperature: how hot an object is (kinetic energy of particles)• Measured in Celsius (C), Fahrenheit ( F), or Kelvin (K)
Metric Prefixes
• The metric unit for a given quantity is not always a convenient one to use.
• A metric prefix simply tells us how many times a unit should be multiplied or divided by 10

Commonly Used Metric Prefixes
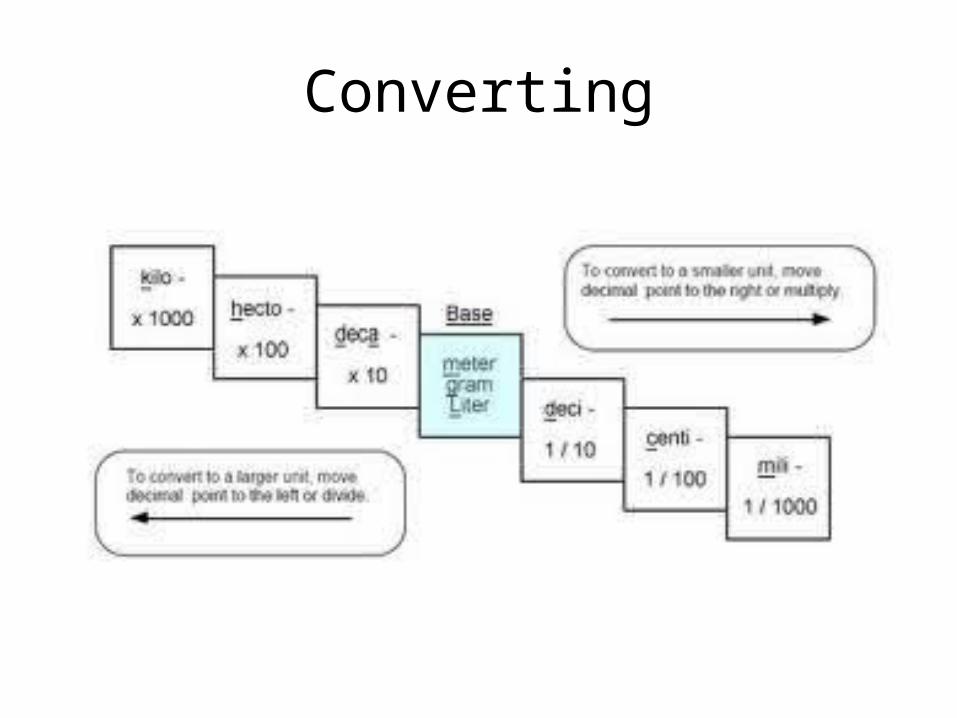
Converting

Practice
1) 5200g = ? Kg 2) 0.002L = ? mL

• Answer: 1) 5.200gMove decimal 3 steps to the left2) 2mLMove decimal 3 steps to the right
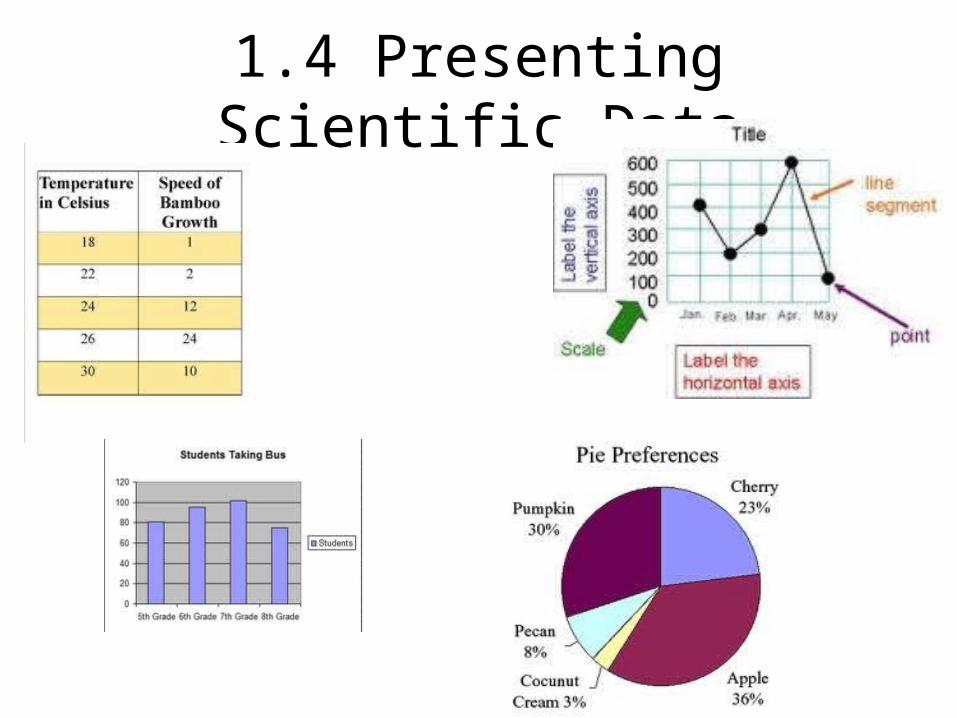
1.4 Presenting Scientific Data
Organizing Data
• Scientists can organize data by using data tables and graphs
• Data Table: information organized in a table• Graph: visual representation of data
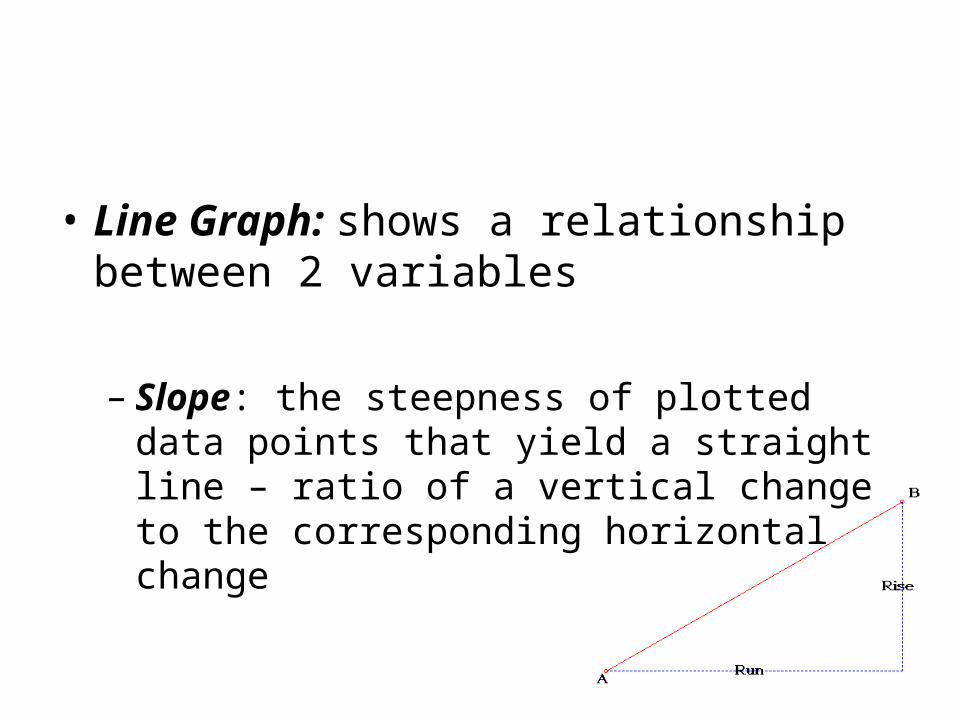
• Line Graph: shows a relationship between 2 variables
– Slope: the steepness of plotted data points that yield a straight line – ratio of a vertical change to the corresponding horizontal change
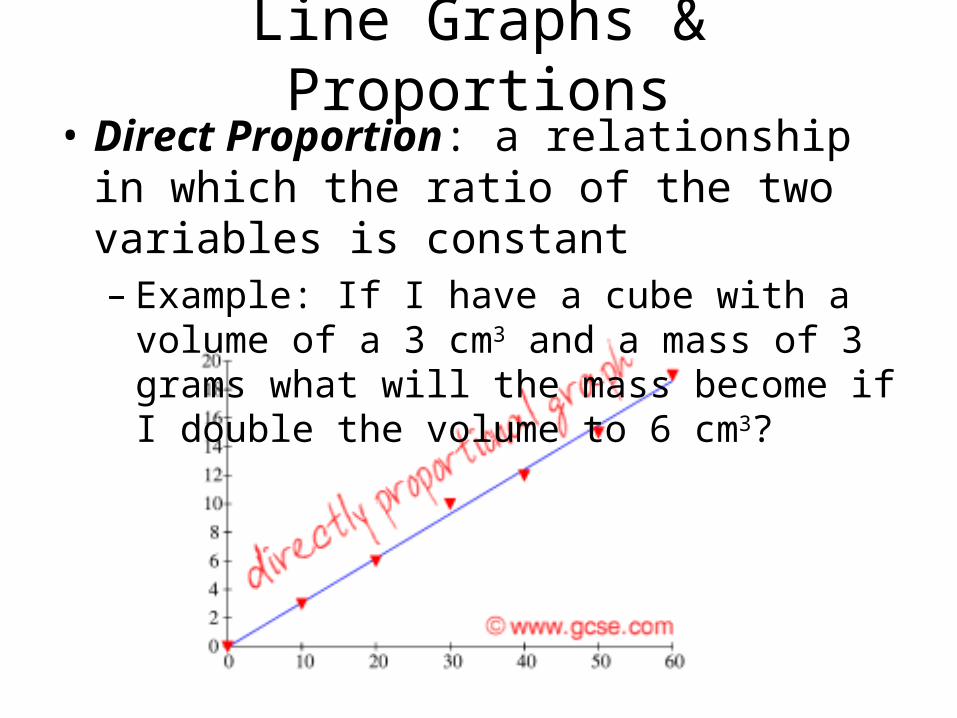
Line Graphs & Proportions• Direct Proportion: a relationship in which the
ratio of the two variables is constant– Example: If I have a cube with a volume of a 3 cm3
and a mass of 3 grams what will the mass become if I double the volume to 6 cm3?

Line Graphs & Proportions• Inverse Proportion: relationship in which the
product of the two variables is a constant– Example: I am filling a 1-gallon pot. I start with a
flow rate of 0.5 gallon/minute and it takes two minutes to fill the pot.
– How long will it take to fill the same 1-gallon pot if I double the flow rate to 1 gallon/minute?
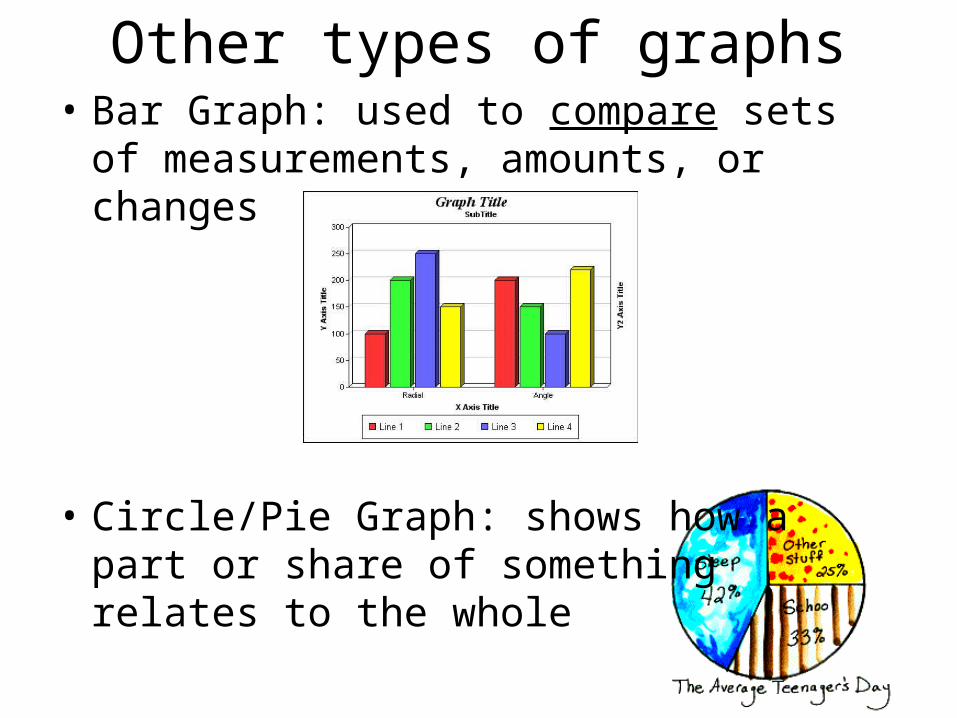
Other types of graphs• Bar Graph: used to compare sets of
measurements, amounts, or changes
• Circle/Pie Graph: shows how a part or share of something relates to the whole
Related Documents