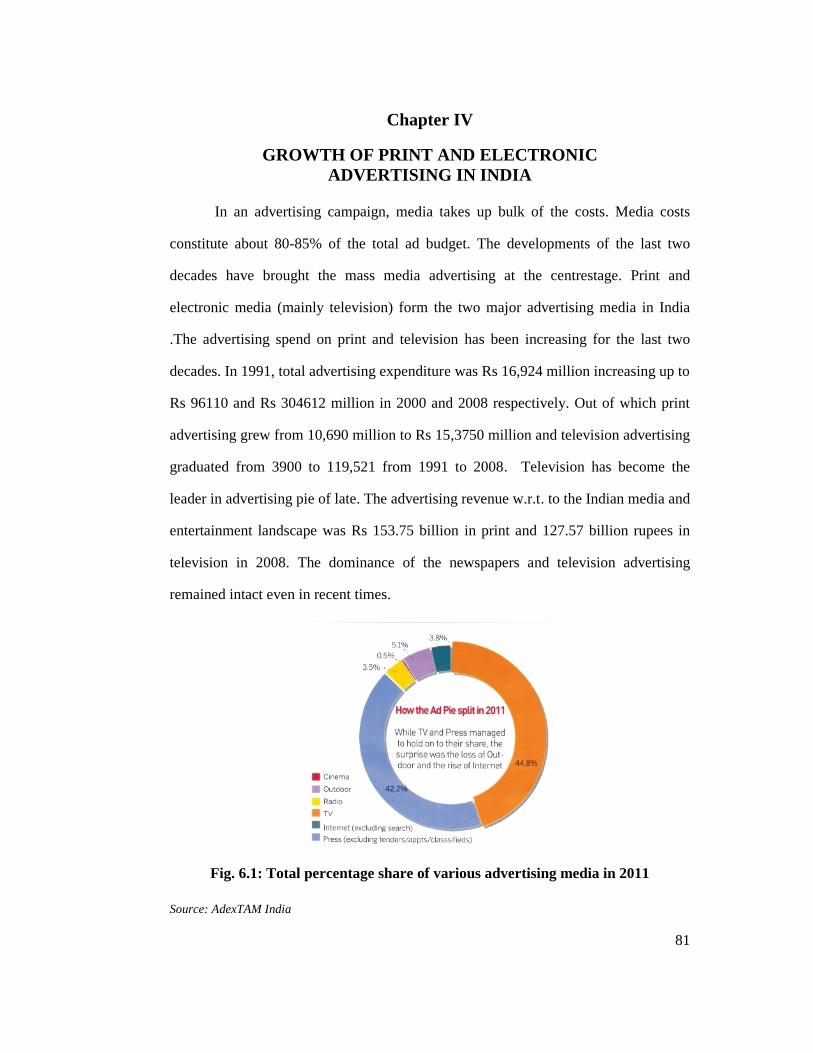
81 Chapter IV GROWTH OF PRINT AND ELECTRONIC ADVERTISING IN INDIA In an advertising campaign, media takes up bulk of the costs. Media costs constitute about 80-85% of the total ad budget. The developments of the last two decades have brought the mass media advertising at the centrestage. Print and electronic media (mainly television) form the two major advertising media in India .The advertising spend on print and television has been increasing for the last two decades. In 1991, total advertising expenditure was Rs 16,924 million increasing up to Rs 96110 and Rs 304612 million in 2000 and 2008 respectively. Out of which print advertising grew from 10,690 million to Rs 15,3750 million and television advertising graduated from 3900 to 119,521 from 1991 to 2008. Television has become the leader in advertising pie of late. The advertising revenue w.r.t. to the Indian media and entertainment landscape was Rs 153.75 billion in print and 127.57 billion rupees in television in 2008. The dominance of the newspapers and television advertising remained intact even in recent times. Fig. 6.1: Total percentage share of various advertising media in 2011 Source: AdexTAM India

Welcome message from author
This document is posted to help you gain knowledge. Please leave a comment to let me know what you think about it! Share it to your friends and learn new things together.
Transcript
81
Chapter IV
GROWTH OF PRINT AND ELECTRONICADVERTISING IN INDIA
In an advertising campaign, media takes up bulk of the costs. Media costs
constitute about 80-85% of the total ad budget. The developments of the last two
decades have brought the mass media advertising at the centrestage. Print and
electronic media (mainly television) form the two major advertising media in India
.The advertising spend on print and television has been increasing for the last two
decades. In 1991, total advertising expenditure was Rs 16,924 million increasing up to
Rs 96110 and Rs 304612 million in 2000 and 2008 respectively. Out of which print
advertising grew from 10,690 million to Rs 15,3750 million and television advertising
graduated from 3900 to 119,521 from 1991 to 2008. Television has become the
leader in advertising pie of late. The advertising revenue w.r.t. to the Indian media and
entertainment landscape was Rs 153.75 billion in print and 127.57 billion rupees in
television in 2008. The dominance of the newspapers and television advertising
remained intact even in recent times.
Fig. 6.1: Total percentage share of various advertising media in 2011
Source: AdexTAM India

82
4.1 GROWTH OF PRINT ADVERTISING IN INDIA
In the words of Vinita. k. Kandekar ‘Indian print business is in the best years
of its evolution’. FDI in print media opened up the sector to both national and foreign
media players alike. In the last five years,from 2007 onwards, there has been flurry of
newspaper launches both in language and English press. National Readership Survey
postulated that the continuing growth of print media can be attributed to the
demographic changes and the literacy rate (66% in 2005). The average number of
members per household have gained the ability to read and write creating more space
for newspapers in their homes. It has been noted that there exists direct relationship
between growth of gross domestic product (GDP) and the advertising revenue. The
latter runs the newspapers and other publications as circulation ( paid or through
subscription) does not contribute to more that 15% of the revenue for English
language and 30-45% for language press.
Fig. 6.2: Share of advertising revenue of English and Vernacular press
Source: AdEx

83
Even though circulation of vernacular publication is far more than English
readership, the advertising rate of a English publication is three times1 the rate bagged
by a Hindi or a regional newspaper or magazine. Hence, print advertising in English
publications play a large role in the whole cost revenue relationship. Within print
advertising, newspapers are more favoured by advertisers than the magazines. In 2004
magazines had almost 10% share in the print ad pie. It has come down to 3.5% in
2011. The yearly spend on print advertising from 2007 to 2011 has moved up from
8470 Cr to 10,791 Cr. According to TAM Adex, a daily newspaper on an average
consumed 4.5 lakh cc in 2011 for advertising. In India, the print industry grew by 8.4
percent from 2010 to 2011 i.e. from Rs. 193 billion it grew to Rs. 209 billion (FICCI-
KPMG India Media and Entertainment Industry Report 2012). The report further
points out that Advertising revenue grew 8.7 percent while the circulation revenue
grew 3.7 percent, clearly reinforcing the importance of advertising media. Thus,
unlike many global markets, India continues to show a growth in the newspaper
industry every year. With literacy levels going up and more people being added to the
target audience of newspapers, this healthy growth is expected to continue another
five to ten years.
Fig. 7: Increase in print advertising with increase in no. of brands
Source : AdEx India.
1 Source : www.agencyfaqs.com

84
As the print media spread out at the geo-demographical level, there was
plethora of opportunities for the advertisers to use it for its various products. On one
hand, newspapers provided options in the categories of classifieds, classified displays,
display advertising and reading notices, magazines provided choices and editorial
environment for customised messages.
Fig 8.1: Growth in the number of advertisers w.r.t print from 2000-2009
Source : AdEx India.
The incline curve indicates an upward movement of advertisers investing in
the print media. It shows a six times increase in the number of advertisers in print
during Jan-Sep 2009 over 2000.
Fig. 8.2: Increase in the number of brands for print advertising from 2000-2009
Source : AdEx India
The graph clearly shows that there has been 4-5 times growth in the total
number of brands advertised in print media during Jan-Sep 2009 over 2000.
85
Newspaper advertising is bagging more advertisers every year emerging as the
top advertising form , followed closely by television .
4.1.2 Trends showcasing product –print advertising from 2000-20102
• Six times increase in number of advertisers in print during Jan-Sep ‘09 over
2000.
• The number of exclusive advertisers in print has increased by 7 times during
the last ten years.
• 4.5 times growth in number of brands advertised in print during Jan-Sep‘09
over 2000.
• ‘Banking/Finance/Investment’ has maintained its rank in the Top 10 list of
sectors of 2000 and Jan-Sep’09 in print whereas experimented with alternative
media or new media options.
• Public Service Advertisements (PSA) have emerged as the top category in
print lately in sharp contrast to the year 2000.
• LG Electronics India Ltd and Samsung India Electronics were only two
common advertisers in the top 10 list of advertisers in Print of 2000 and Jan-
Sep ’09.It indicates the consistent reliance of consumer appliances brands on
newspaper advertising.
• Print innovative ad layouts increased by 4 times during Jan-Sep ’09 compared
to 2005.
• Education sector was the top sector in Print advertising in 2010.Maximum
advertising for educational institutions category in Print during H1 ‘2010.
2 Facts and analysis compiled from AdEx India, HTML version of http://www.tamindia.com/tamindia/ accessed on Ist October, 2010
86
• Tata Motors Ltd leads in Print advertising during H1 ‘2010.
• Print advertising skewed towards Newspapers during H1 ‘2010.
A comparative analysis of product categories spending on print advertising
shows that FMCG (Household items, Impulse and personal care items), education,
telecommunication etc. have been increasing steadily. Media products too have shown
increase in advertising volumes in the last year. In 2007, FMCG personal care has
increased its ad volume from 3.8 % to 5.5 % in 2011. In 2010, 9.8% of the print
advertising revenue has come from the automobile sector. Sanjay Gupta, CEO, Jagran
Group and Editor, Dainik Jagraan thinks “print will go till 17-18% percent growth in
advertising spends”. The continued rise in print advertising can be attributed to the
inherent nature and scope of the print media as a medium of advertising .Newspapers
are the primary reason for people’s preference for print. The expansion of newspaper
industry has created abundant options for the advertisers cutting across product class
and type. Newspapers have been categorised largely by the frequency of delivery,
physical size and audience. On the basis of frequency newspapers are of two types:
the daily newspapers and the weekly newspapers. On the basis of physical shape
we have broadsheets and tabloids, audience based newspapers can be shopping
newspapers or special Sunday newspaper of the morningers. There are daily
newspapers in English, Hindi and other regional languages along with their
supplements, both local and specialised. Newspaper advertising has been traditionally
classified as display advertising, classified and classified display ads, public notices
and pre printed inserts. In addition to varied formats, the quality of reproduction has
improved considerably making it as attractive as a magazine for the readers and the
advertisers. Some of the features that make newspaper advertising maintain a
commanding position are:

87
1) Timeliness : Newspapers arrive everyday at the readers doorstep, allowing the
advertiser the opportunity to reach the audience immediately i.e. the
advertisement can appear very quickly sometimes in just one day series of
advertisements are published to elicit desired response.
2) Editorial support : The editorial content is vital to the audience creating an
environment for the advertising content.
3) Broad based yet selective : Modern day newspapers have both reach and
penetration on their side. The national newspapers reach is widespread
whereas the supplements and allied insertions are niche; target oriented
creating a favourable mix of consumers for the advertiser. It covers a wide
geographical area with zoned editions for specific neighbourhood or
communities.
4) Comprehensive in scope : Newspapers cover an extraordinary range of topics
and issues making it suitable for all kinds of local, regional and national
brands.
5) Credibility : The trustworthiness of the printed word makes newspapers as the
most believable medium of advertising amongst all.
6) Creative flexibility : An ad’s physical size and shape can be modifies to suit
the requirements of theme, concept or campaign objectives. Last minute
changes in design and layout can also be accommodated. Besides, new
information can be added without particularly creating a new ad.
7) An active medium : Here the audience is not passive. The reader turns the
pages; sort through the content and above all control the exposure unlike TV
and Radio.
88
8) Permanent medium : In contrast to electronic media, newspapers are a
medium of reference both for news and non news content, direct response
advertising and sales promotion offers in advertising is often saved by the
people for future use.
9) Advertiser friendly : Not only creatively flexible, all kinds of advertisers with
low, medium or high budgets can use newspaper advertising
10) Frequency : Daily newspapers arrive every morning with pages for all. Since
newspaper arrives every day, advertisers can communicate their messages
resulting in continuous impressions.
11) Can direct the customers to stores : Local advertising in newspapers is
directly proportional to retail visits for most products.
The success of newspaper advertising in India lies in its strong hold over four3
basic concepts namely: reach, frequency, impact and continuity.
4.2 GROWTH OF TELEVISION ADVERTISING IN INDIA
Television ushered in a creative revolution across the globe by wrapping a
creative idea in multiple variations of sight, sound and spoken word. Claims have
been made about the invention of electronic television: Who marketed and developed
this medium in order for it to succeed? Who was involved in setting the universal
standards for television? It is documented that J.L. Baird was the first person to record
a mechanical television production. In India, SITE (Satellite Instructional Television
Experiment) was conducted in 1975-76. It was an attempt to use sophisticated
technology of satellite broadcasting for social education. Early eighties saw the
3 Kelley ,L.D. and Jugenheimer, D. W., 2009, Advertising Media Planning : A BrandManagement Approach, Ch-2,pp-12-14, PHI Learning Private Systems

89
introduction of regular satellite links between Delhi and other transmitters and the
launch of national programmes. In 1982, television went colour. Soon there were host
of foreign channels beaming their content in India. It was the beginning of a new
India. Media and related industries like advertising underwent profound changes with
the invention of television. With the new economic reforms the Indian government
followed a liberal policy in permitting the transmission or reception of foreign
satellite channels. This led to an inflow of programmes with varied themes, stories
and presentation formats. The programmes dealt with issues sometimes related to our
socio cultural fabric and sometimes completely new to our value system. The
cornucopia of channels and programmes on each channel has created a hold on
everyone: audiences, investors and advertisers. Now, commercial broadcasting was
heavily dependent on advertising for its survival. It did not take long for the national
advertisers to discover the power of television advertising to reach mass audience
quickly and frequently.
Advertising spend on TV has climbed up from 3,950 million in 1991 to Rs
119,521 million in 2008. Advertisers see a lot of potential in television, ad revenue
from TV in India is a moderate $ 2096 in comparison to $ 57470 billion in USA and
$6350 in UK. The advertisers feel Indian broadcasting scene is highly optimistic and
offers variety of innovative possibilities for advertising and promotion. Amongst all
channels, Hindi general entertainment channels have been getting maximum
viewership consistently, followed by film based channels and news channels. English
and other vernacular channels have been growing though not at the same rate (Fig.9).

90
Fig. 9: The share of viewership of various television channels in India
Source: TAM Index
There has been a significant rise in television advertising over the last five
years. From 10-30 second spots to long television ad campaigns, most advertisers
include television as a necessary component in their media plans.
Fig. 10: Growth of television advertising from 2006-2011
Source : TAM Index

91
Trends also show that all types of products are now using television
advertising. Edible items, daily use commodities, household products , appliances and
the services sector in particular have increased their advertising budget manifold in
the last five years .New products have increased television advertising considerably(
Fig.11).
Fig.11: Increase in number of brands using television advertising from 2000-2009.
Source : TAM Index
4.2.2 Trends showcasing product - television advertising from 2000-20104
Given below are some of the salient developments in television advertising in
the last three decades.
In 2011, a mixed bag of brands contributed most to the TV ad share. Cellular
operators, edible packed food like complain, Colgate along with other FMCG’s like
shampoos, detergents and bathing soaps dominated the share. 7.6 % of the TV’s ad
revenue have come from automobile sector . Tata Nano and Hero Motocorp being the
top spenders in recent times.
• 74% growth in number of advertisers on television from 2000 to 2009.
• Compared to 2000, 52% increase in number of exclusive advertisers on
television in the last ten years.
4 Facts and figures compiled from TAM viewership Index, HTML version of http://www.tamindia.com/tamindia/ accessed on Ist October , 2010
92
• 66% rise in count of brands on TV during Jan-Sep’09 over 2000.
• F&B and Personal Care/Personal Hygiene the top two sectors have maintained
their ranks over the ten year period.
• Cellular Phone Services and PSA were among the top 3 position in the Top 10
list of categories on TV of Jan-Sep ’09, which were not even present in the top
10 list of 2000.
• Hindustan Lever Limited maintained its top position as a brand umbrella on
TV during 2000 and Jan-Sep ’09.
• Bollywood garnered high share of celebrity endorsements on TV during 2003
and Jan-Sep ’09. During 2003, 66% share was gathered by the hindi film
Actors and Actress together on TV.
• Airtel Cellular Phone Service was the top brand present on TV since 2000.
• During Jan-Sep ‘09, five out of Top 10 categories belonged to FMCG sector
and two were from Automobile sector.
• Compared to 2000,five new categories in the top 10 list of Jan-Sep ’09 on TV
viz. Cellular Phone Service, Social Advertisements, Two Wheelers, DTH
Service Providers’ and Milk Beverages.
• Five common categories in the Top 10 list of 2000 and Jan-Sep '09 were Toilet
Soaps, Aerated Soft Drinks, Shampoos’, Tooth Paste, Cars & Jeeps.
• Compared to 2000, 5 of the advertisers have moved up in its rank to be among
the top 10 list of Jan-Sep ’09 on TV viz. Cadburys India Ltd, Smithkline
Beecham, Bharti Airtel Ltd’, ITC Lt’ and Colgate Palmolive India Ltd.
• Reckitt Benckiser (India) Ltd at the 10 position in 2000, secured its position
among the top 3 list of advertisers of Jan-Sep ’09 on TV.
93
• HUL, Reckitt Benckiser (India) Ltd, Coca Cola India Ltd, Pepsi Co’ and
Procter & Gamble have been the common advertisers among the top 10
advertisers list on TV of 2000 and Jan-Sep ’09 indicating the popularity of
television advertising across time zones. The trends in the next four years
(2009-2013) project more performance for TV ads. Kevin Vaz, President ad
sales ,Star India sums up the buoyant mood, “I expect television ad revenue in
2011 to grow by a minimum of 14-15% over last year. Various factors have
contributed to this growth. The genres which command a lion’s share which is
GEC’s and cricket had a great year.”
Television advertising or television commercials are largely advertisements of
various products before the beginning, in the middle or at the end of the programs
being run on network, cable or satellite television. Advertisers decide on when to air
these commercials. Various day parts include daytime ( 9 am to 4 pm) early fringe (
4:00pM to 5:30 PM) , early news ( 5:30-7:30 pm) , prime access ( 7:30-8:00 PM) ,
prime time ( 8:00-11:00 PM) and late fringe ( 11:00-1 AM).
No other form of advertising medium has the potency and impact of television
w.r.t. mass audience. It has vast array of tools and effects to create an advertising
message exactly the way the sender wants to. Salient features of TV advertising are:
1) Mass Coverage : Television advertising can reach maximum number of
people with one communication message. Since there are more than 800
channels, the TV viewing hours have increased from five hours to 8 hours
in 2008.
94
2) Relatively low cost : Even though cost of production in television advertising
is high, its equally huge audience brings the cost per exposure down. The
advertiser finds the cost per person reduced to a reasonable degree.
3) Selectivity : Specialised programming content and dedicated television
channels have created opportunities for segmented targeting on TV.
Advertising can be presented when and what the potential consumers are
watching. Moreover the advertisers can reach select geographical audiences
by buying airtime in local and regional markets
4) Creativity : Various facets of television advertising give freedom to innovate
and experiment with infinite ways of communicating the ad message. Music,
sound effects, visual effects and supers combine to make several mini brand
sagas.
5) Prestige : Since TV has assumed the role of a mentor in public domain, it is
considered to be a powerful medium of information and crystallising public
opinion, it gives the advertisers a prestigious image.
6) Impact : Because of its multidimensional nature and varied scope, television
has been able to leave tremendous impact on consumer mind. Whether the
content is informative, entertaining or persuasive, the impact is note worthy.
7) Social dominance : Television in the last few years has not only penetrated
the urban India but also become part of rural lives in the country, creating a
social favourtism towards the medium itself.
8) Frequency : It is special in terms of the no of times advertisements can be
aired during the same day. Highly frequent television is ideal to hammer the
message continuously and repeatedly.
95
9) Reproduction quality : Excellent reproduction quality permits the advertisers
to be able to essay any visualisation without handicaps.
10) Flexibility : Coverage and commercial content enables the advertiser to adopt
its commercials according to the product and consumer specifications
11) Versatile : Varied and comprehensive television advertising can prop up any
product type/genre that is evident from the recent trends
The profile of television advertising is strong and suffusing. Not only does it
lead to brand awareness, but also helps direct marketing forms in achieving their
goals. ABC network (1970-71) found out that television commercials induced 82%
greater increments in advertised brand coupon redemption than print ads.
Thus we see that both print and electronic advertising are the primary drivers
of advertising revenue in India. The Indian advertiser favours these two for all forms
of product promotion.
Related Documents


