CHAPTER-IV FINANCIAL MANAGEMENT OF JAGGERY PRODUCTION

Welcome message from author
This document is posted to help you gain knowledge. Please leave a comment to let me know what you think about it! Share it to your friends and learn new things together.
Transcript
CHAPTER-IV
FINANCIAL MANAGEMENT OF
JAGGERY
PRODUCTION
CHAPTER-IV
FINANCIAL MANAGEMENT OF JAGGERY
PRODUCTION
4.1 Introduction
4.2 Production Management
4.3 Human Resources Management
4.4 Financial Management
4.5 Marketing Management
4.6 Cost sheet analysis
4.7 Unawareness among financial management
4.8 Testing Hypotheses
4.9 Conclusion
CHAPTER- IV
FINANCIAL MANAGEMENT OF JAGGERY PRODUCTION UNITS
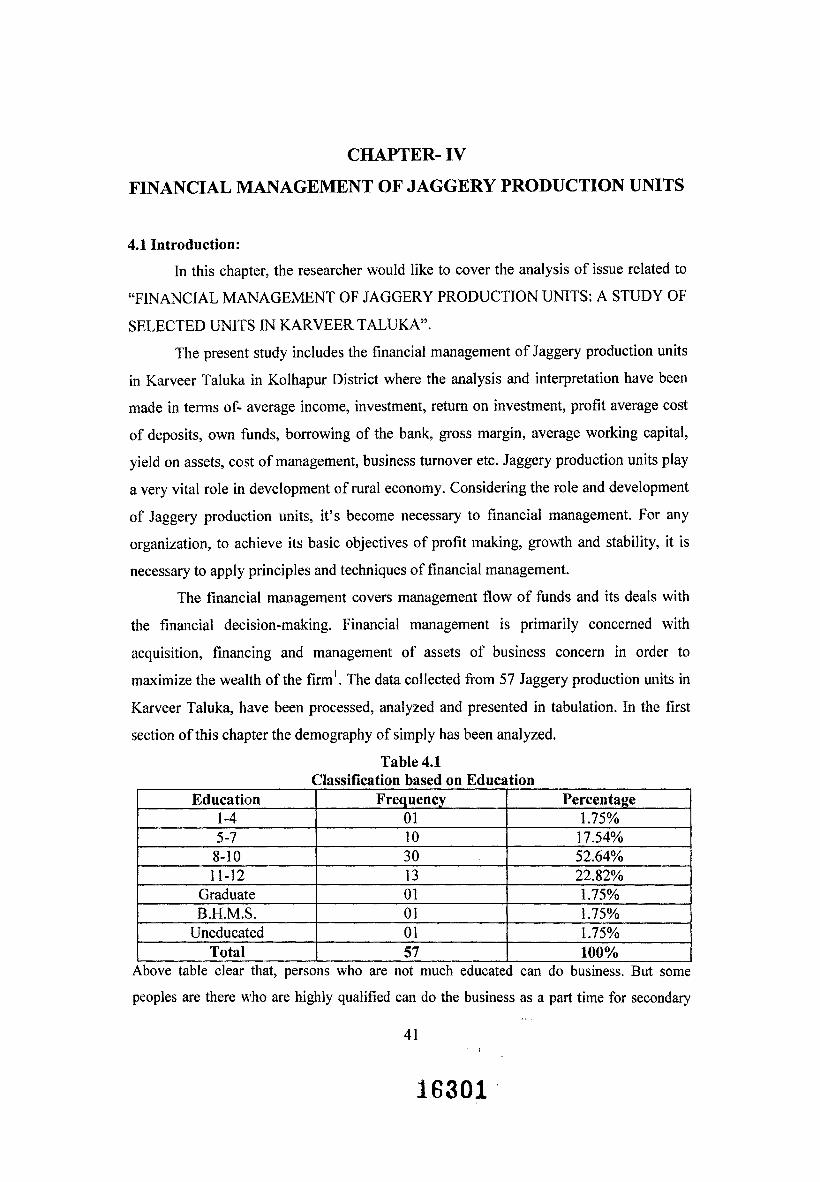
4.1 Introduction:
In this chapter, the researcher would like to cover the analysis of issue related to
“FINANCIAL MANAGEMENT OF JAGGERY PRODUCTION UNITS: A STUDY OF
SELECTED UNITS IN KARVEER TALUKA”.
The present study includes the financial management of Jaggery production units
in Karveer Taluka in Kolhapur District where the analysis and interpretation have been
made in terms of- average income, investment, return on investment, profit average cost
of deposits, own funds, borrowing of the bank, gross margin, average working capital,
yield on assets, cost of management, business turnover etc. Jaggery production units play
a very vital role in development of rural economy. Considering the role and development
of Jaggery production units, it’s become necessary to financial management. For any
organization, to achieve its basic objectives of profit making, growth and stability, it is
necessary to apply principles and techniques of financial management.
The financial management covers management flow of funds and its deals with
the financial decision-making. Financial management is primarily concerned with
acquisition, financing and management of assets of business concern in order to
maximize the wealth of the firm1. The data collected from 57 Jaggery production units in
Karveer Taluka, have been processed, analyzed and presented in tabulation. In the first
section of this chapter the demography of simply has been analyzed.
Table 4.1Classification based on Education
Education Frequency Percentage1-4 01 1.75%5-7 10 17.54%
8-10 30 52.64%11-12 13 22.82%
Graduate 01 1.75%B.H.M.S. 01 1.75%
Uneducated 01 1.75%Total 57 100%
Above table clear that, persons who are not much educated can do business. But some
peoples are there who are highly qualified can do the business as a part time for secondary
41i
16301
source of income. Important thing is that an uneducated person can run the business. Table
4.1 reveals that 52.64% owners of Jaggery production unit are having education from 8th tc
10th standard only.
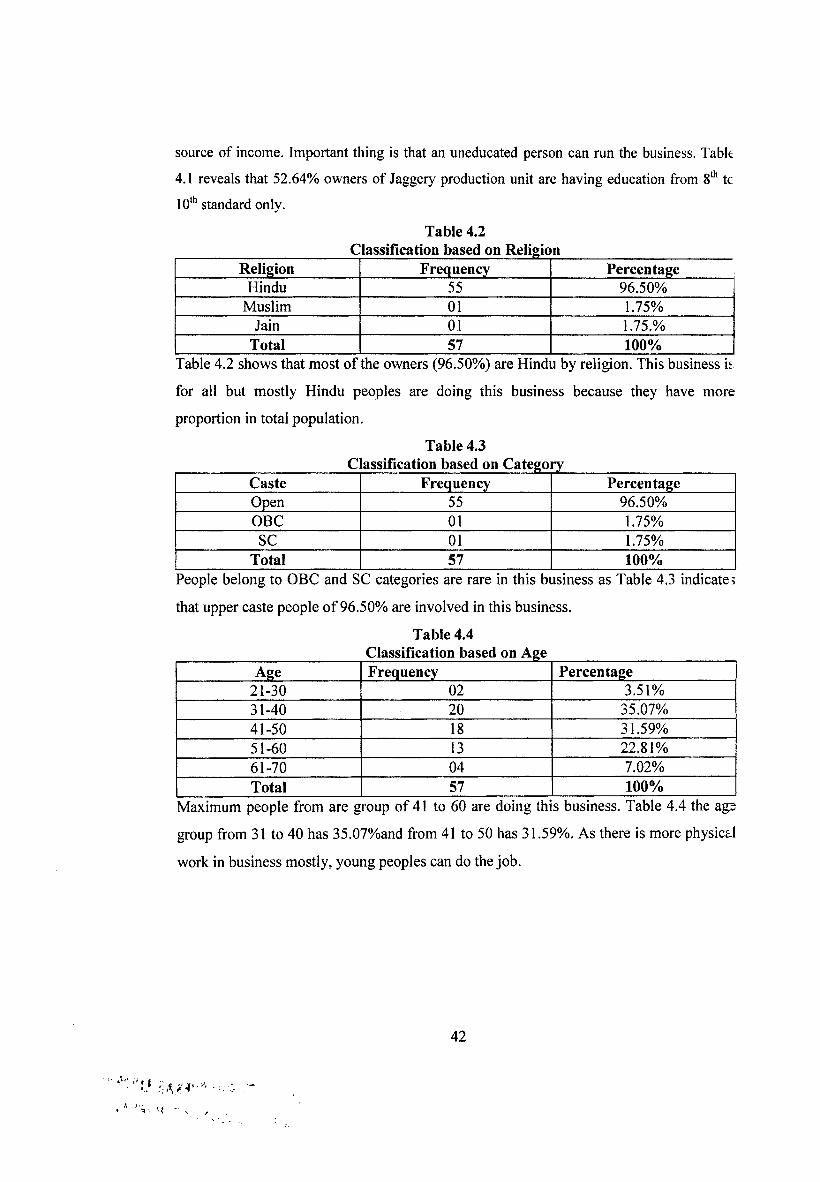
Table 4.2Classification based on Religion
Religion Frequency PercentageHindu 55 96.50%
Muslim 01 1.75%Jain 01 1.75.%
Total 57 100%Table 4.2 shows that most of the owners (96.50%) are Hindu by religion. This business is
for all but mostly Hindu peoples are doing this business because they have more
proportion in total population.
Table 4.3c assification based on Category
Caste Frequency PercentageOpen 55 96.50%OBC 01 1.75%SC 01 1.75%
Total 57 100%People belong to OBC and SC categories are rare in this business as Table 4.3 indicate5
that upper caste people of 96.50% are involved in this business.
Table 4.4Classification based on Age
Age Frequency Percentage21-30 02 3.51%31-40 20 35.07%41-50 18 31.59%51-60 13 22.81%61-70 04 7.02%Total 57 100%
Maximum people from are group of 41 to 60 are doing this business. Table 4,4 the age
group from 31 to 40 has 35.07%and from 41 to 50 has 31.59%. As there is more physical
work in business mostly, young peoples can do the job.
42
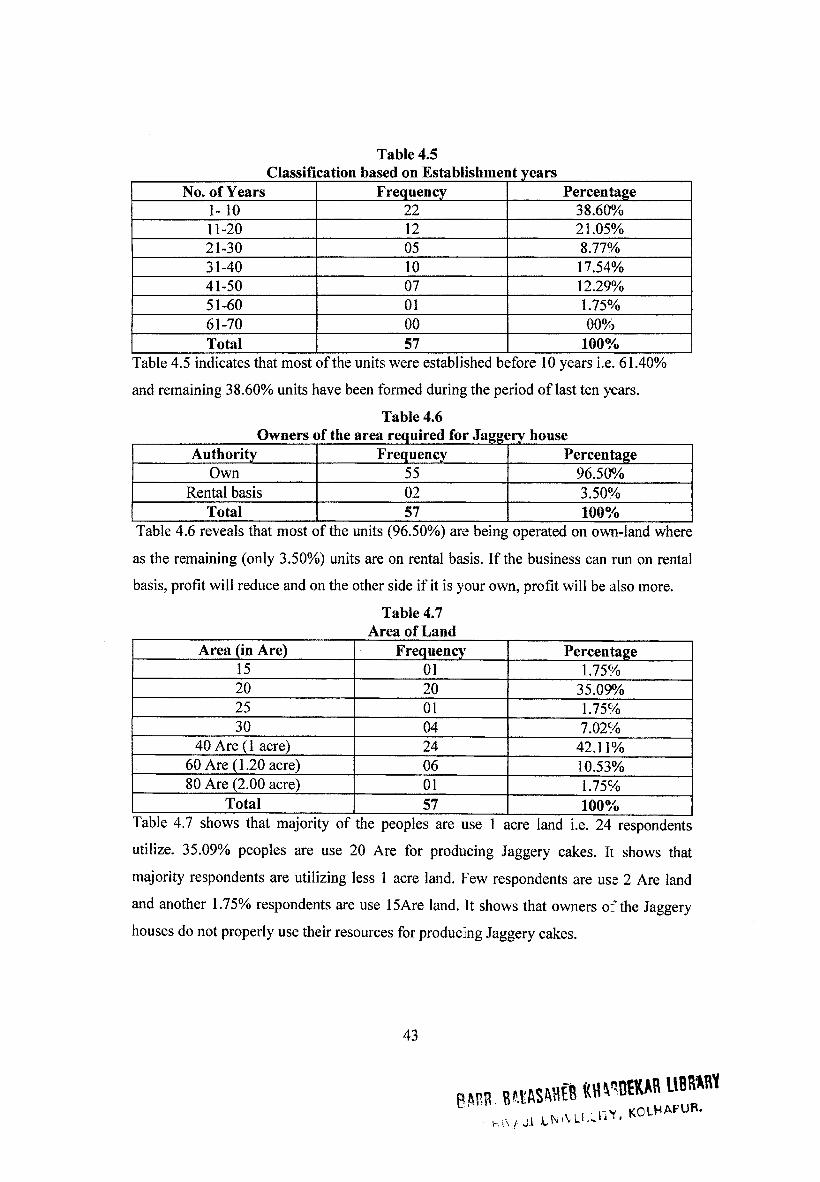
Table 4.5Classification based on Establishment years
No. of Years Frequency Percentage1-10 22 38.60%11-20 12 21.05%21-30 05 8.77%31-40 10 17.54%41-50 07 12.29%51-60 01 1.75%61-70 00 00%Total 57 100%
Table 4.5 indicates that most of the units were established before 10 years i.e. 61.40%
and remaining 38.60% units have been formed during the period of last ten years.
Table 4.6Owners of the area required for Jaggery house
Authority Frequency PercentageOwn 55 96.50%
Rental basis 02 3.50%Total 57 100%
Table 4.6 reveals that most of the units (96.50%) are being operated on own-land where
as the remaining (only 3.50%) units are on rental basis. If the business can run on rental
basis, profit will reduce and on the other side if it is your own, profit will be also more.
Table 4.7 Area of Land
Area (in Are) Frequency Percentage15 01 1.75%20 20 35.09%25 01 1.75%30 04 7.02%
40 Are (1 acre) 24 42.11%60 Are (1.20 acre) 06 10.53%80 Are (2.00 acre) 01 1.75%
Total 57 100%Table 4.7 shows that majority of the peoples are use 1 acre land i.e. 24 respondents
utilize. 35.09% peoples are use 20 Are for producing Jaggery cakes. It shows that
majority respondents are utilizing less 1 acre land. Few respondents are use 2 Are land
and another 1.75% respondents are use 15Are land. It shows that owners o: the Jaggery
houses do not properly use their resources for producing Jaggery cakes.
43
ft HHWWMR UM«WJ, KOLHAPUR.
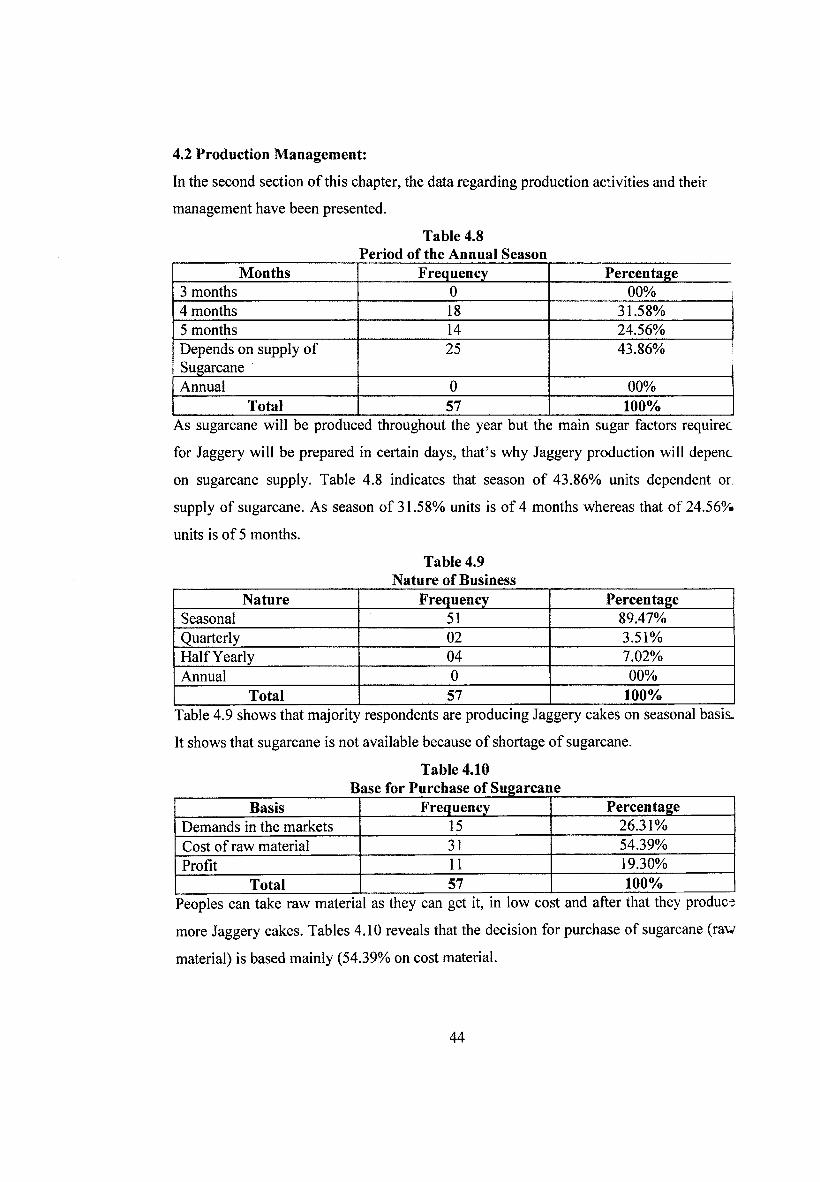
4.2 Production Management:
In the second section of this chapter, the data regarding production activities and their
management have been presented.
Table 4.8Period of the Annual Season
Months Frequency Percentage3 months 0 00%4 months 18 31.58%5 months 14 24.56%Depends on supply of Sugarcane
25 43.86%
Annual 0 00%Total 57 100%
As sugarcane will be produced throughout the year but the main sugar factors requirec
for Jaggery will be prepared in certain days, that’s why Jaggery production will depenc
on sugarcane supply. Table 4.8 indicates that season of 43.86% units dependent or.
supply of sugarcane. As season of 31.58% units is of 4 months whereas that of 24.56%
units is of 5 months.
Table 4.9Nature of Business
Nature Frequency PercentageSeasonal 51 89.47%Quarterly 02 3.51%Half Yearly 04 7.02%Annual 0 00%
Total 57 100%Table 4.9 shows that majority respondents are producing Jaggery cakes on seasonal basis.
It shows that sugarcane is not available because of shortage of sugarcane.
Table 4.10Base for Purchase of Sugarcane
Basis Frequency PercentageDemands in the markets 15 26.31%Cost of raw material 31 54.39%Profit 11 19.30%
Total 57 100%Peoples can take raw material as they can get it, in low cost and after that they produce
more Jaggery cakes. Tables 4.10 reveals that the decision for purchase of sugarcane (raw
material) is based mainly (54.39% on cost material.
44
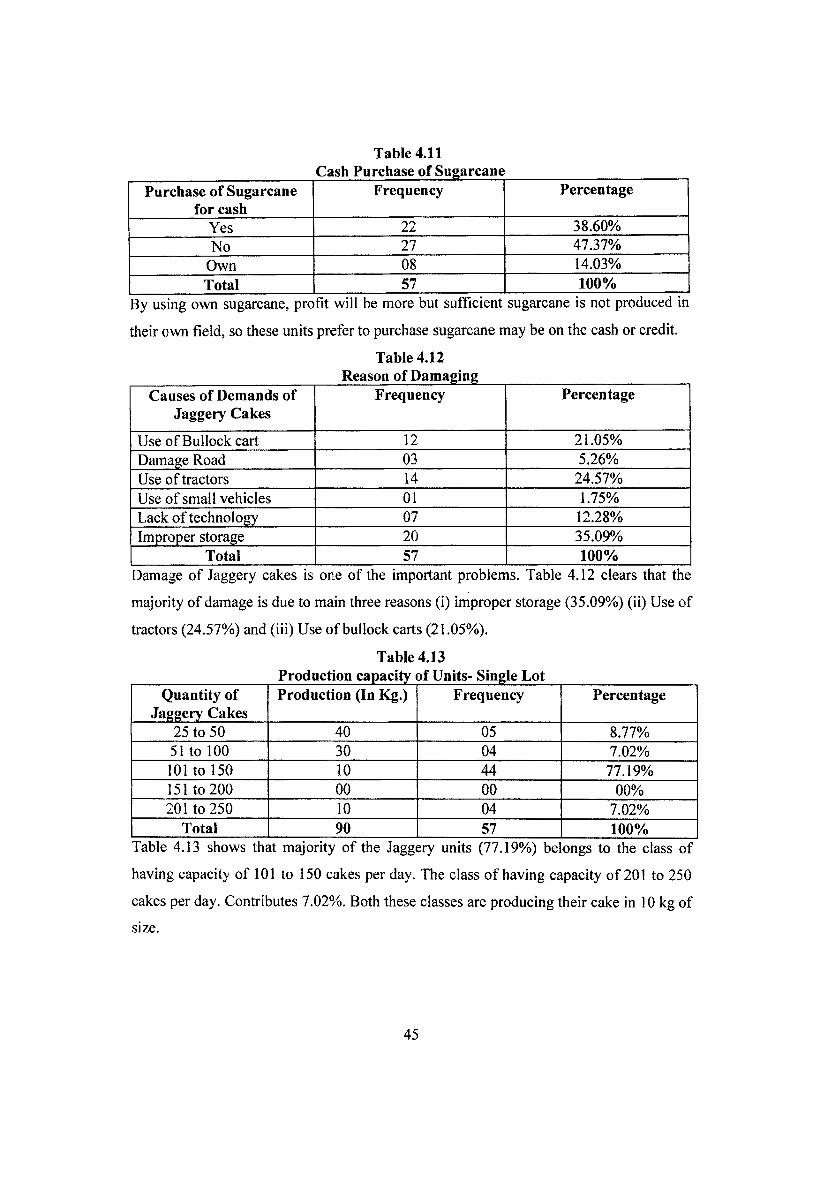
Table 4.11Cash Purchase of Sugarcane
Purchase of Sugarcane for cash
Frequency Percentage
Yes 22 38.60%No 27 47.37%
Own 08 14.03%Total 57 100%
By using own sugarcane, profit will be more but sufficient sugarcane is not produced in
their own field, so these units prefer to purchase sugarcane may be on the cash or credit.
Table 4.12 Reason of Damaging
Causes of Demands of Jaggery Cakes
Frequency Percentage
Use of Bullock cart 12 21.05%Damage Road 03 5.26%Use of tractors 14 24.57%Use of small vehicles 01 1.75%Lack of technology 07 12.28%Improper storage 20 35.09%
Total 57 100%Damage of Jaggery cakes is one of the important problems. Table 4.12 clears that the
majority of damage is due to main three reasons (i) improper storage (35.09%) (ii) Use of
tractors (24.57%) and (iii) Use of bullock carts (21.05%).
Table 4.13Production capacity of Units- Single Lot
Quantity of Jaggery Cakes
Production (In Kg.) Frequency Percentage
25 to 50 40 05 8.77%51 to 100 30 04 7.02%101 to 150 10 44 77.19%151 to 200 00 00 00%201 to 250 10 04 7.02%
Total 90 57 100%Table 4.13 shows that majority of the Jaggery units (77.19%) be ongs to the class of
having capacity of 101 to 150 cakes per day. The class of having capacity of 201 to 250
cakes per day. Contributes 7.02%. Both these classes are producing their cake in 10 kg of
size.
45
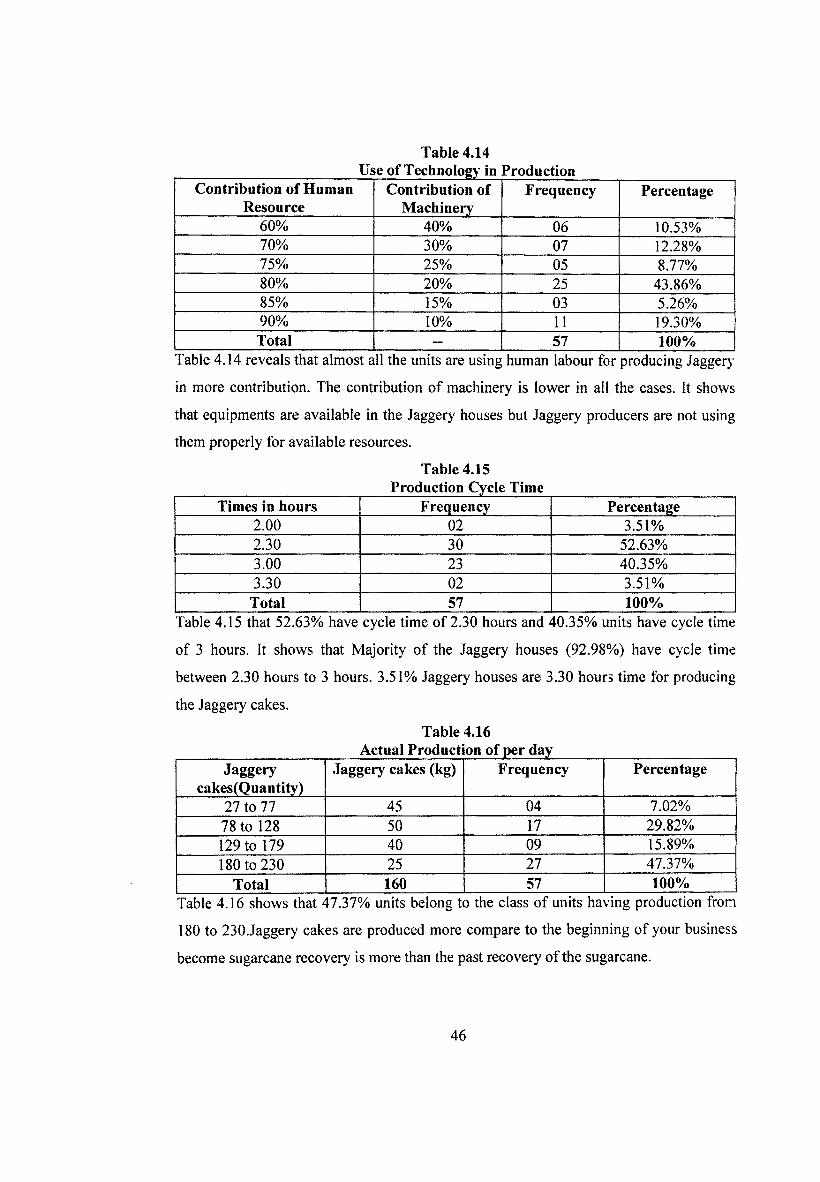
Table 4.14Use of Technology in Production
Contribution of Human Resource
Contribution of Machinery
Frequency Percentage
60% 40% 06 10.53%70% 30% 07 12.28%75% 25% 05 8.77%80% 20% 25 43.86%85% 15% 03 5.26%90% 10% 11 19.30%Total — 57 100%
Table 4.14 reveals that almost all the units are using human labour for producing Jaggery
in more contribution. The contribution of machinery is lower in all the cases. It shows
that equipments are available in the Jaggery houses but Jaggery producers are not using
them properly for available resources.
Table 4.15Production Cycle Time
Times in hours Frequency Percentage2.00 02 3.51%2.30 30 52.63%3.00 23 40.35%3.30 02 3.51%
Total 57 100%Table 4.15 that 52.63% have cycle time of 2.30 hours and 40.35% units have cycle time
of 3 hours. It shows that Majority of the Jaggery houses (92.98%) have cycle time
between 2.30 hours to 3 hours. 3.51% Jaggery houses are 3.30 hours time for producing
the Jaggery cakes.
Table 4.16Actual Production of per day
Jaggerycakes(Quantity)
Jaggery cakes (kg) Frequency Percentage
27 to 77 45 04 7.02%78 to 128 50 17 29.82%129 to 179 40 09 15.89%180 to 230 25 27 47.37%
Total 160 57 100%Table 4.16 shows thatL17.37% units belong to the class of units having production from
180 to 230Jaggery cakes are produced more compare to the beginning of your business
become sugarcane recovery is more than the past recovery of the sugarcane.
46
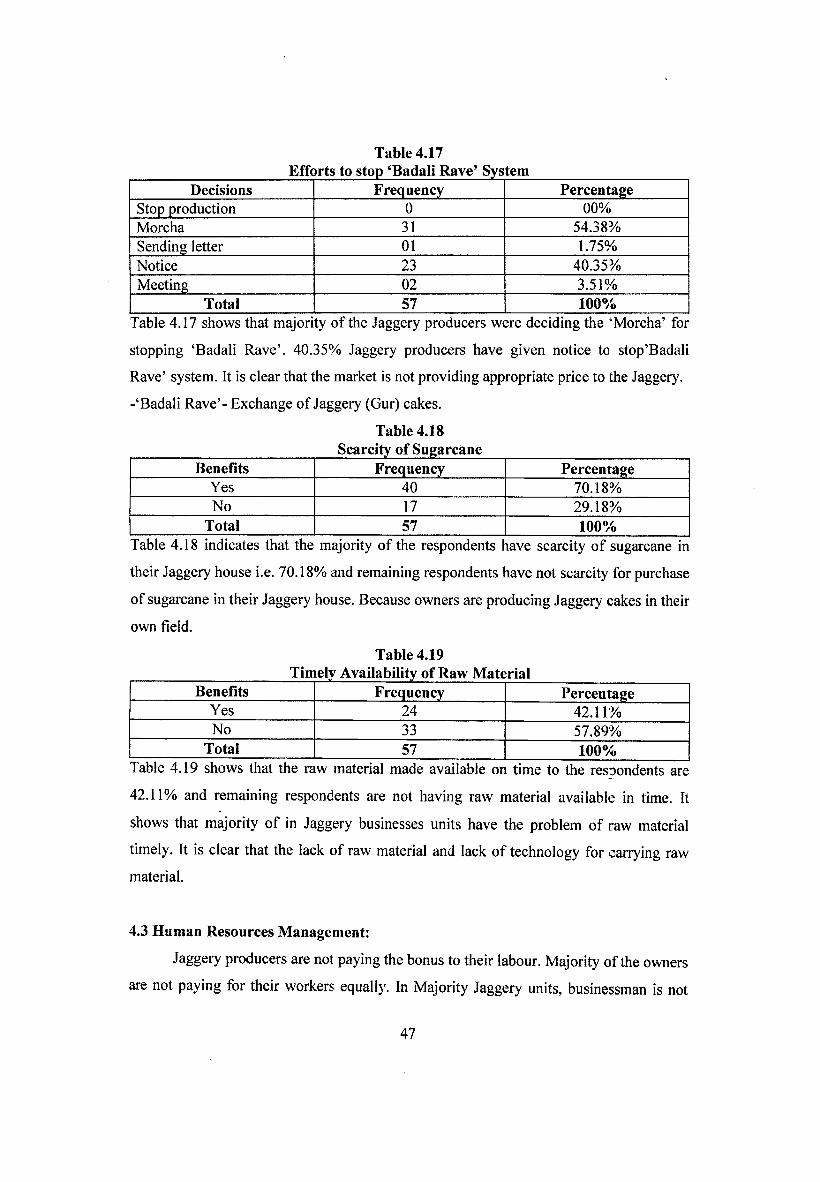
Table 4.17Efforts to stop ‘Badali Rave’ System
Decisions Frequency PercentageStop production 0 00%Morcha 31 54.38%Sending letter 01 1.75%Notice 23 40.35%Meeting 02 3.51%
Total 57 100%Table 4.17 shows that majority of the Jaggery producers were deciding the ‘Morcha’ for
stopping ‘Badali Rave’. 40.35% Jaggery producers have given notice to stop’Badali
Rave’ system. It is clear that the market is not providing appropriate price to the Jaggery.
-‘Badali Rave’ - Exchange of Jaggery (Gur) cakes.
Table 4.18Scarcity of Sugarcane
Benefits Frequency PercentageYes 40 70.18%No 17 29.18%
Total 57 100%Table 4.18 indicates that the majority of the respondents have scarcity of sugarcane in
their Jaggery house i.e. 70.18% and remaining respondents have not scarcity for purchase
of sugarcane in their Jaggery house. Because owners are producing Jaggery cakes in their
own field.
Table 4.19Timely Availability of Raw Material
Benefits Frequency PercentageYes 24 42.11%No 33 57.89%
Total 57 100%Table 4.19 shows that the raw material made available on time to the respondents are
42.11% and remaining respondents are not having raw material available in time. It
shows that majority of in Jaggery businesses units have the problem of raw material
timely. It is clear that the lack of raw material and lack of technology for carrying raw
material.
4.3 Human Resources Management:
Jaggery producers are not paying the bonus to their labour. Majority of the owners
are not paying for their workers equally. In Majority Jaggery units, businessman is not
47
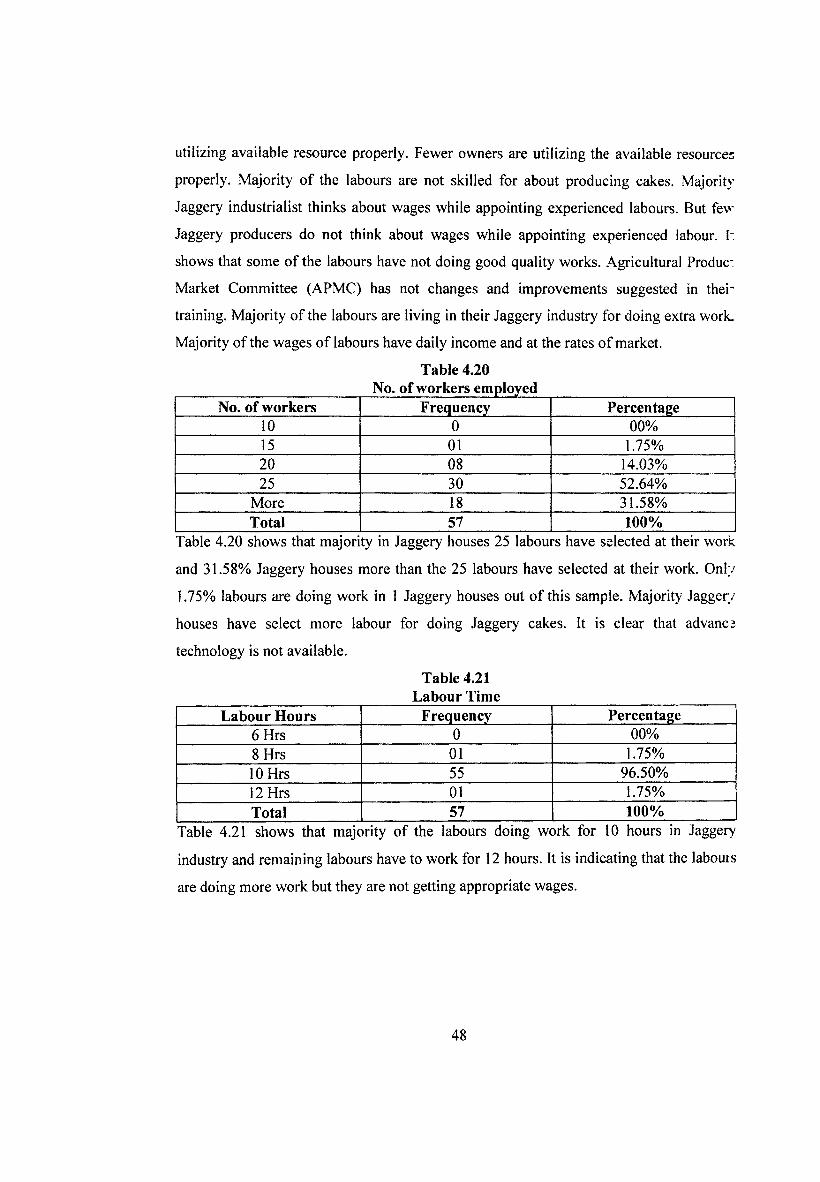
utilizing available resource properly. Fewer owners are utilizing the available resources
properly. Majority of the labours are not skilled for about producing cakes. Majority
Jaggery industrialist thinks about wages while appointing experienced labours. But few
Jaggery producers do not think about wages while appointing experienced labour. I:
shows that some of the labours have not doing good quality works. Agricultural Produce
Market Committee (APMC) has not changes and improvements suggested in ther
training. Majority of the labours are living in their Jaggery industry for doing extra work.
Majority of the wages of labours have daily income and at the rates of market.
Table 4.20No. of workers employed
No. of workers Frequency Percentage10 0 00%15 01 1.75%20 08 14.03%25 30 52.64%
More 18 31.58%Total 57 100%
Table 4.20 shows that majority in Jaggery houses 25 labours have selected at their work
and 31.58% Jaggery houses more than the 25 labours have selected at their work. Only
1.75% labours are doing work in 1 Jaggery houses out of this sample. Majority Jaggery
houses have select more labour for doing Jaggery cakes. It is clear that advance
technology is not available.
Table 4.21 Labour Time
Labour Hours Frequency Percentage6 Hrs 0 00%8 Hrs 01 1.75%10 Hrs 55 96.50%12 Hrs 01 1.75%Total 57 100%
Table 4.21 shows that majority of the labours doing work for 10 hours in Jaggery
industry and remaining labours have to work for 12 hours. It is indicating that the labours
are doing more work but they are not getting appropriate wages.
48
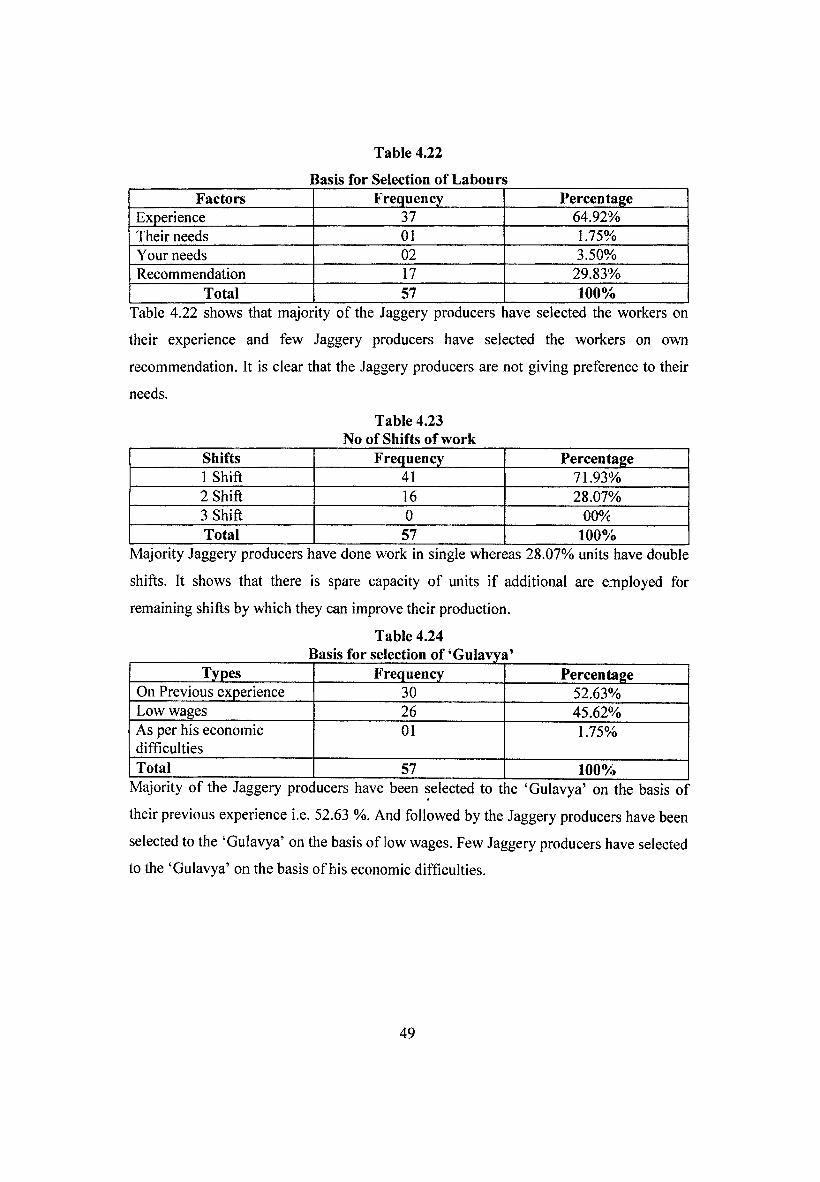
Table 4.22
Basis for Selection of LaboursFactors Frequency Percentage
Experience 37 64.92%Their needs 01 1.75%Your needs 02 3.50%Recommendation 17 29.83%
Total 57 100%Table 4.22 shows that majority of the Jaggery producers rave selected the workers on
their experience and few Jaggery producers have selected the workers on own
recommendation. It is clear that the Jaggery producers are not giving preference to their
needs.
Table 4.23 No of Shifts of work
Shifts Frequency Percentage1 Shift 41 71.93%2 Shift 16 28.07%3 Shift 0 00%Total 57 100%
Majority Jaggery producers have done work in single whereas 28.07% units have double
shifts. It shows that there is spare capacity of units if additional are employed for
remaining shifts by which they can improve their production.
Table 4.24Basis for selection of ‘Gulavya’
Types Frequency PercentageOn Previous experience 30 52.63%Low wages 26 45.62%As per his economic difficulties
01 1.75%
Total 57 100%Majority of the Jaggery prod ucers have been selected to t le ‘Gulavya’ on the basis of
their previous experience i.e. 52.63 %. And followed by the Jaggery producers have been
selected to the ‘Gulavya’ on the basis of low wages. Few Jaggery producers have selected
to the ‘Gulavya’ on the basis of his economic difficulties.
49
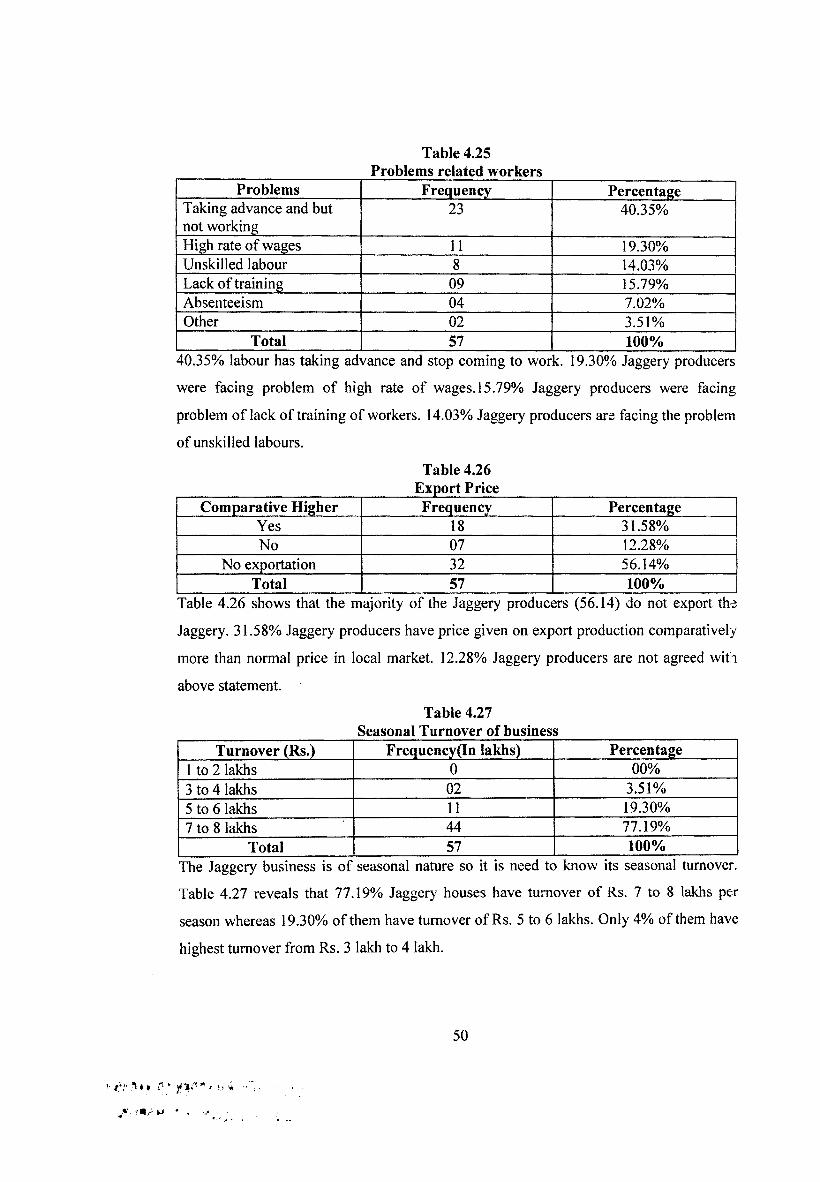
Table 4.25Problems related workers
Problems Frequency PercentageTaking advance and but not working
23 40.35%
High rate of wages 11 19.30%Unskilled labour 8 14.03%Lack of training 09 15.79%Absenteeism 04 7.02%Other 02 3.51%
Total 57 100%40.35% labour has taking advance and stop coming to wor c. 19.30% Jaggery producers
were facing problem of high rate of wages. 15.79% Jaggery producers were facing
problem of lack of training of workers. 14.03% Jaggery producers are facing the problem
of unskilled labours.
Table 4.26 Export Price
Comparative Higher Frequency PercentageYes 18 31.58%No 07 12.28%
No exportation 32 56.14%Total 57 100%
Table 4.26 shows that the majority of the Jaggery producers (56.14) do not export the
Jaggery. 31.58% Jaggery producers have price given on export production comparatively
more than normal price in local market. 12.28% Jaggery producers are not agreed with
above statement.
Table 4.27Seasonal Turnover of business
Turnover (Rs.) Frequency(In lakhs) Percentage1 to 2 lakhs 0 00%3 to 4 lakhs 02 3.51%5 to 6 lakhs 11 19.30%7 to 8 lakhs 44 77.19%
Total 57 100%The Jaggery business is of seasonal nature so it is need to know its seasonal turnover.
Table 4.27 reveals that 77.19% Jaggery houses have turnover of Rs. 7 to 8 lakhs per
season whereas 19.30% of them have turnover of Rs. 5 to 6 lakhs. Only 4% of them have
highest turnover from Rs. 3 lakh to 4 lakh.
50
,n*t ft?*. *■> 4
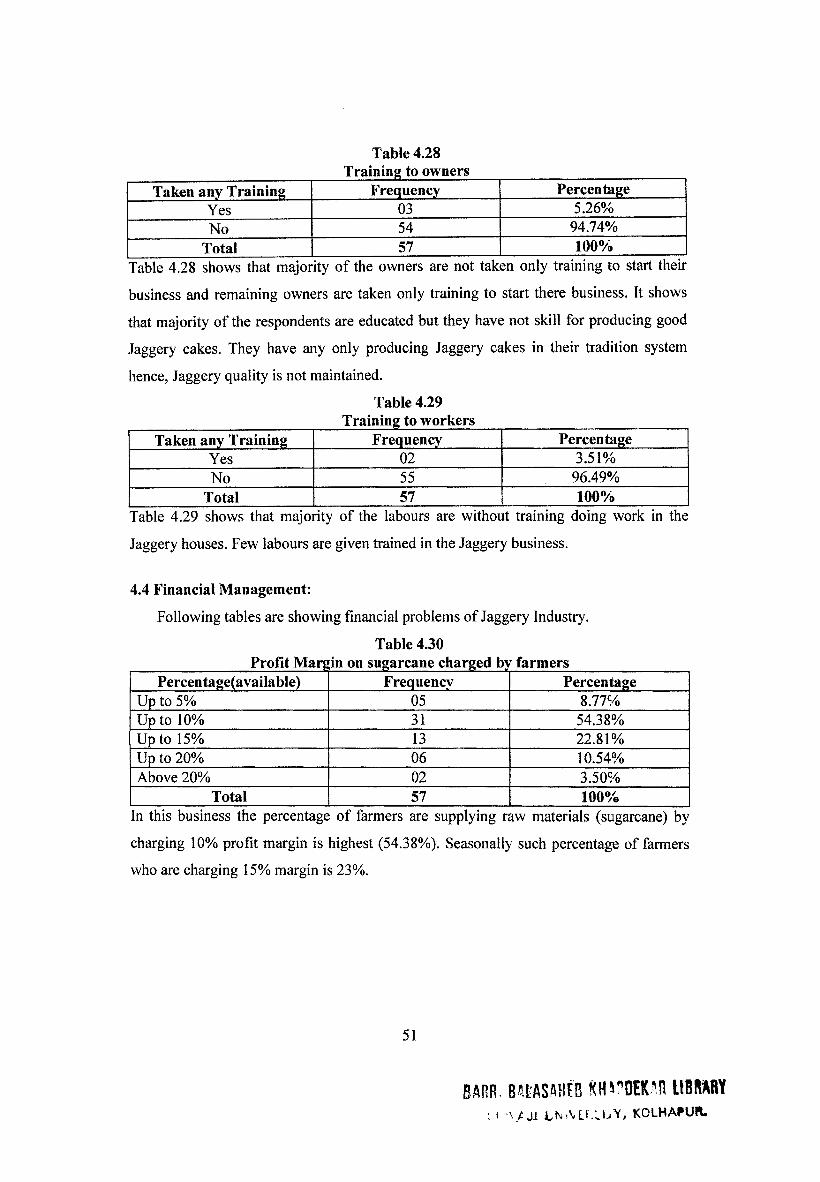
Table 4.28Training to owners
Taken any Training Frequency PercentageYes 03 5.26%No 54 94.74%
Total 57 100%Table 4.28 shows that majority of the owners are not taken only training to start their
business and remaining owners are taken only training to start there business. It shows
that majority of the respondents are educated but they have not skill for producing good
Jaggery cakes. They have any only producing Jaggery cakes in their tradition system
hence, Jaggery quality is not maintained.
Table 4.29_________________________ Training to workers
Taken any Training Frequency PercentageYes 02 3.51%No 55 96.49%
Total 57 100%Table 4.29 shows that majority of the labours are without training doing work in the
Jaggery houses. Few labours are given trained in the Jaggery business.
4.4 Financial Management:
Following tables are showing financial problems of Jaggery Industry.
Table 4.30Profit Margin on sugarcane charged by farmers
Percentage(available) Frequency PercentageUp to 5% 05 8.77%Up to 10% 31 54.38%Up to 15% 13 22.81%Up to 20% 06 10.54%Above 20% 02 3.50%
Total 57 100%In this business the percentage of farmers are supplying raw materials (sugarcane) by
charging 10% profit margin is highest (54.38%). Seasonally such percentage of farmers
who are charging 15% margin is 23%.
51
BARR. BAt'ASAHEB RH^DEKAR UBflARY: i \/Ji LNiMT.'vbY, KOLHAPUR.
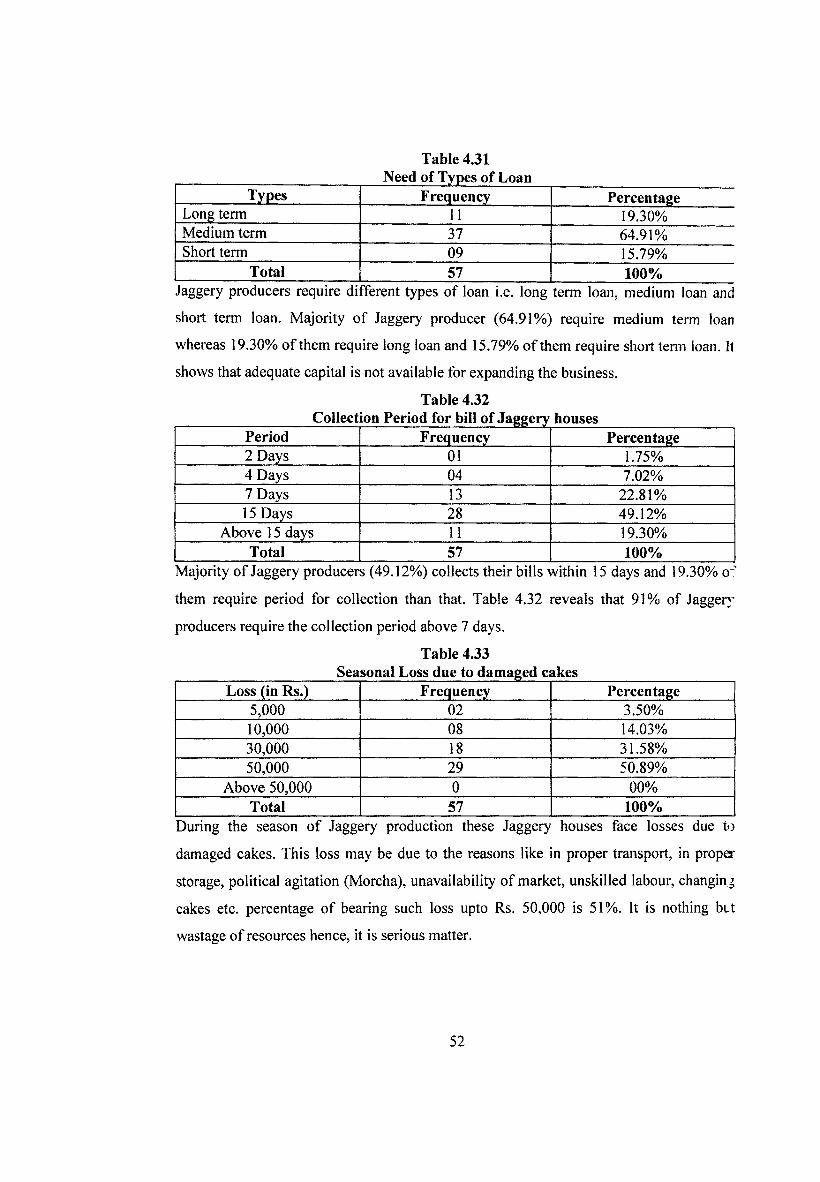
Table 4.31Need of Types of Loan
llfies Frequency PercentageLong term 11 19.30%Medium term 37 64.91%Short term 09 15.79%
Total 57 100%Jaggery producers require di fferent types of loan i.e. long term loan, medium loan and
short term loan. Majority of Jaggery producer (64.91%) require medium term loan
whereas 19.30% of them require long loan and 15.79% of them require short term loan. It
shows that adequate capital is not available for expanding the business.
Table 4.32Collection Period for bill of Jaggery houses
Period Frequency Percentage2 Days 01 1.75%4 Days 04 7.02%7 Days 13 22.81%15 Days 28 49.12%
Above 15 days 11 19.30%Total 57 100%
Majority of Jaggery producers (49.12%) collects their bills within 15 days and 19.30% o'
them require period for collection than that. Table 4.32 reveals that 91% of Jaggery
producers require the collection period above 7 days.
Table 4.33Seasonal Loss due to damaged cakes
Loss (in Rs.) Frequency Percentage5,000 02 3.50%10,000 08 14.03%30,000 18 31.58%50,000 29 50.89%
Above 50,000 0 00%Total 57 100%
During the season of Jaggery production these Jaggery houses face losses due to
damaged cakes. This loss may be due to the reasons like in proper transport, in proper
storage, political agitation (Morcha), unavailability of market, unskilled labour, changing
cakes etc. percentage of bearing such loss upto Rs. 50,000 is 51 %. It is nothing but
wastage of resources hence, it is serious matter.
52
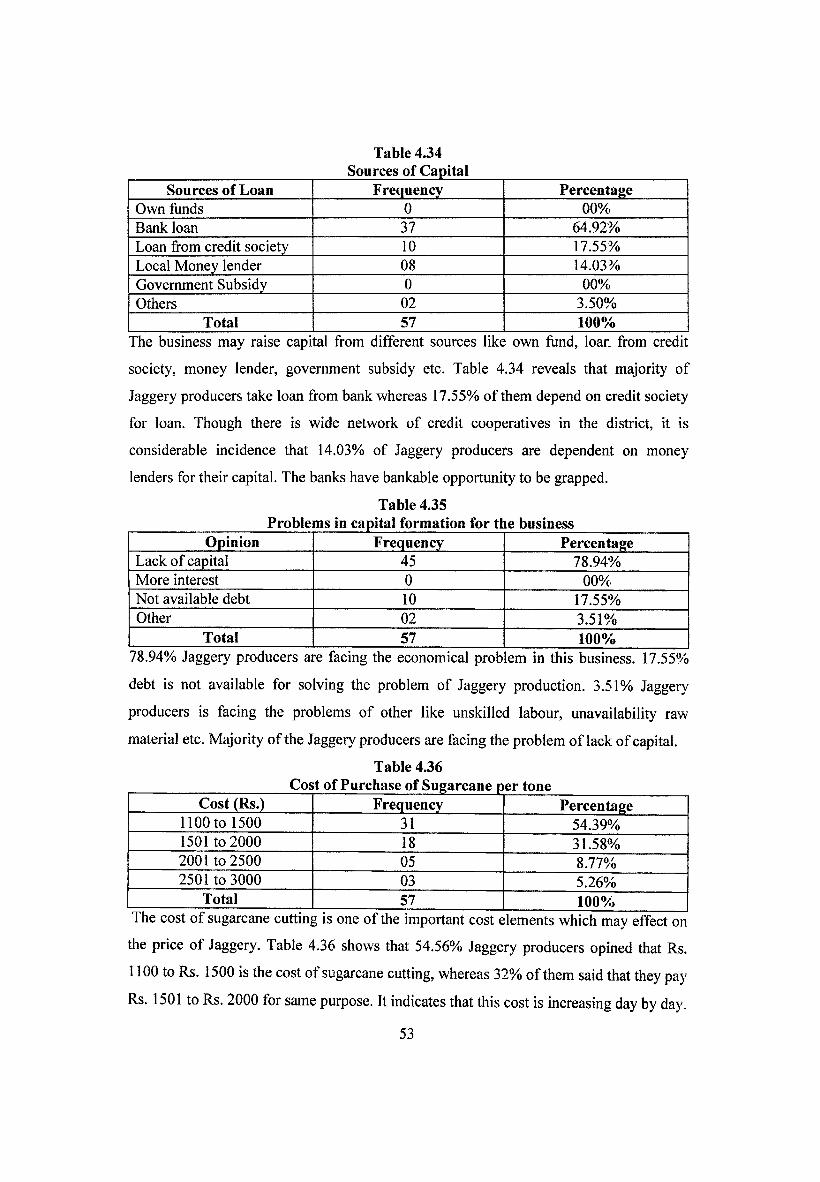
Table 4.34Sources of Capital
Sources of Loan Frequency PercentageOwn funds 0 00%Bank loan 37 64.92%Loan from credit society 10 17.55%Local Money lender 08 14.03%Government Subsidy 0 00%Others 02 3.50%
Total 57 100%The business may raise capital from different sources like own fund, loan from credit
society, money lender, government subsidy etc. Table 4.34 reveals that majority of
Jaggery producers take loan from bank whereas 17.55% of them depend on credit society
for loan. Though there is wide network of credit cooperatives in the district, it is
considerable incidence that 14.03% of Jaggery producers are dependent on money
lenders for their capital. The banks have bankable opportunity to be grapped.
Table 4.35Problems in capital formation for the business
Opinion Frequency PercentageLack of capital 45 78.94%More interest 0 00%Not available debt 10 17.55%Other 02 3.51%
Total 57 100%78.94% Jaggery producers are facing the economical prob em in this business. 17.55%
debt is not available for solving the problem of Jaggery production. 3.51% Jaggery
producers is facing the problems of other like unskilled labour, unavailability raw
material etc. Majority of the Jaggery producers are facing the problem of lack of capital.
Table 4.36Cost of Purchase of Sugarcane per tone
Cost (Rs.) Frequency Percentage1100 to 1500 31 54.39%1501 to 2000 18 31.58%2001 to 2500 05 8.77%2501 to 3000 03 5.26%
Total 57 100%The cost of sugarcane cutting is one of the important cost elements which may effect on
the price of Jaggery. Table 4.36 shows that 54.56% Jaggery producers opined that Rs.
1100 to Rs. 1500 is the cost of sugarcane cutting, whereas 32% of them said that they pay
Rs. 1501 to Rs. 2000 for same purpose. It indicates that this cost is increasing day by day.
53
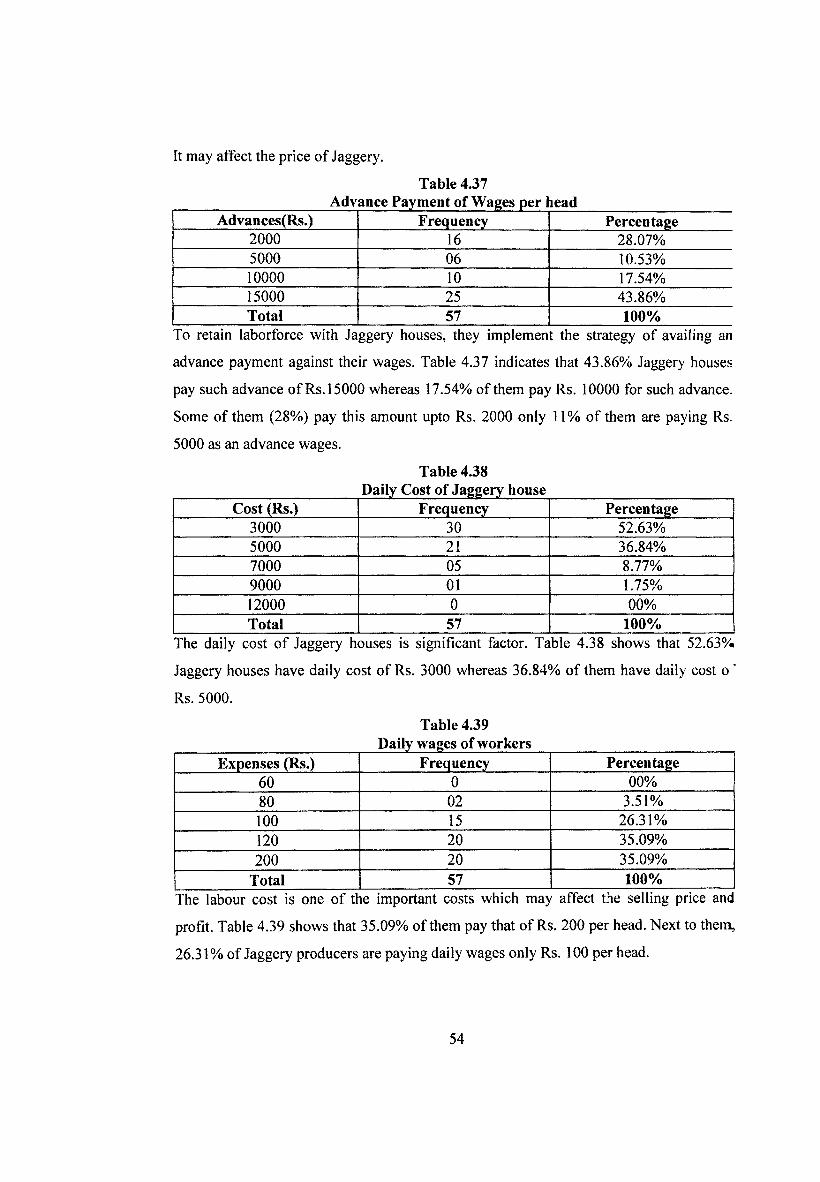
It may affect the price of Jaggery.
Table 4.37Advance Payment of Wages per lead
Advances(Rs.) Frequency Percentage2000 16 28.07%5000 06 10.53%10000 10 17.54%15000 25 43.86%Total 57 100%
To retain laborforce with Jaggery houses, they implement the strategy of availing an
advance payment against their wages. Table 4.37 indicates that 43.86% Jaggery houses
pay such advance of Rs. 15000 whereas 17.54% of them pay Rs. 10000 for such advance.
Some of them (28%) pay this amount upto Rs. 2000 only 11% of them are paying Rs.
5000 as an advance wages.
Table 4.38Daily Cost of Jaggery house
Cost (Rs.) Frequency Percentage3000 30 52.63%5000 21 36.84%7000 05 8.77%9000 01 1.75%12000 0 00%Total 57 100%
The daily cost of Jaggery houses is significant factor. Table 4.38 shows that 52.63%
Jaggery houses have daily cost of Rs. 3000 whereas 36.84% of them have daily cost of
Rs. 5000.
Table 4.39Daily wages of workers
Expenses (Rs.) Frequency Percentage60 0 00%80 02 3.51%100 15 26.31%120 20 35.09%200 20 35.09%
Total 57 100%The labour cost is one of the important costs which may affect the selling price and
profit. Table 4.39 shows that 35.09% of them pay that of Rs. 200 per head. Next to them,
26.31% of Jaggery producers are paying daily wages only Rs. 100 per head.
54
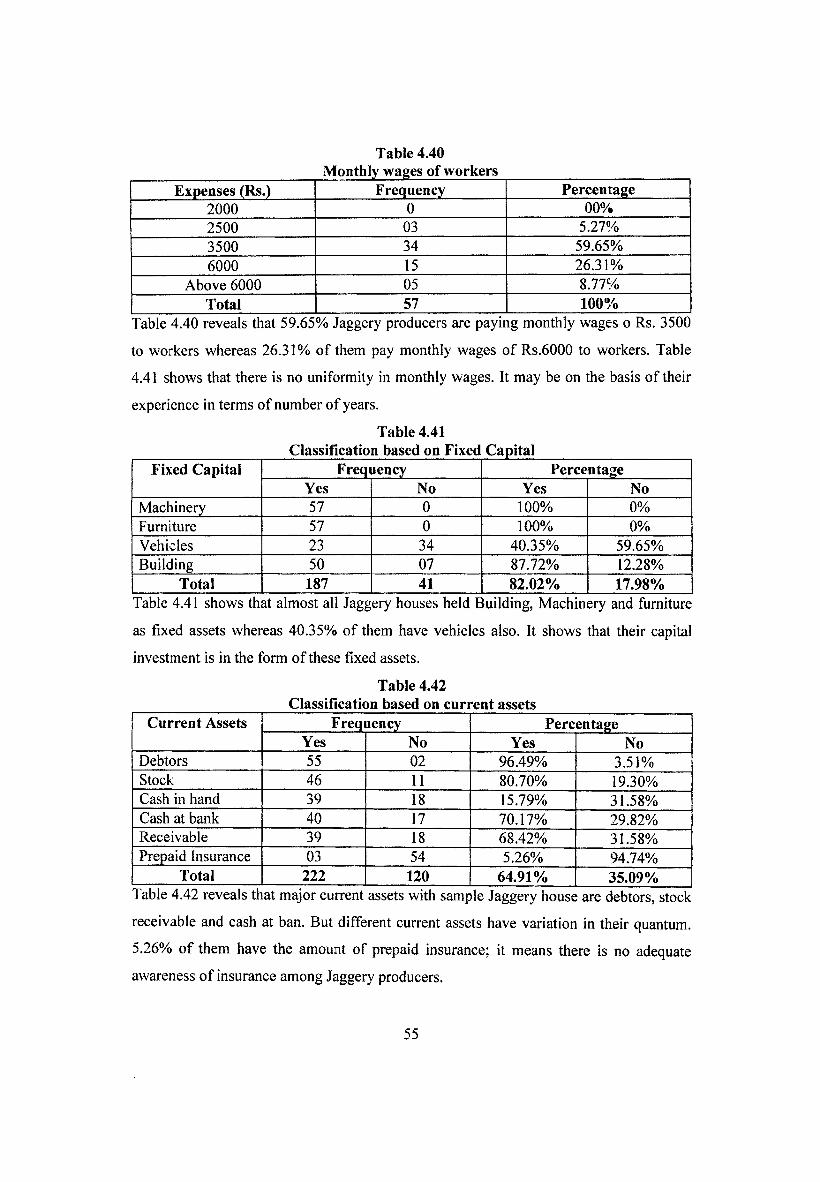
Table 4.40Monthly wages of workers
Expenses (Rs.) Frequency Percentage2000 0 00%2500 03 5.27%3500 34 59.65%6000 15 26.31%
Above 6000 05 8.77%Total 57 100%
Table 4.40 reveals that 59.65% Jaggery producers are paying monthly wages o Rs. 3500
to workers whereas 26.31% of them pay monthly wages of Rs.6000 to workers. Table
4.41 shows that there is no uniformity in monthly wages. It may be on the basis of their
experience in terms of number of years.
Table 4.41Classification based on Fixed Capital
Fixed Capital Frequency PercentageYes No Yes No
Machinery 57 0 100% 0%Furniture 57 0 100% 0%Vehicles 23 34 40.35% 59.65%Building 50 07 87.72% 12.28%
Total 187 41 82.02% 17.98%Table 4.41 shows that almost all Jaggery houses held Etuilding, Machinery and furniture
as fixed assets whereas 40.35% of them have vehicles also. It shows that their capital
investment is in the form of these fixed assets.
Table 4.42Classification based on current assets
Current Assets Frequency PercentageYes No Yes No
Debtors 55 02 96.49% 3.51%Stock 46 11 80.70% 19.30%Cash in hand 39 18 15.79% 31.58%Cash at bank 40 17 70.17% 29.82%Receivable 39 18 68.42% 31.58%Prepaid Insurance 03 54 5.26% 94.74%
Total 222 120 64.91% 35.09%Table 4.42 reveals that major current assets with sample Jaggery house are debtors, stock
receivable and cash at ban. But different current assets have variation in their quantum.
5.26% of them have the amount of prepaid insurance; it means there is no adequate
awareness of insurance among Jaggery producers.
55
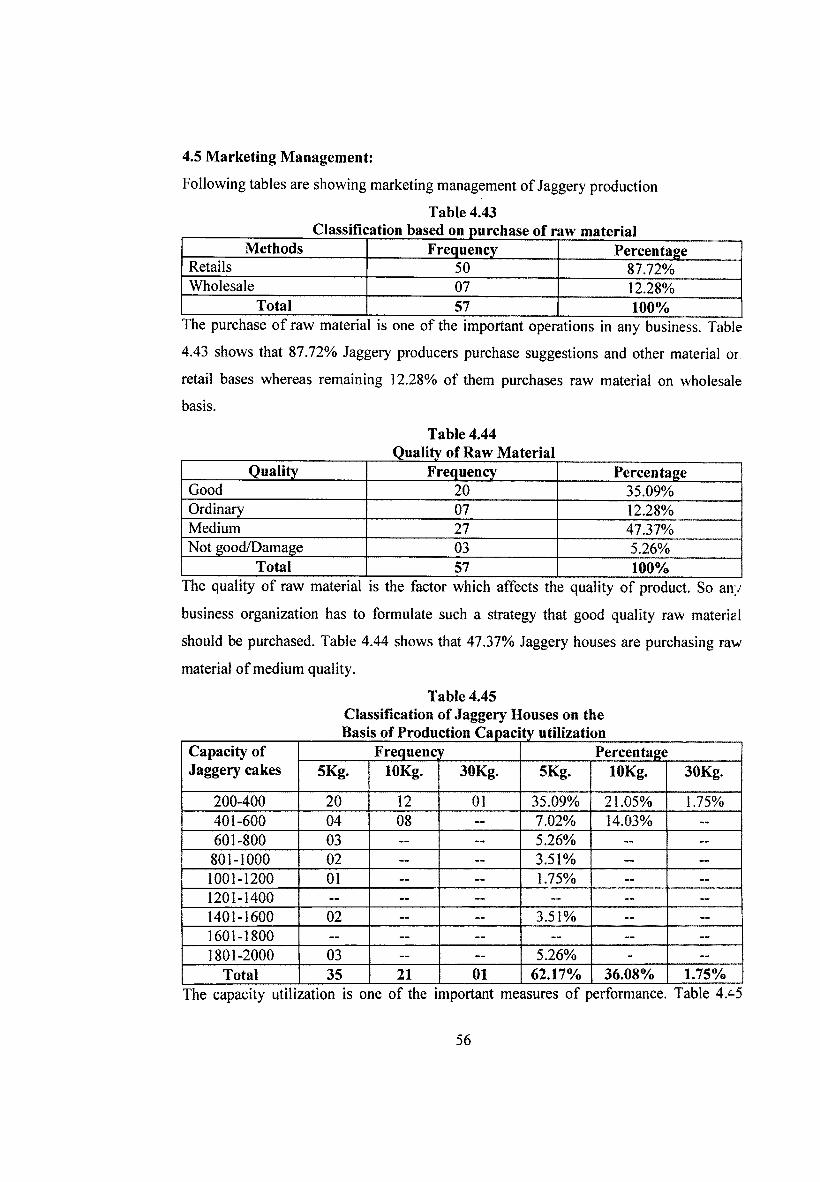
4.5 Marketing Management:
Following tables are showing marketing management of Jaggery production
Table 4.43Classification based on purchase of raw material
Methods Frequency PercentageRetails 50 87.72%Wholesale 07 12.28%
Total 57 100%The purchase of raw materia is one of the important operations in any business. Table
4.43 shows that 87.72% Jaggery producers purchase suggestions and other material or
retail bases whereas remaining 12.28% of them purchases raw material on wholesale
basis.
Table 4.44Quality of Raw Material
Quality Frequency PercentageGood 20 35.09%Ordinary 07 12.28%Medium 27 47.37%Not good/Damage 03 5.26%
Total 57 100%The quality of raw material is the factor which affects the quality of product. So any
business organization has to formulate such a strategy that good quality raw material
should be purchased. Table 4.44 shows that 47.37% Jaggery houses are purchasing raw
material of medium quality.
Table 4.45Classification of Jaggery Houses on the Basis of Production Capacity utilization
Capacity of Frequency PercentageJaggery cakes 5Kg. lOKg. 30Kg. 5Kg. lOKg. 30Kg.
200-400 20 12 01 35.09% 21.05% 1.75%401-600 04 08 — 7.02% 14.03% ..
601-800 03 — — 5.26% — ~
801-1000 02 — 3.51% _ —
1001-1200 01 — — 1.75% — —
1201-1400 — — — — — —
1401-1600 02 — — 3.51% — —
1601-1800 — — — — — —
1801-2000 03 — — 5.26% - —
Total 35 21 01 62.17% 36.08% 1.75%The capacity utilization is one of the important measures of performance. Table 4/-5
56
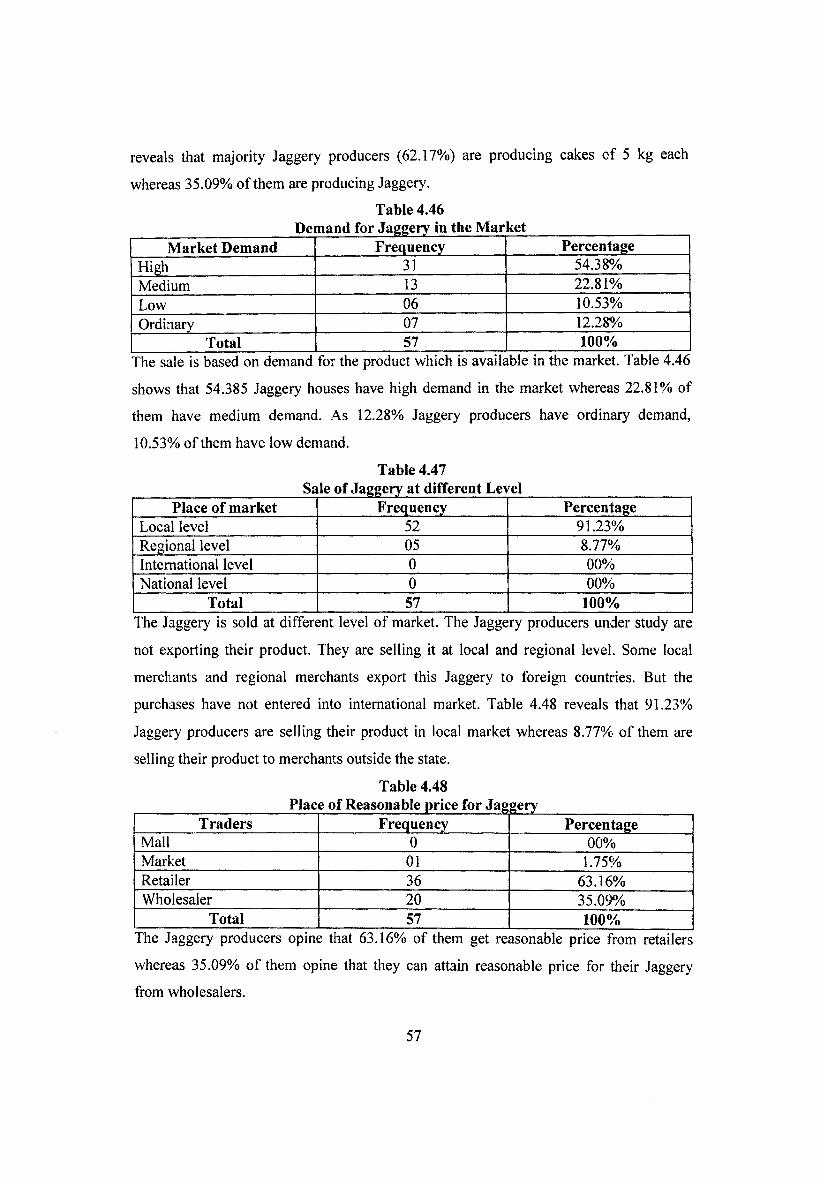
reveals that majority Jaggery producers (62.17%) are producing cakes of 5 kg each
whereas 35.09% of them are producing Jaggery.
Table 4.46Demand for Jaggery in the Mar cet
Market Demand Frequency PercentageHigh 31 54.38%Medium 13 22.81%Low 06 10.53%Ordinary 07 12.28%
Total 57 100%The sale is based on demand for the product which is available in the market. Table 4.46
shows that 54.385 Jaggery houses have high demand in the market whereas 22.81% of
them have medium demand. As 12.28% Jaggery producers have ordinary demand,
10.53% of them have low demand.
Table 4.47Sale of Jaggery at different Level
Place of market Frequency PercentageLocal level 52 91.23%Regional level 05 8.77%International level 0 00%National level 0 00%
Total 57 100%The Jaggery is sold at different level of market. The Jaggery producers under study are
not exporting their product. They are selling it at local and regional level. Some local
merchants and regional merchants export this Jaggery to foreign countries. But the
purchases have not entered into international market. Table 4.48 reveals that 91.23%
Jaggery producers are selling their product in local market whereas 8.77%. of them are
selling their product to merchants outside the state.
Table 4.48Place of Reasonable price for Jaggery
Traders Frequency PercentageMall 0 00%Market 01 1.75%Retailer 36 63.16%Wholesaler 20 35.09%
Total 57 100%The Jaggery producers opine that 63.16% of them get reasonable price from retailers
whereas 35.09% of them opine that they can attain reasonable price for their Jaggery
from wholesalers.
57
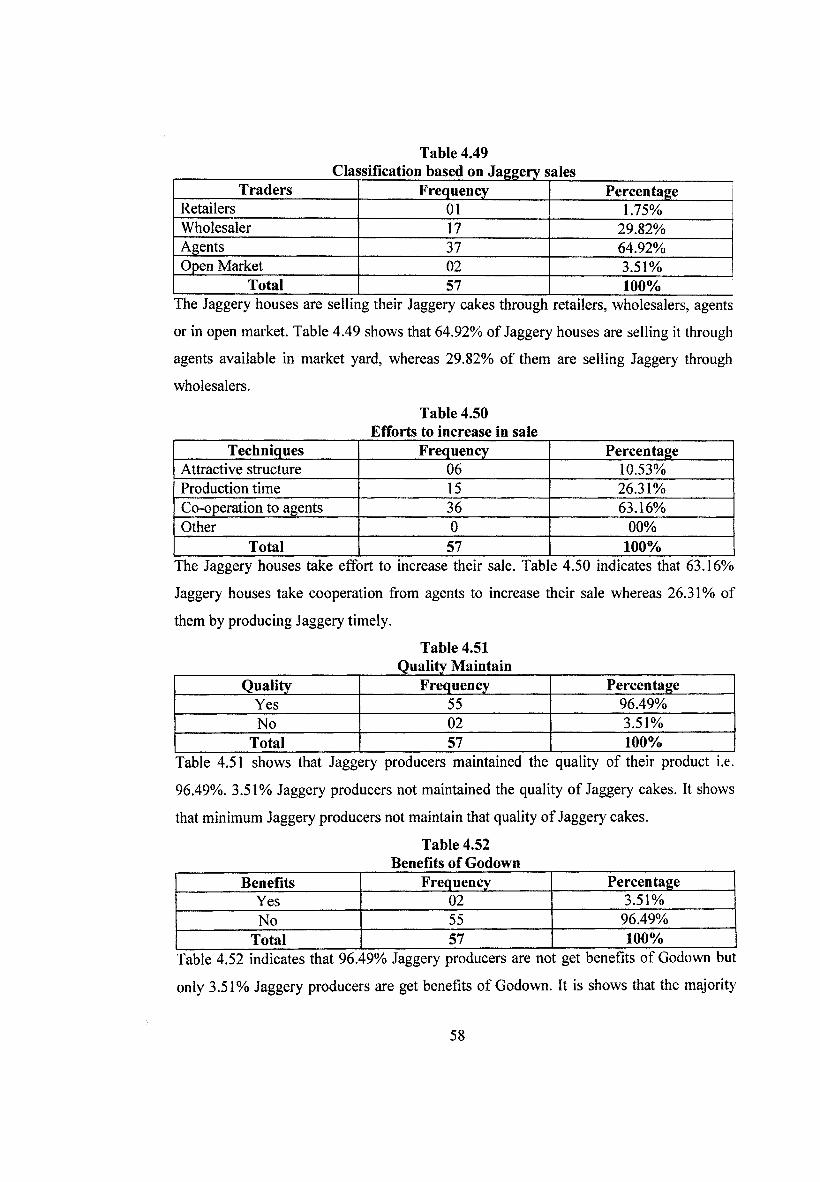
Table 4.49Classification based on Jaggery sales
Traders Frequency PercentageRetailers 01 1.75%Wholesaler 17 29.82%Agents 37 64.92%Open Market 02 3.51%
Total 57 100%The Jaggery houses are selling their Jaggery cakes through retailers, wholesalers, agents
or in open market. Table 4.49 shows that 64.92% of Jaggery houses are selling it through
agents available in market yard, whereas 29.82% of them are selling Jaggery through
wholesalers.
Table 4.50Efforts to increase in sale
Techniques Frequency PercentageAttractive structure 06 10.53%Production time 15 26.31%Co-operation to agents 36 63.16%Other 0 00%
Total 57 100%The Jaggery houses take effort to increase their sale. Tab e 4.50 indicates that 63.16%
Jaggery houses take cooperation from agents to increase their sale whereas 26.31% of
them by producing Jaggery timely.
Table 4.51_________________________ Quality Maintain
Quality Frequency PercentageYes 55 96.49%No 02 3.51%
Total 57 100%Table 4.51 shows that Jaggery producers maintained the quality of their product i.e.
96.49%. 3.51% Jaggery producers not maintained the quality of Jaggery cakes. It shows
that minimum Jaggery producers not maintain that quality of Jaggery cakes.
Table 4.52 Benefits of Godown
Benefits Frequency PercentageYes 02 3.51%No 55 96.49%
Total 57 100%Table 4.52 indicates that 96.49% Jaggery producers are not get benefits of Godown but
only 3.51% Jaggery producers are get benefits of Godown. It is shows that the majority
58
of the Jaggery producers are not getting benefits of Godown.
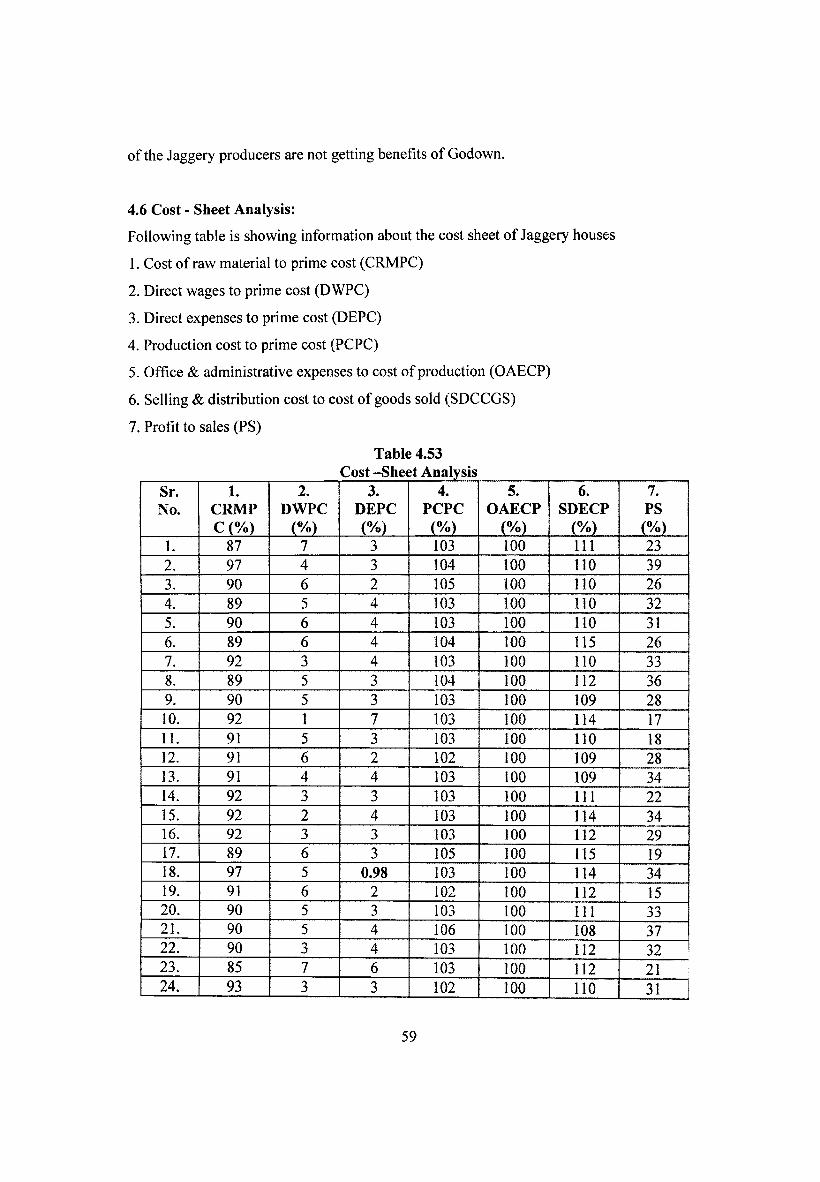
4.6 Cost - Sheet Analysis:Following table is showing information about the cost sheet of Jaggery houses
1. Cost of raw material to prime cost (CRMPC)
2. Direct wages to prime cost (DWPC)
3. Direct expenses to prime cost (DEPC)
4. Production cost to prime cost (PCPC)
5. Office & administrative expenses to cost of production (OAECP)
6. Selling & distribution cost to cost of goods sold (SDCCGS)
7. Profit to sales (PS)
Table 4.53Cost -Sheet Analysis
Sr. 1. 2. 3. 4. 5. 6. 7.No. CRMP DWPC DEPC PCPC OAECP SDECP PS
C (%) (%) (%) (%) (%) (%) (%)1. 87 7 3 103 100 111 232. 97 4 3 104 100 110 393. 90 6 2 105 100 110 264. 89 5 4 103 100 110 325. 90 6 4 103 100 110 316. 89 6 4 104 100 115 267. 92 3 4 103 100 110 338. 89 5 3 104 100 112 369. 90 5 3 103 100 109 2810. 92 1 7 103 100 114 1711. 91 5 3 103 100 110 1812. 91 6 2 102 100 109 2813. 91 4 4 103 100 109 3414. 92 3 3 103 100 111 2215. 92 2 4 103 100 114 3416. 92 3 3 103 100 112 2917. 89 6 3 105 100 115 1918. 97 5 0.98 103 100 114 3419. 91 6 2 102 100 112 1520. 90 5 3 103 100 111 3321. 90 5 4 106 100 108 3722. 90 3 4 103 100 112 3223. 85 7 6 103 100 112 2124. 93 3 3 102 100 110 31
59
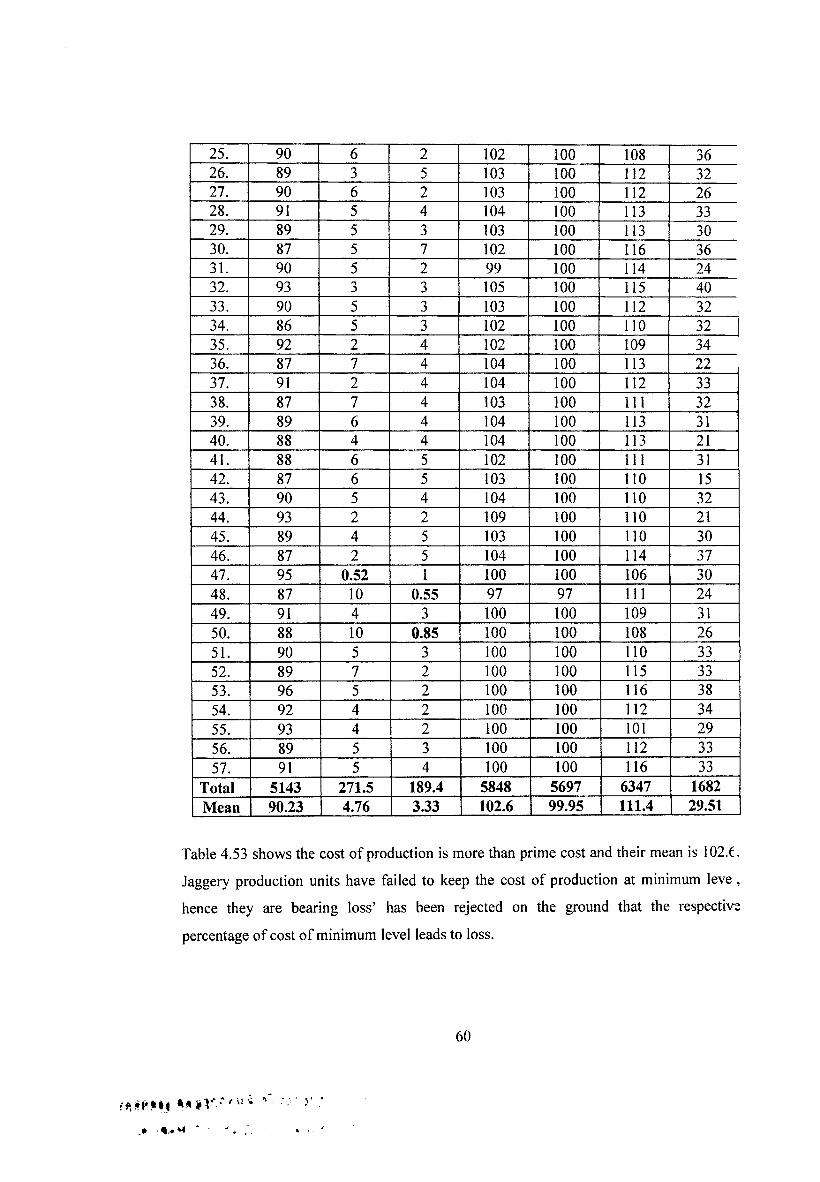
25. 90 6 2 102 100 108 3626. 89 3 5 103 100 112 3227. 90 6 2 103 100 112 2628. 91 5 4 104 100 113 3329. 89 5 3 103 100 113 3030. 87 5 7 102 100 116 3631. 90 5 2 99 100 114 2432. 93 3 3 105 100 115 4033. 90 5 3 103 100 112 3234. 86 5 3 102 100 110 3235. 92 2 4 102 100 109 3436. 87 7 4 104 100 113 2237. 91 2 4 104 100 112 3338. 87 7 4 103 100 111 3239. 89 6 4 104 100 113 3140. 88 4 4 104 100 113 2141. 88 6 5 102 100 111 3142. 87 6 5 103 100 110 1543. 90 5 4 104 100 110 3244. 93 2 2 109 100 110 2145. 89 4 5 103 100 110 3046. 87 2 5 104 100 114 3747. 95 0.52 1 100 100 106 3048. 87 10 0.55 97 97 111 2449. 91 4 3 100 100 109 3150. 88 10 0.85 100 100 108 2651. 90 5 3 100 100 110 3352. 89 7 2 100 100 115 3353. 96 5 2 100 100 116 3854. 92 4 2 100 100 112 3455. 93 4 2 100 100 101 2956. 89 5 3 100 100 112 3357. 91 5 4 100 100 116 33
Total 5143 271.5 189.4 5848 5697 6347 1682Mean 90.23 4.76 3.33 102.6 99.95 111.4 29.51
Table 4.53 shows the cost of production is more than prime cost and their mean is 102.C.
Jaggery production units have failed to keep the cost of production at minimum leve ,
hence they are bearing loss’ has been rejected on the ground that the respective
percentage of cost of minimum level leads to loss.
60
.<► ‘
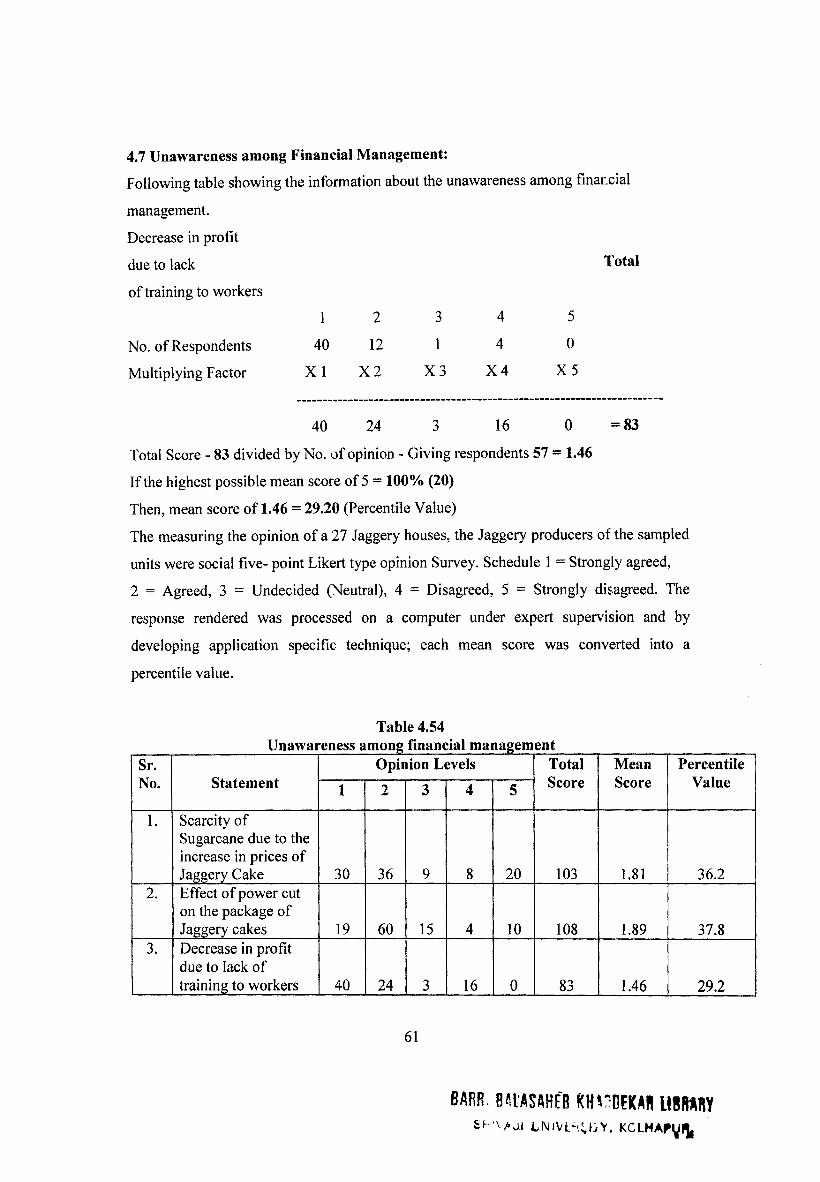
4.7 Unawareness among Financial Management:
Following table showing the information about the unawareness among financial
management.
Decrease in profit
due to lack
of training to workers
1 2 3 4
Total
5
No. of Respondents 40 12 1 4 0
Multiplying Factor X 1 X 2 X 3 X 4 X 5
40 24 3 16 0 =83
Total Score - 83 divided by No. of opinion - Giving respondents 57 = 1.46
If the highest possible mean score of 5 = 100% (20)
Then, mean score of 1.46 = 29.20 (Percentile Value)
The measuring the opinion of a 27 Jaggery houses, the Jaggery producers of the sampled
units were social five- point Likert type opinion Survey. Schedule 1 = Strongly agreed,
2 = Agreed, 3 = Undecided (Neutral), 4 = Disagreed, 5 = Strongly disagreed. The
response rendered was processed on a computer under expert supervision and by
developing application specific technique; each mean score was converted into a
percentile value.
Table 4.54Unawareness among financial management
Sr.No. Statement
Opinion Levels TotalScore
MeanScore
PercentileValue1 2 3 4 5
1. Scarcity ofSugarcane due to the increase in prices of Jaggery Cake 30 36 9 8 20 103 1.81 36.2
2. Effect of power cut on the package of Jaggery cakes 19 60 15 4 10 108 1.89 37.8
3. Decrease in profit due to lack of training to workers 40 24 3 16 0 83 1.46 29.2
61
BARR Btl'ASAHEB KHl'DEKAB LIBRARYSI- ‘VAvU LNIVI>.;LY. KCLMAPyiJ,
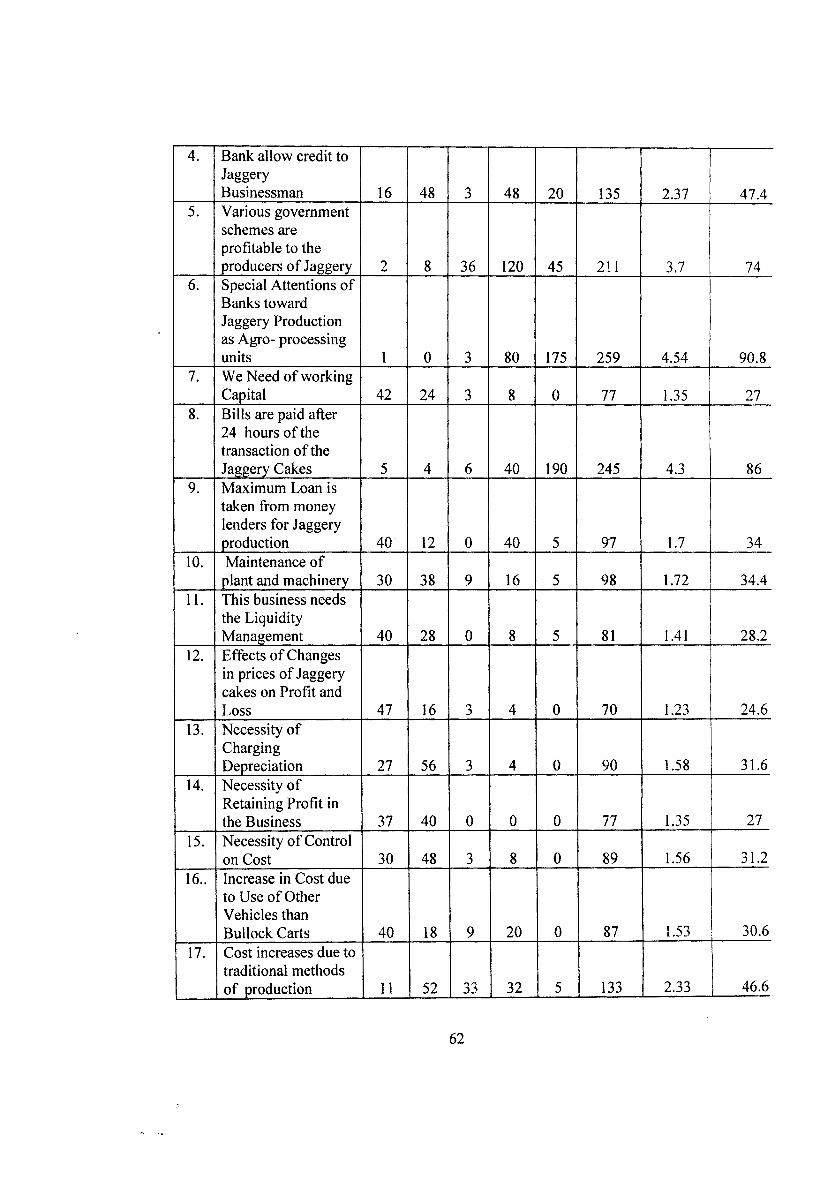
4. Bank allow credit to JaggeryBusinessman 16 48 3 48 20 135 2.37 47.4
5. Various government schemes are profitable to the producers of Jaggery 2 8 36 120 45 211 3.7 74
6. Special Attentions of Banks towardJaggery Production as Agro- processing units 1 0 3 80 175 259 4.54 90.8
7. We Need of working Capital 42 24 3 8 0 77 1.35 27
8. Bills are paid after24 hours of the transaction of the Jaggery Cakes 5 4 6 40 190 245 4.3 86
9. Maximum Loan is taken from money lenders for Jaggery production 40 12 0 40 5 97 1.7 34
10. Maintenance of plant and machinery 30 38 9 16 5 98 1.72 34.4
11. This business needs the Liquidity Management 40 28 0 8 5 81 1.41 28.2
12. Effects of Changes in prices of Jaggery cakes on Profit and Loss 47 16 3 4 0 70 1.23 24.6
13. Necessity ofChargingDepreciation 27 56 3 4 0 90 1.58 31.6
14. Necessity of Retaining Profit in the Business 37 40 0 0 0 77 1.35 27
15. Necessity of Control on Cost 30 48 3 8 0 89 1.56 31.2
16.. Increase in Cost due to Use of Other Vehicles thanBullock Carts 40 18 9 20 0 87 1.53 30.6
17. Cost increases due to traditional methods of production 11 52 33 32 5 133 2.33 46.6
62
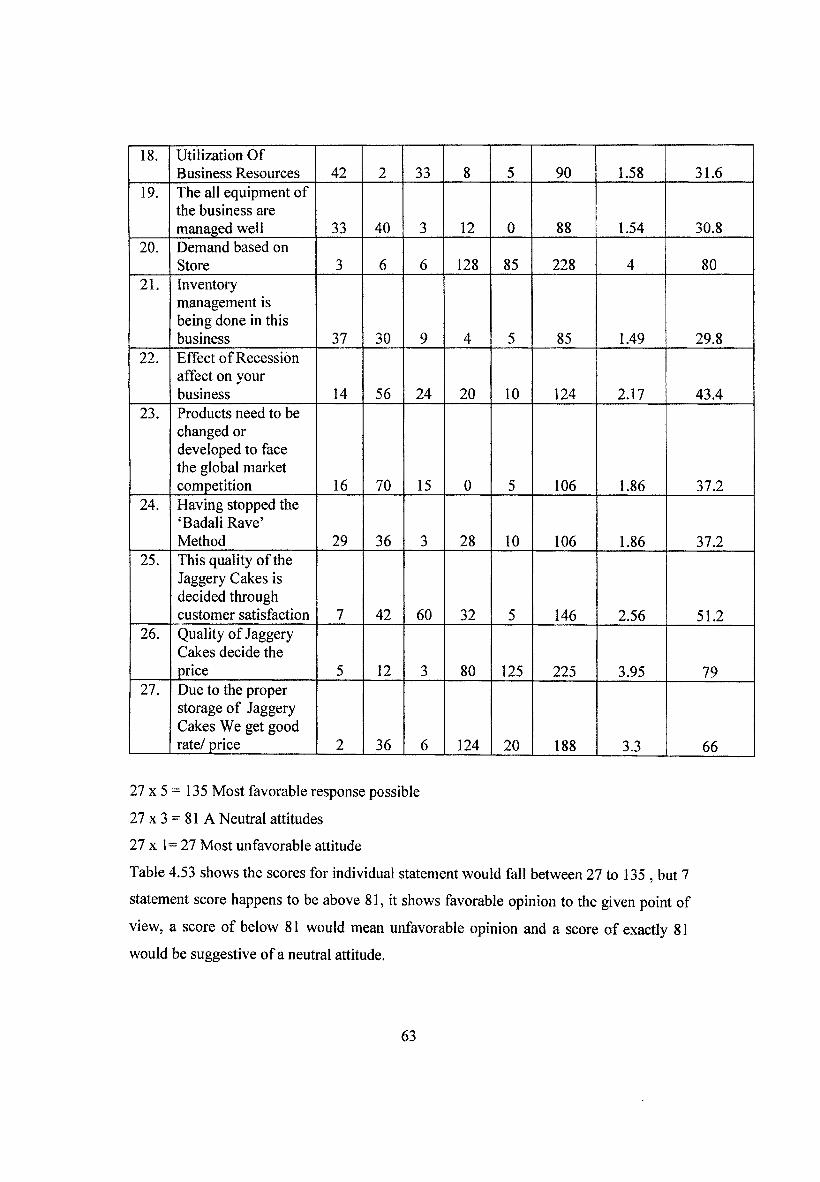
18. Utilization Of Business Resources 42 2 33 8 5 90 1.58 31.6
19. The all equipment of the business are managed well 33 40 3 12 0 88 1.54 30.8
20. Demand based on Store 3 6 6 128 85 228 4 80
21. Inventory management is being done in this business 37 30 9 4 5 85 1.49 29.8
22. Effect of Recession affect on your business 14 56 24 20 10 124 2.17 43.4
23. Products need to be changed or developed to face the global market competition 16 70 15 0 5 106 1.86 37.2
24. Having stopped the ‘Badali Rave’Method 29 36 3 28 10 106 1.86 37.2
25. This quality of the Jaggery Cakes is decided through customer satisfaction 7 42 60 32 5 146 2.56 51.2
26. Quality of Jaggery Cakes decide the price 5 12 3 80 125 225 3.95 79
27. Due to the proper storage of Jaggery Cakes We get good rate/ price 2 36 6 124 20 188 3.3 66
27 x 5 = 135 Most favorable response possible
27 x 3 = 81 A Neutral attitudes
27 x 1= 27 Most unfavorable attitude
Table 4.53 shows the scores for individual statement would fall between 27 to 135 , but 7
statement score happens to be above 81, it shows favorable opinion to the given point of
view, a score of below 81 would mean unfavorable opinion and a score of exactly 81
would be suggestive of a neutral attitude.
63
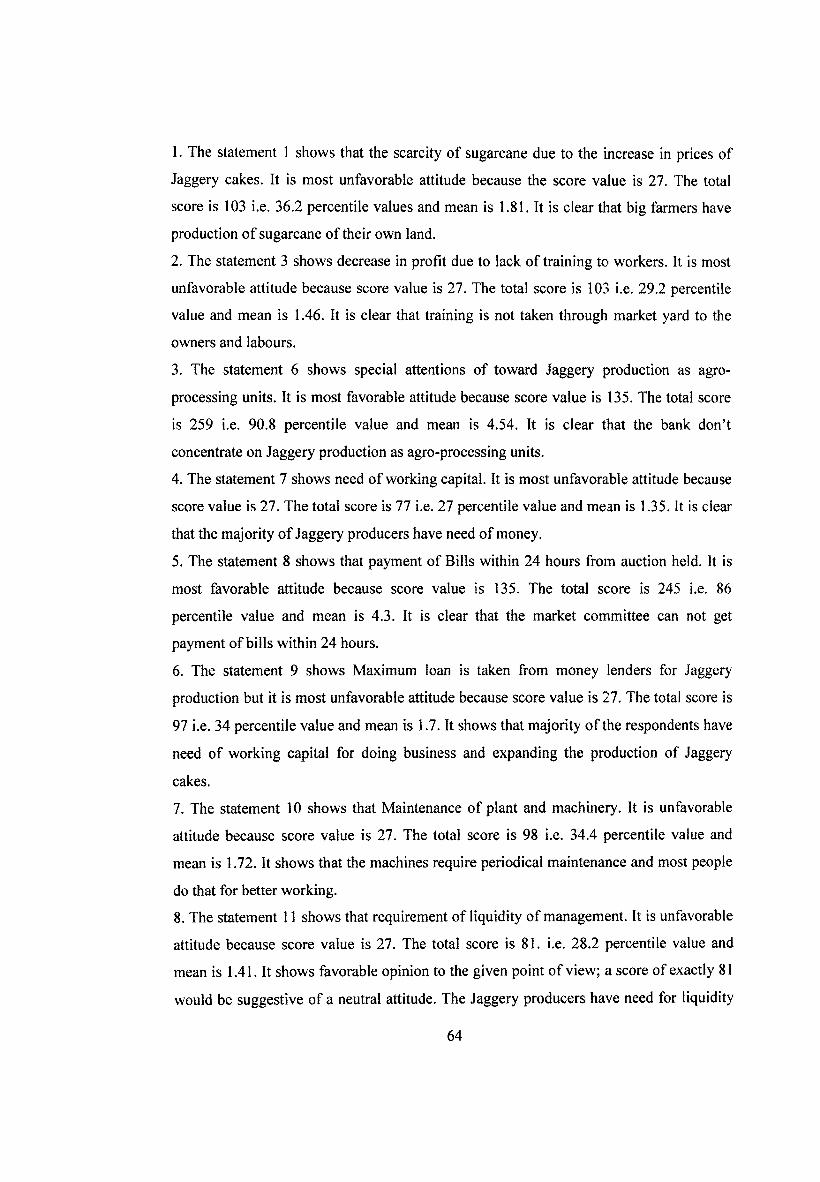
1. The statement 1 shows that the scarcity of sugarcane due to the increase in prices of
Jaggery cakes. It is most unfavorable attitude because the score value is 27. The total
score is 103 i.e. 36.2 percentile values and mean is 1.81. It is clear that big farmers have
production of sugarcane of their own land.
2. The statement 3 shows decrease in profit due to lack of training to workers. It is most
unfavorable attitude because score value is 27. The total score is 103 i.e. 29.2 percentile
value and mean is 1.46. It is clear that training is not taken through market yard to the
owners and labours.
3. The statement 6 shows special attentions of toward Jaggery production as agro
processing units. It is most favorable attitude because score value is 135. The total score
is 259 i.e. 90.8 percentile value and mean is 4.54. It is clear that the bank don’t
concentrate on Jaggery production as agro-processing units.
4. The statement 7 shows need of working capital. It is most unfavorable attitude because
score value is 27. The total score is 77 i.e. 27 percentile value and mean is 1.35. It is clear
that the majority of Jaggery producers have need of money.
5. The statement 8 shows that payment of Bills within 24 hours from auction held. It is
most favorable attitude because score value is 135. The total score is 245 i.e. 86
percentile value and mean is 4.3. It is clear that the market committee can not get
payment of bills within 24 hours.
6. The statement 9 shows Maximum loan is taken from money lenders for Jaggery
production but it is most unfavorable attitude because score value is 27. The total score is
97 i.e. 34 percentile value and mean is 1.7. It shows that majority of the respondents have
need of working capital for doing business and expanding the production of Jaggery
cakes.
7. The statement 10 shows that Maintenance of plant and machinery. It is unfavorable
attitude because score value is 27. The total score is 98 i.e. 34.4 percentile value and
mean is 1.72. It shows that the machines require periodical maintenance and most people
do that for better working.
8. The statement 11 shows that requirement of liquidity of management. It is unfavorable
attitude because score value is 27. The total score is 81. i.e. 28.2 percentile value and
mean is 1.41. It shows favorable opinion to the given point of view; a score of exactly 81
would be suggestive of a neutral attitude. The Jaggery producers have need for liquidity
64
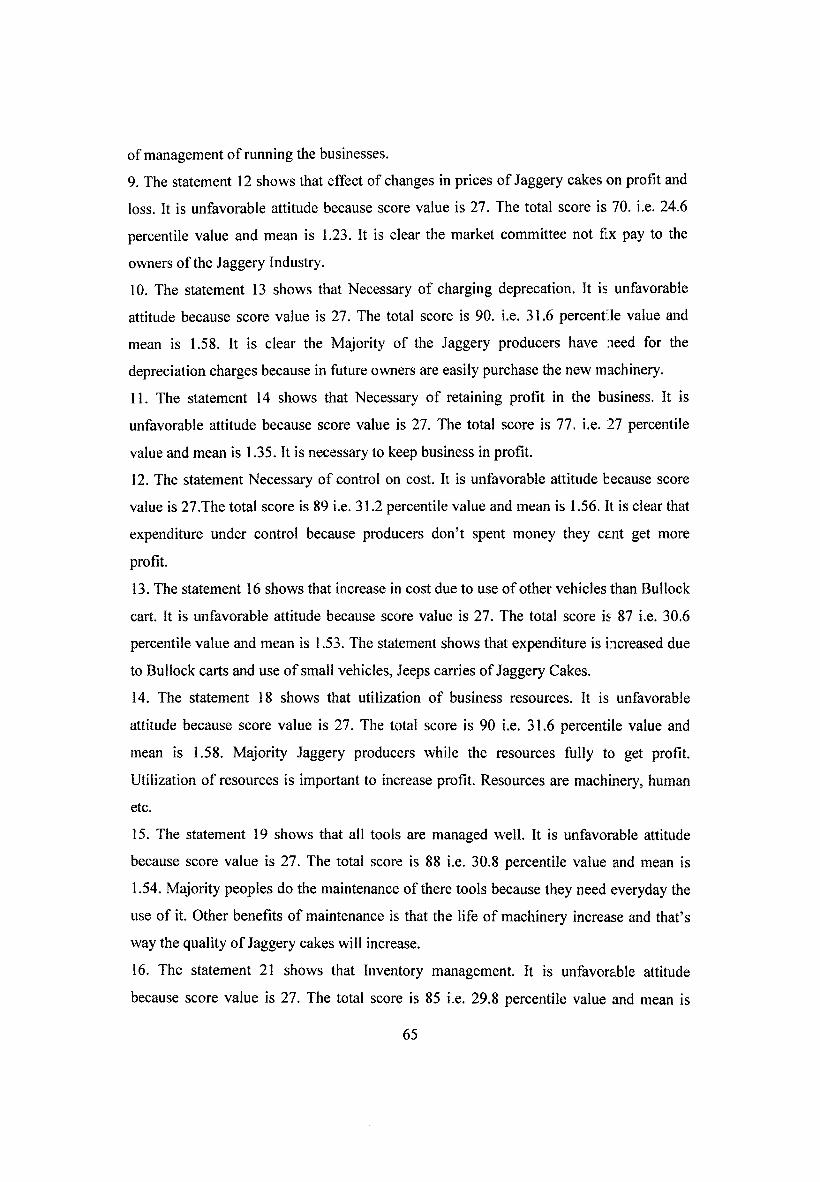
of management of running the businesses.
9. The statement 12 shows that effect of changes in prices of Jaggery cakes on profit and
loss. It is unfavorable attitude because score value is 27. The total score is 70. i.e. 24.6
percentile value and mean is 1.23. It is clear the market committee not fix pay to the
owners of the Jaggery Industry.
10. The statement 13 shows that Necessary of charging deprecation. It is unfavorable
attitude because score value is 27. The total score is 90. i.e. 31.6 percentile value and
mean is 1.58. It is clear the Majority of the Jaggery producers have need for the
depreciation charges because in future owners are easily purchase the new machinery.
11. The statement 14 shows that Necessary of retaining profit in the business. It is
unfavorable attitude because score value is 27. The total score is 77. i.e. 27 percentile
value and mean is 1.35. It is necessary to keep business in profit.
12. The statement Necessary of control on cost. It is unfavorable attitude because score
value is 27.The total score is 89 i.e. 31.2 percentile value and mean is 1.56. It is clear that
expenditure under control because producers don’t spent money they cant get more
profit.
13. The statement 16 shows that increase in cost due to use of other vehicles than Bullock
cart. It is unfavorable attitude because score value is 27. The total score is 87 i.e. 30.6
percentile value and mean is 1.53. The statement shows that expenditure is increased due
to Bullock carts and use of small vehicles, Jeeps carries of Jaggery Cakes.
14. The statement 18 shows that utilization of business resources. It is unfavorable
attitude because score value is 27. The total score is 90 i.e. 31.6 percentile value and
mean is 1.58. Majority Jaggery producers while the resources fully to get profit.
Utilization of resources is important to increase profit. Resources are machinery, human
etc.
15. The statement 19 shows that all tools are managed well. It is unfavorable attitude
because score value is 27. The total score is 88 i.e. 30.8 percentile value and mean is
1.54. Majority peoples do the maintenance of there tools because they need everyday the
use of it. Other benefits of maintenance is that the life of machinery increase and that’s
way the quality of Jaggery cakes will increase.
16. The statement 21 shows that Inventory management. It is unfavorable attitude
because score value is 27. The total score is 85 i.e. 29.8 percentile value and mean is
65
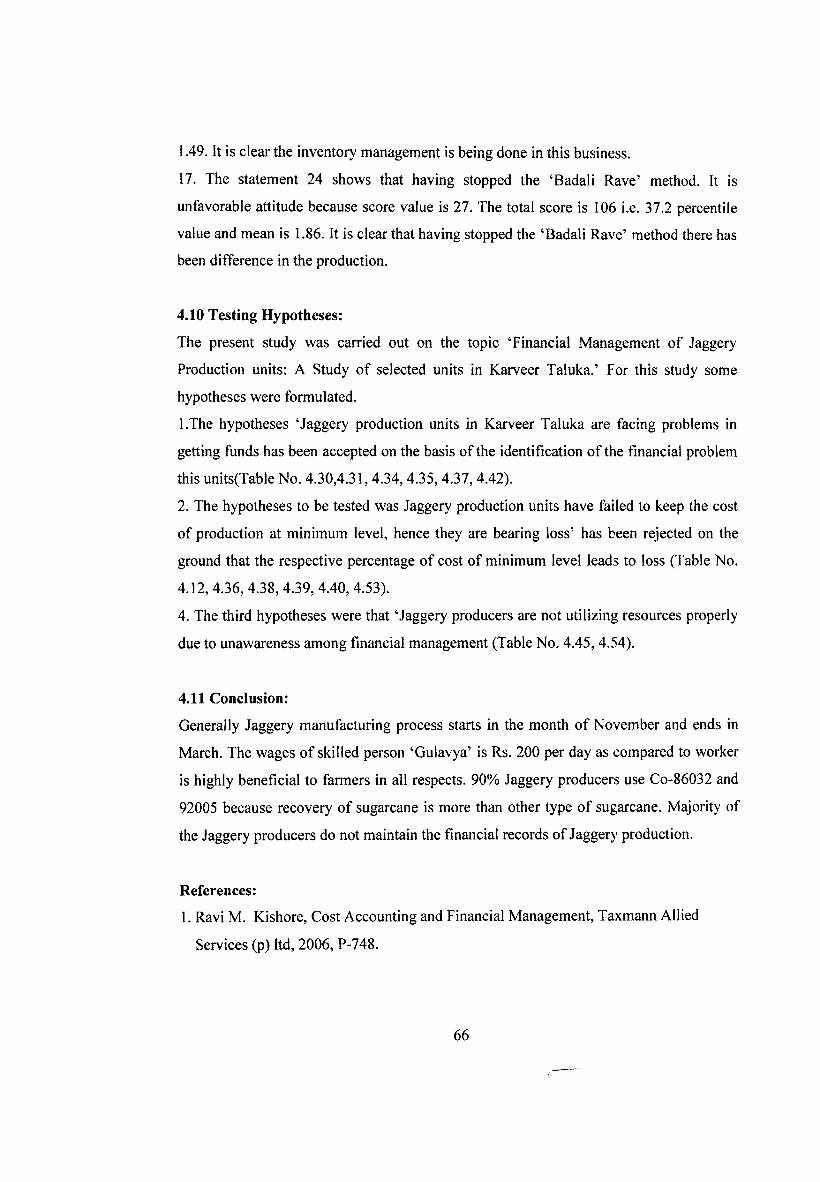
1.49. It is clear the inventory management is being done in this business.
17. The statement 24 shows that having stopped the ‘Badali Rave’ method. It is
unfavorable attitude because score value is 27. The total score is 106 i.e. 37.2 percentile
value and mean is 1.86. It is clear that having stopped the ‘Badali Rave’ method there has
been difference in the production.
4.10 Testing Hypotheses:
The present study was carried out on the topic ‘Financial Management of Jaggery
Production units: A Study of selected units in Karveer Taluka.’ For this study some
hypotheses were formulated.
1. The hypotheses ‘Jaggery production units in Karveer Taluka are facing problems in
getting funds has been accepted on the basis of the identification of the financial problem
this units(Table No. 4.30,4.31,4.34,4.35,4.37,4.42).
2. The hypotheses to be tested was Jaggery production units have failed to keep the cost
of production at minimum level, hence they are bearing loss’ has been rejected on the
ground that the respective percentage of cost of minimum level leads to loss (Table No.
4.12, 4.36, 4.38, 4.39, 4.40, 4.53).
4. The third hypotheses were that ‘Jaggery producers are not utilizing resources properly
due to unawareness among financial management (Table No. 4.45,4.54).
4.11 Conclusion:
Generally Jaggery manufacturing process starts in the month of November and ends in
March. The wages of skilled person ‘Gulavya’ is Rs. 200 per day as compared to worker
is highly beneficial to farmers in all respects. 90% Jaggery producers use Co-86032 and
92005 because recovery of sugarcane is more than other type of sugarcane. Majority of
the Jaggery producers do not maintain the financial records of Jaggery production.
References:
1. Ravi M. Kishore, Cost Accounting and Financial Management, Taxmann Allied
Services (p) ltd, 2006, P-748.
66
Related Documents