128 CHAPTER IV DATA ANALYSIS AND INTERPRETATION 4.0 Introduction Sheligar and Shohamy (1989) state that “data analysis refers to sifting, organizing, summarizing and synthesizing the data so as to arrive at the results and conclusions of the research” (p.201). This chapter presents detailed analyses of the data collected through different tools followed by interpretation of the same. The research questions for the study are reiterated in the form of the hypotheses. Quantitative results from the data collected by means of the tests are examined through different statistical procedures. In addition to the quantitative analysis and a descriptive and qualitative analysis is presented with the results of the speaking skills and of the feedback on the programme. 4.1 Hypotheses The study aimed at checking the effect of a multimedia package to enhance communication skills of the students at the UG level in the digital language laboratory.

Welcome message from author
This document is posted to help you gain knowledge. Please leave a comment to let me know what you think about it! Share it to your friends and learn new things together.
Transcript
128
CHAPTER IV
DATA ANALYSIS AND INTERPRETATION
4.0 Introduction
Sheligar and Shohamy (1989) state that “data analysis refers to sifting,
organizing, summarizing and synthesizing the data so as to arrive at the
results and conclusions of the research” (p.201). This chapter presents
detailed analyses of the data collected through different tools followed by
interpretation of the same. The research questions for the study are reiterated
in the form of the hypotheses. Quantitative results from the data collected by
means of the tests are examined through different statistical procedures. In
addition to the quantitative analysis and a descriptive and qualitative
analysis is presented with the results of the speaking skills and of the
feedback on the programme.
4.1 Hypotheses
The study aimed at checking the effect of a multimedia package to enhance
communication skills of the students at the UG level in the digital language
laboratory.
129
The following null hypothesis guided the research study.
i. There will be no significant difference in the overall mean scores of the
pre-test and post- test of the students.
ii. There will be no significant difference in the mean scores of the pre-test
and post-test of the students in terms of gender.
iii. There will be no significant difference in the mean scores of the pre-test
and post-test of the students in terms of the discipline opted for at
higher secondary level.
iv. There will be no significant difference in the mean scores of the pre-test
and post-test of the students in terms of achievement in English at 12th
standard level.
v. There will be no significant difference in the mean scores of the pre-test
and post-test of the students in terms of SES.
vi. There will be no significant difference in the mean scores of the pre-test
and post test of the students in various language skills covered in the
programme.
4.2 Pre-test and post-test scores
In accordance with the requirement of the study, one-group pre-test, post-
test experimental research design was adopted as already explained in
Section 3.1. The pre-test was administered at the beginning of the
experiment as a regulatory means to control prior differences among
130
participants followed by the treatment and the post-test towards the end of
the experiment to measure the effectiveness of the treatment, that is, the new
materials. The statistical procedures of T-test were used to evaluate the
effectiveness of the treatment offered to the participants as part of the
experiment.
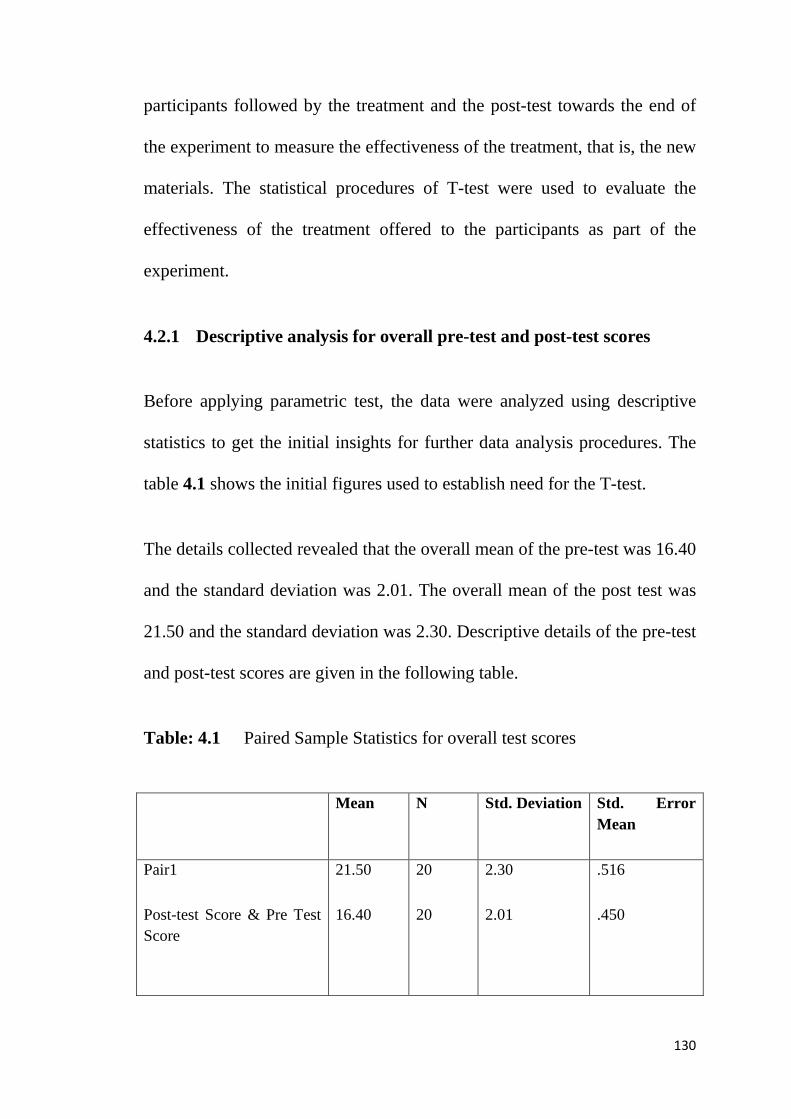
4.2.1 Descriptive analysis for overall pre-test and post-test scores
Before applying parametric test, the data were analyzed using descriptive
statistics to get the initial insights for further data analysis procedures. The
table 4.1 shows the initial figures used to establish need for the T-test.
The details collected revealed that the overall mean of the pre-test was 16.40
and the standard deviation was 2.01. The overall mean of the post test was
21.50 and the standard deviation was 2.30. Descriptive details of the pre-test
and post-test scores are given in the following table.
Table: 4.1 Paired Sample Statistics for overall test scores
Mean N Std. Deviation Std. Error Mean
Pair1
Post-test Score & Pre Test Score
21.50
16.40
20
20
2.30
2.01
.516
.450
131
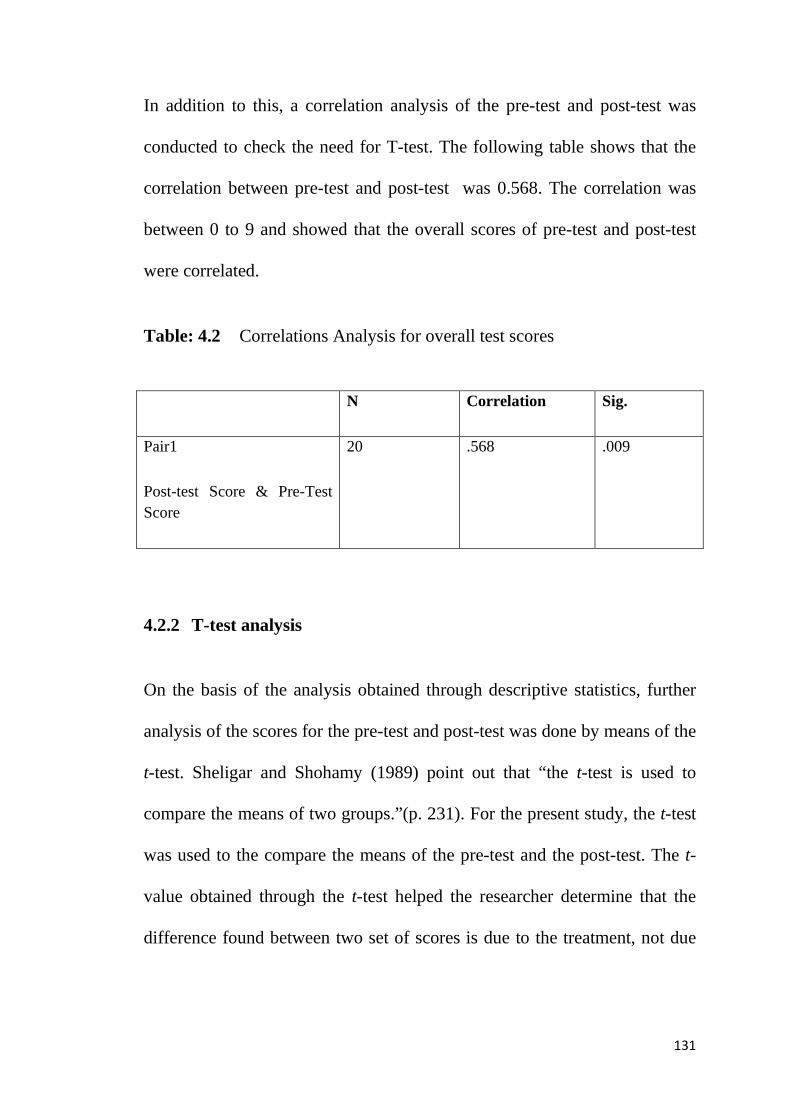
In addition to this, a correlation analysis of the pre-test and post-test was
conducted to check the need for T-test. The following table shows that the
correlation between pre-test and post-test was 0.568. The correlation was
between 0 to 9 and showed that the overall scores of pre-test and post-test
were correlated.
Table: 4.2 Correlations Analysis for overall test scores
N Correlation Sig.
Pair1
Post-test Score & Pre-Test Score
20 .568 .009
4.2.2 T-test analysis
On the basis of the analysis obtained through descriptive statistics, further
analysis of the scores for the pre-test and post-test was done by means of the
t-test. Sheligar and Shohamy (1989) point out that “the t-test is used to
compare the means of two groups.”(p. 231). For the present study, the t-test
was used to the compare the means of the pre-test and the post-test. The t-
value obtained through the t-test helped the researcher determine that the
difference found between two set of scores is due to the treatment, not due
132
to chance. For the current study, the t-test analysis was conducted for the
first hypothesis set out in the study.
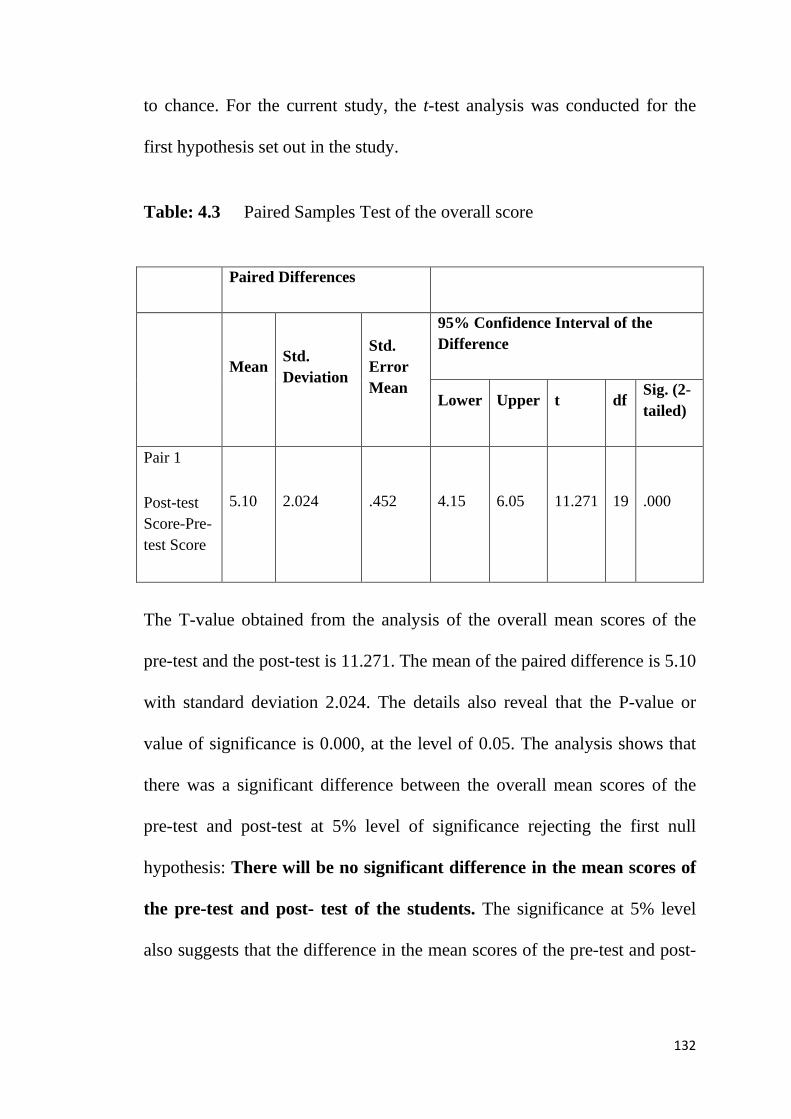
Table: 4.3 Paired Samples Test of the overall score
Paired Differences
Mean Std. Deviation
Std. Error Mean
95% Confidence Interval of the Difference
Lower Upper t df Sig. (2-tailed)
Pair 1
Post-test Score-Pre-test Score
5.10 2.024 .452 4.15
6.05
11.271 19 .000
The T-value obtained from the analysis of the overall mean scores of the
pre-test and the post-test is 11.271. The mean of the paired difference is 5.10
with standard deviation 2.024. The details also reveal that the P-value or
value of significance is 0.000, at the level of 0.05. The analysis shows that
there was a significant difference between the overall mean scores of the
pre-test and post-test at 5% level of significance rejecting the first null
hypothesis: There will be no significant difference in the mean scores of
the pre-test and post- test of the students. The significance at 5% level
also suggests that the difference in the mean scores of the pre-test and post-
133
test is due to the effect of the materials and the programme, not due to
chance.
i) Difference in the mean scores in relation to gender
In order to get the difference between the pre-test and post-test in relation to
gender, Levene’s Test for Equality of Variances was applied. Before the
test a descriptive analysis of the Pre-test and post-test scores of Male and
Female participants was done to find out initial difference. The table ……
shows the group statistics of the subject according to their gender.
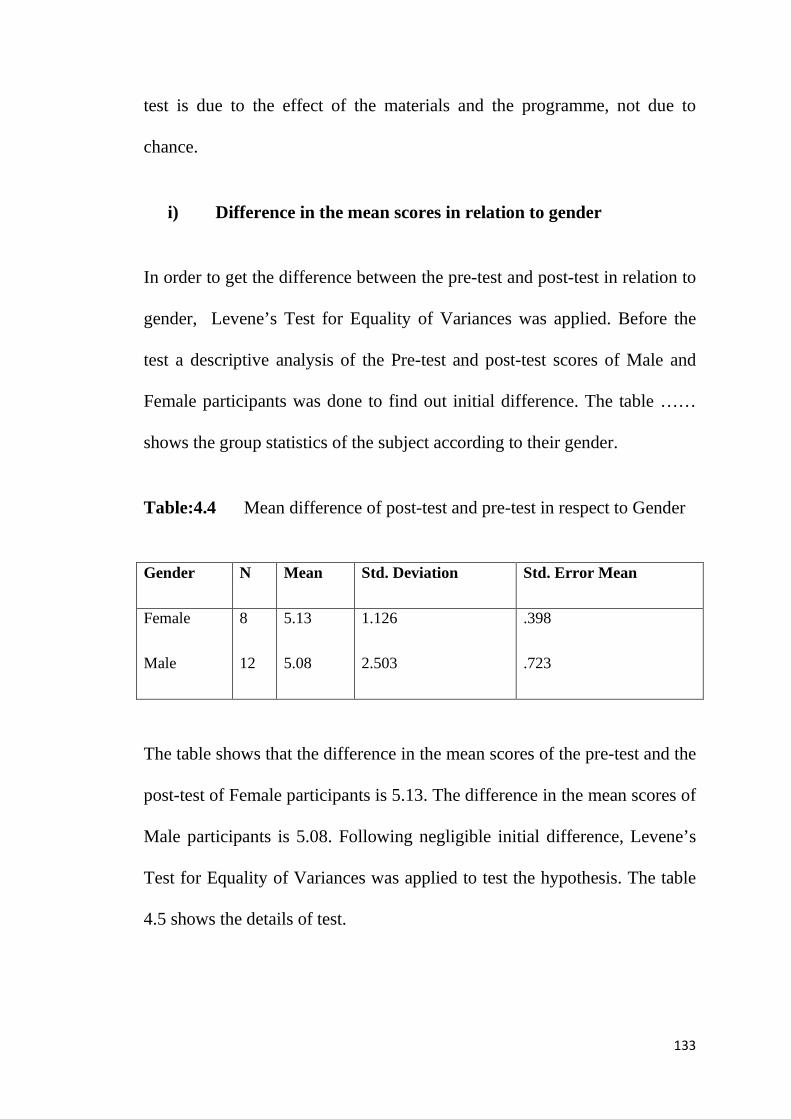
Table:4.4 Mean difference of post-test and pre-test in respect to Gender
Gender N Mean Std. Deviation Std. Error Mean
Female
Male
8
12
5.13
5.08
1.126
2.503
.398
.723
The table shows that the difference in the mean scores of the pre-test and the
post-test of Female participants is 5.13. The difference in the mean scores of
Male participants is 5.08. Following negligible initial difference, Levene’s
Test for Equality of Variances was applied to test the hypothesis. The table
4.5 shows the details of test.
134
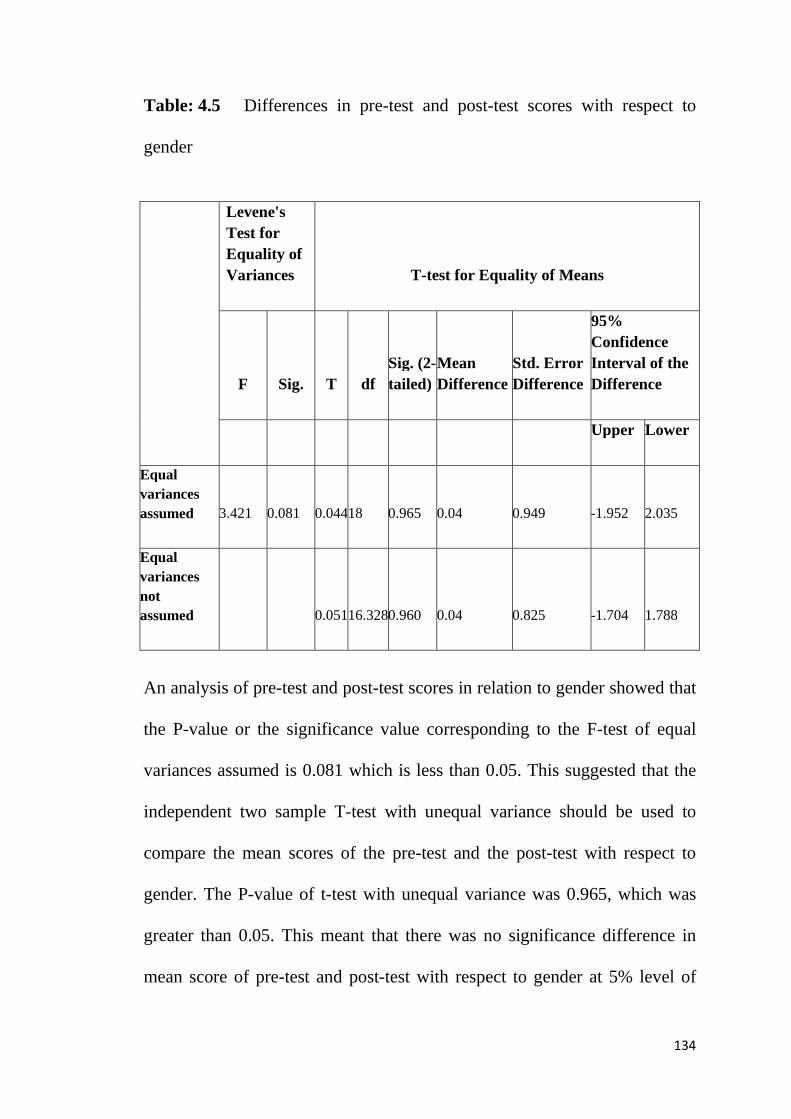
Table: 4.5 Differences in pre-test and post-test scores with respect to
gender
Levene's Test for Equality of Variances T-test for Equality of Means
F Sig. T df Sig. (2-tailed)
Mean Difference
Std. Error Difference
95% Confidence Interval of the Difference
Upper Lower
Equal variances assumed 3.421 0.081 0.04418 0.965 0.04 0.949 -1.952 2.035
Equal variances not assumed 0.05116.3280.960 0.04 0.825 -1.704 1.788
An analysis of pre-test and post-test scores in relation to gender showed that
the P-value or the significance value corresponding to the F-test of equal
variances assumed is 0.081 which is less than 0.05. This suggested that the
independent two sample T-test with unequal variance should be used to
compare the mean scores of the pre-test and the post-test with respect to
gender. The P-value of t-test with unequal variance was 0.965, which was
greater than 0.05. This meant that there was no significance difference in
mean score of pre-test and post-test with respect to gender at 5% level of

135
significance. As a result, the finding suggested that since there was no
significant difference to be found in the mean scores of the pre-test and the
post-test with respect to gender.
ii) Difference in the mean scores in relation to discipline opted at
higher secondary level
The subjects of the study were undergraduate level students of Arts and
Commerce stream. One of the objectives of the study was to investigate the
achievement level of the participants in respect to their discipline of study at
higher secondary level. The data was analyzed using Levene’s Test or
Independent Sample t-test. The table 4.6 shows the descriptive statistics in
terms of discipline of the sample.
Table 4.6 Mean difference of post-test and pre-test with respect to
discipline of study
Discipline N Mean Std. Deviation Std. Error Mean
Arts
Commerce
10
10
5.70
4.50
1.829
2.121
.578
.671
The details in the table indicate that there is a mean difference of 5.70 and
standard deviation of 1.829 between the score of post-test and pre-test of
Arts’ students. The mean difference in the scores of post-test and pre-test of
136
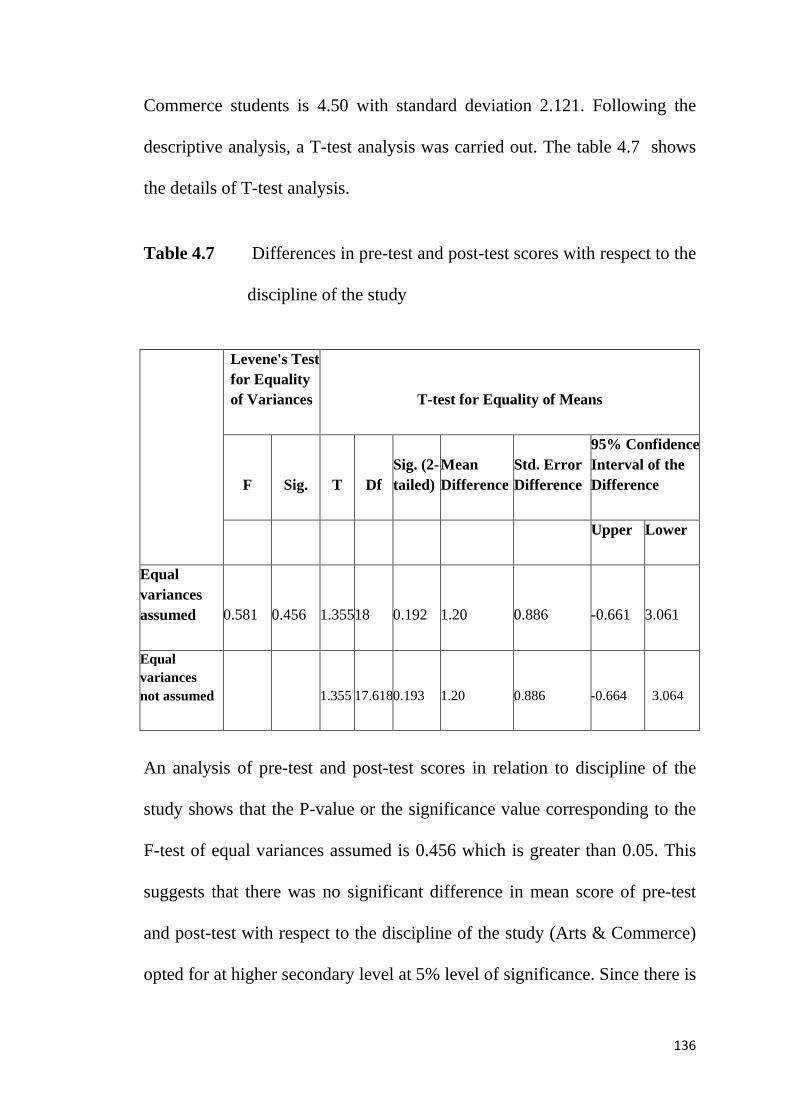
Commerce students is 4.50 with standard deviation 2.121. Following the
descriptive analysis, a T-test analysis was carried out. The table 4.7 shows
the details of T-test analysis.
Table 4.7 Differences in pre-test and post-test scores with respect to the
discipline of the study
Levene's Test for Equality of Variances T-test for Equality of Means
F Sig. T Df Sig. (2-tailed)
Mean Difference
Std. Error Difference
95% Confidence Interval of the Difference
Upper Lower
Equal variances assumed 0.581 0.456 1.35518 0.192 1.20 0.886 -0.661 3.061
Equal variances not assumed 1.355 17.6180.193 1.20 0.886 -0.664 3.064
An analysis of pre-test and post-test scores in relation to discipline of the
study shows that the P-value or the significance value corresponding to the
F-test of equal variances assumed is 0.456 which is greater than 0.05. This
suggests that there was no significant difference in mean score of pre-test
and post-test with respect to the discipline of the study (Arts & Commerce)
opted for at higher secondary level at 5% level of significance. Since there is
137
no significant difference found in the mean scores of the pre-test and the
post-test, it can be concluded that the materials had similar and equal effect
on Arts as well as Commerce students.
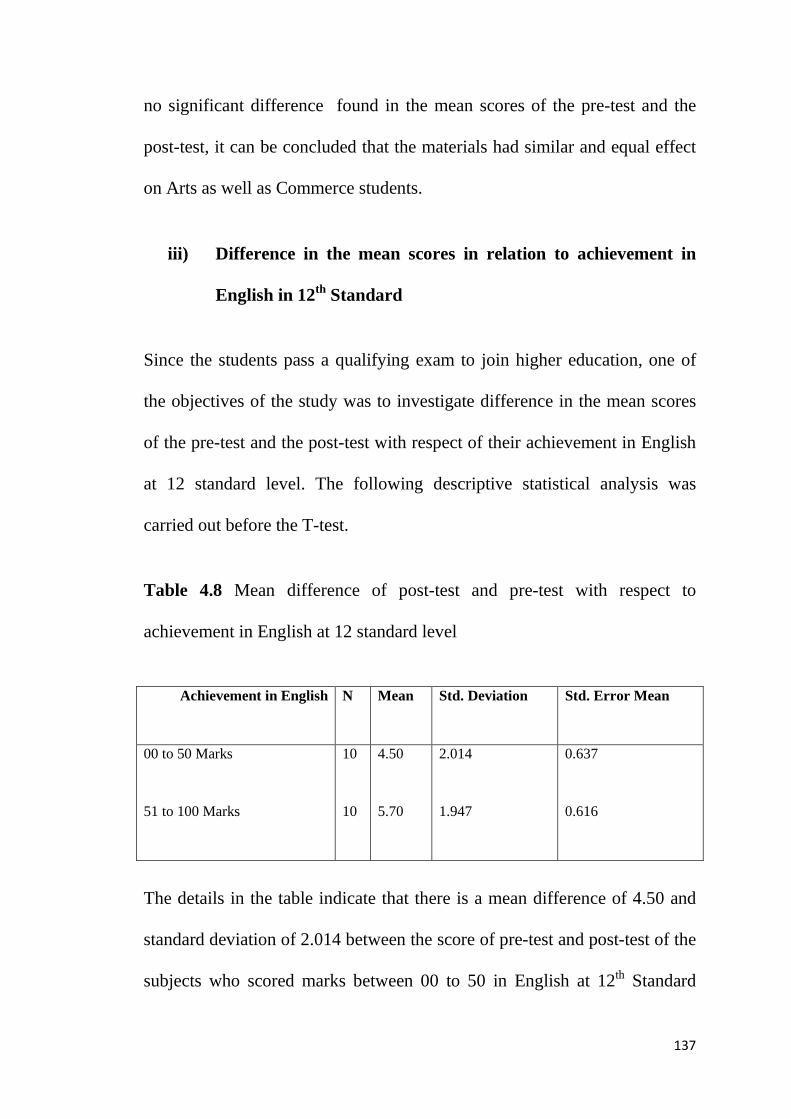
iii) Difference in the mean scores in relation to achievement in
English in 12th Standard
Since the students pass a qualifying exam to join higher education, one of
the objectives of the study was to investigate difference in the mean scores
of the pre-test and the post-test with respect of their achievement in English
at 12 standard level. The following descriptive statistical analysis was
carried out before the T-test.
Table 4.8 Mean difference of post-test and pre-test with respect to
achievement in English at 12 standard level
Achievement in English N Mean Std. Deviation Std. Error Mean
00 to 50 Marks
51 to 100 Marks
10
10
4.50
5.70
2.014
1.947
0.637
0.616
The details in the table indicate that there is a mean difference of 4.50 and
standard deviation of 2.014 between the score of pre-test and post-test of the
subjects who scored marks between 00 to 50 in English at 12th Standard
138
level. The mean difference in the scores of pre-test and post-test of the
students who scored between 51 to 100 is 5.70 with standard deviation of
1.947. Following the descriptive analysis, a T-test analysis was carried out.
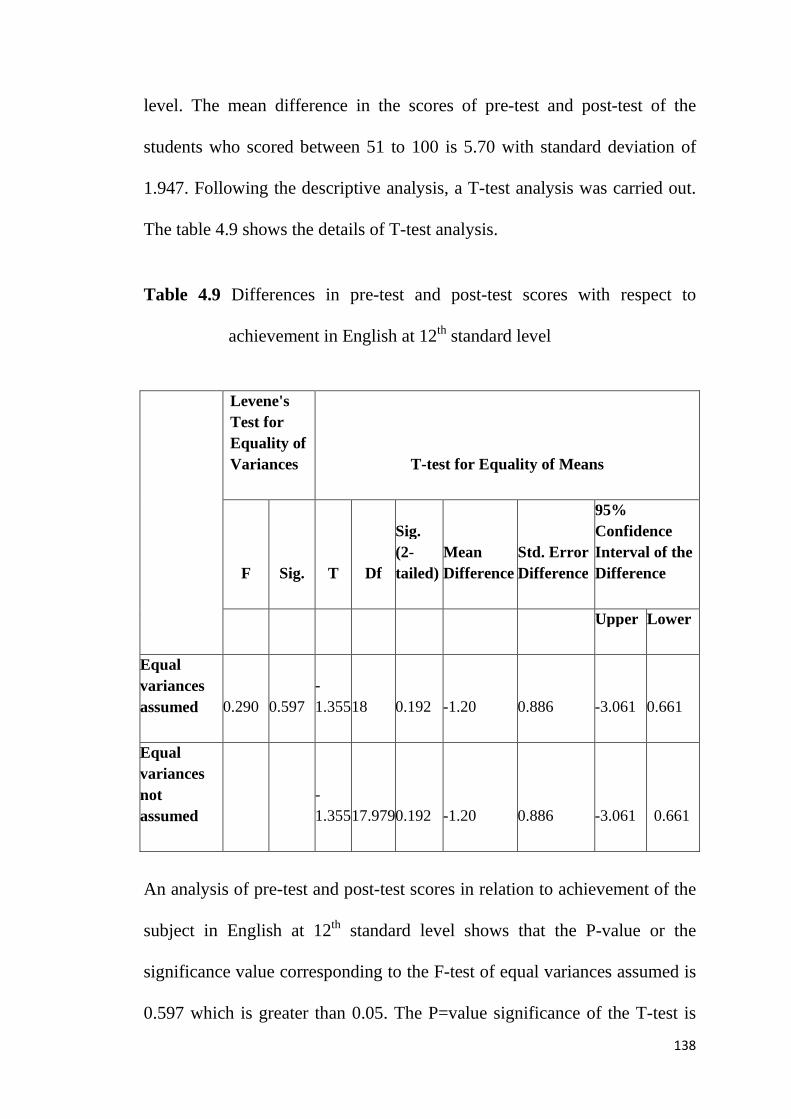
The table 4.9 shows the details of T-test analysis.
Table 4.9 Differences in pre-test and post-test scores with respect to
achievement in English at 12th standard level
Levene's Test for Equality of Variances T-test for Equality of Means
F Sig. T Df
Sig. (2-tailed)
Mean Difference
Std. Error Difference
95% Confidence Interval of the Difference
Upper Lower
Equal variances assumed 0.290 0.597
-1.355 18 0.192 -1.20 0.886 -3.061 0.661
Equal variances not assumed
-1.355 17.9790.192 -1.20 0.886 -3.061 0.661
An analysis of pre-test and post-test scores in relation to achievement of the
subject in English at 12th standard level shows that the P-value or the
significance value corresponding to the F-test of equal variances assumed is
0.597 which is greater than 0.05. The P=value significance of the T-test is
139
0.192 which is greater than 0.05. This suggests that there was no significant
difference in mean score of pre-test and post-test with respect to
achievement of the students in English in 12th standard at 5% level of
significance. Based on the analysis it can be concluded that the materials
had equal effect on those who score above as well as below 50 marks in 12th
Standard English.
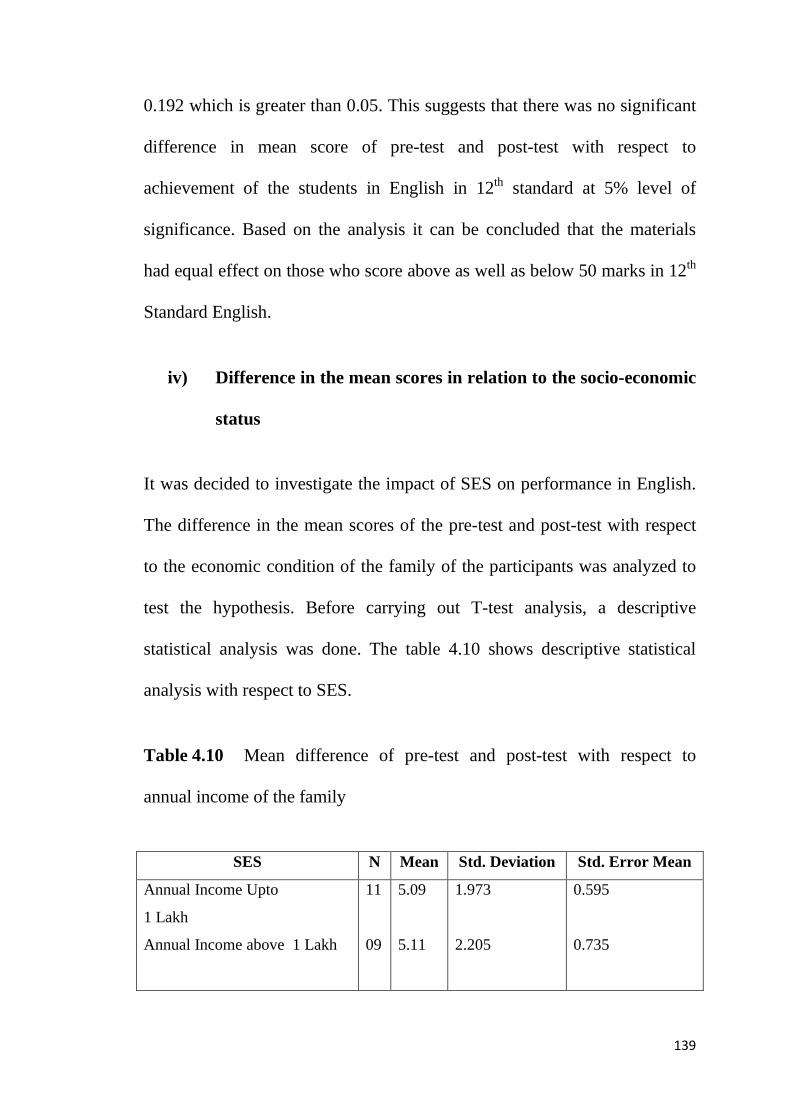
iv) Difference in the mean scores in relation to the socio-economic
status
It was decided to investigate the impact of SES on performance in English.
The difference in the mean scores of the pre-test and post-test with respect
to the economic condition of the family of the participants was analyzed to
test the hypothesis. Before carrying out T-test analysis, a descriptive
statistical analysis was done. The table 4.10 shows descriptive statistical
analysis with respect to SES.
Table 4.10 Mean difference of pre-test and post-test with respect to
annual income of the family
SES N Mean Std. Deviation Std. Error Mean
Annual Income Upto
1 Lakh
Annual Income above 1 Lakh
11
09
5.09
5.11
1.973
2.205
0.595
0.735
140
The details in the table indicate that there is a mean difference of 5.09 and
standard deviation of 1.973 between the scores of pre-test and post-test of
the subjects whose family income is upto 1 Lakh. The mean difference in
the scores of pre-test and post-test of the students with above 1 Lakh family
income is 1 Lakh is 5.11 with standard deviation of 2.205. Following the
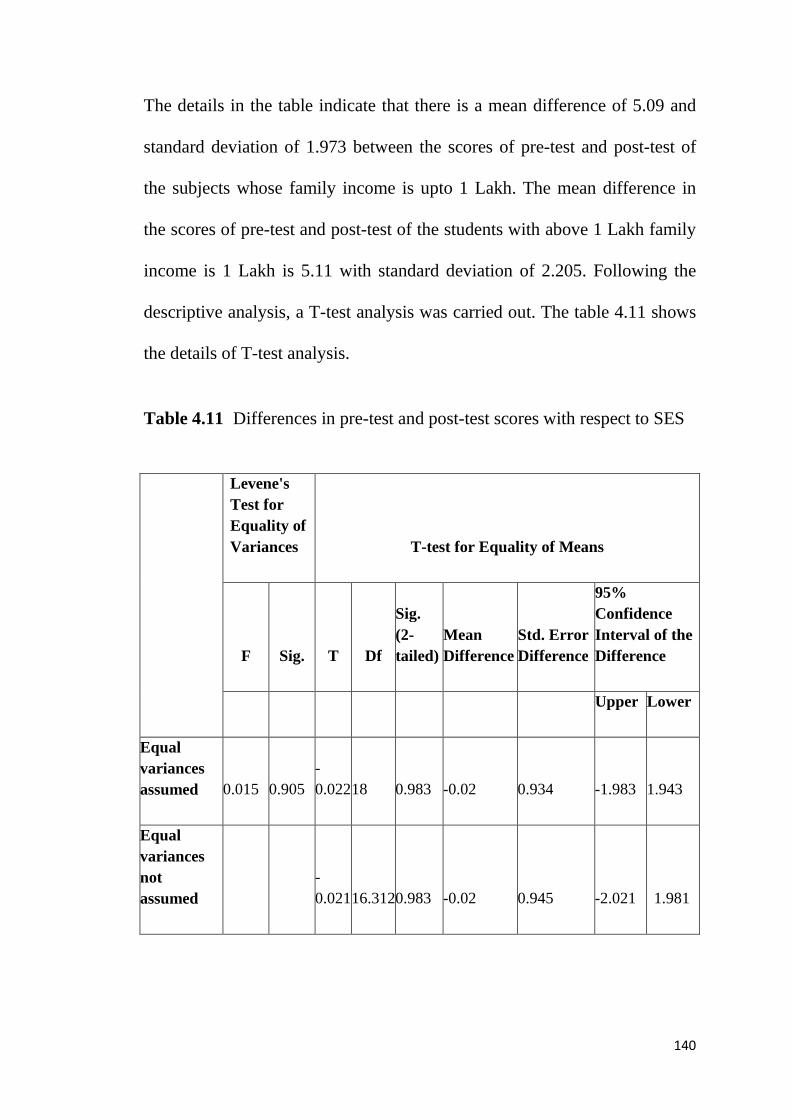
descriptive analysis, a T-test analysis was carried out. The table 4.11 shows
the details of T-test analysis.
Table 4.11 Differences in pre-test and post-test scores with respect to SES
Levene's Test for Equality of Variances T-test for Equality of Means
F Sig. T Df
Sig. (2-tailed)
Mean Difference
Std. Error Difference
95% Confidence Interval of the Difference
Upper Lower
Equal variances assumed 0.015 0.905
-0.022 18 0.983 -0.02 0.934 -1.983 1.943
Equal variances not assumed
-0.021 16.3120.983 -0.02 0.945 -2.021 1.981
141
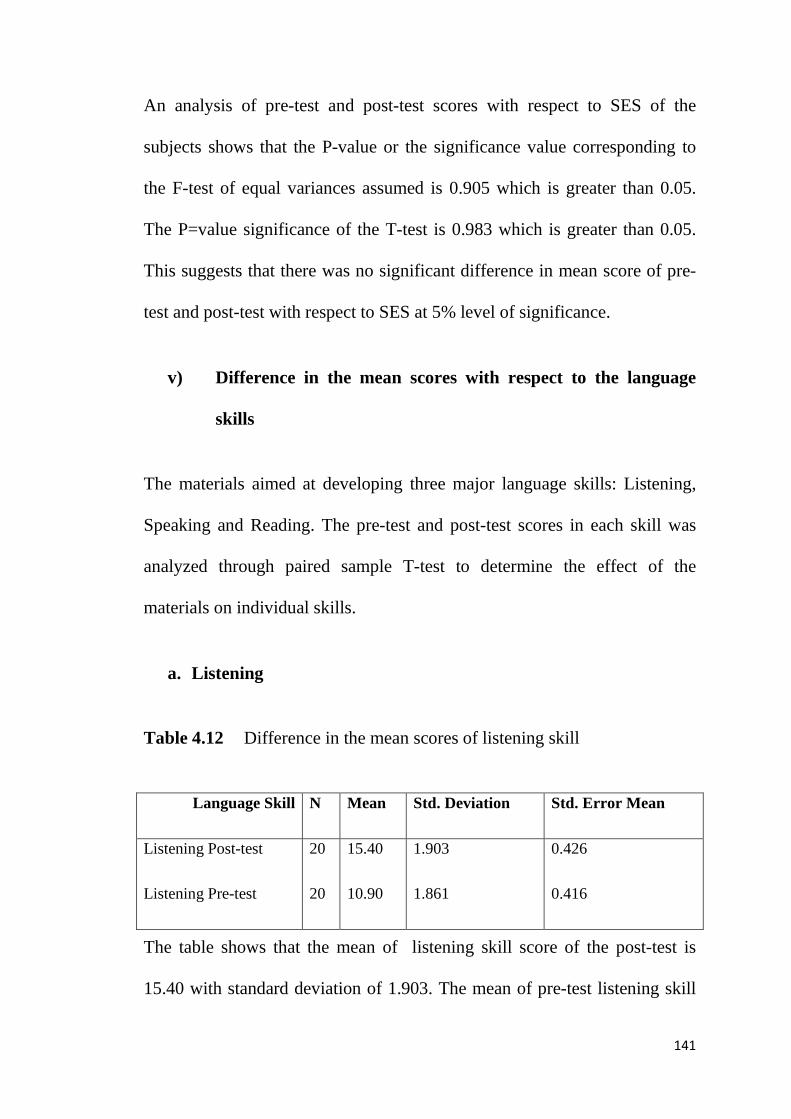
An analysis of pre-test and post-test scores with respect to SES of the
subjects shows that the P-value or the significance value corresponding to
the F-test of equal variances assumed is 0.905 which is greater than 0.05.
The P=value significance of the T-test is 0.983 which is greater than 0.05.
This suggests that there was no significant difference in mean score of pre-
test and post-test with respect to SES at 5% level of significance.
v) Difference in the mean scores with respect to the language
skills
The materials aimed at developing three major language skills: Listening,
Speaking and Reading. The pre-test and post-test scores in each skill was
analyzed through paired sample T-test to determine the effect of the
materials on individual skills.
a. Listening
Table 4.12 Difference in the mean scores of listening skill
Language Skill N Mean Std. Deviation Std. Error Mean
Listening Post-test
Listening Pre-test
20
20
15.40
10.90
1.903
1.861
0.426
0.416
The table shows that the mean of listening skill score of the post-test is
15.40 with standard deviation of 1.903. The mean of pre-test listening skill
142
score is 10.90 with standard deviation of 1.861. The difference in the mean
scores of pre-test and post test is 4.50. In addition to this, a correlation
analysis of the pre-test and post-test was conducted to check the need for T-
test. The following table shows the correlation between pre-test and post-test
scores.
Table 4.13 Correlations Analysis
Listening Skill N Correlation Sig.
Pair1
Post-test Score & Pre-Test Score
20 .606 .005
The analysis shows that the correlation between pre-test and post-test scores
in listening skills is 0.606. The correlation, which is between 0 to 9 and the
significance value 0.05 shows that the overall scores of pre-test and post-test
are highly correlated. For further analysis T-test was carried out. The table
4.14 shows the T-test analysis.
143
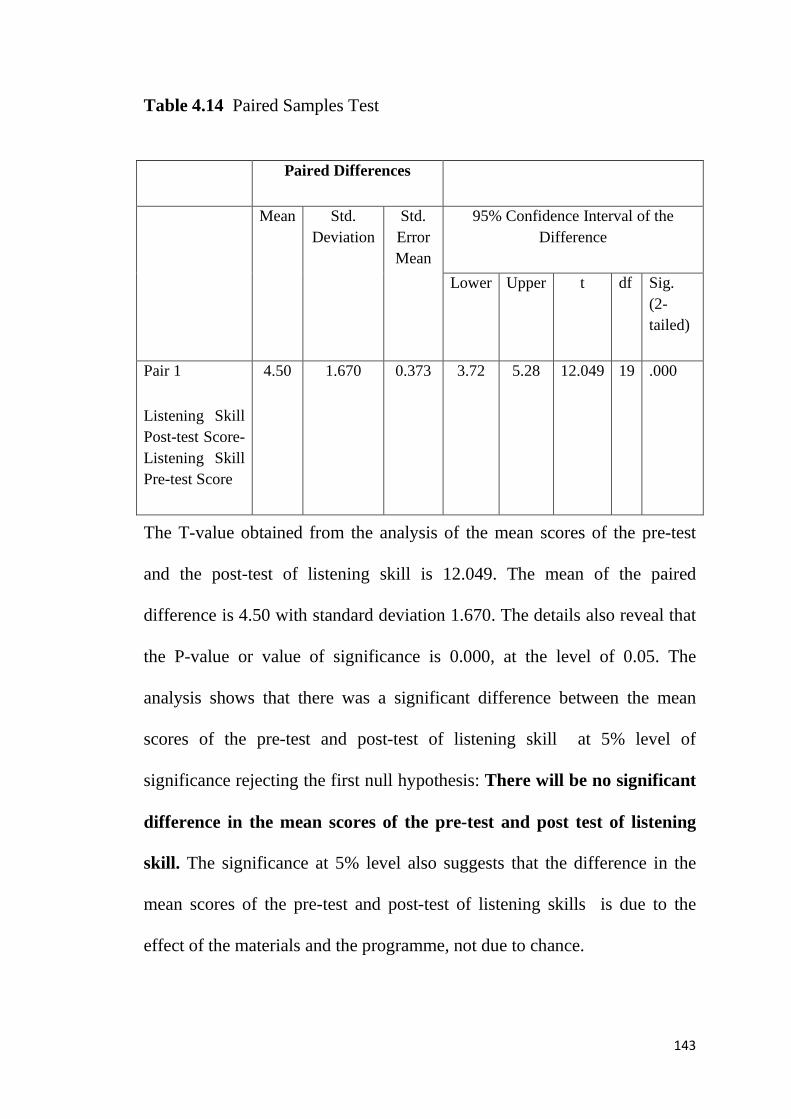
Table 4.14 Paired Samples Test
Paired Differences
Mean Std. Deviation
Std. Error Mean
95% Confidence Interval of the Difference
Lower Upper t df Sig. (2-tailed)
Pair 1
Listening Skill Post-test Score-Listening Skill Pre-test Score
4.50 1.670 0.373 3.72 5.28
12.049 19 .000
The T-value obtained from the analysis of the mean scores of the pre-test
and the post-test of listening skill is 12.049. The mean of the paired
difference is 4.50 with standard deviation 1.670. The details also reveal that
the P-value or value of significance is 0.000, at the level of 0.05. The
analysis shows that there was a significant difference between the mean
scores of the pre-test and post-test of listening skill at 5% level of
significance rejecting the first null hypothesis: There will be no significant
difference in the mean scores of the pre-test and post test of listening
skill. The significance at 5% level also suggests that the difference in the
mean scores of the pre-test and post-test of listening skills is due to the
effect of the materials and the programme, not due to chance.

144
b. Reading
The pre-test and post-test scores in reading skill were analyzed through
paired sample T-test to determine the effect of the materials on development
of reading skills.
Table 4.15 Difference in the mean scores of reading skill
Reading Skill N Mean Std. Deviation Std. Error Mean
Listening Post-test
Listening Pre-test
20
20
6.10
5.50
1.252
0.827
0.280
0.185
The table shows that the mean of reading skill score of the post-test is 6.10
with standard deviation of 1.252. The mean of pre-test reading skill score is
5.50 with standard deviation of 0.827. The difference in the mean scores of
pre-test and post test is 0.60. In addition to this, a correlation analysis of the
pre-test and post-test was conducted to check the need for T-test. The
following table shows the correlation between pre-test and post-test scores.
Table 4.16 Correlations Analysis
Reading Skill N Correlation Sig.
Pair1
Post-test Score & Pre-Test Score
20 .102 .670
145
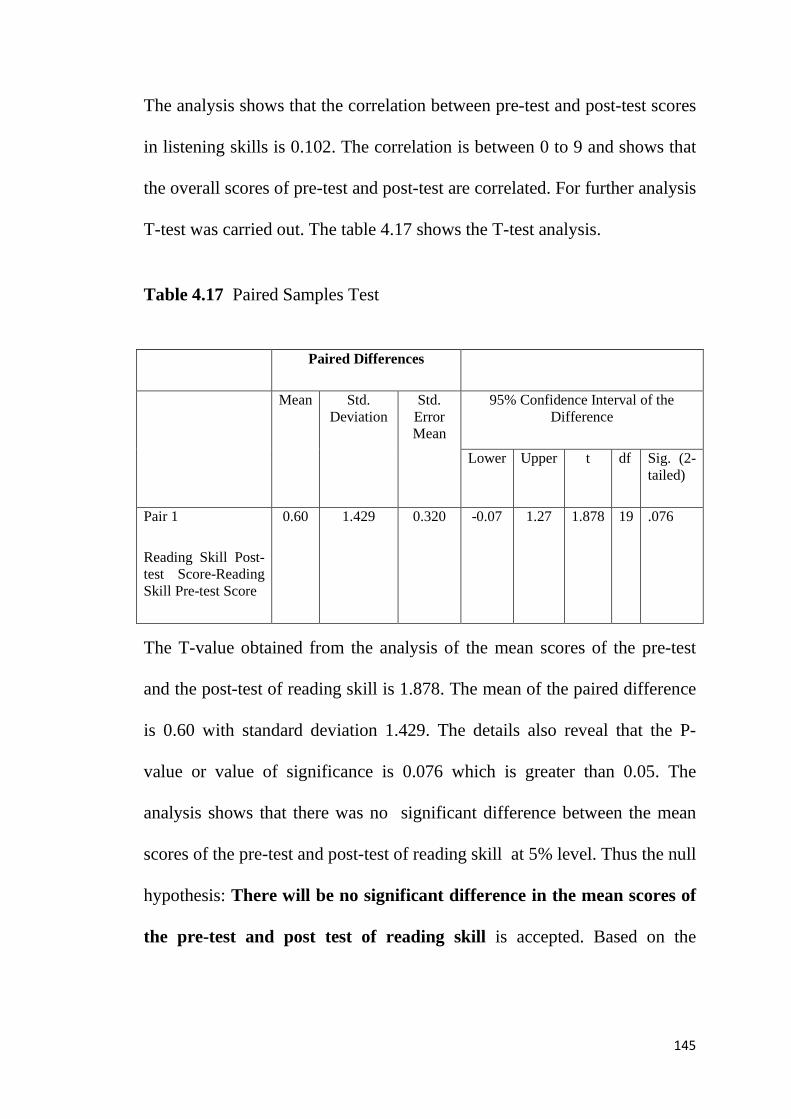
The analysis shows that the correlation between pre-test and post-test scores
in listening skills is 0.102. The correlation is between 0 to 9 and shows that
the overall scores of pre-test and post-test are correlated. For further analysis
T-test was carried out. The table 4.17 shows the T-test analysis.
Table 4.17 Paired Samples Test
Paired Differences
Mean Std. Deviation
Std. Error Mean
95% Confidence Interval of the Difference
Lower Upper t df Sig. (2-tailed)
Pair 1
Reading Skill Post-test Score-Reading Skill Pre-test Score
0.60 1.429 0.320 -0.07 1.27
1.878 19 .076
The T-value obtained from the analysis of the mean scores of the pre-test
and the post-test of reading skill is 1.878. The mean of the paired difference
is 0.60 with standard deviation 1.429. The details also reveal that the P-
value or value of significance is 0.076 which is greater than 0.05. The
analysis shows that there was no significant difference between the mean
scores of the pre-test and post-test of reading skill at 5% level. Thus the null
hypothesis: There will be no significant difference in the mean scores of
the pre-test and post test of reading skill is accepted. Based on the
146
analysis, it can be concluded that the materials have been more effective in
developing listening skills in comparison to reading skills.
c. Speaking
One of the objectives of the study was to investigate the effect of the
materials on speaking skills. A qualitative analysis was carried out to assess
the difference in the pre-test and post-test performance in speaking skills. A
set of criteria to assess speaking skills was used to assess the performance in
speaking. The table 4.18 gives description of the participants’ performance
in the pre-test and post-test of speaking.
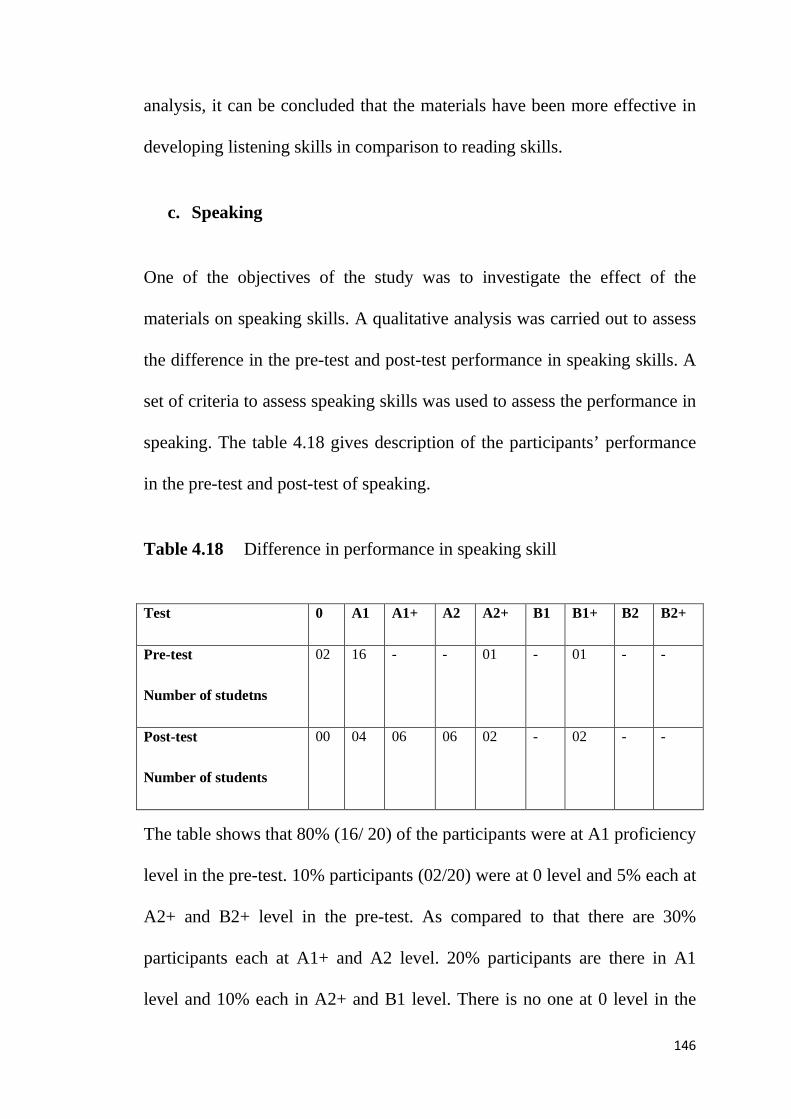
Table 4.18 Difference in performance in speaking skill
Test 0 A1 A1+ A2 A2+ B1 B1+ B2 B2+
Pre-test
Number of studetns
02 16 - - 01 - 01 - -
Post-test
Number of students
00 04 06 06 02 - 02 - -
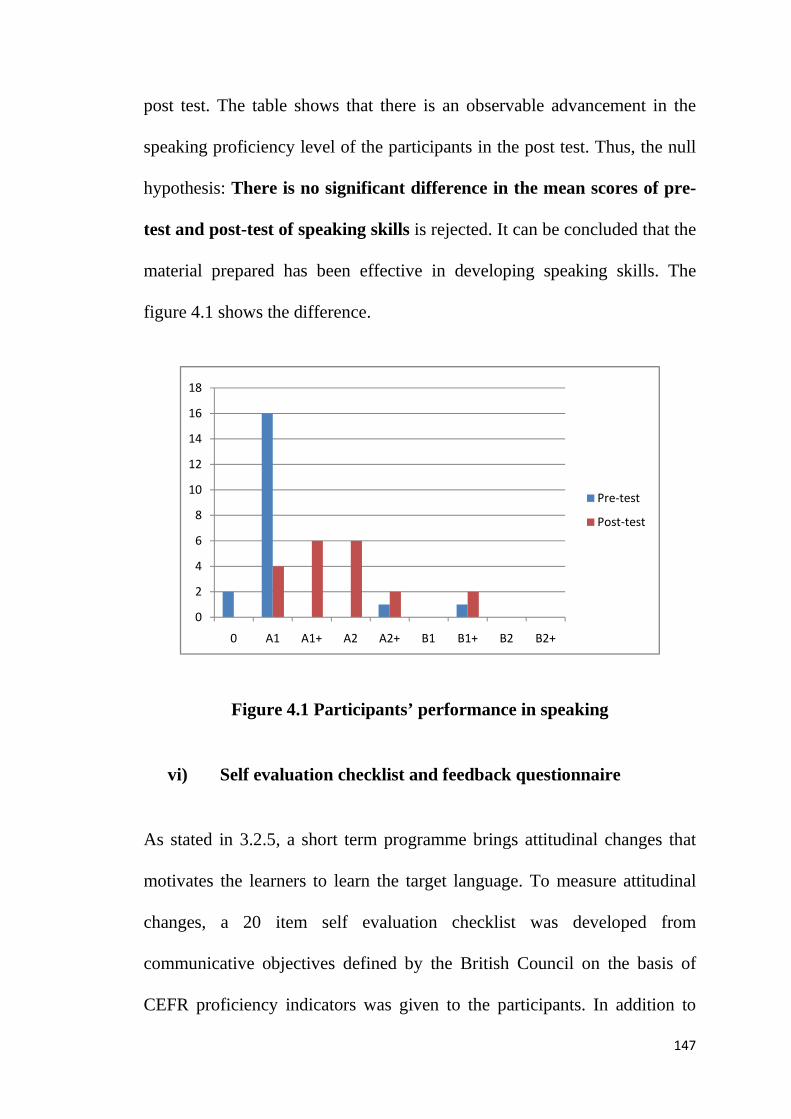
The table shows that 80% (16/ 20) of the participants were at A1 proficiency
level in the pre-test. 10% participants (02/20) were at 0 level and 5% each at
A2+ and B2+ level in the pre-test. As compared to that there are 30%
participants each at A1+ and A2 level. 20% participants are there in A1
level and 10% each in A2+ and B1 level. There is no one at 0 level in the
147
post test. The table shows that there is an observable advancement in the
speaking proficiency level of the participants in the post test. Thus, the null
hypothesis: There is no significant difference in the mean scores of pre-
test and post-test of speaking skills is rejected. It can be concluded that the
material prepared has been effective in developing speaking skills. The
figure 4.1 shows the difference.
Figure 4.1 Participants’ performance in speaking
vi) Self evaluation checklist and feedback questionnaire
As stated in 3.2.5, a short term programme brings attitudinal changes that
motivates the learners to learn the target language. To measure attitudinal
changes, a 20 item self evaluation checklist was developed from
communicative objectives defined by the British Council on the basis of
CEFR proficiency indicators was given to the participants. In addition to
0
2
4
6
8
10
12
14
16
18
0 A1 A1+ A2 A2+ B1 B1+ B2 B2+
Pre-test
Post-test
this, to evaluate the effectiveness of the multimedia materials’ package, a
programme evaluation technique was adopted in the form of a questionnaire.
a. Descriptive analysis of the self evaluation checklist
All 20 participants responde
The participants responded to a three point scale to the checklist at the
beginning and at the end of the programme. The participants responded to a
three point scale: Always, Sometimes and Not sure on a list
statements.
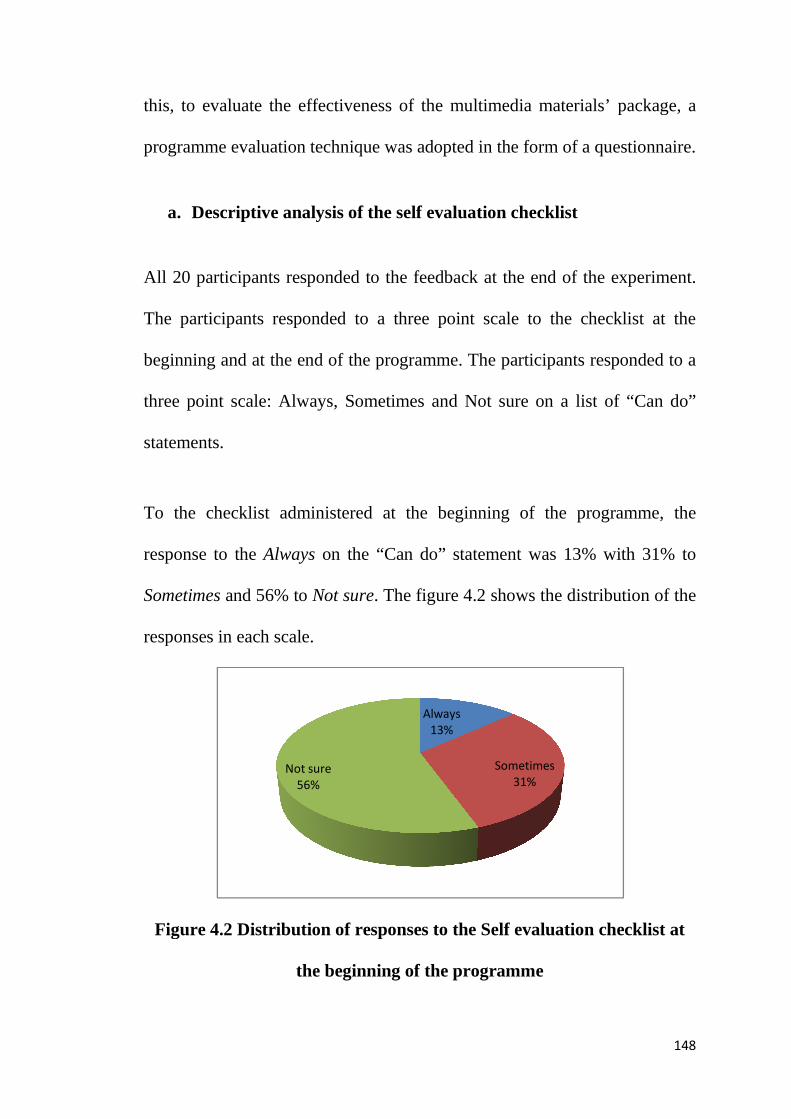
To the checklist administered at the beginning of the programme, the
response to the Always
Sometimes and 56% to
responses in each scale.
Figure 4.2 Distribution of responses to the Self evaluation checklist at
Not sure
this, to evaluate the effectiveness of the multimedia materials’ package, a
programme evaluation technique was adopted in the form of a questionnaire.
Descriptive analysis of the self evaluation checklist
All 20 participants responded to the feedback at the end of the experiment.
The participants responded to a three point scale to the checklist at the
beginning and at the end of the programme. The participants responded to a
three point scale: Always, Sometimes and Not sure on a list
To the checklist administered at the beginning of the programme, the
Always on the “Can do” statement was 13% with 31% to
and 56% to Not sure. The figure 4.2 shows the distribution of the
responses in each scale.
Figure 4.2 Distribution of responses to the Self evaluation checklist at
the beginning of the programme
Always
13%
Sometimes
31%Not sure
56%
148
this, to evaluate the effectiveness of the multimedia materials’ package, a
programme evaluation technique was adopted in the form of a questionnaire.
Descriptive analysis of the self evaluation checklist
d to the feedback at the end of the experiment.
The participants responded to a three point scale to the checklist at the
beginning and at the end of the programme. The participants responded to a
three point scale: Always, Sometimes and Not sure on a list of “Can do”
To the checklist administered at the beginning of the programme, the
on the “Can do” statement was 13% with 31% to
shows the distribution of the
Figure 4.2 Distribution of responses to the Self evaluation checklist at
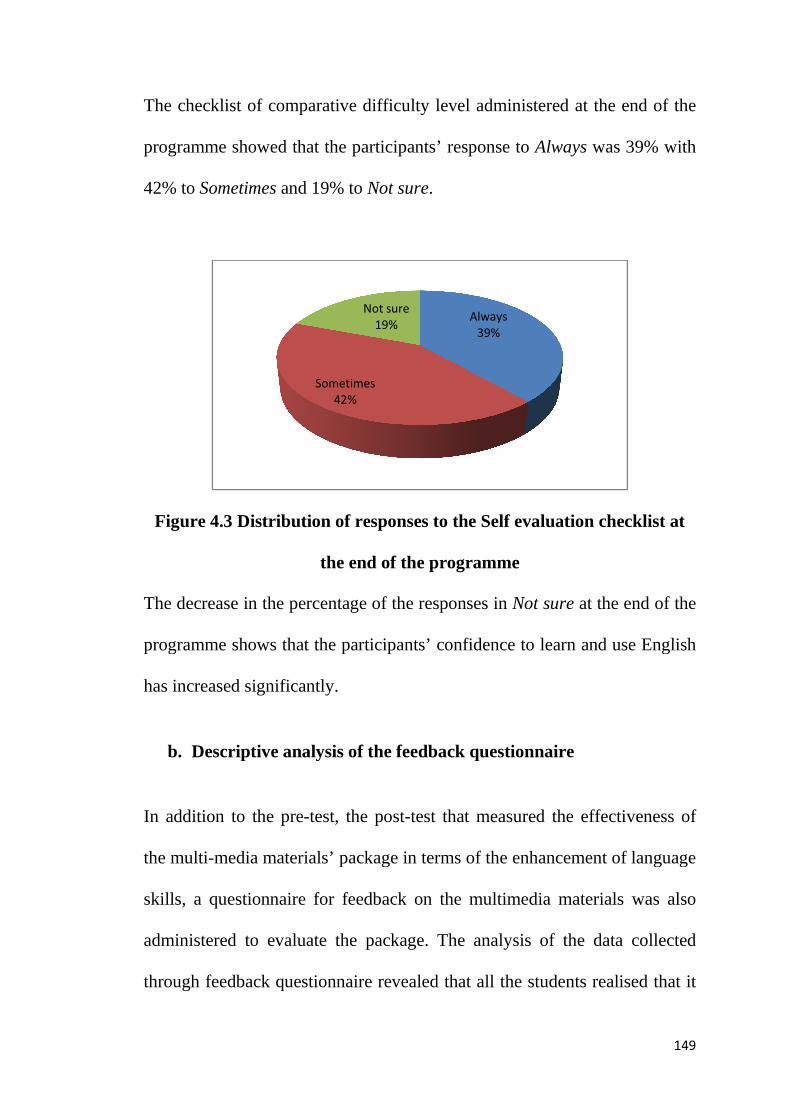
The checklist of comparative difficulty level administered at the end of the
programme showed
42% to Sometimes and 19% to
Figure 4.3 Distribution of responses to the Self evaluation checklist at
The decrease in the percentage of the responses in
programme shows that the participants’ confidence to learn and use English
has increased significantly.
b. Descriptive analysis of the feedback questionnaire
In addition to the pre
the multi-media materials’ package in terms of the enhancement of language
skills, a questionnaire for feedback on the multimedia materials was also
administered to evaluate the package. The analysis of the data collected
through feedback questionnaire revea
The checklist of comparative difficulty level administered at the end of the
programme showed that the participants’ response to Always
and 19% to Not sure.
istribution of responses to the Self evaluation checklist at
the end of the programme
The decrease in the percentage of the responses in Not sure
programme shows that the participants’ confidence to learn and use English
has increased significantly.
Descriptive analysis of the feedback questionnaire
In addition to the pre-test, the post-test that measured the effectiveness of
media materials’ package in terms of the enhancement of language
skills, a questionnaire for feedback on the multimedia materials was also
administered to evaluate the package. The analysis of the data collected
through feedback questionnaire revealed that all the students realised that it
Always
39%
Sometimes
42%
Not sure
19%
149
The checklist of comparative difficulty level administered at the end of the
Always was 39% with
istribution of responses to the Self evaluation checklist at
Not sure at the end of the
programme shows that the participants’ confidence to learn and use English
Descriptive analysis of the feedback questionnaire
test that measured the effectiveness of
media materials’ package in terms of the enhancement of language
skills, a questionnaire for feedback on the multimedia materials was also
administered to evaluate the package. The analysis of the data collected
led that all the students realised that it
150
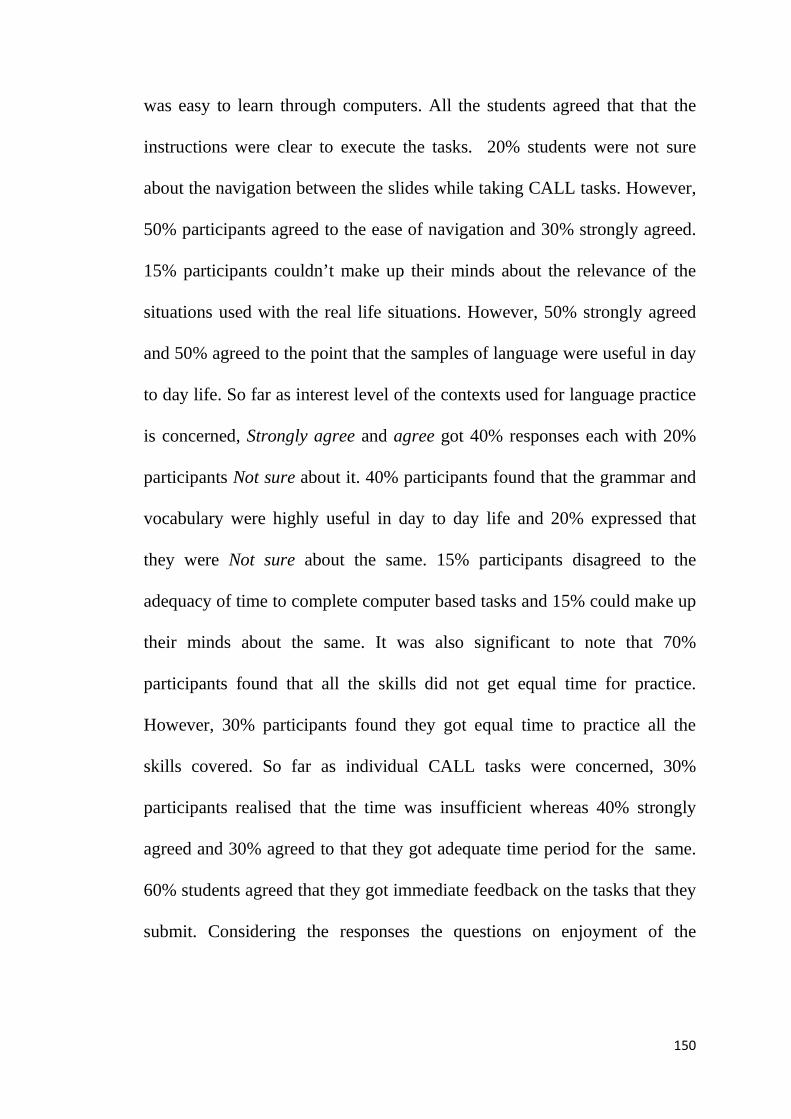
was easy to learn through computers. All the students agreed that that the
instructions were clear to execute the tasks. 20% students were not sure
about the navigation between the slides while taking CALL tasks. However,
50% participants agreed to the ease of navigation and 30% strongly agreed.
15% participants couldn’t make up their minds about the relevance of the
situations used with the real life situations. However, 50% strongly agreed
and 50% agreed to the point that the samples of language were useful in day
to day life. So far as interest level of the contexts used for language practice
is concerned, Strongly agree and agree got 40% responses each with 20%
participants Not sure about it. 40% participants found that the grammar and
vocabulary were highly useful in day to day life and 20% expressed that
they were Not sure about the same. 15% participants disagreed to the
adequacy of time to complete computer based tasks and 15% could make up
their minds about the same. It was also significant to note that 70%
participants found that all the skills did not get equal time for practice.
However, 30% participants found they got equal time to practice all the
skills covered. So far as individual CALL tasks were concerned, 30%
participants realised that the time was insufficient whereas 40% strongly
agreed and 30% agreed to that they got adequate time period for the same.
60% students agreed that they got immediate feedback on the tasks that they
submit. Considering the responses the questions on enjoyment of the
151
programme, 100% participants agreed to it. The table 4.19 shows the
detailed analysis of the feedback on the programme.
Table 4.19 Distribution of the responses to the questionnaire
No. Item Strongly agree
Agree Not sure
Disagree Strongly
Disagree
1 It was easy to use computers for learning English.
35% 65% 0 0 0
2 The instructions provided in the units were easy to follow.
60% 40% 0 0 0
3 It was easy to take computer based tasks.
35% 65% 0 0 0
4 The instructions for navigation were clear.
30% 50% 20% 0 0
5 The situations/contexts were real life like.
25% 60% 15% 0 0
6 The samples of language were useful in day to day life.
50% 50% 0 0 0
7 The grammar and vocabulary were useful in day to day life.
40% 40% 20% 0 0
8 The situations/contexts for language practice were interesting.
40% 40% 20% 0 0
9 The time given for computer based task was adequate.
40% 30% 15% 15% 0
10 I got equal time to practice listening, speaking and reading.
0 30% 0 70% 0
152
4.3 Conclusion
This chapter has outlined the methodological approach and procedures
including the research design best suited to address the research hypotheses.
The first section of the chapter included a restatement of the research
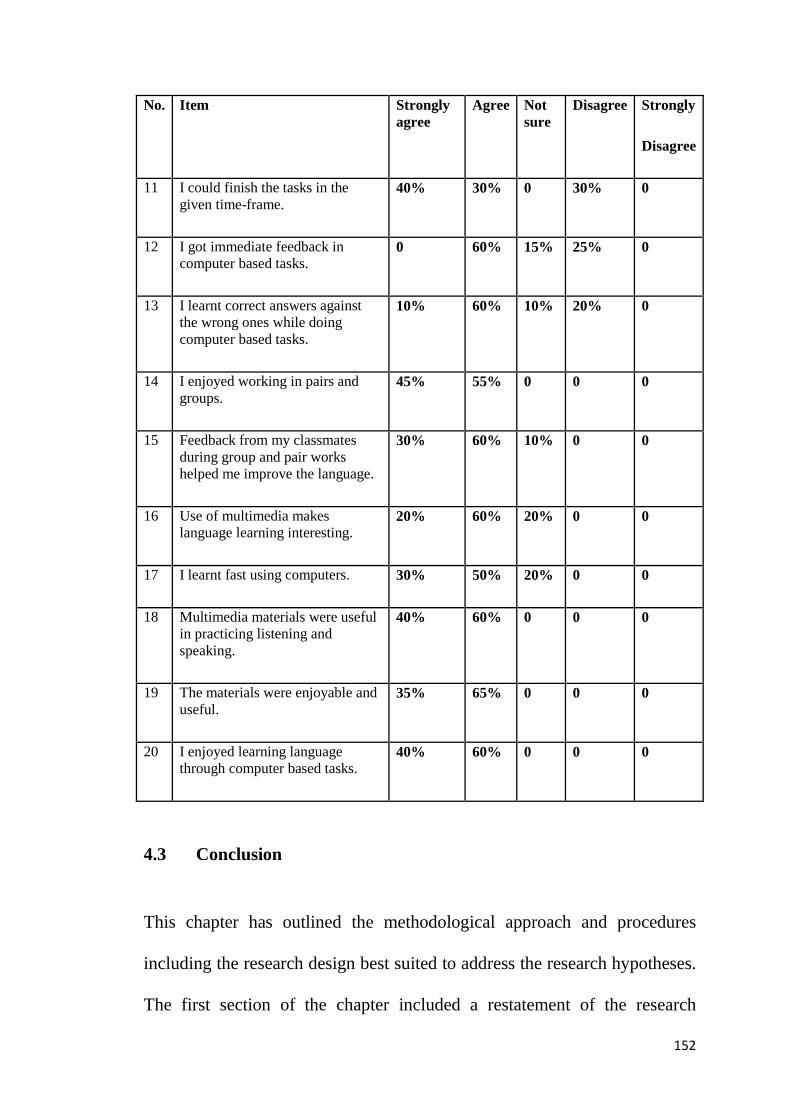
No. Item Strongly agree
Agree Not sure
Disagree Strongly
Disagree
11 I could finish the tasks in the given time-frame.
40% 30% 0 30% 0
12 I got immediate feedback in computer based tasks.
0 60% 15% 25% 0
13 I learnt correct answers against the wrong ones while doing computer based tasks.
10% 60% 10% 20% 0
14 I enjoyed working in pairs and groups.
45% 55% 0 0 0
15 Feedback from my classmates during group and pair works helped me improve the language.
30% 60% 10% 0 0
16 Use of multimedia makes language learning interesting.
20% 60% 20% 0 0
17 I learnt fast using computers. 30% 50% 20% 0 0
18 Multimedia materials were useful in practicing listening and speaking.
40% 60% 0 0 0
19 The materials were enjoyable and useful.
35% 65% 0 0 0
20 I enjoyed learning language through computer based tasks.
40% 60% 0 0 0
153
hypotheses. The subsequent section analysed the data collected through the
pre-test and the post-test with the interpretations. The pre-test and the post-
test analyses has been followed by the descriptive analysis and interpretation
of the self evaluation checklist and the feedback questionnaire for the
evaluation of the multimedia materials.
Related Documents