Chapter III GRAIN-SIZn; ANALYSIS OF SANDSTONES INTRODUCTION This chapter deals with grain-size characteristics of the terrigenous clastic sediments of the Jaisalmer Formation, The grain-size study was undertaken with a view to interjsretinq the depositional processes and environments in the Jaisalmer Basin. The genetic interpretation of grain-size characteristics of a sediment has proved to be a challenging task over the years. The extended efforts to study this aspect by a large number of workers have produced voluminous literature, Polk (1966), Visher (1969) and i''riedman (1979) published excellent reviews of grain-size parameters and their relationship with depositional processes. in general grain-size studies have followed two main genetic approaches : (i) relating the grain-size to sediment dynamics and depositional processes; (ii) relating it to specific sedimentary environments on the basis of empirical study of sediments from various modern geomorphic environments. Some workers have also emphasised the role of source materials and sediment generative processes in the generation of grain-size distribution.

Welcome message from author
This document is posted to help you gain knowledge. Please leave a comment to let me know what you think about it! Share it to your friends and learn new things together.
Transcript

Chapter III
GRAIN-SIZn; ANALYSIS OF SANDSTONES
INTRODUCTION
This chapter deals with grain-size characteristics of
the terrigenous clastic sediments of the Jaisalmer Formation,
The grain-size study was undertaken with a view to interjsretinq
the depositional processes and environments in the Jaisalmer
Basin.
The genetic interpretation of grain-size characteristics
of a sediment has proved to be a challenging task over the
years. The extended efforts to study this aspect by a large
number of workers have produced voluminous literature, Polk
(1966), Visher (1969) and i''riedman (1979) published excellent
reviews of grain-size parameters and their relationship
with depositional processes.
in general grain-size studies have followed two main
genetic approaches : (i) relating the grain-size to sediment
dynamics and depositional processes; (ii) relating it to
specific sedimentary environments on the basis of empirical
study of sediments from various modern geomorphic environments.
Some workers have also emphasised the role of source
materials and sediment generative processes in the generation
of grain-size distribution.

92
Many gra in-s ize d i s t r i b u t i o n s are mixtures of two or
more sub-populations which are products of d i f fe ren t modes
of sedimentary t ranspor t (Doeglas^ 1946; Harr is 1958;
Moss, 1962, 1963, 1972; Visher, 1969). Opinions d i f fe r on
the nature of sub-population - tha t i s , whether they are
log-normal truncated (Sindowski, 1957; Visher, 1969) or
log-normal overlapping (Tanner, 1964; Pu l l e r , 1961; Walger,
1965; Spencer, 1963; Middleton and Southard, 1977).
V i she r ' s (1969) outstanding work on gra in-s ize d i s t r i b u
t ion in r e l a t i o n to deposi t ional processes was based on
extensive t ex tu ra l study o± both modern and ancient sands and
i t provided the bas is for a genetic i n t e rp re t a t ion of
g r a in - s i ze , Visher ' s work was extended and developed by h i s
coworkers (Visher and Howard, 1974; Freeman and Visher,
1975; Sagoe and Visher, 1977). Visher and h i s coworkers
concluded tha t each log-normal g ra in-s ize d i s t r i bu t i on curve
comprised a number of s t r a i g h t - l i n e segments of d i f fe ren t
slope separated by sharp ' b r e a k s ' . The s t r a i g h t - l i n e
segments represented truncated log-normal sub-populations
generated by d i f ferent modes of sediment t ranspor t and
deposi t ion. The number, amount, s ize-range, mixing, and
sor t ing of these sub-populations varied systematical ly
in r e l a t ion to provenance, sedimentary processes , and
sedimentary dynamics. The nature of the s t r a i g h t - l i n e
segments and 'breaks ' were accordingly r e l a t ed to the
importance of the various t ranspor t mechanisms operating

93
during deposition, presumed distinctive in different
depositional environments. Several workers used Visher's
approach in the recognition of ancient depositional
environment (Holmes and Oliver, 1973; Glaister and Nelson,
1974; Amaraland Pryor, 1977, Moshrif, 1980).
Many workers attempted direct interpretation of
depositional environments on the basis of statistical measures
of grain-size, such as mean, standard deviation, skewness
and kurtosis (folk and Ward, 1957; Mason and i'olk, 1958;
Harris, 1959, Friedman, 1961, 1962, 1967; Sahu, 1964;
Moiola and Weiser, 1968; Duane, 1964; Solohub and Klovan,
1970; Buller and Mc Manus, 1972; Reed_et_al,, 1975;
Staper and Tanner, 1975; Valia and Cameron, 1977). Most
of these studies used scatter diagrams involving two variables
to distinguish the various environments but some workers
employed, more sophisticated techniques of discriminant
analysis involving more than two variables at a time.
A useful method of biv'ariate analysis, CM plots, was
introduced by Passega (1957) for distinguishing the various
depositional processes.
The approach ot directly interpreting the agent and/or
environment of deposition on the basis of grain-size
distribution is not wholly valid. It is doubtful that
a particular environment is characterized by a completely
unique pattern of grain-size distribution because similar
sediment transport and depositional mechanisms may operate
in different environments ( R e e d ^ al,, 1975; Ruzyla, 1977;

94
Steidtmann, 1977; Jackson, 1978; Sedimentation Seminar, 1981).
Moreover/ grain-size distribution is also affected by provenance
and sediment generative processes as well as by diagenetic
modifications. Despite these ambiguities, most sedimentologists
agree that grain-size distribution does reflect the depositional
processes and enables reconstruction of ancient depositional
environments provided this property is studied in combination
with other sedimentary properties.
MtiTHUDS OF STUDY AND DATA PRESENTATION
A total of 4 5 sandstone samples of the Jaisalmer Formation
were employed for grain-size analysiSo 39 samples from the
Fort Member were selected in such a way as to bring about
a uniform coverage, Ijoth horizontally and vertically, of the
outcrops of the Fort Member. In addition to these samples,
4 samples from the Hamira Men±)er and 2 samples from the Joyan
Member were also studied.
The seiving technique was employed for grain-size analysis
because the sandstones are soft, friable and capable of complete
disaggregation. The samples were carefully disaggregated in a
morta,r by a rubber padded pestle, and 50 to 200 gms weight
of each sample was taken for sieving. Sahu (1964) suggested
40 gms as the optimum weight of a sample for sieving. Sieving
of weighed samples was carried out following the standard
method of sieve analysis with the help of ASTM sieves and
automatic sieve shaker. Sieves were arranged at quarter
interval and eighteen sieves, ranging from mesh nos, 16 to 230
(size from - 0.25 to 4.0 <li or 1.19 mm to 0.0625 mm) were used.

95
Each fraction of the samples obtained on the sieves was weighed
to the 2nd place of decimal by chemical balance, and its weight
percentage was calculated (Appendix I). Arithmetic probability
graph paper was employed for constructing log-probability
curves of the grain-size data. The log-probability plots
were preferred to cumulative frequency curves as the former
allow for easy comparisons and measurements and are also
believed to be meaningful with regard to depositional
processes.
Grain-size analysis in the present study was based on
approaches described by Visher (1969), Folk and Ward (1957),
Passega (1957, 1964) and Stewart (1958).
Visher's (1969) method was employed to recognise the
various sub-populations (surface creep, saltation, suspension)
represented by straight-line segments on the log-probability
curve of a grain-size distribution. Percentages of each
sub-population were determined from the curve. Sorting of
each sub-population was evaluated on the basis of slope
of the straight-line segment representing the sub-population.
The following arbitrary angular limits of steepness of the
curve suggested by Visher (1969) were adopted here with some
modifications as a measure of sorting
' < 50* Poorly sorted / Poor sorting
SO^-eO" Moderately sorted / Fair sorting
60°-70* Moderately well sorted / Good sorting
> 70° Well sorted / Excellent sorting

96
Truncation poin ts a t the coarser and f ine r ends of each sub-population
segment were determined. All the above determined c h a r a c t e r i s t i c s of
gra in-s ize d i s t r i bu t i on are summarised in Table 2.
TABLE 2. Charac te r i s t i c s of Type I , Type I I , Type I I I and Type IV gra in - s ize curves of sandstones, Jaisalmer Formation.
T = Coarse t runcat ion point of t r a c t i o n ; T„ = Coarse t runcat ion point of s a l t a t i o n ; T^ = Pine t runcat ion poin t of s a l t a t i o n .
Traction Sa l t a t ion Suspension
Dominant Subordinate S ample
No. r'er- Angle Per- Angle Per Angle Per- Angle cent (deg- cent (deg- cent (deg- cent (deg
ree) ree) ree) ree)
T.
Type
6 8 9 10 76
127 131 191 200 222 233 257 268 330 331 334
I Curves
0,03 0.10 1.20 0.10 0.05 0.50 0.60 0.10 5.00 0.70 0.30 0.05 0.07 6.00 0.20 0.50
22 28 33 61 16 70 42 35 38 45 40 9 39 58 28 55
63.97 74.00 58.80 85.85 56.00 12.50 79.40 79.90 76.00 75.30 54.00 87.00 67.93 59.00 67.00 83.50
64 56 61 63 57 62 67 72 73 63 64 64 63 75 78 79
31.50 9.90 31.00 0.05 34.95 3.50
15.50 17.50 16.00 21.00 37.70 7.95
30.20 28.00 17.80 6.00
48 51 52 7
70 33 42 49 49 48 75 43 54 48 55 42
4.50 16.00 9.00 14.00 9.00 3.50 4.50 2.50 3.00 3o00 8.00 5.00 1.80 7.00 15o00 10.00
29 24 18 19 30 13 16 17 17 20 15 26 12 27 36 22
0.50 0.00 0.25 0.25 0.50 0.25 0.00 0.75 0.25 0.00 1.25 0.00 0.25 0.75 0.50 1.00
1.00 0.75 1.00 0.50 1.55 0.05 1.00 1.45 1.70 0.85 1.85 0.75 0.55 1.75 1.50 1.60
3.25 3.00 2.65 2.60 3.20 2.05 2.80 3.10 2.95 2.80 3.00 3.40 2.80 2.85 2.80 2.90
Type II Curves
3 5 7 71 72 73 79 124 130 139
2.00 0.40 0.10 0.10 0.10 0.40 0.20 0.07 0.05 0.05
41 28 32 18 15 29 35 16 41 20
76o00 94c00 95.40 93.40 94.40 92.10 85.80 90.03 97.25 96.45
68 61 55 65 58 62 60 67 56 65
2 2.00 5.50 4.50 6.50 5.50 7.50
14.00 9.00 2.25 3.50
24 23 26 20 20 36 29 25 18 27
0.60 0.00 0.25 0.00 0.00 0.50 0.50 0.50 0.00 0.50
2.00 1.25 1.05 1.25 1.25 1.50 1.25 1.85 0.75 1.40
2.85 2.95 3.50 2.75 3.40 3.10 2.90 3.25 3.05 3.15

97 TABLE 2 . ( C o n t d . )
Sample No.
Type
189 220 269 289 294 311 313
Type
11 192 196 230 239 290 357
Type
193 197 226 328 352
Traction
Per- Angle cent (deg
ree)
II Curves (Ci
3.00 35 0.30 22 0.15 41 0.06 18 0.20 29 6.00 36 1.40 39
III Curves
_ _
- -- -- -• - -_ _ - —
IV Curves
5.00 50 - -
2.50 44 3.00 32 1.80 33
Saltation
Dominant
Percent
ontd)
57.00 94.70 87.85 90.94 88.80 91.50 93.00
76.00 82.00 95.00 80.00 91.00 95.00 70.00
45.00 2.00 19.50 11.00 6.20
Angle (degree)
79 66 71 67 67 65 64
55 50 67 62 61 67 56
62 67 32 68 69
Subordinate
Percent
—
-----—
^
-----—
_
---
Angle (degree)
— -----—
_
-----—
—
---
Suspension
Percent
40.00 5.00
12.00 9.00 11.00 2.50 7.00
24.00 18.00 5.00
20.00 9.00 5.00
30.00
50.00 98.00 78.00 86.00 92.00
Angle (degree)
47 28 19 23 30 13 16
30 40 24 36 26 14 31
40 55 57 53 53
^1
1.25 0.50 1.25 0.50 1.25 0.00 0.25
_
-— ---—
1.25 -
0.00 1.00 1.00
^2
3.00 1.45 1.75 1.20 2.40 1.70 1.50
0.25 0.25 1.25 1.75 1.25 1.25 1.00
1.70 1.75 1.50 2.50 2.50
^3
3.30 2.95 2.80 2.70 3.70 2.90 2.85
2.60 3.15 2.70 3.10 3.20 2.70 3.05
2.80 2.25 2.90 2.75 2.70

98
The second approach to study grain-size distribution
employed the parameters described by Folk and Ward (1957) .
The grain diameter in phi units represented by $ 5, 516,
425, $50, 575, 584 and 595 percentiles were computed
(Appendix II). The following statistical graphic parameters
were calculated (Table 3) .
Graphic Mean (M ) z
516 + 550 + 584
Inclusive Graphic 584 -516 595 -55 standard Deviation (CT-r) = +
6.6
Inclusive Graphic 516 + 584 - 2550 55 +595 - 2550 Skewness (SK^) = +
Graphic Kurtosis (K )
2(584-516) 2(595-55)
595 - 55
2.44(575 - 525)
The third approach to studying grain-size distribution
employed the methods of bivariate analysis described by
Passega (1957, 1964) and Stewart (1958). Following Passega,
values of C ( one percentile ) and M (median grain-size
at 50 percentile ) in microns were computed from log-probability
curves for all the samples ( Appendix III ) , and the bivariate
plot or CM diagram was constructed by plotting all the sample
points on a logarithmic graph paper taking M on abscissa and
C on ordinate. Passega (1964) considered 20 to 30 sanples as
optimum number. Values were determined on 5 scale and then

99
TABLE 3 . S t a t i s t i c a l parameters of g r a i n - s i z e d i s t r i b u t i o n of sands tones , J a i s a l m e r Formation
M = Graphic Mean; cr = I n c l u s i v e Graphic S tandard
D e v i a t i o n ; SK = I n c l u s i v e Graphic Skewness; K_ = Graphic
K u r t o s i s .
Sam- M ° I Verbal SK Verbal K Verbal pie ^ limits of limits of limits of No. ( ) i^) sorting skewness kurtosis
3 2.75 0.51 Moderately +0.40 Strongly 1.20 Leptokurtic well sorted fine-skewed
5 2.30 0.43 Well sorted +0.08 Near-symme- 1.15 Leptokurtic trical
6 2.28 0.45 Well s o r t e d +0.32 S t r o n g l y 1.15 L e p t o k u r t i c f ine-skewed
7 2.63 0o57 Moderately +0.02 Near-symme- 0.89 Platykurtic well sorted trical
8 2.57 0o66 Moderately +0.22 Fine-skewed 1.07 Mesokurt ic wel l s o r t e d
9 1.90 0.54 Moderately +0.28 Fine-skewed 1.32 Leptokurtic well sorted
10 2.17 0.55 Moderately +0.24 Fine-skewed 1.84 Very l e p t o -well sorted kurtic
11 2.35 0,74 Moderately +0.20 Fine-skewed 1.39 Leptokurtic sorted
71 2.23 0.40 Well sorted +0.24 Fine-skewed 1.54 Very leptokurtic
72 2.70 0,52 Moderately +0.07 Near-symme- 0.90 Platykurtic well sorted trical
73 2.65 0o45 Well sorted +0.12 Fine-skewed 0.77 Platykurtic 76 2,63 0.47 Well sorted +0.31 Strongly 0,91 Mesokurtic
fine-skewed 79 2.50 0.57 Moderately +0.30 Fine-skewed 1.45 Leptokurtic
well sorted 124 2.85 0.36 Well sorted +0.05 Near-symme- 1.46 Leptokurtic
trical 127 1.50 0.31 Very well +0.02 Near-symme- 1.08 Mesokurtic
sorted trical 130 1.98 0.53 Moderately +0.17 Fine-r skewed 1.17 Leptokurtic
well sorted 131 1.83 0.43 Well sorted +0.28 Fine-skewed 1.55 Very
leptokurtic 139 2.62 0.41 Well sorted +0.15 Fine-skewed 0.70 Platykurtic 189 3.40 0.36 Well sorted +0.61 Strongly 1.18 Leptokurtic
fine-skewed 191 2.22 0.33 Very well +0.24 Fine-skewed 1.52 Very
sorted leptokurtic 192 2.58 0.67 Moderately +0.00 Symmetrical 1.39 Leptokurtic
well sorted 193 3.05 0.70 Moderately -0.14 Coarse- 1.16 Leptokurtic
well sorted skewed

TABLE 3. (Contd.) 100
Samp l e Nos ,
196 197
200
220
222 226
230
233
239 257
268 269
289 290 294 311
313
328 330
331
334
352
357
M z w
2.22 3 .62
2 . 4 7
2 .47
1.80 3 .25
2 .88
2 .60
2 .67 2 .88
1.78 2 . 5 7
2 . 3 3 2 . 1 3 3 .31 2 .22
2 . 2 8
3 .33 2 . 4 8
2 . 6 3
2 . 7 1
3 . 5 0
2 .92
Ci
W
0 . 3 8 0 . 4 6
0 . 3 3
0 .47
0 .46 0 .60
0 .49
0 . 4 1
0 .49 0 .42
0o41 0 . 4 3
0 .40 0 .39 0 .37 0 . 4 0
0 .42
0 .50 0 .39
0 .29
0 . 2 5
0 .52
0 . 6 7
V e r b a l l i m i t s of s o :
Well Well
Very
r t i n g
s o r t e d s o r t e d
w e l l s o r t e d Well
Well
s o r t e d
s o r t e d M o d e r a t e l y w e l l
Well
Well
Wel l Well
Well Well
Well Well Well Well
Well
Wel l Well
Very
s o r t e d
s o r t e d
s o r t e d
s o r t e d s o r t e d
s o r t e d s o r t e d
s o r t e d s o r t e d s o r t e d s o r t e d
s o r t e d
s o r t e d s o r t e d
w e l l s o r t e d Very w e l l s o r t e d M o d e r a t e l y w e l l s o r t e d M o d e r a t e l y w e l l s o r t e d
SK^
+ 0 . 2 0 - 0 . 2 4
- 0 . 2 5
+ 0 .36
+0 .22 - 0 . 3 1
- 0 . 2 2
+0 .40
+ 0 . 1 1 - 0 . 3 1
+0 .17 +0 .40
+0 .20 +0 .23 +0 .15 +0 .09
+ 0.08
+0 .17 - 0 . 3 0
+0 .08
+ 0 .29
- 0 . 0 3
+0 .36
V e r b a l l i m i t s of skewness
F i n e skewed Co arse-T skewed C o a r s e -skewed S t r o n g l y f i n e skewed F i n e - s k e w e d S t r o n g l y c o a r s e -skewed C o a r s e -skewed S t r o n g l y f i n e - s k e w e d F i n e - s k e w e d S t r o n g l y c o a r s e -skewed F i n e - s k e w e d S t r o n g l y f i n e - s k e w e d F i n e - s k e w e d F i n e - s k e w e d F i n e - s k e w e d Near-symmet r i c a l Near-symmet r i c a l F i n e - s k e w e d C o a r s e -skewed Near-symmet r i c a l F i n e - s k e w e d
Near-symmet r i c a l S t r o n g l y f i n e - s k e w e d
^G
1.49 0 . 7 9
1.64
1.27
1.35 1.60
1.17
1.43
0 . 9 3 1.06
1.04 1.80
1.37 1.32 1.46 1.41
1.15
1.00 1.44
2 .50
2 . 5 6
0 .86
1.19
V e r b a l l i m i t s of k u r t o s i s
L e p t o k u r t i c P l a t y k u r t i c
Very l e p t o k u r t i c L e p t o k u r t i c
L e p t o k u r t i c Very l e p t o k u r t i c
L e p t o k u r t i c
L e p t o k u r t i c
M e s o k u r t i c M e s o k u r t i c
M e s o k u r t i c Very l e p t o k u r t i c L e p t o k u r t i c L e p t o k u r t i c L e p t o k u r t i c L e p t o k u r t i c
L e p t o k u r t i c
M e s o k u r t i c L e p t o k u r t i c
Very l e p t o k u r t i c Very l e p t o k u r t i c P l a t y k u r t i c
L e p t o k u r t i c
converted to micron scale with the help of conversion graph given
by Folk (1968). The second bivariate plot was constructed
following Stewart's (1958) method by plotting Median diameter against

101
Inclusive Graphic Standard Deviation, All the sample points
were plotted on a simple graph paper taking phi Median diameter
on abscissa and phi Inclusive Graphic Standard Deviation on
ordinate.
LOG-PROBABILITY CURVES
The log-probab"ility curves of grain-size distribution
of the studied samples were analysed by Visher's (1969)
methodo The curves were broadly divided into four types
(Types I-IV) on the basis of number of populations and their
relative development in a single distribution. Figs. 14-16
show the various types of grain-size distribution curves of
the studied samples.
Type I Curves
16 out of 45 samples show Type I grain-size distribution
which comprises four populations (Fig. 14A,B,C,D), These
populations were identified as surface creep, suspension and
two saltation populations.
The surface creep population is very poorly developed
and constitutes commonly less than 1,0 percent but some
samples show relatively higher percentages (upto 6 percent).
The population is predominantly poorly sorted but in a few
samples it is moderately sorted to moderately well sorted.
The coarse truncation point of the population lies at
-0.25t5 to 1.255. However, in most distributions this point

89(1
-4 «9«
- i M M
-?»»«
Phi S c « l .
«««•
^(tiUHf U fvp* I >«• ^r«t>'b<*'lr ^'A*^ a'^* l*'* ^Ml' « (.u'*«« • A. a C t 0 ) 0f •«n(t*l*A««

102
lies between a narrow range of O.OS to 0,5 i5. The grain
size of the population ranges from a maximum of -0.25$ to
a minimum of 1.85S.
Two saltation populations are characteristically present
in Type X Curves. Of the two saltation populations one is
invariably well developed and dominant. The dominant saltation
population commonly lies adjacent to the suspension
population. However/ in some samples, the dominant saltation
population adjoins the surface creep population. The
percentages of dominant saltation population range from
54 to 92.5 percent. The dominant saltation population is
commonly moderately well sorted but its sorting ranges from
moderately sorted to well sorted. The percentages of
subordinate saltation population range from 0.05 to 37.7
percent. This population is commonly poorly sorted but
occasionally moderately sorted to well sorted. The truncation
point of saltation population and surface creep population
is quite variable and lies at 0.05 S to 1.85 S>. The break
between saltation population and suspension population occurs
at 2.05 4 to 3.40 4. The overall size range of saltation
population is from a maximum of 0,05 4 to a minimum of 3,40 $,
The percentage of suspension population commonly
ranges from 1,8 to 10 percent but few samples show higher
values upto 16 percent. The suspension population is poorly
sorted. The overall size range of suspension population is
from 2,O50to 4 S.
103
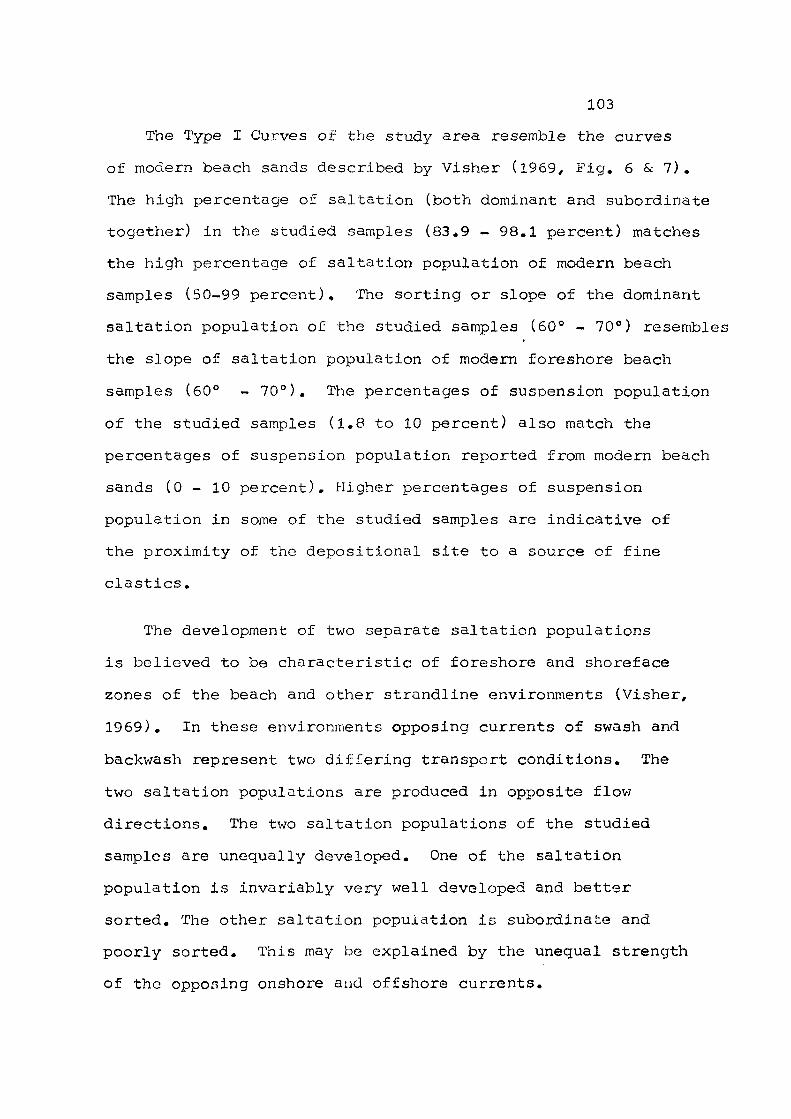
The Type I Curves of the study area resemble the curves
of modern beach sands described by Visher (1969/ Fig. 6 & 7).
The high percentage of saltation (both dominant and subordinate
together) in the studied samples (83«9 - 98.1 percent) matches
the high percentage of saltation population of modern beach
samples (50-99 percent). The sorting or slope of the dominant
saltation population of the studied samples (60° - 70°) resemble:
the slope of saltation population of modern foreshore beach
samples (60° - 70°). The percentages of suspension population
of the studied samples (1.8 to 10 percent) also match the
percentages of suspension population reported from modem beach
sands (0 - 10 percent). Higher percentages of suspension
population in some of the studied samples are indicative of
the proximity of the depositional site to a source of fine
elastics.
The development of two separate saltation populations
is believed to be characteristic of foreshore and shoreface
zones of the beach and other strandline environments (Visher,
1969), In these environments opposing currents of swash and
backwash represent two differing transport conditions. The
two saltation populations are produced in opposite flow
directions. The two saltation populations of the studied
samples are unequally developed. One of the saltation
population is invariably very well developed and better
sorted. The other saltation population is subordinate and
poorly sorted. This may be explained by the unequal strength
of the opposing onshore and offshore currents.

104
Type II Curves
The Type II distribution comprises three populations
surface creep, saltation, and suspension. 17 samples show
Type II distribution (Fig. 15A,B,C,D).
The surface creep population is generally very poorly
developed constituting less than 1,0 percent in majority
of samples. The percentage of the population in some samples
is relatively higher, ranging upto 6 percent. The population
is poorly sorted. The coarse truncation point of the
population falls at 0.0 S to 1.25 S but commonly at 0,5 S.
The grain-size of the population ranges from 0.0 S to 2.4 S.
The saltation population is well developed and its
percentages range from 76 to 97.3 percent excepting one
sample showing a lesser value of 57 percent. The population
is moderately well sorted with the exception of few samples
which show moderately sorted and well sorted saltation
population. The coarse truncation point of the population
lies at 1.05 5 to 2.4 5 and the fine truncation point at
2.7 cB to 3.7 Sc The grain-size of the population ranges
from 1.05 a to 3.7 5.
The suspension population is mostly poorly developed.
The percentages of the population generally range from
2.3 to 14 percent but in two samples higher percentages
(22 and 40 percent) are met. The population is invariably
poorly sorted. The grain-size of the population ranges
from 2.7 a to 4 4.

T
0.
fr
98 >9
- ' M l
QOl
T 1 r -I r «*M
Phi Seal*
9998
Phi Sc«l«
=
^ £
^ a.
1 t j ^
^ 1 J i
« i -^ ^ o
- 1 f 1
0
-
/ /
- J - - ^ 1.
/ /
•
1 1 1 1 1
y - * 5 ^ ./?.-/•, ' ' •?• ' ' • • / y ''*' / / J
1 •• 7 • /
/ // / / 1 *; 7 /
••' / V / / / /
i / .-/ . / /
y / y /
^ r
V .. .J. . 1_ . _ i , 1
^' ..r-
1 ' <iS'8a
J
•' ' <^
-
~ ~ "
" •
-
-1
99 »
98
90
70
SO
JO
10
I
OS
01
0 01
Phi S e l l .
flOURE IS ' y p « a locj ptub.biUty 91 «ui iU» iMilnUilMii iutv»» ( A. 6 C t [) ) ol v*in)»luii«».
Jfci*»tmtr ^ocm»^lon i aMm Vii h^t, I9ti9 I
105
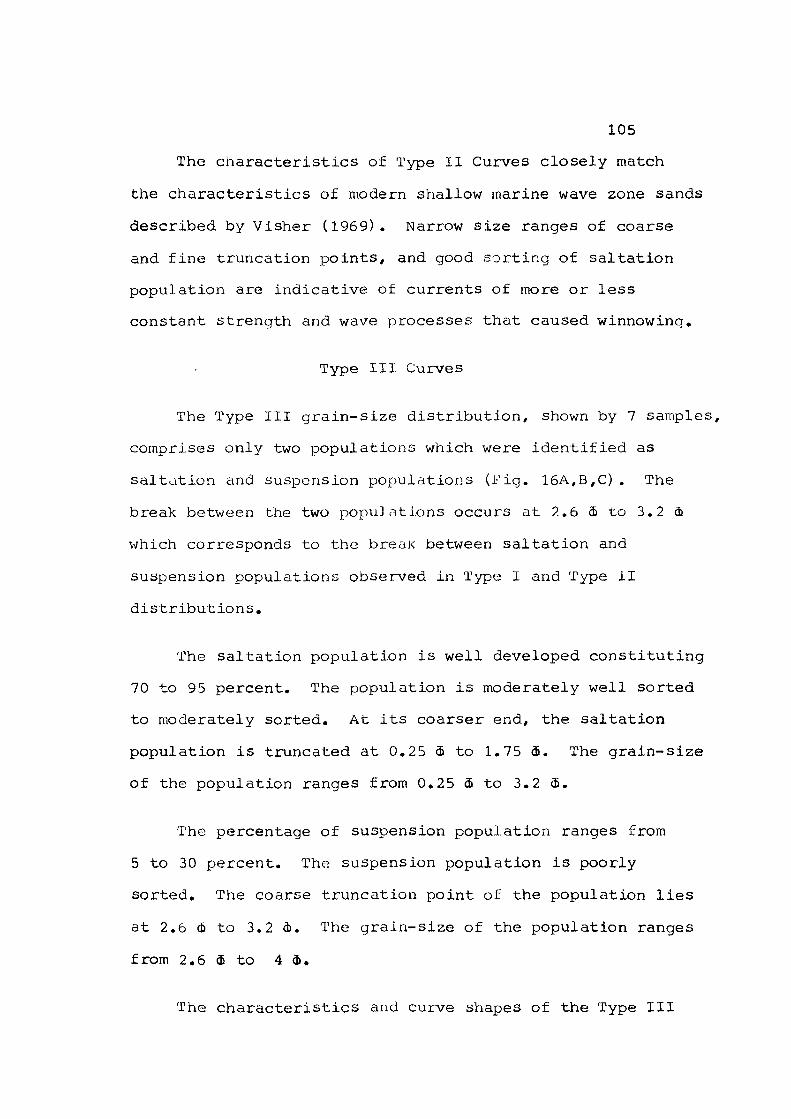
The characteristics of Type II Curves closely match
the characteristics of modern shallow marine wave zone sands
described by Visher (1969). Narrow size ranges of coarse
and fine truncation points, and good sorting of saltation
population are indicative of currents of more or less
constant strength and wave processes that caused winnowing.
Type III Curves
The Type III grain-size distribution, shown by 7 samples,
comprises only two populations which were identified as
saltation and suspension populations (Fig. 15A,B,C). The
break between the two populations occurs at 2.6 4 to 3.2 (i
which corresponds to the breaK between saltation and
suspension populations observed in Type I and Type 11
distributions.
The saltation population is well developed constituting
70 to 95 percent. The population is moderately well sorted
to moderately sorted. At its coarser end, the saltation
population is truncated at 0.25 S to 1.75 4. The grain-size
of the population ranges from 0.25 cB to 3.2 4.
The percentage of suspension population ranges from
5 to 30 percent. The suspension population is poorly
sorted. The coarse truncation point of the population lies
at 2.6 S to 3.2 cb. The grain-size of the population ranges
from 2.6 4 to 4 (6.
The characteristics and curve shapes of the Type III

* ^
i
i o a
1 1 /" ^ I
:
1 "5 U
-
_
-
1 « 0
-J . i |
A
•
Al
Y I
• ' \
/ j
y^ //
t i_ 1
•~ "v
. / / /
1
r /
/•
__!_
1 (— I 1 1
' -
J^ I^ "
^^ ^
> ' ^ ' ' ^ 'y / , f
J- y'»' 'A -U/ : / f'
. / / / ^ / / .
/* /
~ _ _ -
.,. ...J„ U . i i ,, 1 -2 3 4
»••«
«»R
2
I, S
01
"T \ \—1«1»«
-igae
Phi Scan
J 1 I i I I Jooi
Phi Scale
1 I !
i
»
-
-
^ -
-r-
[
1 '
1 0
•• - r
C
—-J__
• ' \ •
1
1
/
1
/ /
r • r "1 1
/ • * • ^
/ ^' / / / /
7 / V / J ' f /
' / /
/
1 1
•'
— -
, ^ <
_
-
99 S4
39 a
90
7U
50
30
Id
I
11 1
11 1)
' •?*<
',M 1 1
1
-^ ... 7 r
> I'h. S i i i ,
t t i r y w i rt/ ft«ni|Vtl'r.*r4>

106
distributions resemble those of modern and ancient fluvial
and distributary channel sands. Both fluvial deposits and
distributary channel deposits are characterised by two major
populations, one related to suspension and the other to
saltation. In general. Type 111 curves represent deposition
by unidirectional currents.
Type IV Curves
The Type IV distribution, shown by 5 samples, is
chancterised by a highly developed suspension population and
poorly developed surface creep and saltation populations
(Fig. 16D) .
The surface creep population is present in four samples
and forms upto 5 percent. The population is poorly sorted.
The coarse tiruncation point of the population lies at 0.0 S
to 1.25 S. The grain-size of the population ranges from
0.0 S> to 2.5 a.
The saltation population constitues 2 to 19.5 percent
in four samples and 4 5 percent in one sample. The population
is moderately well sorted in majority of the samples and
poorly sorted in one sample. The saltation population is
truncated at its coarser e-id at 1,5 3 - 2.50 5 and its
fine truncation point lies at 2.25 cB - 2.9 c6. The grain-size
of the population rancies fcrom 1,5 4 to 2,9 S.
The suspension population constit\ites generally 78 to 98
percent and 50 percent in one sample. It is generally
moderately sorted but poorly sorted in one sample. The
107
grain-size of the population ranges from 2.25 $ to 4 5.
The characteristics and shapes of the Type IV Curves
match those of modern levee deposits associated with
fluvial channels and distributary channels. The presence
of a predominant suspension population suggests that the
Type IV Curves were formed by the rapid fallout of suspended
material.
UNIVARIATE PARAMETERS
The statistical parameters of grain-size distribution
of the sandstone samples from the study area were determined
with the help of formulae given by Folk and Ward (1957).
Statistical measures obtained included Graphic Mean (M„),
Inclusive Graphic Standard Deviation ( CT ) , Inclusive
Graphic Skewness (SK .) , and Graphic Kurtosis {K_) , The samples
were classified according to Folk and Ward's (1957)' verbal
limits for sorting, skewness and kurtosis.
Mean Size
M values of the studied samples range from 1.5 S to
3.62 5 indicating that the sandstones are medium to very
fine grained. The sandstones are, however, commonly fine
grained as M values of most samples lies between 2 5 to 3 5.
Mean size is a function of (1) the size range of available
sediment and (2) amount of energy imparted to the sediment
which depends on current velocity or turbulence of the

108
transporting medixom. The narrow range of mean size of the
studied sandstones suggests that either the available
sediment had a limited size range or the hydrodynamic conditions
were more or less uniform during the deposition of various
sandstone units. The vertical sequence of sedimentary
structures and bedding types indicated varying energy
conditions, Therefoj-o the narrow range of mean grain-size
in all probability reflects a limited size range of available
sediment. The fine nrained mean size of most samples is
in conformity with a close association of sandstone units
with generally micritic limestones.
Despite an apparent homogeneity of mean grain-size,
several sandstone units of the Hamira Member, the Joyan
Member and the Fort Member show a coarsening-upwards of the
mean grain-size. This is attributed to prograding coastal
sands and shoaling waters that resulted in winnowing of finer
sediments due to increasing wave and current action in
nearshore environments as proposed by Mason and Folk (1958),
Friedman (1961, 1962, 1967), Duane (1964), Tanner (1966),
and Valia and Cameron (1977) .
Sorting
O" Values of the studied samples range from 0,25 $
to 0.74 4. According to the verbal classification scale
for sorting, the sandstones are mostly moderately well sorted
to well sorted. However, few samples are either moderately
sorted or very well sorted.

109
Sorting is a poorly understood measure. It depends
on atleast three major factors which are the size range of
available sediment, its rate of deposition, and the strength
and variation in energy of the depositing agent. Folk (1968)
believes that sorting of a given source material decreases
in a sequence of aeolian, beach, river (or nearshore marine),
and offshore marine environments. Sorting values in the
1 a to 3 4 sand class generally range from 0.25 5 to 0.50 d)
for beach sands and from 0,35 i> to 1.0 S> for river (or shallow
marine) sands (Folk, 1968). Since the mean size of the studied
sandstones generally lies between 2 S - 3 S, their sorting
values can be compared with the sorting values of modern
sediments described by Folk (1968). About 70 percent of the
studied samples show sorting values between 0o25 $ and 0,5 iS
matching the sorting of modern beach sands. The remaining
30 percent samples show sorting values ranging from 0.51 S
to 0,74 5. These sandstones perhaps represent nearshore
marine sands which, according to Folk (1968), are somewhat
more poorly sorted than corresponding beaches, and tend to have
sorting values roughly similar to river sands.
Skewness and Kurtosis
SK^ values of the studied sandstones range from -0,31 to
+0.61. 82 percent of the samples have positive skewness
and the remaining 18 percent are negatively skewed. Among
the positively skewed samples, 20 percent are near-symmetrical,
44 percent are fine-skewed and the remaining 18 percent are
strongly fine-skewed. 13 percent of the negatively skewed

110
samples are coarse-skewed, and 5 percent are strongly
coarse-skewed.
K^ values of the studied sandstones range from 0.70
to 2.56. Majority of the samples are leptokurtic (51 percent)
followed in descending order by very leptokurtic (20 percent),
mesokurtic (16 percent) and platykurtic (13 percent).
SkewnesG and i^urtosis wetu teferx-ed to as indicators
of selective action of the transporting agent by Krumbein
and Pettijohn (1938). Since then the parameters have been
employed by various investigators but have been little studied
from a geological standpoint. Polk and Ward (1957) considered
that skewness and kurtosis reflect bimodality of grain-size
even though modes are not readily apparent. Mason and Folk
(1958) made a comparative textural studies in recent sands of
beach, dune, and aeolian flat environments. These studies
indicated that beach sands are normal or negative and leptokurtic,
that dune sands have positive skewness and are mesokurtic,
and tliat "aeolian flot" sands have positive skewness and are
leptokurtic. Friedman (1961) attempted to distinguish
between beach, dune and river sands on the basis of skewness.
He demonstrated that modern beach sands generally have negative
skewness, but both dune and river sands usually are positively
skewed. Duane (1964) demonstrated that sands of the littoral,
beach, and tidal inlet environments have negative skewness as
the result of winnowing action, waves and tidal currents. In
sheltered quiet water areas and in reeper water, where bottom
currents or wave-base surge are not effective, the sands have

Ill
positive skewness. Sediments show local variation'in the
sign of skewness in areas of fluctuating energy conditions
or of intermittent winnowing action.
About 40 percent of the studied samples have near-symme
trical or negative skewness which suggests winnowing action
of currents and waves. The remaining 50 percent of the samples
show positive skewness and range from fine-skewed to strongly
fine-skewed. The positive skewness and leptokurtic distribution
in the studied samples might be due to either nearness to the
source of the sand as suggested by Folk and Ward (1957), or
relatively deeper water conditions where wave-base surge
and bottom currents were not effective.
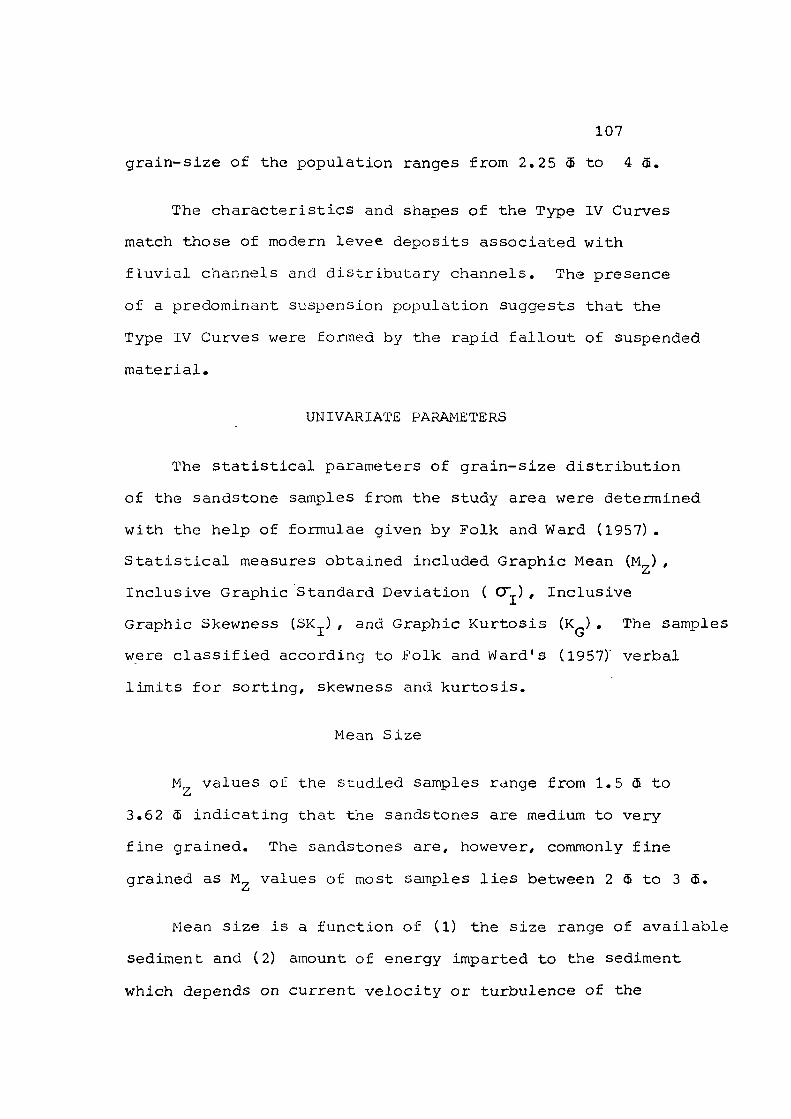
BIVARIATE PLOTS
Bivariate plots were constructed by combining two
statistival grain-size parameters of the studied sandstones.
The sample points were plotted on two different combinations
which included (1) C (one percentile) versus M (median diameter),
and (2) inclusive graphic standard deviation versus median
diameter. The bivariate plots were employed to interpret
the depositional processes and environments.
The bivariate plot of C versus M (CM diagram) was
constructed by Passega's (1957, 1964) methods. Figure 17 shows
the CM diagram for the study area with superimposed patterns
representing two types of deposits. Most of the sample points
best fit the pattern representing typical beach environment.
Sample points are mostly situated where the pattern is close
JOOO
100 T — f i t T w .. 5*00 1000
M.Mtdt .n Oi.m.t .r (Micron»>
I
- - - . - ;:i, "o;.:?:*'''''" '' ''*'''-'''>•-«-

112
to limit C=M^ and hence the sediments are generally well
sorted. Passega (1957) demonstrated that CM patterns indicated
the depositional agent as each of the different type of deposits,
for example, river, beach, quiet water and turbidity current
deposits, was characterised by a distinctive pattern.
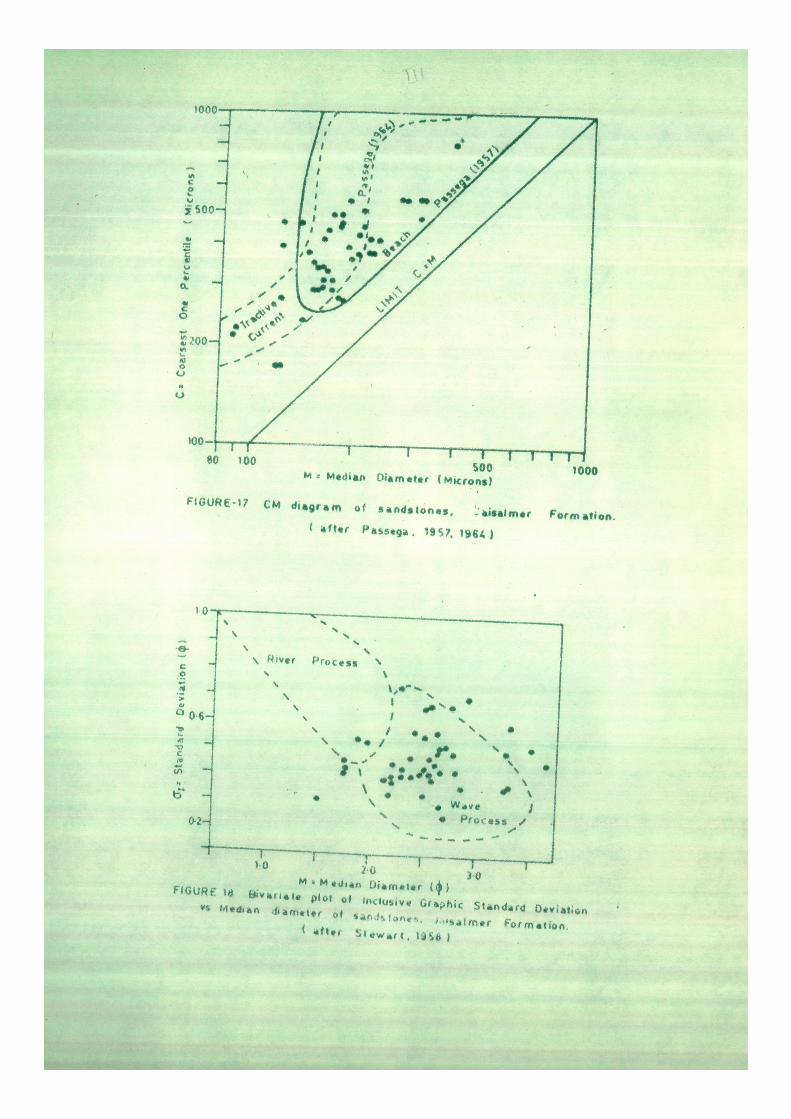
Bivariate plot of inclusive graphic standard deviation
( 0~ ) versus median diameter was employed by Stewart (1958)
to distinguish between«»ve and river processes. The bivariate
plot of the studied sandstones (Fig, 18) shows two different
fields, each of river and wave processes. Most of the
sample points fall in the field of wave process. It appears
that wave processes played a dominant role in the deposition
of the studied sandstones.
Related Documents