Department of Materials Science Page 71 Chapter III Characterization of Hydroxyapatite Nanoparticles III.1 Introduction The hydroxyapatite is known to be an excellent adsorption material into the human body. In addition to high adsorption capacity for heavy metals, it has low water solubility, high stability under reducing and oxidizing conditions. It can be processed with ease and method is cost effective. Therefore, in the present work hydroxyapatite was prepared and efforts were made to optimize the processing parameter of hydroxyapatite having high surface area and mesoporosity have been optimised. III.2 Characterization of HA Nanoparticles The preparation conditions used to prepare HA nanoparticles for which the various analysis’s and tests mentioned in chapter two have been carried out are given in Table III.1. Table III.1 Experimental parameters used to prepare HA nanoparticles via chemical precipitation method III.2.1 Physical properties III.2.1.a Particle size and shape TEM micrographs of the prepared samples after calcination are shown in Figure Sample pH of CN pH of AHP Reaction Temperature A 9.5 9.5 Ambient B 10.5 10.5 Ambient C 12 12 Ambient

Welcome message from author
This document is posted to help you gain knowledge. Please leave a comment to let me know what you think about it! Share it to your friends and learn new things together.
Transcript
Department of Materials Science Page 71
Chapter III
Characterization of Hydroxyapatite Nanoparticles
III.1 Introduction
The hydroxyapatite is known to be an excellent adsorption material into the
human body. In addition to high adsorption capacity for heavy metals, it has low water
solubility, high stability under reducing and oxidizing conditions. It can be processed
with ease and method is cost effective. Therefore, in the present work hydroxyapatite was
prepared and efforts were made to optimize the processing parameter of hydroxyapatite
having high surface area and mesoporosity have been optimised.
III.2 Characterization of HA Nanoparticles
The preparation conditions used to prepare HA nanoparticles for which the
various analysis’s and tests mentioned in chapter two have been carried out are given in
Table III.1.
Table III.1 Experimental parameters used to prepare HA nanoparticles via chemical precipitation method
III.2.1 Physical properties
III.2.1.a Particle size and shape
TEM micrographs of the prepared samples after calcination are shown in Figure
Sample pH of CN pH of AHP
Reaction Temperature
A 9.5 9.5 Ambient
B 10.5 10.5 Ambient
C 12 12 Ambient

Chapter III
Department of Materials Science Page 72
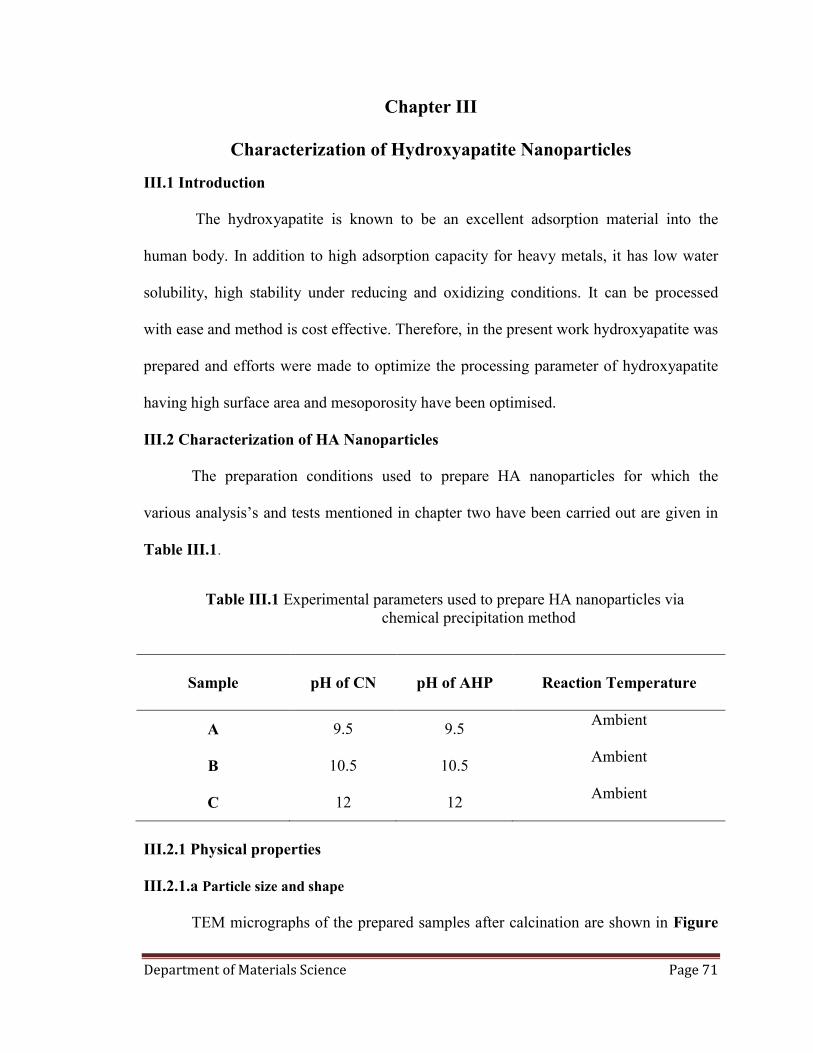
III.1. The particles are mainly composed of aggregates of nanoparticles with different
Ca/P ratio.
TEM micrographs of prepared samples after calcination are shown in Figure
III.1. These micrographs indicate nanometer scale size of precipitated HA particles
prepared by chemical precipitation method. The comparison of the relative micrographs
of figure reveals some significant changes between morphology and size of the particles.
The particles of all the three samples show two different shapes (i) nanorods and
(ii) nearly spherical nanoparticles. Irrespective of the shape of particles, the particle size
varies from 20-50 nm.
Sample A is composed mainly of from nanoparticles having low aspect ratio
represents the HA nanomaterials. In Figure III.1.a, HA particles hold spherical crystals
and congregation also can be observed. HA particles synthesized at pH 9.5 were spherical
or close to spherical in shape with different size. The results indicate that the pH has an
obvious influence on the morphology and size of HA particles. The morphology of HA
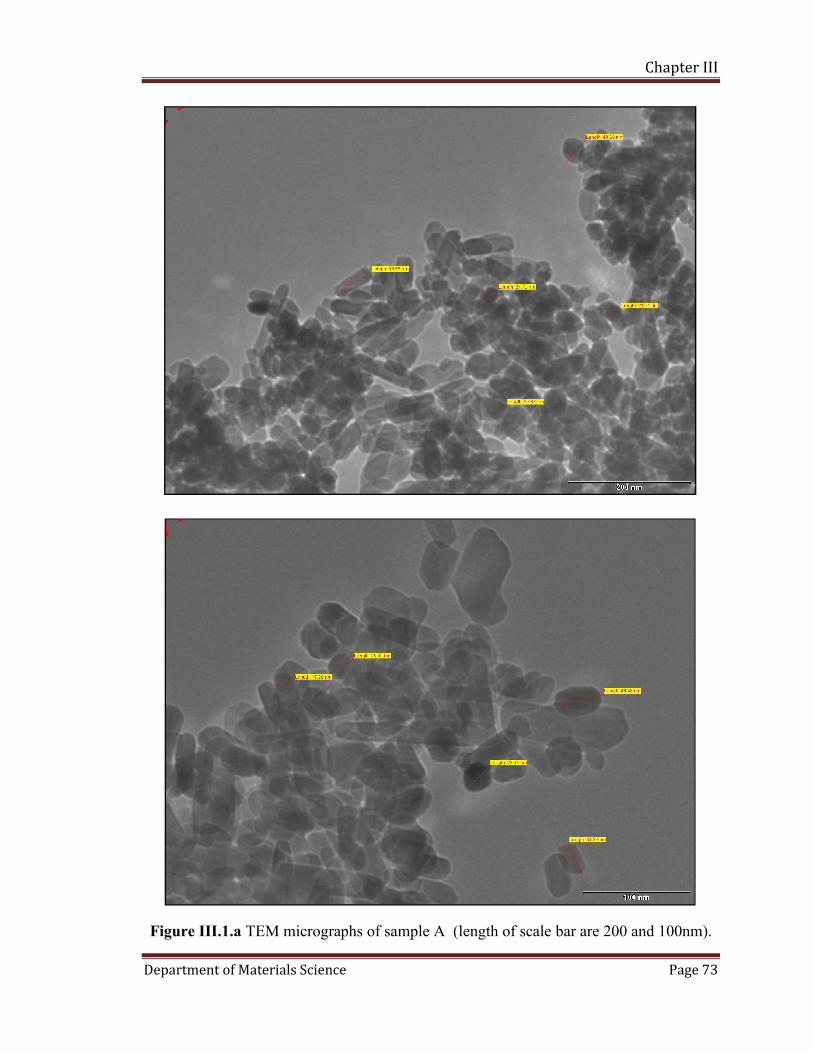
shown in Figure III.1.b presents needle-like crystals with an average size of
approximately 20-50 nm in width.
As it is seen in Figure III.1.c, nanoparticles indicated by arrow-head, is
containing some fine holes in their infrastructure. These holes are fundamentally some
structural defects that can be related to the kind of synthesis of them. Since, synthesis of
HA was carried out in alkaline environment, so, there are some high corrosive hydroxyl
groups in the synthesis reactor which they because the defects in the structure. It can be
concluded that the low pH may prevent the growth of HA particles and provide a more
uniform size distribution.
Chapter III
Department of Materials Science Page 73
Figure III.1.a TEM micrographs of sample A (length of scale bar are 200 and 100nm).
Chapter III
Department of Materials Science Page 74
Figure III.1.b TEM micrographs of sample B (length of scale bar are 50 and100nm).

Chapter III
Department of Materials Science Page 75
Figure III.1.c TEM micrographs of sample C (length of scale bar are 100nm).
Chapter III
Department of Materials Science Page 76
III.2.2 Chemical composition
III.2.2.a Fourier transform infrared spectroscopy
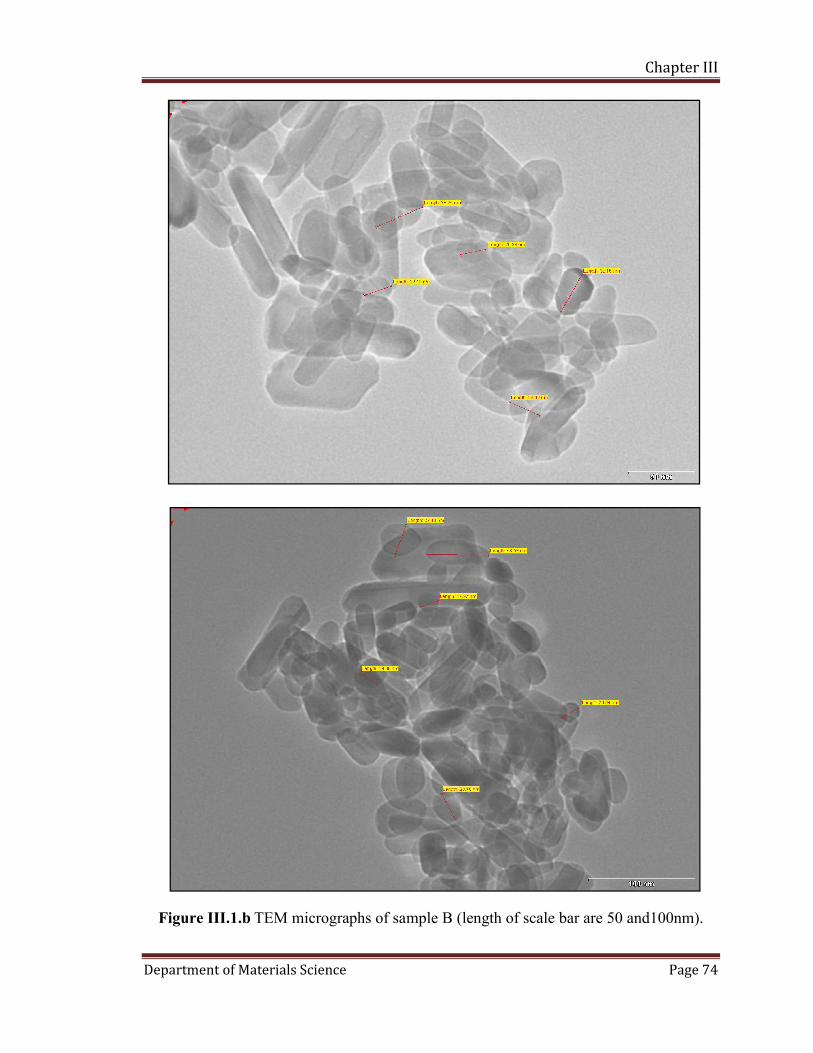
The FT-IR spectra of samples A, B and C before and after calcination are shown
in Figure III.2.a & b respectively. In both spectra, the absorption due to the vibration
modes from phosphates and hydroxyl groups, which represent the HA structure in IR
spectra are present.
Figure III.2.a FT-IR spectra for samples A, B and C before calcination
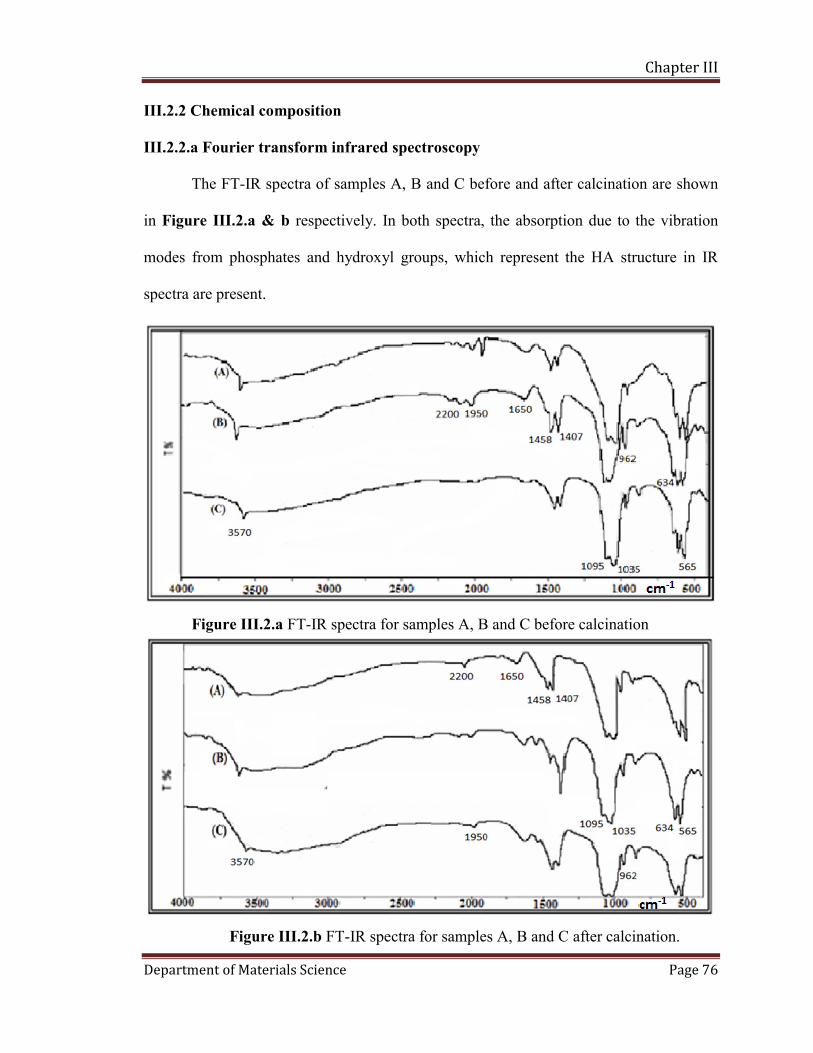
Figure III.2.b FT-IR spectra for samples A, B and C after calcination.

Chapter III
Department of Materials Science Page 77
The FT-IR spectra of samples A, B and C before calcination and after calcination
are shown in Figure III.2.a and Figure III.2.b respectively.
In both spectra the absorption due to the vibration modes from phosphates and
hydroxyl groups, which represent the hydroxyapatite structure in IR spectra are seen. The
bands at 3570 cm-1and 634 cm-1 arise from stretching and librational modes of OH– ions
respectively. The bands at 1095 cm-1 and 1035 cm-1 arise from ν3 PO4, the 962 cm-1 band
arise from ν1 PO4, the 601 cm-1 and 565 cm-1 band arise from ν4 PO4 1-2. The group of
weak intensity bands in the 2200 cm-1 to 1950 cm-1 region derives from overtones and
combinations of the ν3 and ν1 PO4 modes.
The bands at 1407 cm-1 and 1458 cm-1 are attributed to components of the ν3 mode
of a trace amount of CO32–, the band at 872 cm-1 is attributed to components of the ν2
mode of CO32-, and bands at 1540 cm-1 derived from CO3
2– that replace OH– ions in the
hydroxyapatite lattice, were detected suggesting the substitution of PO4 group in the
structure of hydroxyapatite by CO32– 3-4. The broad peaks at 1650 cm-1 and 3200-3350
cm-1 show the presence of water5-6. Result shows that after calcination, the peaks become
sharper and more distinguishable because of the reduction of the number of phases.
Presence of carbonated group in spectra confirms formation of carbonated
hydroxyapatite.
III.2.2.b Inductively coupled plasma method
The results of the ICP analysis of the prepared samples are given in Table III.2.
The aim of this analysis was to determine the Ca/P molar ratio to be used to find
stoichiometric status of the prepared HA. It has been observed that all prepared HA is

Chapter III
Department of Materials Science Page 78
Carbonated HA, i.e., having Ca percent greater than the ideal status, as can also be
observed in FT-IR spectra.
Comparing the Ca/P ratio of samples A, B and C having different pH shows that
with increasing pH, the Ca/P ratio increases up and is highest in case of sample C. This
can be explained by the structural tendency of HA to have the lowest level of stability at
pH 12, which is represented by the stoichiometric status.
Table III.2 Molar ratio obtained from ICP Analysis
III.2.2.c X-Ray Diffraction Analysis
the XRD patterns of the samples A, B and C after calcinations are shown in
Figure III.3.a, b and c. The observed positions of the diffraction lines (2θ and
corresponding d2θ) for the patterns of all samples are found to be in full agreement with
the corresponding values reported for hexagonal hydroxyapatite. The major expected
phase is hydroxyapatite, which is confirmed by comparing data obtained with the JCPDS,
Card No. 9-432.
The formation of hydroxyapatite was indicated by the appearance of
characteristics peak at 2θ =31.8˚ which is seen in all HA samples. The narrow peaks in
XRD spectra indicate high degree of crystallinity in the hydroxyapatite particles 7.
The occurrence of the two peaks at 2θ =32˚ in the diffraction spectrum and the
diffraction peaks at 2θ= 33.5˚, 34.6˚ and 49.9˚, respectively, became narrower and
No Sample ID Molar Ratio
1 Sample A 1.6787
2 Sample B 1.6815
3 Sample C 1.7001

Chapter III
Department of Materials Science Page 79
sharper, and the diffraction peaks at 2θ =26˚, 28.8˚ and 48.1˚ appear with increasing pH.
These suggested that higher pH HA with larger proportion of crystalline phase. The XRD
pattern of samples show that secondary phase present is calcium oxide (CaO), identified
at 53.67 (2θ)8.
These result shows formation of hydroxyapatite. The occurrence of sharp wide
and high peaks reveals very small size and excellent crystal quality of HA. In all the
cases intense peaks were observed, showing formation of nano-HA powders with
superior quality by chemical precipitation method 9. These results are found to be in
agreement with the results reported in literature which suggested that the initial
precipitate was an amorphous calcium phosphate (ACP), which underwent stages of
aging to form a poorly crystalline apatite phase, and then a crystallized HA phase10-11 on
sintering at 550˚C.
Figure III.3.a XRD patterns of prepared HA sample A

Chapter III
Department of Materials Science Page 80
Figure III.3.b XRD patterns of prepared HA sample B
Figure III.3.c XRD patterns of prepared HA sample C

Department of Materials Science
III.2.3 Surface characteristics
III.2.3.a Nitrogen adsorption stud
The adsorption and desorption of nitrogen isotherms of the calcined samples are
shown in Fig. III.4. The shape of these plots match with ‘type IV’ of the six principal
classes of isotherm shapes.
Fig III.4 Adsorption and desorption isotherms of
Department of Materials Science
II.2.3 Surface characteristics
II.2.3.a Nitrogen adsorption study
The adsorption and desorption of nitrogen isotherms of the calcined samples are
The shape of these plots match with ‘type IV’ of the six principal
classes of isotherm shapes.
Adsorption and desorption isotherms of the calcined HA samples.
Chapter III
Page 81
The adsorption and desorption of nitrogen isotherms of the calcined samples are
The shape of these plots match with ‘type IV’ of the six principal
HA samples.
Chapter III
Department of Materials Science Page 82
Type IV isotherms possess a hysteresis loop, the shape of which varies from one
adsorption system to another. Hysteresis loops are associated with mesoporous solids,
where capillary condensation occurs. The initial part of the Type IV isotherm is attributed
to monolayer-multilayer adsorption since it follows the same path as the corresponding
part of a Type II isotherm obtained with the given adsorptive on the same surface area of
the adsorbent. Thus the samples have mixed porosities 12.
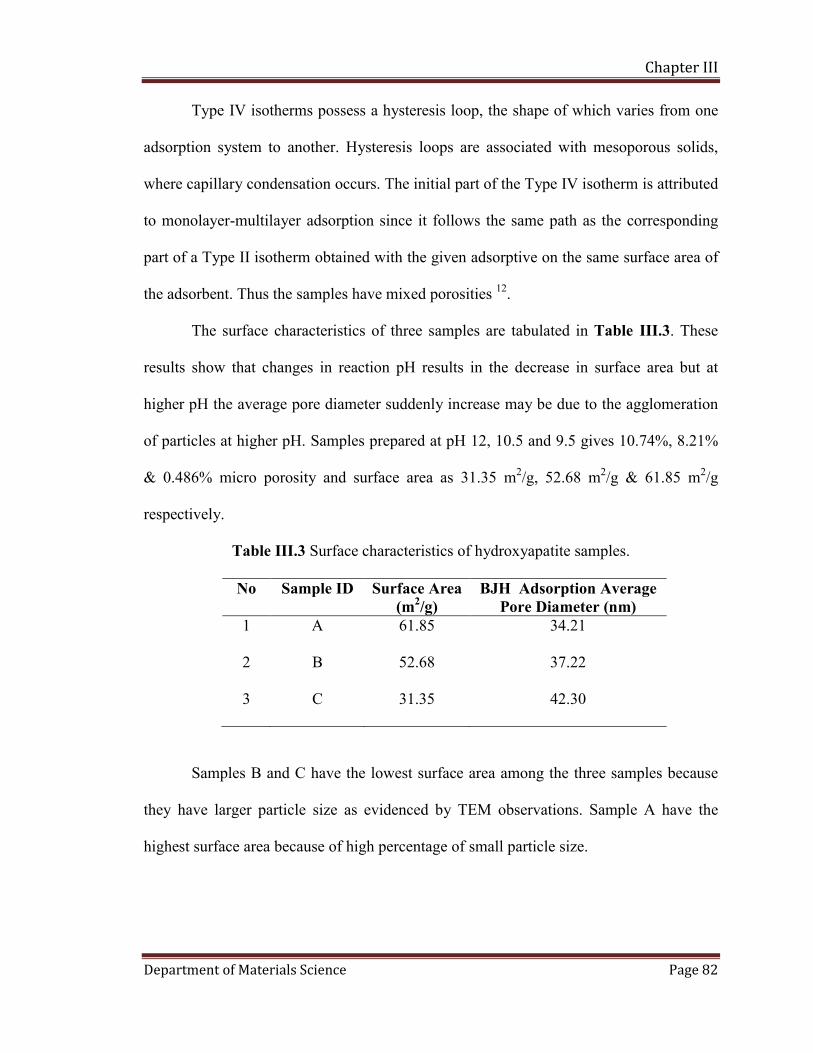
The surface characteristics of three samples are tabulated in Table III.3. These
results show that changes in reaction pH results in the decrease in surface area but at
higher pH the average pore diameter suddenly increase may be due to the agglomeration
of particles at higher pH. Samples prepared at pH 12, 10.5 and 9.5 gives 10.74%, 8.21%
& 0.486% micro porosity and surface area as 31.35 m2/g, 52.68 m2/g & 61.85 m2/g
respectively.
Table III.3 Surface characteristics of hydroxyapatite samples.
No Sample ID Surface Area (m2/g)
BJH Adsorption Average Pore Diameter (nm)
1 A 61.85 34.21
2 B 52.68 37.22
3 C 31.35 42.30
Samples B and C have the lowest surface area among the three samples because
they have larger particle size as evidenced by TEM observations. Sample A have the
highest surface area because of high percentage of small particle size.
Chapter III
Department of Materials Science Page 83
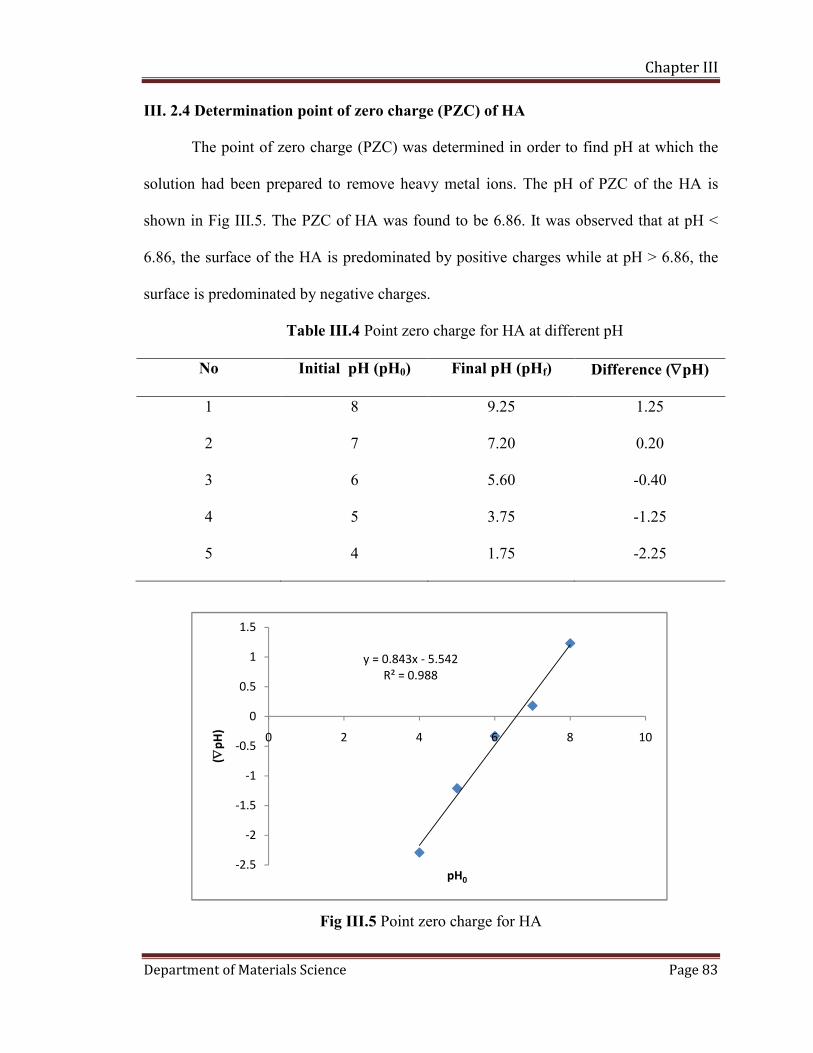
III. 2.4 Determination point of zero charge (PZC) of HA
The point of zero charge (PZC) was determined in order to find pH at which the
solution had been prepared to remove heavy metal ions. The pH of PZC of the HA is
shown in Fig III.5. The PZC of HA was found to be 6.86. It was observed that at pH <
6.86, the surface of the HA is predominated by positive charges while at pH > 6.86, the
surface is predominated by negative charges.
Table III.4 Point zero charge for HA at different pH
No Initial pH (pH0) Final pH (pHf) Difference (pH)
1 8 9.25 1.25
2 7 7.20 0.20
3 6 5.60 -0.40
4 5 3.75 -1.25
5 4 1.75 -2.25
Fig III.5 Point zero charge for HA
y = 0.843x - 5.542R² = 0.988
-2.5
-2
-1.5
-1
-0.5
0
0.5
1
1.5
0 2 4 6 8 10
(p
H)
pH0

Chapter III
Department of Materials Science Page 84
III.3 Characterization of HA Pellets
III.3.1 Particle size and shape
TEM micrographs of the HA powders are shown in Fig III.6. As seen from the
morphologies of particles, there is a distribution of small particles and large agglomerates
with their size in the range 20 to 50 nm. These agglomerates consist of fine particles that
are cold welded together. The powders are composed of aggregates of nanosized HA
particles smaller than 50 nm There are two types of nanoparticles seen in the
micrographs: (i) nanorods and (ii) nearly spherical nanoparticles.
Fig III.6 TEM micrograph of the HA nanoparticles.
III.3.2 Chemical composition
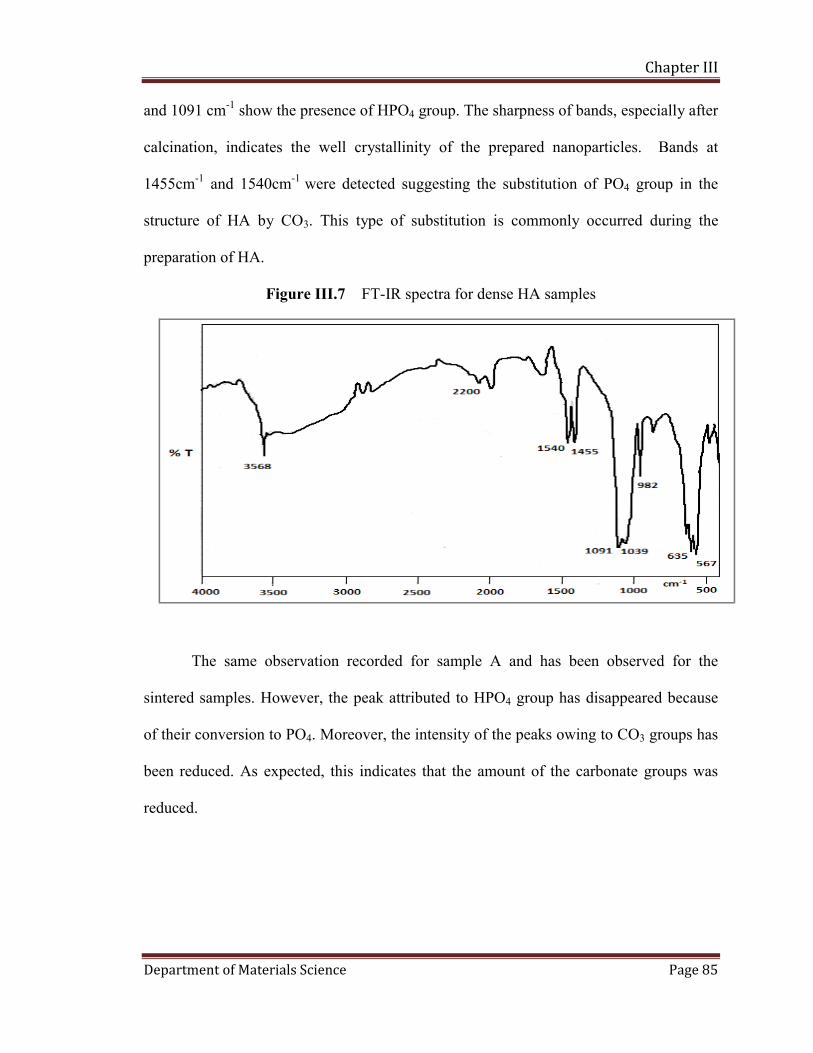
III.3.2.a Fourier transform infrared spectroscopy
The FT-IR spectra of dense HA are shown in Figure III.7. The bands at 3568 cm-1,
and 635cm-1 arise from stretching, and librational modes of OH– ions, respectively. The
peaks at 567 cm-1 and 1039 cm-1 show the presence of PO4 group, the peaks at 982 cm-1
Chapter III
Department of Materials Science Page 85
and 1091 cm-1 show the presence of HPO4 group. The sharpness of bands, especially after
calcination, indicates the well crystallinity of the prepared nanoparticles. Bands at
1455cm-1 and 1540cm-1 were detected suggesting the substitution of PO4 group in the
structure of HA by CO3. This type of substitution is commonly occurred during the
preparation of HA.
Figure III.7 FT-IR spectra for dense HA samples
The same observation recorded for sample A and has been observed for the
sintered samples. However, the peak attributed to HPO4 group has disappeared because
of their conversion to PO4. Moreover, the intensity of the peaks owing to CO3 groups has
been reduced. As expected, this indicates that the amount of the carbonate groups was
reduced.

Chapter III
Department of Materials Science Page 86
III.3.2.b Inductively coupled plasma method
The Ca/P molar ratio was determined as 1.678. The measured Ca/P ratio for this
produced powder was higher than stoichiometric ratio (1.667) expected for a pure HA
phase that can arise from two matters: (a) local presence of carbonate apatite in which the
Ca/P ratio can be as high as 3.33 or (b) presence of impurities such as CaO. According to
the XRD patterns & FT-IR spectra that showed existence of carbonate apatite, the first
matter is much more reasonable.
III.3.2.c X-Ray Diffraction Analysis
The XRD patterns for the dense HA samples are shown in Figure III.8. It has
been observed that obtained peaks match perfectly with the corresponding values
reported for hexagonal hydroxyapatite (JCPDS, Card No. 9-432). The result shows a
crystalline nature of typical apatite crystal structure with broad diffracted peaks and does
not show any extraneous phases, which suggests that the chemical precipitation reaction
has produced phase pure or homogeneous HA.
Figure III.8 The XRD patterns for the Dense HA.

Chapter III
Department of Materials Science Page 87
III.3.3 Surface characteristics
III.3.3.a Nitrogen & Methylene blue adsorption studies
The surface characteristics determined by nitrogen adsorption on HA pellets
samples are given in Fig III.9.
Fig III.9 Adsorption isotherms of the prepared HA Pellets.
0.0 0.2 0.4 0.6 0.8 1.0
0
1
2
3
4
5
6
7
Vo
lum
e A
dso
rbe
d (
cm3/g
ST
P)
Relative Pressure (P/Po)
Compaction Pressure 100 kg/cm2
0.0 0.2 0.4 0.6 0.8 1.0
0
2
4
6
8
10
Volu
me A
dso
rbed
(cm
3/ g S
TP
)
Relative Pressure (P/Po)
Compaction Pressure 75 kg/cm2
0.0 0.2 0.4 0.6 0.8 1.0
0
1
2
3
4
5
6
7
Volu
me A
dso
rbed
(cm
3/ g S
TP
)
Relative Pressure (P/Po)
Compaction Pressure 125 Kg/cm2
0.0 0.2 0.4 0.6 0.8 1.0
0
2
4
6
8
10
12
Vo
lum
e A
dso
rbe
d (
cm
3/g
ST
P)
Relative Pressure (P/P0)
Compaction Pressure 50 Kg/cm2

Chapter III
Department of Materials Science Page 88
These isotherms show mesoporous nature showing multilayer adsorption process
where complete filling of the smallest capillaries has occurred corresponding to type IV
adsorption isotherms which are characteristics of mesoporous materials. Type IV
isotherms describe a multilayer adsorption process where complete filling of the smallest
capillaries has occurred.
The Surface characteristic properties of the dense HA prepared in different
packing condition are given in Table III.5. As compaction pressure increases the pores
got closed resulting in enlarging the pore diameter. BET surface area also decreased from
10.94 to 5.98 m2/g as compaction pressure increases from 50 to 125 Kg/cm2. These
results clearly show that compaction pressure is important parameter for formation of
porosity. Surface area measured using methylene blue method also show a similar kind of
nature. It decreases from 12.42 to 7.83 m2/g as compaction pressure increases from 50
to 125 Kg/cm2.
Table: III.5 Surface characteristic properties of HA pellets.
Sample No.
Compaction pressure (Kg/cm2)
Surface Area BET Method
(m2/gm)
Surface Area Methylene Blue
Method (m2/gm)
Average Pore Diameter
(nm)
1 50 10.94 12.42 5.90
2 75 9.32 11.05 5.80
3 100 6.51 8.68 5.78
4 125 5.98 7.83 2.39

Chapter III
Department of Materials Science Page 89
III.3.4 Physical properties
The physical properties of the HA pellets prepared at different conditions are
given in Table III.6. The kerosene porosity and hence water absorption, decreased by
using higher applied pressure. In contrast, the density found to be increased through
increasing the packing pressure. Comparing the moisture content values of the prepared
samples shows that it decreases with increasing the packing pressure.
Table III.6 The physical properties of dense HA packed at different conditions.
Compaction pressure (Kg/cm2)
50 75 100 125
Kerosene Porosity (%) 53.73 49.06 44.80
42.64
Water Absorption (%) 51.77 46.39 41.99
39.02
Bulk Density (g/cc) 1.2690 1.3747 1.5315
1.6240
Moisture content (%) 0.9393 0.7830 0.6945
0.6442
III.3.5 Mechanical Testing
III.3.5.a Compressive strength
The results of compressive strength of HA samples are given in Table III.7. It has
can be seen that by increasing the compaction pressure improves the compressive
strength of HA. The result suggests that compaction pressure has an important role in
controlling the mechanical properties of HA. With the applied pressure porosity of
samples gets reduced, enhancing compressive strength of HA pellets.

Chapter III
Department of Materials Science Page 90
Table III.7 The Mechanical properties of dense HA packed at different conditions.
No Pressure (Kg/cm2 )
Compressive Strength (MPa)
Compressive Modulas (GPa)
1 50 27.92 0.64
2 75 48.09 0.70
3 100 87.92 0.89
4 125 128.96 1.02
III.4 Conclusions
It has been found that carful adjustment of the processing parameters during the
preparation of HA nanoparticles is very necessary to control the microstructural
characteristics of the HA which is a complex ceramic system. This can successfully solve
many processing difficulties associated with the use of the HA and allowing
nanocrystalline particles of perfect phase purity to be achieved. The chemical
precipitation method with high pH precursors yield crystalline HA nanoparticles which
compose mainly from agglomerated nanorods having thermal stability. It has been
observed that the chemical and mineral composition as well as the morphology of the HA
nanoparticles prepared by chemical precipitation method are highly affected by the pH of
the starting solutions. The pH has been found to have significant role in the shape and
crystallinity of the nanoparticles. Equiaxed nanoparticles, nanowhisker, and nanorods can
be prepared from the same starting solutions by controlling the pH.

Chapter III
Department of Materials Science Page 91
III.5 References
1) G. Gergely, F. Wéber, I. Lukács, L. Illés, A. L. Tóth, Z. E. Horváth, J. Mihály, C. Balázsi, Central European Journal of Chemistry, Vol. 8,375–381,(2010) 2) S. K. Ghosh, A. Prakash, S. Datta, S. K. Roy and D. Basu, Bulletin of Materials Science,Vol. 33, 7–16, (2010) 3) M. Shahmohammadi , R . Jahandideh , A. Behnamghader, M. Rangie, Int.J.Nano.Dim, Vol.1,41-45, (2010) 4) T.V. Thamaraiselvi, K. Prabakaran and S. Rajeswari, Trends Biomater. Artif. Organs, Vol. 19, 81-83,( 2006) 5) E. Bouyer, F. Gitzhofer, M. I. Boulos, Journal of Materials Science: Materials in Medicine, Vol.11, 523 – 531, (2000) 6) K.C. Blakeslee and R. A. Condrate, Journal of the American Ceramic Society, Vol. 54, 559- 564, (1971) 7) K. Kieswetter, TW. Bauer, SA. Brown, F. Van Lette, K Merrit, Biomaterials,15,183-188, (1994) 8) Recent Researches in Communications, Automation, Signal Processing, Nanotechnology, Astronomy and Nuclear Physics. ISBN: 978-960-474-276-9 9) Smičiklas, I. Onjia, A. and Raičevič, S., Sep.Purif. Technol. 44 : 97-102, (2005) 10) E. D. Eanes, I. H. Gillessen, and A. S. Posner, Nature, 208: pp365, (1965) 11) A. L. Boskey and A. S. Posner, J. Phys. Chem., 77: pp 2313 (1973) 12) S. J. Gregg and K. S. W. Sing, Adsorption, Surface Area and Porosity, London:
Academic Press (1982)
Related Documents