Chapter II Performance Audit relating to Government Companies Ajmer Vidyut Vitran Nigam Limited, Jaipur Vidyut Vitran Nigam Limited and Jodhpur Vidyut Vitran Nigam Limited 2.1 Power Distribution Utilities Executive summary Electricity is an essential requirement for all facets of our life and its supply at reasonable rate to all the sectors is very crucial for sustained economic development. In Rajasthan, distribution of electricity is managed by Ajmer Vidyut Vitran Nigam Limited, Jaipur Vidyut Vitran Nigam Limited and Jodhpur Vidyut Vitran Nigam Limited. As on 31 March 2011, the State had distribution network of 6.33 lakh Circuit Kilometer of lines (33/11 KV and LT), 3498 Sub-Stations and 813808 transformers of various categories. The number of consumers was 95.27 lakh as on 31 March 2011. The turnover of DISCOMs was 21807.49 crore in 2009-10, which was equal to 65.98 per cent and 9.92 per cent of the turnover of State PSUs and State Gross Domestic Product respectively. The DISCOMs employed 41040 employees as on 31 March 2011. Distribution Network Planning The increase in distribution capacity could not match the pace of growth in consumer demand, as against the planned additions of 1200 sub-stations during 2006-11, the actual addition was only 1142 sub-stations and further, as compared to the growth of connected load from 11792 MW as on April 2006 to 20857 MW as on March 2011, the increase in transformers capacity was from 11310 MVA to 15469 MVA. In JdVVNL, delay ranging between five and 27 months in completion of 28 sub-stations against scheduled dates of completion as on 31 March 2011 deprived envisaged energy savings of 17.44 MUs valuing 11.37 crore. Centrally Sponsored Schemes RGGVY The State Government notified the Rural Electrification Plan with a delay of 18 months. The DISCOMs against the target of electrification of all villages by March 2009 under Rajiv Gandhi Grameen Vidyutikaran Yojna, electrified only 1661 villages out of total 6538 un-electrified villages and further, only 1488 more villages could be electrified by March 2011. JdVVNL departmentally executed the projects in violation of the provisions of scheme which resulted into deprival of subsidy of 2.11 crore for Barmer project and likely deprival of 19.58 crore for four projects of tenth plan. JdVVNL incurred excess expenditure of 13.05 crore from its own sources during tenth plan while funds released by REC under eleventh plan remained unspent due to slow progress of work. The excess expenditure incurred on the projects of tenth plan were not reimbursed by REC due to failure of JdVVNL to submit closure certificates. This has cost JdVVNL of 3.20 crore on account of interest paid on borrowed funds. APDRP/R-APDRP The works of 163.62 crore executed by DISCOMs did not match the sanctioned list of the GOI under mandatory and non-mandatory item list as a result the DISCOMs were deprived of the subsidy of 40.91 crore. For implementing SCADA in Jodhpur and Bikaner city, the implementing agency could not achieve the target of ‘Go Live’ by due date. Further, the JdVVNL could ring fence only 19 out of 31 towns, which resulted in undue delay in commencement of activities. The DPRs of the projects were under preparation stage and only 16.35 crore could be utilised (June 2011) against loan funds of 102.63 crore. Operational Efficiency The DISCOMs purchased excess power of 7524 MUs beyond the approval of RERC. The long-term purchases were not enough to fulfill the demand of power

Welcome message from author
This document is posted to help you gain knowledge. Please leave a comment to let me know what you think about it! Share it to your friends and learn new things together.
Transcript
Chapter II
Performance Audit relating to Government Companies
Ajmer Vidyut Vitran Nigam Limited, Jaipur Vidyut Vitran Nigam Limited and Jodhpur Vidyut Vitran Nigam Limited [
2.1 Power Distribution Utilities
Executive summary
Electricity is an essential requirement for all facets of our life and its supply at reasonable rate to all the sectors is very crucial for sustained economic development. In Rajasthan, distribution of electricity is managed by Ajmer Vidyut Vitran Nigam Limited, Jaipur Vidyut Vitran Nigam Limited and Jodhpur Vidyut Vitran Nigam Limited. As on 31 March 2011, the State had distribution network of 6.33 lakh Circuit Kilometer of lines (33/11 KV and LT), 3498 Sub-Stations and 813808 transformers of various categories. The number of consumers was 95.27 lakh as on 31 March 2011. The turnover of DISCOMs was ���� 21807.49 crore in 2009-10, which was equal to 65.98 per cent and 9.92 per cent of the turnover of State PSUs and State Gross Domestic Product respectively. The DISCOMs employed 41040 employees as on 31 March 2011.
Distribution Network Planning
The increase in distribution capacity could not match the pace of growth in consumer demand, as against the planned additions of 1200 sub-stations during 2006-11, the actual addition was only 1142 sub-stations and further, as compared to the growth of connected load from 11792 MW as on April 2006 to 20857 MW as on March 2011, the increase in transformers capacity was from 11310 MVA to 15469 MVA. In JdVVNL, delay ranging between five and 27 months in completion of 28 sub-stations against scheduled dates of completion as on 31 March 2011 deprived envisaged energy savings of 17.44 MUs valuing ���� 11.37 crore.
Centrally Sponsored Schemes
RGGVY The State Government notified the Rural Electrification Plan with a delay of 18 months. The DISCOMs against the target of electrification of all villages by March 2009 under Rajiv Gandhi Grameen Vidyutikaran Yojna, electrified only 1661
villages out of total 6538 un-electrified villages and further, only 1488 more villages could be electrified by March 2011. JdVVNL departmentally executed the projects in violation of the provisions of scheme which resulted into deprival of subsidy of ���� 2.11 crore for Barmer project and likely deprival of ���� 19.58 crore for four projects of tenth plan.
JdVVNL incurred excess expenditure of ���� 13.05 crore from its own sources during tenth plan while funds released by REC under eleventh plan remained unspent due to slow progress of work. The excess expenditure incurred on the projects of tenth plan were not reimbursed by REC due to failure of JdVVNL to submit closure certificates. This has cost JdVVNL of ���� 3.20 crore on account of interest paid on borrowed funds.
APDRP/R-APDRP The works of ���� 163.62 crore executed by DISCOMs did not match the sanctioned list of the GOI under mandatory and non-mandatory item list as a result the DISCOMs were deprived of the subsidy of ���� 40.91 crore. For implementing SCADA in Jodhpur and Bikaner city, the implementing agency could not achieve the target of ‘Go Live’ by due date. Further, the JdVVNL could ring fence only 19 out of 31 towns, which resulted in undue delay in commencement of activities. The DPRs of the projects were under preparation stage and only ���� 16.35 crore could be utilised (June 2011) against loan funds of ���� 102.63 crore.
Operational Efficiency
The DISCOMs purchased excess power of 7524 MUs beyond the approval of RERC. The long-term purchases were not enough to fulfill the demand of power
Audit Report No.4 for the year ended 31 March 2011
18
in the State and shortage was met from short-term purchases at a higher cost ranging between ���� 3.87 per unit and ���� 7.52 per unit and UI purchases ranging between ���� 3.65 and ���� 9.20 during 2006-11. The DISCOMs also did not maintain the Grid discipline. The energy losses in DISCOMs were in excess than approved by RERC during 2006-07 and 2009-10 by 1386 MUs valuing ���� 751.50 crore. Further, the expenditure on repairs of failed DTRs in JdVVNL increased from ���� 7760 per DTR in 2006-07 to ���� 19952 per DTR in 2009-10 despite no major change in contractual rates of repair. The significant shortfall in addition of capacitor banks and non- repairing of the defective capacitors in JdVVNL led to loss of targeted energy saving of 161.47 MUs valued at ���� 89.59 crore. The JdVVNL could not achieve the targets of vigilance checking and theft detection and further, the targets of assessment in respect of detected cases despite declining trend were not achieved except in 2009-10 and 2010-11.
Financial Management
Inadequate State Government support, non-release of subsidy and non-revision of tariff during the review period worsened the financial position of DISCOMs. The increase in tariff (September 2011) was inadequate to cover the average cost of supply and deficit in subsequent years. As on 31 March 2010, the subsidy receivable from State Government inclusive of revenue deficit was ���� 27612.97 crore. During 2006-10, the DISCOMs incurred cash losses of ���� 33916.88 crore which was overcome mainly by borrowings from commercial banks/financial institutions. The dependence of DISCOMs on borrowed funds increased from ���� 8601.72 crore to ���� 32859.51 crore during 2006-10 and simultaneously, the interest burden also increased from ���� 694.08 crore to ���� 2611.69 crore. The cost of power purchase was more than the revenue realised from sale of power and the percentage of cost to revenue realised increased from 94.15 per cent to 162.43 per cent during 2006-10.
Energy Conservation
The JdVVNL though created ‘Demand Side Management’ cell but the cell remained non-functional since creation and was discontinued in 2006. The JdVVNL did not conduct mandatory Energy Audit from 2007 as was required under Energy Conservation Act, 2001. JdVVNL also did not install meters
at all feeders to achieve the objective of energy accounting.
Further, against the direction of RERC to convert unmetered FRAC into metered category, JdVVNL could not adhere the annual targets and only 9799 FRAC against the target of 20037 were converted into metered category during 2006-10. JdVVNL also could not replace the defective meters within scheduled time and resultantly consumers were billed on average basis
Conclusion and Recommendations
DISCOMs did not prepare plans for capacity additions keeping in view the load growth. The DISCOMs could not achieve the targets/objectives of RGGVY and APDRP/R-APDRP due to deficient planning. Long-term power purchase agreements were not adequate even to meet the demand approved by RERC and power was purchased at high cost through short-term agreements and UI purchases. Sub-transmission and distribution losses in JdVVNL were in excess than approved by RERC. Delay in revision of tariff, inadequate State Government support and supply of power to flat rate agricultural consumers at subsidised rates caused wide gap between revenue realised and cost of power supply which was funded through borrowings from financial institutions. Even after revision of tariff, cross subsidy was non-existent and all categories of consumers were still being supplied power at less than average cost of supply. The targets of vigilance checking and theft detection were not adequate and age-wise analysis of outstanding dues from sale of power and assessment of vigilance reported cases was not proper in JdVVNL which affected the recovery of debts/old debts. Further, JdVVNL did not get done mandatory energy audit under Energy Conservation Act, 2001 and also could not install meters at all feeders to achieve the objective of energy accounting. The review contains eight recommendations which includes financial package for reviving the financials of DISCOMs, ensure timely revision of tariff, adherence to the norms of RERC, timely completion of schemes, re-assessment of targets of vigilance checking and theft detection and to get done energy audit and accounting etc.
Chapter II Performance Audit relating to Government Companies
19
Introduction
2.1.1 Electricity is an essential requirement for all facets of our life. It has been recognized as a basic human need. It is a critical infrastructure on which the socio-economic development of the country depends. Supply of electricity at reasonable rate to rural India is essential for its overall development. Equally important is availability of reliable and quality power at competitive rates to Indian industry to make it globally competitive and to enable it to exploit the tremendous potential of employment generation. Service sector has made significant contribution to the growth of our economy. Availability of quality supply of electricity is very crucial to sustained growth of this segment.
Recognizing that electricity is one of the key drivers for rapid economic growth and poverty alleviation, the nation has set itself the target of providing access to all households in next five years.
Major responsibility for achieving the key parameters of the above said importance of electricity devolves on the distribution sector. Distribution sector is very near to people. Distribution Companies (DISCOMs) are first point of contact in the electricity sector for millions of Indians. This is the sector, which provides electricity to the doorstep of every household. It serves various objectives of electricity sector such as access to electricity for all households, supply of reliable and quality power of specified standards in an efficient manner and at reasonable rates and at the same time protects the consumer interest. To achieve the above objectives, DISCOMs need to make a financial turnaround and they should be commercially viable.
In this review, it is proposed to analyse how far the DISCOMs in Rajasthan planned its operations to achieve above objectives, its financial turnaround and the problems encountered during the last five year period from 2006-07 to 2010-11.
Power sector reforms in Rajasthan
2.1.2 As part of power sector reforms, the erstwhile Rajasthan State Electricity Board (RSEB) was unbundled into five companies namely Rajasthan Rajya Vidyut Utpadan Nigam Limited (RRVUNL), Rajasthan Rajya Vidyut Prasaran Nigam Limited (RRVPNL) and three distribution companies (DISCOMs) viz. Jaipur Vidyut Vitran Nigam Limited (JVVNL), Ajmer Vidyut Vitran Nigam Limited (AVVNL) and Jodhpur Vidyut Vitran Nigam Limited (JdVVNL). All the five companies were incorporated on 19 July 2000 under the Companies Act, 1956 under the administrative control of Department of Energy, Government of Rajasthan (GOR).
Vital parameters of Electricity Supply in Rajasthan
2.1.3 Sale of energy increased from 20036 Million Units (MUs) in 2006-07 to 34449 MUs in 2010-11 registering an increase of 71.94 per cent during the five years period 2006-11. As on 31 March 2011, the State had distribution network of 6.33 lakh Circuit Kilometer (CKM) of lines (33/11 KV and LT),
Audit Report No.4 for the year ended 31 March 2011
20
3498 Sub-Stations and 813808 transformers of various categories. The number of consumers was 95.27 lakh as on 31 March 2011. The turnover of DISCOMs was � 21807.49 crore in 2009-10, which was equal to 65.98 per cent and 9.92 per cent of the turnover of State PSUs and State Gross Domestic Product respectively. The DISCOMs employed 41040 employees as on 31 March 2011.
Performance review on power sector
2.1.4 A comprehensive review on “Transmission and Distribution Losses” was included in the Report of the Comptroller and Auditor General of India (Commercial), Government of Rajasthan for the year ended 31 March 2006. The Report was discussed by COPU in June and August 2008. The recommendations of COPU were awaited (September 2011).
Scope and Methodology of Audit
2.1.5 The present performance audit conducted during February 2011 to June 2011 covers the performance of the JdVVNL during the period from 2006-07 to 2010-11. The review mainly deals with the Network Planning and execution, Implementation of Central Schemes, Operational Efficiency, Financial Management, Consumer Satisfaction, Energy Conservation and Monitoring. The audit examination involved scrutiny of records at the Head Office and three circles1 out of nine circles selected on the basis of the extent of electrification. Further, 13 sub-divisions2 out of 52 sub-divisions of three selected circles were selected for detailed analysis.
The methodology adopted for attaining the audit objectives with reference to audit criteria consisted of explaining audit objectives to top management, scrutiny of records at Head Office and selected units, interaction with the auditee personnel, analysis of data with reference to audit criteria, raising of audit queries, discussion on audit findings with the Management and issue of draft review to the Management for comments.
Audit Objectives
2.1.6 The objectives of the performance audit were to assess whether:
• aims and objectives of National Electricity Policy/Plans were adhered to and distribution reforms were implemented;
• network planning and its execution was adequate and effective;
1 Jodhpur district, Pali and Barmer. 2 Luni, Borunda, Falaudi, Baap (Jodhpur district), CSD-I, CSD-II, Pali (Rural),
Pindwara, Abu Road, Rohat (Pali), Jaislamer (Rural), Pachpadra and Balotra (Barmer).
Chapter II Performance Audit relating to Government Companies
21
• the central schemes such as, Rajiv Gandhi Grameen Vidyutikaran Yojna (RGGVY) and Revised Accelerated Power Development & Reforms Programme (RAPDRP) were implemented efficiently and effectively;
• operational Efficiency was achieved in meeting the power demand of the consumers in the State;
• Financial Management was effective and the subsidy due from Union/ State Government were released in time;
• Aggregate Revenue Requirement (ARR) and tariff revision petition was submitted timely to ensure adequacy of tariff to cover the cost of operations and cross-subsidisation at prescribed level;
• billing and collection of revenue from consumers was efficient;
• effective system was in place to assess consumers satisfaction and redressal of grievances;
• effective energy conservation measures were undertaken; and
• effective monitoring system was in place and the same was being utilised in review of overall working.
Audit Criteria
2.1.7 The audit criteria adopted for assessing the achievement of the audit objectives were:
• National Electricity Plan, Plans and norms concerning distribution network of DISCOMs and Planning criteria fixed by the Rajasthan Electricity Regulatory Commission (RERC);
• Standard procedures for award of contract with reference to principles of economy, efficiency and effectiveness;
• Financial Restructuring Plan (FRP);
• Norms prescribed by various agencies with regard to operational activities;
• Norms of technical and non-technical losses;
• Guidelines/ instructions/ directions of RERC;
• Terms and conditions contained in the Central Scheme Documents;
• Comparison with best performers in the regions/all India averages; and
Audit Report No.4 for the year ended 31 March 2011
22
• Provisions of Electricity Act, 2003.
Audit Findings
2.1.8 An entry conference was held on 10 February 2011 with the State Government and Management of DISCOMs wherein the audit objectives and methodology was discussed. Subsequently, audit findings were reported to the State Government and DISCOMs in July 2011 and discussed in an ‘Exit Conference’ held on 19 September 2011. The Exit Conference was attended by Energy Secretary (GOR), Chairman and Managing Director (JVVNL) and Managing Director (JdVVNL). The DISCOMs replied to audit findings in September 2011. The views expressed by them have been considered while finalising this review. The audit findings are discussed in the subsequent paragraphs.
Distribution Network Planning
2.1.9 The National Electricity Policy was evolved with the following aims and objectives to be achieved.
• Access to electricity –Available for all household in next five years from 2005.
• Supply of reliable and quality power of specified standards in an efficient manner and reasonable rates.
To ensure power to all, the Power Distribution Companies in the State are required to prepare long term plan & annual plan for creation of infrastructural facilities for efficient distribution of electricity so as to cover maximum population in the State. Besides the upkeep of the existing network, additions in distribution network are planned keeping in view the demand/ connected load, anticipated new connections and growth in demand based on Electric Power Survey (EPS). Considering physical parameters, Capital Investment Plans are submitted to the State Government/RERC. The major components of the outlay include normal development and system improvement besides rural electrification and strengthening of IT enabled systems.
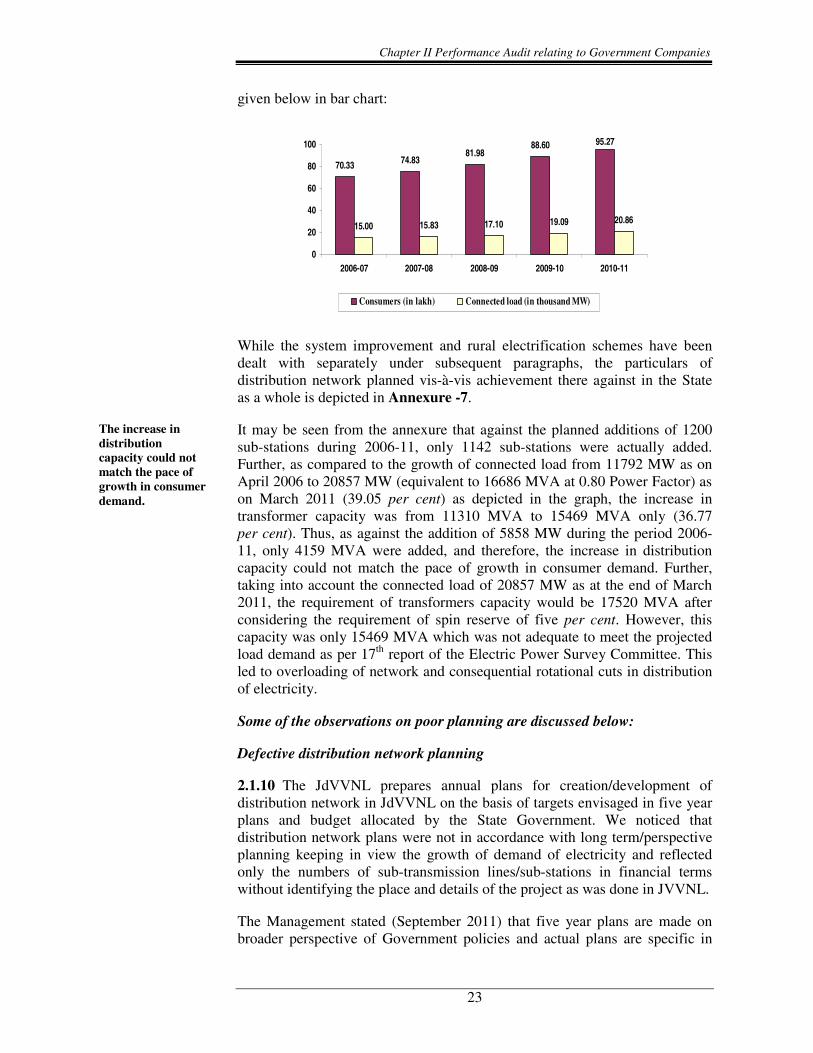
The particulars of consumers and their connected load during review period is
Chapter II Performance Audit relating to Government Companies
23
given below in bar chart:
70.33 74.8381.98
88.60 95.27
15.00 15.83 17.10 19.09 20.86
0
20
40
60
80
100
2006-07 2007-08 2008-09 2009-10 2010-11
Consumers (in lakh) Connected load (in thousand MW)
While the system improvement and rural electrification schemes have been dealt with separately under subsequent paragraphs, the particulars of distribution network planned vis-à-vis achievement there against in the State as a whole is depicted in Annexure -7.
It may be seen from the annexure that against the planned additions of 1200 sub-stations during 2006-11, only 1142 sub-stations were actually added. Further, as compared to the growth of connected load from 11792 MW as on April 2006 to 20857 MW (equivalent to 16686 MVA at 0.80 Power Factor) as on March 2011 (39.05 per cent) as depicted in the graph, the increase in transformer capacity was from 11310 MVA to 15469 MVA only (36.77 per cent). Thus, as against the addition of 5858 MW during the period 2006-11, only 4159 MVA were added, and therefore, the increase in distribution capacity could not match the pace of growth in consumer demand. Further, taking into account the connected load of 20857 MW as at the end of March 2011, the requirement of transformers capacity would be 17520 MVA after considering the requirement of spin reserve of five per cent. However, this capacity was only 15469 MVA which was not adequate to meet the projected load demand as per 17th report of the Electric Power Survey Committee. This led to overloading of network and consequential rotational cuts in distribution of electricity.
Some of the observations on poor planning are discussed below:
Defective distribution network planning
2.1.10 The JdVVNL prepares annual plans for creation/development of distribution network in JdVVNL on the basis of targets envisaged in five year plans and budget allocated by the State Government. We noticed that distribution network plans were not in accordance with long term/perspective planning keeping in view the growth of demand of electricity and reflected only the numbers of sub-transmission lines/sub-stations in financial terms without identifying the place and details of the project as was done in JVVNL.
The Management stated (September 2011) that five year plans are made on broader perspective of Government policies and actual plans are specific in
The increase in distribution capacity could not match the pace of growth in consumer demand.
Audit Report No.4 for the year ended 31 March 2011
24
terms of works, financial tie-up, identified/sanctioned as per the actual pending demand of the area and expected future load growth. The fact remains that the State Government allots budget in accordance with the perspective plans of planning commission in financial terms only for JdVVNL as a whole and the plans prepared by JdVVNL also indicated the likely expenditure in financial terms.
Inadequate transformation capacity
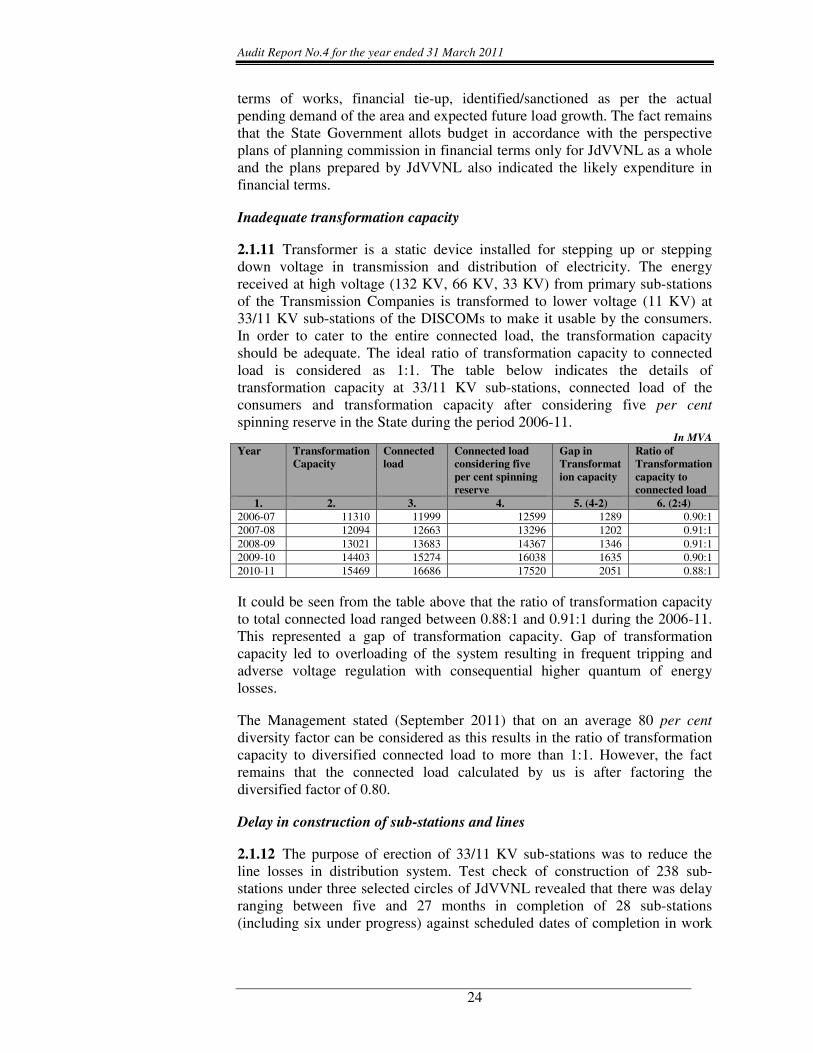
2.1.11 Transformer is a static device installed for stepping up or stepping down voltage in transmission and distribution of electricity. The energy received at high voltage (132 KV, 66 KV, 33 KV) from primary sub-stations of the Transmission Companies is transformed to lower voltage (11 KV) at 33/11 KV sub-stations of the DISCOMs to make it usable by the consumers. In order to cater to the entire connected load, the transformation capacity should be adequate. The ideal ratio of transformation capacity to connected load is considered as 1:1. The table below indicates the details of transformation capacity at 33/11 KV sub-stations, connected load of the consumers and transformation capacity after considering five per cent spinning reserve in the State during the period 2006-11.
In MVA Year Transformation
Capacity Connected load
Connected load considering five per cent spinning reserve
Gap in Transformation capacity
Ratio of Transformation capacity to connected load
1. 2. 3. 4. 5. (4-2) 6. (2:4) 2006-07 11310 11999 12599 1289 0.90:1 2007-08 12094 12663 13296 1202 0.91:1 2008-09 13021 13683 14367 1346 0.91:1 2009-10 14403 15274 16038 1635 0.90:1 2010-11 15469 16686 17520 2051 0.88:1
It could be seen from the table above that the ratio of transformation capacity to total connected load ranged between 0.88:1 and 0.91:1 during the 2006-11. This represented a gap of transformation capacity. Gap of transformation capacity led to overloading of the system resulting in frequent tripping and adverse voltage regulation with consequential higher quantum of energy losses.
The Management stated (September 2011) that on an average 80 per centdiversity factor can be considered as this results in the ratio of transformation capacity to diversified connected load to more than 1:1. However, the fact remains that the connected load calculated by us is after factoring the diversified factor of 0.80.
Delay in construction of sub-stations and lines
2.1.12 The purpose of erection of 33/11 KV sub-stations was to reduce the line losses in distribution system. Test check of construction of 238 sub-stations under three selected circles of JdVVNL revealed that there was delay ranging between five and 27 months in completion of 28 sub-stations (including six under progress) against scheduled dates of completion in work
Chapter II Performance Audit relating to Government Companies
25
orders as on 31 March 2011. Delay in construction of sub-stations deprived the JdVVNL of envisaged energy savings of 17.44 MUs valuing � 11.37 crore.
The Management stated (September 2011) that delay was attributed to factors beyond the control of JdVVNL viz. acquisition of land, right of way, availability of labour, material and local resistance. The reasons stated by Management for delay are not correct as in case of sub-stations there are no issues pertaining to acquisition of land, right of way and local resistance and the work orders are awarded only after resolving these issues. The time period for any pending issue is considered at planning stage itself.
Implementation of Centrally Sponsored Schemes
Rural Electrification
2.1.13 The National Electricity Policy states that the key objective of development of the power sector is to supply electricity to all areas including rural areas for which the GOI and the State Governments would jointly endeavour to achieve this objective. Accordingly, the Rajiv Gandhi Grameen Vidyutikaran Yojana (RGGVY) was launched in April 2005, which aimed at providing access to electricity for all households in five years for which the GOI provides 90 per cent capital subsidy.
Besides, the GOI notified the Rural Electrification Policy (REP) in August 2006. The REP inter-alia aims at providing access to electricity for all households by 2009 and Minimum lifeline consumption of one unit per household per day as a merit good by the year 2012. The other Rural Electrification (RE) schemes viz., Accelerated Electrification of one lakh villages and one crore household and Minimum Needs Programme were merged into RGGVY. The features of the erstwhile ‘Kutir Jyoti Programme’ were also suitably integrated into this scheme.
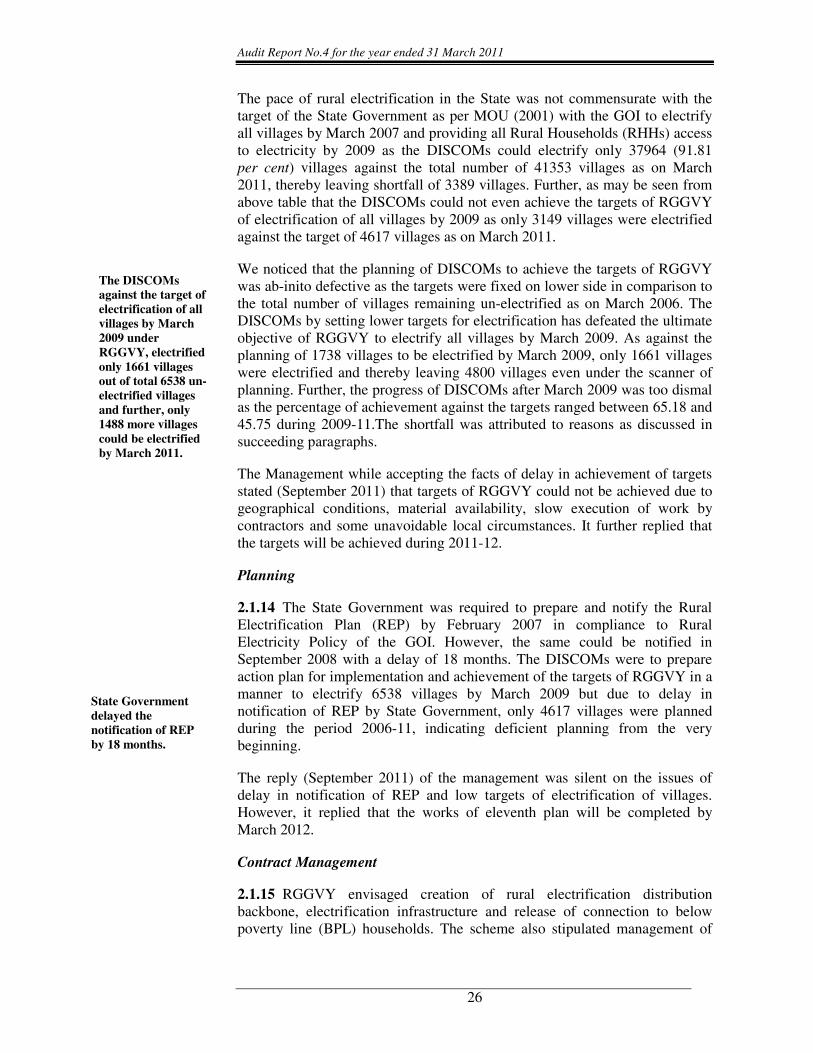
As on 31 March 2006, out of 41353 villages in the State (as per 2001 Census), 34815 villages were electrified (84.19 per cent). The year-wise target vis-à-vis achievement of electrification under the RGGVY scheme during the review period is shown in the table below:
Year Electrified at the beginning of the year
Targeted for electrification during the year
Electrified during the year
Electrified at the end of the year
Percentage of achievement against target during the year
2006-07 34815 1051 831 35646 79.07 2007-08 35646 407 479 36125 117.69 2008-09 36125 280 351 36476 125.36 2009-10 36476 1146 747 37223 65.18 2010-11 37223 1733 741 37964 42.75
Audit Report No.4 for the year ended 31 March 2011
26
The pace of rural electrification in the State was not commensurate with the target of the State Government as per MOU (2001) with the GOI to electrify all villages by March 2007 and providing all Rural Households (RHHs) access to electricity by 2009 as the DISCOMs could electrify only 37964 (91.81 per cent) villages against the total number of 41353 villages as on March 2011, thereby leaving shortfall of 3389 villages. Further, as may be seen from above table that the DISCOMs could not even achieve the targets of RGGVY of electrification of all villages by 2009 as only 3149 villages were electrified against the target of 4617 villages as on March 2011.
We noticed that the planning of DISCOMs to achieve the targets of RGGVY was ab-inito defective as the targets were fixed on lower side in comparison to the total number of villages remaining un-electrified as on March 2006. The DISCOMs by setting lower targets for electrification has defeated the ultimate objective of RGGVY to electrify all villages by March 2009. As against the planning of 1738 villages to be electrified by March 2009, only 1661 villages were electrified and thereby leaving 4800 villages even under the scanner of planning. Further, the progress of DISCOMs after March 2009 was too dismal as the percentage of achievement against the targets ranged between 65.18 and 45.75 during 2009-11.The shortfall was attributed to reasons as discussed in succeeding paragraphs.
The Management while accepting the facts of delay in achievement of targets stated (September 2011) that targets of RGGVY could not be achieved due to geographical conditions, material availability, slow execution of work by contractors and some unavoidable local circumstances. It further replied that the targets will be achieved during 2011-12.
Planning
2.1.14 The State Government was required to prepare and notify the Rural Electrification Plan (REP) by February 2007 in compliance to Rural Electricity Policy of the GOI. However, the same could be notified in September 2008 with a delay of 18 months. The DISCOMs were to prepare action plan for implementation and achievement of the targets of RGGVY in a manner to electrify 6538 villages by March 2009 but due to delay in notification of REP by State Government, only 4617 villages were planned during the period 2006-11, indicating deficient planning from the very beginning.
The reply (September 2011) of the management was silent on the issues of delay in notification of REP and low targets of electrification of villages. However, it replied that the works of eleventh plan will be completed by March 2012.
Contract Management
2.1.15 RGGVY envisaged creation of rural electrification distribution backbone, electrification infrastructure and release of connection to below poverty line (BPL) households. The scheme also stipulated management of
The DISCOMs against the target of electrification of all villages by March 2009 under RGGVY, electrified only 1661 villages out of total 6538 un-electrified villages and further, only 1488 more villages could be electrified by March 2011.
State Government delayed the notification of REP by 18 months.
Chapter II Performance Audit relating to Government Companies
27
rural distribution through franchisee and deciding bulk supply tariff for revenue sustainability.
Rural Electrification Corporation (REC) sanctioned 14 projects during the period 2004-2009 under RGGVY in tenth and eleventh plan to electrify 1742 villages and to release 5.10 lakh connections to BPL/RHHs at an estimated cost of � 444.59 crore.
We observed following deficiencies in implementation of the projects:
Execution of work in violation of provisions of scheme
2.1.16 As per the guidelines of projects approved by REC under tenth plan, projects were to be executed on turnkey basis. We noticed that the JdVVNL executed the Barmer project (� 2.34 crore) on departmental basis without prior permission of REC and consequently, REC had withdrawn (October 2008) sanction of � 2.50 crore for the project. The amount of � 75.02 lakh released for tender invitation was adjusted in other three projects. Further, in seven other projects sanctioned by REC under tenth plan, the JdVVNL also departmentally executed the work of releasing connections to BPL households at a cost of � 19.58 crore3 despite knowing the fact of withdrawal of sanction of Barmer project.
Thus, departmental execution of Barmer project in violation of the provisions of scheme without prior permission of REC had resulted in deprival of subsidy of � 2.11 crore (being 90 per cent of cost of execution � 2.34 crore) and likely deprival of � 19.58 crore for four projects of tenth plan.
The Management stated (September 2011) that no turnkey contractor turned up even after five times of re-tendering in Barmer district and after withdrawal of the scheme by REC, the works were executed under State Rural Electrification Programme. It further, stated that release of BPL connections in seven projects was made on turnkey basis by the circle Superintending Engineers. The reply is not convincing as JdVVNL did not obtain the prior concurrence of REC for departmental execution which led to withdrawal of subsidy and had to execute the works from borrowed funds. Further, the reply regarding releasing of BPL connections on turnkey basis is factually not correct as the circle offices awarded the work on central labour rate contract.
Delay due to awarding of work to defaulting firms
2.1.17 The JdVVNL invited tenders for turnkey contracts on two part basis i.e. technical and price part. Technical analysis included proven track record of satisfactory completion of work by the firm. In the following cases, the JdVVNL failed to analyze the technical part of the bids and did not observe tender parameter which led to awarding of work to defaulting firms and resultantly failure in adherence of scheduled target dates of the scheme.
3 Departmental cost of execution of only four projects as the finalization of three
projects was pending (July 2011).
JdVVNL departmentally executed the projects in violation of the provisions of scheme which resulted into deprival of subsidy of ���� 2.11 crore for Barmer project and likely deprival of ���� 19.58 crore for four projects of tenth plan.
Audit Report No.4 for the year ended 31 March 2011
28
(a) The JdVVNL awarded (June 2008) the work of infrastructure creation/development for Sriganganagar and Hanumangarh projects to KLG Systel Limited (firm) with scheduled date of completion May 2009 and April 2009 respectively. We noticed that the firm was having proven track record of disrepute in earlier contract of ‘Loss Diagnostic Study’ (December 2001) wherein final notice for termination was issued (August 2007) and the contract was terminated (January 2009) due to non-response and delay in work.
Owing to slow progress in the work of project implementation of rural electrification in Sriganganagar and Hanumangarh, the contract termination notice was served in December 2010 when work amounting to ��16.45 crore (60.93 per cent) and � 12.69 crore (43.99 per cent) respectively remained unexecuted. The JdVVNL was to recover liquidated damages of � 1.46 crore on both projects at the rate of five per cent as per the provisions of work order and general condition of contract. The contract was terminated in January 2011 and the work was awarded (May 2011) to another firm with scheduled completion in November 2011 and consequently, the work was delayed by 30 months.
(b) Similarly, the JdVVNL awarded (August 2010) the work of release of 67000 connections to BPL households in Barmer with schedule of completion by May 2011 to Dee Control Limited (Firm) despite knowing the fact that it did not perform contractual obligations in earlier contract (June 2009) of installation of packaged DTR at Mount Abu sub-division and final contract termination notice was served in May 2010 due to poor progress of work. Further, the performance of the firm was also not satisfactory in implementation of RGGVY awarded (May 2008) to it by JVVNL.
We noticed that the JdVVNL allotted (October 2010) a list of 7784 consumers based on the work done by the Power Grid Corporation of India Limited. However, the firm was able to carry out the work only for 4412 connections upto March 2011. Thereafter, the firm did not turn up for the remaining work and resultantly, the target of 67000 connections by May 2011 could not be achieved by the JdVVNL. The contract was terminated in April 2011 and was re-awarded (June 2011) to another firm with schedule of completion by September 2011. Thus, awarding contract to a firm having poor performance in earlier contract resulted in non-achievement of target.
Certificate of electrification
2.1.18 RGGVY guidelines provided submission of a certificate duly signed by the Sarpanch, Executive of the JdVVNL and the executing agency, witnessed by the domestic consumers of the concerned villages declaring that the village has been electrified as per the definition of the electrification. In addition a photograph of the sign board of the scheme in the electrified villages was also to be provided to REC.
We noticed that out of 698 villages electrified upto 2007-08 in tenth plan, certificates for 461 villages were submitted whereas sign-boards in 509 villages could only be installed by January 2011. Similarly, out of 506 villages
Chapter II Performance Audit relating to Government Companies
29
electrified in eleventh plan, certificates submitted and sign-boards were installed in 101 and 11 villages respectively.
Thus, failure of management to ensure the compliance of certificate and sign-boards requirement at the time of the execution of work by the contractor resulted in delay in submission of closure report of the projects.
The Management while accepting the facts stated (September 2011) that GOI had extended the tenth and eleventh plan schemes upto November 2011 and the efforts are being made to obtain pending certificates and install signboards upto scheduled date.
Financial Performance
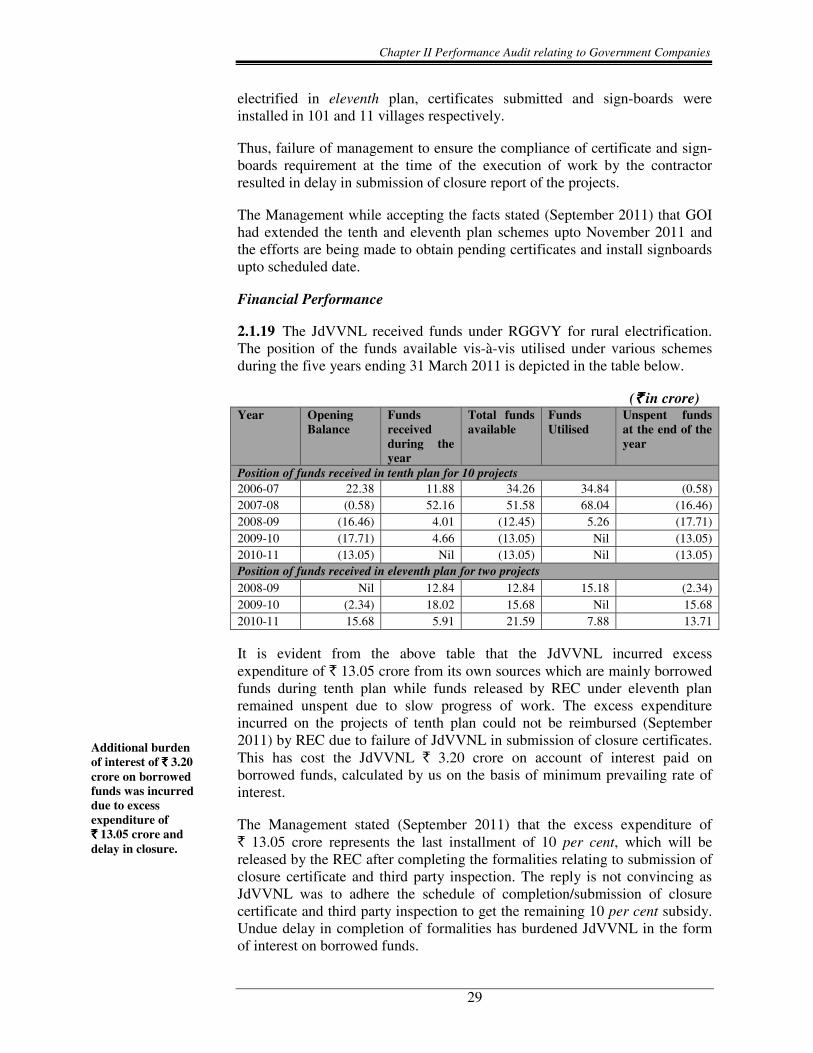
2.1.19 The JdVVNL received funds under RGGVY for rural electrification. The position of the funds available vis-à-vis utilised under various schemes during the five years ending 31 March 2011 is depicted in the table below.
(���� in crore) Year Opening
Balance Funds received during the year
Total funds available
Funds Utilised
Unspent funds at the end of the year
Position of funds received in tenth plan for 10 projects 2006-07 22.38 11.88 34.26 34.84 (0.58) 2007-08 (0.58) 52.16 51.58 68.04 (16.46) 2008-09 (16.46) 4.01 (12.45) 5.26 (17.71) 2009-10 (17.71) 4.66 (13.05) Nil (13.05) 2010-11 (13.05) Nil (13.05) Nil (13.05) Position of funds received in eleventh plan for two projects 2008-09 Nil 12.84 12.84 15.18 (2.34) 2009-10 (2.34) 18.02 15.68 Nil 15.68 2010-11 15.68 5.91 21.59 7.88 13.71
It is evident from the above table that the JdVVNL incurred excess expenditure of � 13.05 crore from its own sources which are mainly borrowed funds during tenth plan while funds released by REC under eleventh plan remained unspent due to slow progress of work. The excess expenditure incurred on the projects of tenth plan could not be reimbursed (September 2011) by REC due to failure of JdVVNL in submission of closure certificates. This has cost the JdVVNL � 3.20 crore on account of interest paid on borrowed funds, calculated by us on the basis of minimum prevailing rate of interest.
The Management stated (September 2011) that the excess expenditure of � 13.05 crore represents the last installment of 10 per cent, which will be released by the REC after completing the formalities relating to submission of closure certificate and third party inspection. The reply is not convincing as JdVVNL was to adhere the schedule of completion/submission of closure certificate and third party inspection to get the remaining 10 per cent subsidy. Undue delay in completion of formalities has burdened JdVVNL in the form of interest on borrowed funds.
Additional burden of interest of ���� 3.20 crore on borrowed funds was incurred due to excess expenditure of ���� 13.05 crore and delay in closure.
Audit Report No.4 for the year ended 31 March 2011
30
Quality control and monitoring issues in implementation of RGGVY
2.1.20 The various deficiencies noticed by us in respect of quality control and monitoring issues are as below:
• Variations of � 1.82 crore in material at site and material verified at Jodhpur District circle was reported (October 2009) by third party inspection agency. However, the JdVVNL did not reconcile the variation till July 2011.
• Despite directions of REC, the JdVVNL did not appoint a nodal officer for overall supervision and effective monitoring of works. Further, circle offices also did not submit reports as regards quality and quantum of work executed by contractors as per REC specification/standards in respect of villages declared electrified, which led to delay in completion of projects.
The Management while accepting the facts stated (September 2011) that the reconciliation work is under progress.
Restructured Accelerated Power Development Reforms Programme
2.1.21 The GOI approved the Accelerated Power Development Reforms Programme (APDRP) to leverage the reforms in power sector through the State Governments. This scheme was implemented by the power sector companies through the State Government with the objective of up-gradation of sub-transmission and distribution system including energy accounting and metering, for which financial support was provided by the GOI.
In order to carry on the reforms further, the GOI launched the Restructured APDRP (R-APDRP) in July 2008 as a Central Sector Scheme for XI Plan. The R-APDRP scheme comprises of Part A and B. Part A was dedicated to establishment of IT enabled system for achieving reliable and verifiable baseline data system in all towns besides installation of SCADA4/Distribution Management System. For this, 100 per cent loan is provided, and was convertible into grant on completion and verification of same by Third Party independent evaluating agencies. The Part B of the scheme deals with strengthening of regular sub-transmission & distribution system and up-gradation of projects.
Financial Performance
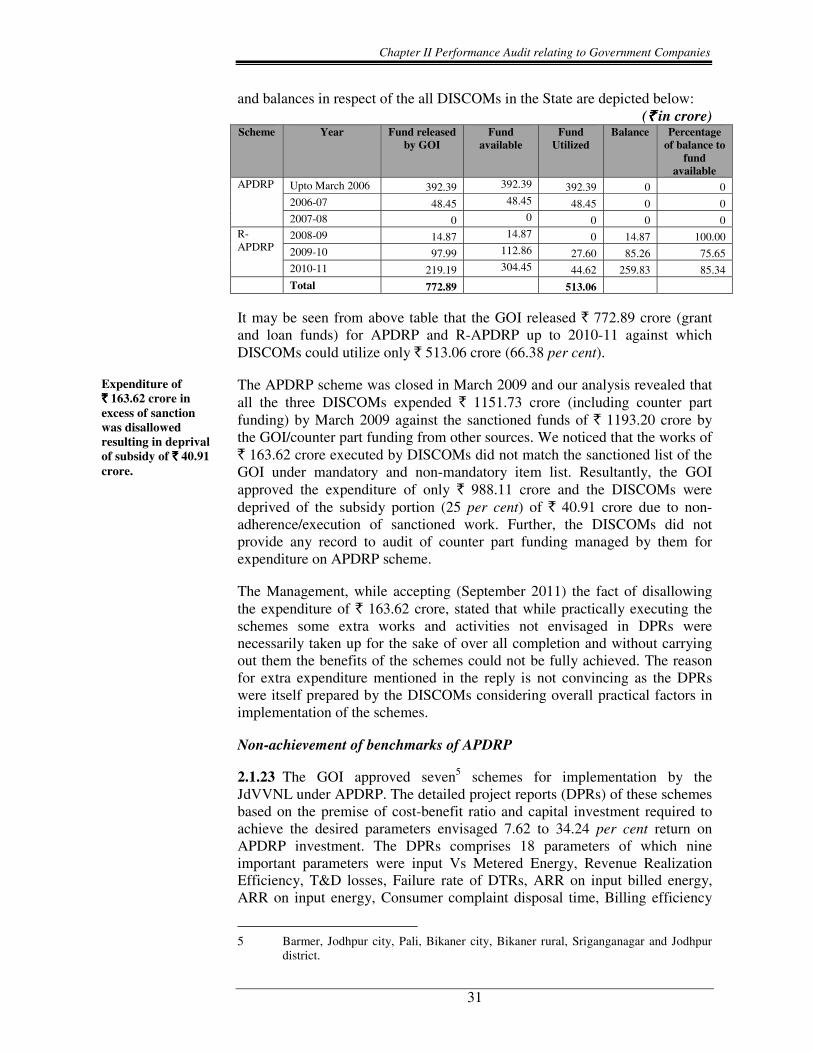
2.1.22 The details of the funds released by the GOI, mobilized from other agencies (including REC/PFC/Commercial Banks), utilisation there against
4 Supervisory Control And Data Acquisition – It generally refers to industrial control
systems: computer systems that monitor and control industrial, infrastructure or facility-based processes.
Chapter II Performance Audit relating to Government Companies
31
and balances in respect of the all DISCOMs in the State are depicted below: (���� in crore)
Scheme Year Fund released by GOI
Fund available
Fund Utilized
Balance Percentage of balance to
fund available
APDRP Upto March 2006 392.39 392.39 392.39 0 0 2006-07 48.45 48.45 48.45 0 0 2007-08 0 0 0 0 0
R-APDRP
2008-09 14.87 14.87 0 14.87 100.00 2009-10 97.99 112.86 27.60 85.26 75.65 2010-11 219.19 304.45 44.62 259.83 85.34 Total 772.89 513.06
It may be seen from above table that the GOI released � 772.89 crore (grant and loan funds) for APDRP and R-APDRP up to 2010-11 against which DISCOMs could utilize only � 513.06 crore (66.38 per cent).
The APDRP scheme was closed in March 2009 and our analysis revealed that all the three DISCOMs expended � 1151.73 crore (including counter part funding) by March 2009 against the sanctioned funds of � 1193.20 crore by the GOI/counter part funding from other sources. We noticed that the works of � 163.62 crore executed by DISCOMs did not match the sanctioned list of the GOI under mandatory and non-mandatory item list. Resultantly, the GOI approved the expenditure of only � 988.11 crore and the DISCOMs were deprived of the subsidy portion (25 per cent) of � 40.91 crore due to non-adherence/execution of sanctioned work. Further, the DISCOMs did not provide any record to audit of counter part funding managed by them for expenditure on APDRP scheme.
The Management, while accepting (September 2011) the fact of disallowing the expenditure of � 163.62 crore, stated that while practically executing the schemes some extra works and activities not envisaged in DPRs were necessarily taken up for the sake of over all completion and without carrying out them the benefits of the schemes could not be fully achieved. The reason for extra expenditure mentioned in the reply is not convincing as the DPRs were itself prepared by the DISCOMs considering overall practical factors in implementation of the schemes.
Non-achievement of benchmarks of APDRP
2.1.23 The GOI approved seven5 schemes for implementation by the JdVVNL under APDRP. The detailed project reports (DPRs) of these schemes based on the premise of cost-benefit ratio and capital investment required to achieve the desired parameters envisaged 7.62 to 34.24 per cent return on APDRP investment. The DPRs comprises 18 parameters of which nine important parameters were input Vs Metered Energy, Revenue Realization Efficiency, T&D losses, Failure rate of DTRs, ARR on input billed energy, ARR on input energy, Consumer complaint disposal time, Billing efficiency
5 Barmer, Jodhpur city, Pali, Bikaner city, Bikaner rural, Sriganganagar and Jodhpur
district.
Expenditure of ���� 163.62 crore in excess of sanction was disallowed resulting in deprival of subsidy of ���� 40.91 crore.
Audit Report No.4 for the year ended 31 March 2011
32
and Metering efficiency. All the parameters were to be achieved by March 2005. A study of efficiency achievement of these nine important parameters in four circles/town6 revealed that Revenue realization efficiency was achieved by one circle (Sriganganagar), Consumer complaint disposal time by one circle (Barmer), ARR on billed energy was accomplished by two circles (Pali and Sriganganagar) and ARR input energy was achieved by two circles (Barmer and Sriganganagar). In addition to this, only two parameters of Consumer complaint disposal time (Pali, Bikaner city and Sriganganagar) and ARR on billed energy (Bikaner City) could be achieved by closure of APDRP in 2008-09.
We observed that the JdVVNL failed to implement the scheme effectively as it could not achieve the desired objectives in the form of parameters. Further, there was no monitoring of scheme after 2008-09 to assess the sustainability of improvement. We also observed that there was no mechanism to ensure the recoupment of expenditure as envisaged in DPRs and non-achievement of benchmarks shows that the expenditure was not recouped as was desired from the scheme.
The Management in its reply (September 2011) did not address the issues mentioned in the paragraph and stated that reduction in AT&C losses was sufficient to establish the sustainability of APDRP. However, the fact of reduction in AT&C losses due to rightful implementation of APDRP scheme was also not fully correct as there were other reasons for reduction viz. feeder renovation programme.
Establishment of IT enabled system
2.1.24 Part-A of the R-APDRP scheme is dedicated to establishment of IT enabled system and SCADA/Distribution Management System. It provided for conversion of 100 per cent initially disbursed loan funds by the GOI into subsidy on completion and verification of the project by an independent agency within three years from the date of sanction, failing which no conversion of loan into subsidy would be made.
The GOI sanctioned (February 2009) funds of � 100.36 crore for establishment of IT enabled system in 31 towns and � 56.73 crore (April/June 2010) for implementing SCADA in Jodhpur and Bikaner city. The JdVVNL appointed HCL Infosystem (September 2009) as the IT implementing agency for IT enabled system. The agency was to accomplish the target of ‘Go Live’ in respect of Jodhpur city (selected as pilot city) by September 2010 (re-scheduled to December 2010) and for all the 31 towns by March 2011. We noticed that the agency could not even achieve the target (July 2011) of ‘Go Live’ for pilot city. Further, the activity wise milestone submitted (January 2011) to PFC revealed that only 15 activities out of 111 activities have been completed.
Thus, it could be seen that the progress of the work of IT implementing is very slow and in case of non-adherence to the requirement of third party inspection
6 Barmer, Pali, Bikaner city and Sriganganagar.
Chapter II Performance Audit relating to Government Companies
33
which was to be undertaken after achieving the target of ‘Go Live’ in respect of all 31 cities, the possibilities of conversion of loan funds into grant seems remote.
The Management while accepting the facts stated (September 2011) that the project is being monitored at apex level and target date of 24 September 2011 is being given to HCL for achieving the target of ‘Go Live’ in respect of three pilot towns.
Strengthening of sub-transmission and distribution system
2.1.25 The focus in this part was on reduction of Aggregate Technical & Commercial (AT&C) losses on sustainable basis. 25 per cent loan is to be provided and up to 50 per cent of scheme cost is convertible to grant depending on extent of maintaining AT&C loss level at 15 per cent level for five years. The scheme stipulated that activities under Part-B will commence after ring fencing of project towns and verification of the starting figure of AT&C loss of the project area by independent agency appointed by MOP.
The GOI sanctioned (June/August 2010) � 684.17 crore for implementing works relating to this part in 31 towns. Sixty per cent (� 102.63 crore) of loan funds was released (June 2010).
We noticed that the JdVVNL could ring fence (September 2011) only 19 towns out of 31 towns as reported by third party inspection and evaluation agency which resulted in undue delay in commencement of activities under this part. It was also noticed that DPRs of the projects were under preparation stage and only � 16.35 crore could be utilized so far (June 2011).
The Management while accepting the facts stated (September 2011) that ring fencing of the remaining towns will be completed by December 2011.
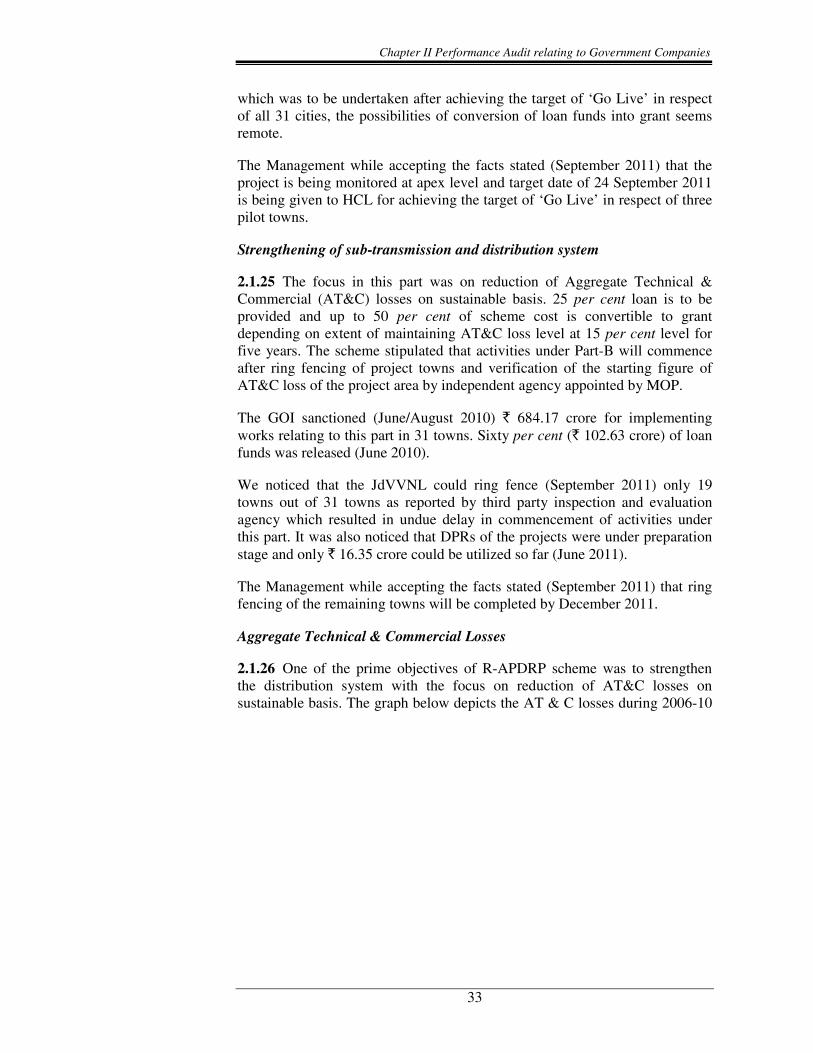
Aggregate Technical & Commercial Losses
2.1.26 One of the prime objectives of R-APDRP scheme was to strengthen the distribution system with the focus on reduction of AT&C losses on sustainable basis. The graph below depicts the AT & C losses during 2006-10
Audit Report No.4 for the year ended 31 March 2011
34
in the JdVVNL.
34.54
32.98
30.0631.43
20.00
22.00
24.00
26.00
28.00
30.00
32.00
34.00
36.00
2006-07 2007-08 2008-09 2009-10
AT & C Losses
It may be seen from the above graph that the AT&C losses in the JdVVNL decreased from 34.54 to 30.06 per cent during 2006-07 to 2008-09 but again increased to 31.43 per cent in 2009-10.
The Management did not accept (September 2011) the AT&C losses and stated the same as 32.37, 31.15, 28.73 and 29.13 per cent during 2006-07 to 2009-10 respectively. The reply of the Management does not consider the change in debtors position which is also to be accounted in calculating AT&C losses as prescribed under APDRP/R-APDRP schemes.
Operational efficiency
2.1.27 The operational performance of the DISCOM is judged on the basis of availability of adequate power for distribution, adequacy and reliability of distribution network, minimizing line losses, detection of theft of electricity, etc. These aspects have been discussed below:
Purchase of Power
2.1.28 The demand for energy has been increasing year after year in the State due to economic development. Assessment of future demand and requirement of power is assessed on the basis of past consumption trends, present requirement, load growth trends and T & D losses. RERC approves the sources of purchase of power and the purchase cost based on the estimates made in the ARR.
After unbundling (19 July 2000) of erstwhile RSEB into five separate companies, RRVPNL played the role of single buyer for purchase of power in the State. The Electricity Act, 2003 (effective from June 2003) required power trading to be a distinct activity from the State Transmission Utility and State
Chapter II Performance Audit relating to Government Companies
35
Load Dispatch Centre within one year. Accordingly, Rajasthan Power Procurement Cell (RPPC) was constituted (April 2004) for purchase of power for the DISCOMs. The RPPC was renamed (April 2009) as Rajasthan Discoms Power Procurement Cell (RDPPC).
We noticed that the co-ordination committee of Rajasthan Power Sector Companies initially decided to manage the function of RPPC by RRVPNL as the DISCOMs were not having experience and expertise to manage the activities of power procurement and thereafter planned independent management and full control of power trading activities by respective DISCOMs from April 2006 onwards. However, RRVPNL continued power procurement activities till March 2009.
We observed that the mandate of the Act was delayed by more than four years resulting in dilution of accountability and responsibility within RPPC due to collective ownership. Further, DISCOMs could not gear up for managing their operations under emerging power market structure.
The Management stated (September 2011) that the work of power purchase and load management was transferred from RRVPNL to DISCOMs, slowly and smoothly to avoid any mismanagement in demand and supply and inconvenience to consumers as the DISCOMs were not fully acquainted with the load management. However, the fact remains that the mandate of Electricity Act, 2003 was delayed by more than four years.
Non-implementation of intra state availability based tariff (ABT)
2.1.29 Considering the limited benefits of inter-state ABT and to overcome the problem of huge peak power shortage experienced by majority of the State utilities, NEP 2005 recommended SERCs to implement intra-state ABT at the State level within one year. Accordingly, RERC issued (August 2006) regulations on intra-state ABT.
We noticed that RRVPNL issued (March 2008) directions for commencement of commercial operations at RPPC on intra-state mechanism after successful mock exercise. However, the directions were not adhered and the Co-ordination Committee deferred (February 2009) operations on intra-state mechanism due to lack of preparation, absence of infrastructure, trained staff etc.
The Management while accepting the facts stated (September 2011) that inter DISCOM billing is being done by JVVNL, AVVNL and JdVVNL as per over drawl. However, the reply was silent on the planning and implementation of intra-state ABT.
Quantification of Power Purchased
2.1.30 The details of demand of power assessed for the State based on the 17th
Electric Power Survey (EPS), purchase of power approved by RERC and actual power purchased during the period 2006-07 to 2010-11 in respect of the
Audit Report No.4 for the year ended 31 March 2011
36
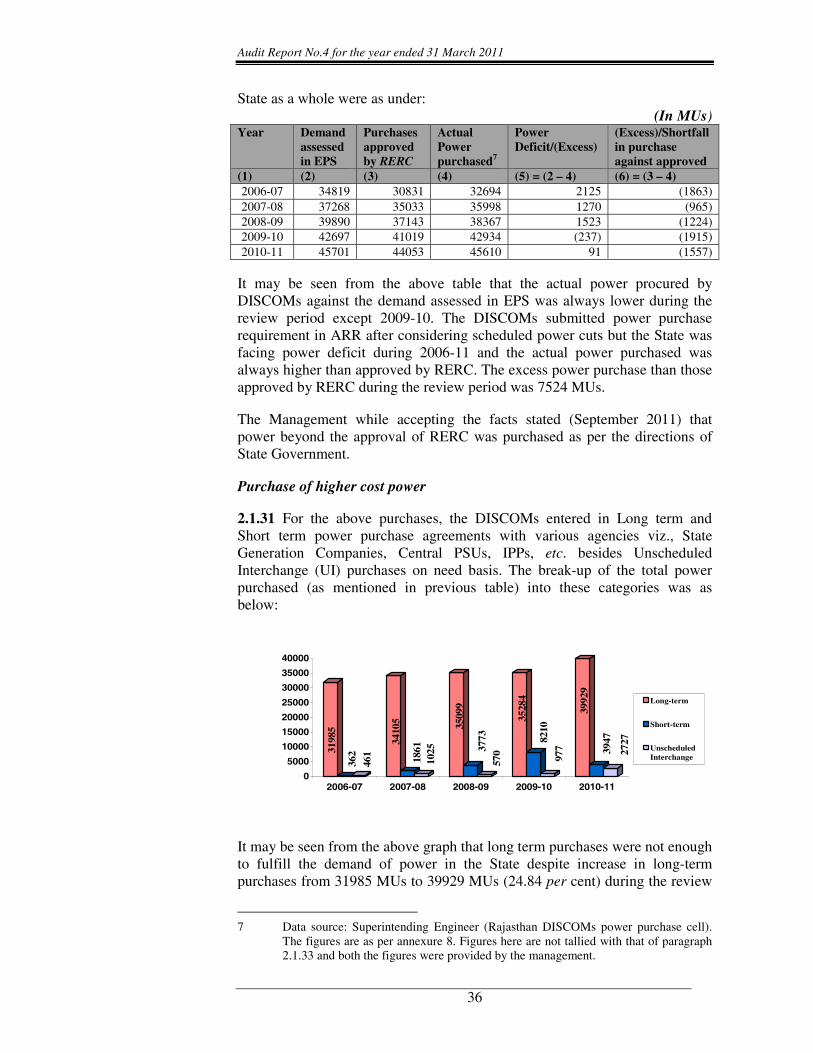
State as a whole were as under: (In MUs)
Year Demand assessed in EPS
Purchases approved by RERC
Actual Power purchased7
Power Deficit/(Excess)
(Excess)/Shortfall in purchase against approved
(1) (2) (3) (4) (5) = (2 – 4) (6) = (3 – 4) 2006-07 34819 30831 32694 2125 (1863) 2007-08 37268 35033 35998 1270 (965) 2008-09 39890 37143 38367 1523 (1224) 2009-10 42697 41019 42934 (237) (1915) 2010-11 45701 44053 45610 91 (1557)
It may be seen from the above table that the actual power procured by DISCOMs against the demand assessed in EPS was always lower during the review period except 2009-10. The DISCOMs submitted power purchase requirement in ARR after considering scheduled power cuts but the State was facing power deficit during 2006-11 and the actual power purchased was always higher than approved by RERC. The excess power purchase than those approved by RERC during the review period was 7524 MUs.
The Management while accepting the facts stated (September 2011) that power beyond the approval of RERC was purchased as per the directions of State Government.
Purchase of higher cost power
2.1.31 For the above purchases, the DISCOMs entered in Long term and Short term power purchase agreements with various agencies viz., State Generation Companies, Central PSUs, IPPs, etc. besides Unscheduled Interchange (UI) purchases on need basis. The break-up of the total power purchased (as mentioned in previous table) into these categories was as below:
3198
5
362
461
3410
5
1861
1025
3509
9
3773
570
3528
4
8210
977
3992
9
3947
2727
0
5000
10000
15000
20000
25000
30000
35000
40000
2006-07 2007-08 2008-09 2009-10 2010-11
Long-term
Short-term
UnscheduledInterchange
It may be seen from the above graph that long term purchases were not enough to fulfill the demand of power in the State despite increase in long-term purchases from 31985 MUs to 39929 MUs (24.84 per cent) during the review
7 Data source: Superintending Engineer (Rajasthan DISCOMs power purchase cell).
The figures are as per annexure 8. Figures here are not tallied with that of paragraph 2.1.33 and both the figures were provided by the management.
Chapter II Performance Audit relating to Government Companies
37
period. The shortage was met through short-term and UI purchases which increased from 362 MUs to 3947 MUs (990.33 per cent) and 461 MUs to 2727 MUs (491.54 per cent) respectively during review period. The power from Short-term and UI purchases was exceptionally high during 2009-10 and 2010-11. This shows increased dependence of the DISCOMs over short term and UI purchases during the review period due to high demand of power in the State.
The source-wise purchase of power during review period is given in Annexure-8. It could be seen there from:
• The State Power generating Utilities and Central sector are the major contributors to meet the demand of power in the State. It may be seen that though the contribution of State Utilities and Central Sector increased from 18201.25 MUs to 22839.89 MUs and 13213.25 MUs to 17298.36 MUs respectively during 2006-07 to 2010-11 but the contribution in percentage terms against the total power procured by DISCOMs decreased from 55.67 to 50.08 (State Utilities) and 40.41 to 37.93 (Central Sector) during review period. This has increased the dependence of DISCOMs to procure power from Independent Power Projects (IPPs) and others at higher cost.
• The power purchase cost per unit of DISCOMs increased from � 2.25 to � 3.07 in case of State Utilities while in case of Central Sector it increased from � 1.96 to � 2.23 during 2006-07 to 2010-11. Against it the power procured from IPPs and other sources was at abnormally higher rates ranging between � 8.30 and � 3.21 per unit during the same period.
• The annual average power purchase cost per unit of DISCOMs from long term purchases was ranging between � 1.94 and � 2.88 during 2006-07 to 2010-11 while in case of short-term purchase the same was ranging between � 3.87 and � 7.52 and for UI purchases it was ranging between � 3.65 and � 9.20 during the same period.
• DISCOMs had to bear extra expenditure of � 3868.57 crore due to 17238.05 MUs of unplanned power purchase (cost varying between � 3.65 per unit to � 9.20 per unit during review period) through short-term arrangements (bilateral, energy exchanges and UI purchases) in excess of the actual realization rate during the review period.
The Management stated (September 2011) that demand of power in State varies abnormally in various months from 800 LU per day to 1600 LU per day due to various factors like rain, rabi season, festivals, summer season etc. and as such it is not beneficial for the DISCOMs to have long term bilateral purchase. It further replied that the long term power purchase will go waste from July to September during rainy seasons when demand is very low and DISCOMs have to purchase power on short term basis/UI from October to November during rabi season when demand is very high which is generally cheaper. The reply is not convincing as DISCOMs failed to enter into
Long-term power purchase agreements were not adequate even to meet the demand approved by RERC and DISCOMs purchased power at high cost through short-term agreements and UI purchases.

Audit Report No.4 for the year ended 31 March 2011
38
long-term agreement even for the quantity approved by RERC. Further, as the annual average power purchase cost per unit from long term agreements was ranging between � 1.94 and � 2.88 during 2006-07 to 2010-11, it would still be cheaper, even if some power goes waste rather than purchasing under short-term and UI at higher cost which ranged between � 3.87 and � 7.52 and � 3.65 and � 9.20 respectively during the same period.
The DISCOMs should minimise short term and UI purchases.
Grid Violations
2.1.32 As per Central Electricity Regulatory Commission (CERC) regulations, DISCOMs are not permitted drawal of power from Grid below 49.2 HZ to ensure safety of Grid and to prevent system collapse. Test check of the records for 2009-10 and 2010-11 revealed that the DISCOMs violated the Grid Code by overdrawing power below 49.2 HZ in 1717 blocks for which 201 ‘B’ type messages (message indicating violation of Indian Electricity Grid Code and Electricity Act 2003) were issued by Northern Region Load Dispatch Centre (NRLDC).
We noticed that NRLDC issued instructions several times to maintain the Grid Code but DISCOMs did not take any effective action to maintain Grid discipline and NRLDC levied (January 2008) penalty of � 14 lakh towards congestion charges. We further noticed that officers at RDPPC control room were reluctant to resort to load shedding even in the event of contingency for which CERC imposed penalty of � 5 lakh.
The Management stated (September 2011) that very few messages were received from State Load Dispatch Centre and no penalty was imposed on DISCOMs. The reply is factually incorrect as NRLDC and CERC had imposed penalty and also called (May 2009) Chairman and Managing Director (RRVPNL) for personal hearing in view of frequent violations.
Sub-transmission & Distribution Losses
2.1.33 The distribution system is an important and essential link between the power generation source and the ultimate consumer of electricity. For efficient functioning of the system, it must be ensured that there are minimum losses in sub-transmission and distributing the power. While energy is carried from the generation source to the consumer, some energy is lost in the network. The losses at 33KV stage are termed as sub-transmission losses while those at 11 KV and below are termed as distribution losses. These are based on the difference between energy received (paid for) by the Distribution Company and energy billed to consumers. The percentage of losses to available power indicates the effectiveness of Distribution system. The losses occur mainly on two counts, i.e., technical and commercial. Technical losses occur due to inherent character of equipment used for transmitting and distributing power and resistance in conductors through which the energy is carried from one
DISCOMs drew power from Grid below 49.2 HZ despite issue of NRLDC alert messages.
Chapter II Performance Audit relating to Government Companies
39
place to another. On the other hand, commercial losses occur due to theft of energy, defective meters and drawal of unmetered supply etc.
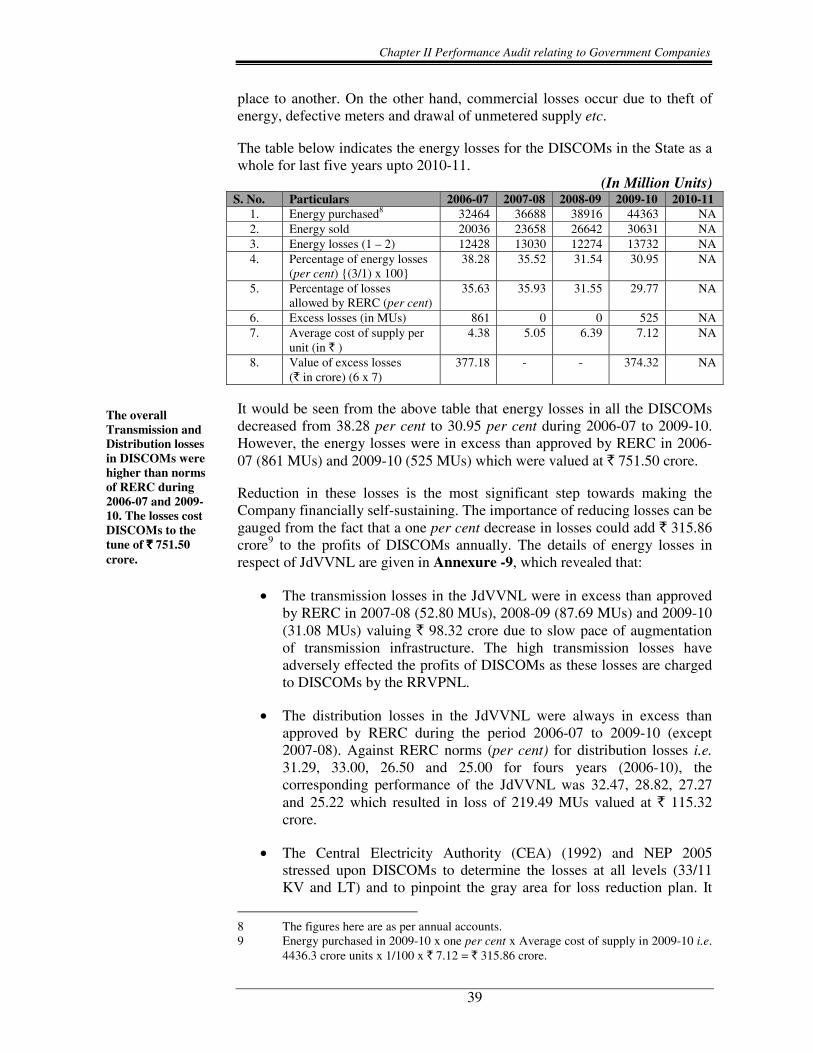
The table below indicates the energy losses for the DISCOMs in the State as a whole for last five years upto 2010-11.
(In Million Units) S. No. Particulars 2006-07 2007-08 2008-09 2009-10 2010-11
1. Energy purchased8 32464 36688 38916 44363 NA 2. Energy sold 20036 23658 26642 30631 NA 3. Energy losses (1 – 2) 12428 13030 12274 13732 NA4. Percentage of energy losses
(per cent) {(3/1) x 100} 38.28 35.52 31.54 30.95 NA
5. Percentage of losses allowed by RERC (per cent)
35.63 35.93 31.55 29.77 NA
6. Excess losses (in MUs) 861 0 0 525 NA 7. Average cost of supply per
unit (in � ) 4.38 5.05 6.39 7.12 NA
8. Value of excess losses (� in crore) (6 x 7)
377.18 - - 374.32 NA
It would be seen from the above table that energy losses in all the DISCOMs decreased from 38.28 per cent to 30.95 per cent during 2006-07 to 2009-10. However, the energy losses were in excess than approved by RERC in 2006-07 (861 MUs) and 2009-10 (525 MUs) which were valued at � 751.50 crore.
Reduction in these losses is the most significant step towards making the Company financially self-sustaining. The importance of reducing losses can be gauged from the fact that a one per cent decrease in losses could add � 315.86 crore9 to the profits of DISCOMs annually. The details of energy losses in respect of JdVVNL are given in Annexure -9, which revealed that:
• The transmission losses in the JdVVNL were in excess than approved by RERC in 2007-08 (52.80 MUs), 2008-09 (87.69 MUs) and 2009-10 (31.08 MUs) valuing � 98.32 crore due to slow pace of augmentation of transmission infrastructure. The high transmission losses have adversely effected the profits of DISCOMs as these losses are charged to DISCOMs by the RRVPNL.
• The distribution losses in the JdVVNL were always in excess than approved by RERC during the period 2006-07 to 2009-10 (except 2007-08). Against RERC norms (per cent) for distribution losses i.e.31.29, 33.00, 26.50 and 25.00 for fours years (2006-10), the corresponding performance of the JdVVNL was 32.47, 28.82, 27.27 and 25.22 which resulted in loss of 219.49 MUs valued at � 115.32 crore.
• The Central Electricity Authority (CEA) (1992) and NEP 2005 stressed upon DISCOMs to determine the losses at all levels (33/11 KV and LT) and to pinpoint the gray area for loss reduction plan. It
8 The figures here are as per annual accounts. 9 Energy purchased in 2009-10 x one per cent x Average cost of supply in 2009-10 i.e.
4436.3 crore units x 1/100 x � 7.12 = � 315.86 crore.
The overall Transmission and Distribution losses in DISCOMs were higher than norms of RERC during 2006-07 and 2009-10. The losses cost DISCOMs to the tune of ���� 751.50 crore.
Audit Report No.4 for the year ended 31 March 2011
40
was also insisted by RERC for determination of voltage wise losses, energy supplied and distribution losses at each level. However, we noticed that the JdVVNL made no efforts to determine the losses at each level to segregate the technical and commercial losses. Thus, the directions of CEA/RERC and provisions of NEP remained un-adhered till date.
The JVVNL stated (September 2011) that augmentation of sub-transmission infrastructure is being done on rapid pace to reduce the losses. However, JdVVNL stated (September 2011) that distribution losses are determined by RERC on estimated basis while accepting ARR and after finalisation of accounts, petition for truing up is filed before RERC for accepting the deviations. The JdVVNL had achieved the targets of distribution losses fixed by the State Government in financial restructuring plan (FRP) and there is no relevancy to compare actual losses with those of approved in ARR. The reply of JdVVNL is not convincing as RERC decides/approves the norms/targets on annual basis after considering all factors/parameters which has more relevance than those fixed under FRP.
Reasons of High Energy Losses
2.1.34 The main reasons for such high energy losses were insufficient transformation capacity, inadequate working capacity of capacitor banks, low power factor, heavy quantum of unmetered consumers and theft of electricity etc. as discussed in subsequent paragraphs.
Performance of Distribution Transformers
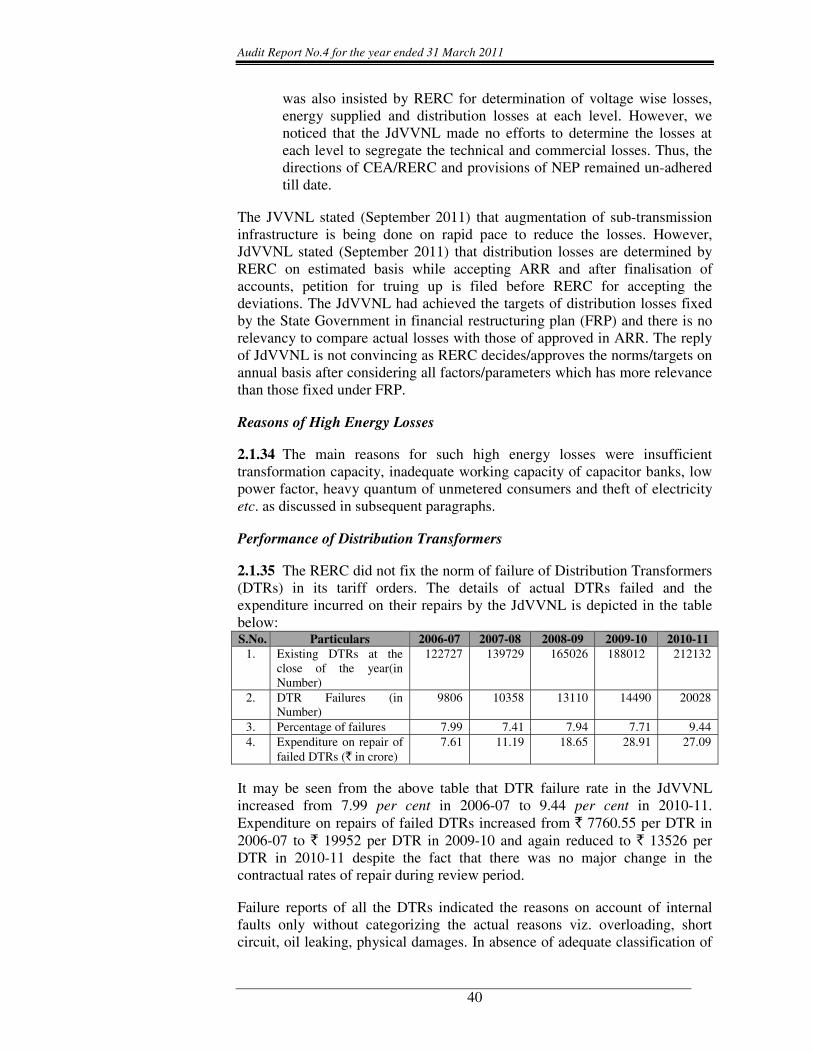
2.1.35 The RERC did not fix the norm of failure of Distribution Transformers (DTRs) in its tariff orders. The details of actual DTRs failed and the expenditure incurred on their repairs by the JdVVNL is depicted in the table below: S.No. Particulars 2006-07 2007-08 2008-09 2009-10 2010-11
1. Existing DTRs at the close of the year(in Number)
122727 139729 165026 188012 212132
2. DTR Failures (in Number)
9806 10358 13110 14490 20028
3. Percentage of failures 7.99 7.41 7.94 7.71 9.44 4. Expenditure on repair of
failed DTRs (� in crore) 7.61 11.19 18.65 28.91 27.09
It may be seen from the above table that DTR failure rate in the JdVVNL increased from 7.99 per cent in 2006-07 to 9.44 per cent in 2010-11. Expenditure on repairs of failed DTRs increased from � 7760.55 per DTR in 2006-07 to � 19952 per DTR in 2009-10 and again reduced to � 13526 per DTR in 2010-11 despite the fact that there was no major change in the contractual rates of repair during review period.
Failure reports of all the DTRs indicated the reasons on account of internal faults only without categorizing the actual reasons viz. overloading, short circuit, oil leaking, physical damages. In absence of adequate classification of
Chapter II Performance Audit relating to Government Companies
41
the reasons of failure by the JdVVNL, we could not ascertain the controllable and non-controllable expenditure on repair of transformers by timely preventive maintenance.
The Management stated (September 2011) that during 2010-11 the DTR failure rate is high as it included 3.50 per cent on account of meter burnt and remaining towards internal fault. However, the reply was silent as regards high DTR failure rate during 2006-10 and higher expenditure on repairs.
Delay in repair of Distribution Transformers
2.1.36 The JdVVNL undertake repair of damaged transformers through outside agencies. Though the time limit for return of repaired transformers was prescribed as 30 days, delays ranging from 65 to 200 days were observed in the repairs of 194 transformers during test checks of record for the year 2009-10 and 2010-11. Further, as per the general terms and conditions of purchase order, the suppliers were required to guarantee the performance of DTRs for three years from the date of dispatch. These were required to be replaced/ repaired in 45 days in case of other state firm and 90 days in case of local firms from the date of intimation of failure. Our analysis of 2009-10 and 2010-11 revealed that, 15791 DTRs failed within the guarantee period. Out of these, 529 DTRs were sent to the firms with delay ranging from 3 to 371 days, 325 DTRs were repaired/replaced after delay of 1 to 307 days beyond the prescribed period of 45/ 90 days. Besides, 462 DTRs were lying with the firms awaiting repair/ replacement at the end of 2010-11. However, no action was taken by the JdVVNL to avoid the delays. This indicated lack of effective management and control by the JdVVNL.
The Management while accepting the facts stated (September 2011) that penalty is being imposed on contractors for delay as per the rates of work order. However, the fact remains that delay beyond the prescribed period did not compensate the energy losses accruing due to delay in repair/replacement of failed transformers in comparison to insignificant amount of penalty imposed on the contractors.
Capacitors Banks
2.1.37 Capacitor bank improves power factor by regulating the current flow and voltage regulation. In the event of voltage falling below normal, the situation can be set right by providing sufficient capacity of capacitor banks to the system as it improves the voltage profile and reduces dissipation of energy to a great extent thereby saving loss of energy. The position as regards capacitors banks is shown in Annexure-10. Scrutiny of records revealed as under:
• The performance of JdVVNL towards installation of 11 KV capacitor banks was highly dismal during the period 2006-07 to 2010-11 as it neither planned (except 2007-08) nor achieved the already laid down targets. As against the planned addition of 196 MVAR to be achieved by March 2006, the same were only achieved by the end of March 2010 and further, the planned addition of 55.60 MVAR during 2007-08
Audit Report No.4 for the year ended 31 March 2011
42
could not be achieved till March 2011. The actual performance against effective targeted capacity was 16 MVAR (15.38 per cent) in 2006-07, 22 MVAR (15.32 per cent) in 2007-08, 25.2 MVAR (20.72 per cent) in 2008-09, 42.4 MVAR (43.98 per cent) in 2009-10 and 8.4 MVAR (15.56 per cent) in 2010-11. There was, thus, significant shortfall of 45.60 MVAR at the end of 2010-11 which led to loss of envisaged energy saving of 107.08 MUs valuing � 57.49 crore during 2006-11.
Thus, significant shortfall in achievement of targets due to poor planning and execution, continued overloading of feeders/transformers and low power factor resulted in higher distribution losses and poor supply to consumers.
• As on April 2006, the installed capacity of capacitor banks in the JdVVNL was 201.60 MVAR out of which capacitors of 20 MVAR were lying defective. The addition in capacity during 2006-11 was 114 MVAR while capacitors of 125.2 MVAR were lying defective. Thus, the actual effective capacity of capacitor banks was 190.40 MVAR as on March 2011 and hence, effective addition was only 8.80 MVAR. We noticed that the defective capacitors were lying without repair due to non-availability of spare parts with the JdVVNL. Non-repairing of the defective capacitors had deprived the JdVVNL of energy savings of 54.39 MUs valued at � 32.10 crore.
Thus, significant shortfall in addition of capacitor banks and non- repairing of the defective capacitors led to loss of targeted energy saving of 161.47 MUs valued at � 89.59 crore.
The JdVVNL while accepting the fact of defective capacitors stated (September 2011) that LT capacitors installed with super transformers was sufficient to meet the target of Northern Region Power Committee. The reply is not convincing as the LT capacitors were to be installed on DTR on LT side but installation of 33/11 KV capacitor banks were planned to regulate power supply from Extra High Voltage system to sub-transmission system. Further, it may be seen that JdVVNL itself had installed capacitors banks during 2006-11, planned during 2004-06 and 2007-08 which would otherwise had not been installed if LT capacitors were sufficient enough to cater the needs.
Commercial losses
2.1.38 The majority of commercial losses relate to consumer metering and billing besides pilferage of energy. While the metering and billing aspects have been covered under implementation of energy accounting and Billing efficiency, respectively, the other observations relating to commercial losses are discussed below:
Implementation of LT less system
2.1.39 High voltage distribution System is an effective method of reduction of technical losses, prevention of theft, improved voltage profile and better consumer service. The GOI had also stressed (February 2001) the need to adopt LT less system of distribution through replacement of existing LT lines
Shortfall in addition of capacitor banks and non- repairing of the defective capacitors led to loss of targeted energy saving of 161.47 MUs valued at ���� 89.59 crore.

Chapter II Performance Audit relating to Government Companies
43
by HT lines to reduce the distribution losses. The HT-LT ratio over the review period of the DISCOMs is given in table below:
(In Lakh CKM) Year JdVVNL AVVNL JVVNL
HT LT Ratio HT LT Ratio HT LT Ratio 2006-07 0.81 0.62 1.31:1 0.68 1.04 0.65:1 0.59 0.92 0.64:1 2007-08 0.86 0.60 1.43:1 0.74 1.15 0.64:1 0.64 0.97 0.66:1 2008-09 0.99 0.62 1.60:1 0.78 1.23 0.63:1 0.73 1.04 0.70:1 2009-10 1.08 0.64 1.69:1 0.82 1.28 0.64:1 0.81 1.08 0.75:1 2010-11 1.14 0.64 1.78:1 0.85 1.32 0.64:1 0.86 1.11 0.77:1
It may be seen from the above table that the HT-LT ratio of the JdVVNL during review period was always more than the ideal ratio of 1:1. However, JVVNL and AVVNL need to improve the HT-LT ratio to minimize the distribution losses.
The JVVNL while accepting the fact of low HT-LT ratio stated (September 2011) that continuous efforts are being made to bring this ratio to 1:1 by replacing LT lines with HT lines.
High incidence of theft
2.1.40 Substantial commercial losses are caused due to theft of energy by tampering of meters by the consumers and unauthorized tapping/hooking by the non-consumers. As per section 135 of Electricity Act 2003, theft of energy is an offence punishable under the Act. The targets for number of checking, theft cases detected, assessed amount and amount realised there against in the JdVVNL are given in Annexure-11. An analysis of the annexure revealed as under:
• The JdVVNL could not achieve the targets of checking and theft detection during the review period. Achievement against targets of checking ranged between 57.78 per cent and 87.42 per cent while in theft detection the same was ranging between 53.05 per cent and 73 per cent.
• The targets of assessment in respect of detected cases fixed by the JdVVNL were on declining trend and were 78.92 per cent of 2006-07 in 2010-11. However, despite declining trend it could not achieve the targets except in 2009-10 and 2010-11, which were only due to decrease in targets. It may also be seen that the realization targets in respect of assessment were only 50 per cent but the same were also not achieved except in 2009-10 and ranged between 66.95 per cent and 103.65 per cent.
The Management while accepting the facts stated (September 2011) that the position of assessment and realization of theft cases has been improving regularly since 2009-10. However, the reply was silent on the issue of non-achievement of targets and declining trend in targets in respect of assessment and achievement there against.
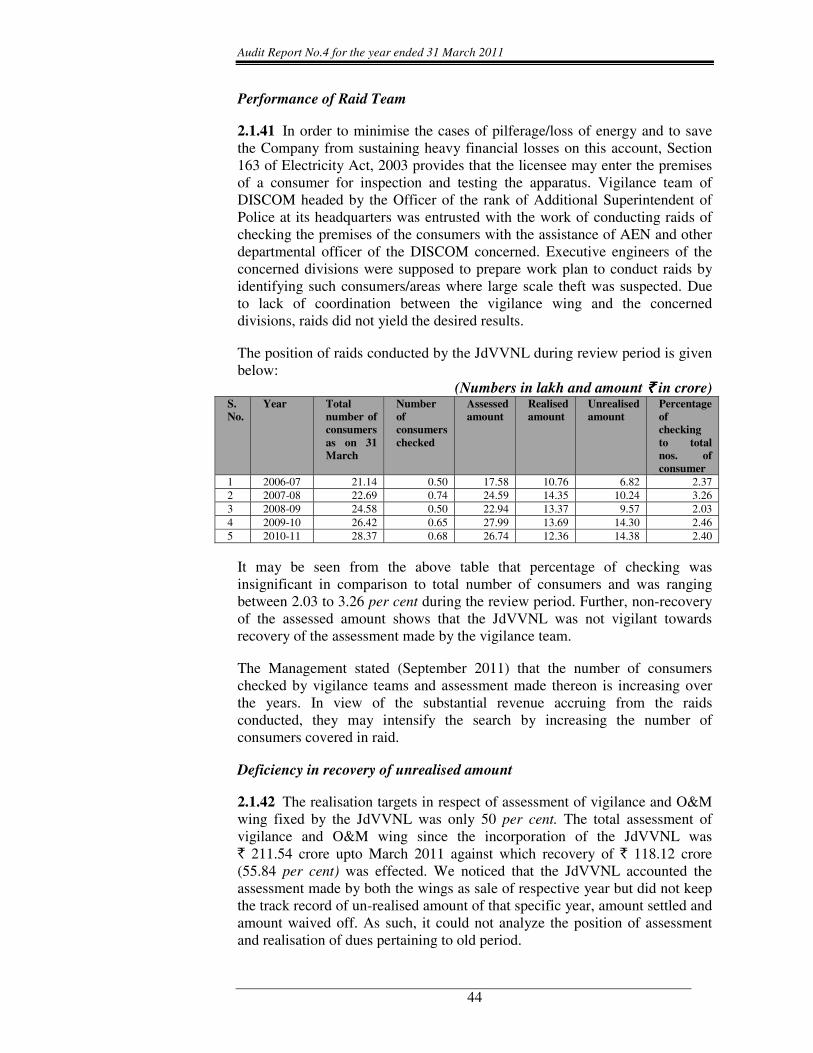
Audit Report No.4 for the year ended 31 March 2011
44
Performance of Raid Team
2.1.41 In order to minimise the cases of pilferage/loss of energy and to save the Company from sustaining heavy financial losses on this account, Section 163 of Electricity Act, 2003 provides that the licensee may enter the premises of a consumer for inspection and testing the apparatus. Vigilance team of DISCOM headed by the Officer of the rank of Additional Superintendent of Police at its headquarters was entrusted with the work of conducting raids of checking the premises of the consumers with the assistance of AEN and other departmental officer of the DISCOM concerned. Executive engineers of the concerned divisions were supposed to prepare work plan to conduct raids by identifying such consumers/areas where large scale theft was suspected. Due to lack of coordination between the vigilance wing and the concerned divisions, raids did not yield the desired results.
The position of raids conducted by the JdVVNL during review period is given below:
(Numbers in lakh and amount ��������in crore) S. No.
Year Total number of consumers as on 31 March
Number of consumers checked
Assessed amount
Realised amount
Unrealised amount
Percentage of checking to total nos. of consumer
1 2006-07 21.14 0.50 17.58 10.76 6.82 2.37 2 2007-08 22.69 0.74 24.59 14.35 10.24 3.26 3 2008-09 24.58 0.50 22.94 13.37 9.57 2.03 4 2009-10 26.42 0.65 27.99 13.69 14.30 2.46 5 2010-11 28.37 0.68 26.74 12.36 14.38 2.40
It may be seen from the above table that percentage of checking was insignificant in comparison to total number of consumers and was ranging between 2.03 to 3.26 per cent during the review period. Further, non-recovery of the assessed amount shows that the JdVVNL was not vigilant towards recovery of the assessment made by the vigilance team.
The Management stated (September 2011) that the number of consumers checked by vigilance teams and assessment made thereon is increasing over the years. In view of the substantial revenue accruing from the raids conducted, they may intensify the search by increasing the number of consumers covered in raid.
Deficiency in recovery of unrealised amount
2.1.42 The realisation targets in respect of assessment of vigilance and O&M wing fixed by the JdVVNL was only 50 per cent. The total assessment of vigilance and O&M wing since the incorporation of the JdVVNL was � 211.54 crore upto March 2011 against which recovery of � 118.12 crore (55.84 per cent) was effected. We noticed that the JdVVNL accounted the assessment made by both the wings as sale of respective year but did not keep the track record of un-realised amount of that specific year, amount settled and amount waived off. As such, it could not analyze the position of assessment and realisation of dues pertaining to old period.
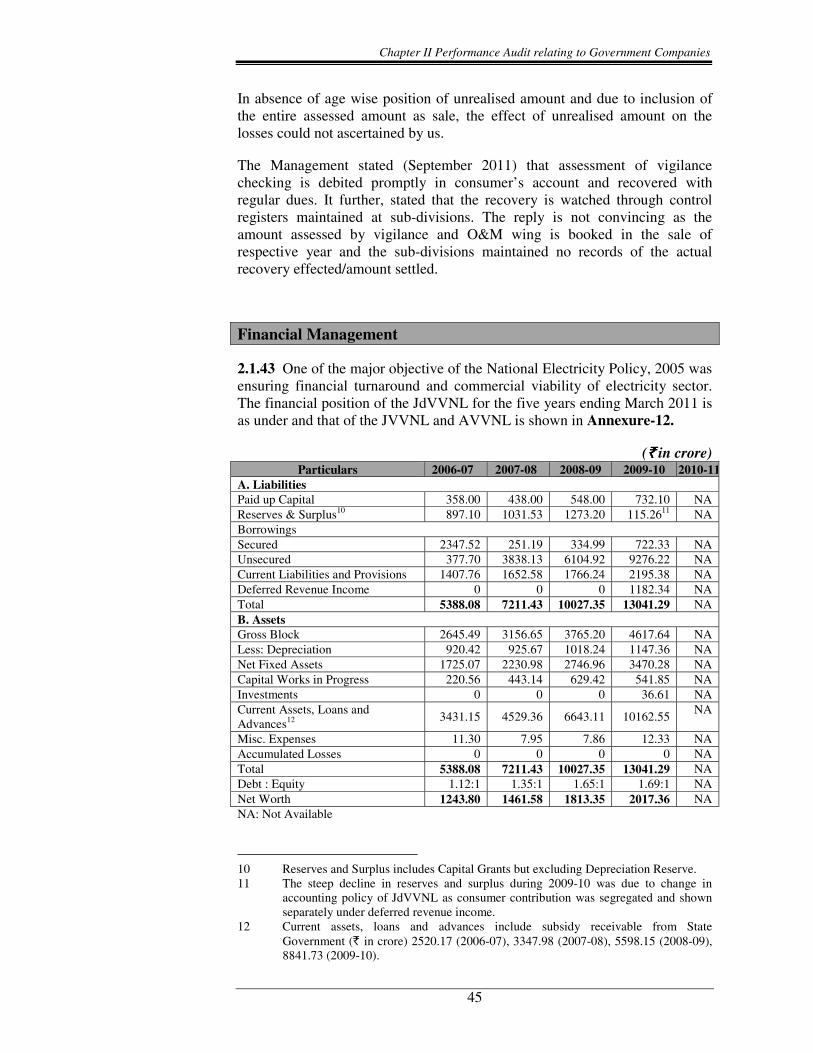
Chapter II Performance Audit relating to Government Companies
45
In absence of age wise position of unrealised amount and due to inclusion of the entire assessed amount as sale, the effect of unrealised amount on the losses could not ascertained by us.
The Management stated (September 2011) that assessment of vigilance checking is debited promptly in consumer’s account and recovered with regular dues. It further, stated that the recovery is watched through control registers maintained at sub-divisions. The reply is not convincing as the amount assessed by vigilance and O&M wing is booked in the sale of respective year and the sub-divisions maintained no records of the actual recovery effected/amount settled.
Financial Management
2.1.43 One of the major objective of the National Electricity Policy, 2005 was ensuring financial turnaround and commercial viability of electricity sector. The financial position of the JdVVNL for the five years ending March 2011 is as under and that of the JVVNL and AVVNL is shown in Annexure-12.
(���� in crore)Particulars 2006-07 2007-08 2008-09 2009-10 2010-11
A. Liabilities Paid up Capital 358.00 438.00 548.00 732.10 NA Reserves & Surplus10 897.10 1031.53 1273.20 115.2611 NA Borrowings Secured 2347.52 251.19 334.99 722.33 NA Unsecured 377.70 3838.13 6104.92 9276.22 NA Current Liabilities and Provisions 1407.76 1652.58 1766.24 2195.38 NA Deferred Revenue Income 0 0 0 1182.34 NA Total 5388.08 7211.43 10027.35 13041.29 NA B. Assets Gross Block 2645.49 3156.65 3765.20 4617.64 NA Less: Depreciation 920.42 925.67 1018.24 1147.36 NANet Fixed Assets 1725.07 2230.98 2746.96 3470.28 NACapital Works in Progress 220.56 443.14 629.42 541.85 NA Investments 0 0 0 36.61 NA Current Assets, Loans and Advances12 3431.15 4529.36 6643.11 10162.55
NA
Misc. Expenses 11.30 7.95 7.86 12.33 NA Accumulated Losses 0 0 0 0 NA Total 5388.08 7211.43 10027.35 13041.29 NA Debt : Equity 1.12:1 1.35:1 1.65:1 1.69:1 NA Net Worth 1243.80 1461.58 1813.35 2017.36 NA NA: Not Available
10 Reserves and Surplus includes Capital Grants but excluding Depreciation Reserve.11 The steep decline in reserves and surplus during 2009-10 was due to change in
accounting policy of JdVVNL as consumer contribution was segregated and shown separately under deferred revenue income.
12 Current assets, loans and advances include subsidy receivable from State Government (��in crore) 2520.17 (2006-07), 3347.98 (2007-08), 5598.15 (2008-09), 8841.73 (2009-10).
Audit Report No.4 for the year ended 31 March 2011
46
The DISCOMs were preparing financial statements on ‘no profit and no loss’ basis as per Financial Restructuring Plan (FRP) approved by the State Government. Revenue deficit i.e. excess of expenditure over revenue was accounted as subsidy receivable from the State Government, which was not paid at all since the incorporation of the DISCOMs.
The analysis of financial position of the DISCOMs revealed the following:
• The revenue deficit occurred due to adoption of ‘no profit and no loss’ basis and subsidy on account of minimum charges and tariff was shown by the DISCOMs as subsidy receivable from State Government under the head current assets, loans and advances. The subsidy receivable from State Government increased from � 2520.17 crore to � 8841.73 crore (250.84 per cent) during 2006-10 in case of JdVVNL and increase in respect of AVVNL and JVVNL, was 291.04 per centand 414.69 per cent respectively during corresponding period.
• The DISCOMs bridged the gap of unfunded subsidy receivable from State Government by availing long term and short term borrowings from various financial institutions. The borrowings of JdVVNL increased by 266.88 per cent from �� 2725.22 crore in 2006-07 to � 9998.55 crore in 2009-10. In case of AVVNL and JVVNL the borrowings increased by 338 per cent and 247 per cent respectively during 2006-10.
• Debt equity ratio increased from 1.12:1 to 1.69:1, 1.30:1 to 2.72:1 and 1.41:1 to 2.66:1 during 2006-07 to 2009-10 in respect of JdVVNL, AVVNL and JVVNL respectively. It indicates the dependence on interest bearing loans for bridging the gap between payments and receipts.
• The net worth of the DISCOMs increased from �� 3416.35 crore in 2006-07 to ��6262.64 crore in 2009-10 mainly due to revenue deficit shown as subsidy receivable from State Government. This does not reflect the true position of net worth increment as DISCOMs were preparing accounts on ‘No profit and No Loss basis’. The net worth would have been negative had revenue deficit receivable was shown separately as accumulated losses.
2.1.44 The particulars of cost of electricity vis-à-vis revenue realization per unit in AVVNL and JVVNL is given in Annexure-13 while that of JdVVNL is given below:
The DISCOMs prepared accounts on ‘No profit and No Loss basis’ and the revenue deficit was shown as receivable from State Government.
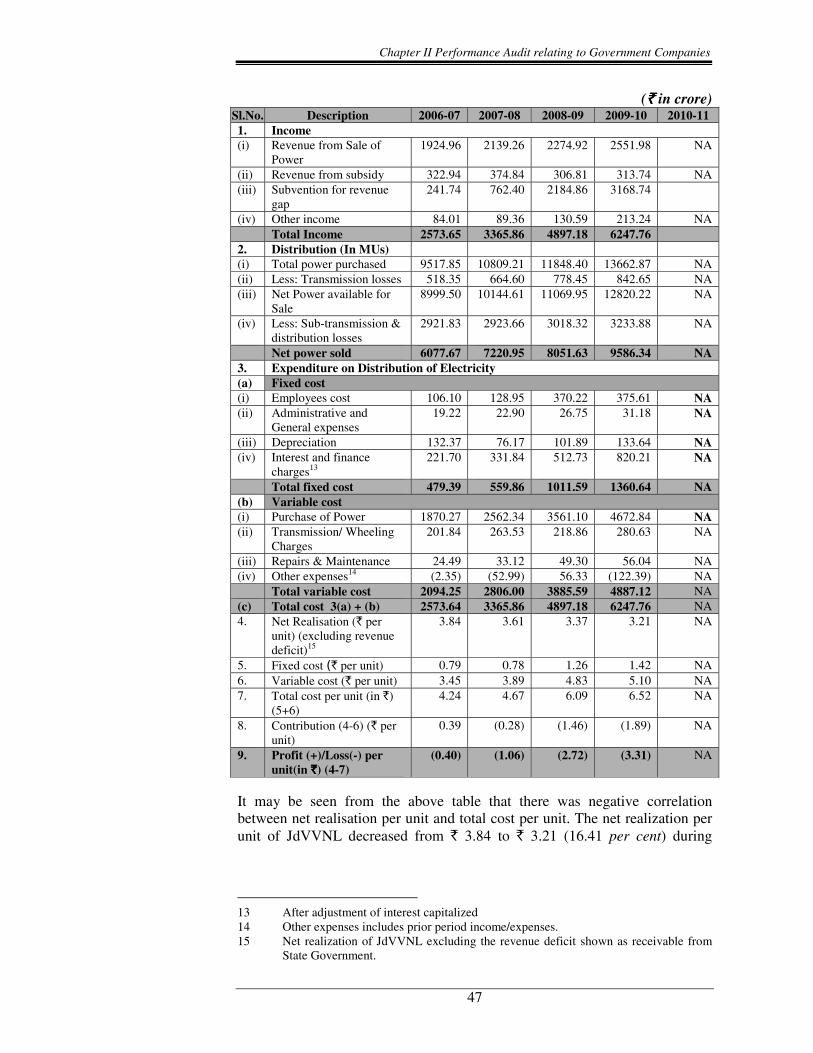
Chapter II Performance Audit relating to Government Companies
47
(��������in crore) Sl.No. Description 2006-07 2007-08 2008-09 2009-10 2010-11 1. Income (i) Revenue from Sale of
Power 1924.96 2139.26 2274.92 2551.98 NA
(ii) Revenue from subsidy 322.94 374.84 306.81 313.74 NA (iii) Subvention for revenue
gap 241.74 762.40 2184.86 3168.74
(iv) Other income 84.01 89.36 130.59 213.24 NA Total Income 2573.65 3365.86 4897.18 6247.76
2. Distribution (In MUs) (i) Total power purchased 9517.85 10809.21 11848.40 13662.87 NA (ii) Less: Transmission losses 518.35 664.60 778.45 842.65 NA (iii) Net Power available for
Sale 8999.50 10144.61 11069.95 12820.22 NA
(iv) Less: Sub-transmission & distribution losses
2921.83 2923.66 3018.32 3233.88 NA
Net power sold 6077.67 7220.95 8051.63 9586.34 NA 3. Expenditure on Distribution of Electricity (a) Fixed cost (i) Employees cost 106.10 128.95 370.22 375.61 NA(ii) Administrative and
General expenses 19.22 22.90 26.75 31.18 NA
(iii) Depreciation 132.37 76.17 101.89 133.64 NA(iv) Interest and finance
charges13221.70 331.84 512.73 820.21 NA
Total fixed cost 479.39 559.86 1011.59 1360.64 NA(b) Variable cost(i) Purchase of Power 1870.27 2562.34 3561.10 4672.84 NA(ii) Transmission/ Wheeling
Charges 201.84 263.53 218.86 280.63 NA
(iii) Repairs & Maintenance 24.49 33.12 49.30 56.04 NA (iv) Other expenses14 (2.35) (52.99) 56.33 (122.39) NA
Total variable cost 2094.25 2806.00 3885.59 4887.12 NA (c) Total cost 3(a) + (b) 2573.64 3365.86 4897.18 6247.76 NA 4. Net Realisation (� per
unit) (excluding revenue deficit)15
3.84 3.61 3.37 3.21 NA
5. Fixed cost �� per unit) 0.79 0.78 1.26 1.42 NA 6. Variable cost (� per unit) 3.45 3.89 4.83 5.10 NA 7. Total cost per unit (in �)
(5+6) 4.24 4.67 6.09 6.52 NA
8. Contribution (4-6) (� per unit)
0.39 (0.28) (1.46) (1.89) NA
9. Profit (+)/Loss(-) per unit(in ����) (4-7)
(0.40) (1.06) (2.72) (3.31) NA
It may be seen from the above table that there was negative correlation between net realisation per unit and total cost per unit. The net realization per unit of JdVVNL decreased from � 3.84 to � 3.21 (16.41 per cent) during
13 After adjustment of interest capitalized 14 Other expenses includes prior period income/expenses. 15 Net realization of JdVVNL excluding the revenue deficit shown as receivable from
State Government.
Audit Report No.4 for the year ended 31 March 2011
48
2006-10 while the total cost per unit increased from ��4.24 to ��6.52 (53.77 per cent) during the corresponding period. Further, the contribution per unit also transformed into negative from surplus of � 0.39 per unit to � 1.89 per unit during same period i.e. decreased by 584.62 per cent. The main reason for negative contribution was steep increase in revenue deficit receivable from the State Government in comparison to actual revenue realized from sale of power. The revenue deficit during 2006-07 was only 11.16 per cent (� 214.74 crore) of the actual revenue realized from sale of power but increased to 124.17 per cent (� 3168.74 crore) by the end of 2009-10.
It may also be seen that purchase of power, interest/finance charges and employees cost constituted the major elements of cost in 2009-10 which represented 74.79, 13.13 and 6.01 per cent of the total cost in that year. On the other hand, revenue from sale of power and subsidy & grants constituted the major elements of revenue in 2009-10 which represented 40.85 and 55.74 per cent of the total revenue. The implementation of the recommendations of sixth pay commission and increased debt financing in absence of State Government support were the main reasons for significant increase in the employee cost and interest and finance charges.
2.1.45 The financial viability of the DISCOMs are generally influenced by the various factors such as:
• Filing of Aggregate Revenue Requirement (ARR) and revision of tariff.
• Adequacy of tariff to cover the cost of operation.
• Timely release of promised subsidy by the Government
• Cross subsidization policy of the Government and its implementation by the DISCOMs.
• The Fund Management of DISCOMs and
• The Revenue billing and collection efficiency.
Each of these factors are discussed in the following paragraphs.
Filing of ARR
2.1.46 The tariff structure of the DISCOMs are subject to revision by RERC after the objections, if any, received against Aggregate Revenue Requirement (ARR) petition filed by them within the stipulated date. DISCOMs were required to file the ARR for each year in November of the preceding year for the respective year. In case of Multi Year Tariff (MYT), ARR was to be filed by November of the preceding year of the control period. The RERC accepts the application filed by the DISCOMs with such modifications/conditions as may be deemed just and appropriate and after considering all suggestions and objections from public and other stakeholders. The table below shows the due
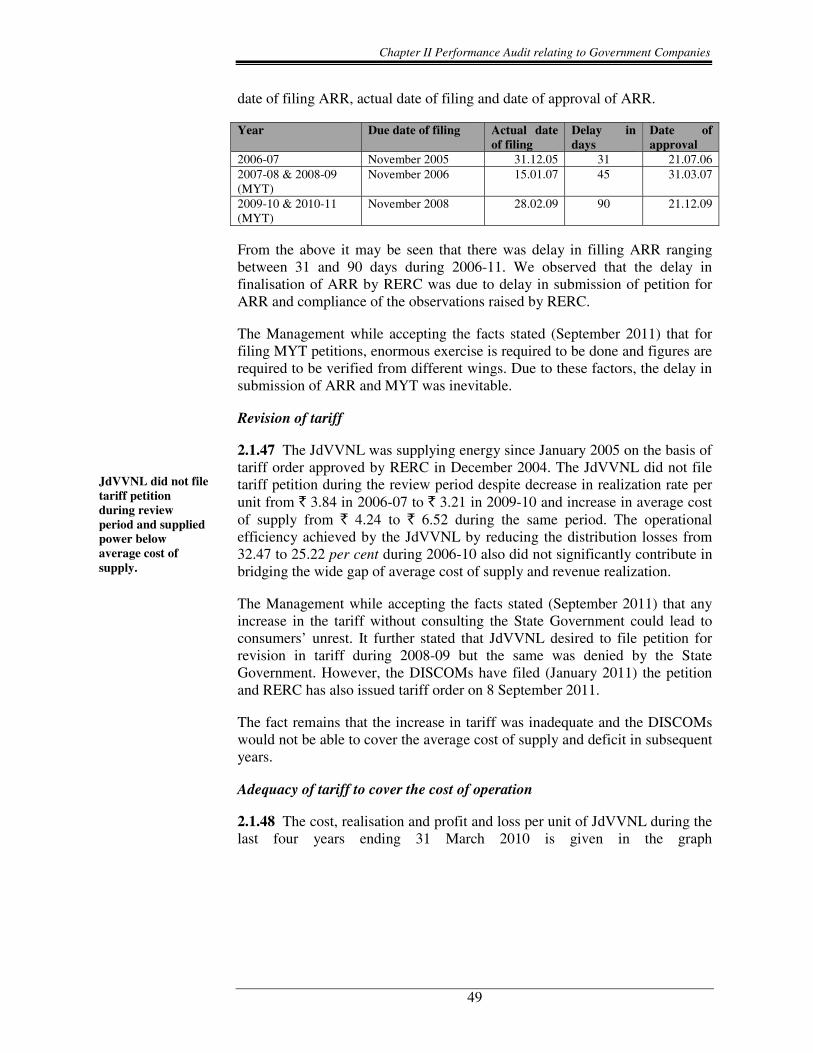
Chapter II Performance Audit relating to Government Companies
49
date of filing ARR, actual date of filing and date of approval of ARR.
Year Due date of filing Actual date of filing
Delay in days
Date of approval
2006-07 November 2005 31.12.05 31 21.07.06 2007-08 & 2008-09 (MYT)
November 2006 15.01.07 45 31.03.07
2009-10 & 2010-11 (MYT)
November 2008 28.02.09 90 21.12.09
From the above it may be seen that there was delay in filling ARR ranging between 31 and 90 days during 2006-11. We observed that the delay in finalisation of ARR by RERC was due to delay in submission of petition for ARR and compliance of the observations raised by RERC.
The Management while accepting the facts stated (September 2011) that for filing MYT petitions, enormous exercise is required to be done and figures are required to be verified from different wings. Due to these factors, the delay in submission of ARR and MYT was inevitable.
Revision of tariff
2.1.47 The JdVVNL was supplying energy since January 2005 on the basis of tariff order approved by RERC in December 2004. The JdVVNL did not file tariff petition during the review period despite decrease in realization rate per unit from � 3.84 in 2006-07 to � 3.21 in 2009-10 and increase in average cost of supply from � 4.24 to � 6.52 during the same period. The operational efficiency achieved by the JdVVNL by reducing the distribution losses from 32.47 to 25.22 per cent during 2006-10 also did not significantly contribute in bridging the wide gap of average cost of supply and revenue realization.
The Management while accepting the facts stated (September 2011) that any increase in the tariff without consulting the State Government could lead to consumers’ unrest. It further stated that JdVVNL desired to file petition for revision in tariff during 2008-09 but the same was denied by the State Government. However, the DISCOMs have filed (January 2011) the petition and RERC has also issued tariff order on 8 September 2011.
The fact remains that the increase in tariff was inadequate and the DISCOMs would not be able to cover the average cost of supply and deficit in subsequent years.
Adequacy of tariff to cover the cost of operation
2.1.48 The cost, realisation and profit and loss per unit of JdVVNL during the last four years ending 31 March 2010 is given in the graph
JdVVNL did not file tariff petition during review period and supplied power below average cost of supply.
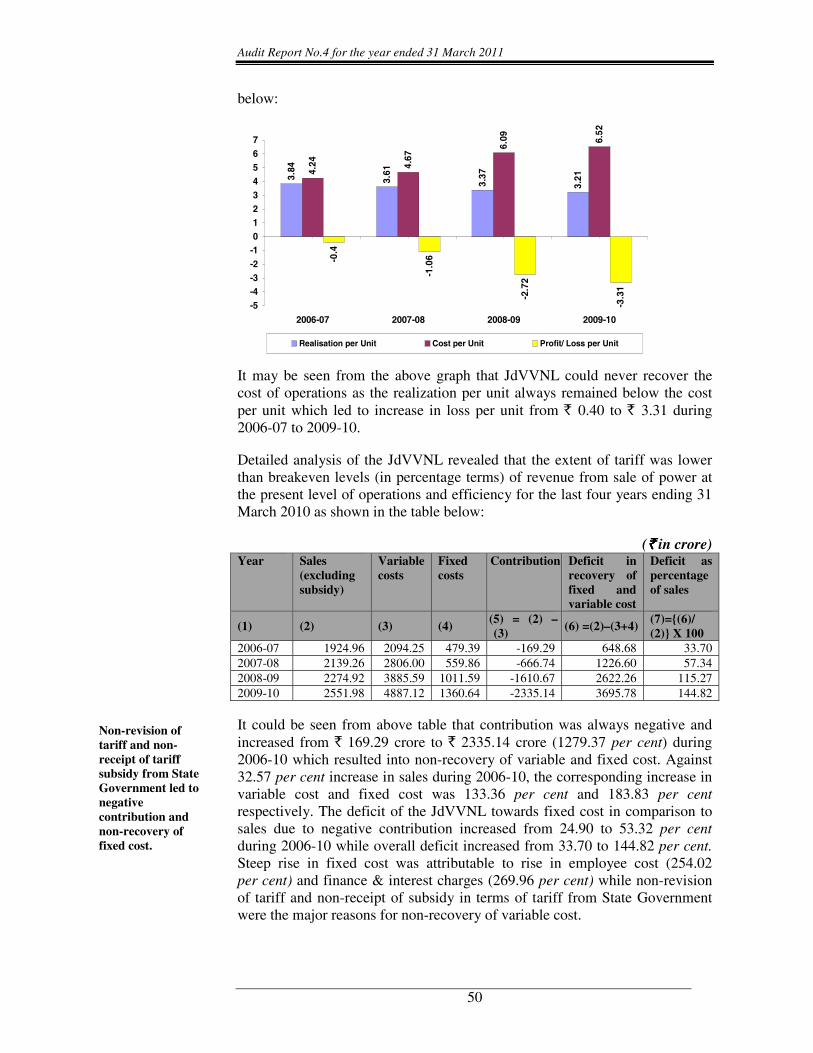
Audit Report No.4 for the year ended 31 March 2011
50
below:
3.84
3.61
3.37
3.21
4.24 4.
67
6.09 6.
52
-0.4
-1.0
6
-2.7
2
-3.3
1
-5-4-3-2-101234567
2006-07 2007-08 2008-09 2009-10
Realisation per Unit Cost per Unit Profit/ Loss per Unit
It may be seen from the above graph that JdVVNL could never recover the cost of operations as the realization per unit always remained below the cost per unit which led to increase in loss per unit from ��0.40 to ��3.31 during 2006-07 to 2009-10.
Detailed analysis of the JdVVNL revealed that the extent of tariff was lower than breakeven levels (in percentage terms) of revenue from sale of power at the present level of operations and efficiency for the last four years ending 31 March 2010 as shown in the table below:
(���� in crore) Year Sales
(excluding subsidy)
Variable costs
Fixed costs
Contribution Deficit in recovery of fixed and variable cost
Deficit as percentage of sales
(1) (2) (3) (4) (5) = (2) – (3)
(6) =(2)–(3+4)(7)={(6)/ (2)} X 100
2006-07 1924.96 2094.25 479.39 -169.29 648.68 33.702007-08 2139.26 2806.00 559.86 -666.74 1226.60 57.34 2008-09 2274.92 3885.59 1011.59 -1610.67 2622.26 115.27 2009-10 2551.98 4887.12 1360.64 -2335.14 3695.78 144.82
It could be seen from above table that contribution was always negative and increased from � 169.29 crore to � 2335.14 crore (1279.37 per cent) during 2006-10 which resulted into non-recovery of variable and fixed cost. Against 32.57 per cent increase in sales during 2006-10, the corresponding increase in variable cost and fixed cost was 133.36 per cent and 183.83 per centrespectively. The deficit of the JdVVNL towards fixed cost in comparison to sales due to negative contribution increased from 24.90 to 53.32 per cent during 2006-10 while overall deficit increased from 33.70 to 144.82 per cent. Steep rise in fixed cost was attributable to rise in employee cost (254.02 per cent) and finance & interest charges (269.96 per cent) while non-revision of tariff and non-receipt of subsidy in terms of tariff from State Government were the major reasons for non-recovery of variable cost.
Non-revision of tariff and non-receipt of tariff subsidy from State Government led to negative contribution and non-recovery of fixed cost.
Chapter II Performance Audit relating to Government Companies
51
Disallowance of expenditure and income
2.1.49 Tariff revision is subject to revision approved by RERC against the ARR filed by DISCOMs. Scrutiny of the ARR submitted by the JdVVNL and truing up orders of RERC revealed the following:
• Against the approved cost for purchasing power of � 3.76 per unit from other sources, the JdVVNL purchased power at � 4.24 per unit during 2006-07. Consequently, RERC disallowed (September 2009) the expenditure of � 8.23 crore at the time of truing up due to purchase of power at high cost.
• RERC disallowed the depreciation of � 22.33 crore claimed by the JdVVNL during 2006-07 and 2007-08 on assets created out of the contribution received from consumers.
• RERC Tariff Regulations 2004 and 2009 did not allow interest expenses on short term loans availed by the utility to meet the revenue deficit. Consequently, it disallowed � 317.41 crore during 2006-07 and 2007-08, claimed by the JdVVNL in ARR of these years.
• The JdVVNL accounted the difference of revenue and expenses as revenue subsidy receivable from the State Government. However, RERC disallowed cumulative revenue deficit of �� 1022.13 crore in 2006-07 and � 205 crore in 2007-08.
The Management while accepting the facts stated (September 2011) that power was essentially required for agriculture consumers. The reply was however, silent on other issues.
Timely release of promised subsidy by the Government
2.1.50 As per section 65 of Electricity Act, the Government was required to pay in advance the subsidy element to the DISCOMs so that their operation is not financially effected.
The graph below indicates revenue subsidy support from State Government against concessional tariff and total subsidies as a percentage of sales16 for the last four years ending 31 March 2010 in respect of the JdVVNL.
16 The figures here are excluding revenue subsidy from State Government for
concessional tariff.

Audit Report No.4 for the year ended 31 March 2011
52
118.50
61.50
39.00
146.03
9.67
9.57
8.34
8.96
020406080
100120140160
2006-07 2007-08 2008-09 2009-10
Per
cent
age
of t
otal
sub
sidi
es t
o sa
les
7.5
8
8.5
9
9.5
10
Per
cent
age
of s
ubsi
dies
(C
once
ssio
nal)
to
sale
s
Percentage of total subsidies to sales
Percentage of Subsidies (Concessional) to sales
It is evident from the above that subsidy claims of the JdVVNL towards concessional tariff from the State Government has decreased from 9.67 per cent in 2006-07 to 8.34 per cent in 2007-08 and again increased to 9.57 per cent in 2009-10. The decrease was attributed to increase in overall volume of sale. However, the total subsidy required (including revenue gap) against revenue earned by the JdVVNL to cover the overall gap/deficit has abnormally increased from 39 per cent in 2006-07 to 146.03 per cent in 2009-10. This is a matter of concern as the overall gap has not been reimbursed by the State Government and subsidy may also be withdrawn over a period of time in a phased manner so that tariff may cover average cost of supply to consumers. Further, against the subsidy claim of � 8488.66 crore during 2006-10 on above account, only � 1715.74 crore was actually paid by the State Government as detailed in the table below:
(� in crore) Particulars 2006-07 2007-08 2008-09 2009-10 2010-11 JdVVNL Opening balance 2143.01 2504.74 3355.01 5623.22 8915.93 Add: Due from State Government during the year
750.72 1315.69 2695.54 3726.71 NA
Less: Received during the year
388.99 465.42 427.33 434.00 NA
Closing balance 2504.74 3355.01 5623.22 8915.93 AVVNLOpening balance 2124.76 2571.23 3891.42 6271.11 10055.34 Add: Due from State Government during the year
922.09 1859.01 2921.70 4285.01 NA
Less: Received during the year
475.62 538.82 542.01 500.78 NA
Closing balance 2571.23 3891.42 6271.11 10055.34 JVVNL Opening balance 1528.14 1678.28 2425.89 4662.43 8641.70 Add: Due from State Government during the year
610.08 1297.25 2817.81 4559.18 NA
Less: Received during the year
459.94 549.64 581.27 579.91 NA
Closing balance 1678.28 2425.89 4662.43 8641.70
Chapter II Performance Audit relating to Government Companies
53
It may be seen from the table above that the closing balance of subsidy receivable from State Government (inclusive of revenue deficit, minimum charges and tariff subsidy) increased from � 5795.91 crore to � 27612.97 crore during April 2006 to March 2010. In JdVVNL it has increased from � 2504.74 crore in 2006-07 to � 8915.93 crore (255.96 per cent) in 2009-10 while in AVVNL, it has increased from � 2571.23 crore to � 10055.34 crore (291.07 per cent during the same period. Further, in case of JVVNL it has increased from � 1678.28 crore to � 8641.70 crore (414.91 per cent) during 2006-10. This indicates that the State Government support to DISCOMs was not adequate enough to overcome the shortfall which not only represents the miserable health of DISCOMs but also bona fide fiscal deficit of the State Government.
In the context of JdVVNL, it was further revealed that:
• The State Government directed (December 2004) DISCOMs to continue to bill agriculture consumers at pre-revised tariff and subsidized supply to certain category of domestic consumer despite approval of tariff (December 2004) by RERC. Against the claim (JdVVNL) of � 687.17 crore during 2006-10 only � 360.16 crore (52.41 per cent) was released. Thus, � 315.16 crore on this account was recoverable from the State Government as on 31 March 2010.
• DISCOMs discontinued the recovery of minimum charges from agriculture consumers on the directions (October 2002) of State Government. Against the subsidy claims (JdVVNL) of � 219.48 crore (2002-10) only � 37.20 crore was reimbursed by the State Government in 2009-10 on account of the agreement of October 2009. Further, the JdVVNL could not claim � 9.65 crore in 2008-09 due to non-reconciliation of minimum charges data.
• The DISCOMs did not follow the RERC directives (December 2006) for immediate stoppage of any relaxation, being provided by deviating the tariff order (2004) including levy of minimum charges from the agriculture consumers unless subsidy was provided. However, despite the specific directions of RERC, the DISCOMs continued exemption of minimum charges to agriculture consumers.
This would not only adversely affect the financial health of the DISCOMs but also infringes the provisions of Section 65 of the Electricity Act 2003 requiring the State Governments to pay the subsidy in advance. Further, as the financial position of the DISCOMs was not very sound, the same may not get finance from outside agencies also. Therefore, operational viability of the DISCOMs is heavily dependent on the government support.
The JdVVNL stated (September 2011) that MOU with the State Government has been signed to liquidate the receivable amount from the State Government. The reply was however, silent on other issues.
The subsidy receivable from Sate Government has increased from ���� 5795.91 crore to ���� 27612.97 crore during April 2006 to March 2010.
Concession of minimum charges to agriculture consumers was continued despite RERC direction for immediate stoppage, unless subsidy was provided.
Audit Report No.4 for the year ended 31 March 2011
54
Cross subsidization policy of the Government and its implementation
2.1.51 Section 61 of Electricity Act 2003 stipulates that the tariff should progressively reflect the average cost of supply (ACoS) of electricity and also reduce cross subsidy in a phased manner as specified by the Commission. National Tariff Policy 2006 envisaged that the tariff of all categories of consumer should range within plus or minus 20 per cent of the ACoS by the year 2010-11.
The position as regards cross-subsidies in various major sectors in respect of DISCOMs is depicted in the Annexure-14.
It could be observed from the annexure that there always remained a wide gap between average cost of supply and average rate of realization in all the DISCOMs. The supply to agriculture consumers was made at highly subsidized rates during the review period which was mainly cross subsidized from non-domestic and public street light in case of JdVVNL and JVVNL and from non-domestic in AVVNL up to 2006-08. The concept of cross subsidisation in all the DISCOMs eliminated from 2008-09 onwards due to non-recovery of cost from all sectors on account of non-revision of tariff since January 2005.
The Management while accepting the facts stated (September 2011) that tariff revision order has been issued by RERC on 8 September 2011 and efforts are being made to do the complete compliance over a period of time. The fact remains that all the sectors still remained subsidized even after increase in tariff.
Fund Management of DISCOMs
2.1.52 Efficient fund management serves as a tool for decision making for optimum utilisation of available resources and borrowings at favourable terms at appropriate time. In view of inadequate State Government support and non-revision of tariff over the years, the DISCOMs had to rely on borrowed funds to fulfill their financial requirements.
We observed that the DISCOMs incurred cash losses of � 33916.88 crore (JdVVNL-� 10442.26 crore, AVVNL-� 13030.81 crore, JVVNL-� 10443.81 crore) during 2006-07 to 2009-10 which was overcome mainly by increased borrowings in the form of cash credit/loans from commercial banks/financial institutions. The dependence of DISCOMs on borrowed funds increased during 2006-10 as borrowings increased from � 8601.72 crore in 2006-07 to � 32859.51 crore (282.01 per cent) at the end of 2009-10. DISCOM wise position of borrowed funds was as below:
(��������in crore) DISCOM Position at the end of
2006-07 Position at the end of 2009-10
Percentage increase
JdVVNL 2725.22 9998.55 266.89 AVVNL 2721.86 11924.32 338.09 JVVNL 3154.64 10936.64 246.68 Total 8601.72 32859.51 282.01
The DISCOMs supplied power to all categories of consumers from 2008-09 onwards at less than average cost of supply.
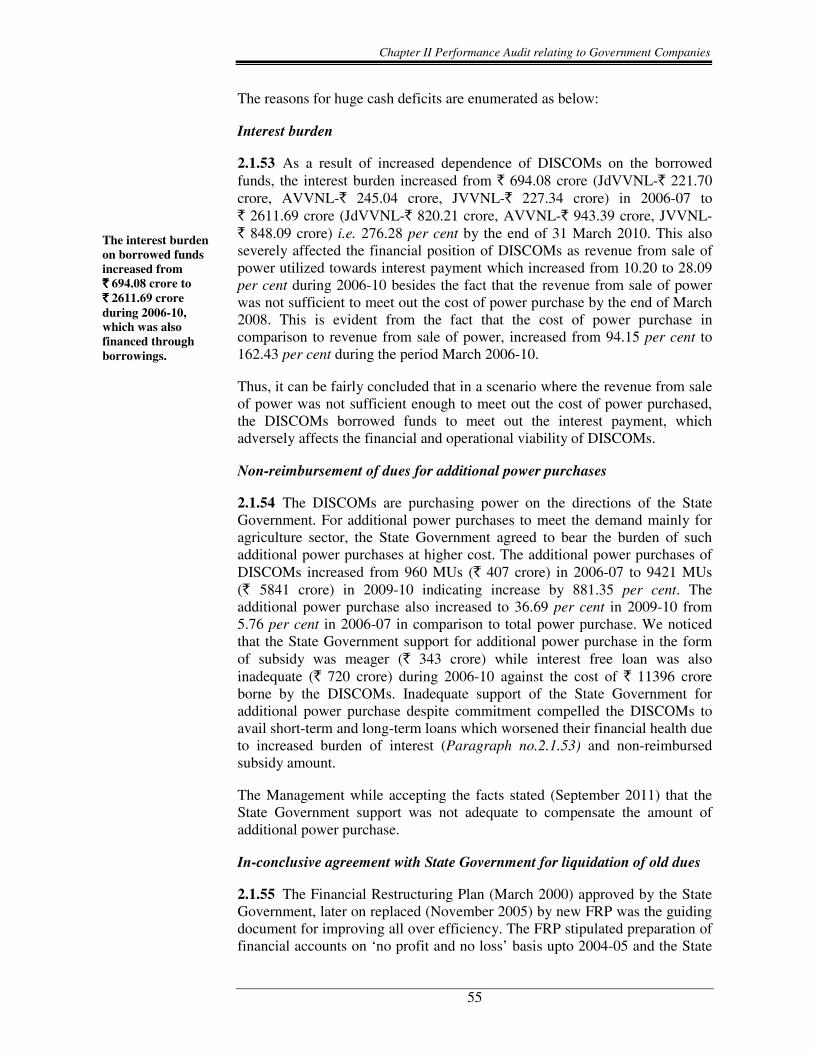
Chapter II Performance Audit relating to Government Companies
55
The reasons for huge cash deficits are enumerated as below:
Interest burden
2.1.53 As a result of increased dependence of DISCOMs on the borrowed funds, the interest burden increased from � 694.08 crore (JdVVNL-� 221.70 crore, AVVNL-� 245.04 crore, JVVNL-� 227.34 crore) in 2006-07 to � 2611.69 crore (JdVVNL-� 820.21 crore, AVVNL-� 943.39 crore, JVVNL- � 848.09 crore) i.e. 276.28 per cent by the end of 31 March 2010. This also severely affected the financial position of DISCOMs as revenue from sale of power utilized towards interest payment which increased from 10.20 to 28.09 per cent during 2006-10 besides the fact that the revenue from sale of power was not sufficient to meet out the cost of power purchase by the end of March 2008. This is evident from the fact that the cost of power purchase in comparison to revenue from sale of power, increased from 94.15 per cent to 162.43 per cent during the period March 2006-10.
Thus, it can be fairly concluded that in a scenario where the revenue from sale of power was not sufficient enough to meet out the cost of power purchased, the DISCOMs borrowed funds to meet out the interest payment, which adversely affects the financial and operational viability of DISCOMs.
Non-reimbursement of dues for additional power purchases
2.1.54 The DISCOMs are purchasing power on the directions of the State Government. For additional power purchases to meet the demand mainly for agriculture sector, the State Government agreed to bear the burden of such additional power purchases at higher cost. The additional power purchases of DISCOMs increased from 960 MUs (� 407 crore) in 2006-07 to 9421 MUs (�� 5841 crore) in 2009-10 indicating increase by 881.35 per cent. The additional power purchase also increased to 36.69 per cent in 2009-10 from 5.76 per cent in 2006-07 in comparison to total power purchase. We noticed that the State Government support for additional power purchase in the form of subsidy was meager (� 343 crore) while interest free loan was also inadequate (� 720 crore) during 2006-10 against the cost of � 11396 crore borne by the DISCOMs. Inadequate support of the State Government for additional power purchase despite commitment compelled the DISCOMs to avail short-term and long-term loans which worsened their financial health due to increased burden of interest (Paragraph no.2.1.53) and non-reimbursed subsidy amount.
The Management while accepting the facts stated (September 2011) that the State Government support was not adequate to compensate the amount of additional power purchase.
In-conclusive agreement with State Government for liquidation of old dues
2.1.55 The Financial Restructuring Plan (March 2000) approved by the State Government, later on replaced (November 2005) by new FRP was the guiding document for improving all over efficiency. The FRP stipulated preparation of financial accounts on ‘no profit and no loss’ basis upto 2004-05 and the State
The interest burden on borrowed funds increased from ���� 694.08 crore to ���� 2611.69 crore during 2006-10, which was also financed through borrowings.
Audit Report No.4 for the year ended 31 March 2011
56
Government will bridge the revenue gap for DISCOMs. As a measure of improving financial efficiency FRP also provided cash support of � 400 crore per year from the State Government and retention of Electricity Duty (ED) by the DISCOMs.
We noticed that the cash support of � 400 crore from the State Government and retention of ED was not sufficient and the financial health of DISCOMs worsened due to non-revision of tariff, providing power to Flat Rate Agriculture Consumers (FRAC) at fixed rate, nominal rate of metered agricultural consumer and high T&D losses. Further, the commitment of the State Government to bridge the revenue gap was not fulfilled and the deficit of DISCOMs mounted to � 16411 crore (� 789 crore for minimum charges and � 15622 crore on account of revenue deficit) by the end of March 2009.
The DISCOMs entered into (October 2009) an agreement with the State Government wherein it agreed to liquidate the deficit of � 16411 crore by paying minimum charges of agriculture consumers in first eight years and thereafter the remaining deficit in next 15 years.
We also observed that agreement of October 2009 was not a concrete solution to improve the financial health of DISCOMs as it did not care for the interest burden on the delayed payment of subsidy and deficit in forthcoming years. This is evident from the fact that deficit of DISCOMs for the year 2009-10 alone was � 10764.46 crore and estimated figure for the year 2010-11 was � 10114 crore.
Thus, it could be seen that neither FRP nor the agreement of October 2009 provided financial safety to DISCOMs as the reasons for deficit remained unattended.
The JVVNL accepted (September 2011) the fact that the terms of the agreement with the State Government were not adequate enough to bring DISCOMs out of the acute financial crisis. It further, stated that the State Government finances are also not in the comfortable position and as such, what the State Government could do, was only to execute this agreement.
Acceptance of outstation cheques
2.1.56 The JdVVNL failed to realise the funds from the consumers due to delay in realisation against the cheques and delay in transfer of funds to the collection account due to lack of monitoring. We noticed that Revenue Manual 2004 of the JdVVNL prohibits acceptance of outstation cheques. Test check in 13 sub-divisions revealed that during 2009-11, 522 outstation cheques (� 5.51 crore) were accepted by field offices. Although, the cheques were deposited in the bank on the same day but were credited after delay ranging between one and 127 days due to delay in clearance. Consequently, the JdVVNL was deprived of utilisation of these funds.
The Management stated (September 2011) that outstation cheques were accepted due to oversight for which appropriate action will be taken after due verification.
The agreement with the State Government did not provide for early realisation of subsidy receivable, interest burden due to delayed payment of subsidy and deficit occurring 2008-09 onwards.
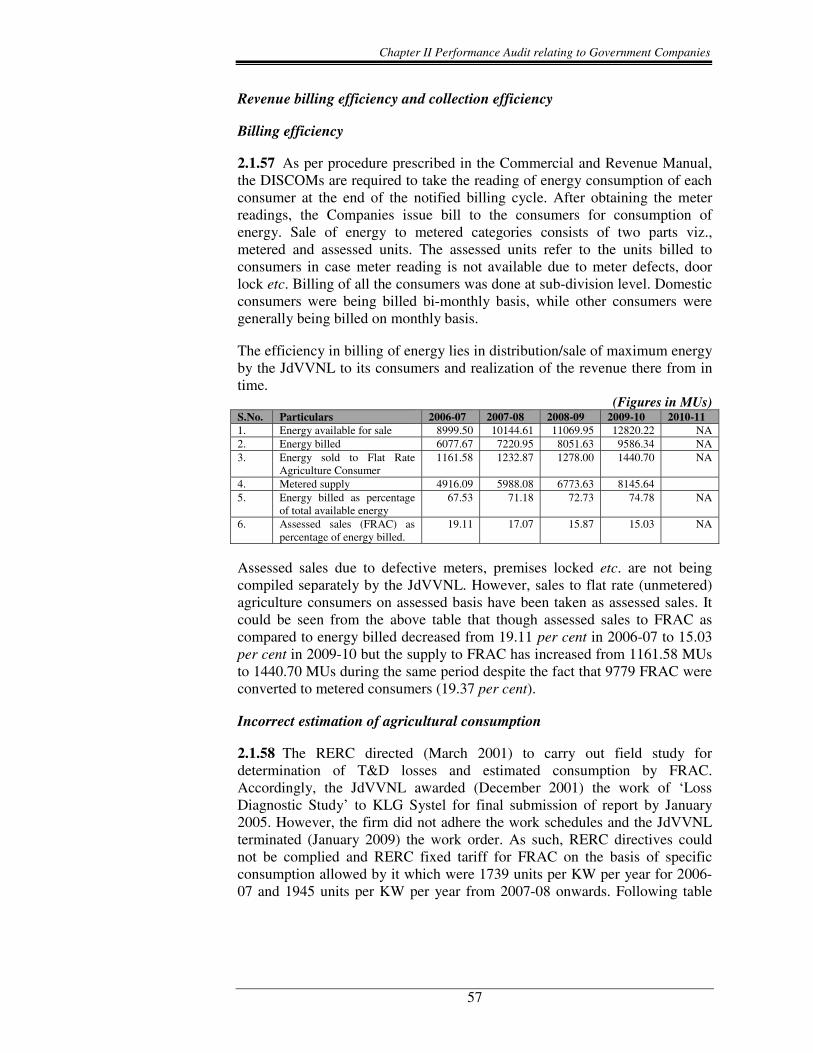
Chapter II Performance Audit relating to Government Companies
57
Revenue billing efficiency and collection efficiency
Billing efficiency
2.1.57 As per procedure prescribed in the Commercial and Revenue Manual, the DISCOMs are required to take the reading of energy consumption of each consumer at the end of the notified billing cycle. After obtaining the meter readings, the Companies issue bill to the consumers for consumption of energy. Sale of energy to metered categories consists of two parts viz., metered and assessed units. The assessed units refer to the units billed to consumers in case meter reading is not available due to meter defects, door lock etc. Billing of all the consumers was done at sub-division level. Domestic consumers were being billed bi-monthly basis, while other consumers were generally being billed on monthly basis.
The efficiency in billing of energy lies in distribution/sale of maximum energy by the JdVVNL to its consumers and realization of the revenue there from in time.
(Figures in MUs) S.No. Particulars 2006-07 2007-08 2008-09 2009-10 2010-11 1. Energy available for sale 8999.50 10144.61 11069.95 12820.22 NA 2. Energy billed 6077.67 7220.95 8051.63 9586.34 NA3. Energy sold to Flat Rate
Agriculture Consumer 1161.58 1232.87 1278.00 1440.70 NA
4. Metered supply 4916.09 5988.08 6773.63 8145.64 5. Energy billed as percentage
of total available energy 67.53 71.18 72.73 74.78 NA
6. Assessed sales (FRAC) as percentage of energy billed.
19.11 17.07 15.87 15.03 NA
Assessed sales due to defective meters, premises locked etc. are not being compiled separately by the JdVVNL. However, sales to flat rate (unmetered) agriculture consumers on assessed basis have been taken as assessed sales. It could be seen from the above table that though assessed sales to FRAC as compared to energy billed decreased from 19.11 per cent in 2006-07 to 15.03 per cent in 2009-10 but the supply to FRAC has increased from 1161.58 MUs to 1440.70 MUs during the same period despite the fact that 9779 FRAC were converted to metered consumers (19.37 per cent).
Incorrect estimation of agricultural consumption
2.1.58 The RERC directed (March 2001) to carry out field study for determination of T&D losses and estimated consumption by FRAC. Accordingly, the JdVVNL awarded (December 2001) the work of ‘Loss Diagnostic Study’ to KLG Systel for final submission of report by January 2005. However, the firm did not adhere the work schedules and the JdVVNL terminated (January 2009) the work order. As such, RERC directives could not be complied and RERC fixed tariff for FRAC on the basis of specific consumption allowed by it which were 1739 units per KW per year for 2006-07 and 1945 units per KW per year from 2007-08 onwards. Following table
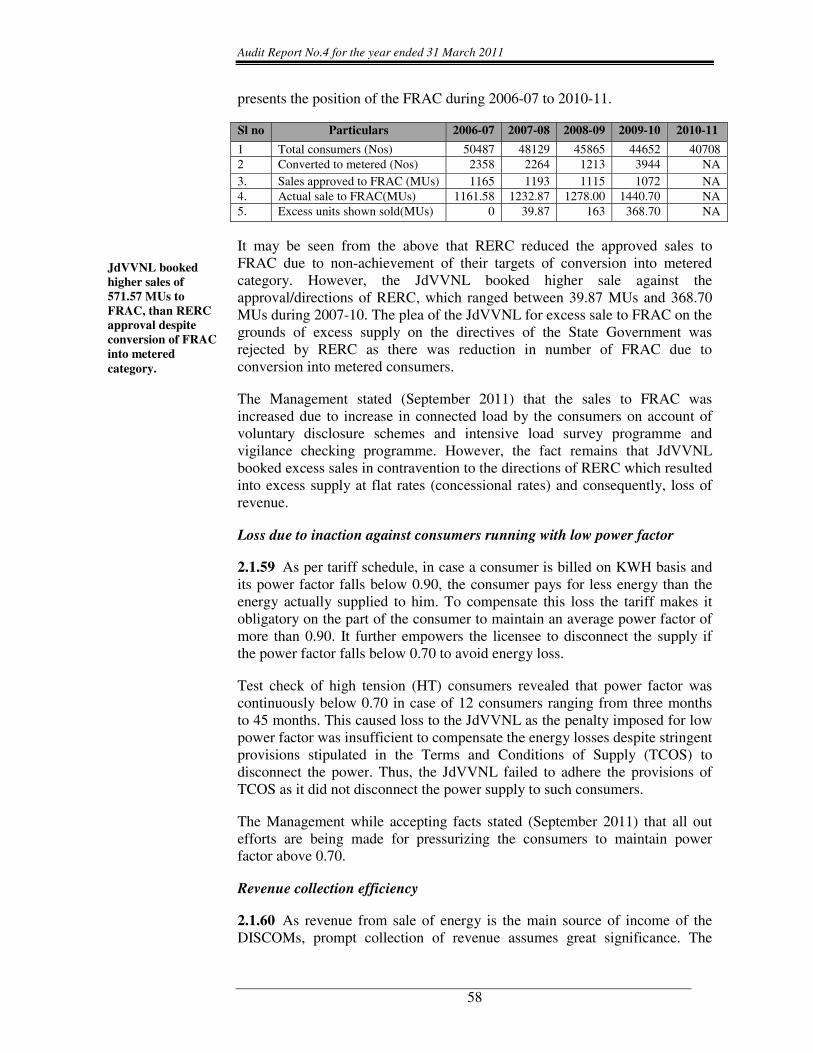
Audit Report No.4 for the year ended 31 March 2011
58
presents the position of the FRAC during 2006-07 to 2010-11.
Sl no Particulars 2006-07 2007-08 2008-09 2009-10 2010-11
1 Total consumers (Nos) 50487 48129 45865 44652 40708 2 Converted to metered (Nos) 2358 2264 1213 3944 NA3. Sales approved to FRAC (MUs) 1165 1193 1115 1072 NA 4. Actual sale to FRAC(MUs) 1161.58 1232.87 1278.00 1440.70 NA 5. Excess units shown sold(MUs) 0 39.87 163 368.70 NA
It may be seen from the above that RERC reduced the approved sales to FRAC due to non-achievement of their targets of conversion into metered category. However, the JdVVNL booked higher sale against the approval/directions of RERC, which ranged between 39.87 MUs and 368.70 MUs during 2007-10. The plea of the JdVVNL for excess sale to FRAC on the grounds of excess supply on the directives of the State Government was rejected by RERC as there was reduction in number of FRAC due to conversion into metered consumers.
The Management stated (September 2011) that the sales to FRAC was increased due to increase in connected load by the consumers on account of voluntary disclosure schemes and intensive load survey programme and vigilance checking programme. However, the fact remains that JdVVNL booked excess sales in contravention to the directions of RERC which resulted into excess supply at flat rates (concessional rates) and consequently, loss of revenue.
Loss due to inaction against consumers running with low power factor
2.1.59 As per tariff schedule, in case a consumer is billed on KWH basis and its power factor falls below 0.90, the consumer pays for less energy than the energy actually supplied to him. To compensate this loss the tariff makes it obligatory on the part of the consumer to maintain an average power factor of more than 0.90. It further empowers the licensee to disconnect the supply if the power factor falls below 0.70 to avoid energy loss.
Test check of high tension (HT) consumers revealed that power factor was continuously below 0.70 in case of 12 consumers ranging from three months to 45 months. This caused loss to the JdVVNL as the penalty imposed for low power factor was insufficient to compensate the energy losses despite stringent provisions stipulated in the Terms and Conditions of Supply (TCOS) to disconnect the power. Thus, the JdVVNL failed to adhere the provisions of TCOS as it did not disconnect the power supply to such consumers.
The Management while accepting facts stated (September 2011) that all out efforts are being made for pressurizing the consumers to maintain power factor above 0.70.
Revenue collection efficiency
2.1.60 As revenue from sale of energy is the main source of income of the DISCOMs, prompt collection of revenue assumes great significance. The
JdVVNL booked higher sales of 571.57 MUs to FRAC, than RERC approval despite conversion of FRAC into metered category.
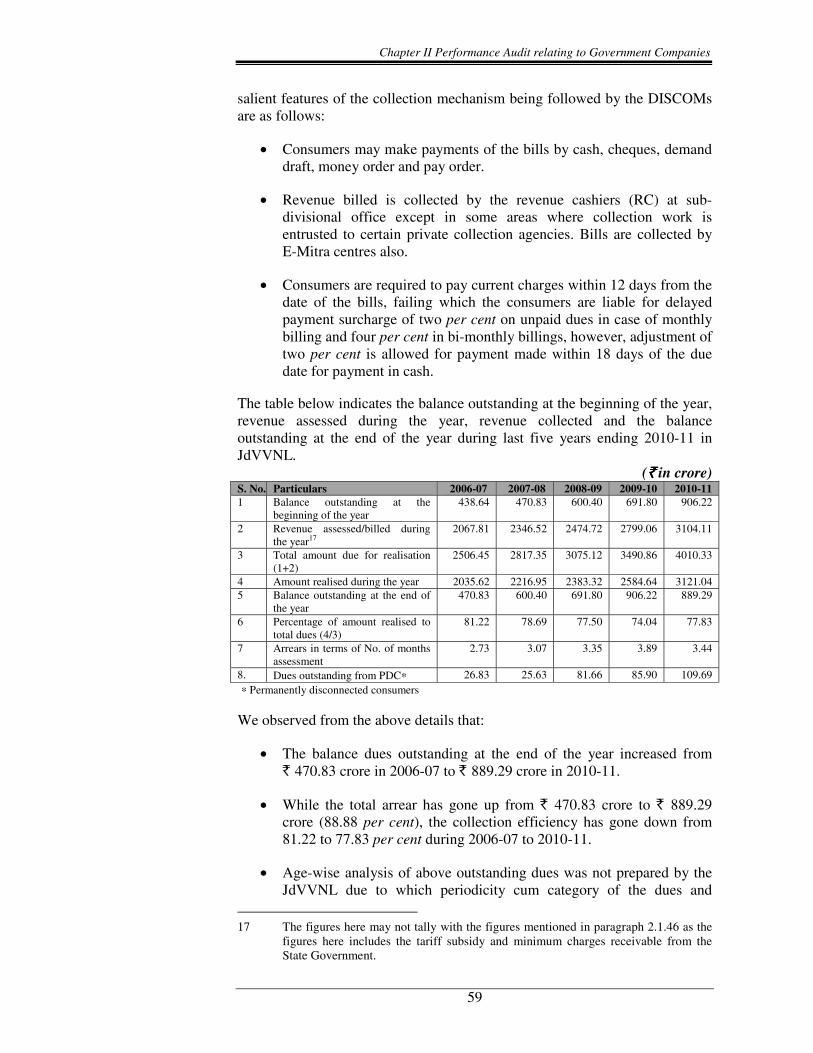
Chapter II Performance Audit relating to Government Companies
59
salient features of the collection mechanism being followed by the DISCOMs are as follows:
• Consumers may make payments of the bills by cash, cheques, demand draft, money order and pay order.
• Revenue billed is collected by the revenue cashiers (RC) at sub-divisional office except in some areas where collection work is entrusted to certain private collection agencies. Bills are collected by E-Mitra centres also.
• Consumers are required to pay current charges within 12 days from the date of the bills, failing which the consumers are liable for delayed payment surcharge of two per cent on unpaid dues in case of monthly billing and four per cent in bi-monthly billings, however, adjustment of two per cent is allowed for payment made within 18 days of the due date for payment in cash.
The table below indicates the balance outstanding at the beginning of the year, revenue assessed during the year, revenue collected and the balance outstanding at the end of the year during last five years ending 2010-11 in JdVVNL.
(���� in crore) S. No. Particulars 2006-07 2007-08 2008-09 2009-10 2010-11 1 Balance outstanding at the
beginning of the year 438.64 470.83 600.40 691.80 906.22
2 Revenue assessed/billed during the year17
2067.81 2346.52 2474.72 2799.06 3104.11
3 Total amount due for realisation (1+2)
2506.45 2817.35 3075.12 3490.86 4010.33
4 Amount realised during the year 2035.62 2216.95 2383.32 2584.64 3121.04 5 Balance outstanding at the end of
the year 470.83 600.40 691.80 906.22 889.29
6 Percentage of amount realised to total dues (4/3)
81.22 78.69 77.50 74.04 77.83
7 Arrears in terms of No. of months assessment
2.73 3.07 3.35 3.89 3.44
8. Dues outstanding from PDC∗ 26.83 25.63 81.66 85.90 109.69 ∗ Permanently disconnected consumers
We observed from the above details that:
• The balance dues outstanding at the end of the year increased from ��470.83 crore in 2006-07 to ��889.29 crore in 2010-11.
• While the total arrear has gone up from ��470.83 crore to ��889.29 crore (88.88 per cent), the collection efficiency has gone down from 81.22 to 77.83 per cent during 2006-07 to 2010-11.
• Age-wise analysis of above outstanding dues was not prepared by the JdVVNL due to which periodicity cum category of the dues and
17 The figures here may not tally with the figures mentioned in paragraph 2.1.46 as the
figures here includes the tariff subsidy and minimum charges receivable from the State Government.
Audit Report No.4 for the year ended 31 March 2011
60
effectiveness of persuasion of old debts could not be ascertained in audit.
• Group-wise analysis of debts outstanding as on 31 March 2011 revealed that dues from PDC increased to ��109.69 crore in 2010-11 from ��26.83 crore of 2006-07.
The Management while accepting the fact of non-availability of age-wise analysis of debtors stated (September 2011) that matter is being taken up with billing agency. It however, stated that the collection efficiency of JdVVNL was ranging between 95 and 101 per cent during the review period and there is only minor increase in the dues pertaining to PDC from � 86.47 crore to � 89.47 crore during 2006-07 to 2007-08. The reply as regards collection efficiency is not correct as JdVVNL had not considered the old outstanding recovered during the year while calculating revenue collection efficiency and further, the reply relating to PDC was factually incorrect as we had reported figures as per certified annual accounts.
Misappropriation/embezzlement of revenue
2.1.61 Instances of misappropriation/embezzlement of revenue involving a sum of �� 78.71 lakh were noticed during review period. The details are as under:
• Theft of ��0.72 lakh from chest (cupboard) at Gudamalani sub-division was reported during 2009-10 due to inadequate arrangements of safety of chest. The amount remained unrecovered (July 2011).
• The investigating team of the JdVVNL detected an embezzlement of �� 46 lakh (April 2007 to November 2009) at Sayla sub-division of Jalore circle wherein the original bills of higher amount were replaced by handwritten fake bills of lower amount. The cheque of higher amount was adjusted against the lower bills and bills of other consumers while the cash received from other consumers was embezzled. The amount was recovered but on further investigation for previous years, the same type of embezzlement was detected involving sum of � 24.86 lakh. We noticed that FIR for this amount was though lodged, recovery was pending (July 2011).
• Embezzlement of ��2.91 lakh by E-Mitra agency was detected during 2008-09 out of which � 2.00 lakh were recovered (2010-11) and recovery for remaining was pending (July 2011).
• For embezzlement of �� 4.22 lakh at CSD-II (Jodhpur Circle), Rajasthan High Court gave judgment (August 2010) in favour of the JdVVNL to attach the property of defaulting official for recovery of �� 12.44 lakh (including interest). However, the JdVVNL could not execute decree till July 2011.
We observed that the JdVVNL could not monitor the adherence of laid down system and procedures which led to thefts and embezzlement of revenue.
Chapter II Performance Audit relating to Government Companies
61
The Management while accepting the facts stated (September 2011) that efforts are being made to ensure compliance of laid down system for cash transaction so that no embezzlement take place.
Consumer Satisfaction
2.1.62 One of the key elements of the Power Sector Reforms was to protect the interest of the consumers and to ensure better quality of service to them. The consumers often face problems relating to supply of power such as non-availability of the distribution system for the release of new connections or extension of connected load, frequent tripping on lines and/ or transformers and improper metering and billing.
The JdVVNL was required to introduce consumer friendly actions like introduction of computerized billing, online bill payment, establishment of customer care centres, etc. to enhance satisfaction of consumers and reduce the advent of grievances among them. The billing issues have already been discussed in preceding paragraphs. The redressal of grievances is discussed below:
Redressal of Grievances
2.1.63 The RERC specified (March 2003) the mode and time frame for redressal of grievance in Standard of Performances (Regulations) 2003, renamed (May 2003) as RERC (Guidelines for redressal of grievances) Regulation 2003 (Regulations) in pursuance of section 57 of Electricity Act, 2003. The RERC had also prescribed the Standards of Performance (SOP) for Company in which the time limit for rendering services to the Consumers and compensation payable for not adhering to the same. The nature of services contained in the Standards inter-alia include line breakdowns, Distribution Transformer failures, period of load shedding/ scheduled outages, voltage variations, meter complaints, installation of new meters/ connections or shifting thereof, etc.
In pursuance to the directions of RERC, the JdVVNL issued (December 2003) detailed instructions to be followed for redressal of consumer grievances which were further elaborated in the Terms and Conditions of Supply (TCOS) 2004. Grievances relating to interruptions in power supply were to be registered at complaint centres/substations, whereas complaints relating to quality of power supply were to be registered at the subdivision office. The JdVVNL awarded (April 2005) the work of handling of “no current” complaints through dedicated IT enabled call centres in urban areas.
To enable the compilation of complaints for assessing the performance on this account, separate registers were to be maintained by the JdVVNL. The overall position as regard to receipt of complaints and their clearances is depicted in
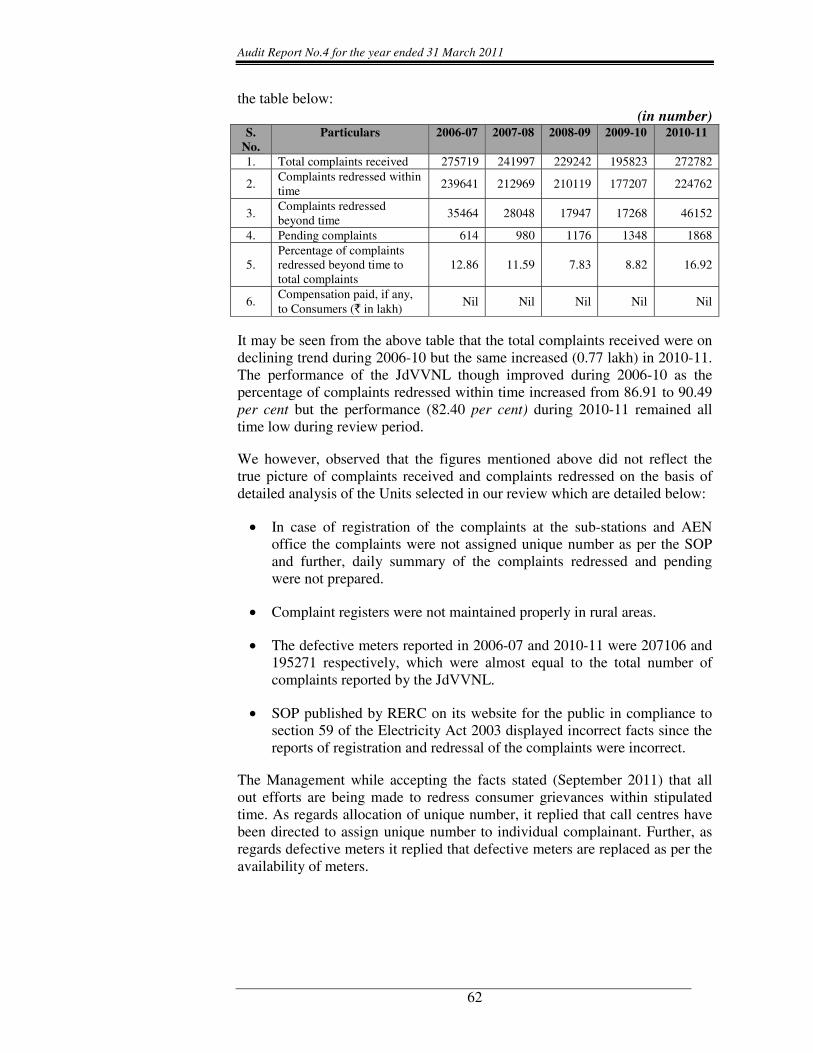
Audit Report No.4 for the year ended 31 March 2011
62
the table below: (in number)
S. No.
Particulars 2006-07 2007-08 2008-09 2009-10 2010-11
1. Total complaints received 275719 241997 229242 195823 272782
2. Complaints redressed within time
239641 212969 210119 177207 224762
3. Complaints redressed beyond time
35464 28048 17947 17268 46152
4. Pending complaints 614 980 1176 1348 1868
5. Percentage of complaints redressed beyond time to total complaints
12.86 11.59 7.83 8.82 16.92
6. Compensation paid, if any, to Consumers (� in lakh)
Nil Nil Nil Nil Nil
It may be seen from the above table that the total complaints received were on declining trend during 2006-10 but the same increased (0.77 lakh) in 2010-11. The performance of the JdVVNL though improved during 2006-10 as the percentage of complaints redressed within time increased from 86.91 to 90.49 per cent but the performance (82.40 per cent) during 2010-11 remained all time low during review period.
We however, observed that the figures mentioned above did not reflect the true picture of complaints received and complaints redressed on the basis of detailed analysis of the Units selected in our review which are detailed below:
• In case of registration of the complaints at the sub-stations and AEN office the complaints were not assigned unique number as per the SOP and further, daily summary of the complaints redressed and pending were not prepared.
• Complaint registers were not maintained properly in rural areas.
• The defective meters reported in 2006-07 and 2010-11 were 207106 and 195271 respectively, which were almost equal to the total number of complaints reported by the JdVVNL.
• SOP published by RERC on its website for the public in compliance to section 59 of the Electricity Act 2003 displayed incorrect facts since the reports of registration and redressal of the complaints were incorrect.
The Management while accepting the facts stated (September 2011) that all out efforts are being made to redress consumer grievances within stipulated time. As regards allocation of unique number, it replied that call centres have been directed to assign unique number to individual complainant. Further, as regards defective meters it replied that defective meters are replaced as per the availability of meters.
Chapter II Performance Audit relating to Government Companies
63
Energy Conservation
2.1.64 Recognising the fact that efficient use of energy and its conservation is the least-cost option to mitigate the gap between demand and supply, the GOI enacted the Energy Conservation Act, 2001. The conservation of energy being a multi-faceted activity, the Act provides both promotional and regulatory roles on the part of various organisations. The promotional role includes awareness campaigns, education and training, demonstration projects, R & D and feasibility studies. The regulatory role includes framing rules for mandatory audits for large energy consumers, devising norms of energy consumption for various sectors, implementation of standards and provision of fiscal and financial incentives. The shortcomings in implementation/adherence of energy conservation measures/regulations noticed by us in the JdVVNL are as under:
• Terms and Conditions of Supply of Electricity (TCOS) 2004 provides a rebate of ‘five paisa’ per unit in the energy charges to consumers using ‘Solar Water Heating System’. It also introduced (August 2010) a scheme to grant � 500 per HP for installation of at least three star rated pump sets certified by Bureau of Energy Efficiency. However, we noticed that the JdVVNL did not promote usage of ‘Solar Energy’ and pump sets of more than three star ratings among consumers as only 33 consumers in all the nine circles were provided rebate of ‘five paisa’ and 27 consumers in Churu circle were provided grant of � 500 during review period.
• The JdVVNL created ‘Demand Side Management’ (DSM) cell to educate the consumers towards power consumption so as to reduce load during peak hours. It was noticed that the cell remained non-functional since creation and as such was discontinued in 2006.
• The ‘Bachat Lamp Yojna’ (BLY) launched (May 2007) by the GOI aimed to promote energy efficient lighting was not implemented by the JdVVNL till July 2011 and as such it was deprived of usage of energy saving devices like CFL, electric choke, ISI marked electrical appliances which were envisaged in scheme.
The Management in its reply stated (September 2011) that the response of consumers for ‘Solar Water Heating System’ was very poor in view of high investment and installation of at least three star rated pump set was purely a voluntary scheme. Further, expression of interest has been floated in July 2010 for implementation of BLY and is under process. The reply is not convincing as the JdVVNL has not implemented the schemes in true spirits and took the shelter of voluntary nature of the schemes. Further, it may be seen that there is no ‘Demand Side Management’ cell in JdVVNL to promote the energy conservation schemes for mitigating gap between demand and supply as desired by GOI in Energy Conservation Act.
Audit Report No.4 for the year ended 31 March 2011
64
Energy accounting and Audit
2.1.65 A concept of comprehensive energy accounting and audit was put in place with the objective to identifying the areas of energy losses and take steps to reduce the same through system improvements besides accurately accounting for the units purchased/ sold and losses at each level. The main objectives of energy audit are as follows:
• better and more accurate monitoring of the consumption of electricity by consumers;
• elimination of wastages;
• reduction of downtime of equipment;
• massive savings in operational costs and increase in revenue, etc.
The JdVVNL did not get conducted the mandatory Energy Audit from 2007 as was required under Energy Conservation Act, 2001. Thus, the efficiency of the JdVVNL towards energy conservation was not measurable. However, some shortcomings noticed in energy accounting during review period are as detailed below:
Feeder metering and accounting
2.1.66 The JdVVNL has been awarding the work of energy accounting to bring the reports relating to supply hours of agricultural feeders, status of feeder meters, breakers and capacitor banks, status of feeder meter equipments, load reports of agricultural feeders, and new commissioned meters. We noticed that the work of consumer indexing and metering of all feeders was not completed in the JdVVNL. We also noticed that there was no provision of installation of meters at the time of construction of feeders and the JdVVNL could not install meters at all feeders (only 92.66 per cent feeders were metered as on March 2010) to achieve the objective of energy accounting.
We observed that, this had resulted in non-utilisation/under-utilisation of the energy accounting reports as the feeders are interconnected and in case of disruption of a feeder, supply to consumers was made from other feeder. Similarly, energy accounting of a defective or unmetered feeder was also not possible. Hence, the object of ascertaining T&D loss of an individual feeder was not fulfilled to pinpoint the commercial or technical loss as is evident from the fact that the reports (August 2009 to January 2010) in Jodhpur District Circle reported negative T&D loss at 283 feeders whereas in 113 feeders losses were not worked out.
The Management while accepting the facts stated (September 2011) that there remained a gap in case of feeders on construction of new 33/11KV sub-stations and receipt of matching quantity of 11 KV VCBs. It further stated that due to error in consumer indexing, bifurcation of feeders on construction of new 33/11 KV sub-stations, temporary switching over of feeder load from one

Chapter II Performance Audit relating to Government Companies
65
feeder to another feeder may cause negative T&D losses on individual feeder. The management also stated that 100 per cent indexing of consumers with respective 11 KV feeder is in progress under R-APDRP scheme.
Consumer Metering
2.1.67 Metering of all consumers and timely replacement of defective meters is essential for effective energy accounting, billing of actual supply and real determination of distribution losses. The goal of 100 per cent metering was also aimed in the MOU (March 2001) of the State Government & the GOI and the objectives of R-APDRP scheme. Electricity Act, 2003 also stipulates that no supply should be made without meters. As on 31 March 2010, all the consumers except FRAC were metered consumers. Hence, meters were mainly purchased (� 207.17 crore during 2006-11) for replacement of defective meters and releasing new connections. We noticed the followings:
(a) RERC directed (March 2001) DISCOMs to convert the 3.97 lakh unmetered FRAC to metered category by 31 March 2004. However, the performance of DISCOMs remained poor and the targets were revised by annual targets. The performance of the JdVVNL was not encouraging and only 32755 unmetered FRAC could be converted into metered category by March 2006 against 81833 in March 2001. Further, it could not adhere the annual targets of conversion and only 9799 FRAC against the target of 20037 were converted into metered category during 2006-10. Thus, the JdVVNL was lagging behind in complying to the directions of RERC and provisions of Act.
The JdVVNL while accepting the fact of non-achievement of RERC targets stated (September 2011) that flat rate agriculture consumers could not be converted into metered category due to resistance of consumers.
(b) RERC directed (March 2001) for replacement of defective/stopped meters within two months from the date of detection by DISCOMs. The position of defective meters and their replacement by all DISCOMs during last four years ending on March 2010 is given in Annexure-15. An analysis of the JdVVNL revealed that though the rate of defective meters against total meters during 2006-10 declined from 10.02 per cent to 7.50 per cent but the replacement rate declined from 78.37 per cent to 53.13 per cent during the same period and also the replacement rate in comparison to total reported defective meters declined considerably from 101.93 per cent in 2006-07 to 82.37 per cent in 2009-10. Test check of records in selected three circles revealed that as on March 2010, 4399618 meters were pending for replacement beyond six months and 2744319 meters beyond 12 months against the period of two months prescribed by RERC. Further, during March 2010, 3031820
three phase consumers out of 138446 consumers and 13241421 single phase consumers out of 868542 consumers were billed on average basis.
18 43996(Jodhpur district circle 221, Pali 27943 and Barmer 15832). 19 27443(Jodhpur district circle 2, Pali 18581 and Barmer 8860). 20 30318 (Jodhpur district circle 16799, Pali 5748 and Barmer 7771). 21 132414 (Jodhpur district circle 46957, Pali 54158 and Barmer 31299).
Against the RERC directives of two months, 43996 meters were pending for replacement beyond six months and 27443 meters beyond 12 months.
Audit Report No.4 for the year ended 31 March 2011
66
Thus, the JdVVNL could not replace the defective meters within scheduled time and resultantly billing on average basis did not reflect the actual consumption of power and possibility of revenue loss cannot be ruled out.
The JdVVNL while accepting the facts stated (September 2011) that best efforts are being made to replace defective meters and to improve the position special campaign is being organized to replace the defective meters within time schedule.
Monitoring by top Management
2.1.68 The DISCOMs play an important role in the State economy. For such a giant organizational setup, to succeed in operating economically, efficiently and effectively, there has to be a Management Information System (MIS) for monitoring by top management. The monthly progress report is prepared after compiling the information collected from all the circles and sections at head office in the form of Demi-Official letter and is submitted to CMD (DISCOMs) for onward submission to Energy Department, GOR and others. Besides the issues are discussed in the Board meetings, DISCOMs Coordination Committee meetings and monthly meetings of the senior officers.
The Management stated (September 2011) that various remedial measures have been taken by the management after discussing the problems in senior officers’ meeting as well as on other lower level.
Conclusion
• Plans for capacity additions were not prepared keeping in view the load growth and hence, gap between connected load and the transformation capacity increased over the years;
• The DISCOMs could not achieve the targets/objectives of RGGVY and APDRP/R-APDRP due to deficient planning;
• Long-term power purchase agreements were not adequate even to meet the demand approved by RERC and DISCOMs purchased power at high cost through short-term agreements and UI purchases;
• Sub-transmission and distribution losses were in excess than approved by RERC;
• The targets of vigilance checking and theft detection were not adequate. Age wise analysis of outstanding dues from sale of power and vigilance assessment was not proper in JdVVNL which affected the recovery of debts/old debts;
Chapter II Performance Audit relating to Government Companies
67
• Non-revision of tariff, inadequate State Government support and supply of power to flat rate agricultural consumers at subsidized rates caused wide gap between revenue realised and cost of power supply which was funded through borrowings from financial institutions;
• Even after revision of tariff after a prolonged period of six years, cross subsidy was non-existent and all the categories of consumers were still being supplied power at less than average cost of supply; and
• JdVVNL did not get done mandatory energy audit under Energy Conservation Act, 2001 and also could not install meters at all feeders to achieve the objective of energy accounting.
Recommendations
• The State Government should provide adequate package in real terms to DISCOMs to sustain their operational and financial viability in the interests of common people at large.
The DISCOMs needs to:
• Plan the capacity addition in accordance with the load growth to ensure stable and quality power supply.
• Take effective steps to ensure timely completion of schemes to achieve the envisaged benefits.
• Enter into long-term power purchase agreements to minimise power purchase from short-term and UI at high cost.
• Ensure timely revision of tariff and adhere to the directions of RERC to convert flat rate agriculture consumers into metered category and bring transmission and distribution losses to the approved levels.
• Re-assess the targets of vigilance checking and theft detection to prevent theft of power.
• Evolve an effective and efficient system for realization of dues.
• Ensure energy accounting at all level and energy audit.
Audit Report No.4 for the year ended 31 March 2011
68
Rajasthan State Industrial Development and Investment Corporation Limited
2.2 Performance Audit on “Industrial Promotion and Infrastructure Activity”
Executive Summary
Rajasthan State Industrial Development and Investment Corporation Limited was renamed (January 1980) to undertake exclusively the activities promoting industrialisation in the State and to achieve the objectives of State Industrial Policy/Policies. The Company is mainly engaged in acquisition of land, building infrastructure and developing industrial areas, financial assistance to industrial projects, and provide concessions as per the policy of the State Government. As on March 2010, the Company developed 322 industrial areas by acquiring about 60395 acres of land wherein 27130 industrial units are established. IPI activity contributed 86 per cent of the total revenue earned during 2005-10, whereas remaining 14 per cent was contributed by investment and other activities.
Implementation of State Industrial Policy
The Company did not plan to develop thrust sectors envisaged in the Industrial Policy i.e. Auto Ancillary at Sitapura (Jaipur), textile at Sitapura and Sanganer (Jaipur) and Jodhpur. Further, the development of wool industry sector and handicrafts sector at Bikaner and Jaisalmer was not achieved (July 2011) even after elapse of 13 years.
Acquisition and development of land
During 2005-10, the Company planned for development of 26 industrial areas on 8986 acre of land. There was significant delay up to 143 months in planning for development of 2445 acre land (12 industrial areas) acquired prior to April 2005. Similarly, 2159 acre of land acquired during 2005-09 was not planned for development at the end of March 2010. Further, the Company also failed to take possession of 2014.04 acres of land despite payment of premium/ compensation of ���� 117.54 crore. Out of pending possession of 787.08 acre as on April 2005, the Company was able to take
possession of only 27.32 acre land during 2005-10.
As on April 2005, 8224 acre of land was lying undeveloped in 68 industrial areas of 24 units. However, while fixing the targets for development of industrial areas this was not considered. Accordingly, the targets set for development were at lower side and not commensurate with total land lying undeveloped at the beginning and acquired during the year.
The Company did not adhere the terms and conditions of allotment of the Government land and did not execute the lease deed for 8536 acre of land. Further, there was delay in mutation of land in revenue records in 21 units for 2532 acre private land acquired during 2005-10.
The land under encroachment/litigation increased from 260.03 acre (���� 7.80 crore) in 2004-05 to 651.37 acre (���� 83.63 crore) in 2009-10. Further, improper planning and delay in providing information hampered the industrial development and also led to blockage of funds.
Without ensuring physical possession of entire land, approval of lay-out plan of industrial areas delayed the development process. Decision of the Infrastructure Development Committee (IDC) for not providing infrastructure facilities in ‘other areas’ defeated the very basic objective of industrial development and adversely affected the industrial growth in these areas.
The industrial areas remained deprived from quality services for which the Company paid a bit higher cost than the normal contracts as the Company did not invoke the defect liability clause despite various defects noticed in the works executed at different units.
Allotment of land
The targets for allotment of plots were on lower side (ranged between 11.96 and
Audit Report No.4 for the year ended 31 March 2011
70
23.34 per cent) and not commensurate with the total plots remained un-allotted at the beginning of the year. Despite low targets, the Company could not achieve the same during 2007-10. The Company did not take corrective measures by analysing the reasons of non/slow-allotment of plots in 39 areas where the plots (ranged between 9 and 138) remained un-allotted for more than five years.
The concessions available at the time of initiating land allotment process in new industrial areas were not publicised which led to non-allotment of plot to ex-servicemen/war-widows, women and SC/ST category entrepreneurs in 20, 14 and 17 industrial areas launched during 2005-10. Further, in absence of maximum ceiling, allotment of concessional plots in excess of prescribed limit to SC/ST and women category of entrepreneurs led to loss of ���� 27.79 crore during last five years.
The Company sustained loss of ���� 9.56 crore due to non-adherence to RIICO Disposal of Land Rules in allotment of land and violating the laid down rules/policy. Besides, there were instances of allotment of land without ensuring physical possession of land/allotment before possession.
Central Assisted Schemes
The various Centrally sponsored schemes viz; Integrated Infrastructural Development, Agro Food Park, Growth Centre, Apparel Park for Export, Special Economic Zones etc. implemented by the Company to attain the objectives of promoting industrial growth, removing regional disparities and improving infrastructure in the State, could not be implemented within time schedule and there was delay upto 148 months. Further, improper planning, defective project reports indicate the Company’s failure towards achievement of very purpose of the schemes.
Corporate Social Responsibility
The corpus of Village Amenities Development Fund (VADF) and Skill Development Fund (SDF) created as per the State Government directives was not utilised in true spirits to fulfill the objectives of CSR as envisaged in the scheme. Further, the Company could not
recover ��������4.27 crore towards VADF/SDF due to non-insertion of clause in MOUs executed with six cement companies.
Entrepreneur Satisfaction Survey
Entrepreneur Satisfaction Survey (ESS) conducted by us during the course of performance audit revealed that the unit offices of the Company largely failed to provide basic infrastructural facilities to the entrepreneurs in the industrial areas which had adversely affected the units in production and consequently the pace of industrialisation in the State.
Conclusion and Recommendations
The performance of the Company towards industrial promotion and development in the State was deficient as it did not prepare long term plans for balanced regional development and the acquired land remained undeveloped for long period. The objective of developing thrust sectors at identified places in the State Industrial Policy 1998 was not fully achieved. There were discrepancies in land records and the Company did not adhere to the terms and conditions of Government allotted land and the mutation of private land in revenue records was also not done. Further, improper planning, inadequate site survey caused non-acquisition/partial acquisition of land which hampered the industrial development process besides blockage of funds. Faulty approval of lay out plans due to non-acquisition/obtaining physical possession of entire land caused allotment of un-acquired land. The IDC violated the laid down rules and made decisions on case-to-case basis, which led to undue benefit to some entrepreneurs besides causing loss of revenue. Non-monitoring of centrally sponsored schemes by the apex management led to delay in implementation of the schemes and consequently, the State was deprived of the envisaged benefits of industrial growth. The review contains seven recommendations which includes adherence to the procedure of land acquisition, preparation of long term plans, compliance of rules, regulations and policies, effective monitoring of schemes, providing quality infrastructure facilities etc.
Chapter II Performance Audit relating to Government Companies
71
Introduction
2.2.1 To promote environmentally sustainable industrial growth and balanced regional development, catalyzing investments, accelerating economic growth and creating large scale employment opportunities, a supportive institutional environment and infrastructure that facilitates and fosters private sector investment and enterprises is vital.
In Rajasthan, Rajasthan State Industrial and Mineral Development Corporation Limited (RSIMDC) was incorporated in March 1969, as a wholly owned State Government Company to undertake the activities of mineral development and support the industrial framework in the State. RSIMDC was renamed (1 January 1980) as Rajasthan State Industrial Development and Investment Corporation Limited (Company ) to exclusively undertake the activities promoting industrialisation in the State and to achieve the objectives of State Industrial Policy/Policies. The Company is mainly engaged in acquisition of land, building infrastructure and developing industrial areas, financial assistance to industrial projects, and provide concessions as per the policy of the State Government. As on March 2010, the Company has developed 322 industrial area by acquiring about 60395 acres of land wherein 27130 industrial units are established.
The Government of Rajasthan announced Industrial Policy 1998 with the principal objective of making Rajasthan, the most preferred State for investment in the identified sectors and to ultimately achieve global competitiveness. The policy laid special emphasis on accelerating the overall pace of industrial growth, increasing employment opportunities, improving productivity, ensuring sustainable development and strengthening the small-scale industries, tiny and cottage industry sector. The industrial policy of 1998 was replaced (2010) by Rajasthan Industrial and Investment Promotion Policy 2010.
The Management of the Company is vested in Board of Directors (BOD) consisting of nine Directors as on 31 March 2010. All the Directors are appointed by the State Government, except one Director to be nominated by the Industrial Development Bank of India. The Chairman and Managing Director/Managing Director is the Chief Executive of the Company and is assisted by an Executive Director, three Advisors (Financial Advisor, Advisor (Infra), Advisor (A&M)) and Chief General Managers/General Managers. The decisions regarding development of industrial area are taken by Infrastructure Development Committee (IDC) comprising of Chairman, Managing Director and four Directors nominated by the Board.
Industrial Promotion and Infrastructure Activity
2.2.2 The industrial sector in Rajasthan experienced an average growth rate of 6.14 per cent during 2005-10 as compared to all India growth of 7.60 per cent. The industrial sector in the State accounts for about 32.5 per cent of the total share of the State’s economy.
Audit Report No.4 for the year ended 31 March 2011
72
The Gross Domestic Product (GDP) growth in Rajasthan during 2005-10 was 7.75 per cent as against 11.3, 11, 9.6, 8.5, 8.1 and 8.1 per cent in Gujarat, Haryana, Bihar, Karnataka, Kerala and Andhra Pradesh respectively. The State GDP remained low as compared to the all India average growth rate of nine per cent.
The infrastructure facilities provided in a State are the corner stone for development of industrial sector. As the Company is a sole agency of the State Government to develop industrial infrastructure and promote industrialisation in Rajasthan, in accordance with the State Government policy/industrial policy, we conducted the performance audit of the ‘Industrial Promotion and Infrastructure (IPI)
Activity’ carried on by the Company during the period 2005-10.
The IPI activity of the Company mainly consists of acquiring land (Government and Private) in different areas of the State for developing industrial sector, developing required infrastructure in those areas, allotment of land to the entrepreneurs and monitoring of the stock of land.
Scope of Audit
2.2.3 A comprehensive review on “Industrial Promotion and Infrastructure activity’ appeared in the Audit Report (Commercial) for the year ended 31 March 2004. The review had been discussed by the Committee on Public Undertakings (COPU) on 8 June 2007 and the recommendations of the Committee are awaited (July 2011).
The present review conducted during January 2011 to June 2011 covers ‘Industrial Promotion and Infrastructure (IPI) activity’ carried by the Company during the period 2005-06 to 2009-10. The audit examination involved scrutiny of records at the Head Office and eight units1 selected for detailed scrutiny on the basis of their turnover, development expenditure and acquisition of land during 2005-10.
Audit objectives
2.2.4 Performance audit on IPI activity of the Company was carried out to evaluate and to get a reasonable assurance that:
• the IPI activities have been carried out as per the mandate, Industrial Policy of the Government of Rajasthan (GOR);
• the survey of area was carried out properly and effectively before demarcation of land for acquisition to avoid acquisition of encroached land/post acquisition disputes;
�1 Ajmer, Balotra, Bhiwadi-I, Bhiwadi-II, Jaipur (North), Jaipur (Rural), Kota and
Neemrana.�
Chapter II Performance Audit relating to Government Companies
73
• the allotments of plots were made as per the RIICO Disposal of Land Rules 1979;
• the Government of India (GOI)/GOR schemes were implemented effectively and efficiently;
• an effective mechanism existed for recovery of dues as per RIICO Disposal of Land Rules, 1979; and
• the entrepreneurs were satisfied with infrastructure facility.
Audit Criteria
2.2.5 The performance audit on IPI activity was assessed against the:
• provisions of the Land Acquisition Act, 1894 and Rajasthan Land Revenue Act, 1956;
• Rajasthan Industrial Policy, 1998 and Rajasthan Investment Promotion Scheme, 2003;
• targets of land acquisition, development and allotment of plots;
• terms and conditions of works executed;
• provisions of the RIICO Disposal of Land Rules, 1979; and
• The GOI guidelines for implementation of Central Assisted Schemes.
Audit methodology
2.2.6 We adopted a mix of the following methodologies during the audit.
• examination of agenda and minutes of BOD and the IDC meeting;
• scrutiny and analysis of survey reports for land acquisition and land acquisition records;
• review of lay out plans for development of different land;
• scrutiny and analysis of different contracts awarded;
• review of records related to administrative sanctions;
• review of records related to allotment of plots;
• analysis of entrepreneur satisfaction survey conducted by us in selected units; and
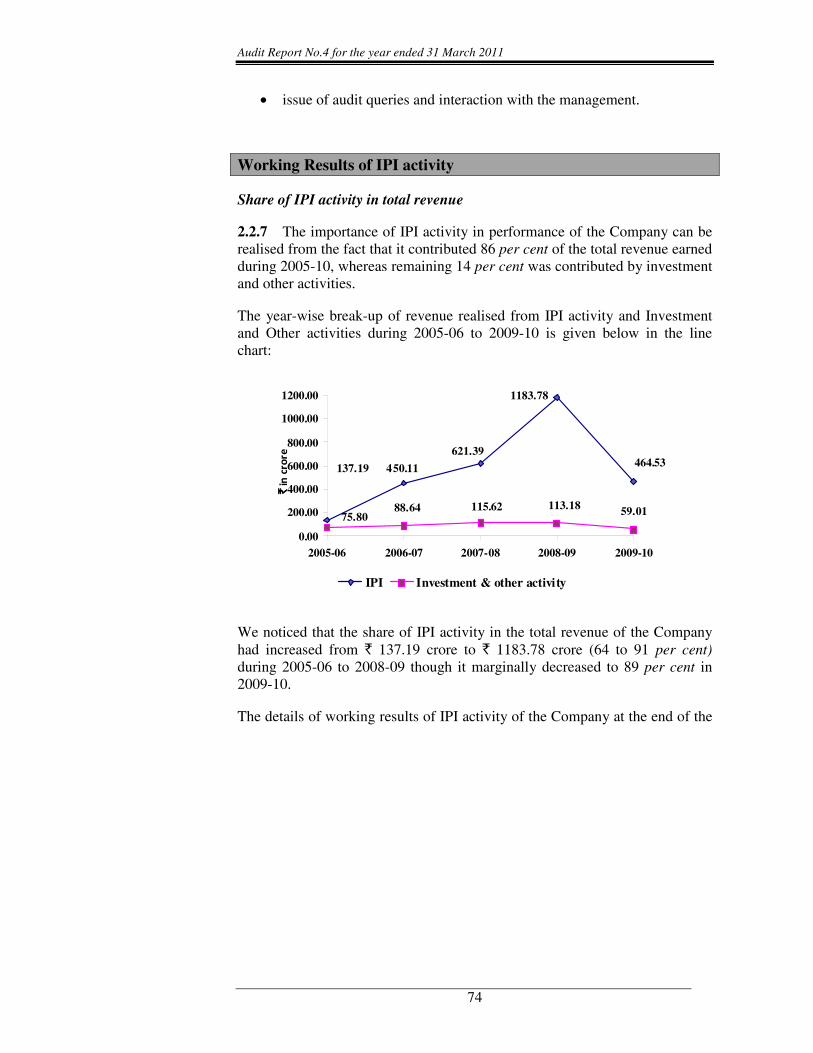
Audit Report No.4 for the year ended 31 March 2011
74
• issue of audit queries and interaction with the management.
Working Results of IPI activity
Share of IPI activity in total revenue
2.2.7 The importance of IPI activity in performance of the Company can be realised from the fact that it contributed 86 per cent of the total revenue earned during 2005-10, whereas remaining 14 per cent was contributed by investment and other activities.
The year-wise break-up of revenue realised from IPI activity and Investment and Other activities during 2005-06 to 2009-10 is given below in the line chart:
137.19 450.11
621.39
1183.78
464.53
75.8088.64 115.62 113.18 59.01
0.00
200.00
400.00
600.00
800.00
1000.00
1200.00
2005-06 2006-07 2007-08 2008-09 2009-10
�� �����������
IPI Investment & other activity
We noticed that the share of IPI activity in the total revenue of the Company had increased from � 137.19 crore to � 1183.78 crore (64 to 91 per cent) during 2005-06 to 2008-09 though it marginally decreased to 89 per cent in 2009-10.
The details of working results of IPI activity of the Company at the end of the
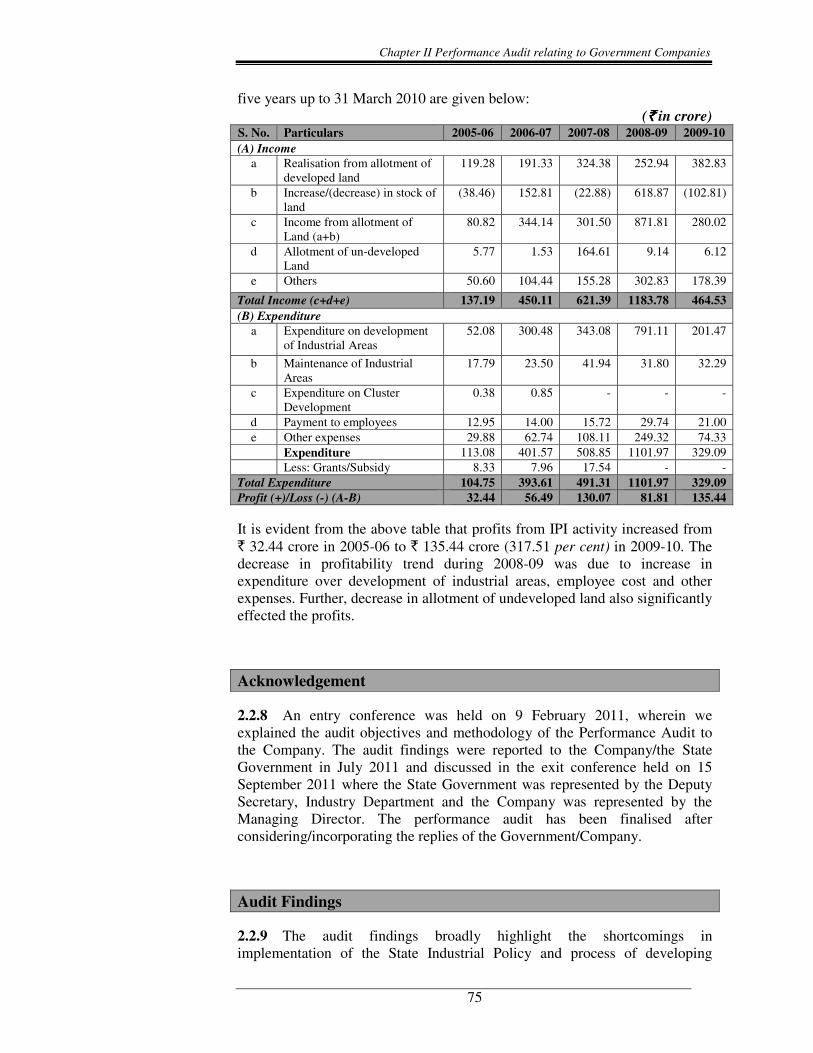
Chapter II Performance Audit relating to Government Companies
75
five years up to 31 March 2010 are given below: (���� in crore)
S. No. Particulars 2005-06 2006-07 2007-08 2008-09 2009-10 (A) Income
a Realisation from allotment of developed land
119.28 191.33 324.38 252.94 382.83
b Increase/(decrease) in stock of land
(38.46) 152.81 (22.88) 618.87 (102.81)
c Income from allotment of Land (a+b)
80.82 344.14 301.50 871.81 280.02
d Allotment of un-developed Land
5.77 1.53 164.61 9.14 6.12
e Others 50.60 104.44 155.28 302.83 178.39
Total Income (c+d+e) 137.19 450.11 621.39 1183.78 464.53 (B) Expenditure
a Expenditure on development of Industrial Areas
52.08 300.48 343.08 791.11 201.47
b Maintenance of Industrial Areas
17.79 23.50 41.94 31.80 32.29
c Expenditure on Cluster Development
0.38 0.85 - - -
d Payment to employees 12.95 14.00 15.72 29.74 21.00 e Other expenses 29.88 62.74 108.11 249.32 74.33
Expenditure 113.08 401.57 508.85 1101.97 329.09 Less: Grants/Subsidy 8.33 7.96 17.54 - - Total Expenditure 104.75 393.61 491.31 1101.97 329.09 Profit (+)/Loss (-) (A-B) 32.44 56.49 130.07 81.81 135.44
It is evident from the above table that profits from IPI activity increased from � 32.44 crore in 2005-06 to � 135.44 crore (317.51 per cent) in 2009-10. The decrease in profitability trend during 2008-09 was due to increase in expenditure over development of industrial areas, employee cost and other expenses. Further, decrease in allotment of undeveloped land also significantly effected the profits.
Acknowledgement
2.2.8 An entry conference was held on 9 February 2011, wherein we explained the audit objectives and methodology of the Performance Audit to the Company. The audit findings were reported to the Company/the State Government in July 2011 and discussed in the exit conference held on 15 September 2011 where the State Government was represented by the Deputy Secretary, Industry Department and the Company was represented by the Managing Director. The performance audit has been finalised after considering/incorporating the replies of the Government/Company.
Audit Findings
2.2.9 The audit findings broadly highlight the shortcomings in implementation of the State Industrial Policy and process of developing
Audit Report No.4 for the year ended 31 March 2011
76
industrial areas viz. acquisition, development and allotment of land. The performance audit also indicates the deficiencies in implementation of GOI schemes, Company’s contribution towards corporate social responsibility. Apart from these, we also assessed the satisfaction level of entrepreneurs and internal control and monitoring mechanism. These findings are discussed in succeeding paragraphs.
Implementation of State Industrial Policy
2.2.10 The State Industrial Policy 1998 envisaged various tasks i.e.establishment of business centres, special industrial complexes at identified locations, development of Integrated Industrial Parks (IIPs), proper upkeep and maintenance of the existing industrial areas to be accomplished by the Company.
Establishment of thrust sectors
2.2.11 The Industrial Policy identified 12 thrust sectors to meet out the requirement of specific industries2 and envisaged development of special industrial complexes at 21 identified locations by the Company for the thrust sectors. Pursuant to the Industrial Policy, the Company developed (between August 1998 and July 2009) these thrust sectors at 15 identified locations only.
During the detailed audit conducted at unit offices, we noticed that out of 12 identified thrust sectors of industrialisation, the Company did not plan to develop the Auto Ancillary sector at Sitapura (Jaipur), textile sector at Sitapura and Sanganer (Jaipur) and Jodhpur. Further, the development of wool industry sector and handicrafts sector at Bikaner and Jaisalmer was not achieved (July 2011) even after elapse of 13 years in absence of any time limit for accomplishment of the tasks from the GOR.
The Government stated (October 2011) that the Company was committed to develop theme based industrial complexes responding to the need of the areas and demand from entrepreneurs. The reply is not convincing as the objectives of industrial policy 1998 remained unachieved and the State Government has declared new industrial policy 2010 with fresh objectives.
Acquisition and development of land
2.2.12 Identification of land in accordance with the prospective planning and its acquisition is of prime importance for development of industrial areas. The Company acquires private land in accordance with the provisions of Land Acquisition Act, 1894. Besides, the State Government also allots government �2 Gems and Jewellery, Hosiery, Auto Ancillary, Ceramics, Software technology,
Electronics and Telecom, Textile, Agro Industries, Leather, Wool Industries, Handicrafts and Dimensional Stone.�

Chapter II Performance Audit relating to Government Companies
77
land to the Company for industrial purpose.
The position of land acquired, developed during 2005-10 and allotted up to March 2011 by the Company is given in Annexure-16. During 2005-10, the Company has planned for development of 26 industrial areas on 8986 acre of land. It could be seen from the Annexure that:
• The Company planned development of 2445.07 acre of land acquired prior to April 2005 after a delay ranging between three months and 143 months. Further, 2158.79 acre land acquired between April 2005 and March 2009 was also not planned for development at the end of March 2010.
• Out of 8986.31 acre land in 26 industrial areas planned for development during 2005-10, the Company was able to allot 3066.92 acre of land.
• Out of total 10446.52 acres land acquired during 2005-10, possession of 2014.04 acres land could not be obtained, though payment of premium/compensation of � 117.54 crore has been made for the same.
Besides, out of pending possession of 787.08 acre land as on April 2005, the Company was able to take possession of 27.32 acre land at the end of March 2010.
The Government while accepting the delay in taking possession stated (October 2011) various reasons i.e. unauthorized occupancy/construction on land, non-acceptance of compensation by khatedars, litigation/dispute regarding ownership of land etc. due to which possession of land could not be taken. It further stated that now directions have been issued to the unit offices to ensure land free from encroachment before deposition of premium/compensation. The fact remains that a huge amount remained blocked for significant period besides delay in development process.
Planning of undeveloped land
2.2.13 Our analysis of the system of planning adopted by the Company for undeveloped land revealed that out of 8224 acre land in 68 industrial areas of 24 units as on April 2005, it developed only 2201 acre land (26.76 per cent) during last five years ending March 2010. The Company against the target of development of 6337 acre land during 2005-10, developed 6049 acre (inclusive of 2201 acre) land.
We observed that the Company did not prepare any long term plan for development of industrial areas to ensure balanced growth of industries in all the parts of the State. Further, the targets set for development were at lower side and the land lying undeveloped prior to 2005 was not considered while making short term plans.
The Government stated (October 2011) that the Company acquires land looking to the future industrial prospective in a particular area and depending
During 2005-10, the Company could not take possession of 2014.04 acre land despite payment of ���� 117.54 crore.
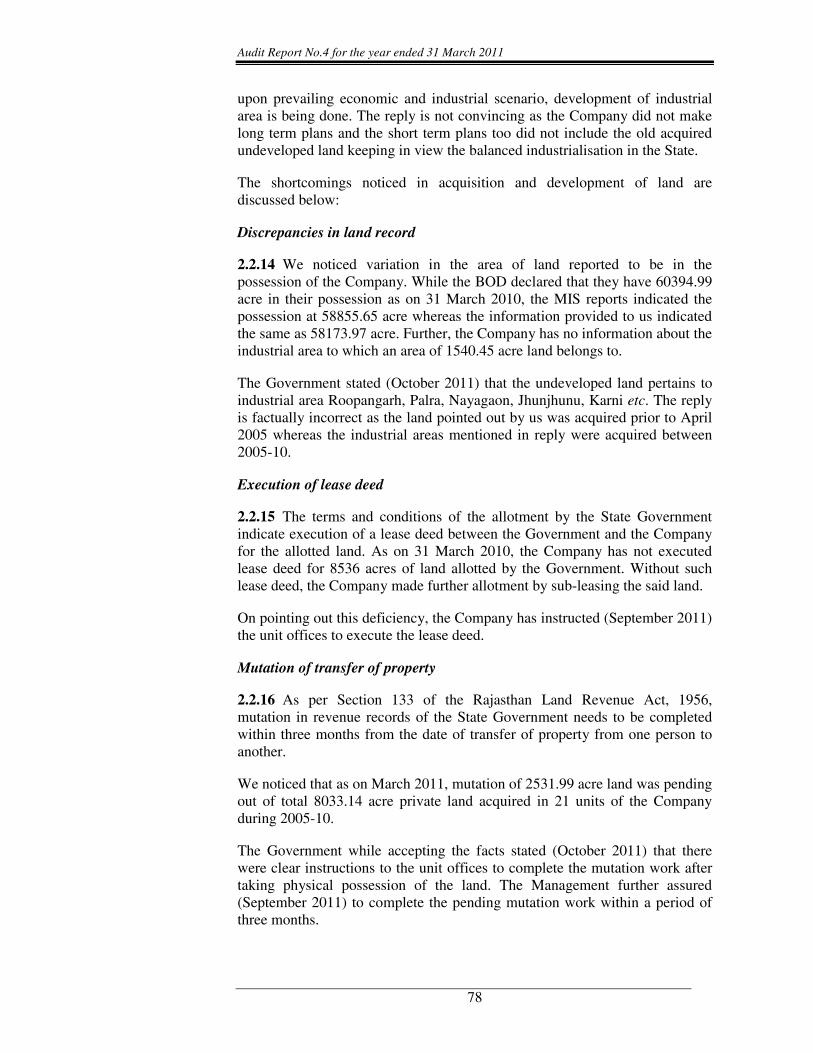
Audit Report No.4 for the year ended 31 March 2011
78
upon prevailing economic and industrial scenario, development of industrial area is being done. The reply is not convincing as the Company did not make long term plans and the short term plans too did not include the old acquired undeveloped land keeping in view the balanced industrialisation in the State.
The shortcomings noticed in acquisition and development of land are discussed below:
Discrepancies in land record
2.2.14 We noticed variation in the area of land reported to be in the possession of the Company. While the BOD declared that they have 60394.99 acre in their possession as on 31 March 2010, the MIS reports indicated the possession at 58855.65 acre whereas the information provided to us indicated the same as 58173.97 acre. Further, the Company has no information about the industrial area to which an area of 1540.45 acre land belongs to.
The Government stated (October 2011) that the undeveloped land pertains to industrial area Roopangarh, Palra, Nayagaon, Jhunjhunu, Karni etc. The reply is factually incorrect as the land pointed out by us was acquired prior to April 2005 whereas the industrial areas mentioned in reply were acquired between 2005-10.
Execution of lease deed
2.2.15 The terms and conditions of the allotment by the State Government indicate execution of a lease deed between the Government and the Company for the allotted land. As on 31 March 2010, the Company has not executed lease deed for 8536 acres of land allotted by the Government. Without such lease deed, the Company made further allotment by sub-leasing the said land.
On pointing out this deficiency, the Company has instructed (September 2011) the unit offices to execute the lease deed.
Mutation of transfer of property
2.2.16 As per Section 133 of the Rajasthan Land Revenue Act, 1956, mutation in revenue records of the State Government needs to be completed within three months from the date of transfer of property from one person to another.
We noticed that as on March 2011, mutation of 2531.99 acre land was pending out of total 8033.14 acre private land acquired in 21 units of the Company during 2005-10.
The Government while accepting the facts stated (October 2011) that there were clear instructions to the unit offices to complete the mutation work after taking physical possession of the land. The Management further assured (September 2011) to complete the pending mutation work within a period of three months.
Chapter II Performance Audit relating to Government Companies
79
Land under encroachment/litigation
2.2.17 The area of land under encroachment/litigation increased from 260.03 acre in 2004-05 to 651.37 acre in 2009-10. The value of land under encroachment/litigation increased from � 7.80 crore to � 83.63 crore in 2009-10. Out of total land under encroachment/litigation, 167.25 acre falls in the National Capital Region (NCR) of Delhi. The Company does not maintain proper records relating to litigated/encroached land as different sources pointed out different areas of land. While the Company’s books of accounts maintained it as 651.37 acre, the MIS reports indicated it as 1089.54 acres. The Company has reduced the quantum of land holdings to 651.37 acres in 2009-10, though payments have been made for the same. Despite the availability of rules and regulations for eviction of unauthorised encroachments, the Company is unable to enforce the same effectively.
Payment of land tax
2.2.18 The GOR levied (1 April 2006) land tax on land admeasuring more than four hectares at rates notified from time to time. The Company pays land tax on the saleable stock of developed and un-developed land held by it.
We noticed that the rate of land tax was reduced from � 1.50 per sqm to � 0.75 per sqm from April 2009 onwards but the Company paid land tax at the rate of � 1.50 per sqm against the saleable stock during 2009-10 (302.43 lakh sqm) and 2010-11 (259.97 lakh sqm) which led to excess payment of � 4.22 crore.
The Management stated (September 2011) that it was not aware about revision in land tax rates and on receipt of demand from the Additional Collector (Stamps) it paid the land tax for 2009-10 and 2010-11 at the pre-revised rates. The Government stated (October 2011) that the matter is being persued with revenue department to adjust the excess paid land tax against the demand of 2011-12.
Delay in land acquisition process
2.2.19 As per Section 11A of the Land Acquisition Act, 1894 (Act), award should be made within a period of two years from the date of publication of declaration under Section 6 and if no award is made within that period, the entire proceeding for the acquisition of the land shall lapse.
We noticed that notification/declaration under Section 4 and 6 to acquire 3148 Bigha land for expansion of Industrial Area Boranada was issued on 4 August 2005 and 20 June 2006 respectively. We observed that delay in constitution of committee for deciding the rate of award coupled with failure to provide the valuation report of structures, trees etc. by the concerned unit office despite repeated reminders (August 2007 to February 2008) by the LAO, the final award for the land could not be declared within the stipulated time period (June 2008) of two years and the whole process of land acquisition has been defeated.
Thus, the industrialisation process was adversely affected as the entire process
Even after reduction in the land tax rates, payment at pre-revised rate caused excess payment of ���� 4.22 crore.
Audit Report No.4 for the year ended 31 March 2011
80
of land acquisition has become unfruitful.
The Government stated (October 2011) that the land acquisition process was delayed due to status-quo orders of Rajasthan High Court and further, the LAO also could not complete the hearing under section 9(3) to get claims of khatedar due to law and order situation. The reply is not convincing in view of the fact that only eight khatedars (out of total 112 khatedars) filed writ petition which were also disposed off by the High Court in April 2008 itself. Further, provision of the Act provides that the period during which any action or proceedings to be taken in pursuance of the said declaration is stayed by an order of court shall be excluded in computing the period of two years but failure on the part of the Company in providing requisite information i.e.valuation reports led to non-acquisition of land.
Improper planning in acquisition of land at industrial area, Manda Bhinda
2.2.20 Based on the report of Site Selection Committee, the Company sent (January 2006) proposal to the District Collector (Jaipur) to set-apart 404.05 hectare government land and acquisition of 9.14 hectare private land falling within the proposed industrial area. The District Collector set-apart (November 2006) 348.31 hectare (two different chunks) and handed over (March 2007) the possession of the land on receipt of premium amounting to � 5.64 crore.
We noticed that the Company could develop only 135.01 hectare land (one chunk) in phase-I out of total 348.31 hectare land. The remaining land planned for development in phase –II could not be developed till July 2011 due to non-acquisition of 170.06 hectare land lying between phase-I and phase-II. The said land between two chunks could not be acquired as there was court stay on 143.18 hectare government land whereas District Collector was not requested for setting-apart 17.74 hectare and non-possession of 9.14 hectare private land despite the fact that the Company had paid compensation of � 2.20 crore for acquisition of private land.
We observed that the development planning of the Company was weak as development of phase–II in near future is not feasible due to non-availability of proper approach road between phase-I and phase-II.
The Government stated (October 2011) that phase-II was planned separately and development would commence after getting environmental clearance. It further stated that the village road would be improved to connect both phases of industrial area. The reply is not convincing as the phase –II could not be developed due to non-acquisition of private land lying between phase-I and II. Further, the requirement of Environment Impact Assessment (EIA) for more than 50 hectare land was applicable from December 2009 only.
Thus, improper planning in acquisition of land not only led to blockage of funds but also hampered the development works.
Chapter II Performance Audit relating to Government Companies
81
Development of land/Industrial Area
2.2.21 After taking possession of the land for developing industrial area, the concerned unit offices are required to prepare lay out plan of the IA on the basis of survey of the land and thereafter the same is required to be submitted to the planning cell of Corporate office. The unit offices are also required to submit certain information along with the lay out plan such as location map, khasra map with details of land allotted/to be allotted, actually required, land whose possession has been taken. The planning cell after scrutiny of the information provided by the unit offices and lay out plan submitted by them finalises the lay out plan of the industrial area.
We noticed that the laid down procedure was not followed scrupulously by the unit offices as the unit offices without ensuring physical possession of the entire land sent the proposals to the planning cell for approval of lay out plans. This led to approval of faulty lay out plans of ‘Integrated Infrastructure Development’ (IID) Khushkhera and industrial area Khushkhera (extension) as the physical possession of entire land was not ensured. As a result, the physical possession of 77 plots in IID and two plots allotted in Khushkhera (extension) allotted to the entrepreneurs between August 2005 and February 2006 could not be given. Subsequently, the entrepreneurs were allotted (between June 2008 and November 2010) alternate plots after modifying the original lay-out of these areas. Similar type of irregularities noticed in selected unit offices are discussed under paragraphs 2.2.35, 2.2.37 (a) and 2.2.38.
We observed that this gross irregularity not only delayed the development process of these areas but also troubled the entrepreneurs to whom alternate plots were allotted after significant delay.
The Government stated (October 2011) that the possession of the land was taken on record but the khatedars opposed while taking physical possession at site. Thereafter, the matter was resolved by allotting alternate plots. It further stated that the Company has now decided not to make allotment in new industrial areas without completion of the development works and demarcation of area.
Infrastructure facilities in other areas
2.2.22 We noticed that the IDC, against the objective of the Company to improve the quality of infrastructure in the existing industrial areas, decided (1996) not to incur any expenditure on the infrastructure facilities in the industrial areas falling under ‘other area’ category except for repair and maintenance of existing roads, drains, water supply and street lights to make them functional. Our analysis of these industrial areas revealed that only 10 per cent units were in operation in three industrial areas, 10 to 30 percent in five areas and 30 to 50 per cent in six areas. Further, in two industrial areas (Mahuwa Mandawar and Sareh Khurd) no unit was in operation as on 31 December 2010.
We observed that the decision of the IDC for not providing infrastructure facilities was the major reason for non-production by the industrial units set up
Audit Report No.4 for the year ended 31 March 2011
82
in these areas and this has defeated the very basic objective of industrialisation in the State.
The Government stated (October 2011) that sometimes the industrialisation in the area did not go as anticipated due to change in the economics/ industrial scenario or some other unforeseen circumstances. It further stated that the slow pace of industrialisation in some of the areas was not because these lacked in basic infrastructure facilities but due to some other reasons. The reply is not acceptable as the Company never reviewed the causes of slow pace of industrialisation in these areas. Further, it is well known fact that the areas where industrialisation does not go as per expectation requires more attention and facilities to bring them at par with the others.
Defects noticed in industrial development
2.2.23 The Company empowered the Sr. Regional Manager/Regional Manager of unit offices to finalise work orders for civil works up to the value of � 30 lakh. Contracts for civil works beyond � 30 lakh were finalised at Head Office.
During review period, various contracts valuing � 571.11 crore were executed. These contracts related to different spheres of activities to develop the industrial areas such as civil works for road, drainage system, water supply scheme, power supply scheme and other miscellaneous works. The deficiencies noticed in this regard are discussed in succeeding paragraphs.
Avoidable extra expenditure
2.2.24 Instances of discrepancies leading to extra expenditure in execution of works in selected units are as under:
a) The Company rejected (October 2007) the bids called for construction of drains and approaches at Neemrana phase-III considering the rates (26.91 per cent above G schedule) of the first lowest bidder on higher side in view of rate trends (10 to 15 per cent above G schedule) for similar nature of work in the area. On re-invitation bids the rates received were 9.91 per cent above G schedule but the same was also considered on higher side and the tender was scrapped. We noticed that the Company re-invited the bids at third occasion but the same was also scrapped in view of higher rates and the contract was finally awarded at the fourth occasion rates which were 23.92 per cent above G schedule. This cost the Company an extra expenditure of � 39.34 lakh. Similarly, in another case at Kishangarh phase-V, the Company awarded the work of construction of road and drainage at fourth occasion rates despite reasonable rates having been received at first occasion itself. This caused an extra expenditure of � 30.14 lakh.
Thus, scrapping of tenders despite receiving reasonable rates as per the internal estimates caused an extra expenditure of � 69.48 lakh.
b) The tender finalisation committee (TFC) ignored the recommendations of unit offices to consider the market trend and similar nature work awarded
Chapter II Performance Audit relating to Government Companies
83
by other unit offices/other institutions at the time of awarding contracts in four cases3 which caused an extra expenditure of � 1.27 crore.
The Government stated (October 2011) that the TFC had awarded tenders keeping in view the recommendations of unit offices, market trend and previously approved rates for similar nature of works. The reply is not convincing as in reported cases the TFC did not consider the recommendations of the unit office, internal estimates and market trend of the similar nature of works.
Quality assurance
2.2.25 The defect liability clause included in the agreements of the contractors with the intention to get quality civil works executed and to maintain them for substantive period was not invoked by the Company effectively. We noticed that the contractors despite issue of several notices (between August 2008 and December 2010) did not repair the defects in the work of (a) street lights and strengthening of road by paver finish at IPIA Kota and (b) re-carpeting of approach road at Bhiwadi-I till October 2011.
Further, the defects at Industrial Area Bagru (Ext.) Phase- II though reported in September 2006 were removed by the contractor in January 2010 only when the retention money was to be forfeited by the Company. Thus, the industrial areas remained deprived from quality services for a substantive period for which the Company paid a bit higher cost than the normal contracts.
The Management stated (September 2011) that in case of damages during defect liability period, notices are issued failing which the defects are removed at the risk and cost of the concerned contractor. The Government stated (October 2011) that the matter of removal of defects just before completion of defect liability period and non-invoking risk and cost clause were being enquired and necessary action would be taken.
External Development Charges
2.2.26 The Company decided (June 1997) to create a fund for ‘External Development Charges’ (EDC) by taking two per cent of the amount of compensation in respect of all the original development schemes sanctioned on or after 15 July 1997. The fund was to be utilised for strengthening the approach roads, street lights, construction of disposal drains outside the industrial areas etc. or to release the amount as Company’s contribution to the concerned State Government agency maintaining approach roads, drains etc.
We noticed that an amount of � 25 crore (approximately) got accumulated towards EDC by March 2010 but the Company despite its assurance in the exit conference failed to provide us details of expenditure incurred by it on external development of industrial areas. Further, it also did not maintain
�3 (1) Strengthening of road with paver finisher at Bagru extension phase-II, (2)
Construction of cement concrete road and RCC culvert at Ramganj Mandi (Kota), (3) Strengthening of road with paver finisher at Ranpur and (4) Resurfacing of road by paver finisher at VKIA (Jaipur)�
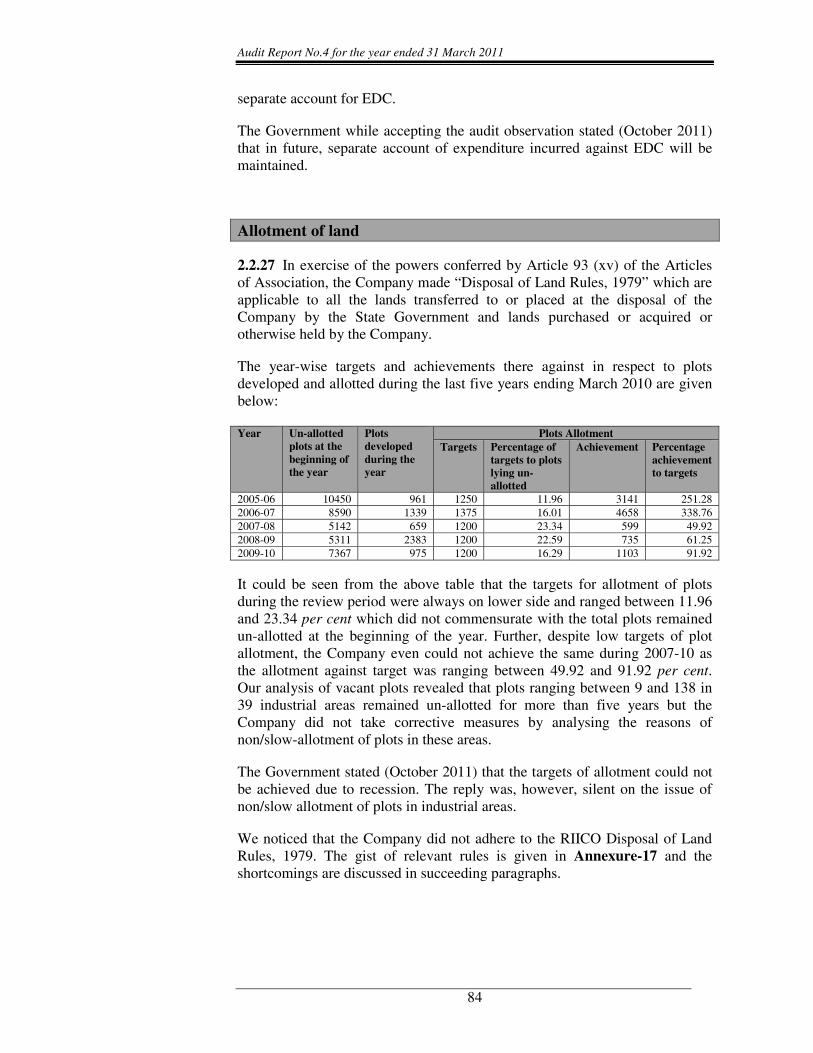
Audit Report No.4 for the year ended 31 March 2011
84
separate account for EDC.
The Government while accepting the audit observation stated (October 2011) that in future, separate account of expenditure incurred against EDC will be maintained.
Allotment of land
2.2.27 In exercise of the powers conferred by Article 93 (xv) of the Articles of Association, the Company made “Disposal of Land Rules, 1979” which are applicable to all the lands transferred to or placed at the disposal of the Company by the State Government and lands purchased or acquired or otherwise held by the Company.
The year-wise targets and achievements there against in respect to plots developed and allotted during the last five years ending March 2010 are given below:
Year Un-allotted plots at the beginning of the year
Plots developed during the year
Plots Allotment Targets Percentage of
targets to plots lying un-allotted
Achievement Percentage achievement to targets
2005-06 10450 961 1250 11.96 3141 251.28 2006-07 8590 1339 1375 16.01 4658 338.76 2007-08 5142 659 1200 23.34 599 49.92 2008-09 5311 2383 1200 22.59 735 61.25 2009-10 7367 975 1200 16.29 1103 91.92
It could be seen from the above table that the targets for allotment of plots during the review period were always on lower side and ranged between 11.96 and 23.34 per cent which did not commensurate with the total plots remained un-allotted at the beginning of the year. Further, despite low targets of plot allotment, the Company even could not achieve the same during 2007-10 as the allotment against target was ranging between 49.92 and 91.92 per cent. Our analysis of vacant plots revealed that plots ranging between 9 and 138 in 39 industrial areas remained un-allotted for more than five years but the Company did not take corrective measures by analysing the reasons of non/slow-allotment of plots in these areas.
The Government stated (October 2011) that the targets of allotment could not be achieved due to recession. The reply was, however, silent on the issue of non/slow allotment of plots in industrial areas.
We noticed that the Company did not adhere to the RIICO Disposal of Land Rules, 1979. The gist of relevant rules is given in Annexure-17 and the shortcomings are discussed in succeeding paragraphs.
Chapter II Performance Audit relating to Government Companies
85
Concession to various categories of entrepreneurs
2.2.28 The Company promotes selected category of entrepreneurs by allowing concession in the rate of development charges in unsaturated industrial areas. The allottee is entitled for the concession upto the plot area or the ceiling limit, whichever is less. No concession is allowed in industrial areas exclusively developed for specific type of industries or for particular category of entrepreneurs. Further, pursuant to the policy package for Micro, Small and Medium Enterprises 2008 of the State Government, a reservation of 30 per cent plots for selected category entrepreneurs is required to be kept by the Company in new industrial areas to be developed by it. We noticed that:
• The Company did not publicise the concessions available for selected entrepreneurs at the time of initiating land allotment process in new industrial areas. As a result, no plot could be allotted to ex-servicemen/war-widows, women and SC/ST category entrepreneurs in 20, 14 and 17 industrial areas respectively out of total 25 industrial areas launched during 2005-10.
• The policy of the Company to provide concession to ex-servicemen/war widows, SC/ST and women entrepreneur lacked clarity, as it did not prescribe the maximum ceiling of such concession. In test check of four industrial areas it was revealed that the Company allotted plots ranging between 17.64 per cent and 54.78 per cent in excess of the prescribed limit to SC/ST and women category of entrepreneurs and thereby sustained a loss of � 27.79 crore during last five years.
• Pursuant to the policy, the concession holder was required to keep the allotted plot for at-least five years after commencement of production. Looking to the impracticality to monitor all such allotment cases, the IDC decided (May 2004) to allow the rebate on completion of 20 per cent construction on the plot area. This decision was subsequently modified (April 2007) by allowing rebate on up front fees. This has defeated the very objective of allotment on concessional rates as there remained no mechanism to monitor the construction and production activity of such entrepreneurs.
On being pointed out by us the Government issued (October 2011) directives to mention relevant provisions of rebate in advertisement/press release in future. It further stated that there was no upper ceiling of rebate for any category in the rules. As regards upfront rebate it stated that terms and conditions of allotment letter keeps check on concessional category entrepreneurs and in case of transfer of plot by such entrepreneurs before five years from production date, the rebate was recovered with interest. The reply is not convincing as the basic objective to promote weaker sections of society by making concessional allotment stands defeated as no mechanism exists after allowing upfront rebate to ensure the utilization of land.

Audit Report No.4 for the year ended 31 March 2011
86
Allotment of land to Technical Institute
2.2.29 We noticed that the Company instead of rejecting the bids of all the three4 bidders and inviting fresh Expression of Interest, allotted (March 2010) land to ‘Education Committee of the Maheshwari Samaj’, at the reserve price merely on the basis of a power point presentation despite the fact that the committee found all the three bidders technically unfit and ineligible as per the terms and conditions of Rule 3(E) i.e. in-sufficient experience to run similar technical institutions in India or abroad.
The Government stated (October 2011) that the Committee after assessing the performance of the applicants on the basis of documents submitted, personal interaction and presentation given selected the most eligible applicant and approved the allotment. The reply is not acceptable as the Committee did not mention specific reasons/merits before deciding the allotment.
Allotment of land to Barmalt (India) Private Limited
2.2.30 We noticed that the committee under Rule 3(W) allotted (10 June 2010), one acre plot to Barmalt (India) Private Limited (entrepreneur) in already saturated Manda Industrial area phase-I at prevailing rate of development charges.
We observed that allotment was not in accordance with the provisions of Rule 3(W) as the proposed investment of � 50 crore on 25 acre land was not ensured and the plant could not be established on one acre land as per the proposal of the entrepreneur. Further, allotment at prevailing rates in already saturated area was also against the policy of allotment in saturated areas as it was to be done through auction.
The Government stated (October 2011) that looking to the prestigious project, the committee decided to allot one acre land in phase-I on prevailing rates and also decided in principle to reserve 25 acre in phase-II and thus, the allotment should not be seen in isolation. The reply does not justify the allotment in view of the fact that upto the date of decision of allotment of land, the entrepreneur did not even submit the project report indicating the project cost and requirement of 25 acre land and hence, the allotment at prevailing rates in saturated industrial area was against the policy of the Company.
Allotment of plot to United Breweries Limited
2.2.31 On the request of the United Breweries Limited (entrepreneur) to allot additional 10 acre land for its ongoing brewery project at Chopanki industrial area (Bhiwadi-II) the Company decided (31 January 2006) to change the use of the land reserved for hospital and park. Accordingly, the Unit office raised (February 2006) a demand of � 82.45 lakh towards 25 per cent development charges for allotment of the additional land. The entrepreneur however, did not deposit the amount up to 18 April 2006, the date on which the industrial
�4 � Shri Balaji Educational & Welfare Trust, Delhi, The Education Committee of the
Maheshwari Samaj (Society), Jaipur and Poddar Trust, Jaipur.�
Chapter II Performance Audit relating to Government Companies
87
area was declared saturated despite reminder (3 April 2006) and subsequently, deposited (22 April 2006) the raised demand. The IDC on the request of the entrepreneur, decided (September 2006) to allot the land at prevailing rate of � 1000 per sqm without treating the plot in saturated category.
We observed that the decision of the IDC to allot plot at prevailing rate in the saturated area was in violation of rules which caused a minimum loss of � 1.36 crore as auction rates received in June 2006 itself ranged between � 1590 and � 1800 per sqm. Further the decision lacked justification as the area was not only reserved for hospital, park and service road but also falls under dark zone category. Allotment of land to brewery industry was also not justified as at the behest of Central Water Pollution Control Board, the Company banned (July 2005) allotment of plots in Bhiwadi industrial area to water polluting industries.
The Government stated (October 2011) that IDC had allowed allotment of additional adjoining land at prevailing rate instead of auction process considering the group profile and circumstances of the entrepreneur. The fact remains that due to violation of rules/policy the Company sustained loss of � 1.36 crore.
Rebate on allotment of larger size industrial plot
2.2.32 a) The Company in violation of Rule 3(C)(b) allowed (July 2007) 10 per cent additional rebate on upfront fee to Orient Craft Limited (entrepreneur) without ensuring likely investment of � 50 crore and not recognizing the fact that the entrepreneur had not set-up the infrastructure on the allotted 30 acre land. Further, the unit office also extended undue favour of � 84.99 lakh to the entrepreneur by calculating the upfront rebate on prevailing rate � 2800 per sqm instead of allotment rate of � 2100 per sqm.
b) Similarly, the IDC in violation of rules allowed 10 per cent additional rebate on upfront fee and two per cent cash incentive to Lafarge Boral Gypsum India Private Limited (entrepreneur) at the time of allotting (September 2006) 15 acre land at Khushkhera industrial area. We observed that the entrepreneur was not eligible for two per cent cash incentive of � 18.21 lakh as the same was admissible on payment of 100 per centdevelopment charges along with application. Further, the unit office also extended undue benefit of � 22.76 lakh by calculating the development charges on the basic prevailing rate rather than the rate after reducing 25 per cent rebate under Rule 3(C)(a).
c) The Company also allowed (January 2010) two per cent cash incentive to Texsa India Limited despite the fact that it had not deposited 100 per centdevelopment charges in one go and thereby sustained a loss of � 3.41 lakh.
The Government stated (October 2011) that considering the profiles of the entrepreneurs, IDC had allowed the rebates to promote industries and investment in the State. The reply is not convincing as the Company suffered losses due to incorrect calculation of rebate.
The decision to allot 10 acre land at prevailing rates in saturated industrial area caused minimum loss of ���� 1.36 crore.
Against the laid down rules, the Company allowed upfront rebate/cash incentive and thereby sustained loss of ���� 1.29 crore.
Audit Report No.4 for the year ended 31 March 2011
88
Thus, the Company by over looking its own laid down rules favoured the entrepreneurs in allotment of these three plots by � 1.29 crore.
Time extension for completion of construction/commencement of production activities
2.2.33 We noticed that the Crew Boss Products Limited (entrepreneur) did not adhere to the requirement of the condition of 20 per cent construction under Rule 21(6) during scheduled period (September 2009) and even during the extended period by March 2010 on payment of retention charges. However, the IDC on the request of the entrepreneur further extended (16 December 2010) the time period without levying retention charges of � 1.15 crore (calculated by us).
We observed that the decision of the IDC to provide extension without recoupment of retention charges was in violation of laid down rules as the entrepreneur was having no intention to commence the production activities. This was evident from the fact that no further built up space was added during the extended period allowed by unit office and further the construction activity was not completed till March 2011. Apart from it, the unit office had also extended undue benefit of � 72.85 lakh in recovery of retention charges by calculating the same at old rates of development charges at the first occasion.
We also observed that the project appraisal was weak as the entrepreneur planned only four acre area of the plot for construction and production activities against total 30 acre area allotted to it and further no efforts were made to revert back the unutilised land.
The Government stated (October 2011) that as per orders dated 27 February 2009, for existing allottees, five year time period had been allowed for commencing production without the requirement of observing any intermediate milestones. It further justified the decision of IDC on the grounds of large investment, employment and prestigious export oriented unit. As regards deficient project appraisal, it stated that the entrepreneur is in process of shifting the unit from Haryana to Neemrana and hence the land requirement was justified. The reply was not convincing as the aforesaid orders were not applicable in this case and as per the prevailing rule in case of plot/land allotment in NCR made on or after 19 May 2006, the allottee as a specific provision was required to complete/commence construction/production activities within the stipulated time period from the date of declaration of the area as developed. Further justification given for allotment of 30 acre of land was incorrect as the entrepreneur did not submit such proposal. Moreover, the Company also did not initiate any action against the entrepreneur despite the fact that it did not pay the retention charges for the extension granted beyond January 2011 till date.
Waiver of restoration charges
2.2.34 We noticed that, Moolchand Shalecha (entrepreneur) to whom a plot at industrial area Balotra-III was allotted (March 2009) through auction on ‘as is where is basis’ did not adhere to the repayment schedule despite issue of
Chapter II Performance Audit relating to Government Companies
89
several notices and hence, the plot was cancelled (October 2010). Subsequently, on the request of the entrepreneur to restore the allotment, the unit office raised (15 November 2010) the demand of restoration charges of � 26.88 lakh along with lumpsum payment of outstanding dues. We further noticed that the Managing Director on the request of entrepreneur waived (April 2011) the restoration charges and restored the plot on the grounds of non-observance of proper procedure of cancellation/non-providing information of outstanding dues by the unit office and that the plot could not be utilised due to drainage problem.
We observed that the decision of Managing Director was in violation of rules and terms and conditions of allotment letter.
The Government stated (October 2011) that restoration of plot without levy of charges had been allowed due to non-issue of proper show cause notice (SCN) before cancellation order and that the plot could not be utilised by the entrepreneur due to accumulation of water of other factories. The reply is not convincing as the rules clearly provide that restoration of cancelled plot was to be done on payment of outstanding development charges along with interest and additional development charges. Further, the justifications given in reply were also not convincing as a SCN was issued in October 2010 and the plot was auctioned on ‘as is where is basis’.
Waiver of interest
2.2.35 We noticed that Alchemy Ventures Private Limited (AVPL) to whom a plot was allotted at industrial area Bagru (extension) Phase-II Jaipur, paid only two instalments and requested (July 2008) the Company to defer the date of construction for one year due to lack of infrastructural facilities in the area. AVPL also intimated (August 2008) that the plot could not be utilised as some Khatedars were creating dispute on the North-West side of the plot. The Company however, did not accept (September 2008) the request of deferring the date of construction but resolved the dispute created by Khatedars by revising the site plan and asked to pay the installment due on 30 June 2008. We further noticed that on subsequent representation (31 December 2008) of AVPL to the Chairman, the waiver committee waived off (July 2009) the interest of � 25.31 lakh on development charges for the disputed period i.e. 25 June 2008 to 23 September 2008. After availing these benefits, AVPL again represented (September 2009) to waive off the entire interest of � 74.49 lakh and the same was also waived (January 2010) by the Waiver Committee as per the direction of the Chairman, on the plea that land handed over to AVPL was not free from encumbrances since allotment.
We observed that the decision of the Waiver Committee to waive/adjust the interest charges at second instance was imprudent and lacked justification as it has already waived interest of � 25.31 lakh, considering all the facts and there was no ground to waive the interest of � 74.49 lakh.
The Government stated (October 2011) that the competent committee waived the interest. The reply was not convincing as the committee initially waived the interest after considering all factors and hence re-opening of the case
Audit Report No.4 for the year ended 31 March 2011
90
without any fresh development was not justified.
Waiver of transfer fees and retention charges
2.2.36 Pursuant to the Memorandum of Understanding (MOU) executed (May 2007) between the GOR and Honda Siel Cars India Limited (HSCI), the Company allotted 610.68 acre of land for setting up the car project of HSCI. We noticed that out of eight5 supplier units of HSCI (including HSCI), only three units commenced production on the allotted land. The HSCI requested (December 2009) to transfer 58.77 acre land belonging to four6 units which did not commence production, to Honda Motorcycles and Scooters India Private Limited (HMSI) to set-up a two-wheeler project and also requested the Company for waiver of applicable transfer fee and retention charges. The request was acceded and the IDC waived (10 February 2010) the entire transfer fee and retention charges recoverable from these four transferor units. Accordingly, the HSCI transferred (May 2010) 58.77 acre land to HMSI.
We observed that the decision of the IDC was imprudent and in violation of rules as the HSCI transferred land to HMSI at much higher rates (profit margin ranged between 64 per cent and 82 per cent). Further, the decision was against the terms and conditions of MOU which clearly stipulated that in case of non-implementation of project, the allotted land was to be reverted back to the Company. Thus, the Company sustained a minimum loss of ��3.67 crore (transfer fee ��3.05 crore and retention charges � 0.62 crore worked out on actual allotment rate).
The Government stated (October 2011) that as per the MOU executed between GOR, HSCI and HMSI on 11 May 2010, the transfer and retention charges of four supplier units were waived and also allowed to transfer their land. The reply was not convincing in view of the fact that IDC waived the charges in February 2010 i.e. even before execution of MOU. Further, in case of non-establishment and operation of various parts of the project envisaged in MOU with HSCI, HSCI had to revert the allotted land. Moreover, decision of IDC was not justified as HSCI/supplier units were selling their land at a premium of ��12.62 crore but were not willing to pay transfer and retention charges.
Other irregularities in allotment of land
Hindrances in industrial growth
2.2.37 (a) The Company despite knowing the fact that some portion (three khasras) of the 25 acre land allotted (November 2007) to the Sona Auto Agro Tractors & Components Private Limited (entrepreneur) at industrial area Patherdi was under litigation, handed over (February 2008) physical possession to the entrepreneur without mentioning the fact. The entrepreneur could not carry out the construction activities on the disputed land and as a result, it did not pay the balance amount of development charges. On �5 GAPAI, Bestex, Yutuka, Moriroku UT India (P) Ltd., HSCI Ltd., Yachio India
Manufacturing (P) Ltd, Keihin Panalfa Ltd. and TS Tech Sun Rajasthan (P) Ltd.�6 � HSCI Ltd. 19.84 acre, Yachio India Manufacturing (P) Ltd 10.98 acre, Keihin
Panalfa Ltd. 8.11 acre and TS Tech Sun Rajasthan (P) Ltd. 19.84 acre�
The Company sustained loss of ���� 3.67 crore due to waiver of transfer fee/retention charges.
Chapter II Performance Audit relating to Government Companies
91
approaching (April 2008) the unit office to resolve the issue, the unit office, instead of resolving the dispute, issued (August 2008) a demand notice to deposit � 17.28 crore against outstanding dues with interest up to August 2008. However, the entrepreneur made representation (April 2009) to surrender the land and to refund the already paid development charges of � 5.66 crore including interest and construction cost of boundary wall. The land was finally surrendered (June 2009) by the entrepreneur in view of non-viability of the project. However, the decision to this effect was pending with Advisor Infra (July 2011).
Thus, the Company owing to failure in providing land free from encumbrances deprived the State with likely investment of � 175 crore.
(b) We noticed that the unit office Neemrana kept the building plan of Unique Decor (India) Private Limited (entrepreneur) for approval against the provision of building regulations. Consequently, the entrepreneur could not adhere the time limit (22 May 2008) of completion of construction activity and requested (September 2008) for time extension without retention charges. The request was acceded by the waiver committee (September 2008) and it was directed to conduct preliminary enquiry for withholding the case and not informing the allottee about the provisions of building regulations of the Company in time. We observed that no such enquiry as directed by the committee was done till date (July 2011).
Thus, redundant action of unit office caused delay in implementation schedule of the entrepreneur.
The Government stated (October 2011) that the enquiry against the delinquent officers was still pending and disciplinary action will be taken as per rules.
Improper allotment of plot
2.2.38 We noticed that the Company allotted a plot to TPS Infrastructure Limited (entrepreneur) at Pathredi industrial area without acquiring entire land. Resultantly, the Company had to reduce the size of the allotted plot considering it as fresh allotment. We further noticed that as per new conditions, the entrepreneur was to deposit the entire outstanding principal dues within 60 days from the date of intimation of decision. However, the decision was intimated (January 2010) to the entrepreneur after delay of 57 days by the unit office.
We observed that the unit office failed to follow the laid down procedure of land acquisition which led to allotment of un-acquired portion of land besides causing delay in intimation and further short recovery of interest of � 5.32 lakh.
The Government stated (October 2011) that due to non-availability of correct location of the existing road on the revenue khasra map, some land/part land of some khasras was left from acquisition. The reply is not convincing as it was the prime necessity to collect all relevant information/revenue map before acquisition of land.

Audit Report No.4 for the year ended 31 March 2011
92
Loss of revenue due to out of court settlement
2.2.39 We noticed that the IDC deviating its earlier decisions (September 2003 and July 2007) taken up at the time of regularising the land of the already existing eight units at Balotra industrial area Phase-III, regularised (February 2010) the land of two units7 without waiting for court decision at the rate of � 60 per sqm plus 16 per cent interest on the directions of the Chairman whereas the land of the six units was regularised (July 2007) at rate of � 250 per sqm.
We observed that the decision of the IDC was unjustified as it did not consider the prevailing rate (� 800 per sqm) or the auction rate (� 1656 per sqm) and thus sustained a minimum loss of � 14.57 lakh (calculated at the rate of � 250 per sqm). Further, the decision of the IDC as regards interest was incomplete and the Managing Director instead of charging the interest since inception, directed (May 2010) to charge interest from the date of decision of the IDC on the request of one unit (UTM), which in our opinion was not correct as the matter was resolved out of court and it led to short recovery of interest of � 20.11 lakh8.
The Government stated (October 2011) that the IDC decided the matter considering the facts/merits of the case. Further, the decision of the Management to charge interest from the date of decision of IDC was also ratified by the IDC in February 2011. The reply was not convincing as the present decisions of IDC was altogether different with its earlier decision which may also cause un-necessary litigation from six units.
Allotment/regularisation of excess land
2.2.40 We noticed that the Company neither prescribed any guidelines nor there was any system in vogue at unit offices to ensure the accurate physical demarcation of the plots as carved and approved in the layout plan. Further, the unit offices at the time of handing over the possession of the allotted plot did not ensure actual measurement to maintain the accuracy of the area allotted as per layout plan. This deficiency led to excess occupancy of land by the entrepreneurs as the land reserved for ancillary services was also occupied.
The Company however, launched (February 2009) Amnesty scheme, valid upto 31 March 2010 and subsequently extended in October 2010, for allotment/regularisation of the excess land occupied by the entrepreneurs on the basis of existing prevailing rate wherein 28.41 acre land pertaining to the period as old as July 1972 was regularised. We also noticed serious irregularities on the part of unit offices, as in one instance (Rochees Breweries, Neemrana), one acre land occupied (1994/1995) in excess of total allotted area was not regularised by it. However, on being pointed out by us the Company regularised (June 2011) the excess land by recovering development charges.
�7 � Uttam Textile Mills (UTM) and M K Dyeing Mills (MKDM).�8 � � 10.66 lakh from UTM as per direction of M.D. and� �� 9.45 lakh from MKDM
suo moto without any direction.�
Chapter II Performance Audit relating to Government Companies
93
The Government stated (October 2011) that it has now been decided to make allotment after demarcation of plots and providing basic infrastructure in the area to reduce the cases of excess land. The reply was however, deficient as regards existing allotments where the entrepreneurs occupied the excess land.
Delay in complying High Court order for shifting of industrial units
2.2.41 Against the directions (2 April 2004) of the Rajasthan High Court to set up an exclusive industrial area within six months to shift the textile industrial units engaged in printing and dying causing water pollution in the residential areas, the performance of the Company was not satisfactory as only 133 cases were reviewed (total 199 cases) and allotment could be made to 45 units till March 2011. We noticed that the delay was attributed to sending the proposal for land acquisition to the State Government (nine months) and intimating (2 June 2005) the State Government for invoking the provisions of Section 17(4) for acquisition of land in emergent situations. Further, the Company belatedly (after 13 months of land acquisition) applied (July 2007) for obtaining Environmental clearance from Ministry of Environment and Forest (MOEF).
Thus, the Company not only failed to implement the orders of the High Court for re-location of polluting units from residential areas but also the purpose of acquisition of land by invoking urgency clause of Land Acquisition Act was defeated.
The Government stated (October 2011) that after acquisition of land, EIA was got conducted and on receipt of environment clearance, the development scheme was prepared in June 2008. The fact remains that even after elapse of considerable period the Company could not ensure shifting of polluted industries.
Central Assisted Schemes
2.2.42 The Company is nodal agency for implementing various schemes of Central Government. During the period 2005-10, the Company implemented scheme for Integrated Infrastructural Development (IID), Agro Food Park (AFP), Growth Centre, Apparel Park for Export, Special Economic Zones (SEZ) etc. to promote industrial growth, remove regional disparities and improve infrastructure in the State. The shortcomings noticed in implementation of these schemes are discussed below:
Integrated Infrastructural Development
2.2.43 The GOI sanctioned nine9 IID centres between August 1994 and August 2004 for development in the Rajasthan. The status of all the nine IID centres is given in Annexure-18. It could be seen from the annexure that:
�9 � Sangaria (Jodhpur), Gogelao (Nagaur), Newai (Tonk), Kaladwas (Udaipur), Falna
(Pali), Hidauncity (Karauli), Baran, Bayana (Bharatpur) and Khushkhera (Alwar).�
Audit Report No.4 for the year ended 31 March 2011
94
• The Company could not implement the IID scheme as there was significant delay in completion of all the IID centres ranging between 34 and 148 months. Further, the Company could receive only � 12.09 crore till January 2011 against total admissible GOI grant of � 14.83 crore due to delay in completion of works and deviation from approved DPRs and GOI guidelines.
• The units in production as on December 2010 at IID Tonk, Nagaur, Falna and Alwar were not significant enough to achieve the objectives of the scheme.
The Government stated (October 2011) that slow progress of development and non-establishment of industrial units was due to global recession and famine etc. It further stated that GOI had not accepted the claim of overhead, interest and future maintenance expenditure for the purpose of grant. The reply was not convincing as the Company could not implement the scheme within the stipulated time period which defeated the very purpose of GOI scheme. Further, grant was not released by the GOI only due to slow progress and non-completion of the envisaged facilities.
Defective Planning
2.2.44 The IID scheme at Baran failed completely due to ab-initio defective planning of the Company as it did not address the water problem despite knowing the fact that the area was under ‘semi-critical’ zone as per the report of Ground Water Department, GOR (June 2002) and dismal performance of the already developed industrial area Baran phase-I. Resultantly, no unit was in production as on December 2010 in 58 allotted plots (total 199 plots).
Similarly, the Company did not give cognizance to the critical ground water condition at Dhoinda (Rajasmand) and slow10 pace of industrial growth at industrial area Dhoinda and got approved (January 2004) the scheme from GOI based on ground water investigation report of 1992. Subsequently, it was decided (June 2005) to terminate the implementation of the project. We also noticed that despite specific directions of the State Government to fix responsibility for approval of the project in absence of water, the same was not done by the Company.
Thus, delay in implementation coupled with defective planning led to non-accomplishment of intended objectives of the scheme of IIDs which resulted in set-back to the process of industrialisation in the State.
The Government while accepting the facts stated (October 2011) that the Baran project would be revived after commissioning of water supply scheme. Further, as regards IID Dhoinda it was replied that the project was turned down with the consent of the State Government. However, the reply was silent on the issue of fixing responsibility as directed by the State Government.
�10 Only 55 plots could be allotted upto March 2003 out of total 267 plots developed.�
Delay in completion of works envisaged coupled with deviation from DPRs and GOI guidelines led to non-release of admissible grant of ���� 2.74 crore.
Chapter II Performance Audit relating to Government Companies
95
Agro Food Park (AFP)
2.2.45 Pursuant to the Policy, the GOI approved (between November 2002 and April 2007) four proposals for setting up AFP at Ranpur (Kota), Boranada (Jodhpur), Sriganganagar and Alwar. The details of the total project cost, financial assistance sanctioned, grant released till date and expenditure incurred till December 2010 on the project items for which grant was sanctioned is given in Annexure-19.
The shortcomings noticed by us in implementation of AFPs are as below:
• All the four AFPs, Ranpur, Boranada, Sriganganagar and Alwar were required to be developed within a period of 18 months from the date of approval by the GOI i.e. by May 2004, August 2004, July 2005 and October 2008 respectively. However, the works envisaged in the project reports of all AFPs were not completed (July 2011).
• The GOI specifically provided financial assistance of � 1.76 crore towards development of warehouse godowns, mini-market & mandi yard in three AFPs11 to provide market linkages between agro producers and agro processing enterprises and � 3.44 crore for development of Common Effluent Treatment Plant (CETP) in all AFPs. The Company did not develop these infrastructural facilities in any of the AFP despite their demand except some expenditure (� 25.15 lakh) on boundary wall of CETP at Boranada.
• The GOI guidelines envisaged setting up of agro based laboratories in AFPs to ensure quality control in food sector by implementing quality management system through compliance of national food standards and reduction in transportation time of sample analysis. The Company signed MOU with the Central Scientific Instruments Organisation (CSIO) in July 2005 for setting up Agro based laboratories and as per the project proposals, the laboratories were to be commissioned by March 2008 (three AFPs) and January 2009 (Alwar). The laboratories were, however, not fully operationalized (July 2011) for want of installation of some equipments and the Company could expend only � 1.25 crore including construction of building against the sanctioned cost of � 2.21 crore by GOI.
Thus, the Company failed to provide infrastructural facilities to small and medium enterprises despite availability of financial assistance from the GOI and significant delay in development of AFPs has defeated the very purpose of the scheme.
The Government stated (October 2011) that the parks were fully developed and some infrastructure facilities were not provided as the same were not required presently. Further, the management accepted non-operation of laboratories and replied that CSIO was not experienced in implementation of the scheme and made several modifications in the buildings after
�11 Boranda, Sriganganagar and Alwar.�
The Company failed to develop AFP at all the four places within stipulated period of 18 months.
Audit Report No.4 for the year ended 31 March 2011
96
constructions. The reply is not convincing as the guidelines and approved DPRs were not adhered to achieve the objectives of the scheme.
Growth Centre Scheme
2.2.46 Pursuant to the decision (June 2001) of the GOI to split such growth centres, where the progress of work was not according to the projections, into other backward areas, the Company applied (January 2002) for splitting up growth centre Chandrawati (Jhalawar) to Palsana (Sikar) and Dholpur Growth Centre to Parbatsar (Nagaur) which was approved by GOI in March 2002. We observed that:
• Even after splitting of these growth centres, the projects were not completed till July 2011. Even basic infrastructural facilities like power, availability of water, drainage system, street lights etc. were not completed and resultantly, the industrial growth was three per cent at Parbatsar and 17 per cent at Palsana (May 2011).
• Despite intimation (9 July 2007) of GOI, not to release any grant beyond 31 March 2009, the Company did not initiate any action to complete the projects within deadline of March 2009 and incurred expenditure of � 4.24 crore after March 2009 on the implementation of Parbatsar projects which was not admissible due to closure of the scheme.
Thus, the Company failed to achieve desired objectives of growth centre scheme to reduce regional imbalance, industrialisation in backward areas and employment generation.
The Government stated (October 2011) that the growth centres were developed in phased manner to avoid blockage of Government fund. It further assured to complete the remaining project works by March 2012. The reply is not convincing as the objectives of the scheme remained unachieved as envisaged by the GOI even after splitting the growth centres.
Apparel Park for Exports Scheme
2.2.47 The GOI formulated (2003) ‘Apparel Parks For Exports Scheme’ to involve State Governments in promoting investments in apparel sector. The scheme was intended to impart focused thrust to set-up apparel manufacturing units of international standards at potential growth centres and to give fillip to exports to achieve the target of US$ 25 billion by 2010 as envisaged in National Textile Policy 2000. We noticed that the GOI approved (November 2003) the proposal of the Company to implement the scheme at Mahal, Jaipur but the Company could not materialise it due to non-obtaining physical possession of the proposed land. The GOI closed (March 2007) the scheme and intimated (July 2008) the Company that it would not support the project and no further grant would be released. The Company incurred an expenditure of � 3.69 crore upto March 2010 against the GOI grant of �� 0.98 crore received in September 2005.
Chapter II Performance Audit relating to Government Companies
97
We observed that obtaining physical possession of land was the prime condition for implementation of the scheme but the same was not adhered to which resulted in non-materialisation of the scheme. This not only deprived the State of the intended benefits but also proved set-back to the National Textile policy.
The Government stated (October 2011) that the development of the Apparel Park was taken up looking to the need of industries with or without Government grant but due to one or other dispute it could not be materialized.
Special Economic Zone
2.2.48 The Company developed a Special Economic Zone (SEZ) for handicrafts industry at Boranada (Jodhpur) during September 2003 to June 2006. We noticed that the Company grossly failed to achieve the objectives of setting-up the SEZ as the entrepreneurs at large surrendered the plots due to lack of basic infrastructural facilities (electricity, water supply, security etc.) and disadvantageous statutory provisions regarding export incentives, non exemption of VAT etc. and as against the envisaged export target of ��300 crore, the export during 2009-10 was merely ��29.32 crore.
We observed that the planning of product specific SEZ was ab-initio defective as the Company did not carry out proper survey of trade and export trend before planning the SEZ. This is evident from the fact that the proposal of the Company for earmarking 54 plots in the SEZ area for setting up of Guargum units was not accepted (November 2004) by the GOI as it was against the provisions of the EXIM Policy and the very concept of SEZ scheme.
The Government stated (October 2011) that during this period there was worldwide recession in handicraft industry. Besides, handicrafts units established outside SEZ were getting more benefits than units established in SEZ and hence, the entrepreneurs dropped the idea for setting units in SEZ. The fact remains that differential trade policies of the State Government led to non-achievement of intended benefits of the SEZ.
Corporate Social Responsibility
2.2.49 Corporate Social responsibility (CSR) represents the contributions of companies to society through social investment, philanthropy programmes and its engagement in public policy. A strong CSR programme is an essential element in achieving good business practices and effective leadership. CSR directly impact the economic, social and environmental landscape and ultimately the relationships with stakeholders, in particular investors, employees, customers, business partners, governments and communities.
Audit Report No.4 for the year ended 31 March 2011
98
Village Amenities Development Fund Scheme and Skill Development Scheme
2.2.50 The GOR emphasised (1995) to create funds under Village Amenities Development Fund Scheme (VADF) and Skill Development Scheme (SDS) to ensure social development of the villages affected by industrialisation. VADF was directed to provide financial assistance for community welfare projects in the villages affected by new industries to create a linkage between development of the local community with the process of industrialisation while SDS was aimed to promote training and skills among persons affected due to industrialisation by preparing a human resource development plan and motivating local engineering colleges, Polytechnics, Industrial Training Institutes etc.
Pursuant to this, the Company decided (February 1996) to create and maintain VADF and Skill Development Fund (SDF) by contributing one per cent of the cost of acquisition of land for each fund.
We noticed that the Company while issuing administrative sanction to compute development charges for any industrial area included two per cent of the land acquisition cost towards VADF and SDF, one per cent each. As on 31 March 2010, a fund of � 12.89 crore for VADF and � 12.89 crore for SDF got accumulated with the Company. However, the Company released (between April 1999 and December 2008) only � 4.64 crore to the District Collectors towards activities under VADF while no expenditure was made from the corpus fund of SDF (July 2011).
We further noticed that the corpus of VADF was to be utilised for different spheres of village development activities on the recommendation of the Gram Sabha/Gram Panchayat and the operations were to be reviewed by the IDC once in every six months along with submission of an annual report to the State Government for review. However, the operations of the scheme were neither reviewed by the IDC nor an annual report was submitted by the Company to the State Government. Further, the funds of SDF remain un-utilised due to non-constitution of district level agencies under the chairmanship of District Collector.
We observed that the Company though created VADF and SDF as per the directions of the State Government but the scheme was not implemented in true spirits to fulfill the objectives of CSR as envisaged in the scheme.
The Government stated (October 2011) that the Company faced difficulty to undertake the works under VADF and hence, it was decided to remit the fund to the concerned District Collector to get the works completed. As regards to SDF, it stated that the scheme was to be implemented by a committee constituted under the Chairmanship of District Collector, however, in absence of directions from GOR funds were not released. The fact remains that due to non-pursuance with District Collector/GOR, the very purpose of creating these funds was defeated.
Chapter II Performance Audit relating to Government Companies
99
Non-recovery of VADF and SDF
2.2.51 Scrutiny of the records revealed that the Company did not include the provision for recovery of VADF and SDF in the six12 MOUs executed (between September 2006 and July 2008) with four cement companies and allowed allotment of land on actual acquisition cost plus 10 per cent administrative charges.
We noticed that the recovery of VADF and SDF was omitted in first three MOUs executed between September 2006 and October 2007. The Company despite acknowledging the mistake in February 2008 did not include the provision in other three MOUs executed between April 2008 and July 2008. We further noticed that the Company did not initiate any action despite the directions (February 2009) of the Chairman to recover the two per cent charges amounting to � 4.42 crore from cement companies by executing revised MOUs. Subsequently, the Company on the instructions of Principal Secretary Industries (GOR) recovered only half per cent charges towards VADF and SDF each from Ambuja Cement Limited for which MOU was executed in October 2007 for establishing plant at Nagaur and thus short recovered � 14.54 lakh.
In absence of any action to recover the VADF and SDF from cement companies despite directions of the Chairman, � 4.27 crore was pending (July 2011) for recovery.
The Government while accepting the audit observation stated (October 2011) that the matter was being persued with the cement companies for recovery.
Entrepreneur Satisfaction Survey
2.2.52 With a view to assess the satisfaction level of the entrepreneurs in the industrial areas developed and maintained by the Company, Entrepreneur Satisfaction Survey (ESS) was conducted by us during the course of performance audit. The broad idea to conduct this survey was to assess and evaluate the level of satisfaction as regards to:
• Basic infrastructural facilities such as road, drainage, water supply, street lights, safety measures etc. provided in the industrial area;
• Environmental issues addressed by the Company;
• Development of service complexes in the industrial area; and
• Cordial relation with the entrepreneurs.
�12 Ambuja Cement Limited Nagaur (September 2006), J.K. Cement Limited Jaipur
(January 2007), Ambuja Cement Limited Nagaur (October 2007) Shree Cement Limited Jhunjhunu (April 2008), The India Cement Limited Jhunjhunu (April 2008) and Shree Cement Limited Jhunjhunu (July 2008).�
The Company did not recover ���� 4.27 crore towards VADF/SDF due to non-insertion of clause in six MOUs executed with four cement companies.
Audit Report No.4 for the year ended 31 March 2011
100
Coverage and methodology
2.2.53 The survey work was carried out in eight selected units during April 2011. Due cognizance was given in selection of the industrial areas and a sample of both new and old industrial areas i.e. industrial areas developed during the review period as well as industrial areas developed prior to April 2005 was taken.
The coverage was as under:
Name of unit Total industrial areas
Industrial area surveyed
Plots allotted
Units in production Units surveyed In total
industrial areas In industrial areas surveyed
Ajmer 22 3 3490 2470 1213 127 Balotra 7 2 1352 938 776 85
Bhiwadi-I 3 1 1752 1457 1345 148 Bhiwadi-II 6 2 2510 334 188 19 Jaipur-North 11 2 3254 2552 1516 151 Jaipur-Rural 16 2 1954 1606 394 39 Kota 27 2 3296 2529 1347 140 Neemrana 8 1 1050 589 124 11 Total 100 15 18658 12475 6903 720
A questionnaire consisting 26 aspects having five levels13 of satisfaction measurement was provided to the entrepreneurs and our survey teams in person conversed with them to identify and respond the factors directly affecting the conduct of business. The database so created was analysed for the Company as a whole as well for individual units. The entrepreneurs response for any category of facilities provided by the Company were categorised as ‘excellent’, ‘very good’ and ‘good’ was treated, as the entrepreneurs were satisfied and where the response was ‘Average’ and ‘Poor’ were treated as unsatisfied. Further, the industrial area was treated as satisfied, where 50 per cent or more entrepreneurs were satisfied with the services.
Satisfaction level
2.2.54 The percentage satisfaction level of macro parameters is given in the
�13 � Excellent, Very Good, Good, Average and Poor.�
Chapter II Performance Audit relating to Government Companies
101
bar chart below:
�
��
��
��
��
��
��
�
�
��
���
Road Quality Other infra facilities
Environmental issues
Service complex
Other aspects
� � � � ��� �
���
�
�� ��
�
�
�
�� ���
�
��
�� �� ��
��
Excellent Very Good Good Average Poor
�
It could be seen from above bar-graph that the satisfaction level on major parameters ranged between 27 and 52 per cent which is major cause of concern. The unit wise analysis of the satisfaction level of the entrepreneurs is given in Annexure-20. It may be seen there from that:
Roads
2.2.55 Our analysis of road services revealed that the unit offices largely failed to provide quality roads and their repair and maintenance as the dissatisfaction level of entrepreneurs was 66 and 68 per cent respectively. The entrepreneurs of Neemrana, Jaipur–North and Balotra units were more satisfied than of other units towards road services while the entrepreneurs of Ajmer, Bhiwadi-I and Kota unit were highly dissatisfied with the quality as well as repair and maintenance of roads.
Audit Report No.4 for the year ended 31 March 2011
102
Other infrastructure facilities
2.2.56 Our analysis of other infrastructural facilities provided by the Company revealed the following:
• The entrepreneurs of all the surveyed units except Bhiwadi-II and Neemrana were dissatisfied with the cleanliness and proper drainage system provided in the industrial areas. There was no mechanism in any industrial area for the disposal of solid waste generated by the units.
• The unit offices were highly indifferent in providing safety measures in the industrial areas as no industrial area was satisfied with the arrangements to avoid any untoward accident, fire etc.
• The approach of the Company towards maintenance of infrastructural facilities in old industrial areas was not up to the mark as the satisfaction level in newly developed industrial areas (Bhiwadi-II and Neemrana) was higher as compare to old industrial areas.
• Inadequate water supply at Ajmer, Balotra, and Kota adversely affected the industrial growth in the State.
Environmental issues
2.2.57 Our analysis of the awareness of the Company towards environmental
Chapter II Performance Audit relating to Government Companies
103
aspects revealed that:
• The entrepreneurs were largely dissatisfied with the plantation done by the Company in the industrial areas as well as maintenance of green belt.
• 68 per cent entrepreneurs indicated essentiality for setting up of CETP in the industrial areas. The Company has so far installed only two CETPs in the units under survey i.e. one at Bhiwadi-I and another at Jaipur-Rural.�
Service Complexes
2.2.58 Our analysis of the service facilities provided in industrial areas revealed that:
• Entrepreneurs of all the surveyed units were largely dissatisfied with the Company due to non-developing complex for product display and marketing.
• Entrepreneurs were satisfied with the availability of Bank/Post office provided in the industrial areas.
• Telecommunication facilities were inadequate in all the surveyed units except Balotra and Jaipur-North.
Other aspects
2.2.59 The views of entrepreneurs in surveyed industrial areas regarding behavioural aspects and application of rules and regulations were as follows:
• Entrepreneurs at large except at Ajmer and Kota were of the view that the rules and regulations of the Company were being applied properly and in a transparent manner.
• Only 47 per cent of the entrepreneurs were satisfied with the promptness of unit offices in disposal of the problems being faced by them as well as redressal of grievances.
Audit Report No.4 for the year ended 31 March 2011
104
• Entrepreneurs were highly satisfied with the behavior of the Company’s personnel.
• 65 per cent of the entrepreneurs were dissatisfied with the utilisation of service charges recovered from them on up-keep and maintenance of industrial areas.
Overall opinion
2.2.60 The unit offices of the Company largely failed to provide basic infrastructural facilities to the entrepreneurs in the industrial areas which had adversely affected the units in production and consequently the pace of industrialisation in the State. The Company needs to play an enhanced role towards addressing the issues relating to cleanliness, solid waste management, adequate water supply arrangements and environmental aspects by making proper utilisation of service charges recovered from entrepreneurs to maintain industrial areas and environment sustainability.
Internal Control and Monitoring Mechanism
2.2.61 The internal control and monitoring mechanism that existed in the Company was inadequate in view of the following:
• The unit offices did not carry out proper site survey before acquisition and possession of land. This led to acquisition of land without proper approach roads besides partial acquisition due to encroachment.
• The Company was not vigilant in acquisition of land which led to faulty approval of lay-out plans, allotment of un-acquired land and hindrances in development of industrial area as per original plans.
• The unit offices did not maintain proper land records and also the MIS at head office related to land acquisition, development and allotment was merely generated for the purpose of creating database which was never reconciled with the books of accounts. The MIS was not utilised for decision making process as the same was not presented before the higher management to monitor the infrastructure development activity.
• The apex management did not monitor the progress of centrally assisted schemes which led to delay in implementation of schemes.
• The unit offices did not ensure proper measurement of land which led to allotment of excess land.
Chapter II Performance Audit relating to Government Companies
105
Other issues
Appointment of consultant for Human Resource and Management System
2.2.62 We noticed that the bid evaluation committee while evaluating (February 2010) the tenders for appointment of consultant for Human Resource and Management System did not follow the parameters determined in terms of reference and decided (March 2010) to open the financial bid of only Ma-Foi Consulting Solutions Limited (MFCS) among four bidders14, merely on the basis of presentation given by MFCS to the Managing Director.
We observed that the decision of bid evaluation committee was not justified and lacked transparency as it deviated from the decided (January 2010) procedure of selection of consultant and favoured MFCS only, without specifying any reason for declaring the other three bidders as technically unfit. Further, the committee also ignored the technical evaluation report wherein the Ernst & Young Private Limited (EYPL) was the most technically eligible bidder.
The Government stated (October 2011) that the Committee evaluated the presentation as well as technical bids, requisite parameters, professional contribution and past experience of the bidders and thereafter recommended to open the financial bid of MFCS only, as rest three bidders were not found technically fit. The reply is factually incorrect in view of the fact that as per the analysis/technical bid evaluation report of the Committee itself, MFCS did not have past experience in developing HR policy whereas EYPL was most suited to the requirements of the Company.
Conclusion
The performance of the Company towards industrial promotion and development in the State was deficient as it did not prepare long term plans for balanced regional development and the acquired land remained undeveloped for long period. The objective of developing thrust sectors at identified places in the State Industrial Policy 1998 was not fully achieved. There were discrepancies in land records and the Company did not adhere to the terms and conditions of Government allotted land and the mutation of private land in revenue records was also not done. Further, improper planning, inadequate site survey caused non-acquisition/partial acquisition of land which hampered the industrial development process besides blockage of funds. Faulty approval of lay out plans due to non-acquisition/obtaining physical possession of entire land caused allotment of un-acquired land. The IDC violated the laid down rules and made decisions on case-to-case basis, which led to undue benefit to some entrepreneurs besides causing loss of revenue. Non-monitoring of centrally sponsored schemes by the apex management led to delay in
�14� Transitions, Jaipuria Institute of Management, Ma-Foi Consulting Solutions Limited,
and Ernst & Young Private Limited.�
Audit Report No.4 for the year ended 31 March 2011
106
implementation of the schemes and consequently, the State was deprived of the envisaged benefits of industrial growth.
Recommendations
The Company should:
• Follow the acquisition process to ensure physical possession of the land before approving lay-out plan;
• Make long-term plan for development of industrial areas to ensure balanced regional development;
• Ensure achievement of the objectives of State Industrial Policy;
• Recover its legitimate dues as per rules, regulations and policy thereof;
• Decide all the cases as per laid down rules, regulations, policy and the provisions of MOU;
• Ensure clear title/availability of land to avoid any dispute; and
• Ensure effective monitoring at top-level management to accomplish intended benefits and objectives of the schemes.
Related Documents