Chapter II: Economic Sector 19 2.1 Introduction This Chapter of the Audit Report deals with the audit findings on functioning of the Government departments under Economic Sector. The names of the departments and the total budget allocation and expenditure of the Government under Economic Sector during the year 2016-17 are given in the table below: Table 2.1.1 (₹ in crore) Sl. No. Name of the Department Total Budget Allocation Expenditure 1 Animal Husbandry, Livestock, Fisheries and Veterinary Services 68.54 46.65 2 Buildings and Housing 52.26 50.26 3 Commerce and Industries 63.06 45.76 4 Co-operation 17.12 14.66 5 Energy and Power 337.93 271.81 6 Food Security and Agriculture Development 83.34 53.37 7 Forest, Environment and Wildlife Management 224.01 132.17 8 Horticulture and Cash Crops Development 111.54 62.71 9 Water Resources and River Development 171.74 30.74 10 Mines, Minerals and Geology 4.81 4.56 11 Roads and Bridges 328.77 156.98 12 Rural Management and Development 522.97 482.54 13 Tourism and Civil Aviation 70.90 58.70 14 Transport 62.84 60.74 15 Urban Development and Housing 206.64 75.71 16 Water Security and Public Health Engineering 164.85 69.75 TOTAL 2,491.32 1,617.11 2.2 Planning and conduct of audit Audit process starts with the assessment of risks faced by various departments based on expenditure incurred, criticality/complexity of activities, level of delegated financial powers, assessment of overall internal controls, etc. After completion of audit of each unit on a test check basis, Inspection Reports (IRs) containing audit findings are issued to the heads of the departments. The departments are to furnish replies to the audit findings within one month of receipt of the IRs. Whenever replies are received, audit findings are either settled based on reply/action taken or further action is required by the audited entities for compliance. Some of the important audit observations arising out of these IRs are processed for inclusion in the Audit Reports. The Audit Reports are submitted to the Governor of the State under Article 151 of the Constitution of India for laying on the table of the Legislature. CHAPTER II ECONOMIC SECTOR

Welcome message from author
This document is posted to help you gain knowledge. Please leave a comment to let me know what you think about it! Share it to your friends and learn new things together.
Transcript
Chapter II: Economic Sector
19
2.1 Introduction
This Chapter of the Audit Report deals with the audit findings on functioning of the
Government departments under Economic Sector.
The names of the departments and the total budget allocation and expenditure of the
Government under Economic Sector during the year 2016-17 are given in the table
below:
Table 2.1.1
(₹ in crore)
Sl.
No. Name of the Department
Total Budget
Allocation Expenditure
1 Animal Husbandry, Livestock, Fisheries and Veterinary
Services 68.54 46.65
2 Buildings and Housing 52.26 50.26
3 Commerce and Industries 63.06 45.76
4 Co-operation 17.12 14.66
5 Energy and Power 337.93 271.81
6 Food Security and Agriculture Development 83.34 53.37
7 Forest, Environment and Wildlife Management 224.01 132.17
8 Horticulture and Cash Crops Development 111.54 62.71
9 Water Resources and River Development 171.74 30.74
10 Mines, Minerals and Geology 4.81 4.56
11 Roads and Bridges 328.77 156.98
12 Rural Management and Development 522.97 482.54
13 Tourism and Civil Aviation 70.90 58.70
14 Transport 62.84 60.74
15 Urban Development and Housing 206.64 75.71
16 Water Security and Public Health Engineering 164.85 69.75
TOTAL 2,491.32 1,617.11
2.2 Planning and conduct of audit
Audit process starts with the assessment of risks faced by various departments based on
expenditure incurred, criticality/complexity of activities, level of delegated financial
powers, assessment of overall internal controls, etc.
After completion of audit of each unit on a test check basis, Inspection Reports (IRs)
containing audit findings are issued to the heads of the departments. The departments are
to furnish replies to the audit findings within one month of receipt of the IRs. Whenever
replies are received, audit findings are either settled based on reply/action taken or further
action is required by the audited entities for compliance. Some of the important audit
observations arising out of these IRs are processed for inclusion in the Audit Reports. The
Audit Reports are submitted to the Governor of the State under Article 151 of the
Constitution of India for laying on the table of the Legislature.
CHAPTER II
ECONOMIC SECTOR
Audit Report for the year ended 31 March 2017
20
Test audits were conducted involving expenditure of ₹ 868.30 crore of previous years of
the State Government under Economic Sector. The details of year-wise break-up is given
in Appendix 2.2.1. This Chapter contains two Performance Audits on ‘National Rural
Drinking Water Programme’ (NRDWP) and ‘Sikkim Nationalised Transport Division
including implementation of the Integrated Depot Management System’ and seven
Compliance Audit Paragraphs as given below:
2.3 National Rural Drinking Water Programme
Performance Audit (PA) on implementation of NRDWP in Sikkim for the period 2012-17
was conducted during April-July 2017 to ascertain effectiveness of planning, economy,
efficiency in implementation and effectiveness of monitoring. PA disclosed deficiencies in
planning, programme execution and monitoring mechanism. The Department had not
constituted the Source Finding Committee. There were short-release of State share and
delay in submission of Annual Action Plan. As of March 2017, the Department was able
to make only 737 habitations out of 2,084 habitations as Fully Covered in the State while
the remaining 1,347 habitations (65 per cent) had not been covered even after the
implementation of revised scheme in 2009. One hundred and five rural water supply
schemes (RWSS) out of the total 462 RWSS in the State had not been completed even after
a delay ranging between three and four years beyond the stipulated date of completion.
The water quality monitoring and testing for detection of chemicals and bacteriological
contamination fell short of the stipulated targets. Discrepancies in data maintained in the
Integrated Management Information System (IMIS) and that maintained by the
implementing agencies undermined the reliability of the system as a viable tool for
monitoring. The following were the main highlights of the PA.
Highlights
Lack of effective delivery mechanism, planning and functioning on the part of
State Water and Sanitation Mission, State Level Scheme Sanctioning Committee
and State Technical Agency led to abnormal delay in completion of projects. This
deprived the intended benefits of providing safe drinking water to the targeted
beneficiaries.
(Paragraph 2.3.9.1)
Analysis of financial management disclosed short-release of State share of ₹ 4.83
crore. As against the total required State share of ₹ 13.95 crore, only ₹ 9.12 crore
was released by the State Government. There was also delay in release of funds by
State to State Water and Sanitation Mission.
(Paragraph 2.3.9.2)
RURAL MANAGEMENT AND DEVELOPMENT DEPARTMENT
Chapter II: Economic Sector
21
The Department procured 84 electro-chlorinators worth ₹ 1.18 crore during 2012-
13 from the Natural Calamity Fund meant for immediate restoration and repair
of damaged drinking water supply works. None of these chlorinators were put to
use in any of the Gram Panchayat Units and were lying idle in dilapidated
condition. This fact was confirmed during physical verification of eight GPUs
where none of the electro-chlorinators were functioning.
(Paragraph 2.3.9.3.3 (d))
Inadequacy in project preparation process led to tapping of water from non-
perennial sources, non-commencement of work involving ₹ 53.63 lakh.
Abandonment of six projects despite incurring ₹ 19.43 lakh owing to land dispute,
absence of source and contractor’s negligence.
(Paragraph 2.3.9.3.1)
All the three mega projects involving ₹ 40.77 crore were lagging behind the
scheduled date of completion by more than two and a half years. This was due to
non-receipt of forest clearance and non-availability of pipes/fittings, contractor’s
negligence and slow pace of work.
(Paragraph 2.3.9.3.1 (c))
As against the total requirement of 1,83,990 tests (Bacteriological and chemical) to
be conducted during 2012-17, the District Laboratories conducted only 5,820 tests.
(Paragraph 2.3.9.3.6 (h))
There were discrepancies in data uploaded in the Integrated Management
Information System with that of records maintained by the Department. The
monitoring mechanism was non-existent as evident from the fact that several
projects were delayed beyond the targeted date.
(Paragraph 2.3.9.4.1)
2.3.1 Introduction
Sikkim is known for its substantial water resources being endowed with waterfalls,
springs, rivers and lakes. The average annual rainfall of 2,739 millimetre is the principal
mode of recharge of surface water. Despite these advantages however, providing potable
water on a sustainable basis to its citizens is becoming increasingly a challenge due to
rapid growth of population and industrial development in the State.
The Accelerated Rural Water Supply Programme (ARWSP), renamed (2009) as National
Rural Drinking Water Programme (NRDWP) by the Government of India (GoI), aims to
provide every rural person with adequate safe water for drinking, cooking and other
domestic basic needs on a sustainable basis.
NRDWP funds rural water supply schemes with special focus on water-stressed and water
quality affected areas, rainwater harvesting and groundwater recharge measures and for
operation and maintenance. It promotes conjunctive use of surface and roof rainwater,
Audit Report for the year ended 31 March 2017
22
and, supports convergence with other developmental programmes. The NRDWP, in
Sikkim, was being implemented by Rural Management and Development Department
The rural habitations were categorised as Fully Covered, Partially Covered and Not
Covered habitations. Not Covered habitations were defined as habitations where a
drinking water source was not available within 100 mtrs. elevation in hilly areas, or where
the habitations had a water source affected by quality problems; Partially Covered were
those habitations which had a safe drinking water source but the capacity of the system
ranged between 10 and 40 lpcd1. The remaining habitations were known as Fully Covered
habitations.
The components of the programme, purpose of each component, distribution of State
allocation under NRDWP and Centre-State sharing pattern of the NRDWP funding at
State level during 2012-17 are given in Appendix 2.3.1.
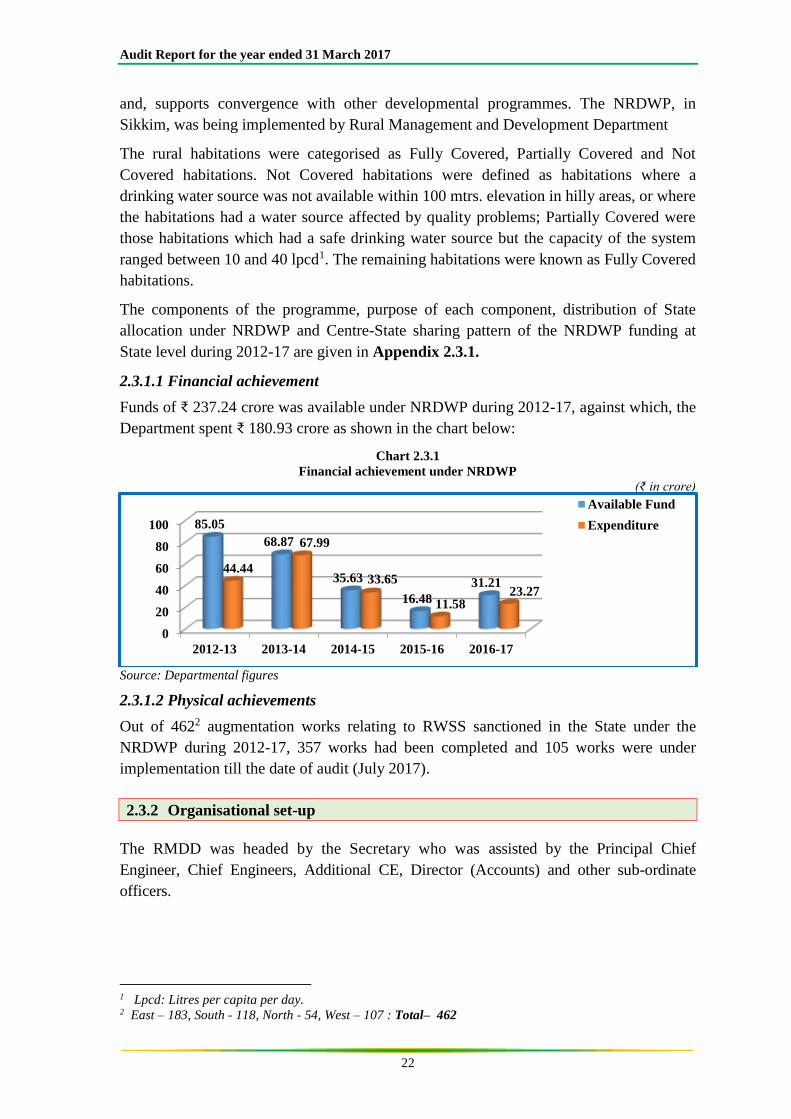
2.3.1.1 Financial achievement
Funds of ₹ 237.24 crore was available under NRDWP during 2012-17, against which, the
Department spent ₹ 180.93 crore as shown in the chart below:
Chart 2.3.1
Financial achievement under NRDWP
(₹ in crore)
Source: Departmental figures
2.3.1.2 Physical achievements
Out of 4622 augmentation works relating to RWSS sanctioned in the State under the
NRDWP during 2012-17, 357 works had been completed and 105 works were under
implementation till the date of audit (July 2017).
2.3.2 Organisational set-up
The RMDD was headed by the Secretary who was assisted by the Principal Chief
Engineer, Chief Engineers, Additional CE, Director (Accounts) and other sub-ordinate
officers.
1 Lpcd: Litres per capita per day. 2 East – 183, South - 118, North - 54, West – 107 : Total– 462
0
20
40
60
80
100
2012-13 2013-14 2014-15 2015-16 2016-17
85.05
68.87
35.63
16.48
31.2144.44
67.99
33.65
11.5823.27
Available Fund
Expenditure
Chapter II: Economic Sector
23
2.3.3 Audit objectives
The Performance Audit of the NRDWP was taken up to ascertain whether:
planning at various levels was adequate;
necessary institutional mechanism existed for effective implementation of the
programme;
the fund management was economical and effective;
the implementation of the NRDWP was effective and efficient; and,
adequate and effective mechanism existed for monitoring and evaluation of the
programme.
2.3.4 Audit criteria
Audit findings were benchmarked against the criteria derived from the following
documents:
Scheme guidelines of the NRDWP issued in 2009 and 2013;
Strategic Plan and Annual Action Plan;
Sikkim Financial Rules;
Sikkim Public Works (SPW) Code and Manual;
Physical and financial progress reported under MIS;
Uniform drinking water quality monitoring protocol;
Statement of Accounts prepared by the firm of Chartered Accountants; and,
Monitoring mechanism prescribed by the GoI and the State Government.
2.3.5 Audit methodology including scope
The audit process began with an Entry Conference (April 2017) held with the Head of the
Department, engineers and district functionaries wherein audit objectives, scope of audit,
audit criteria and audit methodology were explained.
The PA on implementation of NRDWP covering the period from 2012-13 to 2016-17 was
carried out during April-July 2017. Records at the Head Office (RMDD), three (East,
South and North) districts out of four districts, three Zilla Panchayats (ZPs) out of four
ZPs, six Blocks out of 31 Blocks and 15 Gram Panchayat Units (GPUs) out of 176 GPUs
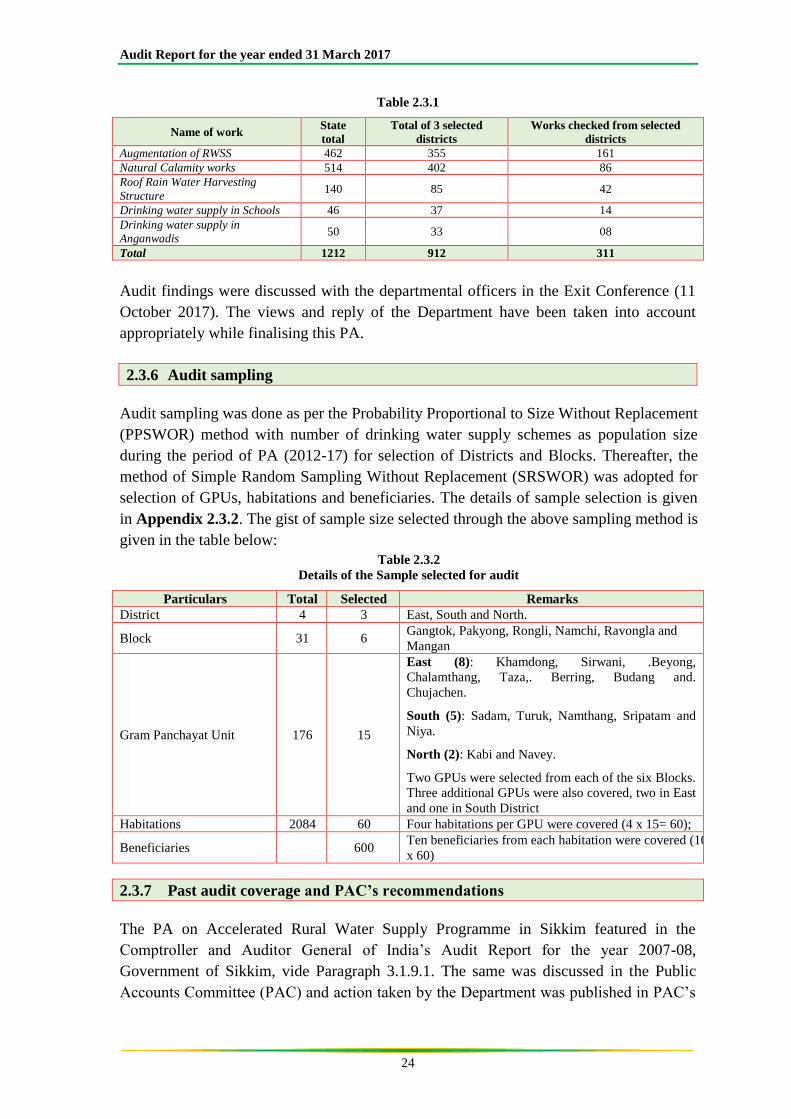
of the selected districts covered under this PA were also checked. Out of 912 works
(₹ 86.95 crore) in the three districts, 311 works (₹ 51.97 crore) were checked. Ninety out
of 311 works were also physically verified along with the departmental engineers and
panchayat functionaries involved in the execution of the projects. The details of selection
of works are given in the table below:
Audit Report for the year ended 31 March 2017
24
Table 2.3.1
Name of work State
total
Total of 3 selected
districts
Works checked from selected
districts
Augmentation of RWSS 462 355 161
Natural Calamity works 514 402 86
Roof Rain Water Harvesting
Structure 140 85 42
Drinking water supply in Schools 46 37 14
Drinking water supply in
Anganwadis 50 33 08
Total 1212 912 311
Audit findings were discussed with the departmental officers in the Exit Conference (11
October 2017). The views and reply of the Department have been taken into account
appropriately while finalising this PA.
2.3.6 Audit sampling
Audit sampling was done as per the Probability Proportional to Size Without Replacement
(PPSWOR) method with number of drinking water supply schemes as population size
during the period of PA (2012-17) for selection of Districts and Blocks. Thereafter, the
method of Simple Random Sampling Without Replacement (SRSWOR) was adopted for
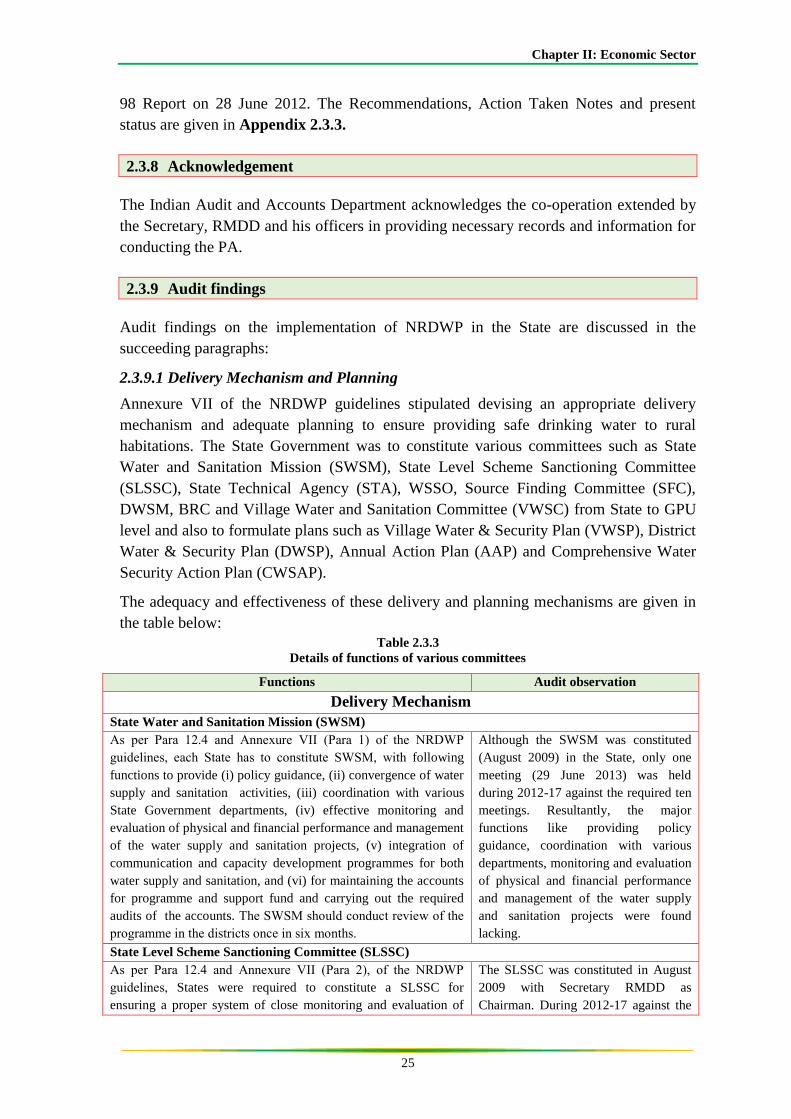
selection of GPUs, habitations and beneficiaries. The details of sample selection is given
in Appendix 2.3.2. The gist of sample size selected through the above sampling method is
given in the table below:
Table 2.3.2
Details of the Sample selected for audit
Particulars Total Selected Remarks
District 4 3 East, South and North.
Block 31 6 Gangtok, Pakyong, Rongli, Namchi, Ravongla and
Mangan
Gram Panchayat Unit 176 15
East (8): Khamdong, Sirwani, .Beyong,
Chalamthang, Taza,. Berring, Budang and.
Chujachen.
South (5): Sadam, Turuk, Namthang, Sripatam and
Niya.
North (2): Kabi and Navey.
Two GPUs were selected from each of the six Blocks.
Three additional GPUs were also covered, two in East
and one in South District
Habitations 2084 60 Four habitations per GPU were covered (4 x 15= 60);
Beneficiaries 600 Ten beneficiaries from each habitation were covered (10
x 60)
2.3.7 Past audit coverage and PAC’s recommendations
The PA on Accelerated Rural Water Supply Programme in Sikkim featured in the
Comptroller and Auditor General of India’s Audit Report for the year 2007-08,
Government of Sikkim, vide Paragraph 3.1.9.1. The same was discussed in the Public
Accounts Committee (PAC) and action taken by the Department was published in PAC’s
Chapter II: Economic Sector
25
98 Report on 28 June 2012. The Recommendations, Action Taken Notes and present
status are given in Appendix 2.3.3.
2.3.8 Acknowledgement
The Indian Audit and Accounts Department acknowledges the co-operation extended by
the Secretary, RMDD and his officers in providing necessary records and information for
conducting the PA.
2.3.9 Audit findings
Audit findings on the implementation of NRDWP in the State are discussed in the
succeeding paragraphs:
2.3.9.1 Delivery Mechanism and Planning
Annexure VII of the NRDWP guidelines stipulated devising an appropriate delivery
mechanism and adequate planning to ensure providing safe drinking water to rural
habitations. The State Government was to constitute various committees such as State
Water and Sanitation Mission (SWSM), State Level Scheme Sanctioning Committee
(SLSSC), State Technical Agency (STA), WSSO, Source Finding Committee (SFC),
DWSM, BRC and Village Water and Sanitation Committee (VWSC) from State to GPU
level and also to formulate plans such as Village Water & Security Plan (VWSP), District
Water & Security Plan (DWSP), Annual Action Plan (AAP) and Comprehensive Water
Security Action Plan (CWSAP).
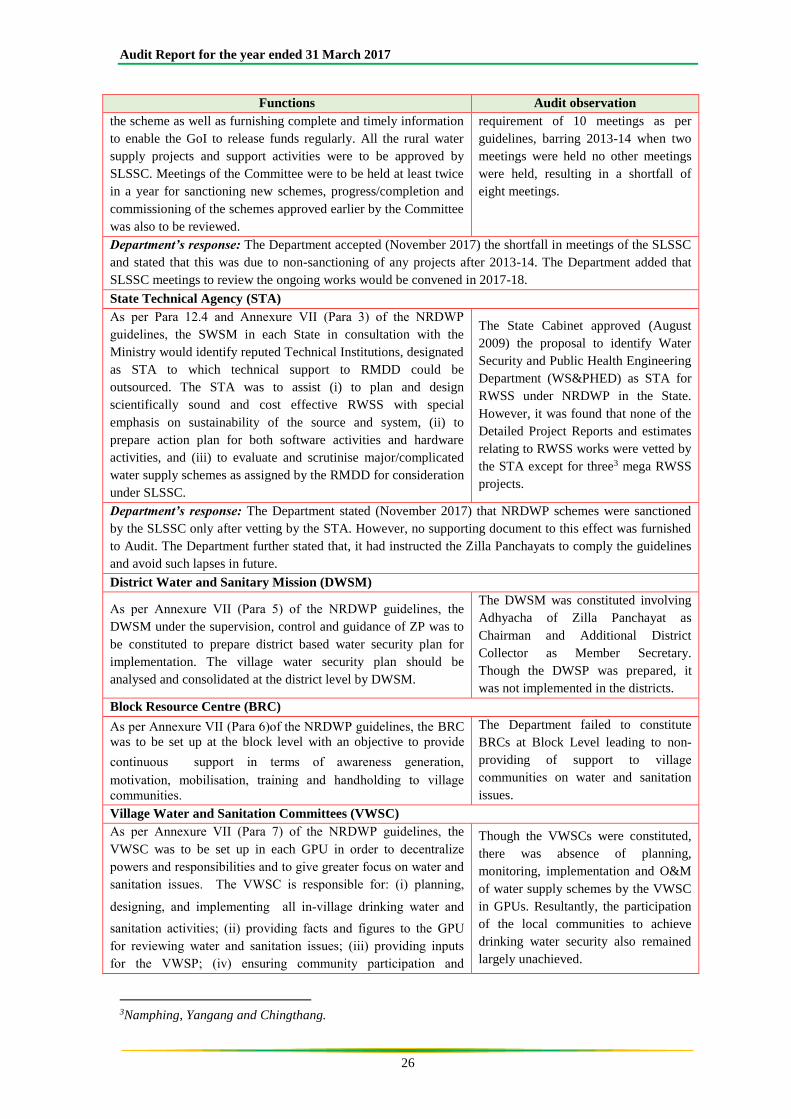
The adequacy and effectiveness of these delivery and planning mechanisms are given in
the table below:
Table 2.3.3
Details of functions of various committees
Functions Audit observation
Delivery Mechanism
State Water and Sanitation Mission (SWSM)
As per Para 12.4 and Annexure VII (Para 1) of the NRDWP
guidelines, each State has to constitute SWSM, with following
functions to provide (i) policy guidance, (ii) convergence of water
supply and sanitation activities, (iii) coordination with various
State Government departments, (iv) effective monitoring and
evaluation of physical and financial performance and management
of the water supply and sanitation projects, (v) integration of
communication and capacity development programmes for both
water supply and sanitation, and (vi) for maintaining the accounts
for programme and support fund and carrying out the required
audits of the accounts. The SWSM should conduct review of the
programme in the districts once in six months.
Although the SWSM was constituted
(August 2009) in the State, only one
meeting (29 June 2013) was held
during 2012-17 against the required ten
meetings. Resultantly, the major
functions like providing policy
guidance, coordination with various
departments, monitoring and evaluation
of physical and financial performance
and management of the water supply
and sanitation projects were found
lacking.
State Level Scheme Sanctioning Committee (SLSSC)
As per Para 12.4 and Annexure VII (Para 2), of the NRDWP
guidelines, States were required to constitute a SLSSC for
ensuring a proper system of close monitoring and evaluation of
The SLSSC was constituted in August
2009 with Secretary RMDD as
Chairman. During 2012-17 against the
Audit Report for the year ended 31 March 2017
26
Functions Audit observation
the scheme as well as furnishing complete and timely information
to enable the GoI to release funds regularly. All the rural water
supply projects and support activities were to be approved by
SLSSC. Meetings of the Committee were to be held at least twice
in a year for sanctioning new schemes, progress/completion and
commissioning of the schemes approved earlier by the Committee
was also to be reviewed.
requirement of 10 meetings as per
guidelines, barring 2013-14 when two
meetings were held no other meetings
were held, resulting in a shortfall of
eight meetings.
Department’s response: The Department accepted (November 2017) the shortfall in meetings of the SLSSC
and stated that this was due to non-sanctioning of any projects after 2013-14. The Department added that
SLSSC meetings to review the ongoing works would be convened in 2017-18.
State Technical Agency (STA)
As per Para 12.4 and Annexure VII (Para 3) of the NRDWP
guidelines, the SWSM in each State in consultation with the
Ministry would identify reputed Technical Institutions, designated
as STA to which technical support to RMDD could be
outsourced. The STA was to assist (i) to plan and design
scientifically sound and cost effective RWSS with special
emphasis on sustainability of the source and system, (ii) to
prepare action plan for both software activities and hardware
activities, and (iii) to evaluate and scrutinise major/complicated
water supply schemes as assigned by the RMDD for consideration
under SLSSC.
The State Cabinet approved (August
2009) the proposal to identify Water
Security and Public Health Engineering
Department (WS&PHED) as STA for
RWSS under NRDWP in the State.
However, it was found that none of the
Detailed Project Reports and estimates
relating to RWSS works were vetted by
the STA except for three3 mega RWSS
projects.
Department’s response: The Department stated (November 2017) that NRDWP schemes were sanctioned
by the SLSSC only after vetting by the STA. However, no supporting document to this effect was furnished
to Audit. The Department further stated that, it had instructed the Zilla Panchayats to comply the guidelines
and avoid such lapses in future.
District Water and Sanitary Mission (DWSM)
As per Annexure VII (Para 5) of the NRDWP guidelines, the
DWSM under the supervision, control and guidance of ZP was to
be constituted to prepare district based water security plan for
implementation. The village water security plan should be
analysed and consolidated at the district level by DWSM.
The DWSM was constituted involving
Adhyacha of Zilla Panchayat as
Chairman and Additional District
Collector as Member Secretary.
Though the DWSP was prepared, it
was not implemented in the districts.
Block Resource Centre (BRC)
As per Annexure VII (Para 6)of the NRDWP guidelines, the BRC
was to be set up at the block level with an objective to provide
continuous support in terms of awareness generation,
motivation, mobilisation, training and handholding to village
communities.
The Department failed to constitute
BRCs at Block Level leading to non-
providing of support to village
communities on water and sanitation
issues.
Village Water and Sanitation Committees (VWSC)
As per Annexure VII (Para 7) of the NRDWP guidelines, the
VWSC was to be set up in each GPU in order to decentralize
powers and responsibilities and to give greater focus on water and
sanitation issues. The VWSC is responsible for: (i) planning,
designing, and implementing all in-village drinking water and
sanitation activities; (ii) providing facts and figures to the GPU
for reviewing water and sanitation issues; (iii) providing inputs
for the VWSP; (iv) ensuring community participation and
Though the VWSCs were constituted,
there was absence of planning,
monitoring, implementation and O&M
of water supply schemes by the VWSC
in GPUs. Resultantly, the participation
of the local communities to achieve
drinking water security also remained
largely unachieved.
3Namphing, Yangang and Chingthang.
Chapter II: Economic Sector
27
Functions Audit observation
decision making in all phases of in-village scheme activities; (v)
commissioning and takeover of completed in-village water supply
and sanitation works through a joint inspection with Line
Department; (vi) collection of funds through a tariff , charges and
deposit system for O&M of water supply and sanitation works for
proper managing and financing of O&M of the services on a
sustainable basis.
Planning
Village Water Security Plan (VWSP)
As per Para 13 of the NRDWP guidelines, the VWSP is
responsible for planning, implementation, management, operation
and maintenance of the rural water supply systems. Village level
planning including water budgeting is the key factor in ensuring
optimum utilisation of water. A water safety plan, performance
improvement plan when augmenting existing infrastructure and
an operational plan for operating the scheme will be part of the
VWSP.
Although the VWSP was prepared at
GPUs, there were absence of
monitoring, planning and maintenance
of the rural water supply systems in the
GPUs covered under this PA. There
was no water budgeting, water safety
plan, performance improvement plan
and operational plan.
District Water Security Plan (DWSP)
As per Para 13 of the NRDWP guidelines, the DWSP should be
prepared based on all the VWSPs of the districts for carrying out
all village work by the GPU or its sub-committee i.e. VWSC. The
DWSP will be implemented by dovetailing funds from different
sources/rural water supply programmes and NRDWP funds.
Although the DWSP was prepared by
the DWSM, none of the required
activities were undertaken in the
villages due to fund constraints and
shortage of manpower.
Annual Action Plan (AAP)
As per Para 14 of the NRDWP guidelines, the main objective of
the AAP is to provide a definite direction to the programme, and
also to ensure regular monitoring of the progress made by the
respective State towards the goal of achieving drinking water
security to every rural household. While preparing the AAP,
completion of the incomplete works was to be given priority over
new works and also to ensure that the works taken up were
completed as per schedule and that there was no delay in
execution. The AAP was also to indicate the target for the year of
coverage of habitations that were proposed to be covered under
these schemes adhering to the prioritisation in targeting
habitations. The AAP for every subsequent year was to be
submitted to GoI by February of each year.
The Department did not furnish the
AAPs for the years 2012-14. However,
the scrutiny of AAPs for the years
2014-17 revealed that priority was not
given for coverage of 0-50 per cent
population, which was one of the core
objectives of the NRDWP. Further,
these were submitted to the GoI
belatedly. There was absence of
monitoring of the ongoing schemes
which resulted into delay in completion
of the projects, non-commencement of
work, abandonment of some projects
etc. which are discussed in paragraph
2.3.9.3.1 (a & b).
Department’s response: The Department stated (November 2017) that the SFC was not set up and the
responsibility of source finding was taken by VWSC. The reply was not tenable as the SFC was responsible
for clearance of schemes put up for approval of SLSSC and for review of the functioning/performance of
existing water supply schemes for availability of potable drinking water as per the norms of the guidelines.
Comprehensive Water Security Action Plan (CWSAP)
As per Para 14 of the NRDWP guidelines, the Department was to
prepare a five year CWSAP including broad directions/thrust and
tangible targets planned to be achieved at the State level
No CWSAP was constituted in the
State. In the absence of CWSAP, it was
not clear how thrust areas were
identified and broad direction given on
the NRDWP’s implementation and
tangible targets were planned.
Audit Report for the year ended 31 March 2017
28
2.3.9.2 Fund Management
As per Para 16.1 of the NRDWP guidelines, the SWSM was to maintain two accounts,
namely, Programme Fund Account and Support Activities Account in any Public Sector
Bank at the State Headquarters. The accounts were required to be audited by a Chartered
Accountant within six months of the close of the financial year. GoI made allocation of
funds under the NRDWP every year in the beginning of the financial year.
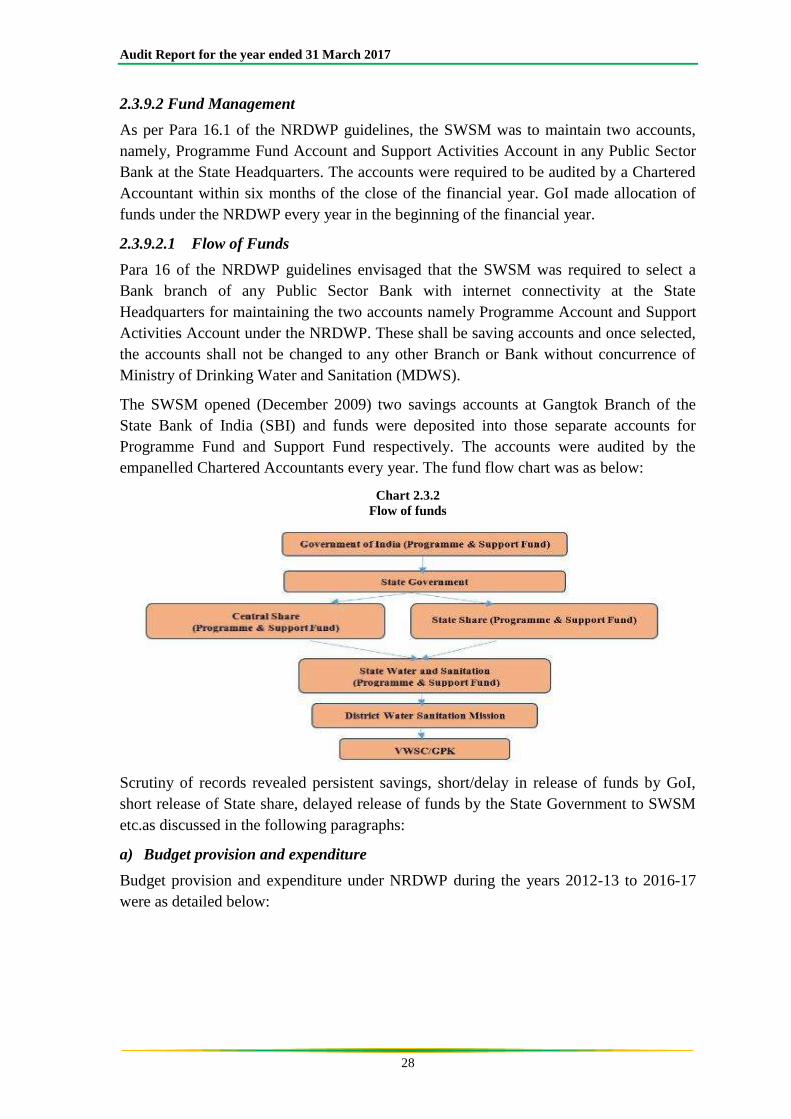
2.3.9.2.1 Flow of Funds
Para 16 of the NRDWP guidelines envisaged that the SWSM was required to select a
Bank branch of any Public Sector Bank with internet connectivity at the State
Headquarters for maintaining the two accounts namely Programme Account and Support
Activities Account under the NRDWP. These shall be saving accounts and once selected,
the accounts shall not be changed to any other Branch or Bank without concurrence of
Ministry of Drinking Water and Sanitation (MDWS).
The SWSM opened (December 2009) two savings accounts at Gangtok Branch of the
State Bank of India (SBI) and funds were deposited into those separate accounts for
Programme Fund and Support Fund respectively. The accounts were audited by the
empanelled Chartered Accountants every year. The fund flow chart was as below:
Chart 2.3.2
Flow of funds
Scrutiny of records revealed persistent savings, short/delay in release of funds by GoI,
short release of State share, delayed release of funds by the State Government to SWSM
etc.as discussed in the following paragraphs:
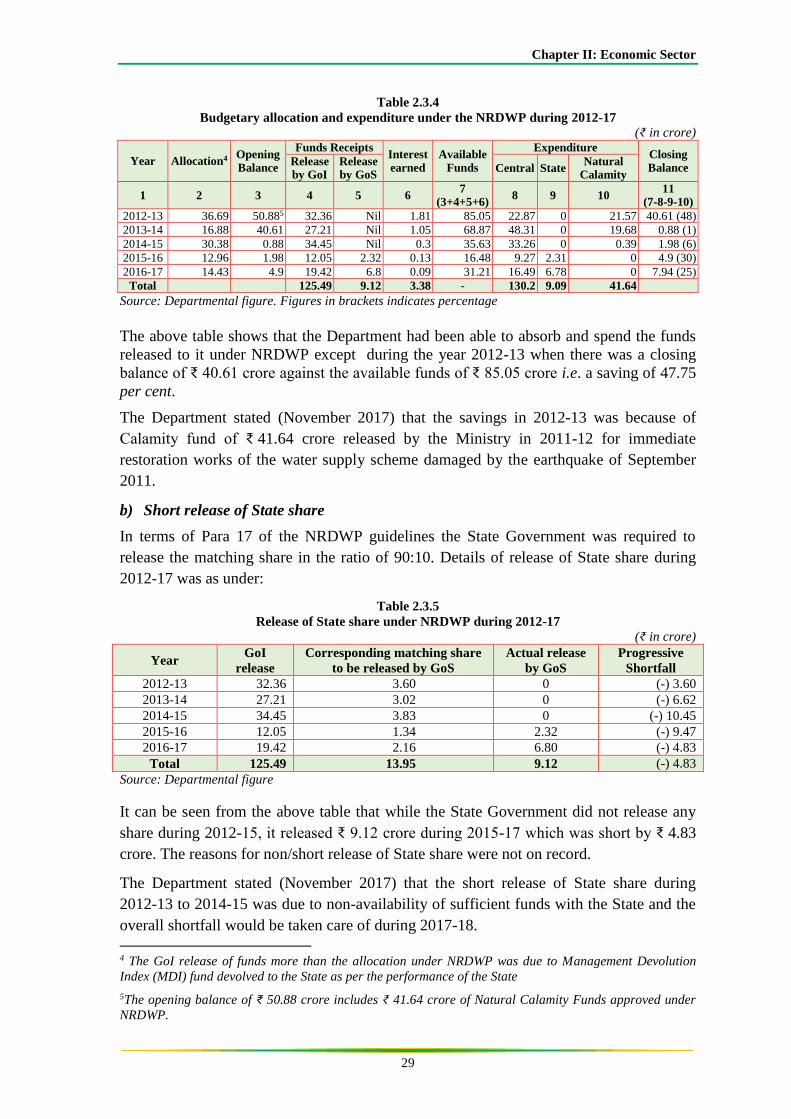
a) Budget provision and expenditure
Budget provision and expenditure under NRDWP during the years 2012-13 to 2016-17
were as detailed below:
Chapter II: Economic Sector
29
Table 2.3.4
Budgetary allocation and expenditure under the NRDWP during 2012-17
(₹ in crore)
Year Allocation4 Opening
Balance
Funds Receipts Interest
earned
Available
Funds
Expenditure Closing
Balance Release by GoI
Release by GoS
Central State Natural
Calamity
1 2 3 4 5 6 7
(3+4+5+6) 8 9 10
11 (7-8-9-10)
2012-13 36.69 50.885 32.36 Nil 1.81 85.05 22.87 0 21.57 40.61 (48)
2013-14 16.88 40.61 27.21 Nil 1.05 68.87 48.31 0 19.68 0.88 (1)
2014-15 30.38 0.88 34.45 Nil 0.3 35.63 33.26 0 0.39 1.98 (6)
2015-16 12.96 1.98 12.05 2.32 0.13 16.48 9.27 2.31 0 4.9 (30)
2016-17 14.43 4.9 19.42 6.8 0.09 31.21 16.49 6.78 0 7.94 (25)
Total
125.49 9.12 3.38 - 130.2 9.09 41.64
Source: Departmental figure. Figures in brackets indicates percentage
The above table shows that the Department had been able to absorb and spend the funds
released to it under NRDWP except during the year 2012-13 when there was a closing
balance of ₹ 40.61 crore against the available funds of ₹ 85.05 crore i.e. a saving of 47.75
per cent.
The Department stated (November 2017) that the savings in 2012-13 was because of
Calamity fund of ₹ 41.64 crore released by the Ministry in 2011-12 for immediate
restoration works of the water supply scheme damaged by the earthquake of September
2011.
b) Short release of State share
In terms of Para 17 of the NRDWP guidelines the State Government was required to
release the matching share in the ratio of 90:10. Details of release of State share during
2012-17 was as under:
Table 2.3.5
Release of State share under NRDWP during 2012-17
(₹ in crore)
Year GoI
release
Corresponding matching share
to be released by GoS
Actual release
by GoS
Progressive
Shortfall
2012-13 32.36 3.60 0 (-) 3.60
2013-14 27.21 3.02 0 (-) 6.62
2014-15 34.45 3.83 0 (-) 10.45
2015-16 12.05 1.34 2.32 (-) 9.47
2016-17 19.42 2.16 6.80 (-) 4.83
Total 125.49 13.95 9.12 (-) 4.83
Source: Departmental figure
It can be seen from the above table that while the State Government did not release any
share during 2012-15, it released ₹ 9.12 crore during 2015-17 which was short by ₹ 4.83
crore. The reasons for non/short release of State share were not on record.
The Department stated (November 2017) that the short release of State share during
2012-13 to 2014-15 was due to non-availability of sufficient funds with the State and the
overall shortfall would be taken care of during 2017-18.
4 The GoI release of funds more than the allocation under NRDWP was due to Management Devolution
Index (MDI) fund devolved to the State as per the performance of the State
5The opening balance of ₹ 50.88 crore includes ₹ 41.64 crore of Natural Calamity Funds approved under
NRDWP.
Audit Report for the year ended 31 March 2017
30
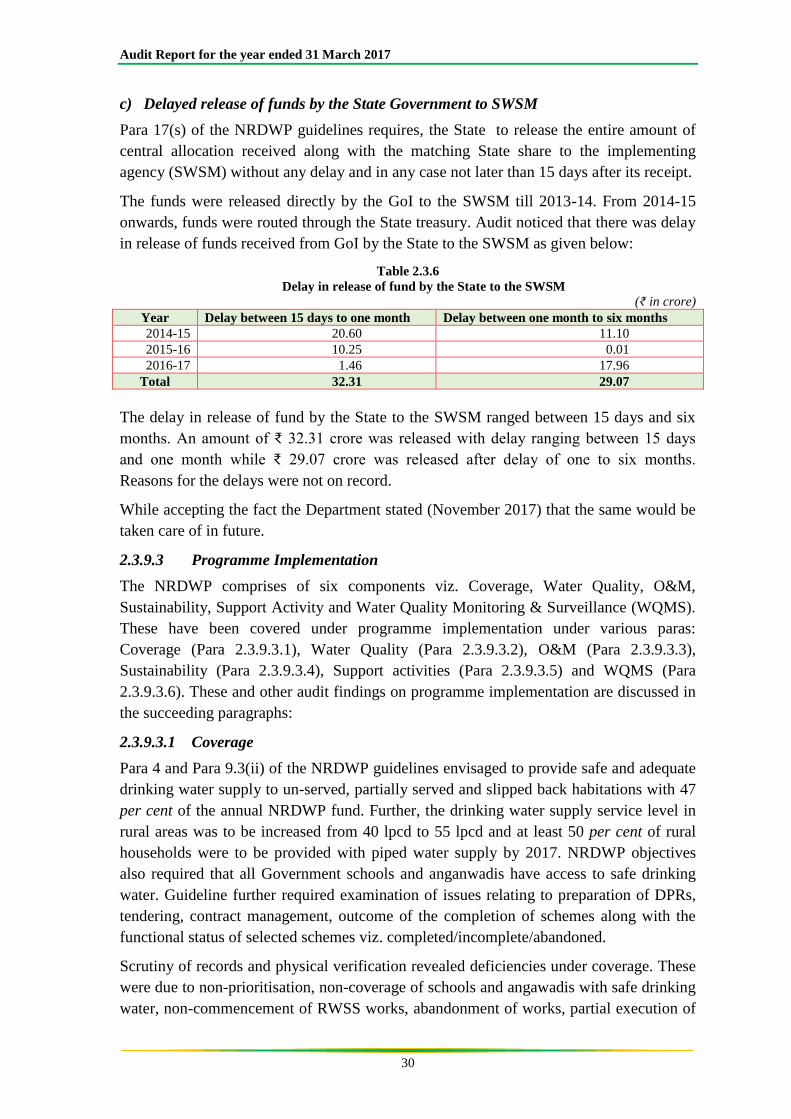
c) Delayed release of funds by the State Government to SWSM
Para 17(s) of the NRDWP guidelines requires, the State to release the entire amount of
central allocation received along with the matching State share to the implementing
agency (SWSM) without any delay and in any case not later than 15 days after its receipt.
The funds were released directly by the GoI to the SWSM till 2013-14. From 2014-15
onwards, funds were routed through the State treasury. Audit noticed that there was delay
in release of funds received from GoI by the State to the SWSM as given below:
Table 2.3.6
Delay in release of fund by the State to the SWSM
(₹ in crore)
Year Delay between 15 days to one month Delay between one month to six months
2014-15 20.60 11.10
2015-16 10.25 0.01
2016-17 1.46 17.96
Total 32.31 29.07
The delay in release of fund by the State to the SWSM ranged between 15 days and six
months. An amount of ₹ 32.31 crore was released with delay ranging between 15 days
and one month while ₹ 29.07 crore was released after delay of one to six months.
Reasons for the delays were not on record.
While accepting the fact the Department stated (November 2017) that the same would be
taken care of in future.
2.3.9.3 Programme Implementation
The NRDWP comprises of six components viz. Coverage, Water Quality, O&M,
Sustainability, Support Activity and Water Quality Monitoring & Surveillance (WQMS).
These have been covered under programme implementation under various paras:
Coverage (Para 2.3.9.3.1), Water Quality (Para 2.3.9.3.2), O&M (Para 2.3.9.3.3),
Sustainability (Para 2.3.9.3.4), Support activities (Para 2.3.9.3.5) and WQMS (Para
2.3.9.3.6). These and other audit findings on programme implementation are discussed in
the succeeding paragraphs:
2.3.9.3.1 Coverage
Para 4 and Para 9.3(ii) of the NRDWP guidelines envisaged to provide safe and adequate
drinking water supply to un-served, partially served and slipped back habitations with 47
per cent of the annual NRDWP fund. Further, the drinking water supply service level in
rural areas was to be increased from 40 lpcd to 55 lpcd and at least 50 per cent of rural
households were to be provided with piped water supply by 2017. NRDWP objectives
also required that all Government schools and anganwadis have access to safe drinking
water. Guideline further required examination of issues relating to preparation of DPRs,
tendering, contract management, outcome of the completion of schemes along with the
functional status of selected schemes viz. completed/incomplete/abandoned.
Scrutiny of records and physical verification revealed deficiencies under coverage. These
were due to non-prioritisation, non-coverage of schools and angawadis with safe drinking
water, non-commencement of RWSS works, abandonment of works, partial execution of
Chapter II: Economic Sector
31
RWSS, tapping of water from non-perennial source and lack of co-ordination within the
State Government departments. These adversely affected the targeted coverage of
habitations as required under the Programme guidelines as discussed in the following
paragraphs:
Priority in coverage
Para 9.1 of the NRDWP guidelines envisaged that higher priority should be given for
coverage of habitations with zero to 25 per cent and 25 to 50 per cent population,
identified quality affected habitations, SC, ST and minority concentrated habitations to
provide adequate and safe drinking water. Hence, the guidelines provide for according
priority to habitations where least number of persons have access to adequate and safe
drinking water.
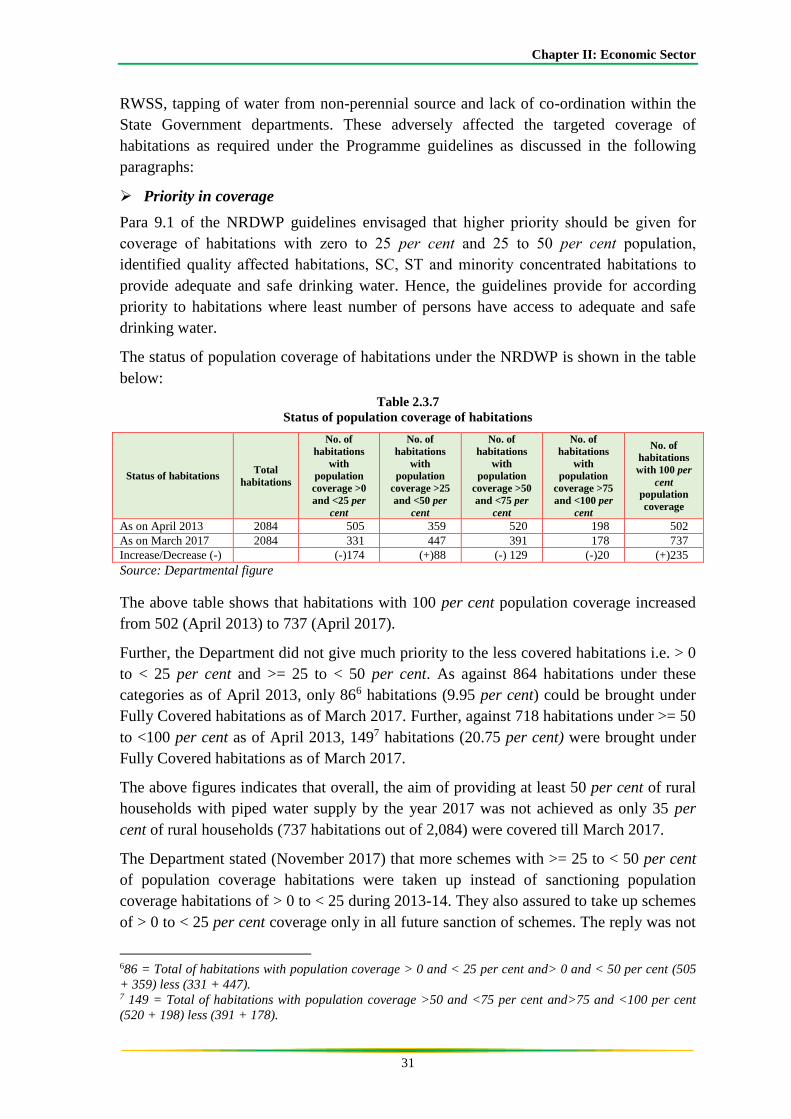
The status of population coverage of habitations under the NRDWP is shown in the table
below:
Table 2.3.7
Status of population coverage of habitations
Status of habitations Total
habitations
No. of
habitations
with
population
coverage >0
and <25 per
cent
No. of
habitations
with
population
coverage >25
and <50 per
cent
No. of
habitations
with
population
coverage >50
and <75 per
cent
No. of
habitations
with
population
coverage >75
and <100 per
cent
No. of
habitations
with 100 per
cent
population
coverage
As on April 2013 2084 505 359 520 198 502
As on March 2017 2084 331 447 391 178 737
Increase/Decrease (-) (-)174 (+)88 (-) 129 (-)20 (+)235
Source: Departmental figure
The above table shows that habitations with 100 per cent population coverage increased
from 502 (April 2013) to 737 (April 2017).
Further, the Department did not give much priority to the less covered habitations i.e. > 0
to < 25 per cent and >= 25 to < 50 per cent. As against 864 habitations under these
categories as of April 2013, only 866 habitations (9.95 per cent) could be brought under
Fully Covered habitations as of March 2017. Further, against 718 habitations under >= 50
to <100 per cent as of April 2013, 1497 habitations (20.75 per cent) were brought under
Fully Covered habitations as of March 2017.
The above figures indicates that overall, the aim of providing at least 50 per cent of rural
households with piped water supply by the year 2017 was not achieved as only 35 per
cent of rural households (737 habitations out of 2,084) were covered till March 2017.
The Department stated (November 2017) that more schemes with >= 25 to < 50 per cent
of population coverage habitations were taken up instead of sanctioning population
coverage habitations of > 0 to < 25 during 2013-14. They also assured to take up schemes
of > 0 to < 25 per cent coverage only in all future sanction of schemes. The reply was not
686 = Total of habitations with population coverage > 0 and < 25 per cent and> 0 and < 50 per cent (505
+ 359) less (331 + 447). 7 149 = Total of habitations with population coverage >50 and <75 per cent and>75 and <100 per cent
(520 + 198) less (391 + 178).
Audit Report for the year ended 31 March 2017
32
acceptable as the prioritisation of less population coverage habitations of 0-25 per cent
and 25-50 per cent should have been done as per the norms of the guidelines.
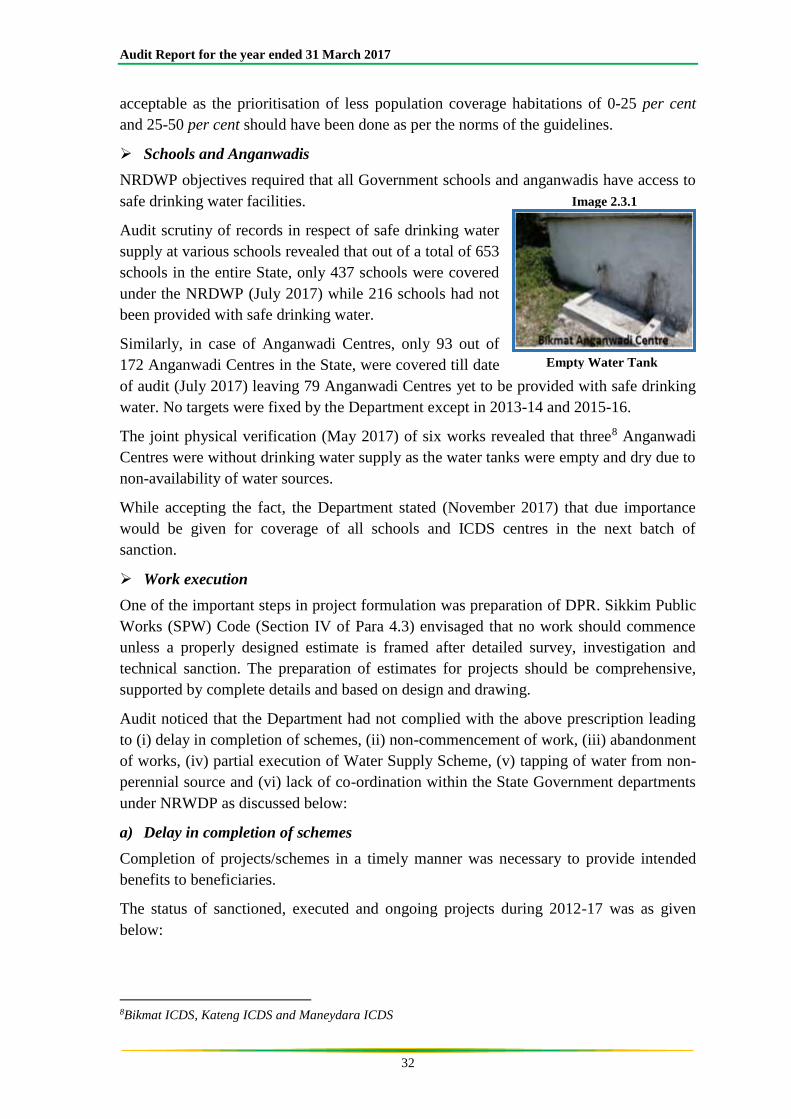
Schools and Anganwadis
NRDWP objectives required that all Government schools and anganwadis have access to
safe drinking water facilities.
Audit scrutiny of records in respect of safe drinking water
supply at various schools revealed that out of a total of 653
schools in the entire State, only 437 schools were covered
under the NRDWP (July 2017) while 216 schools had not
been provided with safe drinking water.
Similarly, in case of Anganwadi Centres, only 93 out of
172 Anganwadi Centres in the State, were covered till date
of audit (July 2017) leaving 79 Anganwadi Centres yet to be provided with safe drinking
water. No targets were fixed by the Department except in 2013-14 and 2015-16.
The joint physical verification (May 2017) of six works revealed that three8 Anganwadi
Centres were without drinking water supply as the water tanks were empty and dry due to
non-availability of water sources.
While accepting the fact, the Department stated (November 2017) that due importance
would be given for coverage of all schools and ICDS centres in the next batch of
sanction.
Work execution
One of the important steps in project formulation was preparation of DPR. Sikkim Public
Works (SPW) Code (Section IV of Para 4.3) envisaged that no work should commence
unless a properly designed estimate is framed after detailed survey, investigation and
technical sanction. The preparation of estimates for projects should be comprehensive,
supported by complete details and based on design and drawing.
Audit noticed that the Department had not complied with the above prescription leading
to (i) delay in completion of schemes, (ii) non-commencement of work, (iii) abandonment
of works, (iv) partial execution of Water Supply Scheme, (v) tapping of water from non-
perennial source and (vi) lack of co-ordination within the State Government departments
under NRWDP as discussed below:
a) Delay in completion of schemes
Completion of projects/schemes in a timely manner was necessary to provide intended
benefits to beneficiaries.
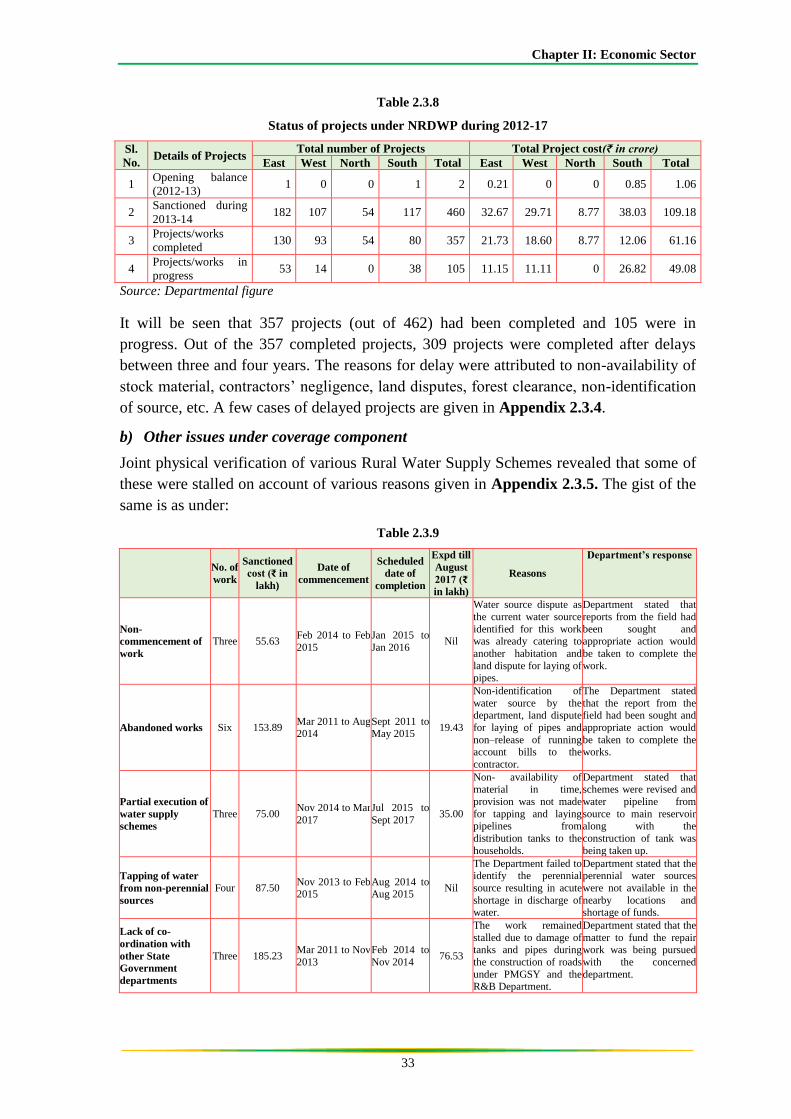
The status of sanctioned, executed and ongoing projects during 2012-17 was as given
below:
8Bikmat ICDS, Kateng ICDS and Maneydara ICDS
Image 2.3.1
Empty Water Tank
Chapter II: Economic Sector
33
Table 2.3.8
Status of projects under NRDWP during 2012-17
Sl.
No. Details of Projects
Total number of Projects Total Project cost(₹ in crore)
East West North South Total East West North South Total
1 Opening balance
(2012-13) 1 0 0 1 2 0.21 0 0 0.85 1.06
2 Sanctioned during
2013-14 182 107 54 117 460 32.67 29.71 8.77 38.03 109.18
3 Projects/works
completed 130 93 54 80 357 21.73 18.60 8.77 12.06 61.16
4 Projects/works in
progress 53 14 0 38 105 11.15 11.11 0 26.82 49.08
Source: Departmental figure
It will be seen that 357 projects (out of 462) had been completed and 105 were in
progress. Out of the 357 completed projects, 309 projects were completed after delays
between three and four years. The reasons for delay were attributed to non-availability of
stock material, contractors’ negligence, land disputes, forest clearance, non-identification
of source, etc. A few cases of delayed projects are given in Appendix 2.3.4.
b) Other issues under coverage component
Joint physical verification of various Rural Water Supply Schemes revealed that some of
these were stalled on account of various reasons given in Appendix 2.3.5. The gist of the
same is as under:
Table 2.3.9
No. of
work
Sanctioned
cost (₹ in
lakh)
Date of
commencement
Scheduled
date of
completion
Expd till
August
2017 (₹
in lakh)
Reasons
Department’s response
Non-
commencement of
work
Three 55.63 Feb 2014 to Feb
2015
Jan 2015 to
Jan 2016 Nil
Water source dispute as
the current water source
identified for this work was already catering to
another habitation and
land dispute for laying of pipes.
Department stated that
reports from the field had
been sought and appropriate action would
be taken to complete the
work.
Abandoned works Six 153.89 Mar 2011 to Aug 2014
Sept 2011 to May 2015
19.43
Non-identification of
water source by the department, land dispute
for laying of pipes and
non–release of running account bills to the
contractor.
The Department stated
that the report from the field had been sought and
appropriate action would
be taken to complete the works.
Partial execution of
water supply
schemes
Three 75.00 Nov 2014 to Mar
2017
Jul 2015 to
Sept 2017 35.00
Non- availability of material in time,
provision was not made
for tapping and laying
pipelines from
distribution tanks to the
households.
Department stated that schemes were revised and
water pipeline from
source to main reservoir
along with the
construction of tank was
being taken up.
Tapping of water
from non-perennial
sources
Four 87.50 Nov 2013 to Feb 2015
Aug 2014 to Aug 2015
Nil
The Department failed to identify the perennial
source resulting in acute
shortage in discharge of water.
Department stated that the perennial water sources
were not available in the
nearby locations and shortage of funds.
Lack of co-
ordination with
other State
Government
departments
Three 185.23 Mar 2011 to Nov
2013
Feb 2014 to
Nov 2014 76.53
The work remained
stalled due to damage of tanks and pipes during
the construction of roads
under PMGSY and the R&B Department.
Department stated that the
matter to fund the repair work was being pursued
with the concerned
department.
Audit Report for the year ended 31 March 2017
34
c) Implementation of mega RWSS projects
The sources of water supply in Sikkim are mainly rivulets and spring water sources.
Some of these are perennial but most dry up or lose discharge during lean seasons. To
overcome the hardship faced in the water scarce areas of the State, three mega projects
(RWSS at Yangang, Namphing and Chingthang) were taken up by the Department. Audit
scrutiny of records of these three projects revealed the following.
i. During joint physical verification (May 2017) of the Yangang RWSS project it was
noticed that the project was delayed by two and half years achieving 20 per cent of
physical progress after spending ₹ 9.52 crore (63 per cent) against the scheduled date of
completion of February 2015. The construction of sedimentation tank near source was
stopped by Forest Department as forest clearance was not obtained. Only 16,154 mtrs. of
pipes were laid as against the total requirement of 64,050 mtrs. of pipes. Out of 57 tanks,
only four were installed/fabricated. Further, only 40 water hydrants were constructed as
against the requirement of 735. The reasons for delay were non-availability of stock
material, non-finalisation of actual site, delay in getting forest clearance for construction
of sedimentation tank and objection by private landowners for laying pipes and GI tanks.
The Department stated (November 2017) that the project was being revised due to
change in scope of work and scheduled to be completed by April 2018.
ii. Scrutiny of records revealed that the Department allowed the firm to conduct survey
at the higher rate of ₹ 5,000 per acre as against ₹ 3,000 per acre allowed to the same firm
during the same period and for similar assignment for two other contour surveys at
Namphing RWSS (South District) and Chingthang RWSS (West District). Thus, an
excess payment of ₹ 8.00 lakh was made to the firm.
iii. As per one9 of the items of the estimate, the pipes measuring length of 64,050 mtrs.
was required to be buried by excavating soil at a total cost of ₹ 21.59 lakh. Joint physical
verification (May 2017), however, revealed that the pipes were laid without excavating
soil and burying the pipes underneath. Thus, payment towards unexecuted work was
irregular. Further, non-execution of this item of work led to laying of the pipelines on
surface that exposed the pipes to high risk of damage.
While accepting the audit observation, the Department stated (November 2017) that it
was issuing instructions to bury the pipelines as per the provisions of the estimate.
RWSS at Namphing
The GoI sanctioned ₹18.14 crore for a RWSS targeted to cater to 1200 households at
Namphing and its surrounding areas in South Sikkim on 90:10 cost sharing with the State.
The civil portion of work to the tune of ₹ 7.48 crore was awarded (February 2014) to a
contractor and scheduled to be completed by February 2016. As per the DPR, the water
was to be tapped from three different sources and three pressure filters were to be
installed between these sources and the main reservoirs. As of March 2017, 66 per cent of
the work was completed at a cost of ₹ 9.30 crore. 9Excavation in foundation trenches in mixed soil, hard rock and mixed filling in pipe line with excavated
earth, etc. all complete’.
Chapter II: Economic Sector
35
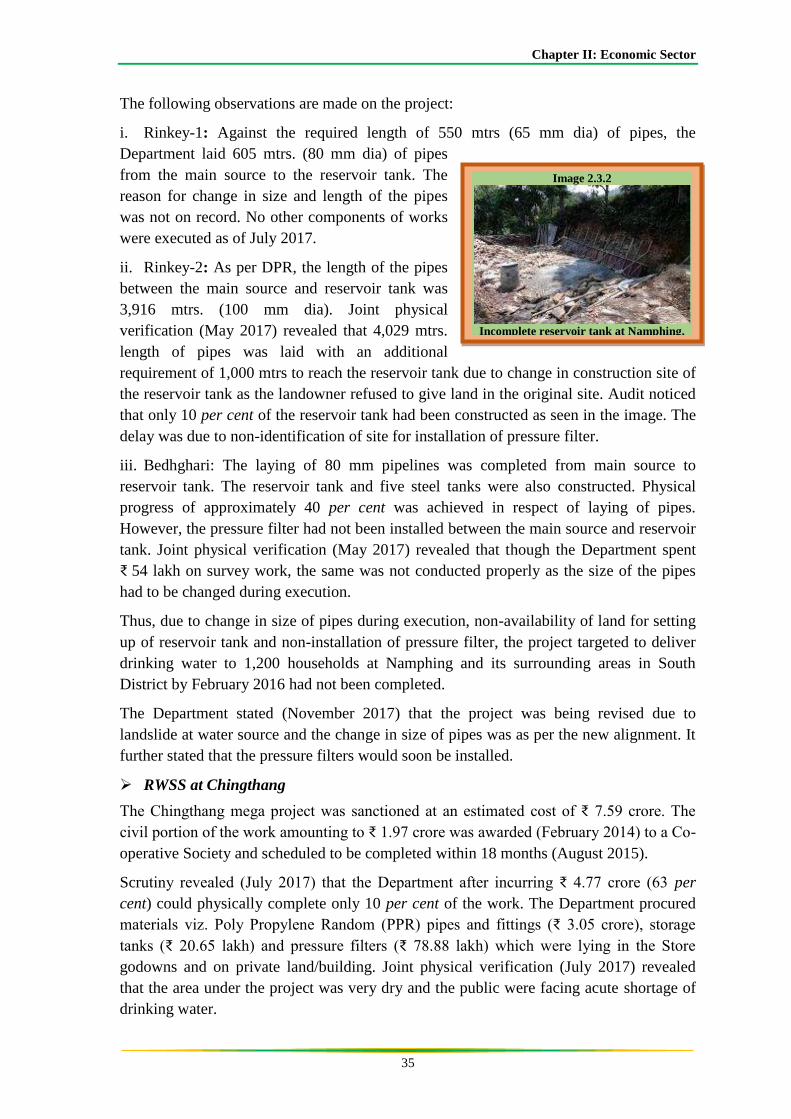
The following observations are made on the project:
i. Rinkey-1: Against the required length of 550 mtrs (65 mm dia) of pipes, the
Department laid 605 mtrs. (80 mm dia) of pipes
from the main source to the reservoir tank. The
reason for change in size and length of the pipes
was not on record. No other components of works
were executed as of July 2017.
ii. Rinkey-2: As per DPR, the length of the pipes
between the main source and reservoir tank was
3,916 mtrs. (100 mm dia). Joint physical
verification (May 2017) revealed that 4,029 mtrs.
length of pipes was laid with an additional
requirement of 1,000 mtrs to reach the reservoir tank due to change in construction site of
the reservoir tank as the landowner refused to give land in the original site. Audit noticed
that only 10 per cent of the reservoir tank had been constructed as seen in the image. The
delay was due to non-identification of site for installation of pressure filter.
iii. Bedhghari: The laying of 80 mm pipelines was completed from main source to
reservoir tank. The reservoir tank and five steel tanks were also constructed. Physical
progress of approximately 40 per cent was achieved in respect of laying of pipes.
However, the pressure filter had not been installed between the main source and reservoir
tank. Joint physical verification (May 2017) revealed that though the Department spent
₹ 54 lakh on survey work, the same was not conducted properly as the size of the pipes
had to be changed during execution.
Thus, due to change in size of pipes during execution, non-availability of land for setting
up of reservoir tank and non-installation of pressure filter, the project targeted to deliver
drinking water to 1,200 households at Namphing and its surrounding areas in South
District by February 2016 had not been completed.
The Department stated (November 2017) that the project was being revised due to
landslide at water source and the change in size of pipes was as per the new alignment. It
further stated that the pressure filters would soon be installed.
RWSS at Chingthang
The Chingthang mega project was sanctioned at an estimated cost of ₹ 7.59 crore. The
civil portion of the work amounting to ₹ 1.97 crore was awarded (February 2014) to a Co-
operative Society and scheduled to be completed within 18 months (August 2015).
Scrutiny revealed (July 2017) that the Department after incurring ₹ 4.77 crore (63 per
cent) could physically complete only 10 per cent of the work. The Department procured
materials viz. Poly Propylene Random (PPR) pipes and fittings (₹ 3.05 crore), storage
tanks (₹ 20.65 lakh) and pressure filters (₹ 78.88 lakh) which were lying in the Store
godowns and on private land/building. Joint physical verification (July 2017) revealed
that the area under the project was very dry and the public were facing acute shortage of
drinking water.
Image 2.3.2
Incomplete reservoir tank at Namphing,
South Sikkim
Audit Report for the year ended 31 March 2017
36
2.3.9.3.2 Water Quality
As per Para 9.3 of the NRDWP guidelines, 20 per cent of the State-wise allocation was to
be utilised for Water Quality component for providing safe drinking water to water
quality affected habitations. States had also been given flexibility to utilise the Coverage
component funds for Water Quality and vice versa.
The Department stated (November 2017) that the State did not have any Water Quality
affected habitation but the basis of the above statement was not substantiated by any
documentary evidence. However, audit analysis revealed that there were some water
quality related issues which are highlighted in the Para 2.3.9.3.6 (f and h).
2.3.9.3.3 Operation and Maintenance
As per Para 9.3 of NRDWP guidelines, funds under O&M were for expenditure on
running and repair costs of drinking water supply projects. Further, State Government
should endeavour to develop sustainable sources of funding for maintenance of RWSS.
Scrutiny of records and physical verification revealed short-utilisation of O&M fund,
non-levy of water charges, diversion of natural calamity funds meant for immediate
repairs and restoration works and other issues relating to O&M. These are discussed in
the following paragraphs:
a) Short-utilisation of O&M fund
As per Para 9.3 of NRDWP guidelines, 15 per cent of the total fund releases under
NRDWP is to be earmarked for O&M component.
As can be seen from Table 2.3.10, against the total available funds of ₹ 19.15 crore
under O&M during 2012-17, the Department spent only ₹ 5.16 crore (27 per cent). The
utilisation of O&M funds ranged between zero and 30 per cent during 2012-17. No
expenditure was incurred on O&M in 2016-17.
Table 2.3.10
O&M funds during 2012-2017
(₹ in crore)
Year Opening
Balance
Release
by GoI
Misc.
receipts
Available
funds Expenditure
Closing
Balance
2012-13 1.13 4.83 0.27 6.23 0.03 (1) 6.20
2013-14 6.20 3.87 0.16 10.23 3.11 (30) 7.12
2014-15 7.12 4.96 0.04 12.13 1.81 (15) 10.31
2015-16 10.31 1.75 0.02 12.08 0.21 (2) 11.87
2016-17 11.87 2.11 0.01 13.99 0 (0) 13.99
Total 17.52 0.50 5.16
Source: Departmental figure; note: Figures in bracket indicate percentage
Thus, despite availability of fund, the Department failed to adequately prioritise repair
and maintenance works of the non-functional projects. This was evident from the
Chapter II: Economic Sector
37
physical verification (June 2017) wherein three10, out of 15 physically verified, water
supply works were lying defunct for want of repairs and maintenance.
b) Water charges
As per Para 14.1 of the Manual of O&M the water charges were to be fixed by the water
agency/GPUs taking into account the ability of the system to meet the expenditure on
O&M. The Department fixed (27 September 2010) water and sanitation charges of
Rupee one per month per household under the GPUs who were responsible for
collecting those charges to fund O&M of rural water supply schemes.
Joint physical verification (May/June 2017) of GPUs covered under this PA revealed
that the recovery mechanism to collect user charges for O&M was not in place as GPUs
had not realised water charges from any of the beneficiaries. This had resulted in non-
realisation of water charges to the tune of ₹ 26.71 lakh11 during 2012-17 which could
have been utilised under O&M for repair and maintenance of various rural water supply
schemes. The fact was further corroborated during beneficiary survey conducted
between May and July 2017 on 600 beneficiaries, that no user charges were collected
and used for operation and maintenance of the water supply schemes.
c) Issues related to Operation and Maintenance
Joint physical verification (May 2017) of RWSS works of GPUs covered under this PA
revealed the following:
As per Para 9.7 of the NRDWP guidelines, the O&M fund were essential to be made
available to PRIs for long term usability of RWSS. The Department transferred only
₹1.7612 crore in 2013-14 and no funds were released to any of the GPUs since 2014-15
despite availability of sufficient funds. Hence, the persons responsible i.e. Bare Foot
Engineers (BFEs) for maintenance of RWSS were not paid wages regularly. Instead the
Department had prioritised Coverage component over the O&M and as against the
available funds of ₹ 19.15 crore during the last five years, the Department spent only
₹ 5.16 crore while the balance was diverted to Coverage component, i.e. augmentation of
RWSS works.
Beneficiary survey in May to July 2017 on 600 beneficiaries also disclosed that none
of them were aware of O&M funds. In the event of any immediate repair, the
beneficiaries themselves repaired the RWSS. Thus, lackadaisical approach by the GPUs
led to beneficiaries bearing financial burden to avail drinking water facilities.
In its reply, the Department stated (November 2017) that the funds from14th Finance
Commission (FC) and 4th State Finance Commission (SFC) were released for
implementing basic services including O&M of RWSS. The reply was not tenable as
10Augmentation of RWSS from Chuba source to Kolbong, South Sikkim 2) Kalimate source to Upper
Rateypani, South Sikkim and 3) Augmentation of RWSS from Hitti source to Karungthang Secondary
School, South Sikkim. 11Calculation was done based on number of households provided with drinking water facilities during
2012-17 @ ₹ one per household per month. 12(@₹ 1 lakh per GPU X 176 GPUs).
Audit Report for the year ended 31 March 2017
38
physical verification (of 15 GPUs) revealed that none of the checked GPUs were released
any fund by the State towards O&M.
d) Natural Calamity Funds released under NRWDP
A major earthquake hit Sikkim on 18 September 2011, which resulted in loss of lives and
damage to public and private properties. In order to provide immediate relief to the
affected populace, the GoI under NRDWP sanctioned ₹ 41.64 crore towards restoration of
various damaged rural water supply schemes. The irregularities on utilisation of Natural
Calamity Fund noticed are given below:
i. As per the records of the Department it was found that the entire fund of ₹ 41.64 crore
received during 2011-12 was utilised by 2014-15. However, scrutiny revealed that the
Department executed 514 works (East-183, West-112, North-60 and South-159) at a
sanctioned cost of ₹ 40.44 crore13 which were completed by 2014-15 incurring an
expenditure of ₹ 35.84 crore. The balance amount of ₹ 5.80 crore was diverted on other
works that were not within the ambit of Natural Calamity Fund.
The Department stated (November 2017) that the funds were utilised in few cases for
augmentation works of rural water supply schemes under coverage which were severely
damaged by the devastating earthquake of September 2011 purely on need basis and
cannot be classified as deviation. The reply of the Department was not acceptable as the
expenditure on augmentation works were not covered under the ambit of natural calamity
funds.
ii. Out of 514 works executed under Natural Calamity Fund at a sanctioned cost of
₹ 40.44 crore, 79 works amounting to ₹ 1.91 crore were diverted to new augmentation
works which were not damaged by the earthquake and hence, not covered under Natural
Calamity Fund.
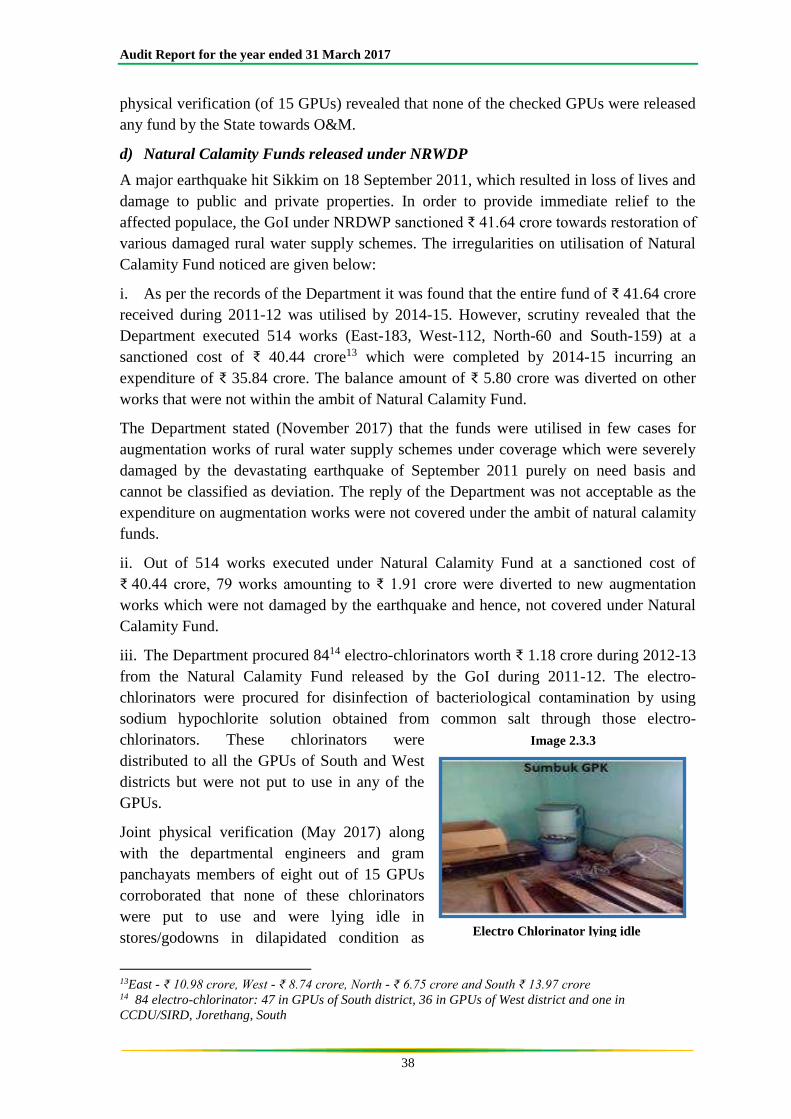
iii. The Department procured 8414 electro-chlorinators worth ₹ 1.18 crore during 2012-13
from the Natural Calamity Fund released by the GoI during 2011-12. The electro-
chlorinators were procured for disinfection of bacteriological contamination by using
sodium hypochlorite solution obtained from common salt through those electro-
chlorinators. These chlorinators were
distributed to all the GPUs of South and West
districts but were not put to use in any of the
GPUs.
Joint physical verification (May 2017) along
with the departmental engineers and gram
panchayats members of eight out of 15 GPUs
corroborated that none of these chlorinators
were put to use and were lying idle in
stores/godowns in dilapidated condition as
13East - ₹ 10.98 crore, West - ₹ 8.74 crore, North - ₹ 6.75 crore and South ₹ 13.97 crore 14 84 electro-chlorinator: 47 in GPUs of South district, 36 in GPUs of West district and one in
CCDU/SIRD, Jorethang, South
Electro Chlorinator lying idle
Image 2.3.3
Chapter II: Economic Sector
39
shown in the photograph. Thus, the expenditure of ₹ 1.18 crore which was diverted from
the Calamity Fund meant for immediate repair and restoration proved wasteful.
The Department while accepting the audit observation stated (November 2017) that the
electro-chlorinators were procured for supplying safe and chlorinated drinking water to
the people in the GPUs. Further, the electro-chlorinator machines would be repaired and
made functional in all the GPUs.
The above observation on operational management revealed that there was absence of
preparedness to absorb the available fund leading to meagre utilisation (27 per cent) and
diversion of O&M fund to other component. This was coupled with non-levy of water
charges (₹ 26.71 lakh) which could have been utilised at village level towards repairs and
maintenance of existing water supply schemes to ensure availability of drinking water
round the year.
2.3.9.3.4 Sustainability
Para 6 of the NRDWP guidelines stipulated to ensure lifeline drinking water security
under all circumstances and at all times. Treatment could be at the delivery point or at the
source but water quality testing could be done at both ends.
Scrutiny of records and physical verification revealed short-utilisation of Sustainability
fund and inoperative Roof Rain Water Harvesting Structures, which are discussed in the
following paragraphs:
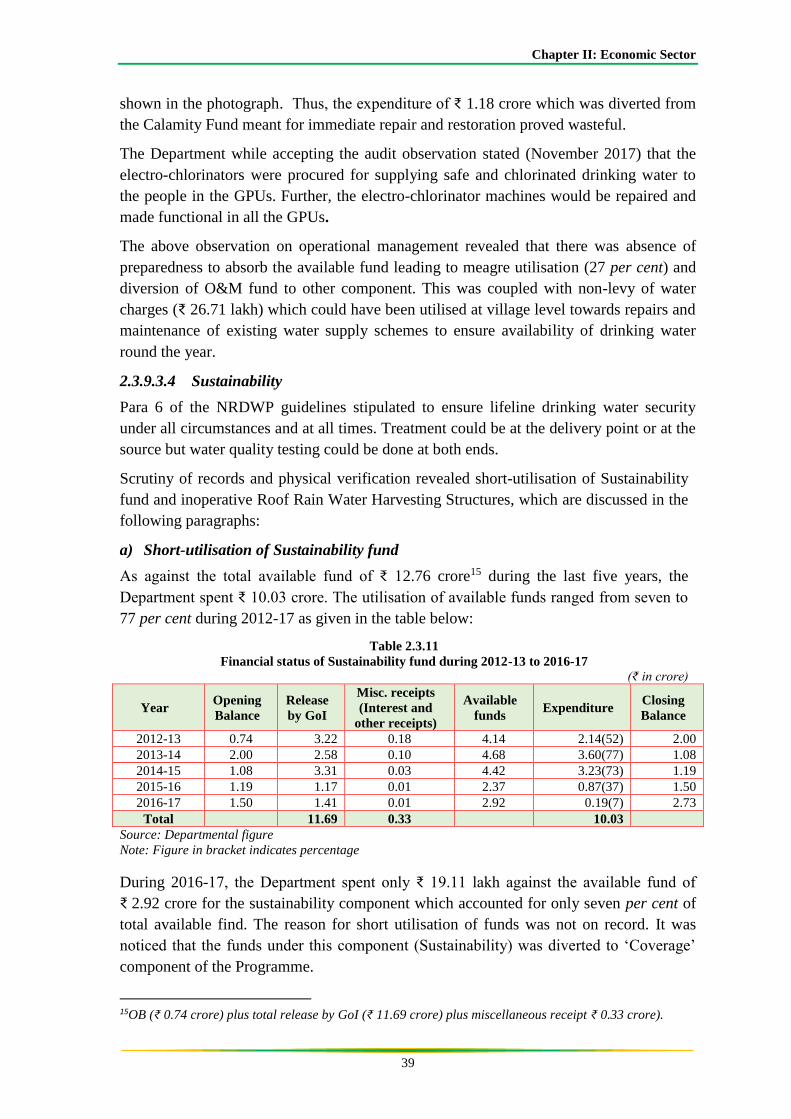
a) Short-utilisation of Sustainability fund
As against the total available fund of ₹ 12.76 crore15 during the last five years, the
Department spent ₹ 10.03 crore. The utilisation of available funds ranged from seven to
77 per cent during 2012-17 as given in the table below:
Table 2.3.11
Financial status of Sustainability fund during 2012-13 to 2016-17
(₹ in crore)
Year Opening
Balance
Release
by GoI
Misc. receipts
(Interest and
other receipts)
Available
funds Expenditure
Closing
Balance
2012-13 0.74 3.22 0.18 4.14 2.14(52) 2.00
2013-14 2.00 2.58 0.10 4.68 3.60(77) 1.08
2014-15 1.08 3.31 0.03 4.42 3.23(73) 1.19
2015-16 1.19 1.17 0.01 2.37 0.87(37) 1.50
2016-17 1.50 1.41 0.01 2.92 0.19(7) 2.73
Total 11.69 0.33 10.03
Source: Departmental figure
Note: Figure in bracket indicates percentage
During 2016-17, the Department spent only ₹ 19.11 lakh against the available fund of
₹ 2.92 crore for the sustainability component which accounted for only seven per cent of
total available find. The reason for short utilisation of funds was not on record. It was
noticed that the funds under this component (Sustainability) was diverted to ‘Coverage’
component of the Programme.
15OB (₹ 0.74 crore) plus total release by GoI (₹ 11.69 crore) plus miscellaneous receipt ₹ 0.33 crore).
Audit Report for the year ended 31 March 2017
40
b) Inoperative Roof Rain Water Harvesting Structures
Under NRDWP (Sustainability), the Department constructed 140 Roof Rain Water
Harvesting Structures (RRWHS) with filter and gutter system at roof top at the cost of
₹ 3.19 crore (₹ 2.28 lakh per unit) across the State. The main objective of the scheme
was to provide safe drinking water to the schools at water scarce and dry areas of the
State. However, joint physical verification (May 2017) of 12 RRWHS under 42 schools
revealed that none of the RRWHS was functioning as no gutter system was fitted with
the roofs of the schools. Further, it was also seen that none of the RRWHT had any type
of filtration system.
The objective of providing safe drinking water to schools in dry and water scarce area
through RRWHS was not fulfilled in respect of the above schools even after spending
₹ 3.19 crore.
The Department stated (November 2017) that the RRWHS, wherever implemented,
would be revisited and all works would be rectified and made functional under O&M,
though the responsibility of maintenance of assets created by the Department lay with the
School Management Committee/GPU as the works were handed over to them after
completion. The Department further stated that henceforth it would regularly monitor the
same and deficiencies observed would be verified for taking appropriate action.
2.3.9.3.5 Support activities
Para 9.3(ii) of the NRDWP guidelines stipulated five per cent of NRDWP funds on a 100
per cent Central share basis to be used for different support activities to enable the rural
communities to have access to assured availability of potable drinking water, use of
advanced technology, viz. satellite data/imagery; GIS mapping; MIS and
computerisation; etc. and other sector support activities, viz. IEC; HRD; MIS;
Computerisation and R&D besides undertaking software support activities on WSSO.
Scrutiny of records and physical verification revealed persistent savings under Support
fund, shortfall in training and discrepancies in MIS figures as discussed in the following
paragraphs:
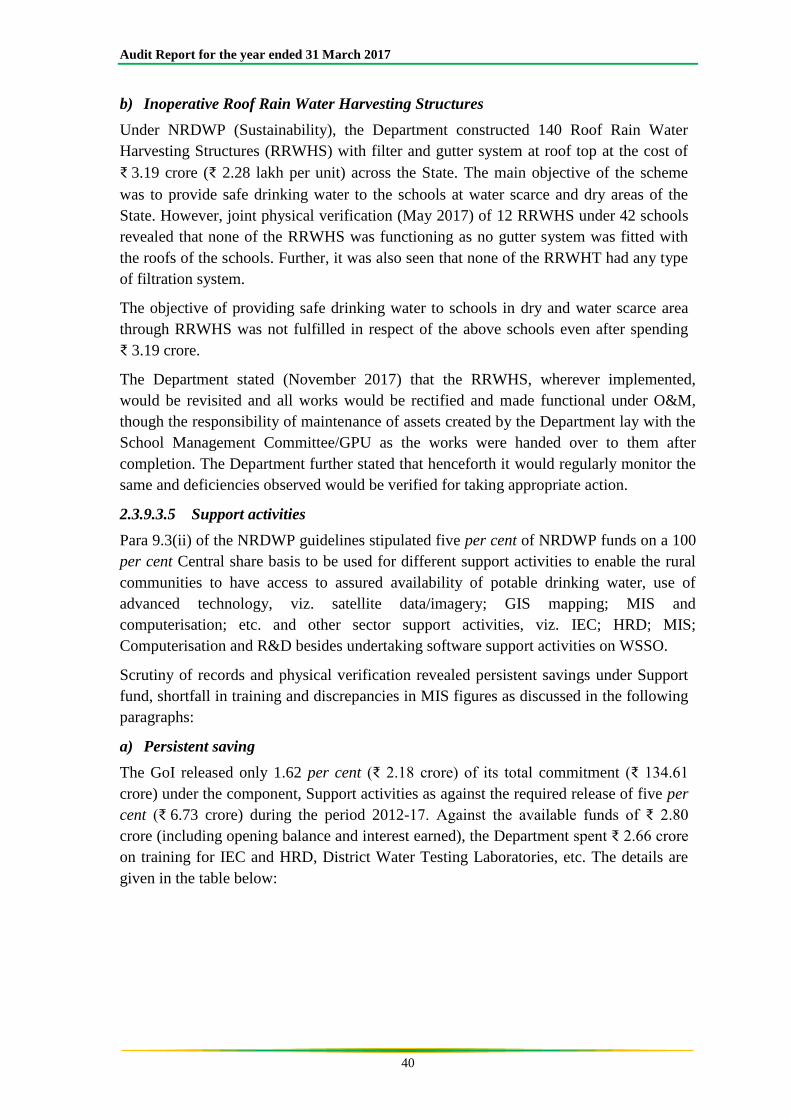
a) Persistent saving
The GoI released only 1.62 per cent (₹ 2.18 crore) of its total commitment (₹ 134.61
crore) under the component, Support activities as against the required release of five per
cent (₹ 6.73 crore) during the period 2012-17. Against the available funds of ₹ 2.80
crore (including opening balance and interest earned), the Department spent ₹ 2.66 crore
on training for IEC and HRD, District Water Testing Laboratories, etc. The details are
given in the table below:
Chapter II: Economic Sector
41
Table 2.3.12
Financial status under support funds during the period 2012-17
(₹ in lakh)
Year Opening
Balance
Release by
GoI
Interest earned
during the year
Available
Funds Expenditure
Closing
Balance
2012-13 52.63 5.09 3.26 60.98 54.43 6.55
2013-14 6.55 86.02 1.43 94.00 71.83 22.17
2014-15 22.17 80.82 1.02 104.01 73.33 30.68
2015-16 30.68 24.08 2.28 57.04 28.37 28.67
2016-17 28.67 21.9 1.66 52.23 37.77 14.46
Total 217.91 9.65 265.73
Source: Departmental figure
Audit scrutiny revealed that there was a short release of support funds by the GoI.
However, the Department did not utilise even the available funds with them and there
were persistent savings in all the five years. The fund could have been utilised in
objectives of this component such as refilling of FTKs, R&D, etc. The reasons for short
release of support funds by the GoI and short-utilisation of available funds by the
Department was not available in the records.
b) Research and Development (R&D)
Para 10.3 of the NRDWP guidelines envisaged that to strengthen the R&D facilities, State
Government was encouraged to establish R&D cells with adequate manpower and
infrastructure. The core objective of this sub component was to strengthen the R&D
facilities and were also to be in link with the Monitoring and Investigation Unit and study
the Monitoring and Evaluation Study Reports for initiating appropriate follow up action.
However, Audit noticed that the Department had not created any R&D cell in the State
and no research and development activity was done during 2012-17.
c) Information, Education and Communication (IEC) and Human Resource
Development (HRD) activities
Para 1 of Annexure IV of the NRDWP guidelines lay great emphasis on use of IEC and
HRD to generate demand and create awareness and participation of the community.
WSSO16 has been designed to support the Engineering Department by taking up software
activities like IEC, HRD, MIS etc. to improve the quality of the implementation in each
State for promoting initiatives in water supply and sanitation sector.
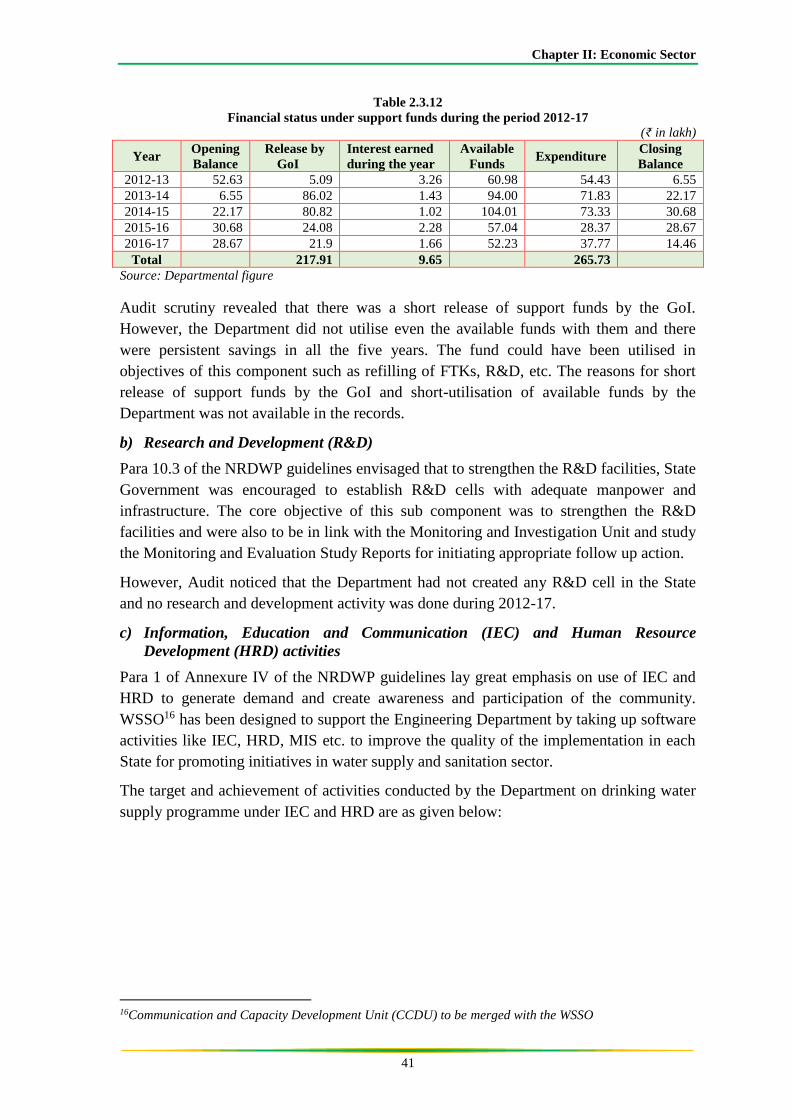
The target and achievement of activities conducted by the Department on drinking water
supply programme under IEC and HRD are as given below:
16Communication and Capacity Development Unit (CCDU) to be merged with the WSSO
Audit Report for the year ended 31 March 2017
42
Table 2.3.13
Target and achievement of activities on drinking water supply programme under IEC and HRD
Year
IEC Activities HRD Activities
No. of
targeted
IEC
activities
No. of IEC
activities
undertaken
No. of
Training
programmes
conducted
No. of persons
required to be trained
(5 persons per GPU)
as per guidelines
No. of
trainees
covered
Shortfall in
achievement
1 2 3 5 4 6
2012-13
Not fixed
32 8 880 654 226
2013-14 2 38 880 2334 Nil
2014-15 6 20 880 980 Nil
2015-16 1 7 880 378 502
2016-17 13 1 880 33 847
Source: Departmental records
From the above table it can be seen that there was shortfall in the number of trainees
covered during the period 2012-13, 2015-16 and 2016-17. During 2013-14, 38 trainings
were conducted covering 2,334 trainees whereas during 2016-17 only one training was
conducted covering merely 33 trainees. The trainings covered handling of electro
chlorinator, handling of FTKs to BFE and preparation of Village Plan to Village
Committees. No trainings and awareness generating IEC activities were ever imparted to
the beneficiaries during the period of PA. Beneficiaries survey (May-July 2017) also
revealed that none of the beneficiaries were ever given training and awareness generating
IEC activities on drinking water.
2.3.9.3.6 Water Quality Monitoring and Surveillance (WQMS)
As per Para 9.3(ii) of the NRDWP, 3 per cent of State allocation was to be provided on a
100 per cent Central funding basis. The guidelines envisaged that the States should
establish/upgrade Water Testing Laboratories at the State, district and sub-district levels
with a provision of testing a few selected chemical and biological parameters. The FTKs
could be used for primary detection of chemical and biological contamination of drinking
water sources in the village with provision for refills and replacement of FTKs with the
fund under WQMS. They were also to authenticate the test results of FTKs used in the
village.
Scrutiny of records and physical verification revealed saving under WQMS fund,
shortfall in water quality test, not refilling of FTKs, idle equipment, undue benefit, non-
establishment of testing labs, non-availability of lab instruments and chemicals, shortage
of manpower and shortfall in water sample testing. The details are discussed in the
following paragraphs:
a) Under Utilisation of funds for WQMS
The financial position under WQMS during performance audit period was as given
below:
Chapter II: Economic Sector
43
Table 2.3.14
Financial position under WQMS during2012-17
(₹ in lakh)
Year Opening Balance Release by
GoI
Total Available
fund Expenditure
Closing
Balance
2012-13 20.38 11.87 32.25 32.25 Nil (0)
2013-14 Nil 55.23 55.23 53.82 1.41 (3)
2014-15 1.41 58.42 59.83 30.67 29.16 (49)
2015-16 29.16 14.45 43.61 11.64 31.97 (73)
2016-17 31.97 13.14 45.11 35.31 9.80 (22)
Total 153.11 163.69
Source: Departmental figure
Note: Figure in bracket indicates percentage
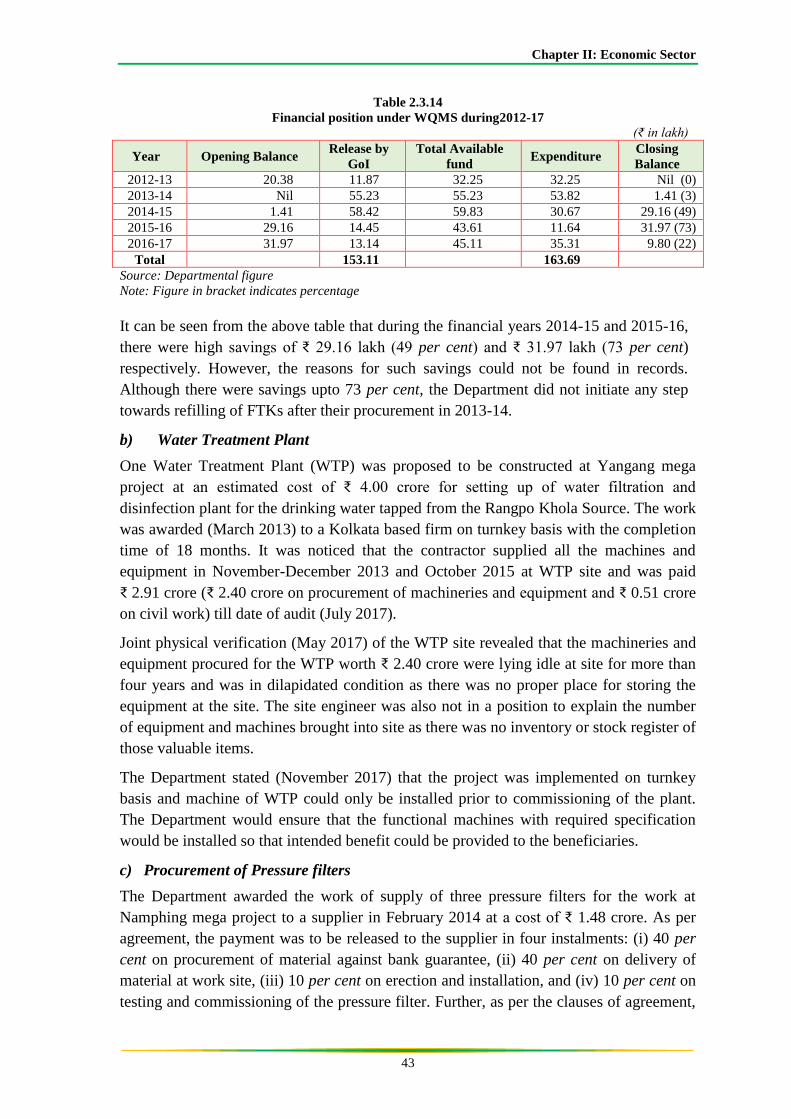
It can be seen from the above table that during the financial years 2014-15 and 2015-16,
there were high savings of ₹ 29.16 lakh (49 per cent) and ₹ 31.97 lakh (73 per cent)
respectively. However, the reasons for such savings could not be found in records.
Although there were savings upto 73 per cent, the Department did not initiate any step
towards refilling of FTKs after their procurement in 2013-14.
b) Water Treatment Plant
One Water Treatment Plant (WTP) was proposed to be constructed at Yangang mega
project at an estimated cost of ₹ 4.00 crore for setting up of water filtration and
disinfection plant for the drinking water tapped from the Rangpo Khola Source. The work
was awarded (March 2013) to a Kolkata based firm on turnkey basis with the completion
time of 18 months. It was noticed that the contractor supplied all the machines and
equipment in November-December 2013 and October 2015 at WTP site and was paid
₹ 2.91 crore (₹ 2.40 crore on procurement of machineries and equipment and ₹ 0.51 crore
on civil work) till date of audit (July 2017).
Joint physical verification (May 2017) of the WTP site revealed that the machineries and
equipment procured for the WTP worth ₹ 2.40 crore were lying idle at site for more than
four years and was in dilapidated condition as there was no proper place for storing the
equipment at the site. The site engineer was also not in a position to explain the number
of equipment and machines brought into site as there was no inventory or stock register of
those valuable items.
The Department stated (November 2017) that the project was implemented on turnkey
basis and machine of WTP could only be installed prior to commissioning of the plant.
The Department would ensure that the functional machines with required specification
would be installed so that intended benefit could be provided to the beneficiaries.
c) Procurement of Pressure filters
The Department awarded the work of supply of three pressure filters for the work at
Namphing mega project to a supplier in February 2014 at a cost of ₹ 1.48 crore. As per
agreement, the payment was to be released to the supplier in four instalments: (i) 40 per
cent on procurement of material against bank guarantee, (ii) 40 per cent on delivery of
material at work site, (iii) 10 per cent on erection and installation, and (iv) 10 per cent on
testing and commissioning of the pressure filter. Further, as per the clauses of agreement,
Audit Report for the year ended 31 March 2017
44
the pressure filters were to be supplied with one year onsite comprehensive warranty from
the date of supply of the pressure filters.
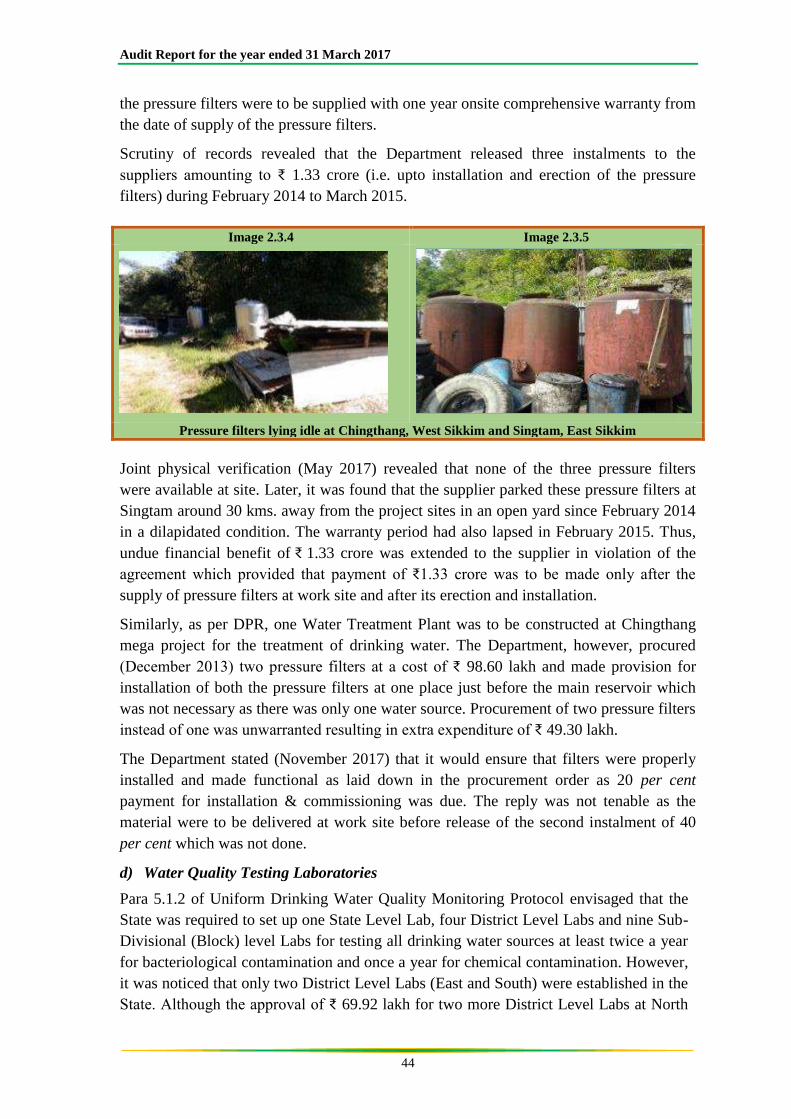
Scrutiny of records revealed that the Department released three instalments to the
suppliers amounting to ₹ 1.33 crore (i.e. upto installation and erection of the pressure
filters) during February 2014 to March 2015.
Image 2.3.4 Image 2.3.5
Pressure filters lying idle at Chingthang, West Sikkim and Singtam, East Sikkim
Joint physical verification (May 2017) revealed that none of the three pressure filters
were available at site. Later, it was found that the supplier parked these pressure filters at
Singtam around 30 kms. away from the project sites in an open yard since February 2014
in a dilapidated condition. The warranty period had also lapsed in February 2015. Thus,
undue financial benefit of ₹ 1.33 crore was extended to the supplier in violation of the
agreement which provided that payment of ₹1.33 crore was to be made only after the
supply of pressure filters at work site and after its erection and installation.
Similarly, as per DPR, one Water Treatment Plant was to be constructed at Chingthang
mega project for the treatment of drinking water. The Department, however, procured
(December 2013) two pressure filters at a cost of ₹ 98.60 lakh and made provision for
installation of both the pressure filters at one place just before the main reservoir which
was not necessary as there was only one water source. Procurement of two pressure filters
instead of one was unwarranted resulting in extra expenditure of ₹ 49.30 lakh.
The Department stated (November 2017) that it would ensure that filters were properly
installed and made functional as laid down in the procurement order as 20 per cent
payment for installation & commissioning was due. The reply was not tenable as the
material were to be delivered at work site before release of the second instalment of 40
per cent which was not done.
d) Water Quality Testing Laboratories
Para 5.1.2 of Uniform Drinking Water Quality Monitoring Protocol envisaged that the
State was required to set up one State Level Lab, four District Level Labs and nine Sub-
Divisional (Block) level Labs for testing all drinking water sources at least twice a year
for bacteriological contamination and once a year for chemical contamination. However,
it was noticed that only two District Level Labs (East and South) were established in the
State. Although the approval of ₹ 69.92 lakh for two more District Level Labs at North
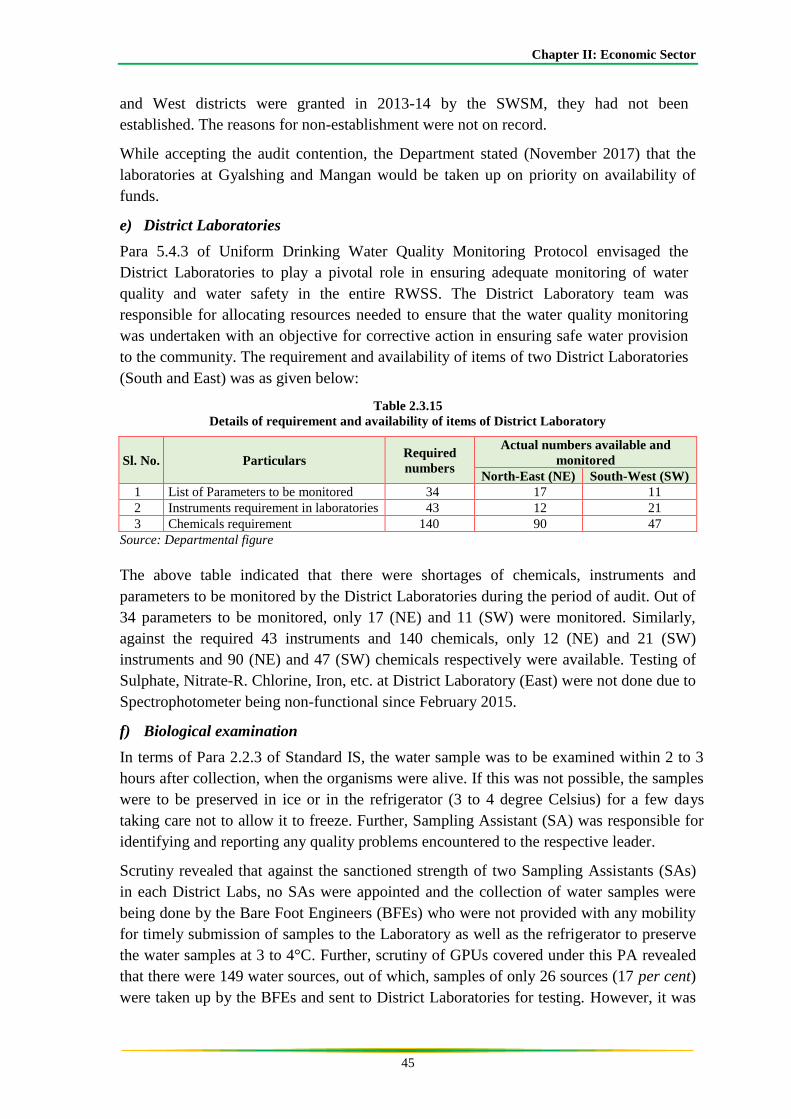
Chapter II: Economic Sector
45
and West districts were granted in 2013-14 by the SWSM, they had not been
established. The reasons for non-establishment were not on record.
While accepting the audit contention, the Department stated (November 2017) that the
laboratories at Gyalshing and Mangan would be taken up on priority on availability of
funds.
e) District Laboratories
Para 5.4.3 of Uniform Drinking Water Quality Monitoring Protocol envisaged the
District Laboratories to play a pivotal role in ensuring adequate monitoring of water
quality and water safety in the entire RWSS. The District Laboratory team was
responsible for allocating resources needed to ensure that the water quality monitoring
was undertaken with an objective for corrective action in ensuring safe water provision
to the community. The requirement and availability of items of two District Laboratories
(South and East) was as given below:
Table 2.3.15
Details of requirement and availability of items of District Laboratory
Sl. No. Particulars Required
numbers
Actual numbers available and
monitored
North-East (NE) South-West (SW)
1 List of Parameters to be monitored 34 17 11
2 Instruments requirement in laboratories 43 12 21
3 Chemicals requirement 140 90 47
Source: Departmental figure
The above table indicated that there were shortages of chemicals, instruments and
parameters to be monitored by the District Laboratories during the period of audit. Out of
34 parameters to be monitored, only 17 (NE) and 11 (SW) were monitored. Similarly,
against the required 43 instruments and 140 chemicals, only 12 (NE) and 21 (SW)
instruments and 90 (NE) and 47 (SW) chemicals respectively were available. Testing of
Sulphate, Nitrate-R. Chlorine, Iron, etc. at District Laboratory (East) were not done due to
Spectrophotometer being non-functional since February 2015.
f) Biological examination
In terms of Para 2.2.3 of Standard IS, the water sample was to be examined within 2 to 3
hours after collection, when the organisms were alive. If this was not possible, the samples
were to be preserved in ice or in the refrigerator (3 to 4 degree Celsius) for a few days
taking care not to allow it to freeze. Further, Sampling Assistant (SA) was responsible for
identifying and reporting any quality problems encountered to the respective leader.
Scrutiny revealed that against the sanctioned strength of two Sampling Assistants (SAs)
in each District Labs, no SAs were appointed and the collection of water samples were
being done by the Bare Foot Engineers (BFEs) who were not provided with any mobility
for timely submission of samples to the Laboratory as well as the refrigerator to preserve
the water samples at 3 to 4°C. Further, scrutiny of GPUs covered under this PA revealed
that there were 149 water sources, out of which, samples of only 26 sources (17 per cent)
were taken up by the BFEs and sent to District Laboratories for testing. However, it was
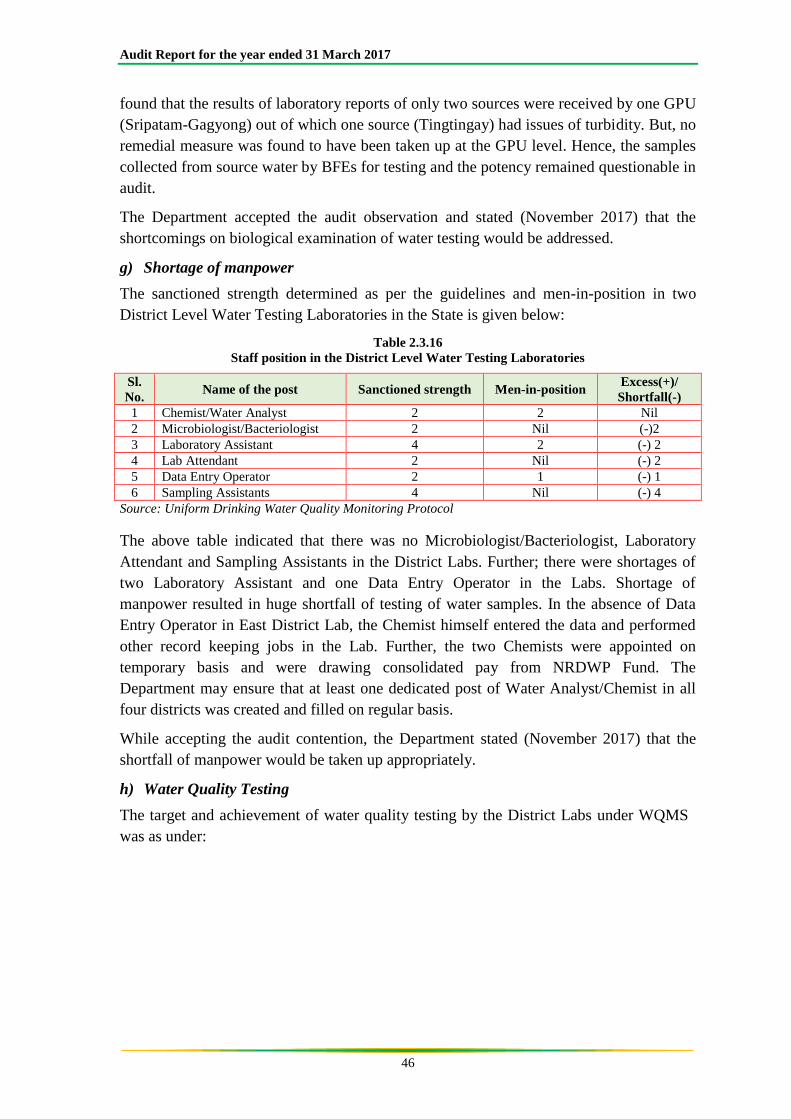
Audit Report for the year ended 31 March 2017
46
found that the results of laboratory reports of only two sources were received by one GPU
(Sripatam-Gagyong) out of which one source (Tingtingay) had issues of turbidity. But, no
remedial measure was found to have been taken up at the GPU level. Hence, the samples
collected from source water by BFEs for testing and the potency remained questionable in
audit.
The Department accepted the audit observation and stated (November 2017) that the
shortcomings on biological examination of water testing would be addressed.
g) Shortage of manpower
The sanctioned strength determined as per the guidelines and men-in-position in two
District Level Water Testing Laboratories in the State is given below:
Table 2.3.16
Staff position in the District Level Water Testing Laboratories
Sl.
No. Name of the post Sanctioned strength Men-in-position
Excess(+)/
Shortfall(-)
1 Chemist/Water Analyst 2 2 Nil
2 Microbiologist/Bacteriologist 2 Nil (-)2
3 Laboratory Assistant 4 2 (-) 2
4 Lab Attendant 2 Nil (-) 2
5 Data Entry Operator 2 1 (-) 1
6 Sampling Assistants 4 Nil (-) 4
Source: Uniform Drinking Water Quality Monitoring Protocol
The above table indicated that there was no Microbiologist/Bacteriologist, Laboratory
Attendant and Sampling Assistants in the District Labs. Further; there were shortages of
two Laboratory Assistant and one Data Entry Operator in the Labs. Shortage of
manpower resulted in huge shortfall of testing of water samples. In the absence of Data
Entry Operator in East District Lab, the Chemist himself entered the data and performed
other record keeping jobs in the Lab. Further, the two Chemists were appointed on
temporary basis and were drawing consolidated pay from NRDWP Fund. The
Department may ensure that at least one dedicated post of Water Analyst/Chemist in all
four districts was created and filled on regular basis.
While accepting the audit contention, the Department stated (November 2017) that the
shortfall of manpower would be taken up appropriately.
h) Water Quality Testing
The target and achievement of water quality testing by the District Labs under WQMS
was as under:
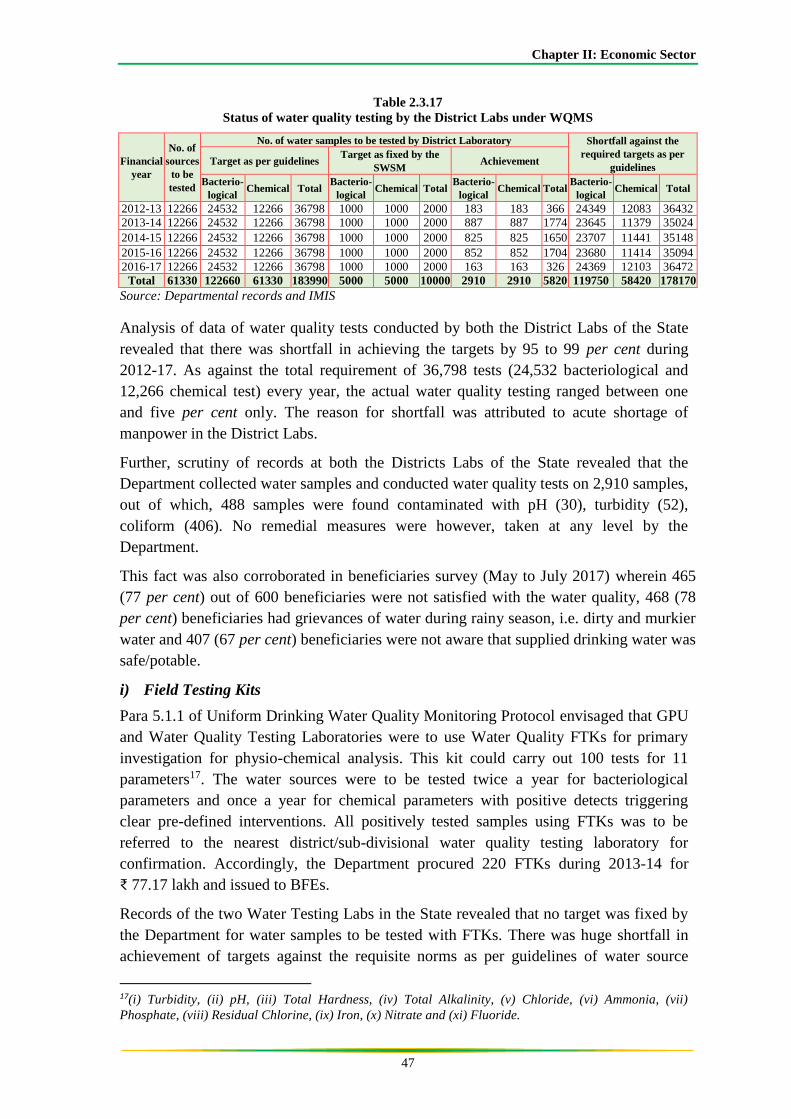
Chapter II: Economic Sector
47
Table 2.3.17
Status of water quality testing by the District Labs under WQMS
Financial
year
No. of
sources
to be
tested
No. of water samples to be tested by District Laboratory Shortfall against the
required targets as per
guidelines Target as per guidelines
Target as fixed by the
SWSM Achievement
Bacterio-
logical Chemical Total
Bacterio-
logical Chemical Total
Bacterio-
logical Chemical Total
Bacterio-
logical Chemical Total
2012-13 12266 24532 12266 36798 1000 1000 2000 183 183 366 24349 12083 36432
2013-14 12266 24532 12266 36798 1000 1000 2000 887 887 1774 23645 11379 35024
2014-15 12266 24532 12266 36798 1000 1000 2000 825 825 1650 23707 11441 35148
2015-16 12266 24532 12266 36798 1000 1000 2000 852 852 1704 23680 11414 35094
2016-17 12266 24532 12266 36798 1000 1000 2000 163 163 326 24369 12103 36472
Total 61330 122660 61330 183990 5000 5000 10000 2910 2910 5820 119750 58420 178170
Source: Departmental records and IMIS
Analysis of data of water quality tests conducted by both the District Labs of the State
revealed that there was shortfall in achieving the targets by 95 to 99 per cent during
2012-17. As against the total requirement of 36,798 tests (24,532 bacteriological and
12,266 chemical test) every year, the actual water quality testing ranged between one
and five per cent only. The reason for shortfall was attributed to acute shortage of
manpower in the District Labs.
Further, scrutiny of records at both the Districts Labs of the State revealed that the
Department collected water samples and conducted water quality tests on 2,910 samples,
out of which, 488 samples were found contaminated with pH (30), turbidity (52),
coliform (406). No remedial measures were however, taken at any level by the
Department.
This fact was also corroborated in beneficiaries survey (May to July 2017) wherein 465
(77 per cent) out of 600 beneficiaries were not satisfied with the water quality, 468 (78
per cent) beneficiaries had grievances of water during rainy season, i.e. dirty and murkier
water and 407 (67 per cent) beneficiaries were not aware that supplied drinking water was
safe/potable.
i) Field Testing Kits
Para 5.1.1 of Uniform Drinking Water Quality Monitoring Protocol envisaged that GPU
and Water Quality Testing Laboratories were to use Water Quality FTKs for primary
investigation for physio-chemical analysis. This kit could carry out 100 tests for 11
parameters17. The water sources were to be tested twice a year for bacteriological
parameters and once a year for chemical parameters with positive detects triggering
clear pre-defined interventions. All positively tested samples using FTKs was to be
referred to the nearest district/sub-divisional water quality testing laboratory for
confirmation. Accordingly, the Department procured 220 FTKs during 2013-14 for
₹ 77.17 lakh and issued to BFEs.
Records of the two Water Testing Labs in the State revealed that no target was fixed by
the Department for water samples to be tested with FTKs. There was huge shortfall in
achievement of targets against the requisite norms as per guidelines of water source
17(i) Turbidity, (ii) pH, (iii) Total Hardness, (iv) Total Alkalinity, (v) Chloride, (vi) Ammonia, (vii)
Phosphate, (viii) Residual Chlorine, (ix) Iron, (x) Nitrate and (xi) Fluoride.
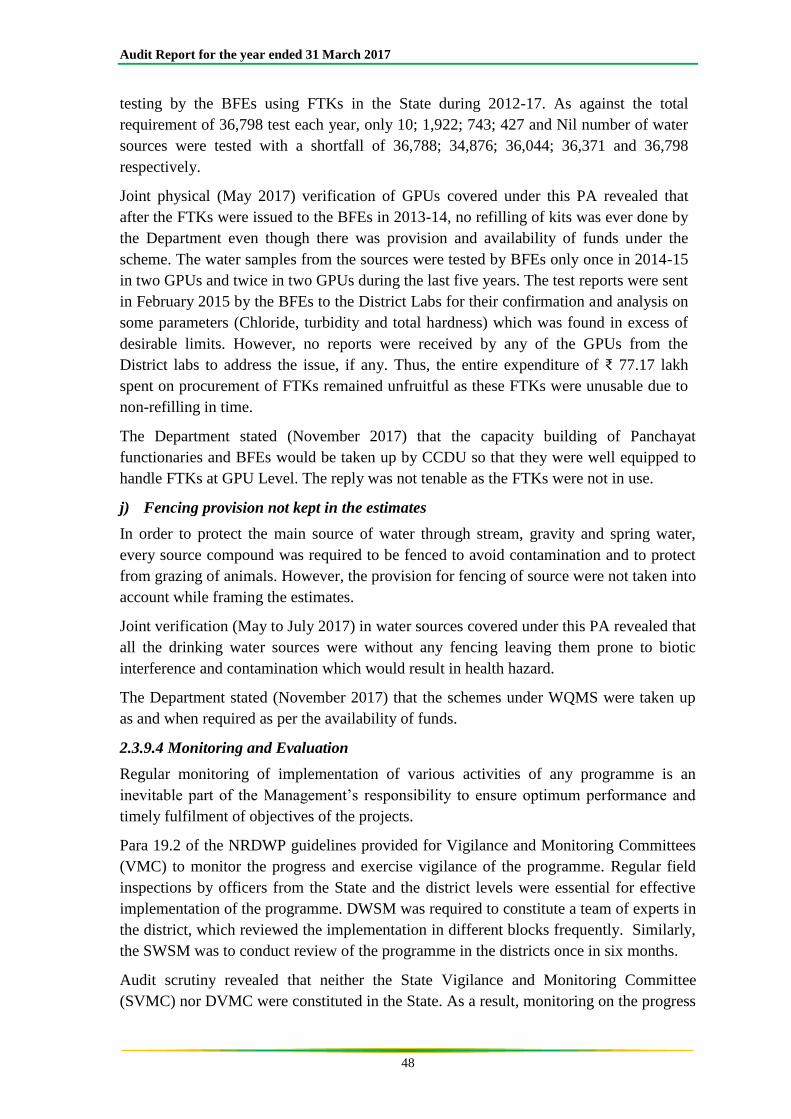
Audit Report for the year ended 31 March 2017
48
testing by the BFEs using FTKs in the State during 2012-17. As against the total
requirement of 36,798 test each year, only 10; 1,922; 743; 427 and Nil number of water
sources were tested with a shortfall of 36,788; 34,876; 36,044; 36,371 and 36,798
respectively.
Joint physical (May 2017) verification of GPUs covered under this PA revealed that
after the FTKs were issued to the BFEs in 2013-14, no refilling of kits was ever done by
the Department even though there was provision and availability of funds under the
scheme. The water samples from the sources were tested by BFEs only once in 2014-15
in two GPUs and twice in two GPUs during the last five years. The test reports were sent
in February 2015 by the BFEs to the District Labs for their confirmation and analysis on
some parameters (Chloride, turbidity and total hardness) which was found in excess of
desirable limits. However, no reports were received by any of the GPUs from the
District labs to address the issue, if any. Thus, the entire expenditure of ₹ 77.17 lakh
spent on procurement of FTKs remained unfruitful as these FTKs were unusable due to
non-refilling in time.
The Department stated (November 2017) that the capacity building of Panchayat
functionaries and BFEs would be taken up by CCDU so that they were well equipped to
handle FTKs at GPU Level. The reply was not tenable as the FTKs were not in use.
j) Fencing provision not kept in the estimates
In order to protect the main source of water through stream, gravity and spring water,
every source compound was required to be fenced to avoid contamination and to protect
from grazing of animals. However, the provision for fencing of source were not taken into
account while framing the estimates.
Joint verification (May to July 2017) in water sources covered under this PA revealed that
all the drinking water sources were without any fencing leaving them prone to biotic
interference and contamination which would result in health hazard.
The Department stated (November 2017) that the schemes under WQMS were taken up
as and when required as per the availability of funds.
2.3.9.4 Monitoring and Evaluation
Regular monitoring of implementation of various activities of any programme is an
inevitable part of the Management’s responsibility to ensure optimum performance and
timely fulfilment of objectives of the projects.
Para 19.2 of the NRDWP guidelines provided for Vigilance and Monitoring Committees
(VMC) to monitor the progress and exercise vigilance of the programme. Regular field
inspections by officers from the State and the district levels were essential for effective
implementation of the programme. DWSM was required to constitute a team of experts in
the district, which reviewed the implementation in different blocks frequently. Similarly,
the SWSM was to conduct review of the programme in the districts once in six months.
Audit scrutiny revealed that neither the State Vigilance and Monitoring Committee
(SVMC) nor DVMC were constituted in the State. As a result, monitoring on the progress
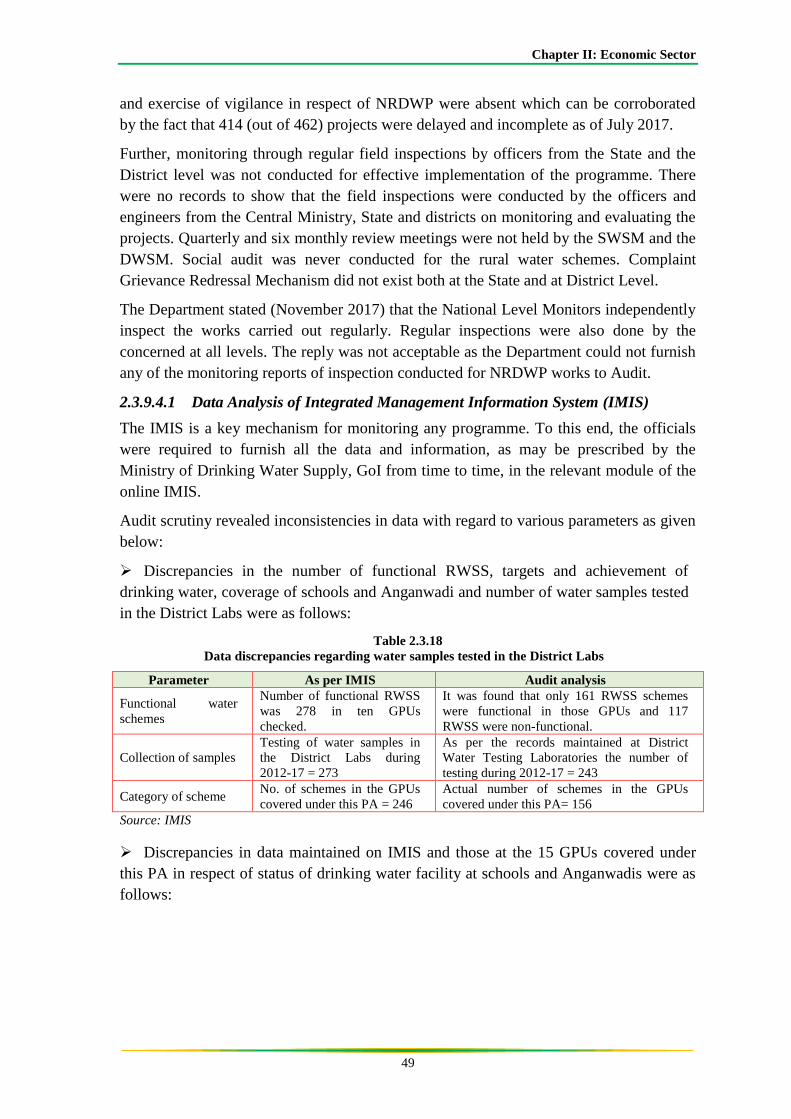
Chapter II: Economic Sector
49
and exercise of vigilance in respect of NRDWP were absent which can be corroborated
by the fact that 414 (out of 462) projects were delayed and incomplete as of July 2017.
Further, monitoring through regular field inspections by officers from the State and the
District level was not conducted for effective implementation of the programme. There
were no records to show that the field inspections were conducted by the officers and
engineers from the Central Ministry, State and districts on monitoring and evaluating the
projects. Quarterly and six monthly review meetings were not held by the SWSM and the
DWSM. Social audit was never conducted for the rural water schemes. Complaint
Grievance Redressal Mechanism did not exist both at the State and at District Level.
The Department stated (November 2017) that the National Level Monitors independently
inspect the works carried out regularly. Regular inspections were also done by the
concerned at all levels. The reply was not acceptable as the Department could not furnish
any of the monitoring reports of inspection conducted for NRDWP works to Audit.
2.3.9.4.1 Data Analysis of Integrated Management Information System (IMIS)
The IMIS is a key mechanism for monitoring any programme. To this end, the officials
were required to furnish all the data and information, as may be prescribed by the
Ministry of Drinking Water Supply, GoI from time to time, in the relevant module of the
online IMIS.
Audit scrutiny revealed inconsistencies in data with regard to various parameters as given
below:
Discrepancies in the number of functional RWSS, targets and achievement of
drinking water, coverage of schools and Anganwadi and number of water samples tested
in the District Labs were as follows:
Table 2.3.18
Data discrepancies regarding water samples tested in the District Labs
Parameter As per IMIS Audit analysis
Functional water
schemes
Number of functional RWSS
was 278 in ten GPUs
checked.
It was found that only 161 RWSS schemes
were functional in those GPUs and 117
RWSS were non-functional.
Collection of samples
Testing of water samples in
the District Labs during
2012-17 = 273
As per the records maintained at District
Water Testing Laboratories the number of
testing during 2012-17 = 243
Category of scheme No. of schemes in the GPUs
covered under this PA = 246
Actual number of schemes in the GPUs
covered under this PA= 156
Source: IMIS
Discrepancies in data maintained on IMIS and those at the 15 GPUs covered under
this PA in respect of status of drinking water facility at schools and Anganwadis were as
follows:
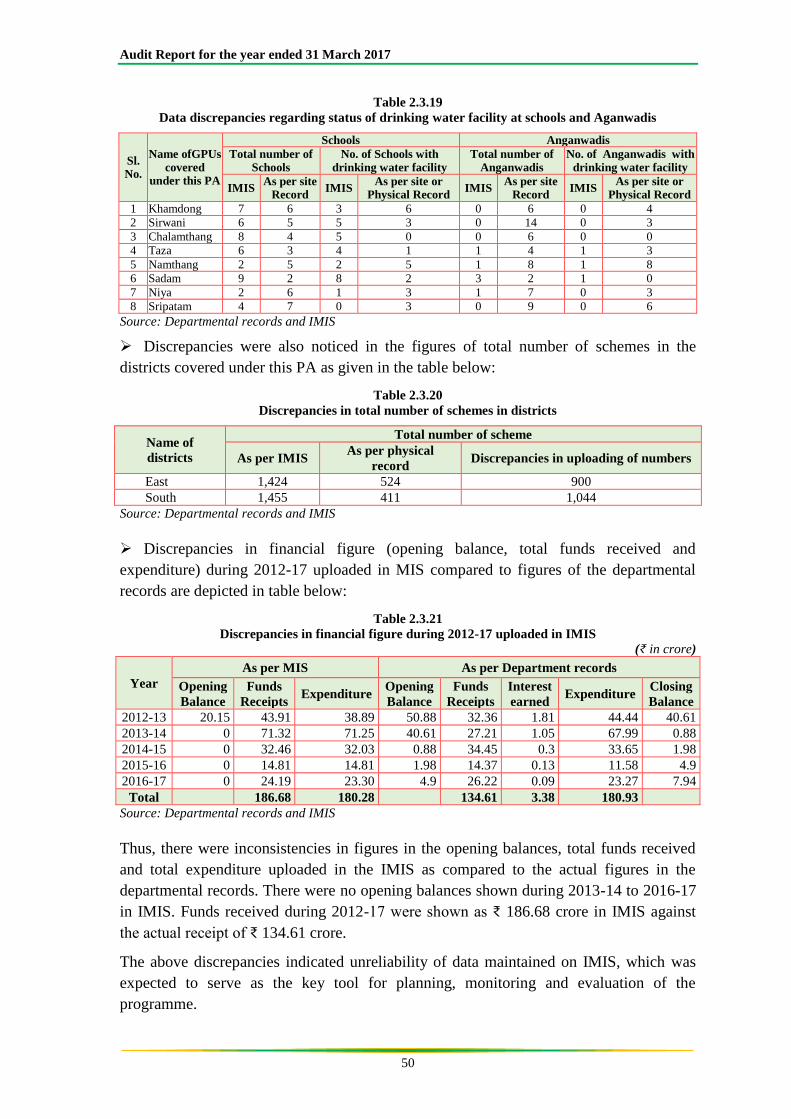
Audit Report for the year ended 31 March 2017
50
Table 2.3.19
Data discrepancies regarding status of drinking water facility at schools and Aganwadis
Sl. No.
Name ofGPUs
covered under this PA
Schools Anganwadis
Total number of
Schools
No. of Schools with
drinking water facility
Total number of
Anganwadis
No. of Anganwadis with
drinking water facility
IMIS As per site
Record IMIS
As per site or Physical Record
IMIS As per site
Record IMIS
As per site or Physical Record
1 Khamdong 7 6 3 6 0 6 0 4
2 Sirwani 6 5 5 3 0 14 0 3
3 Chalamthang 8 4 5 0 0 6 0 0
4 Taza 6 3 4 1 1 4 1 3
5 Namthang 2 5 2 5 1 8 1 8
6 Sadam 9 2 8 2 3 2 1 0
7 Niya 2 6 1 3 1 7 0 3
8 Sripatam 4 7 0 3 0 9 0 6
Source: Departmental records and IMIS
Discrepancies were also noticed in the figures of total number of schemes in the
districts covered under this PA as given in the table below:
Table 2.3.20
Discrepancies in total number of schemes in districts
Name of
districts
Total number of scheme
As per IMIS As per physical
record Discrepancies in uploading of numbers
East 1,424 524 900
South 1,455 411 1,044
Source: Departmental records and IMIS
Discrepancies in financial figure (opening balance, total funds received and
expenditure) during 2012-17 uploaded in MIS compared to figures of the departmental
records are depicted in table below:
Table 2.3.21
Discrepancies in financial figure during 2012-17 uploaded in IMIS
(₹ in crore)
Year
As per MIS As per Department records
Opening
Balance
Funds
Receipts Expenditure
Opening
Balance
Funds
Receipts
Interest
earned Expenditure
Closing
Balance
2012-13 20.15 43.91 38.89 50.88 32.36 1.81 44.44 40.61
2013-14 0 71.32 71.25 40.61 27.21 1.05 67.99 0.88
2014-15 0 32.46 32.03 0.88 34.45 0.3 33.65 1.98
2015-16 0 14.81 14.81 1.98 14.37 0.13 11.58 4.9
2016-17 0 24.19 23.30 4.9 26.22 0.09 23.27 7.94
Total 186.68 180.28 134.61 3.38 180.93
Source: Departmental records and IMIS
Thus, there were inconsistencies in figures in the opening balances, total funds received
and total expenditure uploaded in the IMIS as compared to the actual figures in the
departmental records. There were no opening balances shown during 2013-14 to 2016-17
in IMIS. Funds received during 2012-17 were shown as ₹ 186.68 crore in IMIS against
the actual receipt of ₹ 134.61 crore.
The above discrepancies indicated unreliability of data maintained on IMIS, which was
expected to serve as the key tool for planning, monitoring and evaluation of the
programme.
Chapter II: Economic Sector
51
While accepting the fact, the Department stated (November 2017) that the data gap as per
actual and IMIS was being reconciled in consultation with the concerned section of the
Ministry of Drinking Water & Sanitation.
2.3.10 Conclusion
Implementation of the National Rural Drinking Water Programme in Sikkim was riddled
with deficiencies in planning, programme execution and monitoring. The Five-year
comprehensive plan was not prepared which resulted in water supply schemes being
taken up without an integrated approach. The Department failed to constitute the Source
Finding Committee. As of March 2017, the Department was able to cover only 737
habitations out of 2084 habitations as Fully Covered (40 lpcd, though the target for Fully
Covered habitation was 55 lpcd by March 2017) while the remaining 1,347 habitations
(65 per cent) had not been covered even after the implementation of revised scheme in
2009. There were instances of short-release of State share and delay in release of funds
by State to State Water and Sanitation Mission. Out of 462 RWSS projects in the State,
105 projects had not been completed recording delay between three and four years
beyond the stipulated date of completion. Programme implementation had been
characterised with non-commencement of work, abandonment of work, tapping of water
from non-perennial source, lack of co-ordination with other departments, etc. This was
mainly due to ineffective monitoring and evaluation of physical and financial
performance and management of the water supply by the SWSM. The water quality
monitoring and testing for detection of chemicals and bacteriological contamination was
only one to five per cent in a year. Discrepancies between data in the IMIS and that
maintained by the implementing agencies undermined the reliability of the system as a
viable tool for monitoring.
2.3.11 Recommendations
The Department may consider the following recommendations:
Strengthening of institutional set up for effective coordination, implementation and
monitoring of the schemes taken up under National Rural Drinking Water
Programme;
Constituting the Source Finding Committee to ascertain the perennial water source;
Ensuring timely submission of Annual Action Plans as well as the Utilisation
Certificates and timely release of State’s matching share;
Ensuring timely completion of the projects;
Ensuring integrity of data maintained in the Integrated Management Information
System for effective monitoring of programme at various levels.
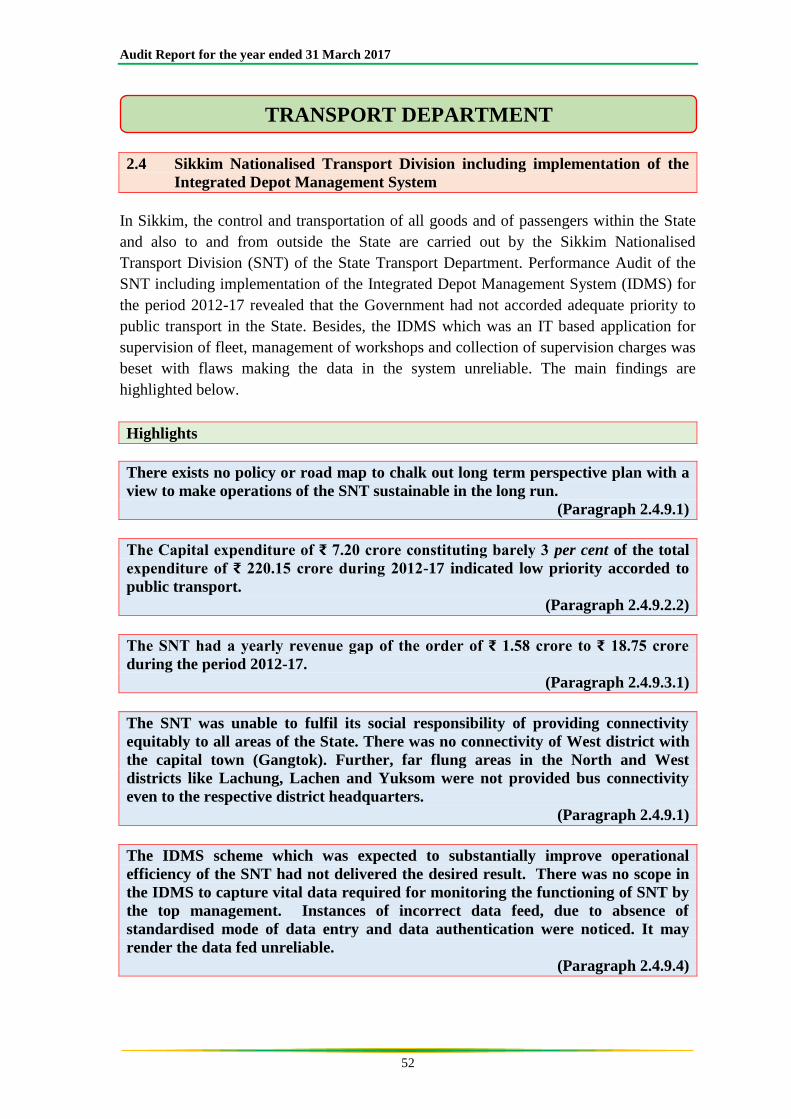
Audit Report for the year ended 31 March 2017
52
2.4 Sikkim Nationalised Transport Division including implementation of the
Integrated Depot Management System
In Sikkim, the control and transportation of all goods and of passengers within the State
and also to and from outside the State are carried out by the Sikkim Nationalised
Transport Division (SNT) of the State Transport Department. Performance Audit of the
SNT including implementation of the Integrated Depot Management System (IDMS) for
the period 2012-17 revealed that the Government had not accorded adequate priority to
public transport in the State. Besides, the IDMS which was an IT based application for
supervision of fleet, management of workshops and collection of supervision charges was
beset with flaws making the data in the system unreliable. The main findings are
highlighted below.
Highlights
There exists no policy or road map to chalk out long term perspective plan with a
view to make operations of the SNT sustainable in the long run.
(Paragraph 2.4.9.1)
The Capital expenditure of ₹ 7.20 crore constituting barely 3 per cent of the total
expenditure of ₹ 220.15 crore during 2012-17 indicated low priority accorded to
public transport.
(Paragraph 2.4.9.2.2)
The SNT had a yearly revenue gap of the order of ₹ 1.58 crore to ₹ 18.75 crore
during the period 2012-17.
(Paragraph 2.4.9.3.1)
The SNT was unable to fulfil its social responsibility of providing connectivity
equitably to all areas of the State. There was no connectivity of West district with
the capital town (Gangtok). Further, far flung areas in the North and West
districts like Lachung, Lachen and Yuksom were not provided bus connectivity
even to the respective district headquarters.
(Paragraph 2.4.9.1)
The IDMS scheme which was expected to substantially improve operational
efficiency of the SNT had not delivered the desired result. There was no scope in
the IDMS to capture vital data required for monitoring the functioning of SNT by
the top management. Instances of incorrect data feed, due to absence of
standardised mode of data entry and data authentication were noticed. It may
render the data fed unreliable.
(Paragraph 2.4.9.4)
TRANSPORT DEPARTMENT
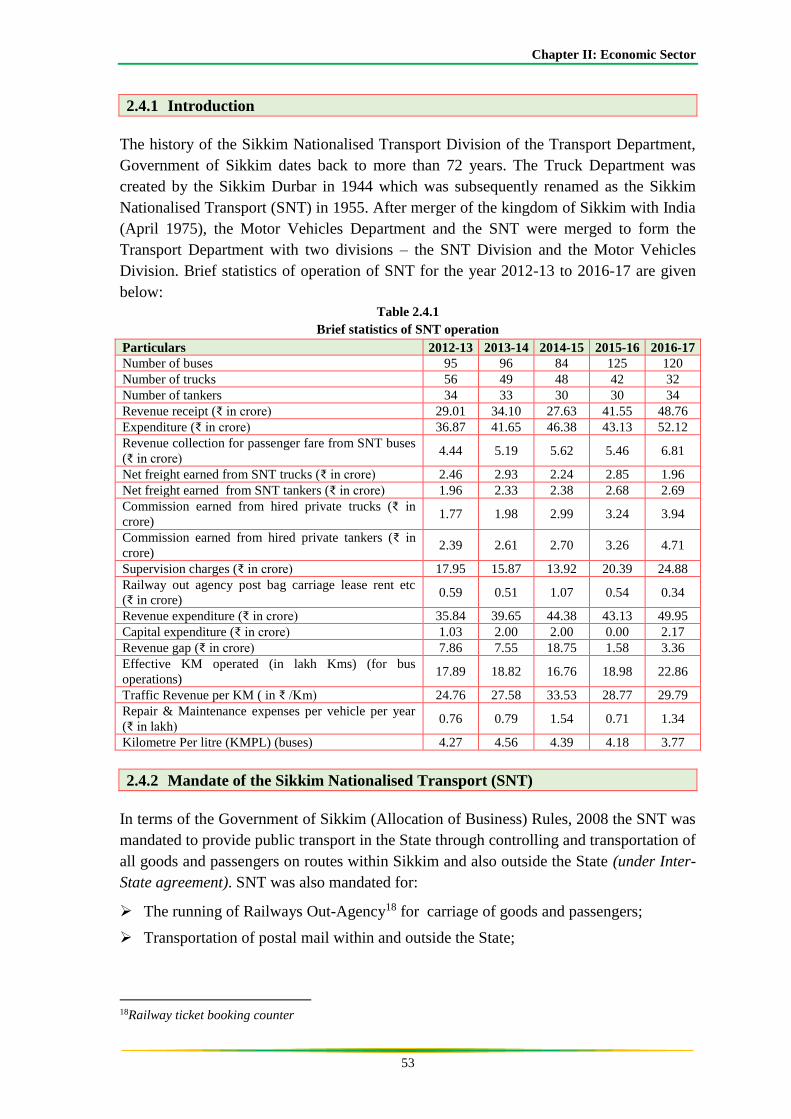
Chapter II: Economic Sector
53
2.4.1 Introduction
The history of the Sikkim Nationalised Transport Division of the Transport Department,
Government of Sikkim dates back to more than 72 years. The Truck Department was
created by the Sikkim Durbar in 1944 which was subsequently renamed as the Sikkim
Nationalised Transport (SNT) in 1955. After merger of the kingdom of Sikkim with India
(April 1975), the Motor Vehicles Department and the SNT were merged to form the
Transport Department with two divisions – the SNT Division and the Motor Vehicles
Division. Brief statistics of operation of SNT for the year 2012-13 to 2016-17 are given
below:
Table 2.4.1
Brief statistics of SNT operation
Particulars 2012-13 2013-14 2014-15 2015-16 2016-17
Number of buses 95 96 84 125 120
Number of trucks 56 49 48 42 32
Number of tankers 34 33 30 30 34
Revenue receipt (₹ in crore) 29.01 34.10 27.63 41.55 48.76
Expenditure (₹ in crore) 36.87 41.65 46.38 43.13 52.12
Revenue collection for passenger fare from SNT buses
(₹ in crore) 4.44 5.19 5.62 5.46 6.81
Net freight earned from SNT trucks (₹ in crore) 2.46 2.93 2.24 2.85 1.96
Net freight earned from SNT tankers (₹ in crore) 1.96 2.33 2.38 2.68 2.69
Commission earned from hired private trucks (₹ in
crore) 1.77 1.98 2.99 3.24 3.94
Commission earned from hired private tankers (₹ in
crore) 2.39 2.61 2.70 3.26 4.71
Supervision charges (₹ in crore) 17.95 15.87 13.92 20.39 24.88
Railway out agency post bag carriage lease rent etc
(₹ in crore) 0.59 0.51 1.07 0.54 0.34
Revenue expenditure (₹ in crore) 35.84 39.65 44.38 43.13 49.95
Capital expenditure (₹ in crore) 1.03 2.00 2.00 0.00 2.17
Revenue gap (₹ in crore) 7.86 7.55 18.75 1.58 3.36
Effective KM operated (in lakh Kms) (for bus
operations) 17.89 18.82 16.76 18.98 22.86
Traffic Revenue per KM ( in ₹ /Km) 24.76 27.58 33.53 28.77 29.79
Repair & Maintenance expenses per vehicle per year
(₹ in lakh) 0.76 0.79 1.54 0.71 1.34
Kilometre Per litre (KMPL) (buses) 4.27 4.56 4.39 4.18 3.77
2.4.2 Mandate of the Sikkim Nationalised Transport (SNT)
In terms of the Government of Sikkim (Allocation of Business) Rules, 2008 the SNT was
mandated to provide public transport in the State through controlling and transportation of
all goods and passengers on routes within Sikkim and also outside the State (under Inter-
State agreement). SNT was also mandated for:
The running of Railways Out-Agency18 for carriage of goods and passengers;
Transportation of postal mail within and outside the State;
18Railway ticket booking counter
Audit Report for the year ended 31 March 2017
54
Fixation of tariffs19, purchase of Government vehicles, accessories and spare parts
from manufacturers and authorised dealers;
Running of workshop for repair and maintenance of departmental fleet of SNT;
Running of Car Workshop for repairs of Government vehicles;
Supply of petrol, oil and lubricants to Government vehicles; and,
Maintenance of stores20 for SNT fleet and Government department vehicles,
The SNT had a network of eight depots, eight booking offices and four workshops and
owned and operated a fleet of 34 tankers, 32 trucks and 120 buses as at the end of 2016-
17.
The SNT implemented (2014-15) the Integrated Depot Management System (IDMS) with
one time financial assistance of ₹ 4.52 crore (50 per cent of project cost) from
Government of India (GoI), Ministry of Road Transport and Highways (MORTH).
2.4.3 Organisational Set-up
Secretary, Transport Department is the head of the SNT. He is assisted by a Chief
Engineer-cum-General Manager (CE-cum-GM). CE is supported by an Additional Chief
Engineer, an Additional General Manager, an Additional Director, a Joint General
Manager, two Superintending Engineers, a Joint Director, a Chief Accounts Officer, an
Accounts Officer, eight Deputy General Managers, a Deputy Director and a host of other
officers and staff. SNT comprised of seven functional wings – Mechanical, Operational,
Enforcement, Administration, Accounts, Revenue and Statistics.
The additional Chief Engineer had been declared as nodal officer to oversee the
functioning of the IDMS.
2.4.4 Scope of Audit
The Performance Audit (PA) of the SNT and implementation of IDMS covering the
period from 2012-13 to 2016-17 was conducted during May to August 2017. Records in
the departmental headquarters, three selected depots/booking offices (Gangtok, Rangpo
and Siliguri) out of eight depots/booking offices and two workshops (Gangtok and
Jalipool) out of four workshops were test checked. Besides, joint physical verification of
three out of four weigh-bridges and the two check-posts existing at the selected depots
was also conducted.
2.4.5 Audit Objectives
The PA was conducted with the objective to assess:
19Bus fares, freight charges of goods carriers (trucks & tankers) and supervision charges 20Stores of spare parts maintained by the SNT attached to its workshops for repair/maintenance of
Government vehicles.
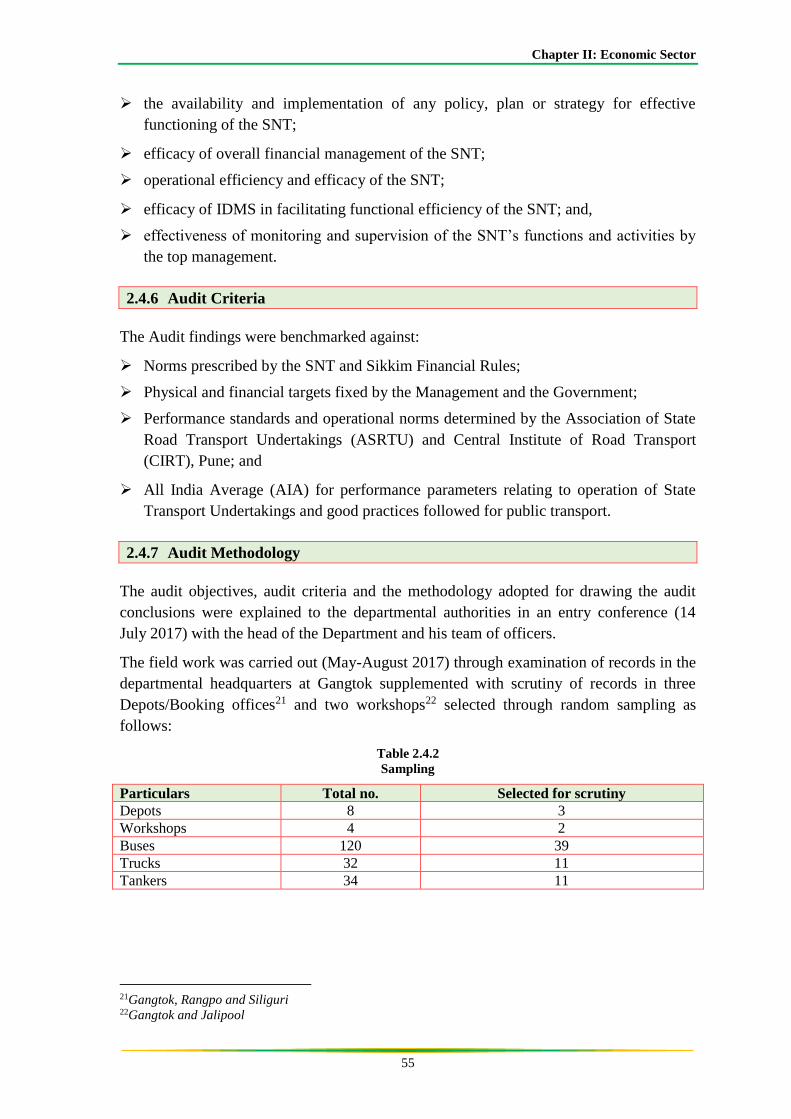
Chapter II: Economic Sector
55
the availability and implementation of any policy, plan or strategy for effective
functioning of the SNT;
efficacy of overall financial management of the SNT;
operational efficiency and efficacy of the SNT;
efficacy of IDMS in facilitating functional efficiency of the SNT; and,
effectiveness of monitoring and supervision of the SNT’s functions and activities by
the top management.
2.4.6 Audit Criteria
The Audit findings were benchmarked against:
Norms prescribed by the SNT and Sikkim Financial Rules;
Physical and financial targets fixed by the Management and the Government;
Performance standards and operational norms determined by the Association of State
Road Transport Undertakings (ASRTU) and Central Institute of Road Transport
(CIRT), Pune; and
All India Average (AIA) for performance parameters relating to operation of State
Transport Undertakings and good practices followed for public transport.
2.4.7 Audit Methodology
The audit objectives, audit criteria and the methodology adopted for drawing the audit
conclusions were explained to the departmental authorities in an entry conference (14
July 2017) with the head of the Department and his team of officers.
The field work was carried out (May-August 2017) through examination of records in the
departmental headquarters at Gangtok supplemented with scrutiny of records in three
Depots/Booking offices21 and two workshops22 selected through random sampling as
follows:
Table 2.4.2
Sampling
Particulars Total no. Selected for scrutiny
Depots 8 3
Workshops 4 2
Buses 120 39
Trucks 32 11
Tankers 34 11
21Gangtok, Rangpo and Siliguri 22Gangtok and Jalipool
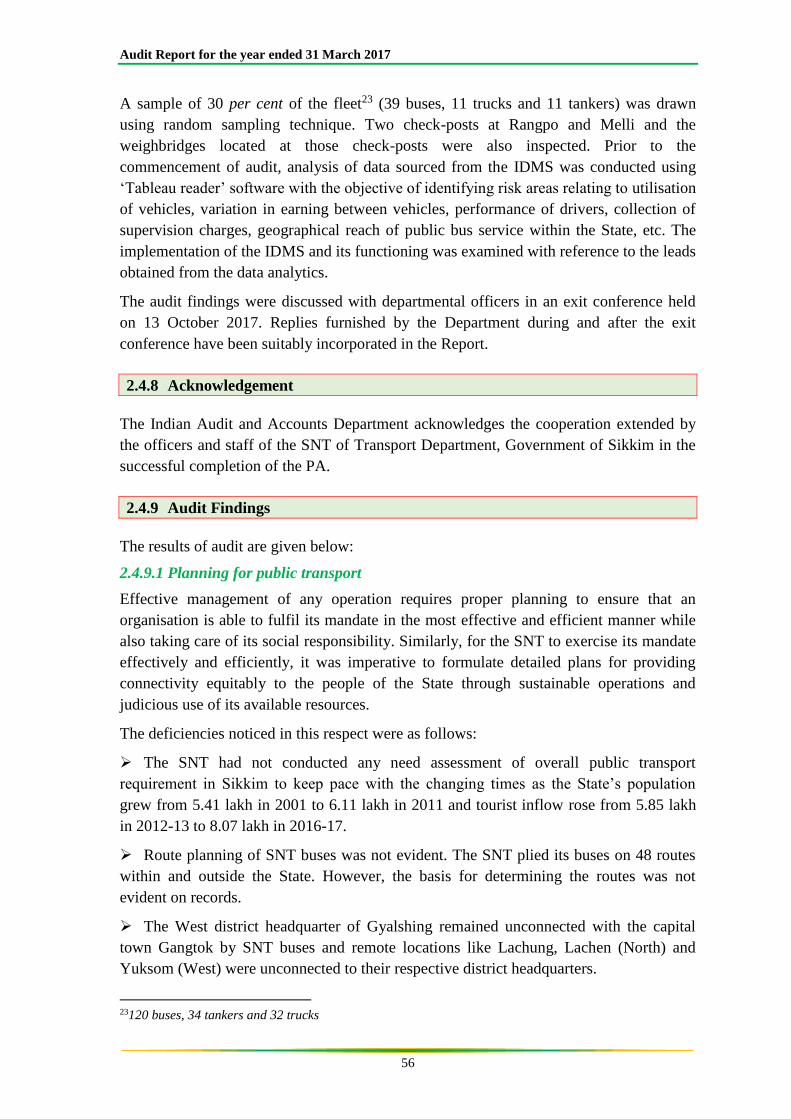
Audit Report for the year ended 31 March 2017
56
A sample of 30 per cent of the fleet23 (39 buses, 11 trucks and 11 tankers) was drawn
using random sampling technique. Two check-posts at Rangpo and Melli and the
weighbridges located at those check-posts were also inspected. Prior to the
commencement of audit, analysis of data sourced from the IDMS was conducted using
‘Tableau reader’ software with the objective of identifying risk areas relating to utilisation
of vehicles, variation in earning between vehicles, performance of drivers, collection of
supervision charges, geographical reach of public bus service within the State, etc. The
implementation of the IDMS and its functioning was examined with reference to the leads
obtained from the data analytics.
The audit findings were discussed with departmental officers in an exit conference held
on 13 October 2017. Replies furnished by the Department during and after the exit
conference have been suitably incorporated in the Report.
2.4.8 Acknowledgement
The Indian Audit and Accounts Department acknowledges the cooperation extended by
the officers and staff of the SNT of Transport Department, Government of Sikkim in the
successful completion of the PA.
2.4.9 Audit Findings
The results of audit are given below:
2.4.9.1 Planning for public transport
Effective management of any operation requires proper planning to ensure that an
organisation is able to fulfil its mandate in the most effective and efficient manner while
also taking care of its social responsibility. Similarly, for the SNT to exercise its mandate
effectively and efficiently, it was imperative to formulate detailed plans for providing
connectivity equitably to the people of the State through sustainable operations and
judicious use of its available resources.
The deficiencies noticed in this respect were as follows:
The SNT had not conducted any need assessment of overall public transport
requirement in Sikkim to keep pace with the changing times as the State’s population
grew from 5.41 lakh in 2001 to 6.11 lakh in 2011 and tourist inflow rose from 5.85 lakh
in 2012-13 to 8.07 lakh in 2016-17.
Route planning of SNT buses was not evident. The SNT plied its buses on 48 routes
within and outside the State. However, the basis for determining the routes was not
evident on records.
The West district headquarter of Gyalshing remained unconnected with the capital
town Gangtok by SNT buses and remote locations like Lachung, Lachen (North) and
Yuksom (West) were unconnected to their respective district headquarters.
23120 buses, 34 tankers and 32 trucks
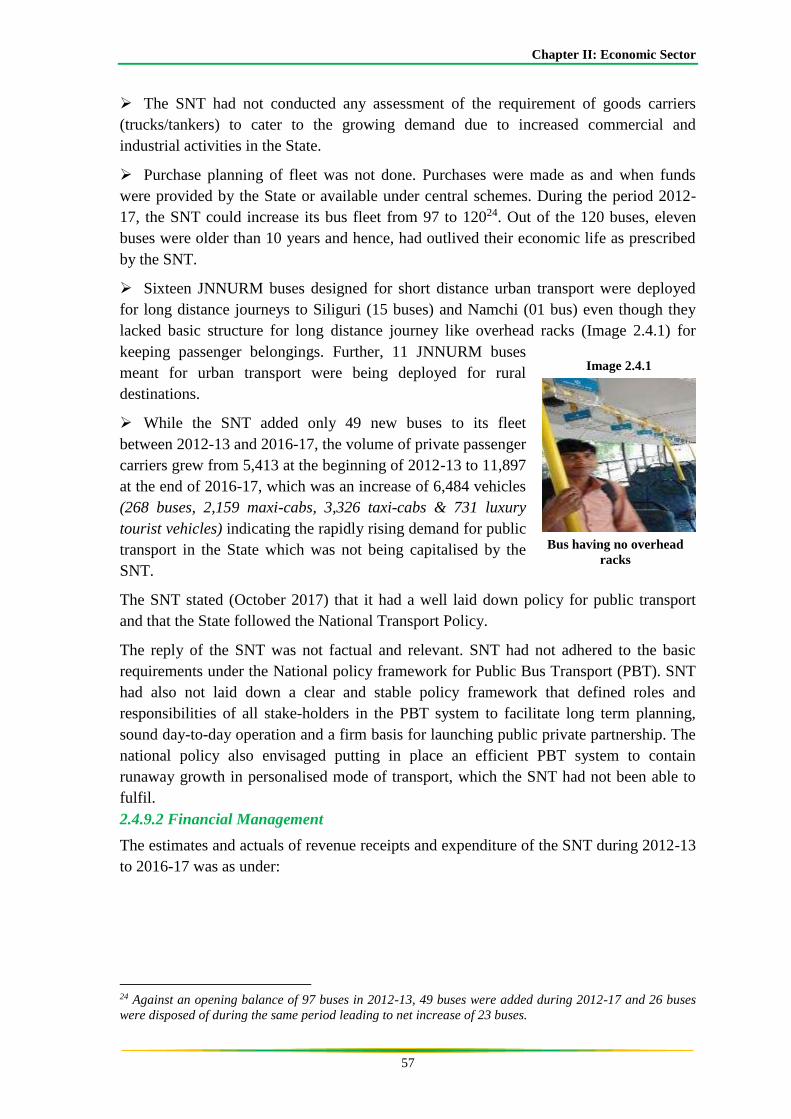
Chapter II: Economic Sector
57
The SNT had not conducted any assessment of the requirement of goods carriers
(trucks/tankers) to cater to the growing demand due to increased commercial and
industrial activities in the State.
Purchase planning of fleet was not done. Purchases were made as and when funds
were provided by the State or available under central schemes. During the period 2012-
17, the SNT could increase its bus fleet from 97 to 12024. Out of the 120 buses, eleven
buses were older than 10 years and hence, had outlived their economic life as prescribed
by the SNT.
Sixteen JNNURM buses designed for short distance urban transport were deployed
for long distance journeys to Siliguri (15 buses) and Namchi (01 bus) even though they
lacked basic structure for long distance journey like overhead racks (Image 2.4.1) for
keeping passenger belongings. Further, 11 JNNURM buses
meant for urban transport were being deployed for rural
destinations.
While the SNT added only 49 new buses to its fleet
between 2012-13 and 2016-17, the volume of private passenger
carriers grew from 5,413 at the beginning of 2012-13 to 11,897
at the end of 2016-17, which was an increase of 6,484 vehicles
(268 buses, 2,159 maxi-cabs, 3,326 taxi-cabs & 731 luxury
tourist vehicles) indicating the rapidly rising demand for public
transport in the State which was not being capitalised by the
SNT.
The SNT stated (October 2017) that it had a well laid down policy for public transport
and that the State followed the National Transport Policy.
The reply of the SNT was not factual and relevant. SNT had not adhered to the basic
requirements under the National policy framework for Public Bus Transport (PBT). SNT
had also not laid down a clear and stable policy framework that defined roles and
responsibilities of all stake-holders in the PBT system to facilitate long term planning,
sound day-to-day operation and a firm basis for launching public private partnership. The
national policy also envisaged putting in place an efficient PBT system to contain
runaway growth in personalised mode of transport, which the SNT had not been able to
fulfil.
2.4.9.2 Financial Management
The estimates and actuals of revenue receipts and expenditure of the SNT during 2012-13
to 2016-17 was as under:
24 Against an opening balance of 97 buses in 2012-13, 49 buses were added during 2012-17 and 26 buses
were disposed of during the same period leading to net increase of 23 buses.
Bus having no overhead
racks
Image 2.4.1
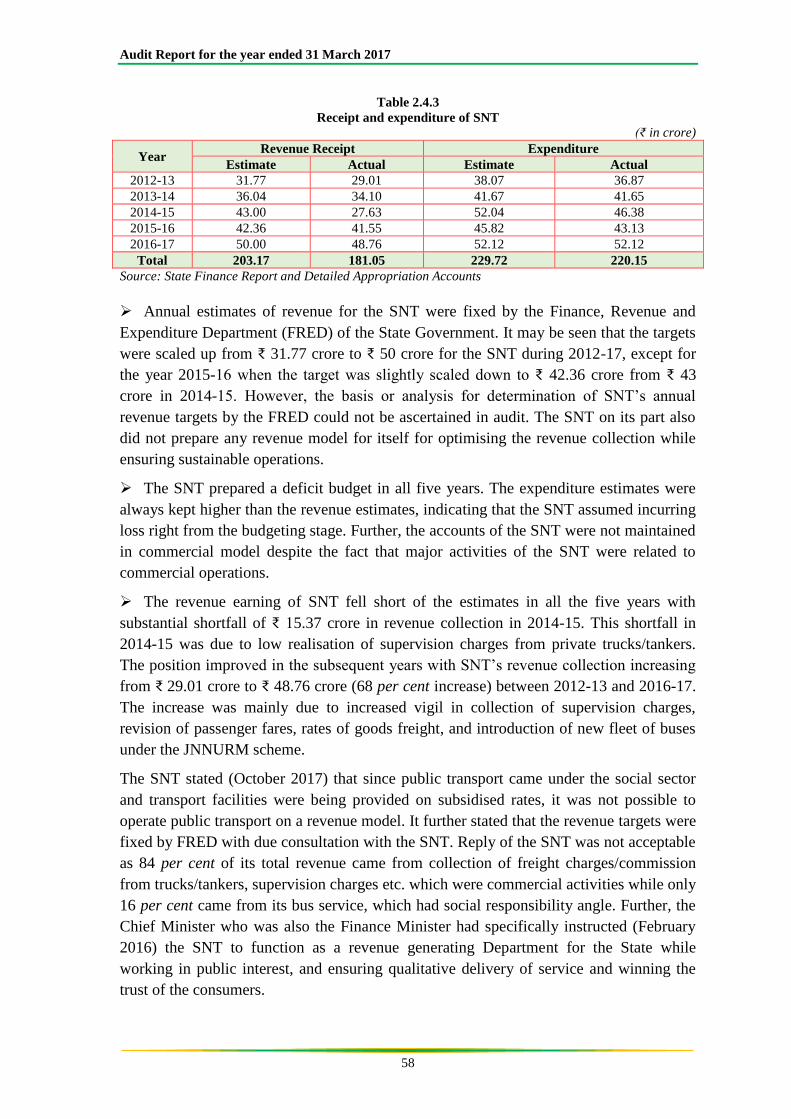
Audit Report for the year ended 31 March 2017
58
Table 2.4.3
Receipt and expenditure of SNT
(₹ in crore)
Year Revenue Receipt Expenditure
Estimate Actual Estimate Actual
2012-13 31.77 29.01 38.07 36.87
2013-14 36.04 34.10 41.67 41.65
2014-15 43.00 27.63 52.04 46.38
2015-16 42.36 41.55 45.82 43.13
2016-17 50.00 48.76 52.12 52.12
Total 203.17 181.05 229.72 220.15
Source: State Finance Report and Detailed Appropriation Accounts
Annual estimates of revenue for the SNT were fixed by the Finance, Revenue and
Expenditure Department (FRED) of the State Government. It may be seen that the targets
were scaled up from ₹ 31.77 crore to ₹ 50 crore for the SNT during 2012-17, except for
the year 2015-16 when the target was slightly scaled down to ₹ 42.36 crore from ₹ 43
crore in 2014-15. However, the basis or analysis for determination of SNT’s annual
revenue targets by the FRED could not be ascertained in audit. The SNT on its part also
did not prepare any revenue model for itself for optimising the revenue collection while
ensuring sustainable operations.
The SNT prepared a deficit budget in all five years. The expenditure estimates were
always kept higher than the revenue estimates, indicating that the SNT assumed incurring
loss right from the budgeting stage. Further, the accounts of the SNT were not maintained
in commercial model despite the fact that major activities of the SNT were related to
commercial operations.
The revenue earning of SNT fell short of the estimates in all the five years with
substantial shortfall of ₹ 15.37 crore in revenue collection in 2014-15. This shortfall in
2014-15 was due to low realisation of supervision charges from private trucks/tankers.
The position improved in the subsequent years with SNT’s revenue collection increasing
from ₹ 29.01 crore to ₹ 48.76 crore (68 per cent increase) between 2012-13 and 2016-17.
The increase was mainly due to increased vigil in collection of supervision charges,
revision of passenger fares, rates of goods freight, and introduction of new fleet of buses
under the JNNURM scheme.
The SNT stated (October 2017) that since public transport came under the social sector
and transport facilities were being provided on subsidised rates, it was not possible to
operate public transport on a revenue model. It further stated that the revenue targets were
fixed by FRED with due consultation with the SNT. Reply of the SNT was not acceptable
as 84 per cent of its total revenue came from collection of freight charges/commission
from trucks/tankers, supervision charges etc. which were commercial activities while only
16 per cent came from its bus service, which had social responsibility angle. Further, the
Chief Minister who was also the Finance Minister had specifically instructed (February
2016) the SNT to function as a revenue generating Department for the State while
working in public interest, and ensuring qualitative delivery of service and winning the
trust of the consumers.
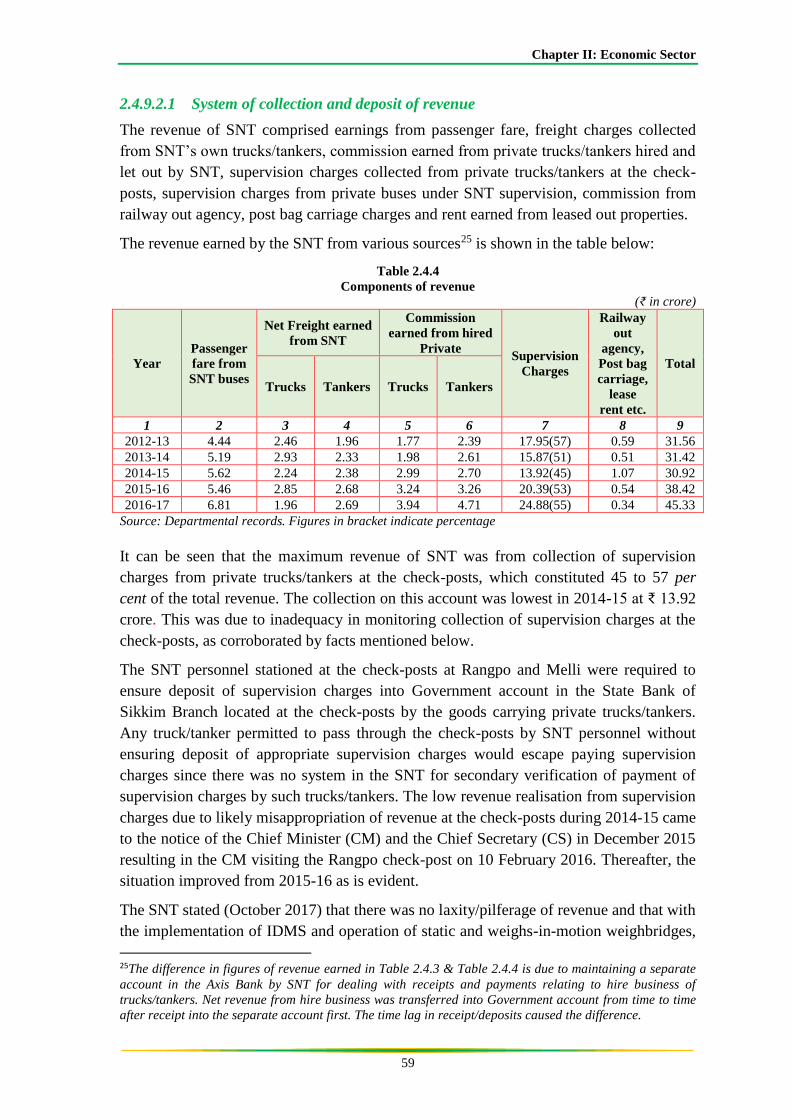
Chapter II: Economic Sector
59
2.4.9.2.1 System of collection and deposit of revenue
The revenue of SNT comprised earnings from passenger fare, freight charges collected
from SNT’s own trucks/tankers, commission earned from private trucks/tankers hired and
let out by SNT, supervision charges collected from private trucks/tankers at the check-
posts, supervision charges from private buses under SNT supervision, commission from
railway out agency, post bag carriage charges and rent earned from leased out properties.
The revenue earned by the SNT from various sources25 is shown in the table below:
Table 2.4.4
Components of revenue
(₹ in crore)
Year
Passenger
fare from
SNT buses
Net Freight earned
from SNT
Commission
earned from hired
Private Supervision
Charges
Railway
out
agency,
Post bag
carriage,
lease
rent etc.
Total
Trucks Tankers Trucks Tankers
1 2 3 4 5 6 7 8 9
2012-13 4.44 2.46 1.96 1.77 2.39 17.95(57) 0.59 31.56
2013-14 5.19 2.93 2.33 1.98 2.61 15.87(51) 0.51 31.42
2014-15 5.62 2.24 2.38 2.99 2.70 13.92(45) 1.07 30.92
2015-16 5.46 2.85 2.68 3.24 3.26 20.39(53) 0.54 38.42
2016-17 6.81 1.96 2.69 3.94 4.71 24.88(55) 0.34 45.33
Source: Departmental records. Figures in bracket indicate percentage
It can be seen that the maximum revenue of SNT was from collection of supervision
charges from private trucks/tankers at the check-posts, which constituted 45 to 57 per
cent of the total revenue. The collection on this account was lowest in 2014-15 at ₹ 13.92
crore. This was due to inadequacy in monitoring collection of supervision charges at the
check-posts, as corroborated by facts mentioned below.
The SNT personnel stationed at the check-posts at Rangpo and Melli were required to
ensure deposit of supervision charges into Government account in the State Bank of
Sikkim Branch located at the check-posts by the goods carrying private trucks/tankers.
Any truck/tanker permitted to pass through the check-posts by SNT personnel without
ensuring deposit of appropriate supervision charges would escape paying supervision
charges since there was no system in the SNT for secondary verification of payment of
supervision charges by such trucks/tankers. The low revenue realisation from supervision
charges due to likely misappropriation of revenue at the check-posts during 2014-15 came
to the notice of the Chief Minister (CM) and the Chief Secretary (CS) in December 2015
resulting in the CM visiting the Rangpo check-post on 10 February 2016. Thereafter, the
situation improved from 2015-16 as is evident.
The SNT stated (October 2017) that there was no laxity/pilferage of revenue and that with
the implementation of IDMS and operation of static and weighs-in-motion weighbridges,
25The difference in figures of revenue earned in Table 2.4.3 & Table 2.4.4 is due to maintaining a separate
account in the Axis Bank by SNT for dealing with receipts and payments relating to hire business of
trucks/tankers. Net revenue from hire business was transferred into Government account from time to time
after receipt into the separate account first. The time lag in receipt/deposits caused the difference.
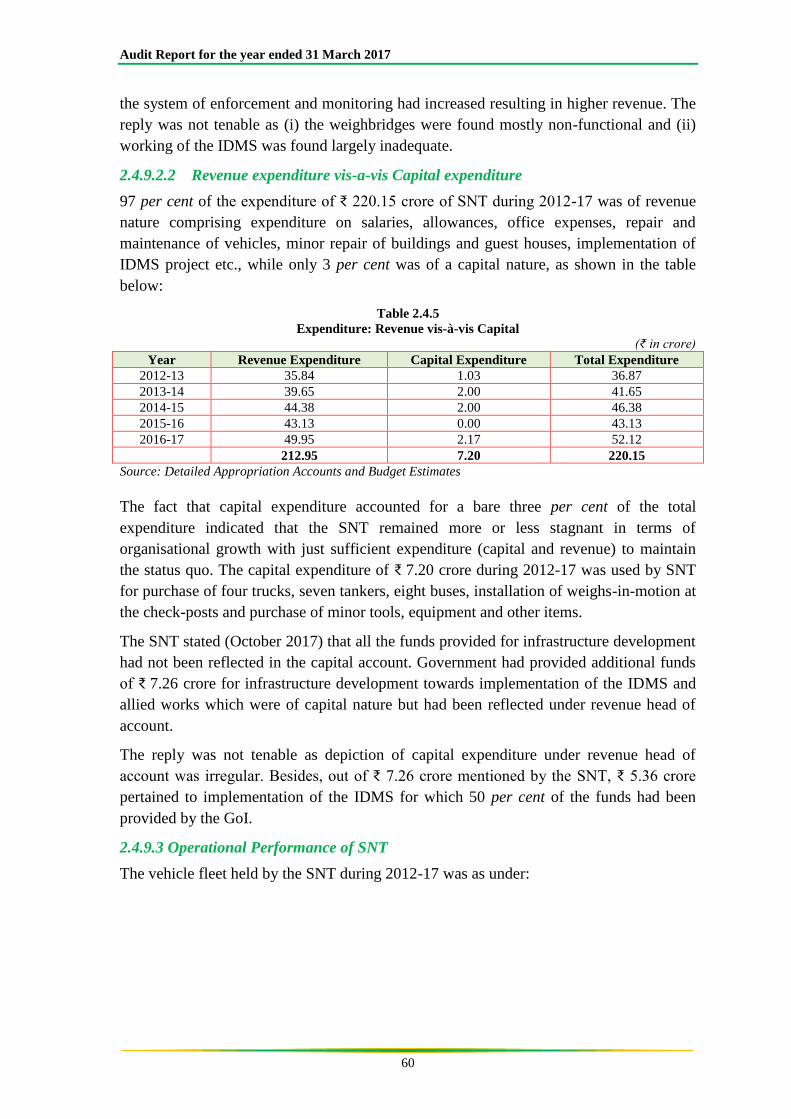
Audit Report for the year ended 31 March 2017
60
the system of enforcement and monitoring had increased resulting in higher revenue. The
reply was not tenable as (i) the weighbridges were found mostly non-functional and (ii)
working of the IDMS was found largely inadequate.
2.4.9.2.2 Revenue expenditure vis-a-vis Capital expenditure
97 per cent of the expenditure of ₹ 220.15 crore of SNT during 2012-17 was of revenue
nature comprising expenditure on salaries, allowances, office expenses, repair and
maintenance of vehicles, minor repair of buildings and guest houses, implementation of
IDMS project etc., while only 3 per cent was of a capital nature, as shown in the table
below:
Table 2.4.5
Expenditure: Revenue vis-à-vis Capital
(₹ in crore)
Year Revenue Expenditure Capital Expenditure Total Expenditure
2012-13 35.84 1.03 36.87
2013-14 39.65 2.00 41.65
2014-15 44.38 2.00 46.38
2015-16 43.13 0.00 43.13
2016-17 49.95 2.17 52.12
212.95 7.20 220.15
Source: Detailed Appropriation Accounts and Budget Estimates
The fact that capital expenditure accounted for a bare three per cent of the total
expenditure indicated that the SNT remained more or less stagnant in terms of
organisational growth with just sufficient expenditure (capital and revenue) to maintain
the status quo. The capital expenditure of ₹ 7.20 crore during 2012-17 was used by SNT
for purchase of four trucks, seven tankers, eight buses, installation of weighs-in-motion at
the check-posts and purchase of minor tools, equipment and other items.
The SNT stated (October 2017) that all the funds provided for infrastructure development
had not been reflected in the capital account. Government had provided additional funds
of ₹ 7.26 crore for infrastructure development towards implementation of the IDMS and
allied works which were of capital nature but had been reflected under revenue head of
account.
The reply was not tenable as depiction of capital expenditure under revenue head of
account was irregular. Besides, out of ₹ 7.26 crore mentioned by the SNT, ₹ 5.36 crore
pertained to implementation of the IDMS for which 50 per cent of the funds had been
provided by the GoI.
2.4.9.3 Operational Performance of SNT
The vehicle fleet held by the SNT during 2012-17 was as under:
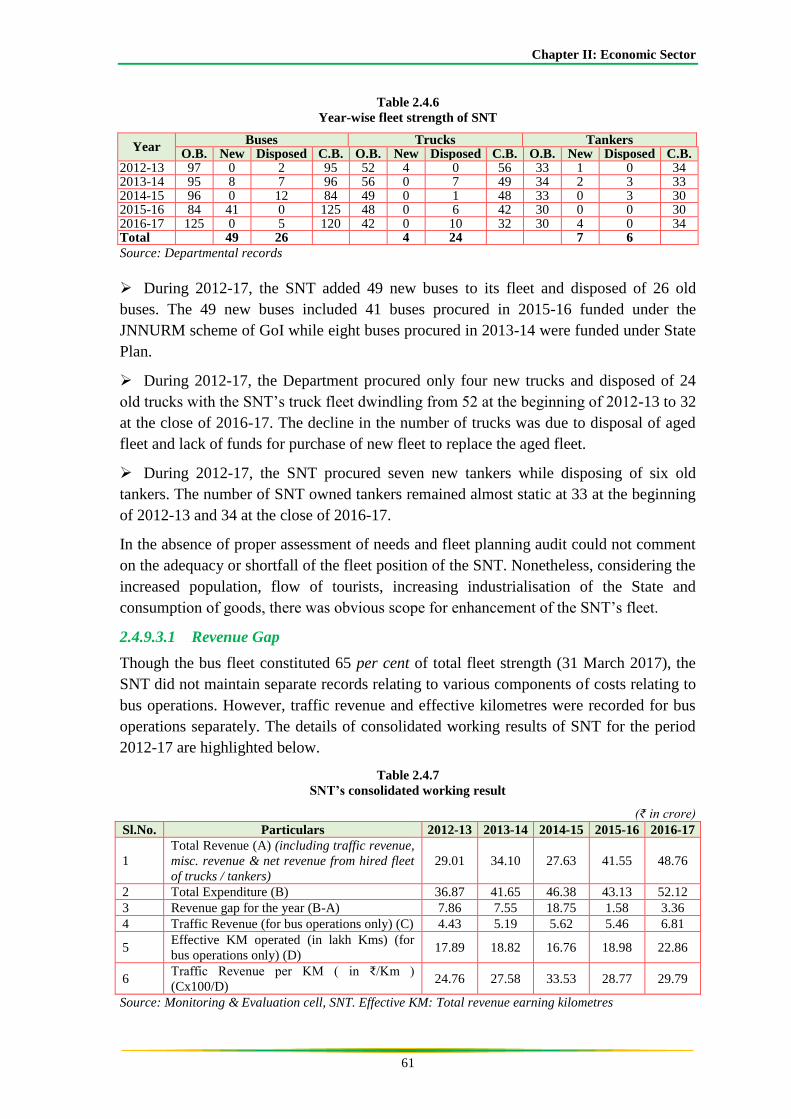
Chapter II: Economic Sector
61
Table 2.4.6
Year-wise fleet strength of SNT
Year Buses Trucks Tankers
O.B. New Disposed C.B. O.B. New Disposed C.B. O.B. New Disposed C.B. 2012-13 97 0 2 95 52 4 0 56 33 1 0 34 2013-14 95 8 7 96 56 0 7 49 34 2 3 33 2014-15 96 0 12 84 49 0 1 48 33 0 3 30 2015-16 84 41 0 125 48 0 6 42 30 0 0 30 2016-17 125 0 5 120 42 0 10 32 30 4 0 34 Total 49 26 4 24 7 6
Source: Departmental records
During 2012-17, the SNT added 49 new buses to its fleet and disposed of 26 old
buses. The 49 new buses included 41 buses procured in 2015-16 funded under the
JNNURM scheme of GoI while eight buses procured in 2013-14 were funded under State
Plan.
During 2012-17, the Department procured only four new trucks and disposed of 24
old trucks with the SNT’s truck fleet dwindling from 52 at the beginning of 2012-13 to 32
at the close of 2016-17. The decline in the number of trucks was due to disposal of aged
fleet and lack of funds for purchase of new fleet to replace the aged fleet.
During 2012-17, the SNT procured seven new tankers while disposing of six old
tankers. The number of SNT owned tankers remained almost static at 33 at the beginning
of 2012-13 and 34 at the close of 2016-17.
In the absence of proper assessment of needs and fleet planning audit could not comment
on the adequacy or shortfall of the fleet position of the SNT. Nonetheless, considering the
increased population, flow of tourists, increasing industrialisation of the State and
consumption of goods, there was obvious scope for enhancement of the SNT’s fleet.
2.4.9.3.1 Revenue Gap
Though the bus fleet constituted 65 per cent of total fleet strength (31 March 2017), the
SNT did not maintain separate records relating to various components of costs relating to
bus operations. However, traffic revenue and effective kilometres were recorded for bus
operations separately. The details of consolidated working results of SNT for the period
2012-17 are highlighted below.
Table 2.4.7
SNT’s consolidated working result
(₹ in crore)
Sl.No. Particulars 2012-13 2013-14 2014-15 2015-16 2016-17
1
Total Revenue (A) (including traffic revenue,
misc. revenue & net revenue from hired fleet
of trucks / tankers)
29.01 34.10 27.63 41.55 48.76
2 Total Expenditure (B) 36.87 41.65 46.38 43.13 52.12
3 Revenue gap for the year (B-A) 7.86 7.55 18.75 1.58 3.36
4 Traffic Revenue (for bus operations only) (C) 4.43 5.19 5.62 5.46 6.81
5 Effective KM operated (in lakh Kms) (for
bus operations only) (D) 17.89 18.82 16.76 18.98 22.86
6 Traffic Revenue per KM ( in ₹/Km )
(Cx100/D) 24.76 27.58 33.53 28.77 29.79
Source: Monitoring & Evaluation cell, SNT. Effective KM: Total revenue earning kilometres
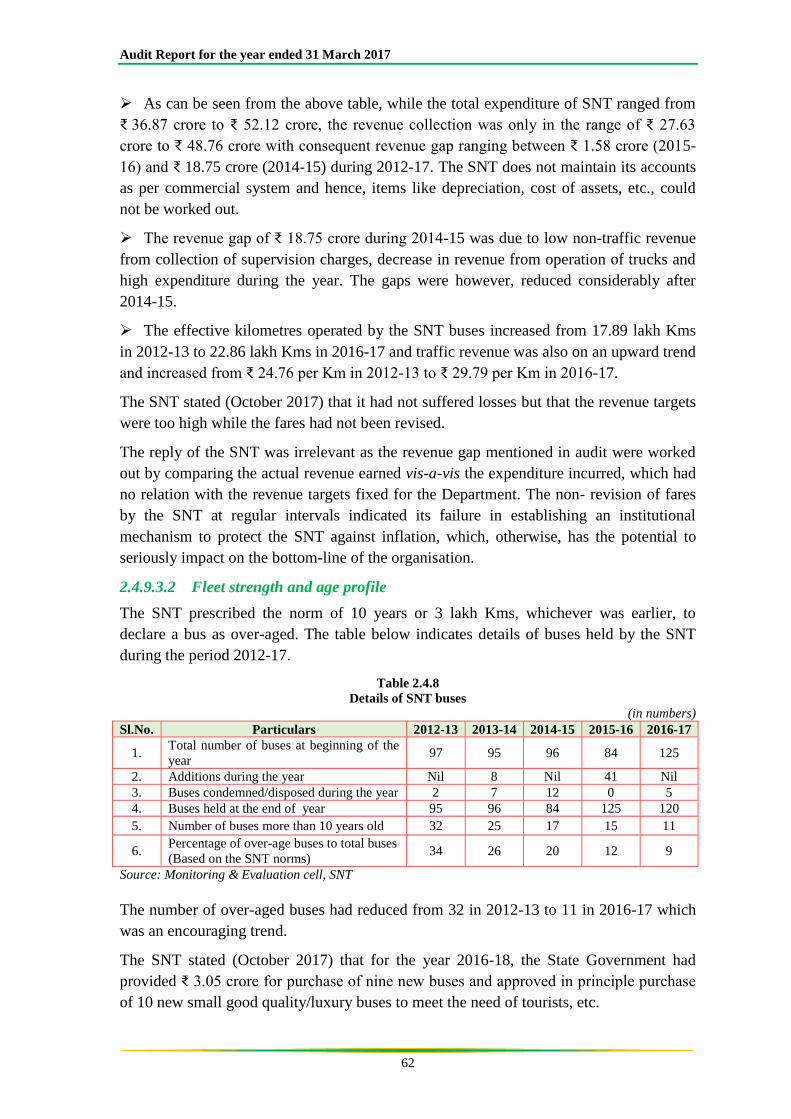
Audit Report for the year ended 31 March 2017
62
As can be seen from the above table, while the total expenditure of SNT ranged from
₹ 36.87 crore to ₹ 52.12 crore, the revenue collection was only in the range of ₹ 27.63
crore to ₹ 48.76 crore with consequent revenue gap ranging between ₹ 1.58 crore (2015-
16) and ₹ 18.75 crore (2014-15) during 2012-17. The SNT does not maintain its accounts
as per commercial system and hence, items like depreciation, cost of assets, etc., could
not be worked out.
The revenue gap of ₹ 18.75 crore during 2014-15 was due to low non-traffic revenue
from collection of supervision charges, decrease in revenue from operation of trucks and
high expenditure during the year. The gaps were however, reduced considerably after
2014-15.
The effective kilometres operated by the SNT buses increased from 17.89 lakh Kms
in 2012-13 to 22.86 lakh Kms in 2016-17 and traffic revenue was also on an upward trend
and increased from ₹ 24.76 per Km in 2012-13 to ₹ 29.79 per Km in 2016-17.
The SNT stated (October 2017) that it had not suffered losses but that the revenue targets
were too high while the fares had not been revised.
The reply of the SNT was irrelevant as the revenue gap mentioned in audit were worked
out by comparing the actual revenue earned vis-a-vis the expenditure incurred, which had
no relation with the revenue targets fixed for the Department. The non- revision of fares
by the SNT at regular intervals indicated its failure in establishing an institutional
mechanism to protect the SNT against inflation, which, otherwise, has the potential to
seriously impact on the bottom-line of the organisation.
2.4.9.3.2 Fleet strength and age profile
The SNT prescribed the norm of 10 years or 3 lakh Kms, whichever was earlier, to
declare a bus as over-aged. The table below indicates details of buses held by the SNT
during the period 2012-17.
Table 2.4.8
Details of SNT buses
(in numbers)
Sl.No. Particulars 2012-13 2013-14 2014-15 2015-16 2016-17
1. Total number of buses at beginning of the
year 97 95 96 84 125
2. Additions during the year Nil 8 Nil 41 Nil
3. Buses condemned/disposed during the year 2 7 12 0 5
4. Buses held at the end of year 95 96 84 125 120
5. Number of buses more than 10 years old 32 25 17 15 11
6. Percentage of over-age buses to total buses
(Based on the SNT norms) 34 26 20 12 9
Source: Monitoring & Evaluation cell, SNT
The number of over-aged buses had reduced from 32 in 2012-13 to 11 in 2016-17 which
was an encouraging trend.
The SNT stated (October 2017) that for the year 2016-18, the State Government had
provided ₹ 3.05 crore for purchase of nine new buses and approved in principle purchase
of 10 new small good quality/luxury buses to meet the need of tourists, etc.
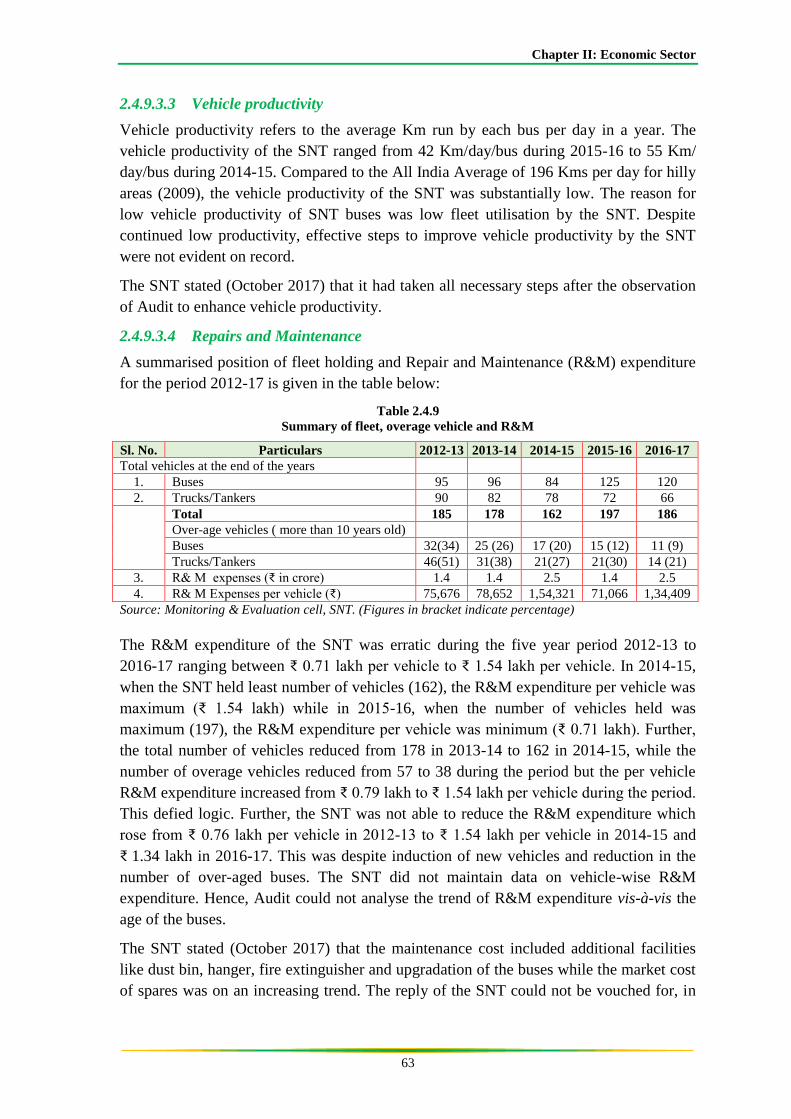
Chapter II: Economic Sector
63
2.4.9.3.3 Vehicle productivity
Vehicle productivity refers to the average Km run by each bus per day in a year. The
vehicle productivity of the SNT ranged from 42 Km/day/bus during 2015-16 to 55 Km/
day/bus during 2014-15. Compared to the All India Average of 196 Kms per day for hilly
areas (2009), the vehicle productivity of the SNT was substantially low. The reason for
low vehicle productivity of SNT buses was low fleet utilisation by the SNT. Despite
continued low productivity, effective steps to improve vehicle productivity by the SNT
were not evident on record.
The SNT stated (October 2017) that it had taken all necessary steps after the observation
of Audit to enhance vehicle productivity.
2.4.9.3.4 Repairs and Maintenance
A summarised position of fleet holding and Repair and Maintenance (R&M) expenditure
for the period 2012-17 is given in the table below:
Table 2.4.9
Summary of fleet, overage vehicle and R&M
Sl. No. Particulars 2012-13 2013-14 2014-15 2015-16 2016-17
Total vehicles at the end of the years
1. Buses 95 96 84 125 120
2. Trucks/Tankers 90 82 78 72 66
Total 185 178 162 197 186
Over-age vehicles ( more than 10 years old)
Buses 32(34) 25 (26) 17 (20) 15 (12) 11 (9)
Trucks/Tankers 46(51) 31(38) 21(27) 21(30) 14 (21)
3. R& M expenses (₹ in crore) 1.4 1.4 2.5 1.4 2.5
4. R& M Expenses per vehicle (₹) 75,676 78,652 1,54,321 71,066 1,34,409
Source: Monitoring & Evaluation cell, SNT. (Figures in bracket indicate percentage)
The R&M expenditure of the SNT was erratic during the five year period 2012-13 to
2016-17 ranging between ₹ 0.71 lakh per vehicle to ₹ 1.54 lakh per vehicle. In 2014-15,
when the SNT held least number of vehicles (162), the R&M expenditure per vehicle was
maximum (₹ 1.54 lakh) while in 2015-16, when the number of vehicles held was
maximum (197), the R&M expenditure per vehicle was minimum (₹ 0.71 lakh). Further,
the total number of vehicles reduced from 178 in 2013-14 to 162 in 2014-15, while the
number of overage vehicles reduced from 57 to 38 during the period but the per vehicle
R&M expenditure increased from ₹ 0.79 lakh to ₹ 1.54 lakh per vehicle during the period.
This defied logic. Further, the SNT was not able to reduce the R&M expenditure which
rose from ₹ 0.76 lakh per vehicle in 2012-13 to ₹ 1.54 lakh per vehicle in 2014-15 and
₹ 1.34 lakh in 2016-17. This was despite induction of new vehicles and reduction in the
number of over-aged buses. The SNT did not maintain data on vehicle-wise R&M
expenditure. Hence, Audit could not analyse the trend of R&M expenditure vis-à-vis the
age of the buses.
The SNT stated (October 2017) that the maintenance cost included additional facilities
like dust bin, hanger, fire extinguisher and upgradation of the buses while the market cost
of spares was on an increasing trend. The reply of the SNT could not be vouched for, in
Audit Report for the year ended 31 March 2017
64
the absence of specific data on vehicle-wise R&M expenditure. The erratic trend of R&M
expenditure of the SNT, therefore, needed to be properly investigated.
2.4.9.3.5 Fuel consumption
The position of effective kilometres covered by the SNT buses vis-a-vis fuel consumed
during 2012-17 is depicted in the table below:
Table 2.4.10
Kilometre per litre achieved by SNT
Sl. No. Particulars 2012-13 2013-14 2014-15 2015-16 2016-17
1. Effective KMs operated (in
lakh) 17.89 18.82 16.76 18.98 22.86
2 Fuel Consumption (in lakh
litres) 4.19 4.13 3.82 4.54 6.07
3. Actual KMPL26 (1/2) 4.27 4.56 4.39 4.18 3.77
4. Target of KMPL fixed by SNT 3.00 3.00 3.30 3.30 3.30
Source: Monitoring & Evaluation cell, SNT
Except during 2014-15, the effective kilometres operated by the SNT buses were on an
increasing trend. However, despite improvement in the quality of the SNT’s fleet in terms
of age profile over the period 2012-17, there was continuous decline of the distance
performed per litre of fuel by the SNT vehicles from 4.56 kmpl in 2013-14 to 3.77 kmpl
in 2016-17. The SNT had neither evaluated the reasons for decline in performance of its
fleet in respect of fuel efficiency nor taken any steps to improve the situation.
The SNT stated (October 2017) that the hilly terrain, road and weather conditions did not
allow optimum output by the vehicles. The reply did not address the fact that despite
improvement in the age profile of the fleet over the period 2012-17, the fuel efficiency
was on a declining trend.
2.4.9.3.6 Private vehicles hired by SNT
Apart from its own trucks/tankers, the SNT also hired private trucks/tankers and rented
them to various agencies. All private trucks/tankers entering Sikkim (not hired by SNT)
were required to pay supervision charges at specific rates calculated on the basis of load
carried and distance travelled. Audit noticed that the rate difference between hire charges
collected from the SNT’s customers and the hire charges paid to the owners of private
trucks/tankers by the SNT equalled the supervision charges applicable to other private
trucks/tankers not hired by SNT. Details of the rate of hire charges collected vis-à-vis hire
charges paid by the SNT and the Supervision charges applicable to other private tankers
and trucks are given in the table below:
26Kilometre Per litre.
Chapter II: Economic Sector
65
Table 2.4.11
Rate of hire charge vis-à-vis supervision charge (2016-17)
Sl.
No. Name of Users
Hire charge
collected by SNT
from its Users
(₹/MT/Km)
Hire charges paid by
SNT to owners of
private
trucks/tankers
(₹/MT/Km)
Difference Supervision
charge
(₹/MT/Km)
a b c d=b-c e=d
1 Army & Project
Swastik 14.64 10.98 3.66 3.66
2
Hydel project
developer &
ancillary units, para-
military forces,
pharmaceutical
companies etc.
14.64 10.98 3.66 3.66
Hence, the SNT did not gain anything by undertaking the hiring business of private
trucks/tankers. On the contrary the SNT had to incur extra expenses on managing the
hired trucks/tankers (309).
The SNT also allotted 8.89 lakh litres of high speed diesel (HSD) from its pump at
Rangpo at a cost of ₹ 4.78 crore on the hired private trucks/tankers during 2015-17 for
performing 5,743 trips. This constituted undue favour to the private vehicle owners. Had
the SNT collected supervision charges at the check-posts instead of hiring the private
trucks/tankers, it could have earned the same amount of revenue promptly without
incurring additional administrative cost and incurring expenditure on purchase of HSD.
The SNT stated (October 2017) that it had introduced additional administrative charges of
1.73 per cent against hiring of private trucks/tankers since 2016-17.
2.4.9.3.7 Measurement of weights of goods transported
All private trucks/tankers carrying load in the State of Sikkim, whether inter-State or
intra-State, were required to pay supervision charges to the State at rates notified by the
SNT from time to time. The supervision charge was determined on the basis of load
carried, distance travelled and the type of organisation/business/individual on whose
behalf goods were carried. The supervision charges were collected at the check-posts
located at Rangpo and Melli.
The following deficiencies were noticed in audit:
Functioning of weighbridges
For the purpose of determining weights carried by vehicles
entering or exiting Sikkim, the SNT took up (February 2011)
work of installing two weighbridges at Mining about 5 Kms
from the Rangpo check-post and another at Melli check-post
at a cost of ₹ 64.91 lakh. Installation of the weighbridges
was to be completed by April 2011. The weighbridges were
commissioned in September 2012 and December 2015
respectively, after a delay of more than one year in Mining Weighbridge at Mining
Image 2.4.2
Audit Report for the year ended 31 March 2017
66
and more than four years in Melli. A joint visit (August 2017) by Audit along with
departmental officers revealed that the weighbridge at Mining was installed about 50
metres away from the national highway inside a residential complex of the State
Government and remained largely unused due to the unplanned nature of its installation.
The weighbridge could be accessed by loaded vehicles coming from Siliguri only after
crossing the highway and after measurement, the vehicles had to reverse and turn round
to exit the complex, there being no thoroughfare from the other end of the weighbridge.
Scrutiny of weighing done at the weighbridge during March 2017 revealed that weighing
was done only for 14 days (between 1 March 2017 and 21 March 2017) for 126 vehicles
only out of 6362 private goods carriers, which passed through the Rangpo check-post
during the same period27. Out of these, 45 vehicles were found carrying excess load
ranging from 300 kgs to 6,810 kgs indicating that the practice of carrying excess load was
prevalent.
At the weighbridge, Melli check-post, only 12 vehicles were measured during March
2017 out of 3,407 goods carrying vehicles, passing through the check-post. Out of these
12 vehicles measured, eight vehicles were found carrying excess weights between 1,690
and 4,630 Kgs indicating widespread prevalence of excess loading.
Despite this fact, mandatory weighing of all vehicles was not enforced and supervision
charges were levied on fixed weights based on carrying capacity of the vehicles.
Installation and functioning of weighs-in-motion
The Chief Secretary (CS) expressed concern (December 2015) over virtual non-utilisation
of weighbridges located at Rangpo and Melli and consequent loss of revenue to the
Government due to likely connivance of Government servants with businessmen in
misappropriating Government revenue. The CM also ordered (December 2015) for repair
of the weighbridges within one week.
The CM also approved (February 2016) the proposal of the Department for installation of
new sets of Weighs-in motion28 (WIM) at various check-posts of the State and at district
headquarters. In the first phase, installation of four Weighs-in motions (WIMs) was taken
up (July 2016), two each at the Rangpo and Melli check-posts for weighing incoming and
outgoing vehicles. The WIMs were expected to automatically measure weights of
vehicles passing through the check-posts without stopping them thereby saving time and
the trouble of taking weights, as in the case of conventional weighbridges.
The SNT directly obtained (February 2016) rates for supply and installation of the WIMs
from three agencies29 without publicising tenders in the national papers as required under
Sikkim Financial Rules (Rule 127). The work was awarded (July 2016) to two firms (M/s
Essae Digitronics Ltd., Bangalore and M/s Precision weighing system, Pune) for supply
and installing two WIMs, one at Rangpo and other at Melli check-post at total cost of
₹ 65.78 lakh.
27 1 March 2017 to 21 March 2017. 28Total12 Weighs-in Motion (WIM) to be installed at the check-posts located at Rangpo, Melli and Reshi besides
purchase of five portable WIM system to be kept in the District Headquarters. 29M/s Essae Digitronice Ltd., Bangalore, M/s Precision weighing system, Pune and M/s Kunal Enterprise, Pune.
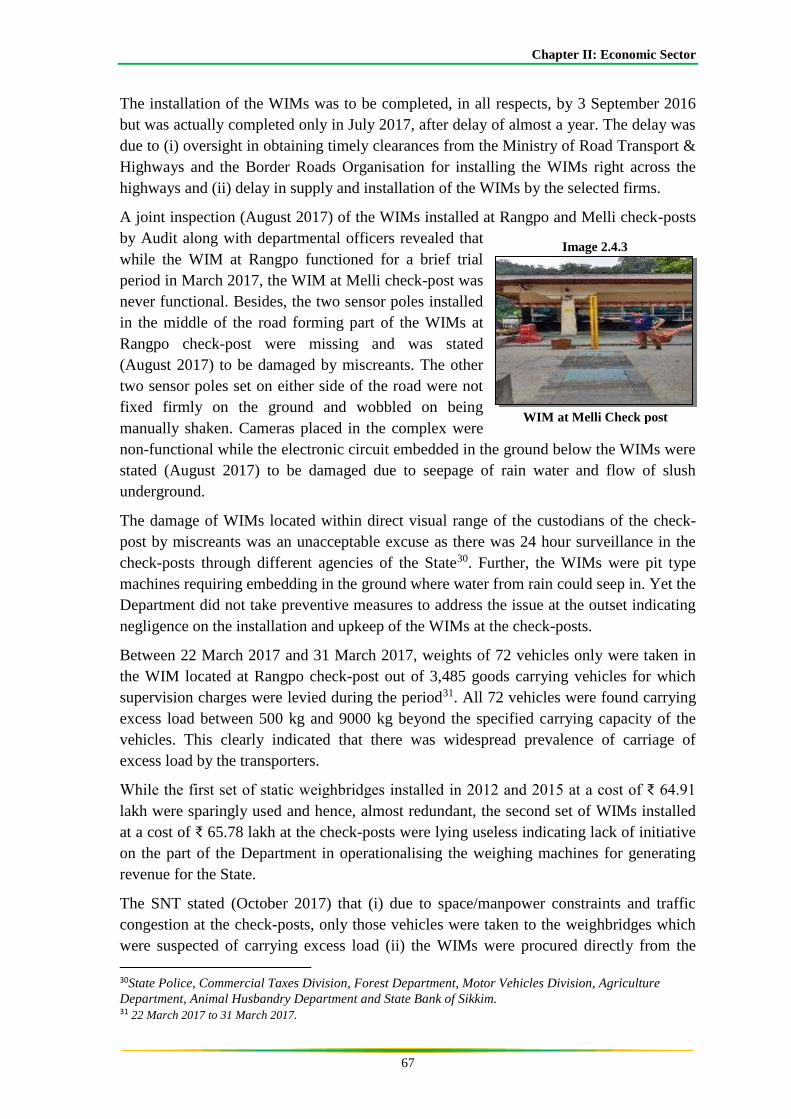
Chapter II: Economic Sector
67
The installation of the WIMs was to be completed, in all respects, by 3 September 2016
but was actually completed only in July 2017, after delay of almost a year. The delay was
due to (i) oversight in obtaining timely clearances from the Ministry of Road Transport &
Highways and the Border Roads Organisation for installing the WIMs right across the
highways and (ii) delay in supply and installation of the WIMs by the selected firms.
A joint inspection (August 2017) of the WIMs installed at Rangpo and Melli check-posts
by Audit along with departmental officers revealed that
while the WIM at Rangpo functioned for a brief trial
period in March 2017, the WIM at Melli check-post was
never functional. Besides, the two sensor poles installed
in the middle of the road forming part of the WIMs at
Rangpo check-post were missing and was stated
(August 2017) to be damaged by miscreants. The other
two sensor poles set on either side of the road were not
fixed firmly on the ground and wobbled on being
manually shaken. Cameras placed in the complex were
non-functional while the electronic circuit embedded in the ground below the WIMs were
stated (August 2017) to be damaged due to seepage of rain water and flow of slush
underground.
The damage of WIMs located within direct visual range of the custodians of the check-
post by miscreants was an unacceptable excuse as there was 24 hour surveillance in the
check-posts through different agencies of the State30. Further, the WIMs were pit type
machines requiring embedding in the ground where water from rain could seep in. Yet the
Department did not take preventive measures to address the issue at the outset indicating
negligence on the installation and upkeep of the WIMs at the check-posts.
Between 22 March 2017 and 31 March 2017, weights of 72 vehicles only were taken in
the WIM located at Rangpo check-post out of 3,485 goods carrying vehicles for which
supervision charges were levied during the period31. All 72 vehicles were found carrying
excess load between 500 kg and 9000 kg beyond the specified carrying capacity of the
vehicles. This clearly indicated that there was widespread prevalence of carriage of
excess load by the transporters.
While the first set of static weighbridges installed in 2012 and 2015 at a cost of ₹ 64.91
lakh were sparingly used and hence, almost redundant, the second set of WIMs installed
at a cost of ₹ 65.78 lakh at the check-posts were lying useless indicating lack of initiative
on the part of the Department in operationalising the weighing machines for generating
revenue for the State.
The SNT stated (October 2017) that (i) due to space/manpower constraints and traffic
congestion at the check-posts, only those vehicles were taken to the weighbridges which
were suspected of carrying excess load (ii) the WIMs were procured directly from the
30State Police, Commercial Taxes Division, Forest Department, Motor Vehicles Division, Agriculture
Department, Animal Husbandry Department and State Bank of Sikkim. 31 22 March 2017 to 31 March 2017.
WIM at Melli Check post
Image 2.4.3
Audit Report for the year ended 31 March 2017
68
manufacturers in extreme urgency due to shortage of time to call for tenders (iii) the
installation of WIMs was done as a pilot project on trial basis to prevent revenue pilferage
and enhance efficiency at the check-posts, and (iv) the damaged component of the WIM
at Rangpo check-post had since been identified and rectified.
Reply of the SNT was not tenable as (i) taking weights of goods vehicles at the check-
posts was being done on arbitrary basis on the whims of the personnel stationed at the
check-posts, and, (ii) while the SNT exhibited all urgency in procuring the WIMs, it did
not demonstrate the same enthusiasm for timely installation of the WIMs and making
them functional.
2.4.9.3.8 Non-levy of supervision charges from intra-State transport of goods
The State Government issued notification (May 2016) specifying the rate of
₹ 3.66/MT32/Km supervision charge for transportation of goods within the State of
Sikkim in respect of hydropower project developers & ancillary units, paramilitary forces,
pharmaceutical companies, private companies, any commercial companies and
organisations. In terms of the notification, the minimum chargeable rate for supervision
would be 10 MT or as per pay load mentioned in the registration certificate with
minimum chargeable distance of 20 Kms.
Audit verification revealed that 1,50,66,315 cubic feet (cft) of sand, stone and stone chips
had been transported within State during 2016-17 in the East district alone. This
translated to a total of 75,332 trips calculated at the rate of 200 cft33 per trip. Supervision
charges for the East district alone for one year would therefore, work out to ₹ 5.51
crore34.
Audit noticed that weighbridges had been installed only at the two check-posts at Rangpo
and Melli for measuring weights of vehicles engaged in inter-state transportation. No
arrangement had been made by SNT to take weights of goods carrying vehicles engaged
in intra-State transportation within the State. Thus, the SNT’s oversight in laying systems,
procedures and facilities for collection of supervision charges from goods carrying
vehicles for intra-state transport had resulted in huge recurring loss of revenue to the State
with no scope of recovery.
2.4.9.4 Information Management System
The GoI, Ministry of Road Transport and Highways (MORTH) introduced (March 2010)
the scheme ‘Central Assistance for strengthening Public Transport System in the
Country’ to address the problems faced by Public Transport Institutions and to ensure
better transport mechanism which could provide world class passenger bus service across
the country. The objectives of the scheme were to provide financial assistance to the
States for use of latest technologies such as Global Positioning System (GPS)/Global
System of Mobile communication (GSM) based vehicle tracking system, computerised
reservation system, automatic fare collection system, electronic ticket vending machines,
32 MT=Metric Tonne 33Carrying capacity of trucks for sand, stone etc. for Sikkim (hilly region) 34Calculated at the chargeable rate of ₹ 3.66/MT/Km for minimum weight of 10 MT per trip and minimum distance 20
Kms.
Chapter II: Economic Sector
69
inter-modal fare integration and passenger information system for services covering inter-
city and mofussil35 areas and to provide financial assistance for preparation of total
mobility plan for the entire State. The scheme provided one time financial assistance to
States to the extent of 50 per cent of the project cost for IT related projects.
Based on the proposal for developing an Integrated Depot Management System (IDMS)
submitted (March 2013) by the SNT, the GoI sanctioned (March 2013) ₹ 4.52 crore for
the project on 50:50 cost sharing basis between the Centre and the State with stipulation
to complete the project within 16 months (July 2014). The project consisted of Depot
Computerisation (₹ 1.95 crore), Electronic Ticketing Machines (₹ 0.22 crore), Real Time
Passenger Information System (₹ 2.30 crore) and preparation of DPR (₹ 0.04 crore). In
addition, the GoI also sanctioned (March 2013 ) ₹ 1.99 crore towards annual
maintenance cost for the hardware and software components of the project for five years
in the funding pattern 50:50 between the Centre and the State.
Tenders were invited online (24 September 2013) through the State Government website
‘www.sikkimtenders.gov.in’ and also simultaneously published in the local and national
papers. The SNT awarded (27 January 2014) implementation of the project to the firm
M/s Aeon Software Pvt. Ltd. along with maintenance of the hardware and software
systems for a period of five years at the GoI sanctioned cost of ₹ 6.51 crore.
The following issues were observed in audit:
2.4.9.4.1 Delay in execution and re-scoping of project
The project (excluding maintenance) was to be completed within 365 days from the date
of award (by 26 January 2015) while the contract for maintenance was for the period
2015-20. The Department reported completion of the project in September 2015, after a
delay of seven months. The delay was due to delay in execution of the project by the
contractor and re-scoping of the project by the Department leading to failure in timely
delivery of targeted benefit of the project to the Department. Further, although the
component ‘Depot computerisation’ was reported as completed, numerous flaws were
observed in the software part of the component as highlighted in paras 2.4.9.4.4 (i, ii and
iii). The other two components of Electronic Ticketing Machines and Real Time
Passenger Information System (which included installation of GPS, Speakers and LED
signage) had only been partially implemented, as highlighted in para 2.4.9.4.3 below.
In March 2015, when the project was nearing completion, the Department realised that
there was a surplus of ₹ 1.05 crore funds resulting from savings on implementation of the
project. Considering the surplus, the Department moved (March 2015) a proposal for re-
scoping the project and took up four additional items36 of work which were not
contemplated in the original proposal and hence, not covered by the GoI/State
Government sanction. This constituted diversion of project funds of ₹ 1.05 crore without
obtaining approval of the GoI. This also indicated that the project requirement was
35Provincial or rural districts of India 36i) Creation of website with facilities for self-management at ₹ 3.75 lakh (ii) Implementation of cloud
based server hosting automated vehicle tracking software for private vehicles, luxury taxies and
Government vehicles at ₹ 60.20 lakh (iii) Construction of control room at ₹ 34.36 lakh and (iv) Payment
for user charges of Global Positioning System (GPS) sim cards (₹ 6.34 lakh).
Audit Report for the year ended 31 March 2017
70
inflated at the DPR stage by the CIRT leading to surplus funds of ₹ 1.05 crore leaving
scope for diversion of funds.
The SNT stated (October 2017) that the IDMS, launched as a pilot project, had enhanced
the efficiency of SNT. Some funds under the IDMS were re-scoped and fruitfully utilised
on important items of work which had not been contemplated under the project earlier
like construction of control room, monitoring of the SNT Undertaking vehicles, private
passenger carriers etc. using GPS system. These essential items had been left out
inadvertently at the DPR stage.
The reply was not tenable as the items of work carried out by the SNT after re-scoping of
the project were beyond the ambit of GoI sanction.
2.4.9.4.2 Shortcomings in implementation of physical infrastructure under the IDMS
The objectives of the IDMS scheme, inter alia, were to provide latest technological
solution such as Global Positioning System (GPS) based vehicle tracking system,
computerised reservation system, automatic fare collection system, electronic ticket
vending machines, and passenger information system. It also included preparation of total
mobility plan for the entire State. A number of shortcomings were observed in
implementation of the physical infrastructure of the IDMS as highlighted below:
Table 2.4.12
Details of items supplied under IDMS
Name of item
Quantity
ordered
and paid
for
Cost
(₹ in
lakh)
Quantity
actually
supplied
Short-
supply
No of items
Installed &
Functional
Non-
functional/idle
1 2 3 4 5 6 7
GPS machines 167 25.05 160 07 114 46
Electronic Ticket
Vending Machines 64 8.96 64 00 44 20
Speaker System 40 2.00 40 00 00 40
LED display panel
(signage) 40 62.08 40 00 22 18
The above items were supplied to the SNT and payment for the same was released to the
firm by March 2015. However, the exact dates of supply and period for which the items
remained non-functional could not be ascertained in audit.
While accepting the audit observation, the SNT stated (October 2017) that the
shortcomings noticed in the devices had been corrected while few of the non-functional
devices and machines were under repair.
2.4.9.4.3 Data Analytics and deficiencies in data management under the IDMS
As part of the audit planning process, analysis of data captured under the IDMS was
carried out using trial version of the software ‘Tableau reader’ with the objective of
identifying risk areas in the functioning of SNT. This included distance covered and trips
performed by the vehicles, trips performed and earnings by drivers, earnings from private
hired trucks/tankers and earnings from supervision charges. This also included entry/exit
Chapter II: Economic Sector
71
of vehicles in workshops etc. The analysis indicated risks related to utilisation of vehicles,
variation in earning between vehicles, performance of drivers, collection of supervision
charges, geographical reach of public bus service within the State, etc. Examination of the
identified risk areas in field audit, such as, low performing vehicles in terms of distance
run, trips performed and revenue earned; low performing drivers; entry/exit of vehicles in
workshops; collection of supervision charges etc. brought out inconsistencies and
inadequacies in the software developed for the IDMS. Besides, there were weakness in
input controls and data validation as detailed below:
(i) Input controls
For proper input control, information like SNT vehicles driver’s names, date of
entry/exit of vehicles in the workshops, journey destinations, etc. could have been pre-fed
in the system and accessed through drop down box in order to prevent incorrect entry of
data and to maintain data uniformity and accuracy. This was, however, not done and data
was being entered in an arbitrary manner. The registration numbers of vehicles (in case of
supervision charges collected at check-posts) were entered in any form - in capital letters,
small letters, alphabets and numerals in continuity or separated by slashes etc. Thus, even
a small variation in the spelling of the SNT driver’s name was treated as a different entry
by the system indicating deficiency in the input control of the software programme. The
arbitrary input and acceptance of data by the system made it impossible to extract details
of a particular vehicle, driver etc. in a single sheet, for analysis. Further, the details of the
entry and exit of vehicles in the workshop as maintained in the registers did not match
with similar data entered into the system. For instance, while workshop records indicated
that nine buses entered the workshop at Gangtok on 5 March 2016 for minor repairs, the
IDMS data captured entry of only five vehicles on the date. Similarly, as per records
maintained in the Jalipool workshop, three vehicles entered the workshop on 2 March
2017 for repairs, while the IDMS data reflected entry of five vehicles on the date. Out of
the five vehicles entered in the IDMS data, only two vehicles matched with the vehicles
entered in the workshop record.
The SNT buses hired by the Army for transportation of manpower were included in
the goods module and not in the passenger module. Hence, the details of journeys
performed by such buses was not recorded in passenger module. During April 2016, the
Army hired SNT buses on 179 occasions for which the details were captured in goods
module and not in the passenger module. A proper input control system would have
prevented this. Hence, the earning of transportation revenue, distance travelled, trips
performed, HSD issued, drivers deputed, etc. in respect of those buses were left out while
extracting consolidated details of the SNT buses from the IDMS.
The SNT owned trucks and tankers were hired by the Army, Border Roads
Organisation, Indian Oil Corporation (IOC), Bharat Petroleum Corporation Limited
(BPCL) and other organisations for carriage of goods and HSD from Siliguri to different
destinations within Sikkim and also between different locations within Sikkim at freight
charges fixed from time to time. The freight charges earned constituted Government
revenue and credited into the Government account. There was no scope for re-
Audit Report for the year ended 31 March 2017
72
imbursement of hire charges to private truck/tanker owners in this case as the vehicles
were owned by the SNT. However, the data entered in the system showed re-
imbursement of hire charges in six cases amounting to ₹ 1.68 lakh even in the case of
goods transported by SNT owned vehicles. This was a case of unnecessary insertion of
the field/column ‘reimbursement’ and erroneous entry of data in the field/column ‘re-
imbursement’, which was not necessary for SNT owned trucks.
The SNT stated (October 2017) that the deficiencies noticed under Input Control had
since been identified and rectified to avoid recurrence of such errors.
(ii) Mapping of requirement of SNT in the system
No fields had been created in the system to capture complete details of fleet under the
SNT such as year of manufacture, engine number, chassis number, seating capacity of
buses, laden and unladen weight, etc., which were essential for assessing performance of
the vehicles and to assist in decision making on fleet operation. Due to absence of
provision to capture basic information relating to individual vehicles, the age and other
unique details of SNT’s fleet could not be sourced from the IDMS.
For every trip a unique challan number was generated with details of vehicles, client,
load, distance etc. Audit noticed that there were double entries of details of the same trip
including challan number, date, driver, vehicle number, consignor, place of origin and
ending point, etc. for the same trip conducted by the truck/tanker on four occasions,
creating confusion in interpreting the data. This was a systemic deficiency indicating
absence of provision for mapping uniqueness of challan number in the system.
There was no provision in the IDMS to display the weights of vehicles measured in
the weighs-in-motion installed at the check-posts at Rangpo and Melli as the automatic
weighing system at the check-posts had not been integrated with the IDMS programme.
Huge quantities of goods like sand, stone, stone aggregates were transported within
the State on a daily basis for infrastructure development projects like construction of
roads, bridges, buildings, hydro-dams, tunnels etc. undertaken by various organisations
and contractors. During 2016-17, 1.51 crore cft of sand, stone, stone aggregates were
transported in the East district alone. However, no provision had been made in the IDMS
to capture details of goods carried within State by private transporters for the purpose of
collection of supervision charges.
The SNT stated (October 2017) that provision for recording details of SNT owned fleet in
the system had since been put in place and data entry of vehicular details was under
progress. Data validation of challan number with reference to trips performed had since
been done and the errors highlighted had been identified and since rectified. The scope of
the project did not include integration of IDMS and Weigh Bridge software while the
supervision on movement of sand, stones, etc. within the State was not applicable.
The SNT accepted the lapses relating to mapping its requirements in the IDMS and stated
that it would take corrective measures to rectify the errors. The reply regarding non-
applicability of supervision charges on movement of sand, stones, etc. within State, was
not tenable, as there was no notification/order of the Government exempting collection of
Chapter II: Economic Sector
73
supervision charges against movement of sand, stones, etc. within State. Further,
integration of the IDMS with the WIMs was essential to automatically capture details of
vehicles passing through the check-posts in the system. This would enable the SNT to
both monitor the functioning of the WIMs and keep a vigil on vehicles passing through
the check-posts.
(iii) Absence of validation control in IDMS
The data entered in the system should be validated with the actual facts and figures to
maintain authenticity. However, no such validation was conducted. As a result, the
following deficiencies were noticed:
The data fed in the IDMS relating to hire of trucks/tankers by SNT and leased out to
the army for transport of goods between Kupup, Tsangu, Gnathang, Sirhi, Surasoi, Thegu,
Yakla, etc. near the Nathula border depicted incorrect distance and quantity of goods
carried. All distances were shown as 1 Km and all quantities of goods as 1 MT by default,
irrespective of the actual distance travelled and the actual load carried. During 23 July
2016 to 6 October 2016, a total of 41 trips were performed by SNT trucks between the
different locations. Out of this, while the distance between Kupup and Gnathang, which
was 4 kms for which 4 journeys were performed could be ascertained, the distance in
respect of other journeys and the loads carried could not be ascertained in audit. In all the
above 41 cases, the distance travelled was shown as 1 Km and weights carried 1 MT.
Thus the correct distances covered and loads carried by the SNT’s trucks/tankers over
time could not be known from the available IDMS data.
The distance travelled by buses on a number of occasions was shown as ‘0’ on the
system although the vehicles were found to have travelled various distances. For instance,
distance from Gangtok to Pakyong, Ranka, Jalipool and Penlong was 32 Kms, 14 Kms,
16 Kms and 14 Kms respectively. However in case of three buses, distance travelled was
shown as ‘0’ against 317 trips performed by the vehicles during the period June 2014 to
March 2017.
The fuel issued to the SNT owned buses were shown as ‘0’ on several occasions in
the formats although all buses were issued fuel before undertaking journey. For example,
during the period June 2014 to March 2017, bus No SK01B0011 performed 236 trips in
terms of the IDMS data, but fuel issued in case of 116 trips was shown as ‘0’. Similarly,
out of 66 trips performed by bus No. SK01B0319, fuel issued in case of 20 trips was
shown as ‘0’. Therefore, the quantity of fuel consumed by SNT vehicles and the fuel
efficiency could not be assessed from data sourced from the IDMS.
In six cases, the earning by SNT from hire of private tankers was shown as ‘0’ in the
‘Earning Statement’ of private tankers. The discrepancy occurred due to posting of
identical amount in the ‘gross amount’ column (meant for entering amount collected by
SNT ) as well as in the ‘re-imbursement amount’ column. Since the two figures were
equal, the difference constituting net earning of SNT was shown as ‘0’. The system
should have rejected or questioned any entry of ‘gross amount’ which was equal to or less
than the ‘reimbursed’ amount.
Audit Report for the year ended 31 March 2017
74
Thus, due to poor input controls, inadequate mapping of requirements of the SNT in the
IDMS and absence of secondary data validation, the data captured in the IDMS was
inconsistent, incomplete and ridden with errors and could not be relied upon for further
analysis to comment on the performance of the SNT’s vehicles.
The SNT stated (October 2017) that in case of tippers carrying army consignments to
forward areas, the freight rate was calculated on trip basis on fixed rate and not on actual
weights and actual distance travelled. Hence, to record such trips, the parameter such as
1MT and 1 km were recorded in the system. All other deficiencies highlighted in the
audit observation were identified and rectified.
Audit observed that the SNT needed to ensure data entry of actual distance travelled by
the tippers even though the journeys performed were on ‘per trip’ basis. This will help
ensure recording of the total distances travelled by the SNT tippers during the course of
their life.
(iv) Absence of data security and exit strategy
As mentioned earlier (Para 2.4.9.4), the firm M/s Aeon Software Pvt. Ltd. had been
awarded contract for implementation of the IDMS project alongwith maintenance of the
hardware and software systems for a period of five years 2015-20. Audit noticed that the
central servers of the IDMS were kept at Mumbai. For storage of the IDMS data, cloud
storage facility was deployed by the firm (Aeon) by hiring services of a cloud service
provider (Netmagic). The firm (Aeon) therefore, administered the system and had
complete control over the IDMS data. Thus, there was no system in the SNT to prevent
the private agency (Aeon) from manipulation or misuse of the IDMS data. The SNT also
had not formulated any strategy for data storage, data management, data security and
continuity of business after conclusion of agreement and exit of the firm from business.
2.4.9.5 Monitoring and Supervision
Regular monitoring of functioning of various wings of the SNT by its top management
was a necessary part of the management’s responsibility with a view to ensure proper
functioning of the depots, booking offices, workshops, weighbridges, check-posts,
discharge of delegated duties by subordinate officers and staff and fulfilment of targets
set by the Department.
Audit observed the following inadequacies:
The SNT had not laid down mechanism for regular monitoring of various activities of
the Department. It could not provide copies of manuals, office orders, circulars,
notifications relating to establishment of monitoring mechanism and also copies of
reports and returns relating to monitoring of various activities of the Department.
The SNT had not maintained any Assets Register containing consolidated assets of
the Department like land, buildings, machinery, equipment, vehicles etc. In the absence of
such consolidated record, it was not clear how the SNT management monitored utilisation
of the assets and their upkeep and vigilance. The SNT had also not laid down any norm
for mandatory checking of its vehicles to ensure their fitness before undertaking journeys.
Chapter II: Economic Sector
75
The SNT had not established any mechanism to continuously monitor its functioning
and provide guidance to achieve its objectives. The SNT had also not established any
grievance redressal mechanism to address complaints/grievances from clients/passengers
using SNT services.
The GoI, while sanctioning (March 2013) the IDMS project, had specifically stressed
that the State Government should monitor implementation of the IDMS project through a
Monitoring Committee. Although the SNT constituted (May 2013) a monitoring
committee consisting of two members, one from FRED and the other from the
Information Technology Department, the SNT could not furnish any report on monitoring
of the IDMS project by the Committee. Negligence in monitoring the implementation of
the IDMS project resulted in delay in execution of the project besides failure to ensure
installation of GPS system, speaker system, LED signage, etc. in the vehicles. Inadequate
monitoring of the IDMS also resulted in absence of authentication of data entered at the
depots, workshops and check-posts resulting in non-uniform and incorrect entries which
rendered the data captured by the system unreliable.
The SNT stated (October 2017) that since the IDMS project was launched on trial basis,
certain errors were obvious. However, the errors were being taken care of. Further, the
monitoring of operations of the SNT was being done from the IDMS control room which
was being carried out in shifts.
The SNT however, did not comment on slackness of overall monitoring system in the
Department as indicated by non-existence of monitoring and grievance redressal
mechanism, absence of departmental code and manual, non-maintenance of assets
registers, etc.
2.4.10 Conclusion
The Sikkim Nationalised Transport (SNT) had not prepared a long term plan and strategy
keeping in perspective its mandate. As a result, no specific targets had been set for
various its functions. The SNT was unable to meet the huge demand of public transport in
the State despite its virtual monopoly within the State on public bus transport.
The SNT incurred huge recurring expenditure (₹ 213 crore) on salaries, allowances,
office expenses, repair and maintenance which constituted 97 per cent of the budgeted
expenditure, while only 3 per cent of the budgeted expenditure of ₹ 220.15 crore was
spent on creation of assets. Although, there was slump in revenue collection during 2013-
15, the SNT improved its earnings from 2015-16 onwards and made revenue collection of
₹ 48.76 crore in 2016-17.
Supervision charge, a non-transport revenue, which the SNT imposed on load carrying
private trucks/tankers crossing the border check-posts at Rangpo and Melli constituted
upto 57 per cent of the total revenue. The SNT was found lagging with regards to
weighing load carrying vehicles at the check posts for determining weight of load and
realising appropriate supervision charges. The weigh bridges installed at the check-posts
at substantial cost were mostly non-functional. Further, supervision charges were not
Audit Report for the year ended 31 March 2017
76
being collected from private trucks within the State carrying sand, stone, stone
aggregates, etc., leading to loss of revenue.
The Integrated Depot Management System, which was expected to contribute
substantially to improve operational efficiency of the Sikkim Nationalised Transport had
not delivered the desired result. There was no scope in the Integrated Depot
Management System to capture many vital data required for monitoring the functions of
the Sikkim Nationalised Transport by the top management. There were instances of
incorrect data feed due to absence of standardised mode of data entry and data
authentication. Reliability of available data in the system was therefore low.
2.4.11 Recommendations
The Government/Sikkim Nationalised Transport may consider the following
recommendations:
Laying down policy, vision, mission and road map for long term perspective plan
with a view to make operations of the Sikkim Nationalised Transport sustainable.
Initiate steps to improve fleet utilisation, vehicle productivity and enroute monitoring
of its buses to enhance traffic revenue from passenger bus service.
Initiate steps to establish a system for collecting supervision charges from private
goods carrying vehicles within the State.
Initiate steps to ensure Weighs-in-Motion (WIM) installed at the check-posts are
made functional round the clock by providing specialised and dedicated manpower
for monitoring and upkeep.
Institutionalise a mechanism for proper management of the Sikkim Nationalised
Transport’s operations by making Integrated Depot Management System reliable
through ensuring entry of all required data, standardisation of process of entering data
and ensuring data security and business continuity.
Institutionalise a system for fixing specific targets for various functional wings of the
Department and ensure achievement of targets by establishing a systematic and well
laid down monitoring mechanism.
2.5 Idling of feed mills and consequent non-production of fish feed
Delay in installation of power supply resulted in idling of Fish Feed Mills worth
₹ 1.16 crore for more than three years and led to non-production of fish feed of
₹ 12.00 crore.
The Directorate of Fisheries under Department of Animal Husbandry, Livestock,
Fisheries and Veterinary Services established two Automatic Floating/Sinking Fish Feed
ANIMAL HUSBANDRY, LIVESTOCK, FISHERIES AND
VETERINARY SERVICES DEPARTMENT
Chapter II: Economic Sector
77
Mills at Rangpo and Rothak with a production capacity of 100 to 150 kgs feed per hour
each for the development of Carp and Trout Fish Farm in the State. The project at Rangpo
was completed (December 2013) at the total cost of ₹ 0.58 crore which was funded by
National Fish Development Board (NFDB) and the project at Rothak was completed
(February 2015) at the total cost of ₹ 0.58 crore funded by Rastriya Krishi Vikash Yojana
(RKVY). The machinery/equipment of both the Fish Feed Mills were automatic and
required power connection for operation. However, the provision for electrification
services was not included in the estimate prepared. Instead, the Directorate requested
(March 2014) the Energy and Power Department for electrical connection of 100 KW at
the Feed Mills which was not provided as of March 2017. Despite completion of the
projects at a cost of ₹ 1.16 crore, the feed mills at Rangpo and Rohtak could not be
operationalised and remained idle for 36 months and 24 months respectively due to delay
in obtaining power supply. This also led to non-production of minimum 600 tons of fish
feed worth ₹ 12.00 crore37 during the period from April 2014 to March 2017.
The Department stated (August 2017) that funds for electrification had since been made
available with electrification expected to be completed within September 2017 and that
the mills would be operational by the end of the year. However, the fact remained that
due to idling of the mills, the Department failed to produce fish feed worth ₹ 12 crore.
2.6 Irregular expenditure
Setting up of a new bio-fertiliser production unit at a cost of ₹ 1.29 crore at the
same site of an existing unit whose products the Department was unable to utilise
was unwarranted. This was also irregular as the approval from the national
mission for sustainable agriculture was for state of art bio-pesticide unit and not
for bio-fertiliser unit.
The Food Security and Agriculture Development Department established (2008) one Bio-
fertiliser Production Unit at Mazitar Farm, East Sikkim at a cost of ₹ 0.61 crore with an
annual production capacity of 150 MTs and with further scope of augmenting the
capacity under financial assistance from NEC (90 per cent grant and 10 per cent loan).
The objective was to produce bio-fertilisers using local strains and to make this input
easily accessible to the farmer. The Department’s initial effort to operate the unit by
providing training to two Village Level Workers did not work as qualified technical
expert/Micro-biologist was required for running the plant and marketing additional
products after meeting the State’s requirement became difficult.
37 Taking into account production capacity 100 kgs per hour (minimum), production cycle of 150 days per
year, production hour per day 8 hours and rate of feed ₹ 200 per kg (lowest rate of SIMFED). (Therefore
100 kg x 450 days x 8 hours = 360000 kg @ ₹ 200 per kg = ₹ 7.20 crore for Rangpo Mill) + (100 kg x 300
days x 8 hours = 240000 kg @ ₹ 200 per kg = ₹ 4.80 crore for Rothak Mill): Total ₹ 12.00 crore.
(Calculation based on production cycles provided by the Directorate to the NFDB while sending proposal.)
FOOD SECURITY AND AGRICULTURE
DEVELOPMENT DEPARTMENT
Audit Report for the year ended 31 March 2017
78
In order to make this unit viable and to make the products available within the State, the
Department proposed to lease it out (November 2011) to the International Panaacca Ltd,
New Delhi for a period of 15 years based on the highest lease rent of ₹ 10.06 lakh per
annum offered by the Company. However, this did not materialise as the rate of the
finished product fixed by the Department was not acceptable to the Company. The
Department thereafter called for fresh tender (May 2012) and on the basis of highest lease
rent of ₹ 18 lakh per annum, the Unit was leased out to M/s Balaji Crop Care Private Ltd
(BCCPL) for 15 years. However, after completion of 16 months of the lease period,
BCCPL intimated (18 September 2013) that the Department had not placed any order for
supply of bio-fertilisers/bio agri inputs although the company had manufactured 15 MT of
nutria pack organic manure. BCCPL also assured for payment of second year lease rent of
₹ 18.00 lakh after the supply starts. Despite the assurance by the BCCPL, the Department
unilaterally cancelled (October 2013) the extension of lease to BCCPL and again called
for fresh tender (February 2014) and bio-fertiliser unit was leased out to Vandeep Green
Globe Ventures Pvt. Ltd, Hyderabad at the highest lease rent of ₹ 9.00 lakh per annum for
5 years. The MOU was accordingly signed (16 October 2014) between the Company and
State Government.
Audit noticed that instead of placing the indents for demand of bio-fertiliser/bio-agri
inputs to BCCPL which had the stock of 15 MT of nutria pack organic manure, the
Department procured the same from SIMFED for ₹ 2.92 crore (September 2013 to March
2014) without any recorded reason.
Besides, the Department established (February 2016) another new bio-fertiliser
production unit at the same place (Mazitar) with an installed capacity of 150 tonnes per
annum incurring an expenditure of ₹ 1.29 crore (equipment: ₹ 1.00 crore and
construction: ₹ 0.29 crore) from the National Mission for Sustainable Agriculture
(NMSA), a 100 per cent CSS meant for setting up of a State of art liquid bio-pesticide
unit.
Further, it was noticed that under Rastriya Krishi Vikas Yojana (RKVY), the Department
took approval from GoI for establishment of bio-fertiliser and bio-pesticides production
unit and obtained sanction of ₹ 1.62 crore in 2015-16. However, work had not started
(December 2016) due to non-finalisation of land.
Expenditure of ₹ 1.29 crore for establishment of bio-fertiliser unit from NMSA fund was
irregular as the NMSA’s approval was for establishment of a ‘State of art bio-pesticide
unit’ and not a bio-fertiliser unit. Besides setting up of a new bio-fertiliser unit rather than
utilising/maintaining the existing production unit and instead procuring bio-fertiliser from
SIMFED for ₹ 2.92 crore was unwarranted.
The Department stated (December 2017) that (i) the lease with BCCPL was cancelled as
the Company failed to pay lease amount even after grace period of several months; (ii)
the 15 MT nutria produced by the company was not indented as they were nearing expiry
(being produced in early 2012-13) and constituted only a fraction of the Department’s
total requirement; (iii) the Department had to establish another unit in 2016 as most of the
equipment of the old unit had become obsolete and equipment for liquid bio-fertiliser and
Chapter II: Economic Sector
79
liquid bio-pesticide units were similar with production depending on raw materials only;
and (iv) the third unit was proposed to cater to South and West districts and production
from all the three units was not sufficient to meet the entire State’s requirement (over 600
MT).
However, the fact remained that the old unit was not put to any productive use by the
Department resulting in the Department procuring bio-fertiliser from SIMFED instead of
procuring the same through the bio-fertiliser unit.
2.7 Avoidable payment
Delay in execution/completion of work due to prolonged tendering process and
belated action for obtaining statutory clearances for encumbrance free land and
shifting of power and electrical utilities led to avoidable payment of cost escalation
of ₹ 1.40 crore.
The Ministry of Development of North Eastern Region sanctioned (18 August 2011)
“Widening, reconstruction and upgradation of State Highway from Manpur to Nayabazar
(Sk-01) and Nayabazar to Namchi (Sk-02) roads (29.2 km)” at a cost of ₹ 95.39 crore
(Centre: ₹ 89.01 crore and State: ₹ 6.38 crore) under Asian Development Bank (ADB)
assisted ‘North Eastern State Roads Investment Programme (NESRIP)’. The GoI entered
into Loan Agreement with the ADB on 9 July 2012 for funding of the project as per
which the State Level Executing Agency (SEA) was to obtain all necessary statutory
clearances such as environmental clearances, forest clearances and No Objection
Certificate (NOC) from the relevant State and Central level agencies prior to commencing
any civil work.
The Project Director, Project Implementing Unit, NESRIP, Sikkim under the Roads and
Bridges Department tendered (11 December 2011) the civil work (₹ 62.92 crore). The
work was awarded (15 September 2012) to M/s BVSR Construction Pvt. Ltd., Hyderabad
at a contract price of ₹ 69.68 crore to be completed within 18 months. The work
commenced on 28 March 2013 and was to be completed by September 2014. However,
the contract was initially extended till 19 May 2016 for 20 months and proposal for
further extension till 26 June 2018 was forwarded to Ministry. As of July 2017, ₹ 28.72
crore had been paid to the contractor. As per the contract, the amount payable to the
contractor was to be adjusted in respect of rise or fall in the indexed cost of labour,
contractor’s plants and equipment, material and other inputs to the works by addition or
subtraction.
Though work was scheduled for completion by 28 September 2014, the financial and
physical progress as of March 2017 was only 44 and 48 per cent respectively and it was
expected to complete by June 2018, i.e. more than 3½ years beyond schedule.
Due to this delay, ₹ 2.47 crore was paid towards cost escalation due to rise in various
costs till October 2016 as per conditions of contract. This included ₹ 1.40 crore for
ROADS AND BRIDGES DEPARTMENT
Audit Report for the year ended 31 March 2017
80
escalation cost relating to period from October 2014 to October 2016, i.e. after scheduled
completion date of September 2014. The cost escalation of ₹ 1.40 crore could have been
avoided had the Department completed the work within the scheduled date. Scrutiny of
records revealed (June 2017) that the delay was due to belated action by Department at
various stages as stated below:
(a) Commencement of work: Though project was sanctioned in August 2011, tender was
floated only in December 2011 and work awarded nine months later (September 2012).
The work finally commenced in March 2013, after 19 months of sanction of the project.
The delay in awarding and commencement of project was due to delayed evaluation of
bids (July 2012) and subsequent delay in obtaining Cabinet approval (August 2012).
(b) Providing encumbrance free land: The Department requested the Energy and Power
Department (EPD) for shifting of electrical utilities existing along the project areas only
in October 2012 for which fund of ₹ 224.95 lakh was transferred to the EPD during
March 2013 to September 201538. Similarly, request to Water Security and Public Health
Engineering Department for shifting of water utilities was made only in October 2012 and
fund transferred during April 2013 to October 201539. Thus, the Department could
handover only 33 per cent40 of encumbrance free land for road length of Section SK-02 to
the contractor before the scheduled completion date.
(c) Environmental clearance: Though Department obtained in-principle approval for
diversion of forest land measuring 3.636 hectare during 2008, final approval was obtained
after award of work only in July - November 2012. Also while request for felling of trees
was made to the Forest, Environment and Wildlife Management Department in
September 2015 and fund transferred during November 2015 to January 201741, the
approval for felling of trees was obtained only in December 2016 and marking orders
issued in January 2017. Approval for Environment clearance, the process for which was
initiated in May 2013, was obtained only in May 2014.
Thus, the Department did not adhere to the provision of the loan agreement and initiated
the tendering/execution of the works without obtaining all the statutory clearances, which
could not be provided even after lapse of the original scheduled completion date leading
to delay in completion of work. This not only resulted in avoidable payment of cost
escalation of ₹ 1.40 crore42 (October 2014 to October 2016), but also caused disruption in
road connectivity.
The Department in an initial reply accepted (February 2017) that there was delay on its
part to handover the encumbrance free land to the contractor due to environmental
clearance, shifting of utility, etc. However, it did not respond on cost escalation of the
project.
38 March 2013: ₹ 50 lakh; July 2013: ₹ 25 lakh; January 2014: ₹ 5 lakh; September 2014: ₹ 20 lakh and September 2015: ₹ 124.95 lakh 39 March 2013: ₹ 15 lakh; March 2014: ₹ 20 lakh and October 2015: ₹ 65.06 lakh 40 As ascertained from Contractor’s correspondence with the Project Director (ADB Projects) 41 November 2015: ₹ 67.15 lakh and January 2017: ₹ 11.41 lakh. 42 Total Escalation paid upto Interim Payment Certificate VIII: ₹ 2,46,69,355
Escalation paid upto scheduled date of completion (27 September 2014) : ₹ 1,06,81,302
Escalation paid after scheduled date of completion: ₹ 1,39,88,053
Chapter II: Economic Sector
81
The matter was reported to the Department (July 2017); reply was awaited (March 2018).
2.8 Avoidable liability
Failure to exercise due diligence by the Roads and Bridges Department in
executing the deposit work led to abandonment of project by user agency and
consequent unwarranted burden of ₹ 24.58 crore on the State exchequer.
The Sikkim Public Works Manual 2009 (SPWM), inter alia, envisaged levy of 9 per cent
establishment charge and other departmental charges as applicable on Deposit works
which was to be recovered in advance43 from the user agency. Further, the agency on
whose behalf the work was done was to be made to understand that the Department does
not bind itself to complete the work within the amount of estimate and that the agency
agrees to finance any excess that may occur. The transfer of funds or deposits should be
realised before any liability is incurred on account of the work44. Estimate for road works
should invariably include ‘No Objection Certificate’ from the landowners45, and before
approval of Notice Inviting Tender (NIT), availability of site and funds should be
ensured46.
Himagiri Hydro Energy Private Limited (HHEPL), a private hydropower project
developer involved in development of the Panan hydropower project in North Sikkim
approached (February 2009) Roads and Bridges Department (RBD) with a proposal for
improvement/upgradation of the road from Sankalang Bridge to Lingzya village in North
Sikkim which included widening/upgradation of existing road (10 Km) and construction
of two bridges en-route. The project was to be undertaken as a deposit work with 100 per
cent funding from HHEPL. After working out (May 2009) the project cost at ₹ 14.96
crore47 and floating NIT (July 2009), the RBD entered into a Memorandum of
Understanding (MOU) with HHEPL on 5 October 2009.
In terms of the MOU, the HHEPL entrusted the work to RBD to be completed within one
and half year from date of award of work at a total cost of ₹ 15.65 crore (including the
tender premium). The MOU, inter alia, envisaged the following:
The cost of work was all inclusive and any upward revision was not allowed. The
entire cost of works would be met from the total amount provided for the works in the
MOU (unless there was a natural calamity).
The RBD would insure both the bridges and the road during the construction stage as
well as after commissioning against all possible risks.
Work order for the civil portion of the project was issued (14 October 2009) to the lowest
bidder (S. K. Agarwal) at a value of ₹ 13.16 crore at 20 per cent tender premium with
completion within 18 months i.e. by April 2011.
43 SPWM Clauses 35.4 & 35.7. 44 SPWM clause 35.9 45 SPWM Clause 4.12(i) 46 SPWM clause 10.4 47 Improvement/widening of road ₹ 8.36 crore & Construction of two bridges ₹ 6.60 crore.
Audit Report for the year ended 31 March 2017
82
The contractor stopped work in August 2013 due to failure of the Department to make the
site available and non-payment of bills. The Department could only obtain forest
clearance and clearance from private land owners more than two and half years after issue
of work order, much after the stipulated completion period. In April 2015, the contractor
issued legal notice to the Department to clear his dues with cost escalation of 7.5 per cent
besides compensation of ₹ 50 lakh towards cost incurred on idle labour, plant and
machinery. HHEPL on its part stopped releasing funds to the Department after initial
release of ₹ 6.33 crore from October 2010 to March 2013 on the grounds of tardy
progress of work and failure to obtain timely insurance of roads/bridges by the
Department.
In December 2015, the Department moved a proposal for revision of estimate of the
project citing non-inclusion of sufficient quantities of hill cutting works, protective walls,
drainage works, pavement works, absence of provision of launching of two steel bridges
in the original estimate and cost escalation of 7.5 per cent per annum over a six-year
period (2009-16). The project cost was accordingly revised from ₹ 15.65 crore to ₹ 30.91
crore. Audit, however, noticed that all the items of works which were revised were
foreseeable and could have been included in the original estimate itself had due diligence
been exercised at the time of framing the original DPR.
Since the Department failed to obtain further funds from the HHEPL, it was decided
(March 2016) to take up the work under State plan through the same contractor. As of
March 2017, the Department had incurred ₹ 13.54 crore on the project.
Thus, absence of due diligence in framing the estimate and inordinate delay in making the
site available led to unwarranted burden of ₹ 24.58 crore on the State Plan due to upward
revision of project cost and unwarranted cost escalation of over ₹ 5.64 crore.
The matter was reported to the Department (August 2017); reply was awaited (March
2018).
2.9 Excess payment
There was excess payment of (i) ₹ 0.60 crore to the contractor on haulage charge
of non-stock material and (ii) ₹ 0.64 crore towards labour on resizing and carriage
of stones beyond requirement despite availability of stone at the work site.
A) Payment towards haulage charges
Pradhan Mantri Gram Sadak Yojana (PMGSY) works were executed based on State
Schedule of Rates (SoR). One of the components under carriage of non-stock material
paid for carriage of stone and sand, was haulage charges. The SoR had various rates for
haulage depending on types of works. Some rates were for per cubic meter and some
were for per ton of non-stock material. Haulage was calculated by multiplying the
quantity of non-stock material, distance transported from the quarry to work site and
RURAL MANAGEMENT AND DEVELOPMENT
DEPARTMENT
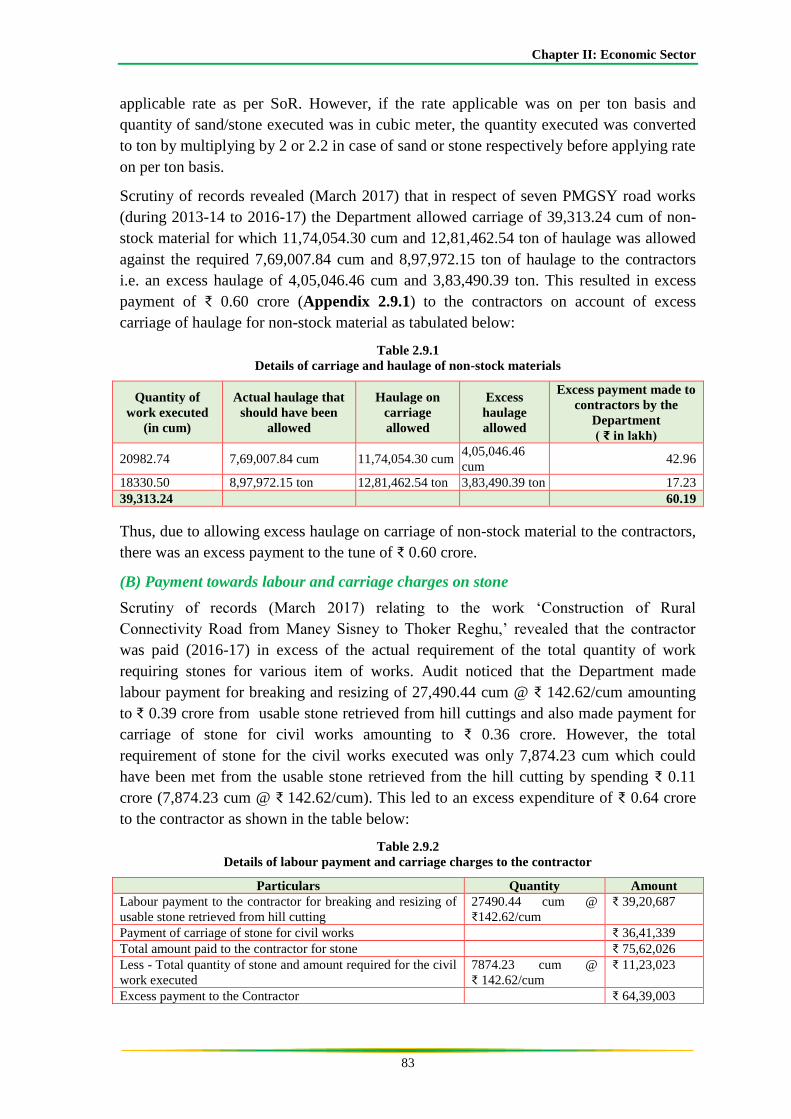
Chapter II: Economic Sector
83
applicable rate as per SoR. However, if the rate applicable was on per ton basis and
quantity of sand/stone executed was in cubic meter, the quantity executed was converted
to ton by multiplying by 2 or 2.2 in case of sand or stone respectively before applying rate
on per ton basis.
Scrutiny of records revealed (March 2017) that in respect of seven PMGSY road works
(during 2013-14 to 2016-17) the Department allowed carriage of 39,313.24 cum of non-
stock material for which 11,74,054.30 cum and 12,81,462.54 ton of haulage was allowed
against the required 7,69,007.84 cum and 8,97,972.15 ton of haulage to the contractors
i.e. an excess haulage of 4,05,046.46 cum and 3,83,490.39 ton. This resulted in excess
payment of ₹ 0.60 crore (Appendix 2.9.1) to the contractors on account of excess
carriage of haulage for non-stock material as tabulated below:
Table 2.9.1
Details of carriage and haulage of non-stock materials
Quantity of
work executed
(in cum)
Actual haulage that
should have been
allowed
Haulage on
carriage
allowed
Excess
haulage
allowed
Excess payment made to
contractors by the
Department
( ₹ in lakh)
20982.74 7,69,007.84 cum 11,74,054.30 cum 4,05,046.46
cum 42.96
18330.50 8,97,972.15 ton 12,81,462.54 ton 3,83,490.39 ton 17.23
39,313.24
60.19
Thus, due to allowing excess haulage on carriage of non-stock material to the contractors,
there was an excess payment to the tune of ₹ 0.60 crore.
(B) Payment towards labour and carriage charges on stone
Scrutiny of records (March 2017) relating to the work ‘Construction of Rural
Connectivity Road from Maney Sisney to Thoker Reghu,’ revealed that the contractor
was paid (2016-17) in excess of the actual requirement of the total quantity of work
requiring stones for various item of works. Audit noticed that the Department made
labour payment for breaking and resizing of 27,490.44 cum @ ₹ 142.62/cum amounting
to ₹ 0.39 crore from usable stone retrieved from hill cuttings and also made payment for
carriage of stone for civil works amounting to ₹ 0.36 crore. However, the total
requirement of stone for the civil works executed was only 7,874.23 cum which could
have been met from the usable stone retrieved from the hill cutting by spending ₹ 0.11
crore (7,874.23 cum @ ₹ 142.62/cum). This led to an excess expenditure of ₹ 0.64 crore
to the contractor as shown in the table below:
Table 2.9.2
Details of labour payment and carriage charges to the contractor
Particulars Quantity Amount
Labour payment to the contractor for breaking and resizing of
usable stone retrieved from hill cutting
27490.44 cum @
₹142.62/cum
₹ 39,20,687
Payment of carriage of stone for civil works ₹ 36,41,339
Total amount paid to the contractor for stone ₹ 75,62,026
Less - Total quantity of stone and amount required for the civil
work executed
7874.23 cum @
₹ 142.62/cum
₹ 11,23,023
Excess payment to the Contractor ₹ 64,39,003
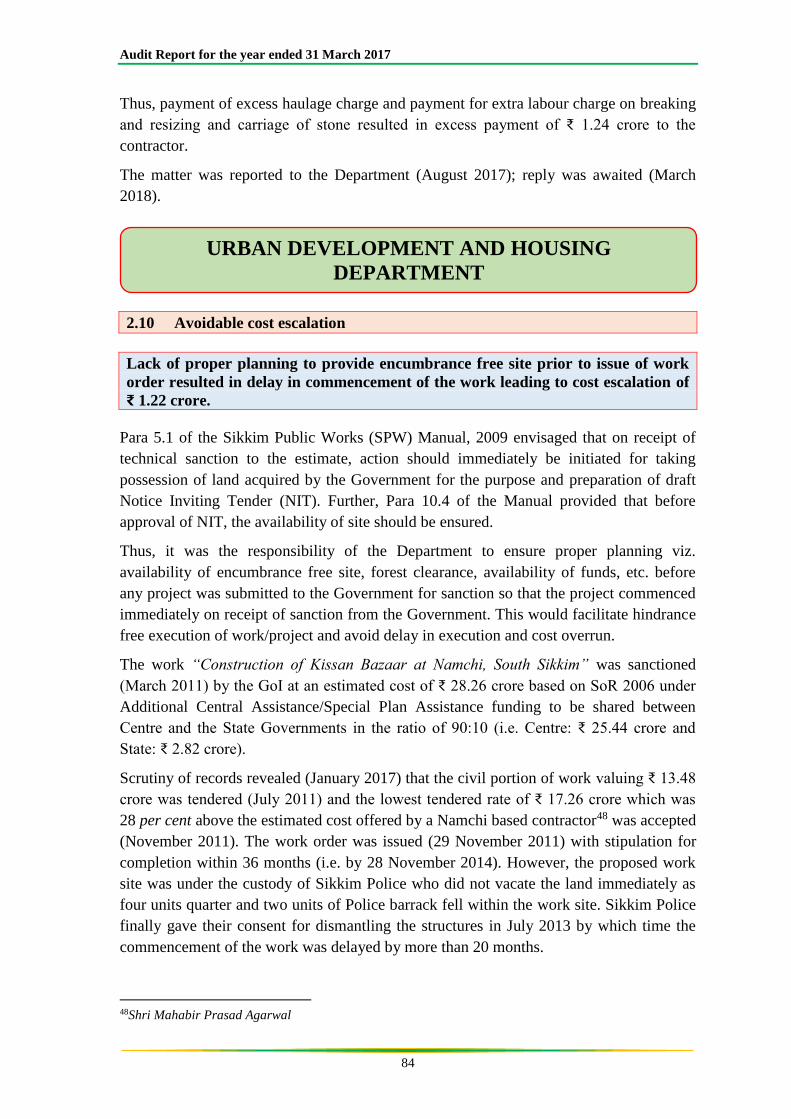
Audit Report for the year ended 31 March 2017
84
Thus, payment of excess haulage charge and payment for extra labour charge on breaking
and resizing and carriage of stone resulted in excess payment of ₹ 1.24 crore to the
contractor.
The matter was reported to the Department (August 2017); reply was awaited (March
2018).
2.10 Avoidable cost escalation
Lack of proper planning to provide encumbrance free site prior to issue of work
order resulted in delay in commencement of the work leading to cost escalation of
₹ 1.22 crore.
Para 5.1 of the Sikkim Public Works (SPW) Manual, 2009 envisaged that on receipt of
technical sanction to the estimate, action should immediately be initiated for taking
possession of land acquired by the Government for the purpose and preparation of draft
Notice Inviting Tender (NIT). Further, Para 10.4 of the Manual provided that before
approval of NIT, the availability of site should be ensured.
Thus, it was the responsibility of the Department to ensure proper planning viz.
availability of encumbrance free site, forest clearance, availability of funds, etc. before
any project was submitted to the Government for sanction so that the project commenced
immediately on receipt of sanction from the Government. This would facilitate hindrance
free execution of work/project and avoid delay in execution and cost overrun.
The work “Construction of Kissan Bazaar at Namchi, South Sikkim” was sanctioned
(March 2011) by the GoI at an estimated cost of ₹ 28.26 crore based on SoR 2006 under
Additional Central Assistance/Special Plan Assistance funding to be shared between
Centre and the State Governments in the ratio of 90:10 (i.e. Centre: ₹ 25.44 crore and
State: ₹ 2.82 crore).
Scrutiny of records revealed (January 2017) that the civil portion of work valuing ₹ 13.48
crore was tendered (July 2011) and the lowest tendered rate of ₹ 17.26 crore which was
28 per cent above the estimated cost offered by a Namchi based contractor48 was accepted
(November 2011). The work order was issued (29 November 2011) with stipulation for
completion within 36 months (i.e. by 28 November 2014). However, the proposed work
site was under the custody of Sikkim Police who did not vacate the land immediately as
four units quarter and two units of Police barrack fell within the work site. Sikkim Police
finally gave their consent for dismantling the structures in July 2013 by which time the
commencement of the work was delayed by more than 20 months.
48Shri Mahabir Prasad Agarwal
URBAN DEVELOPMENT AND HOUSING
DEPARTMENT
Chapter II: Economic Sector
85
Citing the delay in the commencement of the work due to non-providing of encumbrance
free work site, the contractor demanded (April 2013) for grant of differential cost of stock
material and labour due to hike in market rate during the intervening period of November
2011 (date of issue of work order) to July 2013, which was accepted (September 2013) by
the Department. The differential cost was worked out to ₹ 1.22 crore. Accordingly a
revised work order of value of ₹ 18.48 crore (₹ 17.26 crore plus ₹ 1.22 crore) was issued
(1 October 2013) with stipulation for completion within October 2016 (36 months).
However, as of May 2017, the project was under execution with physical and financial
progress of the work at 75 per cent and 60 per cent respectively. Work valuing ₹ 11.29
crore was completed till March 2017 against which payment of ₹ 11.09 crore49 was made
(20 March 2017) inclusive of differential cost amounting to ₹ 74.39 lakh.
Thus, lack of proper planning by the Department to provide encumbrance free site to the
contractor before issue of work order, led to extra cost of ₹ 1.22 crore in construction of
Kissan Bazaar at Namchi, out of which, ₹ 74.39 lakh was already spent till March 2017.
Besides, non-completion of the project despite extension of stipulated completion date by
two years (from November 2014 to October 2016) also denied the kissan (farmers) of the
locality of timely benefit from the project.
The Department accepted the observation and stated (January 2017) that Sikkim Police
took considerable time in relocating the Police Station and other infrastructures to a
suitable location. It further added that it had to consider the claim of the contractor due to
delay in providing hindrance free site to the contractor. Thus, lack of proper planning to
ensure acquisition of land before floating of NIT resulted in delay in commencement of
the work for more than 20 months.
2.11 Avoidable expenditure
Failure to award the declaration under Section 11 of the Land Acquisition Act,
1894 due to absence of budgetary provision for land acquisition and subsequent
revision of compensation resulted in avoidable committed liability of ₹ 23.73 crore.
Land Revenue and Disaster Management Department (LRDMD) was responsible for
acquisition of land required by Government departments for implementation of various
projects/schemes as well as land required by other agencies. While acquiring land from
the public, the LRDMD applied two different methodologies for determination of rates
for land compensation depending upon the landowner’s willingness or otherwise. Where
the landowner was willing to sell, the rate notified by the Government (LRDMD) from
time to time based on the agriculture productivity was applied. In the event of the
landowner not willing to sell the land, acquisition was effected after determining the
prevailing market rate in terms of Section 23 of the Land Acquisition (LA) Act, 1894. In
such an event of compulsory acquisition, the landowner was entitled to a sum of 30 per
cent of market value of land as solatium in addition to market value of land as incentive.
49₹ 9.22 crore (7th RA bill vide Vr. No. 13 dated 28.12.2016 + ₹ 1.87 crore i.e. Adhoc payment on 8th RA bill
vide Vr. No. 06 dated 20.03.2017)
Audit Report for the year ended 31 March 2017
86
The Government of India (GoI) implemented The Right to Fair Compensation and
Transparency in Land Acquisition, Rehabilitation and Resettlement (RFCTLRR) Act,
2013 with effect from 27 September 2013 repealing the LA Act, 1894. According to Sub-
Para (a) of Para 24(1) of the Act (2013), in any case of land acquisition, proceedings
initiated under the LA Act, 1894, where no award under Section 1150 of the said Act had
been made, all provision of the Act (2013) relating to the determination of compensation
shall apply. Further, Para 30(1) of the new Act provided for payment of solatium
equivalent to one hundred per cent of the compensation amount against 30 per cent
provided in the LA Act, 1894. The State Government implemented the Act of 2013 in the
State with the publication (13 October 2015) of The Right to Fair Compensation and
Transparency in Land Acquisition, Rehabilitation and Resettlement (Sikkim) Rules, 2015.
Urban Development and Housing Department’s proposal to acquire land belonging to two
landowners measuring 1.7258 hectare at Rangpo for the purpose of Basic Service for
Urban Poor project and creation of Town Hall/Amusement Park was approved by the
Government in March 2011. Assessment of land compensation of ₹ 5.22 crore51 was
forwarded (October 2012) by the LRDMD to the Department with the request to release
₹ 4.02 crore (80 per cent) for disbursement to the landowners. Audit noticed that despite
having the land acquisition proposal approved (March 2011), the Department had not
made any provision for it in its budget till 2014-15. Hence, it transferred ₹ 3.92 crore to
LRDMD in October 2013 with loan from State Bank of India (SBI CAP Loan) leaving a
balance of ₹ 1.30 crore. The Department proposed for allocation of fund for
compensation in its supplementary budget in September 2014 but no funds were
provided.
While the Department failed to release the balance payment of compensation of ₹ 1.30
crore, the landowners through legal notice (12 August 2014) requested the Department
for revision of compensation as per RFCTLRR Act, 2013 along with interest and
immediate release of compensation. Considering the landowners’ request, the LRDMD
forwarded revised assessment of compensation of ₹ 4.62 crore in September 2016 to the
Department by adding 12 per cent interest on balance payment of ₹ 1.30 crore till July
2015 and increased the solatium from the original 30 per cent to 100 per cent in
accordance with RFCTLRR Act, 2013. Dissatisfied with the revised compensation and
also due to non-release of compensation by the Department, the land owners again
requested (8 June 2016) for revision of land compensation. As the award under Section
11 of the LA Act, 1894 was pending till implementation of the RFCTLRR Act, 2013, the
LRDMD revised (June 2017) the compensation to ₹ 28.84 crore (land compensation:
₹ 24.64 crore @ ₹ 663.19 per sq. ft. and interest on delayed payment: ₹ 4.20 crore)
excluding ₹ 0.99 crore towards establishment charges.
50 Section 11 of LA Act, 1894 provides for the Collector to make an award of true area of land to be
acquisitioned, compensation to be allowed and apportionment of such compensation among persons
believed to be interested in the land after making inquiry into the objection (if any) which any person
interested has stated. 51 Cost of land @ ₹ 208/sft for 1.7258 hectare: ₹ 3,86,39,144 + 30 % Solatium: ₹ 1,15,91,743 +
Contingent/Establishment charges @ 4 %: ₹ 20,09,235 + Capitalised value of LR: ₹ 346 = ₹ 5,22,40,468.
Chapter II: Economic Sector
87
Thus, delay in release of balance compensation of ₹ 1.30 crore resulted in additional
burden to the State exchequer of ₹ 23.62 crore (₹ 28.84 crore – ₹ 5.22 crore excluding
contingency charge). As of June 2017, the Department had released ₹ 5.11 crore (October
2013: ₹ 3.92 crore and September 2016: ₹ 1.19 crore) leaving a balance of ₹ 23.73 crore.
Thus, the Department acquired land without ensuring funds and did not propose/provide
necessary funds in the budget. Despite invoking (May 2012) compulsory clause under
Section 23 of LA Act, 1894, there was inordinate delay in declaration of award under
Section 11 of the LA Act, 1894 resulting in avoidable committed liability of ₹ 23.73
crore on account of revision of land compensation as per RFCTLRR Act, 2013. Besides,
this also led to blockade of Government fund of ₹ 3.92 crore for more than three and half
years as creation of Town Hall and Amusement Park had not been started.
In an interim reply, the Department stated (January 2017) that 75 per cent of the cost was
already paid to the landowners from the funds available from the SBI CAP loan
component. The balance amount was requested every year to the Government during
annual budget and the supplementary demand for grants. However, no funds were
provided. The fact however, remained that the Department could have paid the balance of
₹ 1.30 crore out of funds (₹ 3.57 crore) transferred to the LRDMD for payment of
compensation to other areas (Majwa, Rangpo and Tadong blocks) which were lying idle
(February 2013) with the LRDMD (District Collector, East) due to de-acquisition.
Responsibility for inordinate delay in payment causing extra financial burden of ₹ 23.62
crore may be fixed. The angle of collusion of officials of LRDMD with land owner to
extend financial benefits for personal gains may also be investigated.
The matter was reported to the Department (August 2017); reply was awaited (March
2018).
Related Documents


