6-1 CHAPTER 6 Inventories ASSIGNMENT CLASSIFICATION TABLE Study Objectives Questions Brief Exercises Exercises A Problems B Problems 1. Describe the steps in determining inventory quantities. 1, 2, 3, 4, 5 1 1, 2 1A 1B 2. Explain the accounting for inventories and apply the inventory cost flow methods. 5, 7, 8, 9, 10, 2, 3, 4 3, 4, 5, 6, 7, 8 2A, 3A, 4A, 5A, 6A, 7A 2B, 3B, 4B, 5B, 6B, 7B 3. Explain the financial effects of the inventory cost flow assumptions. 6, 11, 12 5, 6 3, 6, 7, 8 2A, 3A, 4A, 5A, 6A, 7A 2B, 3B, 4B, 5B, 6B, 7B 4. Explain the lower-of- cost-or-market basis of accounting for inventories. 13, 14, 15 7 9, 10 5. Indicate the effects of inventory errors on the financial statements. 16 8 11, 12 6. Compute and interpret the inventory turnover ratio. 17, 18 9 13, 14 *7. Apply the inventory cost flow methods to perpetual inventory records. 19, 20 10 15, 16, 17 8A, 9A 8B, 9B *8. Describe the two methods of estimating inventories. 21, 22, 23, 24 11, 12 18, 19, 20 10A, 11A 10B, 11B *Note: All asterisked Questions, Exercises, and Problems relate to material contained in the appendices to the chapter.

Welcome message from author
This document is posted to help you gain knowledge. Please leave a comment to let me know what you think about it! Share it to your friends and learn new things together.
Transcript
6-1
CHAPTER 6Inventories
ASSIGNMENT CLASSIFICATION TABLE
Study Objectives QuestionsBrief
Exercises ExercisesA
ProblemsB
Problems
1. Describe the steps indetermining inventoryquantities.
1, 2, 3,4, 5
1 1, 2 1A 1B
2. Explain the accountingfor inventories and applythe inventory cost flowmethods.
5, 7, 8,9, 10,
2, 3, 4 3, 4, 5,6, 7, 8
2A, 3A, 4A,5A, 6A, 7A
2B, 3B, 4B,5B, 6B, 7B
3. Explain the financialeffects of the inventorycost flow assumptions.
6, 11, 12 5, 6 3, 6, 7, 8 2A, 3A, 4A,5A, 6A, 7A
2B, 3B, 4B,5B, 6B, 7B
4. Explain the lower-of-cost-or-market basis ofaccounting for inventories.
13, 14, 15 7 9, 10
5. Indicate the effects ofinventory errors on thefinancial statements.
16 8 11, 12
6. Compute and interpretthe inventory turnoverratio.
17, 18 9 13, 14
*7. Apply the inventory costflow methods to perpetualinventory records.
19, 20 10 15, 16, 17 8A, 9A 8B, 9B
*8. Describe the two methodsof estimating inventories.
21, 22,23, 24
11, 12 18, 19, 20 10A, 11A 10B, 11B
*Note: All asterisked Questions, Exercises, and Problems relate to material contained in the appendicesto the chapter.

6-2
ASSIGNMENT CHARACTERISTICS TABLE
ProblemNumber Description
DifficultyLevel
Time Allotted(min.)
1A Determine items and amounts to be recorded in inventory. Moderate 15–20
2A Determine cost of goods sold and ending inventory usingFIFO, LIFO, and average-cost with analysis.
Simple 30–40
3A Determine cost of goods sold and ending inventory usingFIFO, LIFO, and average-cost with analysis.
Simple 30–40
4A Compute ending inventory, prepare income statements,and answer questions using FIFO and LIFO.
Moderate 30–40
5A Calculate ending inventory, cost of goods sold, gross profit,and gross profit rate under periodic method; compareresults.
Moderate 30–40
6A Compare specific identification, FIFO, and LIFO underperiodic method; use cost flow assumption to influenceearnings.
Moderate 20–30
7A Compute ending inventory, prepare income statements,and answer questions using FIFO and LIFO.
Moderate 30–40
*8A Calculate cost of goods sold and ending inventory forFIFO, average-cost, and LIFO, under the perpetualsystem; compare gross profit under each assumption.
Moderate 30–40
*9A Determine ending inventory under a perpetual inventorysystem.
Moderate 40–50
*10A Estimate inventory loss using gross profit method. Moderate 30–40
*11A Compute ending inventory using retail method. Moderate 20–30
1B Determine items and amounts to be recorded in inventory. Moderate 15–20
2B Determine cost of goods sold and ending inventory usingFIFO, LIFO, and average-cost with analysis.
Simple 30–40
3B Determine cost of goods sold and ending inventory usingFIFO, LIFO, and average-cost with analysis.
Simple 30–40
4B Compute ending inventory, prepare income statements,and answer questions using FIFO and LIFO.
Moderate 30–40
5B Calculate ending inventory, cost of goods sold, gross profit,and gross profit rate under periodic method; compareresults.
Moderate 30–40
6B Compare specific identification, FIFO, and LIFO underperiodic method; use cost flow assumption to justifyprice increase.
Moderate 20–30

6-3
ASSIGNMENT CHARACTERISTICS TABLE (Continued)
ProblemNumber Description
DifficultyLevel
Time Allotted(min.)
7B Compute ending inventory, prepare income statements,and answer questions using FIFO and LIFO.
Moderate 30–40
*8B Calculate cost of goods sold and ending inventory underLIFO, FIFO, and average-cost, under the perpetual system;compare gross profit under each assumption.
Moderate 30–40
*9B Determine ending inventory under a perpetual inventorysystem.
Moderate 40–50
*10B Compute gross profit rate and inventory loss using grossprofit method.
Moderate 30–40
*11B Compute ending inventory using retail method. Moderate 20–30
BLOOM’S TAXONOMY TABLEC
orr
elat
ion
Ch
art
bet
wee
n B
loo
m’s
Tax
on
om
y, S
tud
y O
bje
ctiv
es a
nd
En
d-o
f-C
hap
ter
Exe
rcis
es a
nd
Pro
ble
ms
Stu
dy
Ob
ject
ive
Kn
ow
led
ge
Co
mp
reh
ensi
on
Ap
plic
atio
nA
nal
ysis
Syn
thes
isE
valu
atio
n
1.
Des
crib
e th
e st
eps
in d
eter
min
ing
inve
nto
ry q
uan
titie
s.Q
6-2
Q6-
1Q
6-3
Q6-
4B
E6-
1Q
6-5
E6-
1E
6-1
E6-
2P
6-1A
P6-
1B
2.
Exp
lain
th
e ac
cou
nti
ng
fo
rin
ven
tori
es a
nd
ap
ply
th
ein
ven
tory
co
st f
low
met
ho
ds.
Q6-
8Q
6-10
BE
6-5
Q6-
7Q
6-9
Q6-
5B
E6-
2B
E6-
3B
E6-
4E
6-5
E6-
6
E6-
7E
6-8
P6-
2AP
6-3A
P6-
2BP
6-3B
P6-
5AP
6-5B
P6-
6AP
6-6B
E6-
3E
6-4
P6-
4AP
6-4B
P6-
7AP
6-7B
E6-
3E
6-4
P6-
5AP
6-5B
3.
Exp
lain
th
e fi
nan
cial
eff
ects
of
the
inve
nto
ry c
ost
flo
w a
ssu
mp
tio
ns.
Q6-
6Q
6-11
Q6-
12
BE
6-5
BE
6-6
E6-
6E
6-7
E6-
8
P6-
2AP
6-2B
P6-
3AP
6-3B
P6-
5A
P6-
5BP
6-6A
P6-
6B
E6-
3P
6-4A
P6-
4BP
6-7A
P6-
7B
E6-
3P
6-5A
P6-
5BP
6-6A
P6-
6B
4.
Exp
lain
th
e lo
wer
-of-
cost
-or-
mar
ket
bas
is o
f ac
cou
nti
ng
fo
r in
ven
tori
es.
Q6-
13B
E6-
7E
6-9
E6-
10
Q6-
14Q
6-15
5.
Ind
icat
e th
e ef
fect
s o
f in
ven
tory
erro
rs o
n t
he
fin
anci
al s
tate
men
ts.
Q6-
16B
E6-
8E
6-11
E6-
12
6.
Co
mp
ute
an
d in
terp
ret
the
inve
nto
rytu
rno
ver
rati
o.
Q6-
17B
E6-
9E
6-13
E6-
14Q
6-18
BE
6-9
*7.
Ap
ply
th
e in
ven
tory
co
st f
low
met
ho
ds
to p
erp
etu
al in
ven
tory
reco
rds.
Q6-
19Q
6-20
BE
6-10
E6-
15E
6-16
E6-
17
P6-
8AP
6-9A
P6-
8BP
6-9B
E6-
16E
6-17
P6-
8AP
6-8B
*8.
Des
crib
e th
e tw
o m
eth
od
s o
fes
tim
atin
g in
ven
tori
es.
Q6-
21Q
6-22
Q6-
23Q
6-24
BE
6-11
BE
6-12
E6-
18E
6-19
E6-
20P
6-10
A
P6-
11A
P6-
10B
P6-
11B
Bro
aden
ing
Yo
ur
Per
spec
tive
Fin
anci
al R
epo
rtin
gD
ecis
ion
Mak
ing
Acr
oss
th
e O
rgan
izat
ion
Co
mm
un
icat
ion
Exp
lori
ng
th
e W
eb
All
Ab
ou
t Y
ou
Eth
ics
Cas
eC
om
p. A
nal
ysis
6-4

6-5
ANSWERS TO QUESTIONS
1. Agree. Effective inventory management is frequently the key to successful business operations.Management attempts to maintain sufficient quantities and types of goods to meet expectedcustomer demand. It also seeks to avoid the cost of carrying inventories that are clearly in excessof anticipated sales.
2. Inventory items have two common characteristics: (1) they are owned by the company and (2) theyare in a form ready for sale in the ordinary course of business.
3. Taking a physical inventory involves actually counting, weighing or measuring each kind ofinventory on hand. Retailers, such as a hardware store, generally have thousands of differentitems to count. This is normally done when the store is closed.
4. (a) (1) The goods will be included in Reeves Company’s inventory if the terms of sale areFOB destination.
(2) They will be included in Cox Company’s inventory if the terms of sale are FOB shippingpoint.
(b) Reeves Company should include goods shipped to a consignee in its inventory. Goods heldby Reeves Company on consignment should not be included in inventory.
5. Inventoriable costs are $3,020 (invoice cost $3,000 + freight charges $50 – purchase discounts$30). The amount paid to negotiate the purchase is a buying cost that normally is not included inthe cost of inventory because of the difficulty of allocating these costs. Buying costs areexpensed in the year incurred.
6. There are three distinguishing features in the income statement of a merchandising company:(1) a sales revenues section, (2) a cost of goods sold section, and (3) gross profit.
7. Actual physical flow may be impractical because many items are indistinguishable from oneanother. Actual physical flow may be inappropriate because management may be able tomanipulate net income through specific identification of items sold.
8. The major advantage of the specific identification method is that it tracks the actual physical flowof the goods available for sale. The major disadvantage is that management could manipulatenet income.
9. No. Selection of an inventory costing method is a management decision. However, once a methodhas been chosen, it should be consistently applied.
10. (a) FIFO.(b) Average-cost.(c) LIFO.
11. Plato Company is using the FIFO method of inventory costing, and Cecil Company is using theLIFO method. Under FIFO, the latest goods purchased remain in inventory. Thus, the inventoryon the balance sheet should be close to current costs. The reverse is true of the LIFO method.Plato Company will have the higher gross profit because cost of goods sold will include a higherproportion of goods purchased at earlier (lower) costs.

6-6
Questions Chapter 6 (Continued)
12. Casey Company may experience severe cash shortages if this policy continues. All of its netincome is being paid out as dividends, yet some of the earnings must be reinvested in inventoryto maintain inventory levels. Some earnings must be reinvested because net income iscomputed with cost of goods sold based on older, lower costs while the inventory must bereplaced at current, higher costs. Because of this factor, net income under FIFO is sometimesreferred to as “phantom profits.”
13. Peter should know the following:(a) A departure from the cost basis of accounting for inventories is justified when the value of
the goods is lower than its cost. The writedown to market should be recognized in the periodin which the price decline occurs.
(b) Market means current replacement cost, not selling price. For a merchandising company,market is the cost at the present time from the usual suppliers in the usual quantities.
14. Garitson Music Center should report the CD players at $380 each for a total of $1,900. $380is the current replacement cost under the lower-of-cost-or-market basis of accounting for inventories.A decline in replacement cost usually leads to a decline in the selling price of the item. Valuationat LCM is conservative.
15. Ruthie Stores should report the toasters at $27 each for a total of $540. The $27 is the lower of costor market. It is used because it is the lower of the inventory’s cost and current replacement cost.
16. (a) Mintz Company’s 2007 net income will be understated $7,000; (b) 2008 net income will beoverstated $7,000; and (c) the combined net income for the two years will be correct.
17. Willingham Company should disclose: (1) the major inventory classifications, (2) the basis ofaccounting (cost or lower of cost or market), and (3) the costing method (FIFO, LIFO, or average).
18. An inventory turnover that is too high may indicate that the company is losing sales opportunitiesbecause of inventory shortages. Inventory outages may also cause customer ill will and result inlost future sales.
*19. Disagree. The results under the FIFO method are the same but the results under the LIFOmethod are different. The reason is that the pool of inventoriable costs (cost of goods availablefor sale) is not the same. Under a periodic system, the pool of costs is the goods available forsale for the entire period, whereas under a perpetual system, the pool is the goods available forsale up to the date of sale.
*20. In a periodic system, the average is a weighted average based on total goods available for sale for theperiod. In a perpetual system, the average is a moving average of goods available for sale aftereach purchase.
*21. Inventories must be estimated when: (1) management wants monthly or quarterly financialstatements but a physical inventory is only taken annually and (2) a fire or other type of casualtymakes it impossible to take a physical inventory.
6-7
Questions Chapter 6 (Continued)
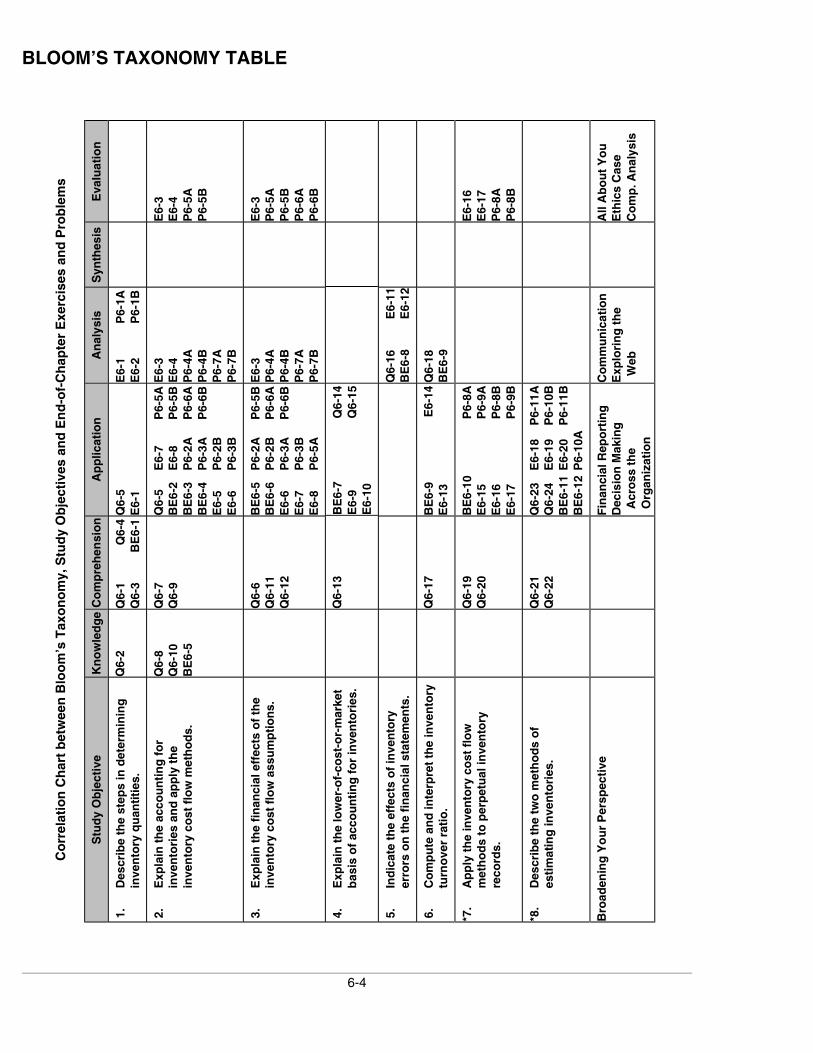
*22. In the gross profit method, the average is the gross profit rate, which is gross profit divided by netsales. The rate is often based on last year’s actual rate. The gross profit rate is applied to net salesin using the gross profit method.
In the retail inventory method, the average is the cost-to-retail ratio, which is the goods availablefor sale at cost divided by the goods available for sale at retail. The ratio is based on current yeardata and is applied to the ending inventory at retail.
*23. The estimated cost of the ending inventory is $40,000:Net sales ...................................................................................................................................... $400,000Less: Gross profit ($400,000 X 35%) .................................................................................... 140,000Estimated cost of goods sold ................................................................................................... $260,000
Cost of goods available for sale .............................................................................................. $300,000Less: Cost of goods sold.......................................................................................................... 260,000Estimated cost of ending inventory......................................................................................... $ 40,000
*24. The estimated cost of the ending inventory is $28,000:
Cost-to-retail ratio: 70% = $84,000
$120,000
Ending inventory at retail: $40,000 = ($120,000 – $80,000)
Ending inventory at cost: $28,000 = ($40,000 X 70%)
6-8
SOLUTIONS TO BRIEF EXERCISES
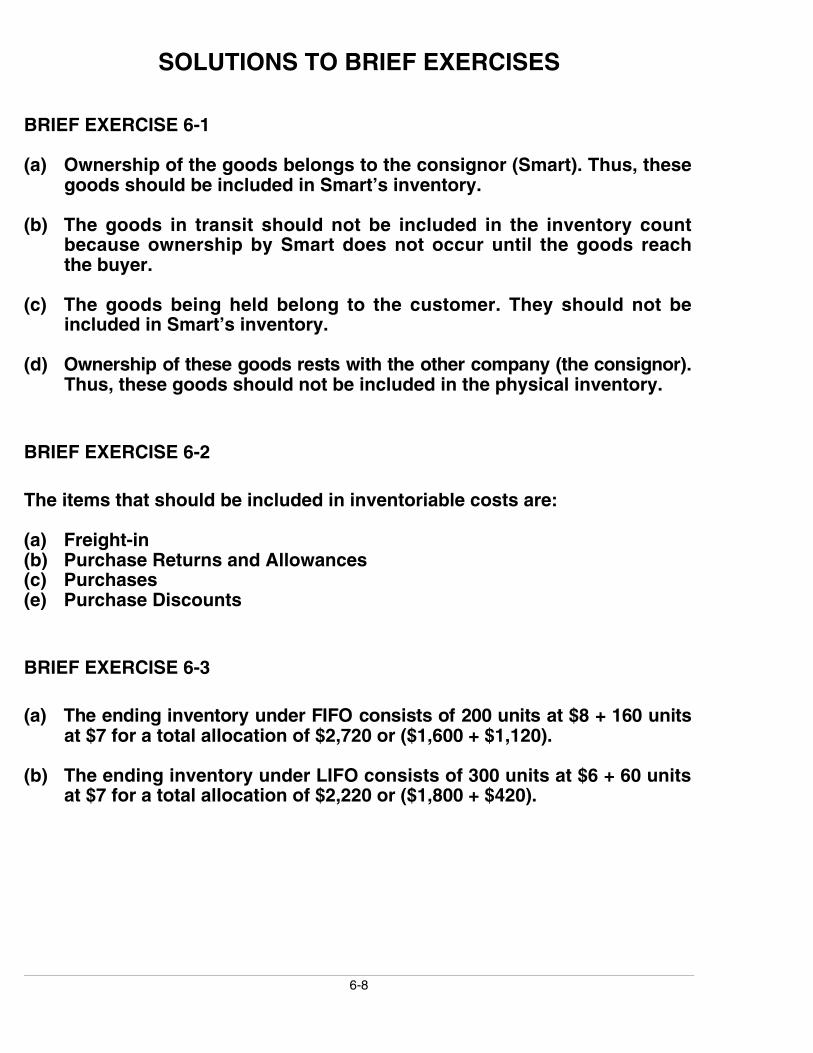
BRIEF EXERCISE 6-1
(a) Ownership of the goods belongs to the consignor (Smart). Thus, thesegoods should be included in Smart’s inventory.
(b) The goods in transit should not be included in the inventory countbecause ownership by Smart does not occur until the goods reachthe buyer.
(c) The goods being held belong to the customer. They should not beincluded in Smart’s inventory.
(d) Ownership of these goods rests with the other company (the consignor).Thus, these goods should not be included in the physical inventory.
BRIEF EXERCISE 6-2
The items that should be included in inventoriable costs are:
(a) Freight-in(b) Purchase Returns and Allowances(c) Purchases(e) Purchase Discounts
BRIEF EXERCISE 6-3
(a) The ending inventory under FIFO consists of 200 units at $8 + 160 unitsat $7 for a total allocation of $2,720 or ($1,600 + $1,120).
(b) The ending inventory under LIFO consists of 300 units at $6 + 60 unitsat $7 for a total allocation of $2,220 or ($1,800 + $420).
6-9
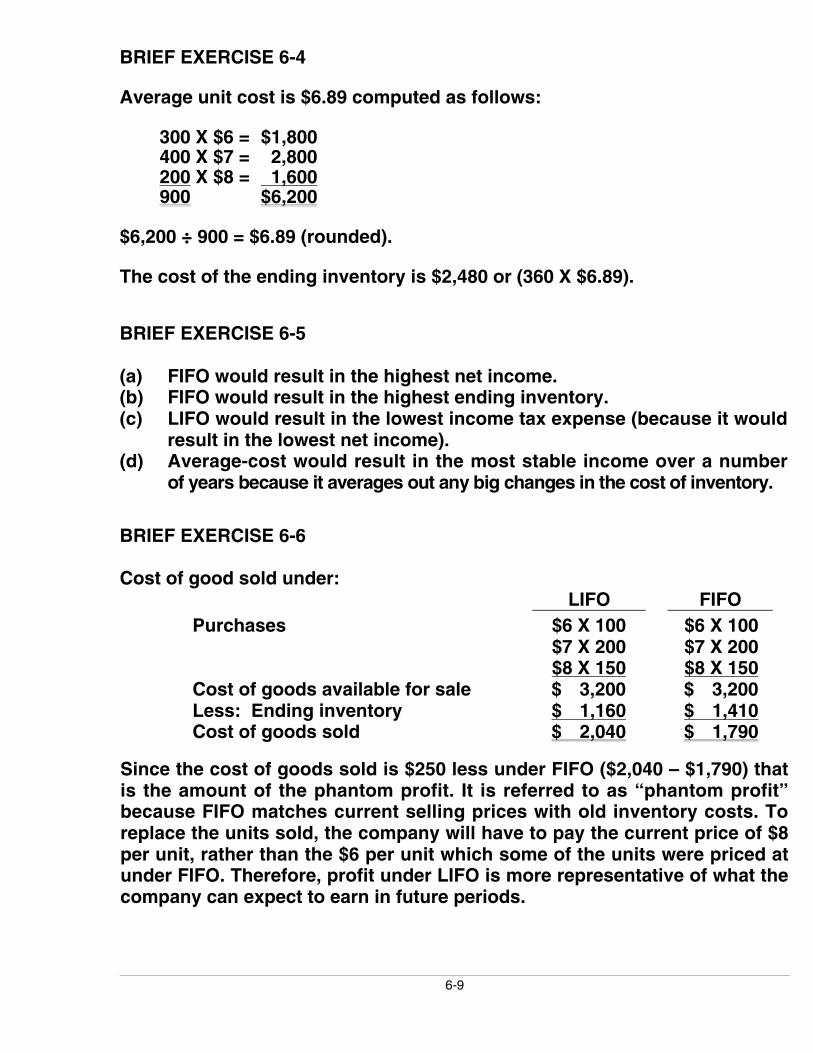
BRIEF EXERCISE 6-4
Average unit cost is $6.89 computed as follows:
300 X $6 = $1,800400 X $7 = 2,800200 X $8 = 1,600900 $6,200
$6,200 ÷ 900 = $6.89 (rounded).
The cost of the ending inventory is $2,480 or (360 X $6.89).
BRIEF EXERCISE 6-5
(a) FIFO would result in the highest net income.(b) FIFO would result in the highest ending inventory.(c) LIFO would result in the lowest income tax expense (because it would
result in the lowest net income).(d) Average-cost would result in the most stable income over a number
of years because it averages out any big changes in the cost of inventory.
BRIEF EXERCISE 6-6
Cost of good sold under:LIFO FIFO
Purchases $6 X 100 $6 X 100$7 X 200 $7 X 200$8 X 150 $8 X 150
Cost of goods available for sale $ 3,200 $ 3,200Less: Ending inventory $ 1,160 $ 1,410Cost of goods sold $ 2,040 $ 1,790
Since the cost of goods sold is $250 less under FIFO ($2,040 – $1,790) thatis the amount of the phantom profit. It is referred to as “phantom profit”because FIFO matches current selling prices with old inventory costs. Toreplace the units sold, the company will have to pay the current price of $8per unit, rather than the $6 per unit which some of the units were priced atunder FIFO. Therefore, profit under LIFO is more representative of what thecompany can expect to earn in future periods.
6-10
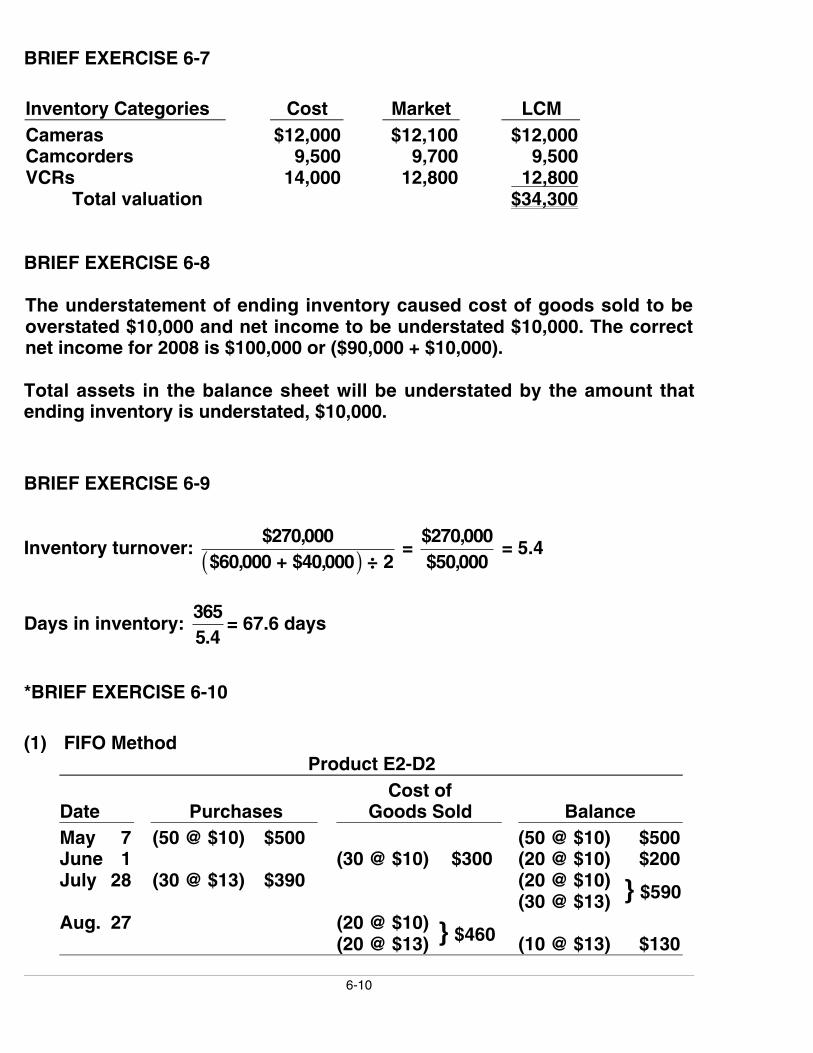
BRIEF EXERCISE 6-7
Inventory Categories Cost Market LCMCameras $12,000 $12,100 $12,000Camcorders 9,500 9,700 9,500VCRs 14,000 12,800 12,800
Total valuation $34,300
BRIEF EXERCISE 6-8
The understatement of ending inventory caused cost of goods sold to beoverstated $10,000 and net income to be understated $10,000. The correctnet income for 2008 is $100,000 or ($90,000 + $10,000).
Total assets in the balance sheet will be understated by the amount thatending inventory is understated, $10,000.
BRIEF EXERCISE 6-9
Inventory turnover: $270,000
$60,000 + $40,000 ÷ 2( ) = $270,000$50,000
= 5.4
Days in inventory: 3655.4
= 67.6 days
*BRIEF EXERCISE 6-10
(1) FIFO MethodProduct E2-D2
Date PurchasesCost of
Goods Sold BalanceMay 7 (50 @ $10) $500 (50 @ $10) $500June 1 (30 @ $10) $300 (20 @ $10) $200July 28 (30 @ $13) $390 (20 @ $10)
(30 @ $13) } $590
Aug. 27 (20 @ $10)(20 @ $13) } $460 (10 @ $13) $130

6-11
*BRIEF EXERCISE 6-10 (Continued)
(2) LIFO MethodProduct E2-D2
Date PurchasesCost of
Goods Sold BalanceMay 7 (50 @ $10) $500 (50 @ $10) $500June 1 (30 @ $10) $300 (20 @ $10) $200July 28 (30 @ $13) $390 (20 @ $10)
(30 @ $13) } $590
Aug. 27 (30 @ $13)(10 @ $10) } $490 (10 @ $10) $100
(3) Average-CostProduct E2-D2
Date PurchasesCost of
Goods Sold BalanceMay 7 (50 @ $10) $500 (50 @ $10) $500June 1 (30 @ $10) $300 (20 @ $10) $200July 28 (30 @ $13) $390 (50 @ $11.80)*$590Aug. 27 (40 @ $11.80) $472 (10 @ $11.80) $118
*($200 + $390) ÷ 50
*BRIEF EXERCISE 6-11
(1) Net sales $330,000Less: Estimated gross profit (35% X $330,000) 115,500Estimated cost of goods sold $214,500
(2) Cost of goods available for sale $230,000Less: Estimated cost of goods sold 214,500Estimated cost of ending inventory $ 15,500
*BRIEF EXERCISE 6-12
At Cost At RetailGoods available for sale $35,000 $50,000Net sales 40,000Ending inventory at retail $10,000
Cost-to-retail ratio = ($35,000 ÷ $50,000) = 70%Estimated cost of ending inventory = ($10,000 X 70%) = $7,000

6-12
SOLUTIONS TO EXERCISES
EXERCISE 6-1
Ending inventory—physical count.................................................... $297,0001. No effect—title passes to purchaser upon shipment
when terms are FOB shipping point.................................... 02. No effect—title does not transfer to Lima until
goods are received.................................................................... 03. Add to inventory: Title passed to Lima when goods
were shipped ............................................................................... 22,0004. Add to inventory: Title remains with Lima until
purchaser receives goods ...................................................... 35,0005. The goods did not arrive prior to year-end. The goods,
therefore, cannot be included in the inventory................ (44,000)Correct inventory.................................................................................... $310,000
EXERCISE 6-2
Ending inventory—as reported.......................................................... $740,0001. Subtract from inventory: The goods belong to
Superior Corporation. Strawser is merely holdingthem as a consignee ................................................................ (250,000)
2. No effect—title does not pass to Strawser untilgoods are received (Jan. 3).................................................... 0
3. Subtract from inventory: Office supplies shouldbe carried in a separate account. They are notconsidered inventory held for resale.................................. (17,000)
4. Add to inventory: The goods belong to Strawseruntil they are shipped (Jan. 1)............................................... 30,000
5. Add to inventory: District Sales ordered goodswith a cost of $8,000. Strawser should record thecorresponding sales revenue of $10,000. Strawser’sdecision to ship extra “unordered” goods does notconstitute a sale. The manager’s statement that Districtcould ship the goods back indicates that Strawser knowsthis over-shipment is not a legitimate sale. The manageracted unethically in an attempt to improve Strawser’sreported income by over-shipping ...................................... 52,000

6-13
EXERCISE 6-2 (Continued)
6. Subtract from inventory: GAAP require that inventorybe valued at the lower of cost or market. Obsolete partsshould be adjusted from cost to zero if they have noother use.......................................................................................... (40,000)
Correct inventory........................................................................................ $515,000
EXERCISE 6-3
(a) FIFO Cost of Goods Sold
(#1012) $100 + (#1045) $90 = $190
(b) It could choose to sell specific units purchased at specific costs if itwished to impact earnings selectively. If it wished to minimize earningsit would choose to sell the units purchased at higher costs—in whichcase the Cost of Goods Sold would be $190. If it wished to maximizeearnings it would choose to sell the units purchased at lower costs—inwhich case the cost of goods sold would be $170.
(c) I recommend they use the FIFO method because it produces a moreappropriate balance sheet valuation and reduces the opportunity tomanipulate earnings.
(The answer may vary depending on the method the student chooses.)
EXERCISE 6-4
FIFO
Beginning inventory (26 X $97)..................................................... $ 2,522Purchases
Sept. 12 (45 X $102).................................................................. $4,590Sept. 19 (20 X $104).................................................................. 2,080Sept. 26 (50 X $105).................................................................. 5,250 11,920
Cost of goods available for sale................................................... 14,442Less: Ending inventory (20 X $105) ........................................... 2,100Cost of goods sold............................................................................ $12,342

6-14
EXERCISE 6-4 (Continued)
ProofDate Units Unit Cost Total Cost9/1 26 $ 97 $ 2,5229/12 45 102 4,5909/19 20 104 2,0809/26 30 105 3,150
121 $12,342
LIFOCost of goods available for sale.................................................................... $14,442Less: Ending inventory (20 X $97)............................................................... 1,940Cost of goods sold............................................................................................. $12,502
ProofDate Units Unit Cost Total Cost9/26 50 $105 $ 5,2509/19 20 104 2,0809/12 45 102 4,5909/1 6 97 582
121 $12,502
(b)
FIFO $2,100 (ending inventory) + $12,342 (COGS) = $14,442LIFO $1,940 (ending inventory) + $12,502 (COGS) = $14,442 }
Cost ofgoodsavailablefor sale
Under both methods, the sum of the ending inventory and cost of goods soldequals the same amount, $14,442, which is the cost of goods available for sale.
EXERCISE 6-5
FIFOBeginning inventory (30 X $8) ....................................................... $240Purchases
May 15 (25 X $11) ...................................................................... $275May 24 (35 X $12) ...................................................................... 420 695
Cost of goods available for sale................................................... 935Less: Ending inventory (25 X $12).............................................. 300Cost of goods sold............................................................................ $635

6-15
EXERCISE 6-5 (Continued)
Proof
Date Units Unit Cost Total Cost5/1 30 $ 8 $2405/15 25 11 2755/24 10 12 120
$635
LIFOCost of goods available for sale.................................................................... $935Less: Ending inventory (25 X $8) ................................................................. 200Cost of goods sold............................................................................................. $735
ProofDate Units Unit Cost Total Cost5/24 35 $12 $4205/15 25 11 2755/1 5 8 40
$735
EXERCISE 6-6
(a) FIFOBeginning inventory (200 X $5)..................................... $1,000Purchases
June 12 (300 X $6) .................................................... $1,800June 23 (500 X $7) .................................................... 3,500 5,300
Cost of goods available for sale................................... 6,300Less: Ending inventory (120 X $7).............................. 840Cost of goods sold............................................................ $5,460
LIFOCost of goods available for sale................................... $6,300Less: Ending inventory (120 X $5).............................. 600Cost of goods sold............................................................ $5,700

6-16
EXERCISE 6-6 (Continued)
(b) The FIFO method will produce the higher ending inventory becausecosts have been rising. Under this method, the earliest costs areassigned to cost of goods sold and the latest costs remain in endinginventory. For Yount Company, the ending inventory under FIFO is$840 or (120 X $7) compared to $600 or (120 X $5) under LIFO.
(c) The LIFO method will produce the higher cost of goods sold for YountCompany. Under LIFO the most recent costs are charged to cost ofgoods sold and the earliest costs are included in the ending inventory.The cost of goods sold is $5,700 or [$6,300 – (120 X $5)] compared to$5,460 or ($6,300 – $840) under FIFO.
EXERCISE 6-7
(a) 1. FIFOBeginning inventory .................................................. $10,000Purchases...................................................................... 26,000Cost of goods available for sale ............................ 36,000Less: ending inventory (80 X $130) ..................... (10,400)Cost of goods sold..................................................... $25,600
2. LIFOBeginning inventory .................................................. $10,000Purchases...................................................................... 26,000Cost of goods available for sale ............................ 36,000Less: ending inventory (80 X $100) ..................... (8,000)Cost of goods sold..................................................... $28,000
3. AVERAGEBeginning inventory .................................................. $10,000Purchases...................................................................... 26,000Cost of goods available for sale ............................ 36,000Less: ending inventory (80 X $120) ..................... (9,600)Cost of goods sold..................................................... $26,400
(b) The use of FIFO would result in the highest net income since the earlierlower costs are matched with revenues.
(c) The use of FIFO would result in inventories approximating current cost inthe balance sheet, since the more recent units are assumed to be on hand.
(d) The use of LIFO would result in Jones paying the least taxes in thefirst year since income will be lower.
6-17
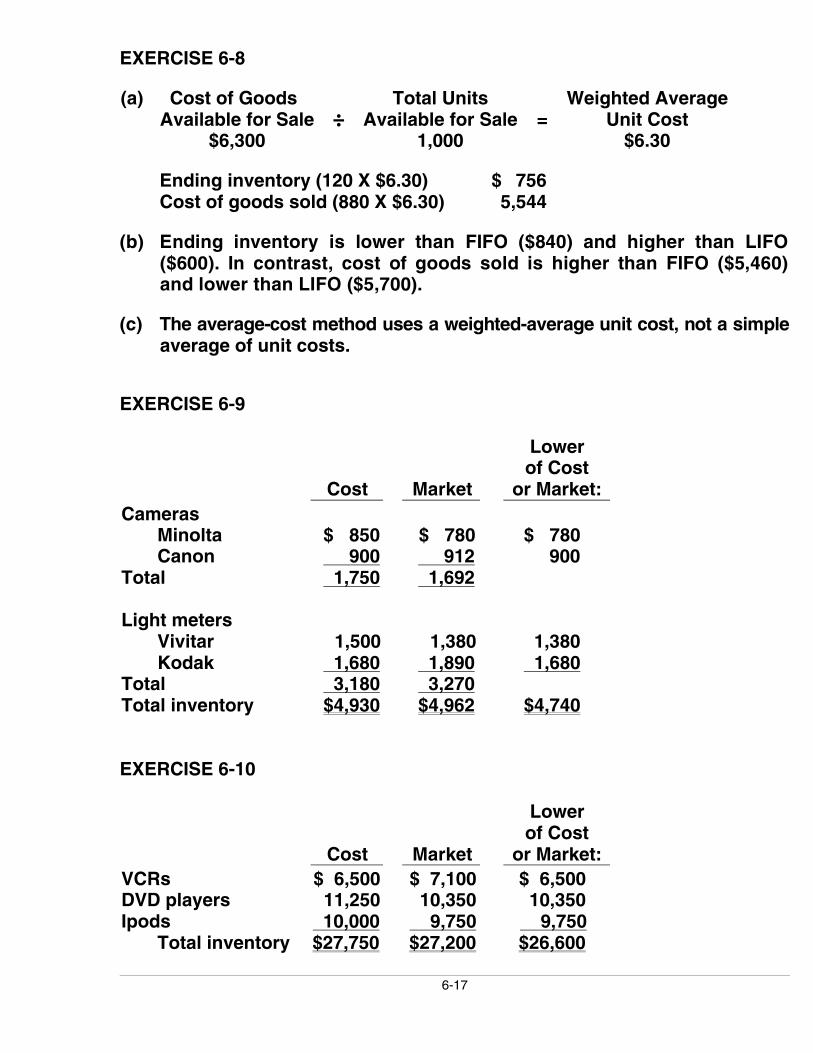
EXERCISE 6-8
(a) Cost of GoodsAvailable for Sale
$6,300÷
Total UnitsAvailable for Sale
1,000=
Weighted AverageUnit Cost
$6.30
Ending inventory (120 X $6.30) $ 756Cost of goods sold (880 X $6.30) 5,544
(b) Ending inventory is lower than FIFO ($840) and higher than LIFO($600). In contrast, cost of goods sold is higher than FIFO ($5,460)and lower than LIFO ($5,700).
(c) The average-cost method uses a weighted-average unit cost, not a simpleaverage of unit costs.
EXERCISE 6-9
Cost Market
Lowerof Cost
or Market:Cameras
Minolta $ 850 $ 780 $ 780Canon 900 912 900
Total 1,750 1,692
Light metersVivitar 1,500 1,380 1,380Kodak 1,680 1,890 1,680
Total 3,180 3,270Total inventory $4,930 $4,962 $4,740
EXERCISE 6-10
Cost Market
Lowerof Cost
or Market:VCRs $ 6,500 $ 7,100 $ 6,500DVD players 11,250 10,350 10,350Ipods 10,000 9,750 9,750
Total inventory $27,750 $27,200 $26,600

6-18
EXERCISE 6-11
2008 2009
Beginning inventory ................................................... $ 20,000 $ 27,000Cost of goods purchased ......................................... 150,000 175,000Cost of goods available for sale............................. 170,000 202,000Corrected ending inventory ..................................... 27,000a 41,000b
Cost of goods sold...................................................... $143,000 $161,000
a$30,000 – $3,000 = $27,000. b$35,000 + $6,000 = $41,000.
EXERCISE 6-12
(a) 2008 2009Sales ............................................................................ $210,000 $250,000Cost of goods sold
Beginning inventory....................................... 32,000 39,000Cost of goods purchased............................. 173,000 202,000Cost of goods available for sale ................ 205,000 241,000Ending inventory ($44,000 – $5,000)......... 39,000 52,000Cost of goods sold ......................................... 166,000 189,000
Gross profit ............................................................... $ 44,000 $ 61,000
(b) The cumulative effect on total gross profit for the two years is zero asshown below:
Incorrect gross profits: $49,000 + $56,000 = $105,000Correct gross profits: $44,000 + $61,000 = 105,000Difference $ 0
(c) Dear Mr./Ms. President:
Because your ending inventory of December 31, 2008 was overstatedby $5,000, your net income for 2008 was overstated by $5,000. For 2009net income was understated by $5,000.
In a periodic system, the cost of goods sold is calculated by deductingthe cost of ending inventory from the total cost of goods you haveavailable for sale in the period. Therefore, if this ending inventory figureis overstated, as it was in December 2008, then the cost of goods soldis understated and therefore net income will be overstated by thatamount. Consequently, this overstated ending inventory figure goes onto become the next period’s beginning inventory amount and is a partof the total cost of goods available for sale. Therefore, the mistakerepeats itself in the reverse.
6-19
EXERCISE 6-12 (Continued)
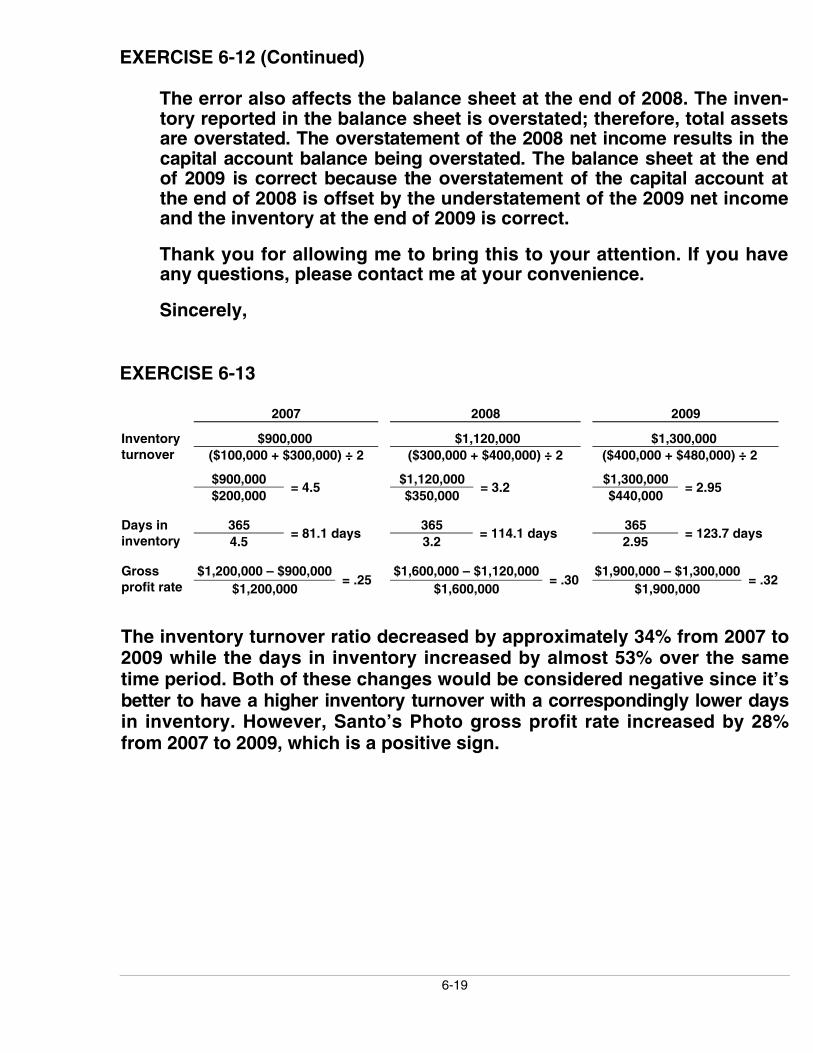
The error also affects the balance sheet at the end of 2008. The inven-tory reported in the balance sheet is overstated; therefore, total assetsare overstated. The overstatement of the 2008 net income results in thecapital account balance being overstated. The balance sheet at the endof 2009 is correct because the overstatement of the capital account atthe end of 2008 is offset by the understatement of the 2009 net incomeand the inventory at the end of 2009 is correct.
Thank you for allowing me to bring this to your attention. If you haveany questions, please contact me at your convenience.
Sincerely,
EXERCISE 6-13
2007 2008 2009
$900,000 $1,120,000 $1,300,000Inventoryturnover ($100,000 + $300,000) ÷ 2 ($300,000 + $400,000) ÷ 2 ($400,000 + $480,000) ÷ 2
$900,000 $1,120,000 $1,300,000$200,000
= 4.5$350,000
= 3.2$440,000
= 2.95
365 365 365Days ininventory 4.5
= 81.1 days3.2
= 114.1 days2.95
= 123.7 days
$1,200,000 – $900,000 $1,600,000 – $1,120,000 $1,900,000 – $1,300,000Grossprofit rate $1,200,000
= .25$1,600,000
= .30$1,900,000
= .32
The inventory turnover ratio decreased by approximately 34% from 2007 to2009 while the days in inventory increased by almost 53% over the sametime period. Both of these changes would be considered negative since it’sbetter to have a higher inventory turnover with a correspondingly lower daysin inventory. However, Santo’s Photo gross profit rate increased by 28%from 2007 to 2009, which is a positive sign.
6-20
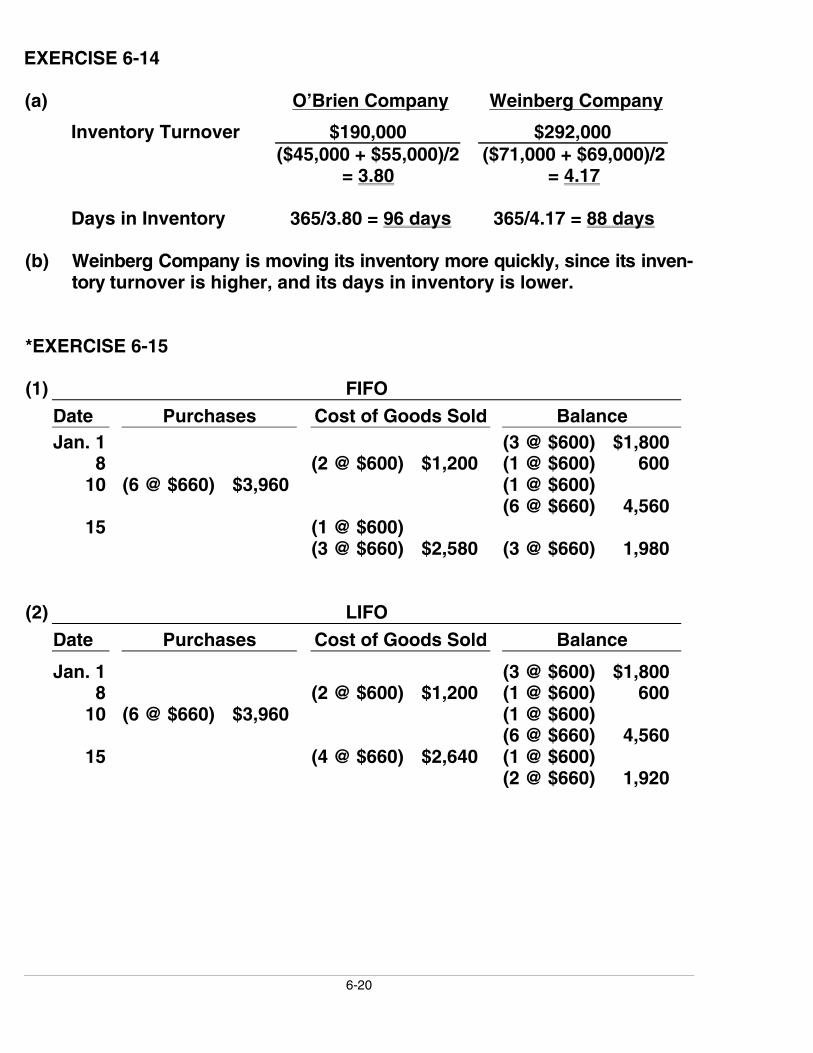
EXERCISE 6-14
(a) O’Brien Company Weinberg Company
Inventory Turnover $190,000 $292,000($45,000 + $55,000)/2
= 3.80($71,000 + $69,000)/2
= 4.17
Days in Inventory 365/3.80 = 96 days 365/4.17 = 88 days
(b) Weinberg Company is moving its inventory more quickly, since its inven-tory turnover is higher, and its days in inventory is lower.
*EXERCISE 6-15
(1) FIFODate Purchases Cost of Goods Sold BalanceJan. 1 (3 @ $600) $1,800
8 (2 @ $600) $1,200 (1 @ $600) 60010 (6 @ $660) $3,960 (1 @ $600)
(6 @ $660) 4,56015 (1 @ $600)
(3 @ $660) $2,580 (3 @ $660) 1,980
(2) LIFODate Purchases Cost of Goods Sold Balance
Jan. 1 (3 @ $600) $1,8008 (2 @ $600) $1,200 (1 @ $600) 600
10 (6 @ $660) $3,960 (1 @ $600)(6 @ $660) 4,560
15 (4 @ $660) $2,640 (1 @ $600)(2 @ $660) 1,920
6-21
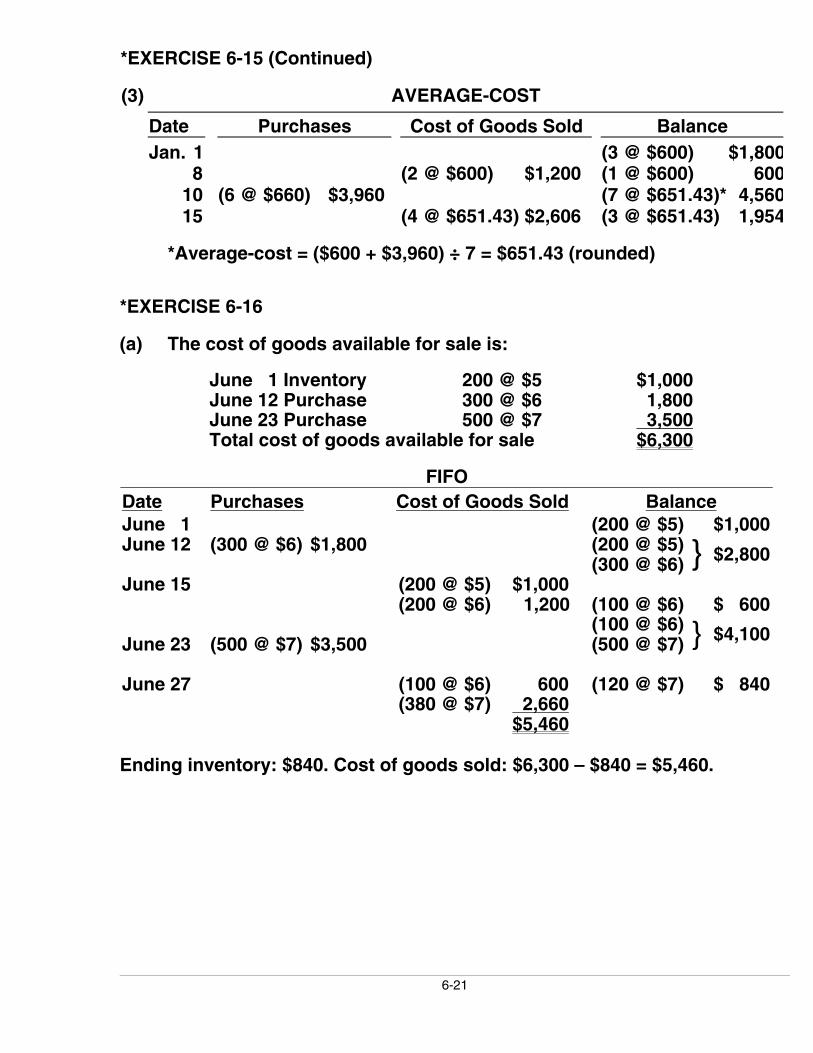
*EXERCISE 6-15 (Continued)
(3) AVERAGE-COST
Date Purchases Cost of Goods Sold BalanceJan. 1 (3 @ $600) $1,800
8 (2 @ $600) $1,200 (1 @ $600) 60010 (6 @ $660) $3,960 (7 @ $651.43)* 4,56015 (4 @ $651.43) $2,606 (3 @ $651.43) 1,954
*Average-cost = ($600 + $3,960) ÷ 7 = $651.43 (rounded)
*EXERCISE 6-16
(a) The cost of goods available for sale is:
June 1 Inventory 200 @ $5 $1,000June 12 Purchase 300 @ $6 1,800June 23 Purchase 500 @ $7 3,500Total cost of goods available for sale $6,300
FIFODate Purchases Cost of Goods Sold BalanceJune 1 (200 @ $5) $1,000June 12 (300 @ $6) $1,800 (200 @ $5)
(300 @ $6) } $2,800
June 15 (200 @ $5) $1,000(200 @ $6) 1,200 (100 @ $6) $ 600
(100 @ $6)June 23 (500 @ $7) $3,500 (500 @ $7) } $4,100
June 27 (100 @ $6) 600 (120 @ $7) $ 840(380 @ $7) 2,660
$5,460
Ending inventory: $840. Cost of goods sold: $6,300 – $840 = $5,460.

6-22
*EXERCISE 6-16 (Continued)
LIFODate Purchases Cost of Goods Sold BalanceJune 1 (200 @ $5) $1,000June 12 (300 @ $6) $1,800 (200 @ $5)
(300 @ $6) } $2,800
June 15 (300 @ $6) $1,800(100 @ $5) $ 500 (100 @ $5) $ 500
(100 @ $5)June 23 (500 @ $7) $3,500 (500 @ $7) } $4,000
(100 @ $5)June 27 (480 @ $7) $3,360 ( 20 @ $7) } $ 640
$5,660
Ending inventory: $640. Cost of goods sold: $6,300 – $640 = $5,660.
Moving-AverageDate Purchases Cost of Goods Sold BalanceJune 1 (200 @ $5) $1,000June 12 (300 @ $6) $1,800 (500 @ $5.60) $2,800June 15 (400 @ $5.60) $2,240 (100 @ $5.60) $ 560June 23 (500 @ $7) $3,500 (600 @ $6.767) $4,060June 27 (480 @ $6.767) $3,248 (120 @ $6.767) $ 812
$5,488
Ending inventory: $812. Cost of goods sold: $6,300 – $812 = $5,488.
(b) FIFO gives the same ending inventory and cost of goods sold valuesunder both the periodic and perpetual inventory system. LIFO andaverage give different ending inventory and cost of goods sold valuesunder the periodic and perpetual inventory systems, due to the Last-in,First-out assumption being applied to a different pool of costs.
(c) The simple average would be [($5 + $6 + $7) ÷ 3)] or $6. However, theaverage-cost method uses a weighted-average unit cost that changeseach time a purchase is made rather than a simple average.
6-23
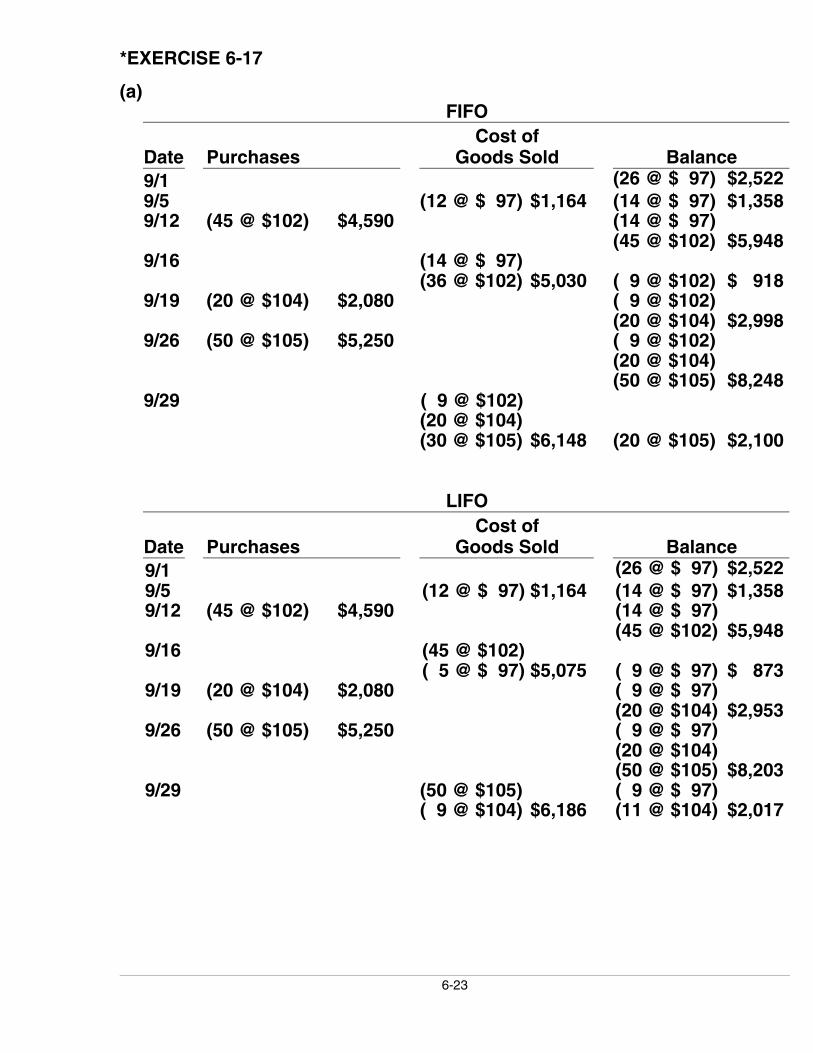
*EXERCISE 6-17
(a)FIFO
Date PurchasesCost of
Goods Sold Balance9/1 (26 @ $ 97) $2,5229/5 (12 @ $ 97) $1,164 (14 @ $ 97) $1,3589/12 (45 @ $102) $4,590 (14 @ $ 97)
(45 @ $102) $5,9489/16 (14 @ $ 97)
(36 @ $102) $5,030 ( 9 @ $102) $ 9189/19 (20 @ $104) $2,080 ( 9 @ $102)
(20 @ $104) $2,9989/26 (50 @ $105) $5,250 ( 9 @ $102)
(20 @ $104)(50 @ $105) $8,248
9/29 ( 9 @ $102)(20 @ $104)(30 @ $105) $6,148 (20 @ $105) $2,100
LIFO
Date PurchasesCost of
Goods Sold Balance9/1 (26 @ $ 97) $2,5229/5 (12 @ $ 97) $1,164 (14 @ $ 97) $1,3589/12 (45 @ $102) $4,590 (14 @ $ 97)
(45 @ $102) $5,9489/16 (45 @ $102)
( 5 @ $ 97) $5,075 ( 9 @ $ 97) $ 8739/19 (20 @ $104) $2,080 ( 9 @ $ 97)
(20 @ $104) $2,9539/26 (50 @ $105) $5,250 ( 9 @ $ 97)
(20 @ $104)(50 @ $105) $8,203
9/29 (50 @ $105) ( 9 @ $ 97)( 9 @ $104) $6,186 (11 @ $104) $2,017

6-24
*EXERCISE 6-17 (Continued)
Average-Cost
Date PurchasesCost of
Goods Sold Balance9/1 (26 @ $97) $2,5229/5 (12 @ $97) $1,164 (14 @ $97) $1,3589/12 (45 @ $102) $4,590 (59 @ $100.81)a $5,9489/16 (50 @ $100.81) $5,041* ( 9 @ $100.81) $ 9079/19 (20 @ $104) $2,080 (29 @ $103.00)b $2,9879/26 (50 @ $105) $5,250 (79 @ $104.27)c $8,2379/29 (59 @ $104.27) $6,152* (20 @ $104.27) $2,085
*Roundeda $5,948 ÷ 59 = $100.81b $2,987 ÷ 29 = $103.00c $8,237 ÷ 79 = $104.27
(b)Periodic Perpetual
Ending Inventory FIFO $2,100 $2,100Ending Inventory LIFO $1,940 $2,017
(c) FIFO yields the same ending inventory value under both the periodicand perpetual inventory system.
LIFO yields different ending inventory values when using the periodicversus perpetual inventory system.
*EXERCISE 6-18
(a) Sales.................................................................................. $800,000Cost of goods sold
Inventory, November 1 ..................................... $100,000Cost of goods purchased ................................ 500,000Cost of goods available for sale.................... 600,000Inventory, December 31 ................................... (120,000)
Cost of goods sold.................................. 480,000Gross profit ..................................................................... $320,000
Gross profit rate $320,000/$800,000 = 40%

6-25
*EXERCISE 6-18 (Continued)
(b) Sales ...................................................................................................... $1,000,000Less: Estimated gross profit (40% X $1,000,000) .................. 400,000Estimated cost of goods sold ....................................................... $ 600,000
Beginning inventory ......................................................................... $120,000Cost of goods purchased ............................................................... 610,000Cost of goods available for sale................................................... 730,000Less: Estimated cost of goods sold .......................................... 600,000Estimated cost of ending inventory ............................................ $130,000
*EXERCISE 6-19
(a) Net sales ($51,000 – $1,000)........................................................... $50,000Less: Estimated gross profit (40% X $50,000)........................ 20,000Estimated cost of goods sold ....................................................... $30,000
Beginning inventory ......................................................................... $20,000Cost of goods purchased ($31,200 – $1,400 + $1,200).......... 31,000Cost of goods available for sale................................................... 51,000Less: Estimated cost of goods sold .......................................... 30,000Estimated cost of merchandise lost ........................................... $21,000
(b) Net sales............................................................................................... $50,000Less: Estimated gross profit (30% X $50,000)........................ 15,000Estimated cost of goods sold ....................................................... $35,000
Beginning inventory ......................................................................... $30,000Cost of goods purchased ............................................................... 31,000Cost of goods available for sale................................................... 61,000Less: Estimated cost of goods sold .......................................... 35,000Estimated cost of merchandise lost ........................................... $26,000
6-26
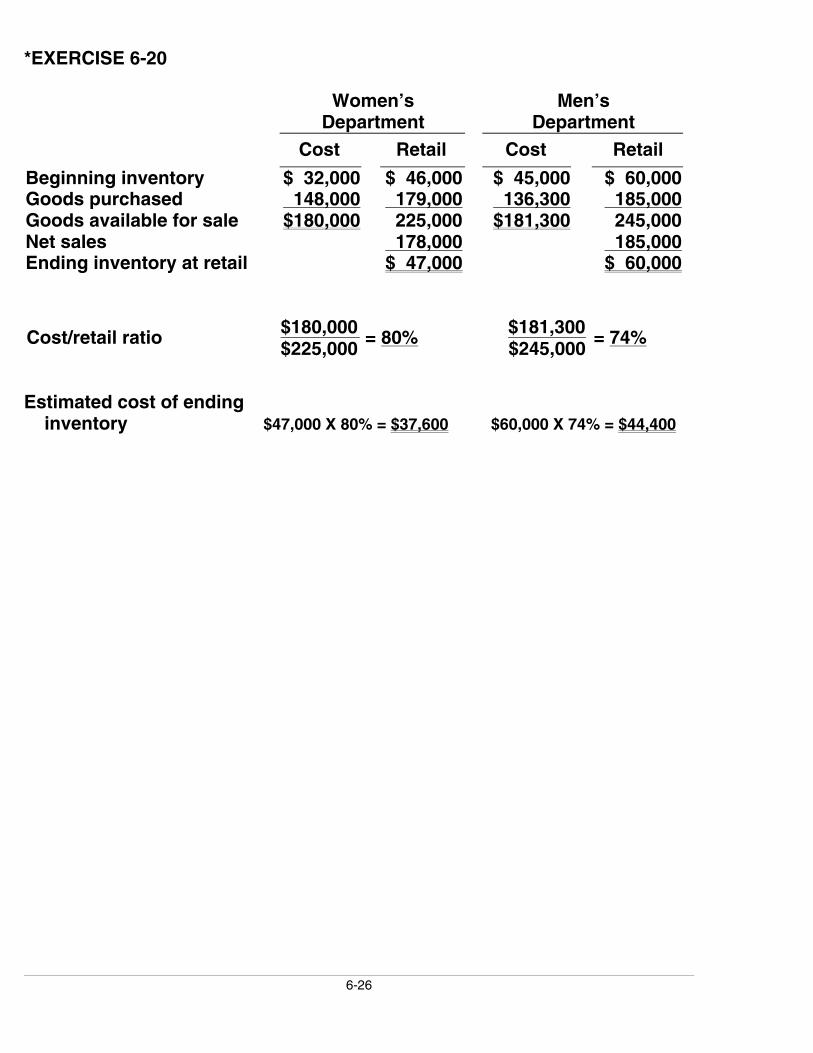
*EXERCISE 6-20
Women’sDepartment
Men’sDepartment
Cost Retail Cost Retail
Beginning inventory $ 32,000 $ 46,000 $ 45,000 $ 60,000Goods purchased 148,000 179,000 136,300 185,000Goods available for sale $180,000 225,000 $181,300 245,000Net sales 178,000 185,000Ending inventory at retail $ 47,000 $ 60,000
$180,000 $181,300Cost/retail ratio$225,000
= 80%$245,000
= 74%
Estimated cost of ending inventory $47,000 X 80% = $37,600 $60,000 X 74% = $44,400

6-27
SOLUTIONS TO PROBLEMS
PROBLEM 6-1A
(a) The goods should not be included in inventory as they were shippedFOB shipping point and shipped February 26. Title to the goodstransfers to the customer February 26. Heath should have recordedthe transaction in the Sales and Accounts Receivable accounts.
(b) The amount should not be included in inventory as they were shippedFOB destination and not received until March 2. The seller still ownsthe inventory. No entry is recorded.
(c) Include $500 inventory.
(d) Include $400 inventory.
(e) $750 should be included in inventory as the goods were shipped FOBshipping point.
(f) The sale will be recorded on March 2. The goods should be includedin inventory at the end of February at their cost of $250.
(g) The damaged goods should not be included in inventory. They shouldbe recorded in a loss account since they are not saleable.

6-28
PROBLEM 6-2A
(a) COST OF GOODS AVAILABLE FOR SALEDate Explanation Units Unit Cost Total CostMarch 1 Beginning Inventory 1,500 $ 7 $ 10,500
5 Purchase 3,000 8 24,00013 Purchase 5,500 9 49,50021 Purchase 4,000 10 40,00026 Purchase 2,000 11 22,000
Total 16,000 $146,000
(b) FIFO(1) Ending Inventory (2) Cost of Goods Sold
Date UnitsUnitCost
TotalCost
Cost of goodsavailable for sale $146,000
March 26 2,000 $11 $22,00021 1,500 10 15,000
Less: Endinginventory 37,000
3,500* $37,000 Cost of goods sold $109,000
*16,000 – 12,500 = 3,500
Proof of Cost of Goods Sold
Date UnitsUnitCost
TotalCost
March 1 1,500 $ 7 $ 10,5005 3,000 8 24,000
13 5,500 9 49,50021 2,500 10 25,000
12,500 $109,000
6-29
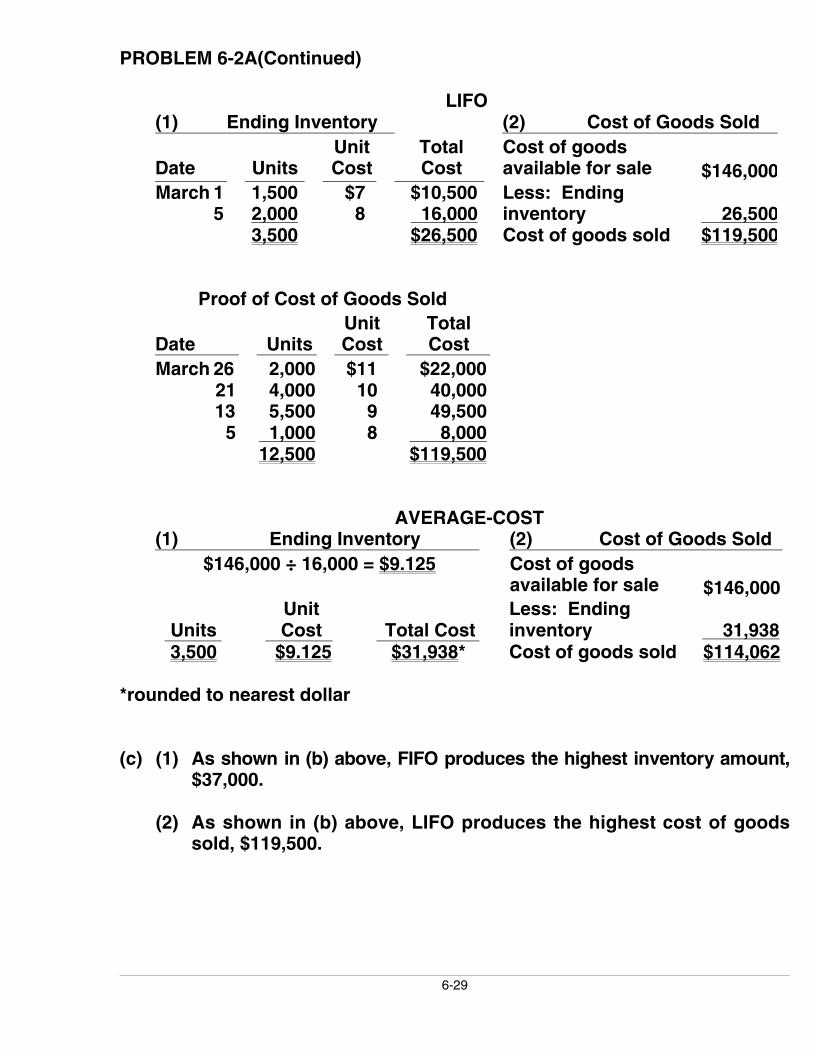
PROBLEM 6-2A(Continued)
LIFO(1) Ending Inventory (2) Cost of Goods Sold
Date UnitsUnitCost
TotalCost
Cost of goodsavailable for sale $146,000
March 1 1,500 $7 $10,5005 2,000 8 16,000
Less: Endinginventory 26,500
3,500 $26,500 Cost of goods sold $119,500
Proof of Cost of Goods Sold
Date UnitsUnitCost
TotalCost
March 26 2,000 $11 $22,00021 4,000 10 40,00013 5,500 9 49,500
5 1,000 8 8,00012,500 $119,500
AVERAGE-COST(1) Ending Inventory (2) Cost of Goods Sold
$146,000 ÷ 16,000 = $9.125 Cost of goodsavailable for sale $146,000
UnitsUnitCost Total Cost
Less: Endinginventory 31,938
3,500 $9.125 $31,938* Cost of goods sold $114,062
*rounded to nearest dollar
(c) (1) As shown in (b) above, FIFO produces the highest inventory amount,$37,000.
(2) As shown in (b) above, LIFO produces the highest cost of goodssold, $119,500.
6-30
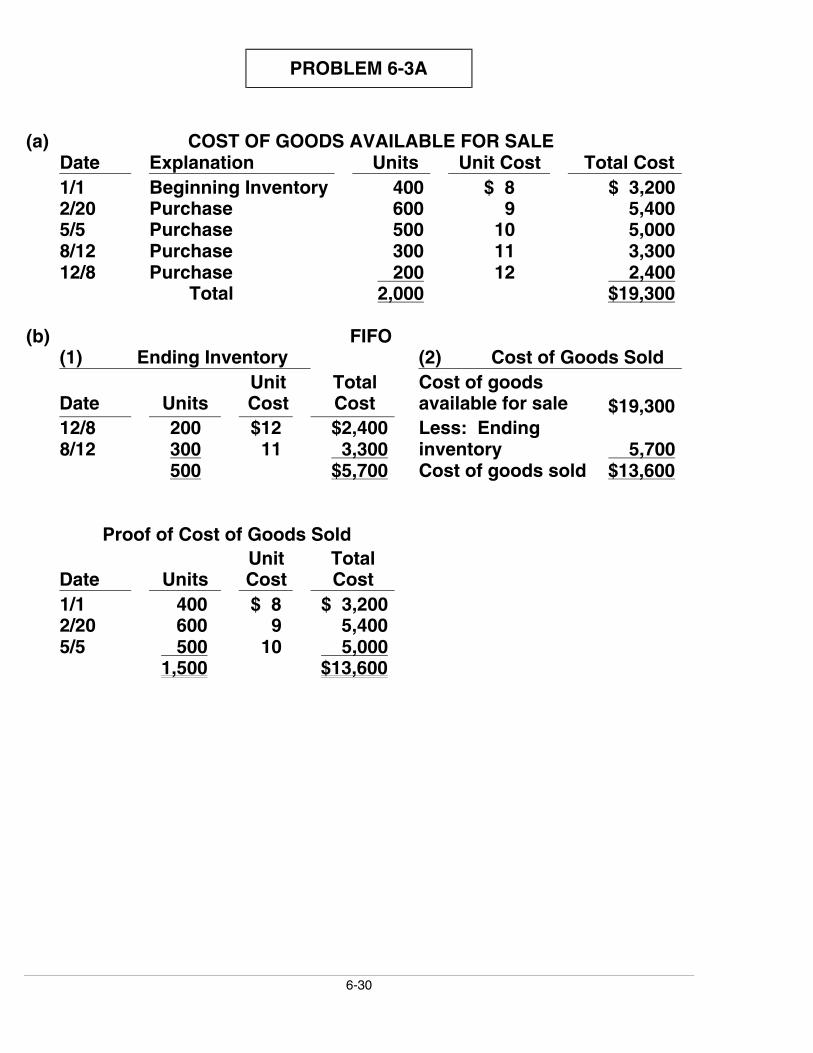
PROBLEM 6-3A
(a) COST OF GOODS AVAILABLE FOR SALEDate Explanation Units Unit Cost Total Cost1/1 Beginning Inventory 400 $ 8 $ 3,2002/20 Purchase 600 9 5,4005/5 Purchase 500 10 5,0008/12 Purchase 300 11 3,30012/8 Purchase 200 12 2,400
Total 2,000 $19,300
(b) FIFO(1) Ending Inventory (2) Cost of Goods Sold
Date UnitsUnitCost
TotalCost
Cost of goodsavailable for sale $19,300
12/8 200 $12 $2,4008/12 300 11 3,300
Less: Endinginventory 5,700
500 $5,700 Cost of goods sold $13,600
Proof of Cost of Goods Sold
Date UnitsUnitCost
TotalCost
1/1 400 $ 8 $ 3,2002/20 600 9 5,4005/5 500 10 5,000
1,500 $13,600

6-31
PROBLEM 6-3A (Continued)
(b) LIFO(1) Ending Inventory (2) Cost of Goods Sold
Date UnitsUnitCost
TotalCost
Cost of goodsavailable for sale $19,300
1/1 400 $8 $3,2002/20 100 9 900
Less: Endinginventory 4,100
500 $4,100 Cost of goods sold $15,200
Proof of Cost of Goods Sold
Date UnitsUnitCost
TotalCost
12/8 200 $12 $ 2,4008/12 300 11 3,3005/5 500 10 5,0002/20 500 9 4,500
1,500 $15,200
AVERAGE-COST(1) Ending Inventory (2) Cost of Goods Sold
$19,300 ÷ 2,000 = $9.65 Cost of goodsavailable for sale $19,300
UnitsUnitCost
TotalCost
Less: Endinginventory 4,825
500 $9.65 $4,825 Cost of goods sold $14,475
Proof of Cost of Goods Sold1,500 units X 9.65 = $14,475
(c) (1) LIFO results in the lowest inventory amount for the balance sheet,$4,100.
(2) FIFO results in the lowest cost of goods sold, $13,600.
6-32
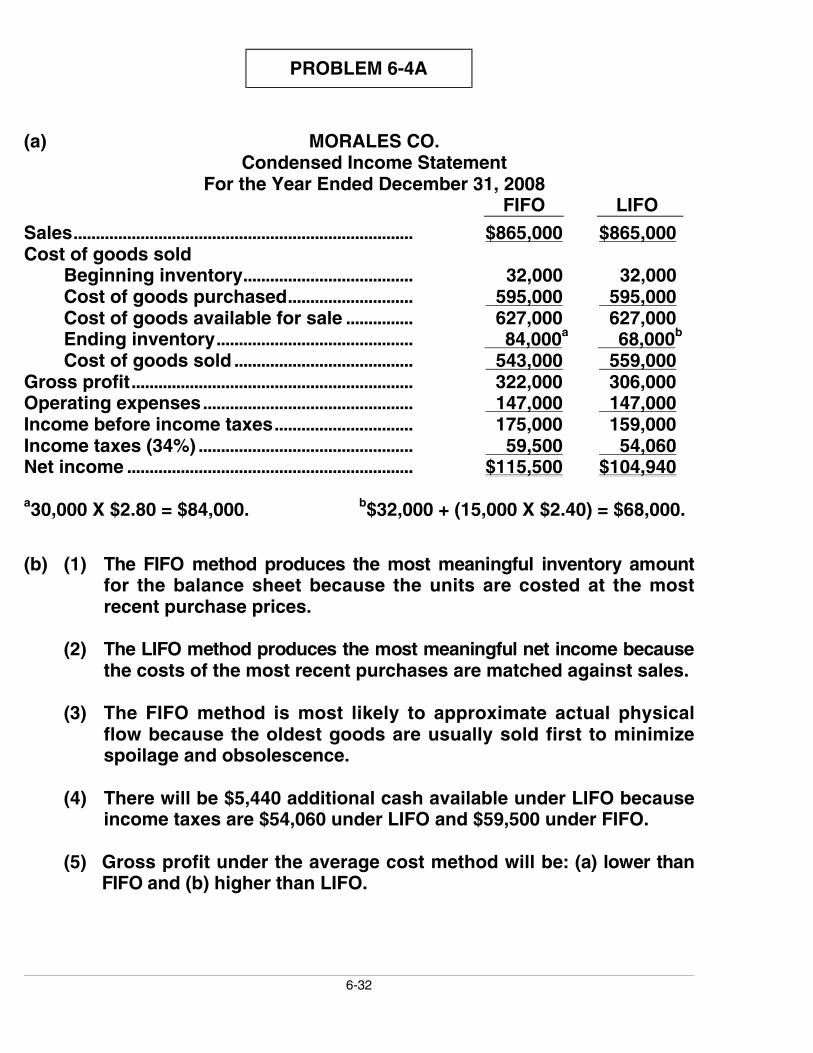
PROBLEM 6-4A
(a) MORALES CO.Condensed Income Statement
For the Year Ended December 31, 2008FIFO LIFO
Sales............................................................................ $865,000 $865,000Cost of goods sold
Beginning inventory...................................... 32,000 32,000Cost of goods purchased............................ 595,000 595,000Cost of goods available for sale ............... 627,000 627,000Ending inventory............................................ 84,000a 68,000b
Cost of goods sold ........................................ 543,000 559,000Gross profit............................................................... 322,000 306,000Operating expenses............................................... 147,000 147,000Income before income taxes............................... 175,000 159,000Income taxes (34%) ................................................ 59,500 54,060Net income ................................................................ $115,500 $104,940
a30,000 X $2.80 = $84,000. b$32,000 + (15,000 X $2.40) = $68,000.
(b) (1) The FIFO method produces the most meaningful inventory amountfor the balance sheet because the units are costed at the mostrecent purchase prices.
(2) The LIFO method produces the most meaningful net income becausethe costs of the most recent purchases are matched against sales.
(3) The FIFO method is most likely to approximate actual physicalflow because the oldest goods are usually sold first to minimizespoilage and obsolescence.
(4) There will be $5,440 additional cash available under LIFO becauseincome taxes are $54,060 under LIFO and $59,500 under FIFO.
(5) Gross profit under the average cost method will be: (a) lower thanFIFO and (b) higher than LIFO.
6-33
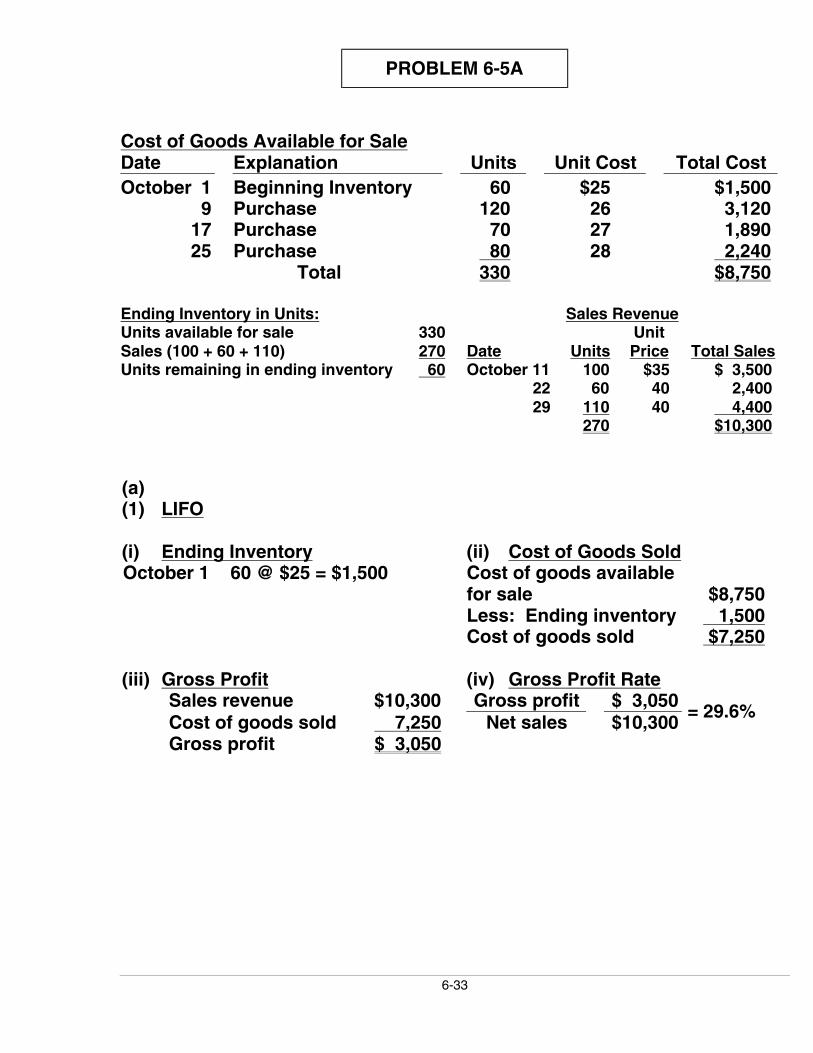
PROBLEM 6-5A
Cost of Goods Available for SaleDate Explanation Units Unit Cost Total CostOctober 1 Beginning Inventory 60 $25 $1,500
9 Purchase 120 26 3,12017 Purchase 70 27 1,89025 Purchase 80 28 2,240
Total 330 $8,750
Ending Inventory in Units: Sales RevenueUnits available for sale 330 UnitSales (100 + 60 + 110) 270 Date Units Price Total SalesUnits remaining in ending inventory 60 October 11 100 $35 $ 3,500
22 60 40 2,40029 110 40 4,400
270 $10,300
(a)(1) LIFO
(i) Ending Inventory (ii) Cost of Goods SoldOctober 1 60 @ $25 = $1,500 Cost of goods available
for sale $8,750Less: Ending inventory 1,500Cost of goods sold $7,250
(iii) Gross Profit (iv) Gross Profit RateSales revenue $10,300 Gross profit $ 3,050Cost of goods sold 7,250 Net sales $10,300
= 29.6%
Gross profit $ 3,050
6-34
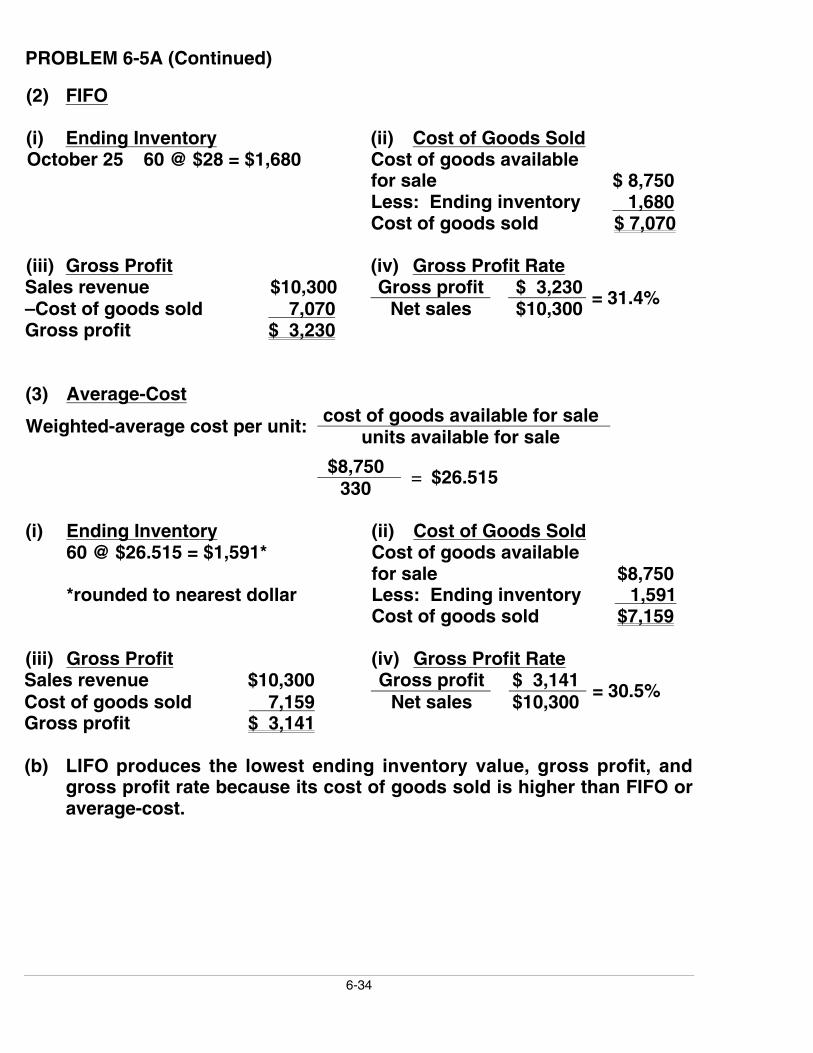
PROBLEM 6-5A (Continued)
(2) FIFO
(i) Ending Inventory (ii) Cost of Goods SoldOctober 25 60 @ $28 = $1,680 Cost of goods available
for sale $ 8,750Less: Ending inventory 1,680Cost of goods sold $ 7,070
(iii) Gross Profit (iv) Gross Profit RateSales revenue $10,300 Gross profit $ 3,230–Cost of goods sold 7,070 Net sales $10,300 = 31.4%
Gross profit $ 3,230
(3) Average-Costcost of goods available for saleWeighted-average cost per unit: units available for sale
$8,750330
= $26.515
(i) Ending Inventory (ii) Cost of Goods Sold60 @ $26.515 = $1,591* Cost of goods available
for sale $8,750*rounded to nearest dollar Less: Ending inventory 1,591
Cost of goods sold $7,159
(iii) Gross Profit (iv) Gross Profit RateSales revenue $10,300 Gross profit $ 3,141Cost of goods sold 7,159 Net sales $10,300
= 30.5%
Gross profit $ 3,141
(b) LIFO produces the lowest ending inventory value, gross profit, andgross profit rate because its cost of goods sold is higher than FIFO oraverage-cost.
6-35
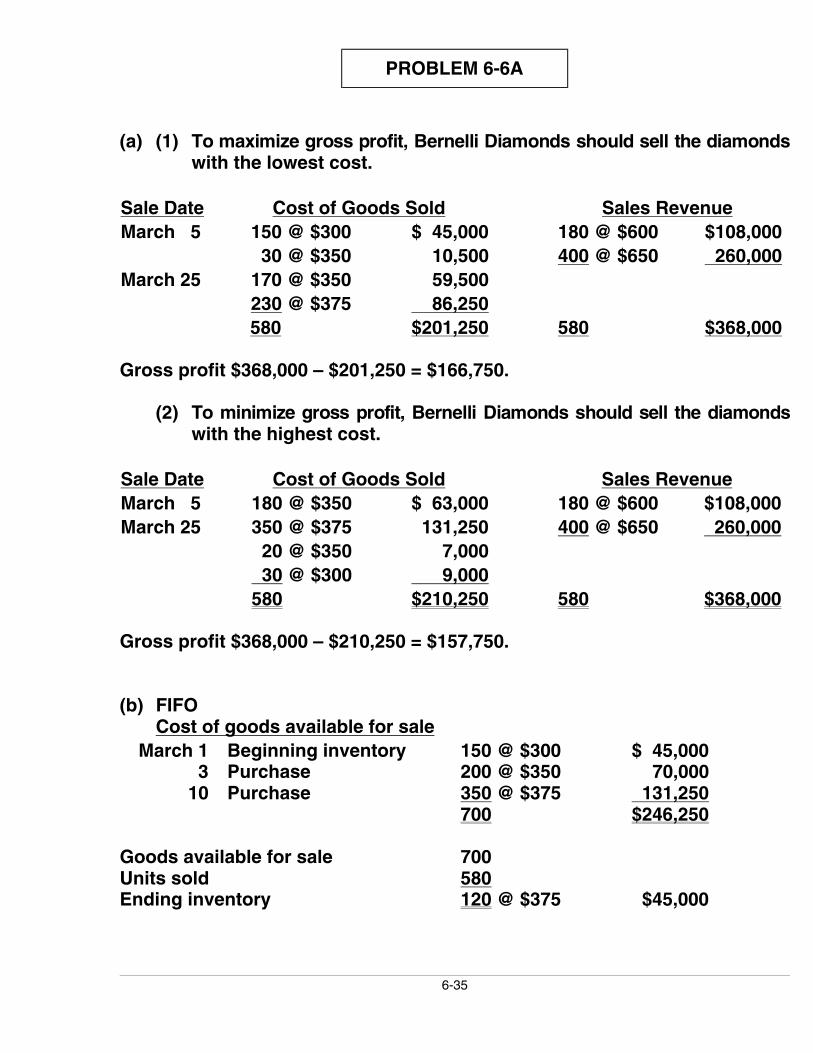
PROBLEM 6-6A
(a) (1) To maximize gross profit, Bernelli Diamonds should sell the diamondswith the lowest cost.
Sale Date Cost of Goods Sold Sales RevenueMarch 5 150 @ $300 $ 45,000 180 @ $600 $108,000
30 @ $350 10,500 400 @ $650 260,000March 25 170 @ $350 59,500
230 @ $375 86,250580 $201,250 580 $368,000
Gross profit $368,000 – $201,250 = $166,750.
(2) To minimize gross profit, Bernelli Diamonds should sell the diamondswith the highest cost.
Sale Date Cost of Goods Sold Sales RevenueMarch 5 180 @ $350 $ 63,000 180 @ $600 $108,000March 25 350 @ $375 131,250 400 @ $650 260,000
20 @ $350 7,000 30 @ $300 9,000580 $210,250 580 $368,000
Gross profit $368,000 – $210,250 = $157,750.
(b) FIFOCost of goods available for sale
March 1 Beginning inventory 150 @ $300 $ 45,0003 Purchase 200 @ $350 70,000
10 Purchase 350 @ $375 131,250700 $246,250
Goods available for sale 700Units sold 580Ending inventory 120 @ $375 $45,000
6-36
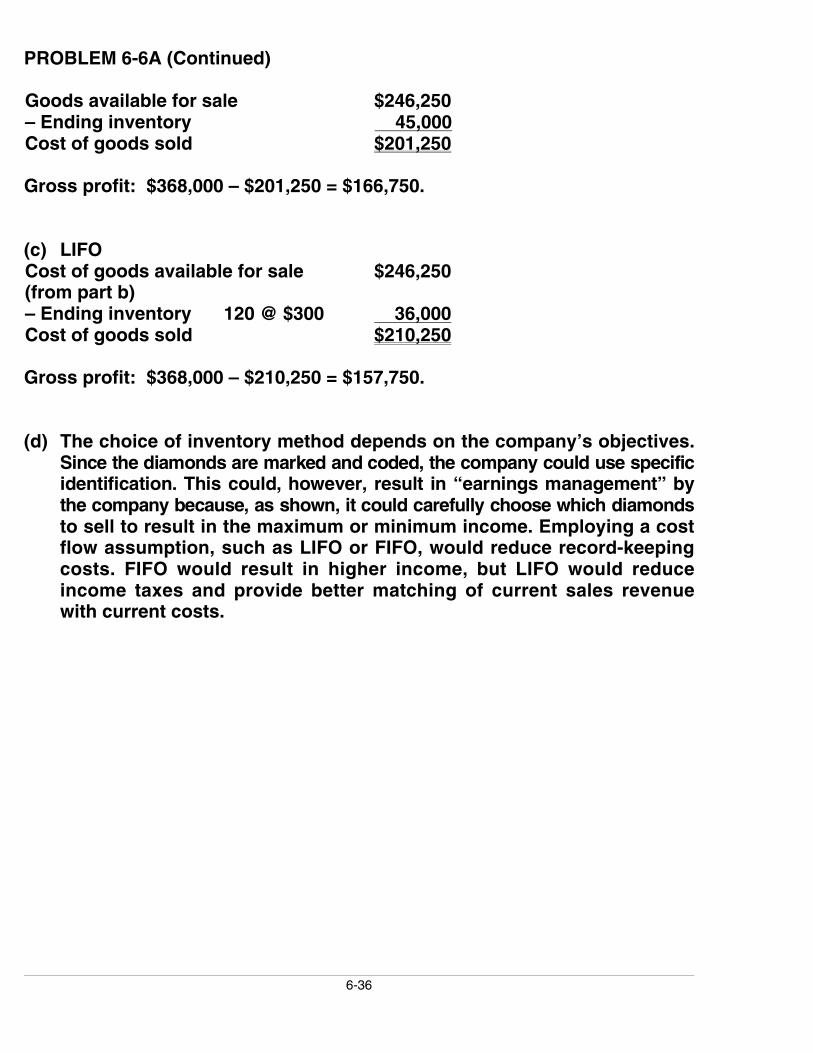
PROBLEM 6-6A (Continued)
Goods available for sale $246,250– Ending inventory 45,000Cost of goods sold $201,250
Gross profit: $368,000 – $201,250 = $166,750.
(c) LIFOCost of goods available for sale $246,250(from part b)– Ending inventory 120 @ $300 36,000Cost of goods sold $210,250
Gross profit: $368,000 – $210,250 = $157,750.
(d) The choice of inventory method depends on the company’s objectives.Since the diamonds are marked and coded, the company could use specificidentification. This could, however, result in “earnings management” bythe company because, as shown, it could carefully choose which diamondsto sell to result in the maximum or minimum income. Employing a costflow assumption, such as LIFO or FIFO, would reduce record-keepingcosts. FIFO would result in higher income, but LIFO would reduceincome taxes and provide better matching of current sales revenuewith current costs.
6-37
PROBLEM 6-7A
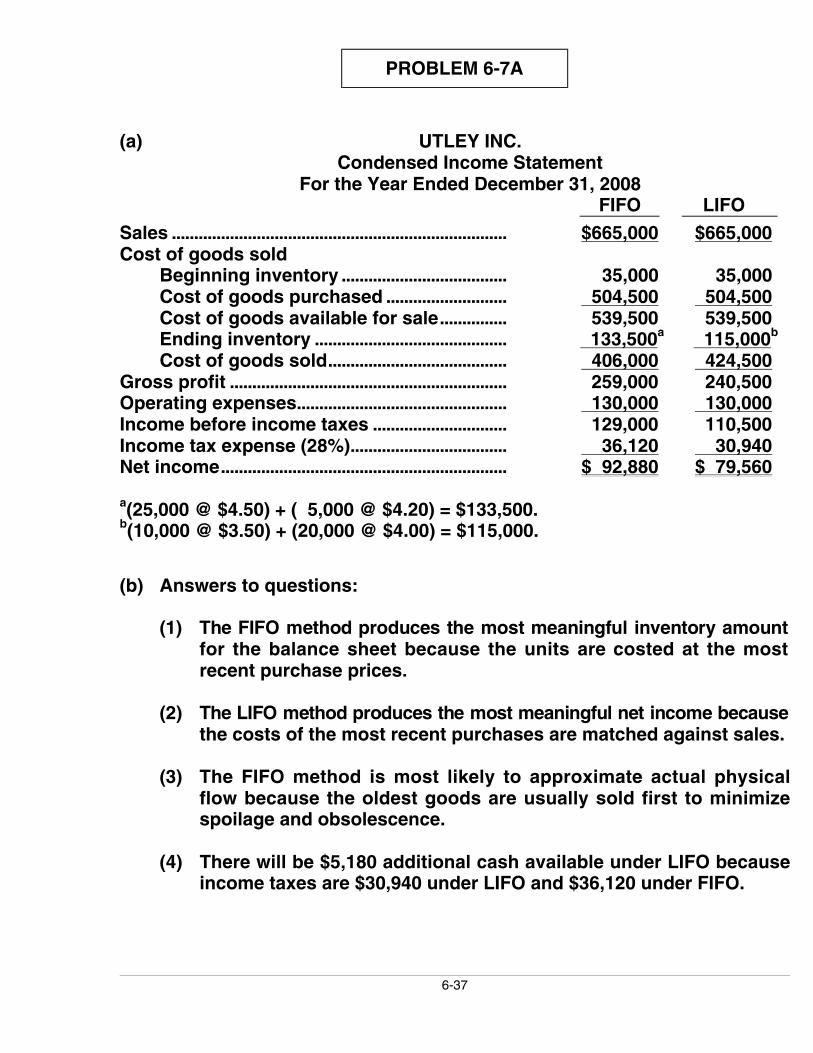
(a) UTLEY INC.Condensed Income Statement
For the Year Ended December 31, 2008FIFO LIFO
Sales ........................................................................... $665,000 $665,000Cost of goods sold
Beginning inventory ..................................... 35,000 35,000Cost of goods purchased ........................... 504,500 504,500Cost of goods available for sale............... 539,500 539,500Ending inventory ........................................... 133,500a 115,000b
Cost of goods sold........................................ 406,000 424,500Gross profit .............................................................. 259,000 240,500Operating expenses............................................... 130,000 130,000Income before income taxes .............................. 129,000 110,500Income tax expense (28%)................................... 36,120 30,940Net income................................................................ $ 92,880 $ 79,560
a(25,000 @ $4.50) + ( 5,000 @ $4.20) = $133,500.b(10,000 @ $3.50) + (20,000 @ $4.00) = $115,000.
(b) Answers to questions:
(1) The FIFO method produces the most meaningful inventory amountfor the balance sheet because the units are costed at the mostrecent purchase prices.
(2) The LIFO method produces the most meaningful net income becausethe costs of the most recent purchases are matched against sales.
(3) The FIFO method is most likely to approximate actual physicalflow because the oldest goods are usually sold first to minimizespoilage and obsolescence.
(4) There will be $5,180 additional cash available under LIFO becauseincome taxes are $30,940 under LIFO and $36,120 under FIFO.

6-38
PROBLEM 6-7A (Continued)
(5) The illusionary gross profit is $18,500 or ($259,000 – $240,500). UnderLIFO, Utley Inc. has recovered the current replacement cost of theunits ($424,500), whereas under FIFO, it has only recovered theearlier costs ($406,000). This means that under FIFO the companymust reinvest $18,500 of the gross profit to replace the units used.
Answer in business letter form:
Dear Utley Inc.
After preparing the comparative condensed income statements for2008 under FIFO and LIFO methods, we have found the following:
The FIFO method produces the most meaningful inventory amountfor the balance sheet because the units are costed at the mostrecent purchase prices. This method is most likely to approximateactual physical flow because the oldest goods are usually soldfirst to minimize spoilage and obsolescence.
The LIFO method produces the most meaningful net income becausethe costs of the most recent purchases are matched against sales.There will be $5,180 additional cash available under LIFO becauseincome taxes are $30,940 under LIFO and $36,120 under FIFO.
There exists an illusionary gross profit of $18,500 ($259,000 –$240,500). Under LIFO, you have recovered the current replacementcost of the units ($424,500) whereas under FIFO you have onlyrecovered the earlier costs ($406,000). This means that underFIFO, the company must reinvest $18,500 of the gross profit toreplace the units sold.
Sincerely,

6-39
*PROBLEM 6-8A
(a) Cost of goods available for sale:
Inventory 150 units @ $17 $ 2,550Purchases:
January 2 100 units @ $21 2,100January 9 75 units @ $24 1,800January 10 return (15 units @ $24) (360)January 23 100 units @ $28 2,800
410 units $ 8,890
Sales:Date
January 6 150 units @ $40 $ 6,000January 9 (return) (10 units @ $40) (400)January 10 50 units @ $45 2,250January 30 110 units @ $50 5,500
Total sales $13,350
(1) LIFODate Purchases Cost of Goods Sold Balance
January 1 (150 @ $17) $2,550
(150 @ $17)January 2 (100 @ $21) $2,100 (100 @ $21) } $4,650
January 6 (100 @ $21) (100 @ $17) $1,700( 50 @ $17) } $2,950
January 9 ( 75 @ $24) $1,800 (110 @ $17)January 9 (–10 @ $17) ($ 170) ( 75 @ $24) } $3,670
January 10 (–15 @ $24) ($ 360) (110 @ $17)( 60 @ $24) } $3,310
January 10 ( 50 @ $24) $1,200 (110 @ $17)( 10 @ $24) } $2,110
January 23 (100 @ $28) $2,800 (110 @ $17)( 10 @ $24) $4,910(100 @ $28)
}January 30 (100 @ $28) (110 @ $17) $1,870
( 10 @ $24)$3,040}$7,020
(i) Cost of goods sold: $8,890 – $1,870 = $7,020. (ii) Ending inventory =$1,870. (iii) Gross profit = $13,350 – $7,020 = $6,330

6-40
*PROBLEM 6-8A (Continued)
(2) FIFO
Date Purchases Cost of Goods Sold Balance
January 1 (150 @ $17) $2,550(150 @ $17)
January 2 (100 @ $21) $2,100 (100 @ $21) } $4,650
January 6 (150 @ $17) $2,550 (100 @ $21) $2,100January 9 (–10 @ $17) ($ 170) ( 10 @ $17)January 9 ( 75 @ $24) $1,800 (100 @ $21)
( 75 @ $24)} $4,070
( 10 @ $17)(100 @ $21)
January 10 (–15 @ $24) ($ 360) ( 60 @ $24)} $3,710
January 10 ( 10 @ $17) ( 60 @ $21)( 40 @ $21) } $1,010
( 60 @ $24) } $2,700
January 23 (100 @ $28) $2,800 ( 60 @ $21)( 60 @ $24)(100 @ $28)
} $5,500
January 30 ( 60 @ $21) ( 10 @ $24)( 50 @ $24) } $2,460
(100 @ $28) } $3,040
$5,850
(i) Cost of goods sold: $8,890 – $3,040 = $5,850. (ii) Ending inventory =$3,040. (iii) Gross profit = $13,350 – $5,850 = $7,500.
(3) Moving-Average
Date Purchases Cost of goods sold Balance
January 1 (150 @ $17) $2,550January 2 (100 @ $21) $2,100 (250 @ $18.60)a $4,650
January 6 (150 @ $18.60) $2,790 (100 @ $18.60) $1,860January 9 (–10 @ $18.60) ($ 186) (110 @ $18.60) $2,046
January 9 ( 75 @ $24) $1,800 (185 @ $20.789)b $3,846
January 10 (–15 @ $24) ($ 360) (170 @ $20.506)c $3,486January 10 ( 50 @ $20.506) $1,025 (120 @ $20.506) $2,461
January 23 (100 @ $28) $2,800 (220 @ $23.914)d $5,261
January 30 (110 @ $23.914) $2,631 (110 @ $23.914) $2,630$6,260
a$4,650 ÷ 250 = $18.60 c$3,486 ÷ 170 = $20.506b$3,846 ÷ 185 = $20.789 d$5,261 ÷ 220 = $23.914
(i) Cost of goods sold: $8,890 – $2,630 = $6,260. (ii) Ending inventory =$2,630. (iii) Gross profit = $13,350 – $6,260 = $7,090.

6-41
*PROBLEM 6-8A (Continued)
(b)Gross profit: LIFO FIFO Moving-AverageSales $13,350 $13,350 $13,350–Cost of goods sold 7,020 5,850 6,260Gross profit $ 6,330 $ 7,500 $ 7,090Ending inventory $ 1,870 $ 3,040 $ 2,630
In a period of rising costs, the LIFO cost flow assumption results in thehighest cost of goods sold and lowest gross profit. FIFO gives thelowest cost of goods sold and highest gross profit. The weightedaverage cost flow assumption results in amounts between the other two.
On the balance sheet, FIFO gives the highest ending inventory (represent-ing the most current costs); LIFO gives the lowest ending inventory(representing the oldest costs); and average-cost results in an endinginventory falling between the other two.
6-42
*PROBLEM 6-9A
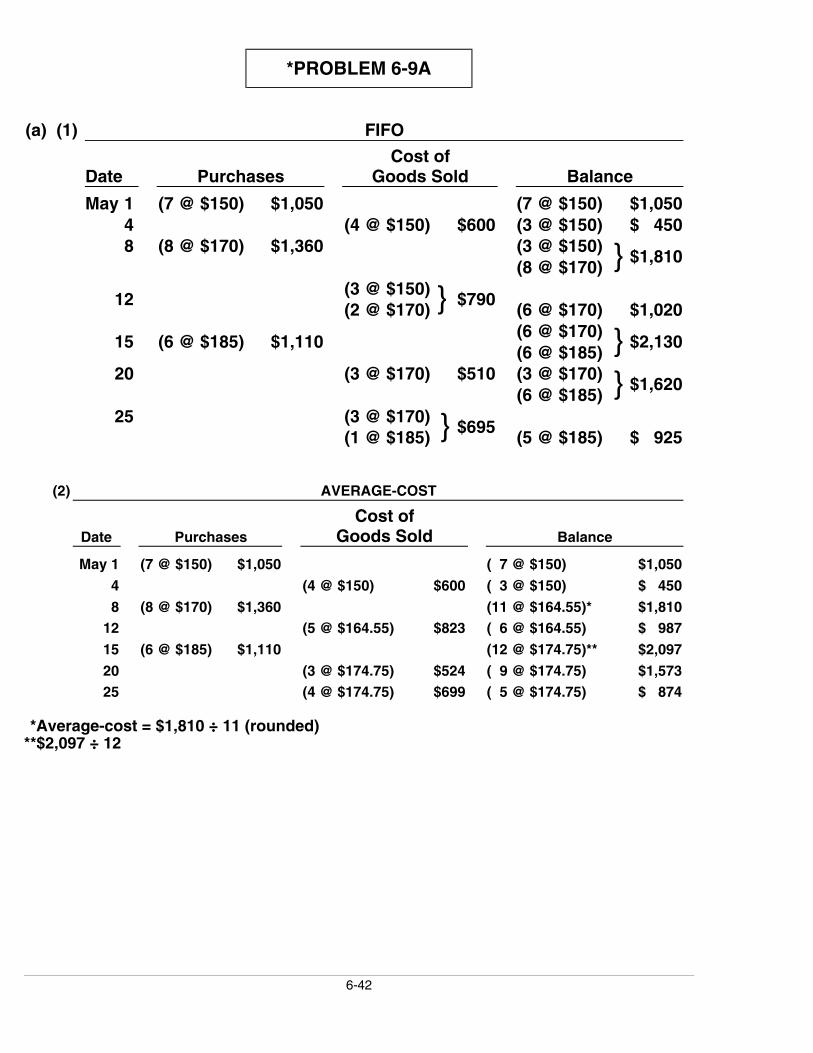
(a) (1) FIFO
Date PurchasesCost of
Goods Sold Balance
May 1 (7 @ $150) $1,050 (7 @ $150) $1,0504 (4 @ $150) $600 (3 @ $150) $ 4508 (8 @ $170) $1,360 (3 @ $150)
(8 @ $170) } $1,810
(3 @ $150)12
(2 @ $170) } $790(6 @ $170) $1,020(6 @ $170)
15 (6 @ $185) $1,110(6 @ $185) } $2,130
20 (3 @ $170) $510 (3 @ $170)(6 @ $185) } $1,620
25 (3 @ $170)(1 @ $185) } $695
(5 @ $185) $ 925
(2) AVERAGE-COST
Date PurchasesCost of
Goods Sold Balance
May 1 (7 @ $150) $1,050 ( 7 @ $150) $1,050
4 (4 @ $150) $600 ( 3 @ $150) $ 450
8 (8 @ $170) $1,360 (11 @ $164.55)* $1,81012 (5 @ $164.55) $823 ( 6 @ $164.55) $ 987
15 (6 @ $185) $1,110 (12 @ $174.75)** $2,097
20 (3 @ $174.75) $524 ( 9 @ $174.75) $1,57325 (4 @ $174.75) $699 ( 5 @ $174.75) $ 874
*Average-cost = $1,810 ÷ 11 (rounded)**$2,097 ÷ 12

6-43
*PROBLEM 6-9A (Continued)
(3) LIFO
Date PurchasesCost of
Goods Sold Balance
May 1 (7 @ $150) $1,050 (7 @ $150) $1,0504 (4 @ $150) $600 (3 @ $150) $ 4508 (8 @ $170) $1,360 (3 @ $150)
(8 @ $170) } $1,810
(3 @ $150)12 (5 @ $170) $850
(3 @ $170) } $ 960
(3 @ $150)15 (6 @ $185) $1,110
(3 @ $170)(6 @ $185)
} $2,070
(3 @ $150)20 (3 @ $185) $555
(3 @ $170)(3 @ $185)
} $1,515
(3 @ $185) (3 @ $150)25
(1 @ $170) } $725(2 @ $170) } $ 790
(b) (1) The highest ending inventory is $925 under the FIFO method.(2) The lowest ending inventory is $790 under the LIFO method.

6-44
*PROBLEM 6-10A
(a) February
Net sales ........................................................... $300,000Cost of goods sold
Beginning inventory............................ $ 4,500Net purchases ....................................... $197,800Add: Freight-in..................................... 2,900Cost of goods purchased.................. 200,700Cost of goods available for sale ..... 205,200Ending inventory.................................. 13,200
Cost of goods sold ...................... 192,000Gross profit...................................................... $108,000
$108,000Gross profit rate =$300,000
= 36%
(b) Net sales ......................................................................... $250,000Less: Estimated gross profit
(36% X $250,000) ........................................ 90,000Estimated cost of goods sold.................................. $160,000
Beginning inventory.................................................... $ 13,200Net purchases ............................................................... $191,000Add: Freight-in............................................................. 4,000Cost of goods purchased.......................................... 195,000Cost of goods available for sale ............................. 208,200Less: Estimated cost of goods sold..................... 160,000Estimated total cost of ending inventory .................................................................... 48,200Less: Inventory not lost (30% X $48,200)........................................................ 14,460Estimated inventory lost in fire (70% X $48,200) ....................................................... $ 33,740
6-45
*PROBLEM 6-11A
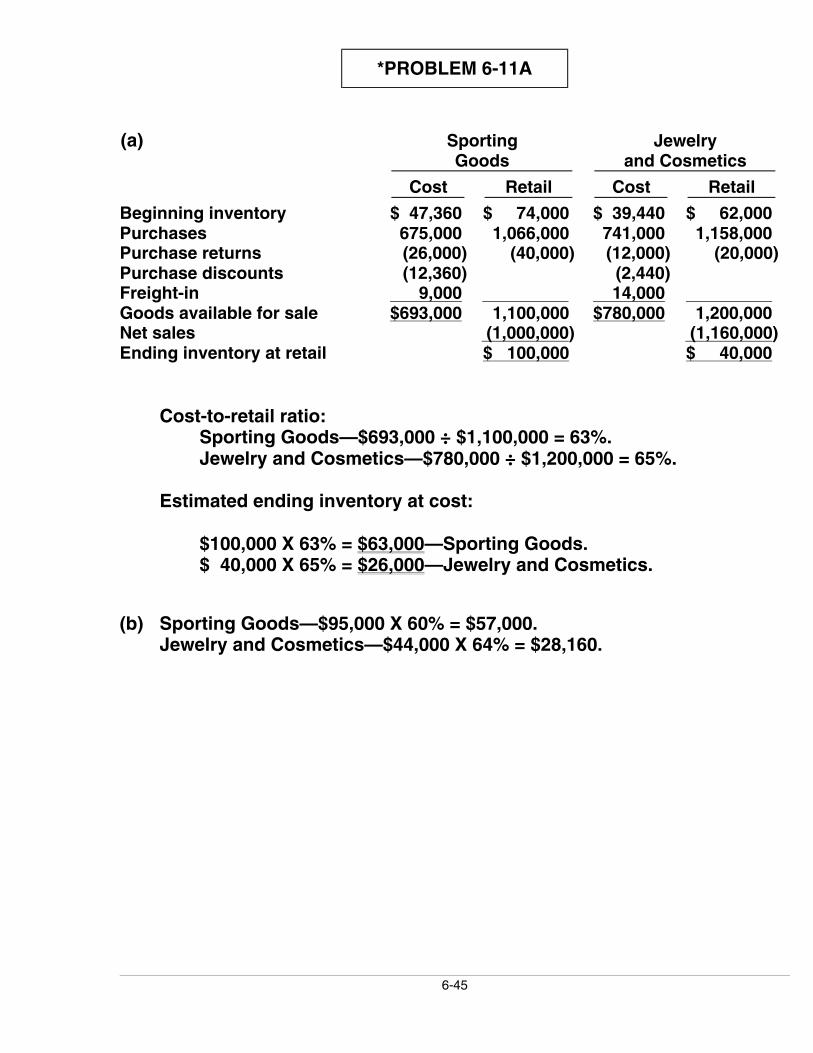
(a) SportingGoods
Jewelryand Cosmetics
Cost Retail Cost Retail
Beginning inventory $ 47,360 $ 74,000 $ 39,440 $ 62,000Purchases 675,000 1,066,000 741,000 1,158,000Purchase returns (26,000) (40,000) (12,000) (20,000)Purchase discounts (12,360) (2,440)Freight-in 9,000 14,000 Goods available for sale $693,000 1,100,000 $780,000 1,200,000Net sales (1,000,000) (1,160,000)Ending inventory at retail $ 100,000 $ 40,000
Cost-to-retail ratio:Sporting Goods—$693,000 ÷ $1,100,000 = 63%.Jewelry and Cosmetics—$780,000 ÷ $1,200,000 = 65%.
Estimated ending inventory at cost:
$100,000 X 63% = $63,000—Sporting Goods.$ 40,000 X 65% = $26,000—Jewelry and Cosmetics.
(b) Sporting Goods—$95,000 X 60% = $57,000.Jewelry and Cosmetics—$44,000 X 64% = $28,160.

6-46
PROBLEM 6-1B
(a) Title to the goods does not transfer to the customer until March 2.Include the $800 in ending inventory.
(b) Slaymakker owns the goods once they are shipped on February 26.Include inventory of $375.
(c) Include $500 inventory.
(d) Exclude the items from Slaymakker’s inventory. Title remains with theconsignor.
(e) Title of the goods does not transfer to Slaymakker until March 2.Exclude this amount from the February 28 inventory.
(f) The sale will be recorded on February 26. The goods (cost, $300) shouldbe excluded from Slaymakker’s inventory at the end of February.

6-47
PROBLEM 6-2B
(a) COST OF GOODS AVAILABLE FOR SALEDate Explanation Units Unit Cost Total CostOct. 1 Beginning Inventory 1,000 $5 $ 5,000
3 Purchase 3,500 6 21,0009 Purchase 4,000 7 28,000
19 Purchase 2,000 8 16,00025 Purchase 2,000 9 18,000
Total 12,500 $88,000
(b) FIFO(1) Ending Inventory (2) Cost of Goods Sold
Date UnitsUnitCost
TotalCost
Cost of goodsavailable for sale $88,000
Oct. 25 2,000 $9 $18,00019 1,000 8 8,000
Less: Endinginventory 26,000
3,000* $26,000 Cost of goods sold $62,000
*12,500 – 9,500 = 3,000
Proof of Cost of Goods SoldDate Units Unit Cost Total CostOct. 1 1,000 $5 $ 5,000
3 3,500 6 21,0009 4,000 7 28,000
19 1,000 8 8,000 9,500 $62,000
LIFO(1) Ending Inventory (2) Cost of Goods Sold
Date UnitsUnitCost
TotalCost
Cost of goodsavailable for sale $88,000
Oct. 1 1,000 $5 $ 5,000 3 2,000 6 12,000
Less: Endinginventory 17,000
3,000 $17,000 Cost of goods sold $71,000
6-48
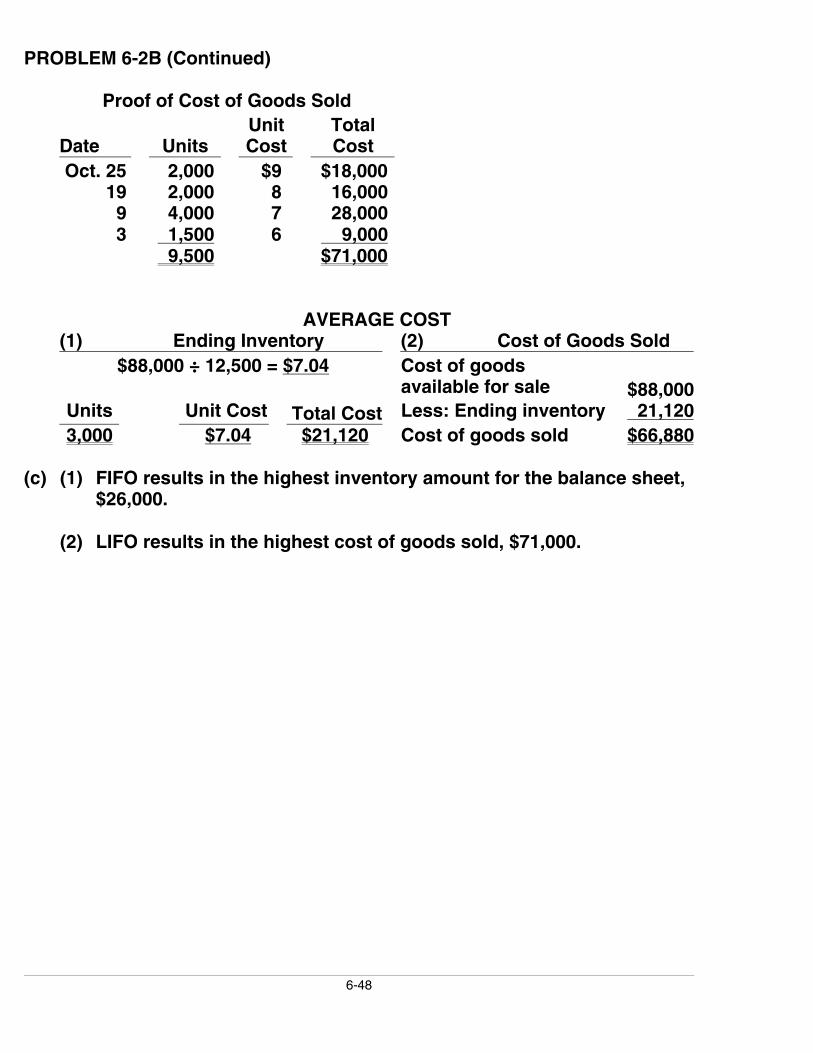
PROBLEM 6-2B (Continued)
Proof of Cost of Goods Sold
Date UnitsUnitCost
TotalCost
Oct. 25 2,000 $9 $18,000 19 2,000 8 16,000 9 4,000 7 28,000 3 1,500 6 9,000
9,500 $71,000
AVERAGE COST(1) Ending Inventory (2) Cost of Goods Sold
$88,000 ÷ 12,500 = $7.04 Cost of goodsavailable for sale $88,000
Units Unit Cost Total Cost Less: Ending inventory 21,1203,000 $7.04 $21,120 Cost of goods sold $66,880
(c) (1) FIFO results in the highest inventory amount for the balance sheet,$26,000.
(2) LIFO results in the highest cost of goods sold, $71,000.
6-49
PROBLEM 6-3B
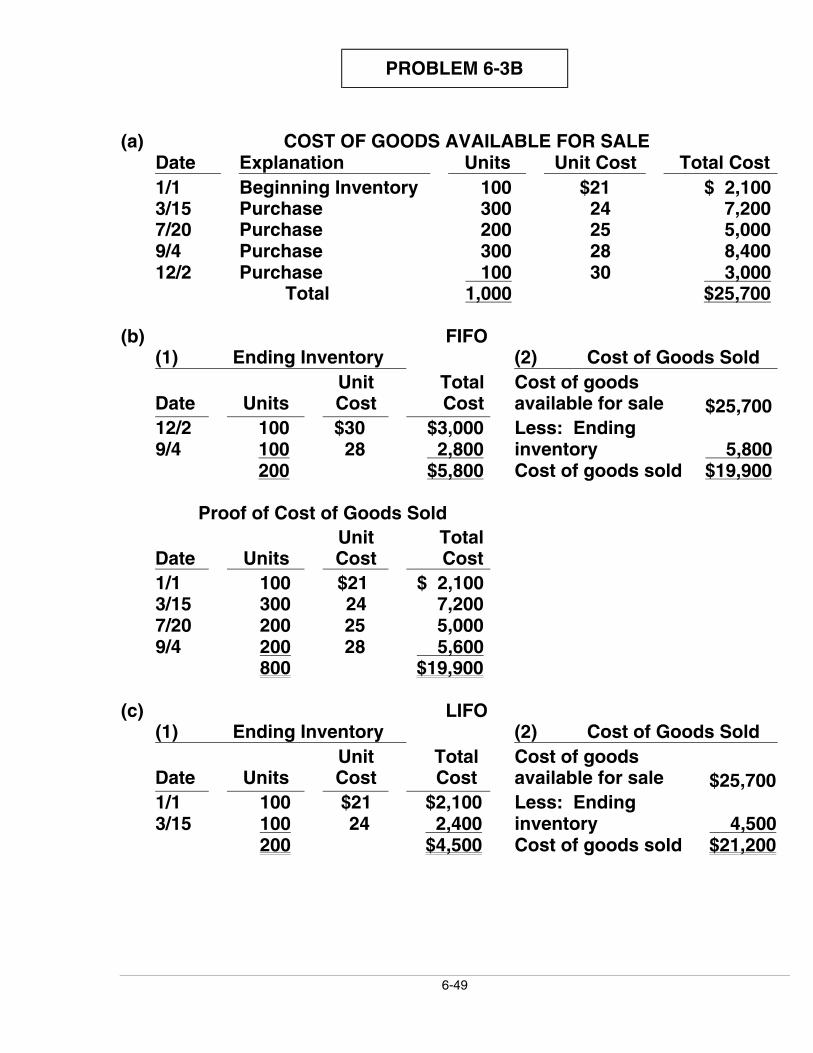
(a) COST OF GOODS AVAILABLE FOR SALEDate Explanation Units Unit Cost Total Cost1/1 Beginning Inventory 100 $21 $ 2,1003/15 Purchase 300 24 7,2007/20 Purchase 200 25 5,0009/4 Purchase 300 28 8,40012/2 Purchase 100 30 3,000
Total 1,000 $25,700
(b) FIFO(1) Ending Inventory (2) Cost of Goods Sold
Date UnitsUnitCost
TotalCost
Cost of goodsavailable for sale $25,700
12/2 100 $30 $3,0009/4 100 28 2,800
Less: Endinginventory 5,800
200 $5,800 Cost of goods sold $19,900
Proof of Cost of Goods Sold
Date UnitsUnitCost
TotalCost
1/1 100 $21 $ 2,1003/15 300 24 7,2007/20 200 25 5,0009/4 200 28 5,600
800 $19,900
(c) LIFO(1) Ending Inventory (2) Cost of Goods Sold
Date UnitsUnitCost
TotalCost
Cost of goodsavailable for sale $25,700
1/1 100 $21 $2,1003/15 100 24 2,400
Less: Endinginventory 4,500
200 $4,500 Cost of goods sold $21,200

6-50
PROBLEM 6-3B (Continued)
Proof of Cost of Goods Sold
Date UnitsUnitCost
TotalCost
12/2 100 $30 $ 3,0009/4 300 28 8,4007/20 200 25 5,0003/15 200 24 4,800
800 $21,200
AVERAGE COST(1) Ending Inventory (2) Cost of Goods Sold
$25,700 ÷ 1,000 = $25.70 Cost of goods availablefor sale $25,700
Units Unit Cost Total Cost Less: Ending inventory 5,140200 $25.70 $5,140 Cost of goods sold $20,560
Proof of Cost of Goods Sold800 units X $25.70 = $20,560
(c) (1) FIFO results in the highest inventory amount, $5,800, as shown in(b) above.
(2) LIFO produces the highest cost of goods sold, $21,200, as shown in(b) above.
6-51
PROBLEM 6-4B
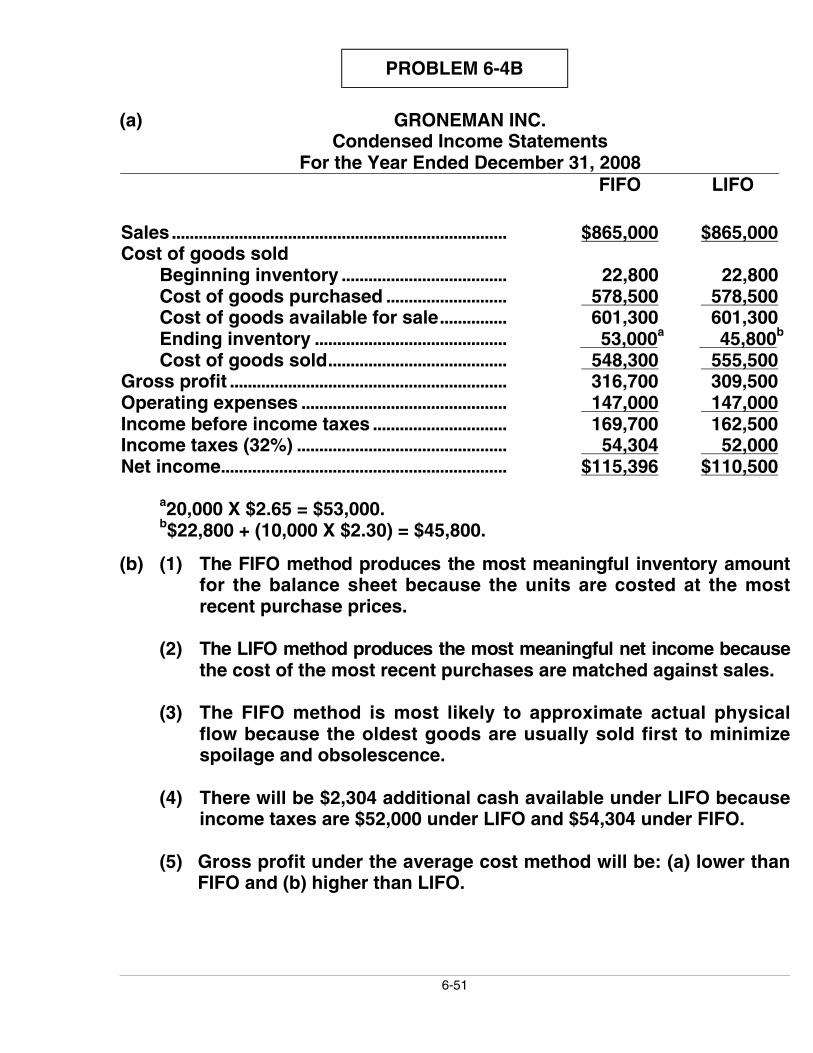
(a) GRONEMAN INC.Condensed Income Statements
For the Year Ended December 31, 2008FIFO LIFO
Sales........................................................................... $865,000 $865,000Cost of goods sold
Beginning inventory ..................................... 22,800 22,800Cost of goods purchased ........................... 578,500 578,500Cost of goods available for sale............... 601,300 601,300Ending inventory ........................................... 53,000a 45,800b
Cost of goods sold........................................ 548,300 555,500Gross profit .............................................................. 316,700 309,500Operating expenses .............................................. 147,000 147,000Income before income taxes .............................. 169,700 162,500Income taxes (32%) ............................................... 54,304 52,000Net income................................................................ $115,396 $110,500
a20,000 X $2.65 = $53,000.b$22,800 + (10,000 X $2.30) = $45,800.
(b) (1) The FIFO method produces the most meaningful inventory amountfor the balance sheet because the units are costed at the mostrecent purchase prices.
(2) The LIFO method produces the most meaningful net income becausethe cost of the most recent purchases are matched against sales.
(3) The FIFO method is most likely to approximate actual physicalflow because the oldest goods are usually sold first to minimizespoilage and obsolescence.
(4) There will be $2,304 additional cash available under LIFO becauseincome taxes are $52,000 under LIFO and $54,304 under FIFO.
(5) Gross profit under the average cost method will be: (a) lower thanFIFO and (b) higher than LIFO.
6-52
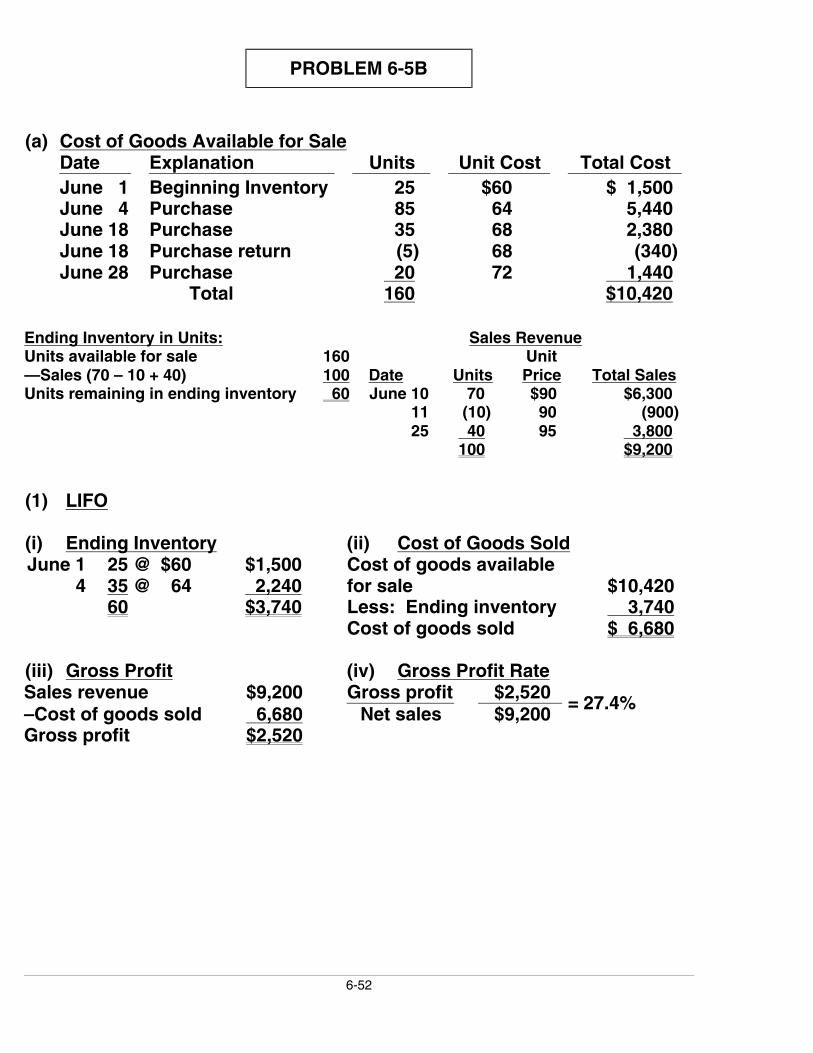
PROBLEM 6-5B
(a) Cost of Goods Available for SaleDate Explanation Units Unit Cost Total CostJune 1 Beginning Inventory 25 $60 $ 1,500June 4 Purchase 85 64 5,440June 18 Purchase 35 68 2,380June 18 Purchase return (5) 68 (340)June 28 Purchase 20 72 1,440
Total 160 $10,420
Ending Inventory in Units: Sales RevenueUnits available for sale 160 Unit—Sales (70 – 10 + 40) 100 Date Units Price Total SalesUnits remaining in ending inventory 60 June 10 70 $90 $6,300
11 (10) 90 (900)25 40 95 3,800
100 $9,200
(1) LIFO
(i) Ending Inventory (ii) Cost of Goods SoldJune 1
425 @ $6035 @ 64
$1,500 2,240
Cost of goods availablefor sale $10,420
60 $3,740 Less: Ending inventory 3,740Cost of goods sold $ 6,680
(iii) Gross Profit (iv) Gross Profit RateSales revenue $9,200 Gross profit $2,520–Cost of goods sold 6,680 Net sales $9,200
= 27.4%
Gross profit $2,520

6-53
PROBLEM 6-5B (Continued)
(2) FIFO
(i) Ending Inventory (ii) Cost of Goods SoldJune 28
1820 @ $7230 @ $68
$1,440 2,040
Cost of goods availablefor sale $10,420
4 10 @ $64 640 Less: Ending inventory 4,12060 $4,120 Cost of goods sold $ 6,300
(iii) Gross Profit (iv) Gross Profit RateSales revenue $9,200 Gross profit $2,900–Cost of goods sold 6,300 Net sales $9,200
= 31.5%
Gross profit $2,900
(3) Average-CostCost of goods available for saleWeighted-average cost per unit:
Units available for sale
$10,420160
= $65.125
(i) Ending Inventory (ii) Cost of Goods Sold60 units @$65.125 3,907.50 Cost of goods available
for sale $10,420.00Less: Ending inventory 3,907.50Cost of goods sold $ 6,512.50
(iii) Gross Profit (iv) Gross Profit RateSales revenue $9,200.00 Gross profit $2,687.50–Cost of goods sold 6,512.50 Net sales $9,200.00
= 29.2%
Gross profit $2,687.50
(b) In this period of rising prices, LIFO gives the highest cost of goodssold and the lowest gross profit. FIFO gives the lowest cost of goodssold and the highest gross profit.
6-54
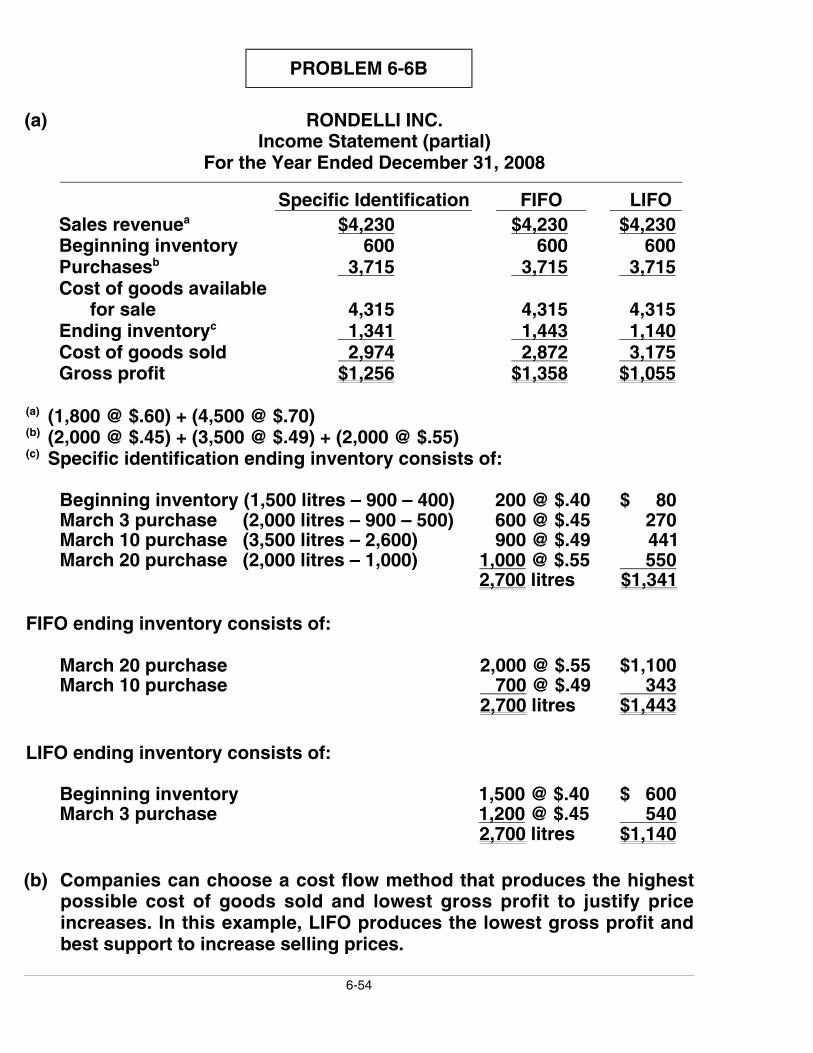
PROBLEM 6-6B
(a) RONDELLI INC.Income Statement (partial)
For the Year Ended December 31, 2008 Specific Identification FIFO LIFO
Sales revenuea $4,230 $4,230 $4,230Beginning inventory 600 600 600Purchasesb 3,715 3,715 3,715Cost of goods available
for sale 4,315 4,315 4,315Ending inventoryc 1,341 1,443 1,140Cost of goods sold 2,974 2,872 3,175Gross profit $1,256 $1,358 $1,055
(a) (1,800 @ $.60) + (4,500 @ $.70)(b) (2,000 @ $.45) + (3,500 @ $.49) + (2,000 @ $.55)(c) Specific identification ending inventory consists of:
Beginning inventory (1,500 litres – 900 – 400) 200 @ $.40 $ 80March 3 purchase (2,000 litres – 900 – 500) 600 @ $.45 270March 10 purchase (3,500 litres – 2,600) 900 @ $.49 441March 20 purchase (2,000 litres – 1,000) 1,000 @ $.55 550
2,700 litres $1,341
FIFO ending inventory consists of:
March 20 purchase 2,000 @ $.55 $1,100March 10 purchase 700 @ $.49 343
2,700 litres $1,443
LIFO ending inventory consists of:
Beginning inventory 1,500 @ $.40 $ 600March 3 purchase 1,200 @ $.45 540
2,700 litres $1,140
(b) Companies can choose a cost flow method that produces the highestpossible cost of goods sold and lowest gross profit to justify priceincreases. In this example, LIFO produces the lowest gross profit andbest support to increase selling prices.

6-55
PROBLEM 6-7B
(a) DAINS CO.Condensed Income Statement
For the Year Ended December 31, 2008
FIFO LIFOSales ........................................................................... $630,000 $630,000Cost of goods sold
Beginning inventory ..................................... 37,000 37,000Cost of goods purchased ........................... 479,000 479,000Cost of goods available for sale............... 516,000 516,000Ending inventory ........................................... 135,000a 121,000b
Cost of goods sold........................................ 381,000 395,000Gross profit .............................................................. 249,000 235,000Operating expenses............................................... 120,000 120,000Income before income taxes .............................. 129,000 115,000Income tax expense (30%)................................... 38,700 34,500Net income................................................................ $ 90,300 $ 80,500
a(20,000 @ $4.55) + (10,000 @ $4.40) = $135,000.b(10,000 @ $3.70) + (20,000 @ $4.20) = $121,000.
(b) Answers to questions:
(1) The FIFO method produces the most meaningful inventory amountfor the balance sheet because the units are costed at the mostrecent purchase prices.
(2) The LIFO method produces the most meaningful net incomebecause the costs of the most recent purchases are matchedagainst sales.
(3) The FIFO method is most likely to approximate actual physical flowbecause the oldest goods are usually sold first to minimizespoilage and obsolescence.
(4) There will be $4,200 additional cash available under LIFO becauseincome taxes are $34,500 under LIFO and $38,700 under FIFO.
(5) The illusionary gross profit is $14,000 or ($249,000 – $235,000).Under LIFO, Dains Co. has recovered the current replacement costof the units ($395,000), whereas under FIFO, it has only recoveredthe earlier costs ($381,000). This means that, under FIFO, thecompany must reinvest $14,000 of the gross profit to replace theunits used.
6-56
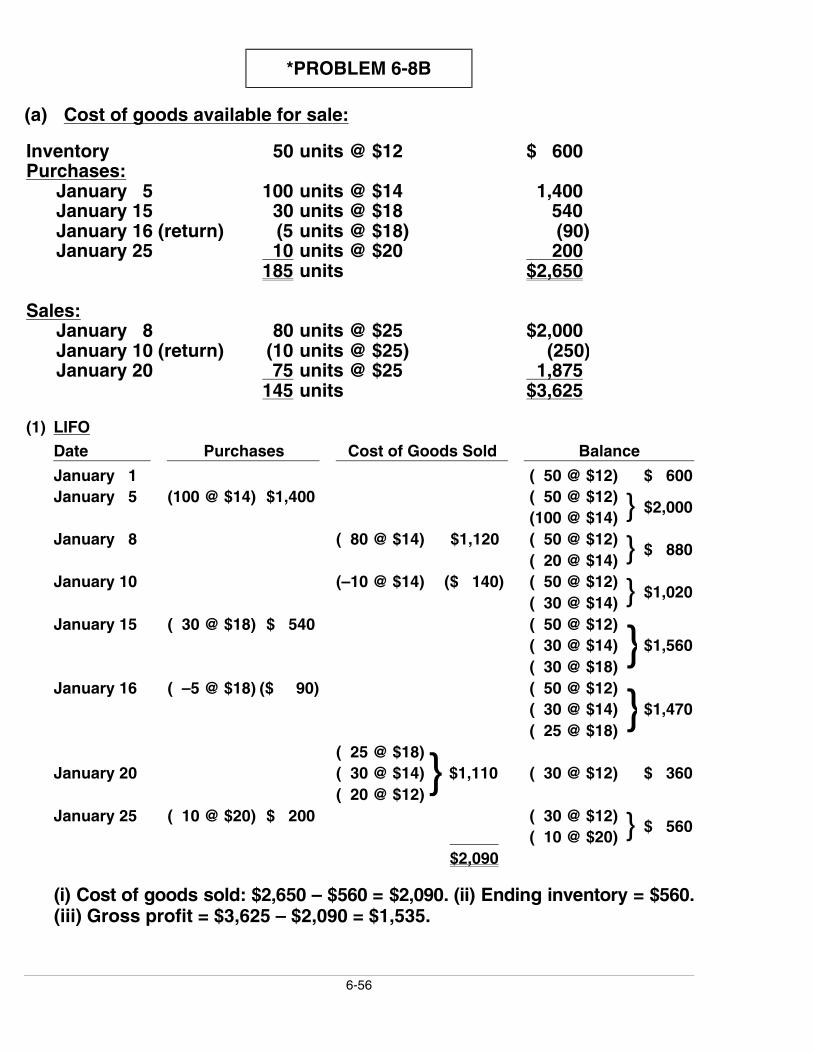
*PROBLEM 6-8B
(a) Cost of goods available for sale:
Inventory 50 units @ $12 $ 600Purchases:
January 5 100 units @ $14 1,400January 15 30 units @ $18 540January 16 (return) (5 units @ $18) (90)January 25 10 units @ $20 200
185 units $2,650
Sales:January 8 80 units @ $25 $2,000January 10 (return) (10 units @ $25) (250)January 20 75 units @ $25 1,875
145 units $3,625
(1) LIFO
Date Purchases Cost of Goods Sold Balance
January 1 ( 50 @ $12) $ 600January 5 (100 @ $14) $1,400 ( 50 @ $12)
(100 @ $14) } $2,000
January 8 ( 80 @ $14) $1,120 ( 50 @ $12)( 20 @ $14) } $ 880
January 10 (–10 @ $14) ($ 140) ( 50 @ $12)( 30 @ $14) } $1,020
January 15 ( 30 @ $18) $ 540 ( 50 @ $12)( 30 @ $14)( 30 @ $18)
}$1,560
January 16 ( –5 @ $18) ($ 90) ( 50 @ $12)( 30 @ $14)( 25 @ $18)
}$1,470
( 25 @ $18)January 20 ( 30 @ $14) $1,110 ( 30 @ $12) $ 360
( 20 @ $12)}
January 25 ( 10 @ $20) $ 200 ( 30 @ $12) ( 10 @ $20) } $ 560
$2,090
(i) Cost of goods sold: $2,650 – $560 = $2,090. (ii) Ending inventory = $560.(iii) Gross profit = $3,625 – $2,090 = $1,535.

6-57
*PROBLEM 6-8B (Continued)
(2) FIFO
Date Purchases Cost of Goods Sold Balance
January 1 ( 50 @ $12) $ 600( 50 @ $12)
January 5 (100 @ $14) $1,400(100 @ $14) } $2,000
( 50 @ $12)January 8
( 30 @ $14) } $1,020 ( 70 @ $14) $ 980
January 10 (–10 @ $14) ($ 140) ( 80 @ $14) $1,120( 80 @ $14)
January 15 ( 30 @ $18) $ 540( 30 @ $18) } $1,660
( 80 @ $14)January 16 ( –5 @ $18)($ 90)
( 25 @ $18) } $1,570
January 20 (75 @ $14) $1,050( 5 @ $14)( 25 @ $18) } $ 520
( 5 @ $14)( 25 @ $18)January 25 ( 10 @ $20) $ 200
( 10 @ $20)} $ 720
$1,930
(i) Cost of goods sold: $2,650 – $720 = $1,930. (ii) Ending inventory = $720.(iii) Gross profit = $3,625 – $1,930 = $1,695.
(3) Moving-Average
Date Purchases Cost of Goods Sold Balance
January 1 ( 50 @ $12) $ 600January 5 (100 @ $14) $1,400 (150 @ $13.333)a $2,000January 8 ( 80 @ $13.333) $1,067* ( 70 @ $13.333) $ 933
January 10 (–10 @ $13.333) ($ 133)* ( 80 @ $13.333) $1,066
January 15 ( 30 @ $18) $ 540 (110 @ $14.600)b $1,606January 16 ( –5 @ $18) ($ 90) (105 @ $14.438)c $1,516
January 20 ( 75 @ $14.438) $1,083* ( 30 @ $14.438)d $ 433
January 25 ( 10 @ $20) $ 200 ( 40 @ $15.83) $ 633$2,017
*roundeda$2,000 ÷ 150 = $13.333 c$1,516 ÷ 105 = $14.438b$1,606 ÷ 110 = $14.60 d$633 ÷ 40 = $15.83
(i) Cost of goods sold: $2,650 – $633 = $2,017. (ii) Ending inventory = $633.(iii) Gross profit = $3,625 – $2,017 = $1,608.

6-58
*PROBLEM 6-8B (Continued)
(b)Gross profit: LIFO FIFO Moving-AverageSales $3,625 $3,625 $3,625–Cost of goods sold 2,090 1,930 2,017Gross profit $1,535 $1,695 $1,608Ending inventory $ 560 $ 720 $ 633
In a period of rising costs, the LIFO cost flow assumption results in thehighest cost of goods sold and lowest gross profit. FIFO gives the lowestcost of goods sold and highest gross profit. The moving-average-cost flowassumption results in amounts between the other two.
On the balance sheet, FIFO gives the highest ending inventory (represent-ing the most current costs); LIFO gives the lowest ending inventory(representing the oldest costs); and average cost results in an endinginventory falling between the other two.

6-59
*PROBLEM 6-9B
(1) FIFO
Date Purchases Cost of Goods Sold Balance
July 1 (4 @ $ 90) $360 (4 @ $ 90) $ 3606 (3 @ $ 90) $270 (1 @ $ 90) $ 90
11 (5 @ $ 99) $495 (1 @ $ 90)(5 @ $ 99) } $ 585
(1 @ $ 90)14
(1 @ $ 99) } $189(4 @ $ 99) $ 396(4 @ $ 99)
21 (6 @ $106) $636(6 @ $106) } $1,032
27 (4 @ $ 99)(1 @ $106) } $502 (5 @ $106) $ 530
(2) AVERAGE-COST
Date PurchasesCost of
Goods Sold Balance
July 1 (4 @ $ 90) $360 ( 4 @ $ 90) $ 3606 (3 @ $ 90) $270 ( 1 @ $ 90) $ 90
11 (5 @ $ 99) $495 ( 6 @ $ 97.50)* $ 58514 (2 @ $ 97.5) $195 ( 4 @ $ 97.50) $ 39021 (6 @ $106) $636 (10 @ $102.60)** $1,02627 (5 @ $102.60) $513 ( 5 @ $102.60) $ 513
*$585 ÷ 6 = $97.5**$1,026 ÷ 10 = $102.60
(3) LIFO
Date Purchases Cost of Goods Sold Balance
July 1 (4 @ $ 90) $360 (4 @ $ 90) $ 3606 (3 @ $ 90) $270 (1 @ $ 90) $ 90
11 (5 @ $ 99) $495 (1 @ $ 90)(5 @ $ 99) } $ 585
(1 @ $ 90)14 (2 @ $ 99) $198
(3 @ $ 99) } $ 387
(1 @ $ 90)21 (6 @ $106) $636
(3 @ $ 99)(6 @ $106)
} $1,023
(1 @ $ 90)27 (5 @ $106) $530
(3 @ $ 99)(1 @ $106)
} $ 493
(b) The highest ending inventory is $530 under the FIFO method.

6-60
*PROBLEM 6-10B
(a) NovemberNet sales ................................................................ $500,000Cost of goods sold
Beginning inventory.................................. $ 34,100Purchases..................................................... $334,975Less: Purchase returns and
Allowances................................... (11,800)Purchase discounts ..................... (7,577)
Add: Freight-in.......................................... 6,402Cost of goods purchased........................ 322,000Cost of goods available for sale ........... 356,100Ending inventory........................................ 31,100
Cost of goods sold ........................... 325,000Gross profit........................................................... $175,000
$175,000Gross profit rate = $500,000 = 35%
(b) Net sales......................................................... $400,000Less: Estimated gross profit
(35% X $400,000) ........................ 140,000Estimated cost of goods sold.................. $260,000
Beginning inventory.................................... $ 31,100Purchases....................................................... $246,000Less: Purchase returns and
allowances.................................... $5,000Purchase discounts ....................... 6,000 11,000
Net purchases ............................................... 235,000Freight-in......................................................... 3,700Cost of goods purchased.......................... 238,700Cost of goods available for sale ............. 269,800Less: Estimated cost of goods
sold ................................................. 260,000Estimated inventory lost in fire ............... $ 9,800
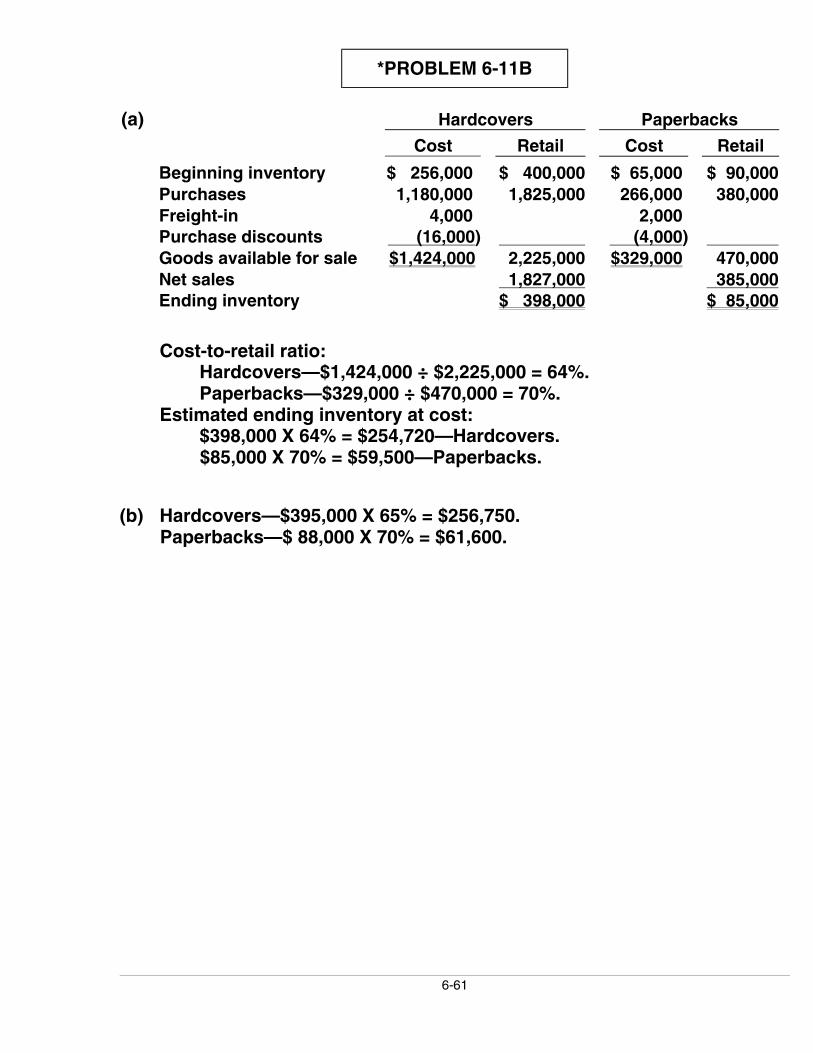
6-61
*PROBLEM 6-11B
(a) Hardcovers Paperbacks
Cost Retail Cost Retail
Beginning inventory $ 256,000 $ 400,000 $ 65,000 $ 90,000Purchases 1,180,000 1,825,000 266,000 380,000Freight-in 4,000 2,000Purchase discounts (16,000) (4,000) Goods available for sale $1,424,000 2,225,000 $329,000 470,000Net sales 1,827,000 385,000Ending inventory $ 398,000 $ 85,000
Cost-to-retail ratio:Hardcovers—$1,424,000 ÷ $2,225,000 = 64%.Paperbacks—$329,000 ÷ $470,000 = 70%.
Estimated ending inventory at cost:$398,000 X 64% = $254,720—Hardcovers.$85,000 X 70% = $59,500—Paperbacks.
(b) Hardcovers—$395,000 X 65% = $256,750.Paperbacks—$ 88,000 X 70% = $61,600.

6-62
BYP 6-1 FINANCIAL REPORTING PROBLEM
(a) December 31, 2005 December 25, 2004Inventory $1,693 million $1,541 million
(b) Dollar change in inventories between 2004 and 2005:
$1,693 – $1,541 = $152.0 million increase
Percent change in inventories between 2004 and 2005:
$152 ÷ $1,541 = 9.9% increase
2005 inventory as a percent of current assets:
$1,693 ÷ $10,454 = 16.2%
(c) Inventories are valued at lower of cost or market. Cost is determinedusing the average, first-in, first-out (FIFO) or last-in, first-out (LIFO)methods (per Note 14 on Supplemental Financial Information).
(d) PepsiCo (in millions) 2005 2004 2003Cost of Goods Sold $14,176 $12,674 $11,691
2005 cost of goods sold as a percent of sales:
$14,176 ÷ $32,562 = 43.5%

6-63
BYP 6-2 COMPARATIVE ANALYSIS PROBLEM
(a) 1. Inventory turnover:
$1,541 + 1,693PepsiCo: $14,176 ÷2
= 8.77 times
$1,420 + 1,424Coca-Cola: $8,195 ÷2
= 5.76 times
2. Days in inventory:
PepsiCo: 365 ÷ 8.77 = 41.6 daysCoca-Cola: 365 ÷ 5.76 = 63.4 days
(b) PepsiCo’s turnover of 8.77 times is approximately one and a half timesas high as Coca-Cola’s 5.76 times, resulting in days in inventory of 41.6versus 63.4. Thus, PepsiCo’s inventory control is much more effective.
6-64
BYP 6-3 EXPLORING THE WEB
The following responses are based on the 2005 annual report:
(a) $1,297,000,000, as of July 30, 2005.
(b) $1,297,000,000 – $1,207,000,000 = $90,000,000 increase.
(c) 43.9 percent ($569 ÷ $1,297).
(d) Lower of cost or market using standard cost, which approximates FIFO.

6-65
BYP 6-4 DECISION MAKING ACROSS THE ORGANIZATION
(a) (1) Sales per trial balance................................ $180,000Cash sales 4/1–4/10 ($18,500 X 40%) .... 7,400Acknowledged credit sales 4/1–4/10..... 37,000Sales made but unacknowledged .......... 5,600Sales as of April 10 ..................................... $230,000
(2) Purchases per trial balance ..................... $ 94,000Cash purchases 4/1–4/10.......................... 4,200Credit purchases 4/1–4/10 ........................ $12,400Less: Items in transit................................. 1,600 10,800Purchases as of April 10 ........................... $109,000
*(b) 2007 2006
Net sales........................................................................... $600,000 $480,000Cost of goods sold
Inventory, January 1............................................ 60,000 40,000Cost of goods purchased .................................. 404,000 356,000Cost of goods available for sale...................... 464,000 396,000Inventory, December 31 ..................................... 80,000 60,000Cost of goods sold............................................... 384,000 336,000
Gross profit ..................................................................... $216,000 $144,000
Gross profit rate............................................................. 36% 30%Average gross profit rate................................... 33%
*(c) Sales .................................................................................................... $230,000Less: Gross profit ($230,000 X 33%)........................................ 75,900Cost of goods sold.......................................................................... $154,100
Inventory, January 1....................................................................... $ 80,000Purchases .......................................................................................... 109,000Cost of goods available for sale................................................. 189,000Cost of goods sold.......................................................................... 154,100Estimated inventory at time of fire ............................................ 34,900Less: Inventory salvaged............................................................. 17,000Estimated inventory loss .............................................................. $ 17,900
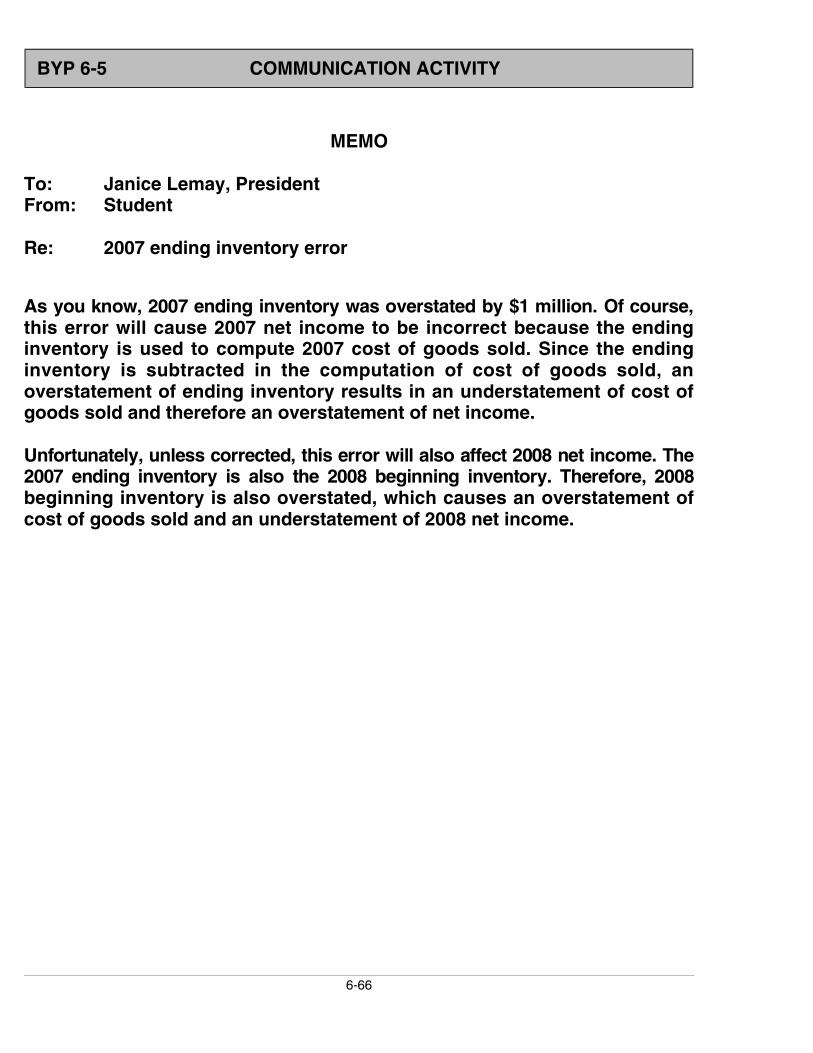
6-66
BYP 6-5 COMMUNICATION ACTIVITY
MEMO
To: Janice Lemay, PresidentFrom: Student
Re: 2007 ending inventory error
As you know, 2007 ending inventory was overstated by $1 million. Of course,this error will cause 2007 net income to be incorrect because the endinginventory is used to compute 2007 cost of goods sold. Since the endinginventory is subtracted in the computation of cost of goods sold, anoverstatement of ending inventory results in an understatement of cost ofgoods sold and therefore an overstatement of net income.
Unfortunately, unless corrected, this error will also affect 2008 net income. The2007 ending inventory is also the 2008 beginning inventory. Therefore, 2008beginning inventory is also overstated, which causes an overstatement ofcost of goods sold and an understatement of 2008 net income.
6-67
BYP 6-6 ETHICS CASE
(a) The higher cost of the items ordered, received, and on hand at year-end will be charged to cost of goods sold, thereby lowering currentyear’s income and income taxes. If the purchase at year-end had beenmade in the next year, the next year’s cost of goods sold would haveabsorbed the higher cost. Next year’s income will be increased if unitpurchases (next year) are less than unit sales (next year). This isbecause the lower costs carried from the earlier year as inventory willbe charged to next year’s cost of goods sold. Therefore, next year’sincome taxes will increase.
(b) No. The president would not have given the same directive because thepurchase under FIFO would have had no effect on net income of thecurrent year.
(c) The accountant has no grounds for not ordering the goods if thepresident insists. The purchase is legal and ethical.
6-68
BYP 6-7 ALL ABOUT YOU ACTIVITY
Students responses to this question will vary depending on the inventoryfraud they choose to investigate. Here are responses for the two examplesgiven in the activity.
The fraud at Leslie Fay involved a number of illegal actions, all of whichincreased net income. The company intentionally overstated ending inventory,which has the effect of understating cost of goods sold. It also understatedor completely omitted discounts and allowances that it gave to retailers. Inaddition, it recorded inventory costs at amounts that differed from the invoiceamount. It also reported sales in incorrect periods.
McKesson Corporation increased its reported net income through manipulationof inventory and sales records. It back-dated many transactions to increasecurrent period results. It also swapped inventory to increase reported revenue.Many of the transactions that it reported as sales, and which resulted inreductions in inventory, were actually not sales because they had negotiatedside agreements which allowed the buyer to return the merchandise.
Related Documents