GOVERNMENT CONSUMPTION EXPENDITURES AND GROSS CHAPTER 9: INVESTMENT (Updated: November 2011) Definitions and Concepts Recording in the NIPAs Overview of Source Data and Estimating Methods Benchmark-year and nonbenchmark-year estimates Current quarterly estimates Quantity and price estimates Table 9.A—Summary of Methodology for Government Consumption Expenditures Table 9.B—Summary of Methodology for Government Gross Investment Government consumption expenditures and gross investment measures the portion of gross domestic product (GDP), or final expenditures, that is accounted for by the government sector. Government consumption expenditures consists of spending by government to produce and provide services to the public, such as public school education. Gross investment consists of spending by government for fixed assets that directly benefit the public, such as highway construction, or that assist government agencies in their production activities, such as purchases of military hardware. Government activity—at the federal, state, and local levels—affects the economy in many ways. As noted above, governments contribute to economic output when they provide services to the public and when they invest in capital. They also provide social benefits, such as social security and Medicare, to households. Governments also affect the economy through taxes and by providing incentives for various business activities. In addition, governments affect the economy through their collective saving, the difference between their revenue and spending. 1 BEA prepares estimates of government consumption expenditures and gross investment for the federal government sector and for the state and local government sector. 2 Estimates of government consumption expenditures and gross investment by function—such as defense, health, and education—provide information on how governments allocate their funds. The full array of government estimates is particularly useful to policymakers, business decisionmakers, and other data users in analyzing the effects of various economic policies. 3 1 The estimates of government current receipts and expenditures are presented in table 3.1 of the national income and product accounts. 2 For a detailed description of the methodology used to prepare the estimates for the government sector, see U.S. Bureau of Economic Analysis, MP-5: Government Transactions (Methodology Papers: U.S. National Income and Product Accounts, September 2005) at www.bea.gov/national/pdf/mp5.pdf. 3 See Mark S. Ludwick and Benjamin A. Mandel, “Analyzing Federal Programs Using BEA Statistics: A Look at Unemployment Insurance Benefits Payments,” Survey of Current Business 91 (September 2011): 14-17.

Welcome message from author
This document is posted to help you gain knowledge. Please leave a comment to let me know what you think about it! Share it to your friends and learn new things together.
Transcript
GOVERNMENT CONSUMPTION EXPENDITURES AND GROSS CHAPTER 9:
INVESTMENT
(Updated: November 2011)
Definitions and Concepts
Recording in the NIPAs
Overview of Source Data and Estimating Methods
Benchmark-year and nonbenchmark-year estimates
Current quarterly estimates
Quantity and price estimates
Table 9.A—Summary of Methodology for Government Consumption Expenditures
Table 9.B—Summary of Methodology for Government Gross Investment
Government consumption expenditures and gross investment measures the
portion of gross domestic product (GDP), or final expenditures, that is accounted for by
the government sector. Government consumption expenditures consists of spending by
government to produce and provide services to the public, such as public school
education. Gross investment consists of spending by government for fixed assets that
directly benefit the public, such as highway construction, or that assist government
agencies in their production activities, such as purchases of military hardware.
Government activity—at the federal, state, and local levels—affects the economy
in many ways. As noted above, governments contribute to economic output when they
provide services to the public and when they invest in capital. They also provide social
benefits, such as social security and Medicare, to households. Governments also affect
the economy through taxes and by providing incentives for various business activities. In
addition, governments affect the economy through their collective saving, the difference
between their revenue and spending.1
BEA prepares estimates of government consumption expenditures and gross
investment for the federal government sector and for the state and local government
sector.2 Estimates of government consumption expenditures and gross investment by
function—such as defense, health, and education—provide information on how
governments allocate their funds. The full array of government estimates is particularly
useful to policymakers, business decisionmakers, and other data users in analyzing the
effects of various economic policies.3
1 The estimates of government current receipts and expenditures are presented in table 3.1 of the national
income and product accounts. 2 For a detailed description of the methodology used to prepare the estimates for the government sector, see
U.S. Bureau of Economic Analysis, MP-5: Government Transactions (Methodology Papers: U.S. National
Income and Product Accounts, September 2005) at www.bea.gov/national/pdf/mp5.pdf. 3 See Mark S. Ludwick and Benjamin A. Mandel, “Analyzing Federal Programs Using BEA Statistics: A
Look at Unemployment Insurance Benefits Payments,” Survey of Current Business 91 (September 2011):
14-17.
CHAPTER 9: GOVERNMENT CONSUMPTION EXPENDITURES AND GROSS INVESTMENT
9-2
The estimates of government consumption expenditures and gross investment are
an integral part of the U.S. national income and product accounts (NIPAs), a set of
accounts that provides a logical and consistent framework for presenting statistics on U.S.
economic activity (see “Chapter 2: Fundamental Concepts”). In addition, the estimates of
gross investment by government in structures, equipment, and software provide the
building blocks for the estimates of government-owned fixed assets in BEA’s fixed assets
and consumer durable goods accounts.4
Definitions and Concepts
In the NIPAs, government is treated as a producer that uses labor, capital, and
intermediate inputs to provide goods and services on behalf of the general public. In its
role as a producer, value added by government measures the contribution of the
government sector to total value added across all industries, which is equal to GDP. In
addition, government is treated as either a consumer of, or an investor in, many of the
goods and services that it produces. In its role as a consumer/investor, government
consumption expenditures and gross investment measures the portion of final
expenditures for GDP that is accounted for by the government sector. (For a discussion of
the three methods for measuring GDP, see chapter 2, page 7.)
In the NIPAs, the framework for government consumption expenditures explicitly
recognizes government as a producer of goods and services (table 9.1). The gross output
of general government consists of all of the goods and services produced by general
government (see the box “General Government and Government Enterprises”). The value
of this output is measured by the cost of inputs—that is, as the sum of employee
compensation, of consumption of fixed capital (CFC), and of intermediate goods and
services purchased.5 This framework is parallel to the concepts and presentation of output
and intermediate inputs of private business (and of government enterprises) in BEA’s
input-output accounts and GDP-by-industry accounts. However, for business, output is
valued at market prices, and the difference between the value of output and the costs of
production is equal to the net operating surplus, while for general government, the
difference between output and costs, by definition, is zero (see the box “Measuring the
Output of Governments”).
4 As noted in chapter 2, fixed assets are produced assets that are used repeatedly or continuously in the
production process—that is, in the production of other goods (including other fixed assets) or of services—
for more than 1 year. For a description of the methodology for BEA’s estimates of the stocks and
depreciation of fixed assets and of the investment flows used to derive them, see U.S. Bureau of Economic
Analysis, Fixed Assets and Consumer Durable Goods in the United States 1925–97, September 2003, at
www.bea.gov/national/pdf/Fixed_Assets_1925_97.pdf. 5 CFC, or depreciation, measures the decline in the value of the stock of fixed assets due to wear and tear,
obsolescence, aging, and accidental damage; however, it does not include losses caused by a natural
disaster or war losses of military equipment. CFC for general government provides a partial measure of the
services derived from government capital investment—that is, of the value added (measured as the expense
incurred) as a result of using government capital goods in the production of services. (CFC is only a partial
measure because the rate of return on government assets is assumed to be zero.)
CHAPTER 9: GOVERNMENT CONSUMPTION EXPENDITURES AND GROSS INVESTMENT
9-3
General Government and Government Enterprises
Government output is divided into market and nonmarket output. Most
government output is nonmarket in nature, meaning that services, such as public
education and law enforcement, are provided without charge or with only a nominal
charge. The nonmarket output of the government sector is classified in the NIPAs as
general government output.
In contrast, certain government entities provide goods and services that are sold
directly to households and businesses in market transactions that recover all or a
considerable portion of their operating costs. In the NIPAs, these entities are called
government enterprises. Generally, government enterprises provide services in the
market economy because special circumstances—such as natural monopolies and
externalities—prevent private companies from doing so. In addition, government
enterprises may undertake projects of a scale too large for the private sector, or they
may perform a public service that would result in operating losses if performed by the
private sector.
The largest government enterprise is the United States Postal Service. Other
federal government enterprises include power authorities, such as the Tennessee Valley
Authority, and insurance enterprises, such as the National Flood Insurance Program.
State and local government enterprises include housing authorities, transit systems,
airports, water ports, and utilities.
In the NIPAs, the value added by government enterprises (as producers of
goods and services for the marketplace) is recorded in the business sector, along with
that of private businesses. Sales of goods and services by government enterprises to
persons are recorded as personal consumption expenditures, and those to businesses are
recorded as intermediate purchases. However, the NIPA presentation of fixed
investment, as with a number of other NIPA-table presentations, is split between
“private” and “government” (rather than between “business” and “general
government”), so the gross investment of government enterprises is included with that
of general government.
CHAPTER 9: GOVERNMENT CONSUMPTION EXPENDITURES AND GROSS INVESTMENT
9-4
Measuring the Output of Governments
Difficult conceptual and practical problems arise in measuring the output of
governments, primarily because most of this output is not sold in the marketplace (see the
box “General Government and Government Enterprises”). Among these problems are the
measurement of nonmarket services and the measurement of change over time in the real
services provided by government.
For the nonmarket services produced by general government, standard practice as
recommended by the System of National Accounts is to value output in terms of the input
costs incurred in production.6 These costs include labor, materials, and supplies, and they
also include the use of fixed capital. BEA uses a depreciation measure known as
“consumption of fixed capital” as a partial measure of the annual services produced by the
existing stock of government fixed capital; this approach implicitly assumes that the net
return for general government fixed assets is zero. In contrast, the cost of capital services
for private market producers includes a positive net return. Alternatively, BEA could
augment its measure of capital services by including a net return on assets, a change that
would tend to raise the overall level of government output and consumption expenditures,
and thus GDP. Several approaches have been suggested: using a private sector rate of
return, a municipal bond rate, the Office of Management and Budget hurdle rate for
investment, or others.7
For real services provided by government, BEA’s estimates of real government
consumption expenditures are generally based on changes in the real inputs, and thus
assume that there is no change in productivity. If possible, it would be preferable to measure
actual changes in the quantity or volume of the services provided, thus allowing for changes
in productivity. Some services, such as national defense, are pure public goods and are
difficult to quantify, even in theory. However, other services, particularly for state and local
governments, can be measured directly: for example, number of criminals arrested, number
of fires extinguished, number of students educated, or number of patients treated. Some
countries, including the United Kingdom, use caseload numbers as a way of quantifying
real government output directly, but such measures have been subject to criticism.
BEA has conducted research in a number of areas pertaining to alternative measures
of real government output.8 This research is currently preliminary, and further research is
needed before these measures can be considered for implementation in the national
accounts.
6 Commission of the European Communities, International Monetary Fund, Organisation for Economic Co-
operation and Development, United Nations, and the World Bank, System of National Accounts 2008: 2.59,
at http://unstats.un.org/unsd/nationalaccount/SNA2008.asp. 7 M. Courtney and Martin H. David, eds., Measuring the Government Sector of the U.S. National
Accounts, National Research Council, Washington DC, National Academies Press, 1998. 8 For example, see Barbara Fraumeni, Marshall B. Reinsdorf, Brooks B. Robinson, Matthew P. Williams,
“Price and Real Output Measures for the Education Function of Government: Exploratory Estimates for
Primary and Secondary Education,” in Price Index Concepts and Measurement, W. Erwin Diewert, John S.
Greenlees, and Charles R. Hulten, eds., University of Chicago Press, 2009, 373-403.

CHAPTER 9: GOVERNMENT CONSUMPTION EXPENDITURES AND GROSS INVESTMENT
9-5
Table 9.1—Government Consumption Expenditures and Gross Investment and
Government Gross Output [2008, billions of dollars]
Government consumption expenditures and gross investment 2,878.1
Consumption expenditures 2,381.0
Gross output of general government 2,757.1
Value added 1,698.0
Compensation of general government employees 1,438.4
Consumption of general government fixed capital 259.6
Intermediate goods and services purchased 1,059.1
Durable goods 70.2
Nondurable goods 288.6
Services 700.4
Less: Own-account investment 28.1
Sales to other sectors 348.0
Gross investment 497.2
Structures 310.0
Equipment and software 187.2
The output of general government consists of services that are provided to the
general public either free of charge or at a charge that is considerably less than the cost of
providing the service and of structures and software that are produced by government for
use in future production by government (own-account investment).9 In the NIPAs, own-
account investment (such as computer software that is developed and used by
government employees) is classified as part of government gross investment. Thus, in
order to avoid double counting in calculating GDP, own-account investment by general
government, as measured by input costs, is subtracted from general government gross
output in deriving government consumption expenditures.
The value of the services that are provided by government free of charge, whether
to individual members of society (such as education at public elementary schools) or to
society as a whole (such as national defense or law enforcement), is included in
government consumption expenditures. In effect, government is treated as the final
purchaser of these services.
For services that are provided by government at a reduced charge (such as tuition
paid to public universities), the fees paid by the public are recorded as personal
consumption expenditures (PCE) if paid by persons or as intermediate inputs if paid by
business. Thus, in order to avoid double counting in calculating GDP, the portion of the
value of the output of services that is covered by fees is recorded as “sales to other
sectors” and is subtracted from gross output of general government in deriving
government consumption expenditures. The remaining value of this output—that is, the
difference between the costs incurred in providing the services and the fees collected for
9 The relatively small amount of noninvestment goods, such as books, that are produced by general
government is included in services.
CHAPTER 9: GOVERNMENT CONSUMPTION EXPENDITURES AND GROSS INVESTMENT
9-6
the services—is included in government consumption expenditures. In effect,
government is treated as the final purchaser of the portion of these services that is not
sold to the public.
Government gross investment is a measure of the additions to, and replacements
of, the stock of government-owned fixed assets. It consists of investment by both general
government and government enterprises in structures (such as highways and schools), in
equipment (such as military hardware), and in software, and it includes own-account
investment by government.
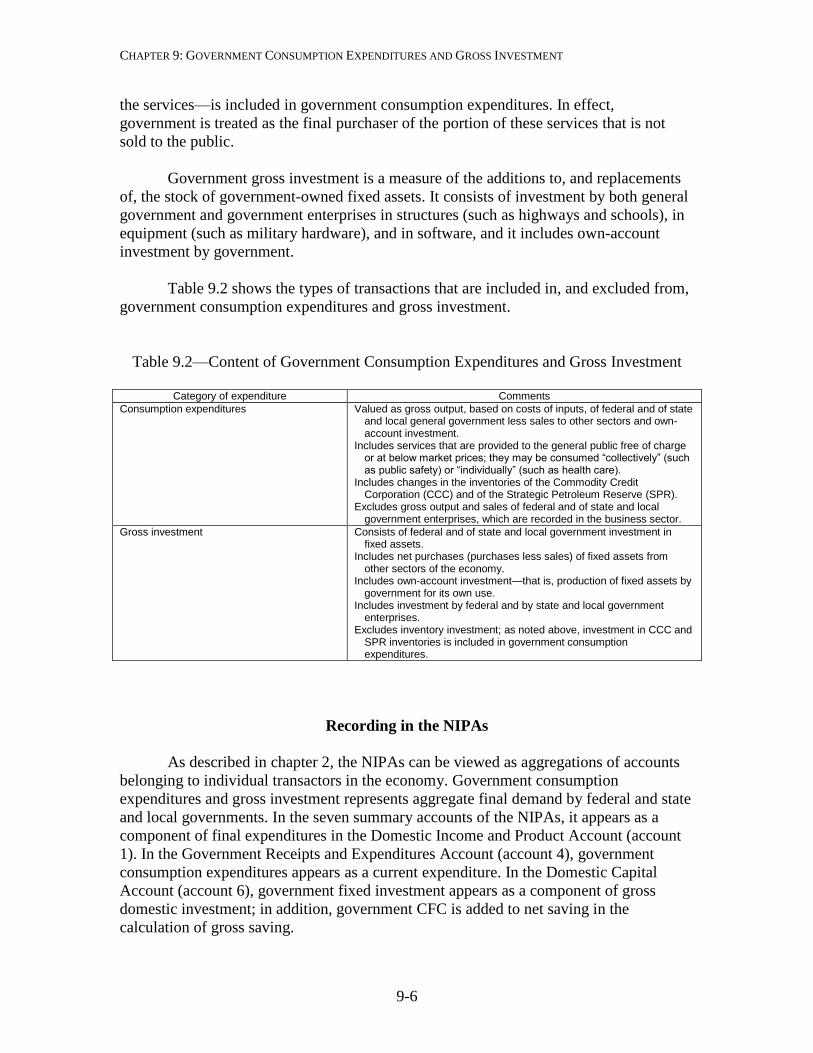
Table 9.2 shows the types of transactions that are included in, and excluded from,
government consumption expenditures and gross investment.
Table 9.2—Content of Government Consumption Expenditures and Gross Investment
Category of expenditure Comments
Consumption expenditures Valued as gross output, based on costs of inputs, of federal and of state and local general government less sales to other sectors and own-account investment.
Includes services that are provided to the general public free of charge or at below market prices; they may be consumed “collectively” (such as public safety) or “individually” (such as health care).
Includes changes in the inventories of the Commodity Credit Corporation (CCC) and of the Strategic Petroleum Reserve (SPR).
Excludes gross output and sales of federal and of state and local government enterprises, which are recorded in the business sector.
Gross investment Consists of federal and of state and local government investment in fixed assets.
Includes net purchases (purchases less sales) of fixed assets from other sectors of the economy.
Includes own-account investment—that is, production of fixed assets by government for its own use.
Includes investment by federal and by state and local government enterprises.
Excludes inventory investment; as noted above, investment in CCC and SPR inventories is included in government consumption expenditures.
Recording in the NIPAs
As described in chapter 2, the NIPAs can be viewed as aggregations of accounts
belonging to individual transactors in the economy. Government consumption
expenditures and gross investment represents aggregate final demand by federal and state
and local governments. In the seven summary accounts of the NIPAs, it appears as a
component of final expenditures in the Domestic Income and Product Account (account
1). In the Government Receipts and Expenditures Account (account 4), government
consumption expenditures appears as a current expenditure. In the Domestic Capital
Account (account 6), government fixed investment appears as a component of gross
domestic investment; in addition, government CFC is added to net saving in the
calculation of gross saving.

CHAPTER 9: GOVERNMENT CONSUMPTION EXPENDITURES AND GROSS INVESTMENT
9-7
NIPA table group 3.9 shows government consumption expenditures as gross
output of general government less own-account investment and sales to other sectors.
Additional detail is shown in table group 3.10. Government gross investment is shown by
type of product in table group 3.9. Detail on national defense consumption expenditures
and gross investment is shown in NIPA table group 3.11. Annual estimates of
government consumption expenditures and gross investment by function—that is, by the
purposes or objectives for which the expenditures are made—are shown in NIPA table
group 3.15.
The following is a list of the principal NIPA tables that present the estimates of
government consumption expenditures and gross investment:
3.9.1 Percent Change From Preceding Period in Real Government Consumption
Expenditures and Gross Investment
3.9.2 Contributions to Percent Change in Real Government Consumption Expenditures
and Gross Investment
3.9.3 Real Government Consumption Expenditures and Gross Investment, Quantity
Indexes
3.9.4 Price Indexes for Government Consumption Expenditures and Gross Investment
3.9.5 Government Consumption Expenditures and Gross Investment
3.9.6 Real Government Consumption Expenditures and Gross Investment, Chained
Dollars
3.10.1 Percent Change From Preceding Period in Real Government Consumption
Expenditures and General Government Gross Output
3.10.3 Real Government Consumption Expenditures and General Government Gross
Output, Quantity Indexes
3.10.4 Price Indexes for Government Consumption Expenditures and General
Government Gross Output
3.10.5 Government Consumption Expenditures and General Government Gross Output
3.10.6 Real Government Consumption Expenditures and General Government Gross
Output, Chained Dollars
3.11.1 Percent Change From Preceding Period in Real National Defense Consumption
Expenditures and Gross Investment by Type
3.11.3 Real National Defense Consumption Expenditures and Gross Investment by Type,
Quantity Indexes
3.11.4 Price Indexes for National Defense Consumption Expenditures and Gross
Investment by Type
3.11.5 National Defense Consumption Expenditures and Gross Investment by Type
3.11.6 Real National Defense Consumption Expenditures and Gross Investment by Type,
Chained Dollars
3.15.1 Percent Change From Preceding Period in Real Government Consumption
Expenditures and Gross Investment by Function
3.15.2 Contributions to Percent Change in Real Government Consumption Expenditures
and Gross Investment by Function
3.15.3 Real Government Consumption Expenditures and Gross Investment by Function,
Quantity Indexes

CHAPTER 9: GOVERNMENT CONSUMPTION EXPENDITURES AND GROSS INVESTMENT
9-8
3.15.4 Price Indexes for Government Consumption Expenditures and Gross Investment
by Function
3.15.5 Government Consumption Expenditures and Gross Investment by Function
3.15.6 Real Government Consumption Expenditures and Gross Investment by Function,
Chained Dollars
3.17 Selected Government Current and Capital Expenditures by Function
In addition, estimates of investment by government in fixed assets are presented
as part of BEA’s fixed assets and consumer durable goods accounts.10
Overview of Source Data and Estimating Methods
As described earlier in the handbook, the NIPA estimates, including those for
government consumption expenditures and gross investment, are prepared using a wide
variety of source data (see “Chapter 3: Principal Source Data”) and using estimating
methods that adjust the source data to the required NIPA concepts and that fill in gaps in
coverage and timing (see “Chapter 4: Estimating Methods”). Tables 9.A (government
consumption expenditures) and 9.B (gross investment) at the end of this chapter
summarize the source data and estimating methods that are used to prepare the current-
dollar benchmark estimates, nonbenchmark annual estimates, and current quarterly
estimates, as well as the quantity and price indexes, for the categories shown in NIPA
table groups 3.9 and 3.10.11
The estimates of government consumption expenditures and gross investment are
prepared separately for the federal government and for the combined state and local
governments.12
For the federal government, the major sources for the estimates of consumption
expenditures and gross investment are federal financial documents, primarily the
Budget of the United States Government, an annual document published by the
Executive Office of the President, and the Department of the Treasury’s Monthly
Treasury Statement of Receipts and Outlays (MTS), which presents monthly data
on federal agency expenditures in a budget framework but in considerably less
detail than is available in the fiscal year budget. Additional source data come from
many federal agencies, including the Department of Defense (DOD), the Social
Security Administration (SSA), the Office of Personnel Management, and the
Bureau of Labor Statistics (BLS).
10
These estimates are available at www.bea.gov, look under “National,” and click on “Fixed Assets” and
then on “Fixed Assets Tables.” 11
For more detail on the concepts, source data, and methods for preparing the NIPA estimates for the
government sector, see MP-5: Government Transactions at www.bea.gov/national/pdf/mp5.pdf. 12
In general, the NIPA estimates for state government and for local government are combined. However,
aggregate annual estimates of current-dollar consumption expenditures and of current-dollar gross
investment are provided separately for state government and for local government in NIPA tables 3.20 and
3.21, respectively. These tables of state government and of local government receipts and expenditures are
published a few months after the NIPA annual revision.

CHAPTER 9: GOVERNMENT CONSUMPTION EXPENDITURES AND GROSS INVESTMENT
9-9
For state and local government, the estimates of consumption expenditures and
gross investment are primarily based on information collected by the U.S. Census
Bureau in the quinquennial Census of Governments and in the annual Surveys of
State and Local Government Finances. Additional data come from many other
federal agencies and from a number of private sources.
Benchmark-year and nonbenchmark-year estimates
Federal
In general, the benchmark and nonbenchmark annual NIPA estimates are
prepared using data from U.S. Treasury financial reports and agency administrative
reports in conjunction with detailed information from BEA’s translation of the
President’s budget into a NIPA basis (see the box “NIPA Translation of the Federal
Budget” below). The budget translation provides a detailed array of NIPA expenditures
by program and by type of expenditure that is used as the basis for allocating the data on
program outlays from the MTS to consumption expenditures and gross investment and to
other expenditures, such as social benefits and subsidies. Supplemental data from other
government sources are then used to estimate spending by type of consumption
expenditure and gross investment.
Estimates of federal government consumption expenditures and gross investment
are prepared separately for defense and for nondefense. The defense category consists of
the activities covered by the national defense function in the budget—that is, DOD
military activities, defense-related atomic energy activities of the Department of Energy,
and defense-related activities of other agencies. The nondefense category consists of the
other consumption and investment activities in the budget.

CHAPTER 9: GOVERNMENT CONSUMPTION EXPENDITURES AND GROSS INVESTMENT
9-10
Defense estimates. For most categories of defense consumption expenditures
other than compensation and CFC, the federal budget information is supplemented with
detailed data from DOD production and financial reports. For many goods and for some
services, the estimates are prepared using a “direct-pricing” method—that is, as the
product of a delivered quantity times the actual price paid.13
For compensation, the estimates of wages and salaries of military employees are
based on federal budget data, and the estimates of supplements are primarily based on
data from SSA and DOD. The estimates of wages and salaries of civilian defense
employees are based on data from the BLS quarterly census of employment and wages
(QCEW), and the estimates of supplements are based on data from SSA, from the MTS,
from the Office of Personnel Management, and from the Thrift Savings Board. The
estimates of CFC are derived using the perpetual inventory method—where investment
flows are cumulated over time to derive estimates of stocks, which are then depreciated
(see “Perpetual inventory method” in chapter 4).14
13
For more information, see MP-5: Government Transactions, II-33, at
www.bea.gov/national/pdf/mp5.pdf. 14
For more information on the derivation of the CFC estimates for government fixed assets, see
“Methodology,” Fixed Assets and Consumer Durable Goods in the United States, 1925–97, September
2003 at www.bea.gov/national/pdf/Fixed_Assets_1925_97.pdf.
NIPA Translation of the Federal Budget
Each year, BEA prepares a “translation” of the information in the President’s
fiscal year budget into a NIPA framework (see the annual article on the NIPA
translation of the federal budget, which is usually published in the March issue of the
Survey of Current Business). Unlike the federal budget, which is a financial plan of the
government, the NIPA federal-sector estimates are designed to facilitate
macroeconomic analyses of the effects of federal government activity on economic
activity. The translation is based on actual budget data on receipts and outlays for the
preceding fiscal year and on projected and proposed receipts and outlays for the current
and the next fiscal year.
In translating the budget data into the framework of the NIPAs, three primary
types of adjustments are made. These adjustments result in NIPA estimates of current
receipts and expenditures that differ from corresponding estimates of receipts and
expenditures in the budget.
Coverage adjustments account for certain transactions that are included in the
budget but are excluded from the NIPAs (and vice versa). For example, the
NIPA estimates include consumption of fixed capital but the budget does not.
Netting and grossing adjustments account for certain transactions that are
recorded as offsets to outlays in the budget but are recorded as receipts in the
NIPAs (and vice versa).
Timing adjustments account for certain transactions that are recorded on a cash
basis in the budget but are recorded on an accrual basis in the NIPAs.

CHAPTER 9: GOVERNMENT CONSUMPTION EXPENDITURES AND GROSS INVESTMENT
9-11
For most categories of defense gross investment, the federal budget information is
supplemented with detailed data from DOD production and financial reports. Whenever
possible, the direct-pricing method is used to prepare the estimates.
Nondefense estimates. For most categories of nondefense consumption
expenditures other than compensation and CFC, the estimates are primarily based on the
federal budget data.
For compensation, the estimates of wages and salaries for federal nondefense
employees are based on QCEW data, and the estimates of supplements are primarily
based on data from SSA and the Office of Personnel Management, and the Thrift Savings
Board. As above, the estimates of CFC are derived using the perpetual inventory method.
For most categories of nondefense gross investment other than structures, the
estimates are primarily based on federal budget data, supplemented with data from
various federal agencies when available. The estimates of structures are primarily based
on Census Bureau construction statistics.
Estimates by function. The annual estimates of federal government consumption
expenditures and gross investment by function are prepared on the basis of functional
classifications for each appropriation in the federal budget. The portions of spending for
all appropriations that are estimated by BEA to be consumption expenditures and gross
investment are summed by budget function and then aggregated into classifications that
are largely consistent with the System of National Account’s “Classification of the
Functions of Government” (COFOG). Sales of government services by appropriation are
also assigned to budget functions and are subtracted from gross expenditures. In addition,
a BEA estimate of CFC is added to each function.15
15
See Karl Galbraith, “Government Spending by Function: A New Presentation,” Survey 80 (June 2000):
18–23. See also Bruce E. Baker, Pamela A. Kelly, and Brooks B. Robinson, “Estimates of Real
Government Consumption Expenditures and Gross Investment by Function for 1959–2003,” Survey 84
(October 2004): 5–10.
CHAPTER 9: GOVERNMENT CONSUMPTION EXPENDITURES AND GROSS INVESTMENT
9-12
State and local
The annual estimates for state and local government, other than those for
compensation and for CFC, are primarily based on compilations of financial data from
the Census of Governments (COG) and from Surveys of State and Local Government
Finances (GF).
The COG is a voluntary census that is conducted in the same year as the
Economic Census. It covers all the states and nearly 90,000 local governments—
including, counties, municipalities, townships, special districts, and school
districts. Data are reported for each government’s annual accounting period (fiscal
year) that ends on or before June 30 of the census year.
The GF data are compiled from three sources: an enumeration of all the states, a
sample survey of local governments, and data from federal government agencies.
Data are reported for each government’s fiscal year that ends on or before June 30
of the survey year.
Generally, it takes about 2 years from the close of each fiscal year for final
tabulations of the COG and GF data to become available. Because the fiscal years for
many state and local governments do not coincide with the calendar year, the
incorporation of the COG/GF data during a NIPA annual revision may affect the
estimates for more than one calendar year. For example, in the 2011 annual revision of
the NIPAs, the estimates for calendar year 2008 (the third annual revision of those
estimates) were prepared using final FY 2008 GF data, and preliminary FY 2009 data.
The estimates for calendar year 2009 (the second annual revision of those estimates) were
prepared using preliminary FY 2009 data and BEA projections for FY 2010. The
estimates for calendar year 2010 (the first annual revision of those estimates) were based
on BEA projections for FY 2010 and FY 2011.
For compensation, the estimates of wages and salaries for state and local
government employees are based on QCEW data, and the estimates of supplements are
primarily based on data from the SSA, from the Department of Labor, from the COG/GF,
and from the Agency for Healthcare Research and Quality. For CFC, the estimates are
derived using the perpetual inventory method.
Estimates by function. The annual estimates of state and local government
consumption expenditures and gross investment by function are based on COG/GF data
by function. These data are adjusted to conform to NIPA accounting concepts and then
sorted into COFOG-based functions. The COG/GF data are supplemented with data from
other sources. In addition, a BEA estimate of CFC is added to each function.16
16
See Galbraith, 18–23, and see also Baker, Kelly, and Robinson, 5–10.
CHAPTER 9: GOVERNMENT CONSUMPTION EXPENDITURES AND GROSS INVESTMENT
9-13
Current quarterly estimates
Federal
For defense consumption expenditures other than compensation and CFC, the
current quarterly estimates for most categories are based on MTS data on budget outlays
and on DOD data from financial reports on disbursements when available. In addition,
the second and third quarterly estimates for some categories are supplemented with other
information from DOD when available.
For nondefense consumption expenditures other than compensation and CFC, the
current quarterly estimates for most categories of goods are based on MTS data on budget
outlays. The estimates for most categories of services are based on judgmental trend.
Although the MTS is the primary source for many of the NIPA estimates of
federal consumption expenditures, it is important to note that critical differences in
definition and coverage limit the usefulness of the MTS as an early indicator of
movements in the NIPA measures. For example, current transfer payments, which
account for a significant part of the federal budget, are not counted as production and are
therefore excluded from the NIPA measures of consumption expenditures.17
For compensation, the current quarterly estimates for military employees are
based on DOD employment data. The estimates for civilian defense employees and for
nondefense employees are based on an indicator series that is derived using changes in
BLS current employment statistics. For CFC, the estimates are derived as part of the
perpetual inventory method that is used to prepare BEA’s estimates of the net stocks of
fixed assets.
For defense gross investment, the current quarterly estimates for most categories
are primarily based on MTS data on outlays and on DOD data from financial reports on
disbursements. The second and third current quarterly estimates are also supplemented
with other information from DOD when available. For nondefense gross investment, the
estimates of structures are primarily based on Census Bureau monthly construction
statistics, and the estimates of equipment and software are primarily based on
government agency data or on judgmental trend.
State and local
For most categories of state and local consumption expenditures other than
compensation and CFC, the current quarterly estimates are derived by first preparing the
quantity estimates and then “reflating” those estimates to current dollars by multiplying
them by appropriate price indexes (generally BLS producer price indexes or consumer
price indexes).
17
For more information, see the box “The Monthly Treasury Statement and BEA’s Estimates of Federal
Government Spending,” Survey 86 (February 2006): 6.

CHAPTER 9: GOVERNMENT CONSUMPTION EXPENDITURES AND GROSS INVESTMENT
9-14
For compensation, the current quarterly estimates are based on an indicator series
that is derived using changes in BLS current employment statistics and changes in the
BLS employment cost index. For CFC, the estimates are derived as part of the perpetual
inventory method that is used to prepare BEA’s estimates of the net stocks of fixed
assets.
For gross investment, the estimates for structures, which account for over four-
fifths of total investment, are based on Census Bureau monthly construction statistics.
The estimates for equipment and software are primarily based on judgmental trend. For
investment in motor vehicles, the estimates reflect monthly data on new motor vehicle
registrations by state and local governments from R.L. Polk and Company.
Quantity and price estimates
The estimates of quantities purchased, or real spending, for most of the detailed
government consumption expenditures and gross investment categories except
compensation and CFC are prepared by deflation. Under this method, the quantities are
calculated by dividing the current-dollar value of the component by an appropriate price
index (with the reference year set equal to 100). For many defense categories, particularly
for equipment, BEA directly prepares detailed price indexes based on DOD delivery and
price information. In addition, as mentioned above, the current quarterly quantity
estimates for most of the state and local government components are prepared by quantity
extrapolation. The quantity and price estimates of compensation for military employees
are prepared by quantity extrapolation using an indicator derived from DOD employment
data, and the quantity and price estimates for federal civilian employees and for state and
local government employees are prepared by quantity extrapolation using an indicator
derived from BLS employment data. (For a general description of the deflation and
quantity extrapolation methods, see “Estimates for detailed components” in chapter 4.)
The aggregate measures of government consumption expenditures and gross
investment are calculated from the detailed components as chain-type quantity and price
indexes (for information about these calculations, see “Estimates for NIPA aggregates” in
chapter 4). BEA also prepares measures of real government consumption expenditures
and gross investment and its components in a dollar-denominated form, designated
“chained-dollar” estimates (see “Chained-dollar measures” in chapter 4).

CHAPTER 9: GOVERNMENT CONSUMPTION EXPENDITURES AND GROSS INVESTMENT
9-15
Table 9.A—Summary of Methodology Used to Prepare Estimates of Government Consumption Expenditures
Line in NIPA table group 3.10
Component
Current-dollar estimates Quantity and price estimates (Quantity estimate prepared by deflating with
price index unless otherwise indicated) Benchmark-year and nonbenchmark-year
estimates Current quarterly estimates*
(Indicator series used to extrapolate annual estimate)
12 Federal consumption expenditures:
23 Defense consumption expenditures: calculated as gross output of general government less own-account investment and sales to other sectors (line
24 less lines 32 and 33).
24 Gross output of general government: calculated as value added plus intermediate goods and services purchased (line 25 plus line 28).
25 Value added: calculated as compensation of general government employees plus consumption of general government fixed capital (line 26 plus line 27).
26 Compensation of general government employees:
Military Wages and salaries: federal budget data. Employer contributions for social insurance: SSA data for military personnel. Employer contributions for employee pension and insurance funds: MTS data.
Wages and salaries: DOD data on military employment. Employer contributions for social insurance: BEA wages and salaries estimate. Employer contributions for employee pension and insurance funds: BEA wages and salaries estimate and federal budget data.
Quantity extrapolation using employment data from DOD.
Civilian Wages and salaries: QCEW data. Employer contributions for social insurance: SSA data for civilian personnel. Employer contributions for employee pension and insurance funds: MTS data, OPM data, and Thrift Savings Board data.
Wages and salaries: CES data on employment. Employer contributions for social insurance: BEA wages and salaries estimate. Employer contributions for employee pension and insurance funds: CES data on employment, BEA wages and salaries estimate, and federal budget data.
Quantity extrapolation using BLS employment data.
27 Consumption of general government fixed capital
Perpetual inventory method based on gross investment estimates and on investment prices.
Same as for annual estimates. Perpetual inventory method based on gross investment estimates and on investment prices.
28 Intermediate goods and services purchased:
29 Durable goods Ships: MTS data on outlays. Other components: DOD financial reports on disbursements and DOD contract award data.
Ships: same as for annual estimates. Other components: DOD financial reports on disbursements when available, or MTS data on outlays.
Various PPIs, IPDs, and DOD price information.

CHAPTER 9: GOVERNMENT CONSUMPTION EXPENDITURES AND GROSS INVESTMENT
9-16
Table 9.A—Summary of Methodology Used to Prepare Estimates of Government Consumption Expenditures
Line in NIPA table group 3.10
Component
Current-dollar estimates Quantity and price estimates (Quantity estimate prepared by deflating with
price index unless otherwise indicated) Benchmark-year and nonbenchmark-year
estimates Current quarterly estimates*
(Indicator series used to extrapolate annual estimate)
30 Nondurable goods
Petroleum products: expenditures from DOD Defense Energy Support Center. Other components: DOD financial reports on disbursements and DOD contract award data.
Petroleum products: data from DOD Defense Finance and Accounting Services when available, or judgmental trend. Other components: DOD financial reports on disbursements when available, or judgmental trend.
Petroleum products: DOD price and quantity information. Other components: various PPIs.
31 Services Research and development: MTS data on outlays and NSF data. Installation support: U.S. Postal Service, DOD contract award, Communication Services Industrial Fund, and McNeil Technologies data. Weapons support: DOD financial reports on disbursements and DOD contract award data. Personnel support: DOD contract award data and BEA international transactions accounts data on payments to foreign nationals. Other components: Federal budget data.
Research and development: MTS data on outlays. Installation support: judgmental trend. Weapons support: DOD financial reports on disbursements when available, or judgmental trend. Personnel support: judgmental trend and, when available, BEA international transactions accounts data on payments to foreign nationals. Other components: judgmental trend.
Installation support: various PPIs, CPIs, and other price information. Weapons support: various BLS employment cost indexes and PPIs. Personnel support: various CPIs and other price information. Other components: various PPIs and other price information.
32 Less: Own-account investment
Structures: value put in place from MCS. Software: portion of national total for own-account software (see the technical note to chapter 6).
Structures: same as for annual estimates. Software: judgmental trend.
Structures: various PPIs and other price information. Software: BEA own-account software intermediate inputs index and BEA nondefense compensation price index.
33 Less: Sales to other sectors
DOD financial reports on disbursements and MTS data on outlays.
DOD financial reports on disbursements when available, or MTS data on outlays.
IPD for military officers’ compensation and various PPIs.
34 Nondefense consumption expenditures: calculated as gross output of general government less own-account investment and sales to other sectors
(line 35 less lines 45 and 46).
35 Gross output of general government: calculated as value added plus intermediate goods and services purchased (line 36 plus line 39).

CHAPTER 9: GOVERNMENT CONSUMPTION EXPENDITURES AND GROSS INVESTMENT
9-17
Table 9.A—Summary of Methodology Used to Prepare Estimates of Government Consumption Expenditures
Line in NIPA table group 3.10
Component
Current-dollar estimates Quantity and price estimates (Quantity estimate prepared by deflating with
price index unless otherwise indicated) Benchmark-year and nonbenchmark-year
estimates Current quarterly estimates*
(Indicator series used to extrapolate annual estimate)
36 Value added: calculated as compensation of general government employees plus consumption of general government fixed capital (line 37 plus line 38).
37 Compensation of general government employees
Wages and salaries: QCEW data. Employer contributions for social insurance: SSA data. Employer contributions for employee pension and insurance funds: OPM data.
Wages and salaries: CES data on employment. Employer contributions for social insurance: wages and salaries estimate. Employer contributions for employee pension and insurance funds: CES data on employment.
Quantity extrapolation using BLS employment data.
38 Consumption of general government fixed capital
Perpetual inventory method based on gross investment estimates and on investment prices.
Same as for annual estimates. Perpetual inventory method based on gross investment estimates and on investment prices.
39 Intermediate goods and services purchased:
40 Durable goods MTS data on outlays. Same as for annual estimates. Various PPIs and IPDs.
41 Nondurable goods:
42 Commodity Credit Corporation (CCC) inventory change
CCC Inventory Operations by Commodities Report and the Donations Report from the U.S. Department of Agriculture.
Same as for annual estimates.
Direct valuation using market price data from the National Agricultural Statistics Service.
43 Other nondurable goods
Petroleum: McNeil Technologies data. Other components: MTS data on outlays.
Petroleum: judgmental trend. Other components: same as for annual estimates.
Petroleum: for Strategic Petroleum Reserve, direct valuation using Department of Energy prices and quantities; for other petroleum purchases, PPI for light fuel oils, PPI for gasoline, and PPI for residual fuels. Other components: various PPIs.
44 Services Financial services furnished without payment: commodity-flow method, primarily based on data from federal government
Financial services furnished without payment: for third estimate, data from federal government agencies; for second
Financial services furnished without payment: for annual, quantity extrapolation using BLS banking output indexes; for

CHAPTER 9: GOVERNMENT CONSUMPTION EXPENDITURES AND GROSS INVESTMENT
9-18
Table 9.A—Summary of Methodology Used to Prepare Estimates of Government Consumption Expenditures
Line in NIPA table group 3.10
Component
Current-dollar estimates Quantity and price estimates (Quantity estimate prepared by deflating with
price index unless otherwise indicated) Benchmark-year and nonbenchmark-year
estimates Current quarterly estimates*
(Indicator series used to extrapolate annual estimate)
agencies. Research and development: data on disbursements from NSF and the National Aeronautics and Space Administration. Other components: federal budget data.
and advance estimates, judgmental trend. Research and development: NASA disbursements data and judgmental trend. Other components: judgmental trend.
quarterly, judgmental trend. Research and development: various PPIs. Other components: various CPIs and PPIs.
45 Less: Own-account investment
Structures: value put in place from MCS. Software: portion of national total for own-account software (see the technical note to chapter 6).
Structures: same as for annual estimates. Software: judgmental trend.
Structures: various PPIs and other price information. Software: BEA own-account software intermediate inputs index and nondefense compensation price index.
46 Less: Sales to other sectors
U.S. Department of Agriculture, Strategic Petroleum Reserve, and MTS data on outlays.
Same as for annual estimates when available, or judgmental trend.
Various PPIs.
47 State and local consumption expenditures: calculated as gross output of general government less own-account investment and sales to other sectors
(line 48 less lines 56 and 57).
48 Gross output of general government: calculated as value added plus intermediate goods and services purchased (line 49 plus line 52).
49 Value added: calculated as compensation of general government employees plus consumption of general government fixed capital (line 50 plus line 51).
50 Compensation of general government employees
Wages and salaries: QCEW data. Employer contributions for social insurance: SSA, Department of Labor, and COG/GF data. Employer contributions for employee pension and insurance funds: primarily data from COG/GF and from the Medical Expenditure Panel Survey conducted by the Agency for Healthcare Research and Quality.
Wages and salaries: CES data on employment and BLS employment cost index. Employer contributions for social insurance: BEA wages and salaries estimate and judgmental trend. Employer contributions for employee pension and insurance funds: judgmental trend.
Quantity extrapolation, primarily using BLS employment data.
51 Consumption of general government fixed
Perpetual inventory method based on gross investment estimates and on investment prices.
Judgmental trend. Perpetual inventory method based on gross investment estimates and on investment prices.

CHAPTER 9: GOVERNMENT CONSUMPTION EXPENDITURES AND GROSS INVESTMENT
9-19
Table 9.A—Summary of Methodology Used to Prepare Estimates of Government Consumption Expenditures
Line in NIPA table group 3.10
Component
Current-dollar estimates Quantity and price estimates (Quantity estimate prepared by deflating with
price index unless otherwise indicated) Benchmark-year and nonbenchmark-year
estimates Current quarterly estimates*
(Indicator series used to extrapolate annual estimate)
capital
52 Intermediate goods and services purchased:
53 Durable goods COG/GF, Bowker, and Association of American Publishers data on purchases.
Judgmental trend. Various CPIs and PPIs.
54 Nondurable goods
COG/GF data on purchases. Judgmental trend. Various CPIs and PPIs.
55 Services Financial services furnished without payment: commodity-flow method, primarily based on data from federal government agencies and financial industry sources (see the technical note to chapter 5). Other components: COG/GF data on purchases.
Financial services furnished without payment: for third estimate, same as for annual estimates; for second and advance estimates, judgmental trend. Other components: judgmental trend.
Financial services furnished without payment: quantity extrapolation using BLS banking output indexes, Federal Reserve Board flow of funds data, and various PPIs. Other components: various CPIs and PPIs.
56 Less: Own-account investment
Structures: primarily based on COG/GF data. Software: portion of national total for own-account software (see the technical note to chapter 6).
Structures: value put in place data from MCS. Software: judgmental trend.
Structures: various CPIs, PPIs, and IPDs. Software: BEA own-account software intermediate inputs index.
57 Less: Sales to other sectors:
58 Tuition and related educational charges
COG/GF data. Judgmental trend. Various CPIs and PPIs.
59 Health and hospital charges
COG/GF and SAS data. Judgmental trend. Various CPIs and PPIs.
60 Other sales COG/GF data. Judgmental trend. Various CPIs and PPIs.

CHAPTER 9: GOVERNMENT CONSUMPTION EXPENDITURES AND GROSS INVESTMENT
9-20
* For state and local government series, the current quarterly estimates are prepared by extrapolating the annual quantity estimate, either using an indicator series or judgmentally,
to derive the quarterly quantity estimate and then reflating that estimate using an appropriate price index.
BEA Bureau of Economic Analysis BLS Bureau of Labor Statistics CES Current Employment Statistics, BLS COG/GF Census of Governments and Annual Survey of Government Finances, Census Bureau CPI Consumer Price Index, BLS DOD Department of Defense IPD Implicit Price Deflator, BEA MCS Monthly construction statistics, Census Bureau MTS Monthly Treasury Statement, Department of the Treasury
NIPAs National Income and Product Accounts, BEA NSF National Science Foundation OPM Office of Personnel Management PPI Producer Price Index, BLS QCEW Quarterly Census of Employment and Wages, BLS SAS Service Annual Survey, Census Bureau SSA Social Security Administration
CHAPTER 9: GOVERNMENT CONSUMPTION EXPENDITURES AND GROSS INVESTMENT
9-21
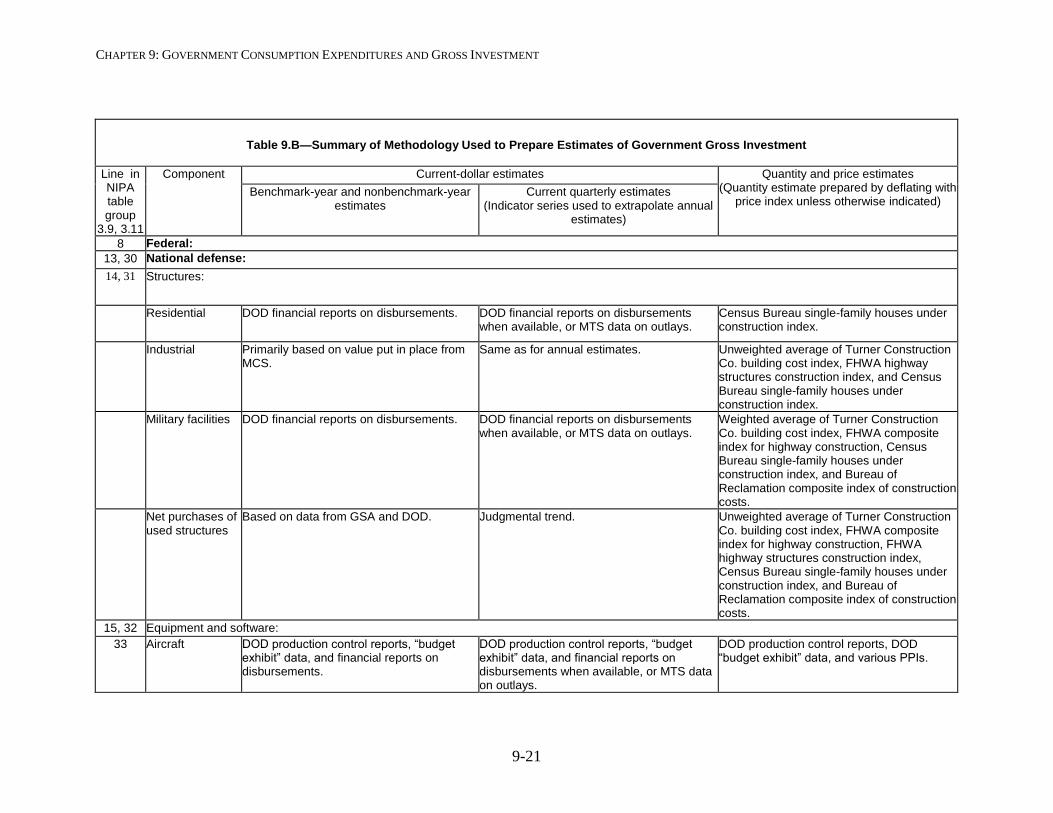
Table 9.B—Summary of Methodology Used to Prepare Estimates of Government Gross Investment
Line in NIPA table group
3.9, 3.11
Component
Current-dollar estimates Quantity and price estimates (Quantity estimate prepared by deflating with
price index unless otherwise indicated) Benchmark-year and nonbenchmark-year
estimates Current quarterly estimates
(Indicator series used to extrapolate annual estimates)
8 Federal:
13, 30 National defense:
14, 31 Structures:
Residential DOD financial reports on disbursements. DOD financial reports on disbursements when available, or MTS data on outlays.
Census Bureau single-family houses under construction index.
Industrial Primarily based on value put in place from MCS.
Same as for annual estimates. Unweighted average of Turner Construction Co. building cost index, FHWA highway structures construction index, and Census Bureau single-family houses under construction index.
Military facilities DOD financial reports on disbursements. DOD financial reports on disbursements when available, or MTS data on outlays.
Weighted average of Turner Construction Co. building cost index, FHWA composite index for highway construction, Census Bureau single-family houses under construction index, and Bureau of Reclamation composite index of construction costs.
Net purchases of used structures
Based on data from GSA and DOD. Judgmental trend. Unweighted average of Turner Construction Co. building cost index, FHWA composite index for highway construction, FHWA highway structures construction index, Census Bureau single-family houses under construction index, and Bureau of Reclamation composite index of construction costs.
15, 32 Equipment and software:
33 Aircraft DOD production control reports, “budget exhibit” data, and financial reports on disbursements.
DOD production control reports, “budget exhibit” data, and financial reports on disbursements when available, or MTS data on outlays.
DOD production control reports, DOD “budget exhibit” data, and various PPIs.

CHAPTER 9: GOVERNMENT CONSUMPTION EXPENDITURES AND GROSS INVESTMENT
9-22
Table 9.B—Summary of Methodology Used to Prepare Estimates of Government Gross Investment
Line in NIPA table group
3.9, 3.11
Component
Current-dollar estimates Quantity and price estimates (Quantity estimate prepared by deflating with
price index unless otherwise indicated) Benchmark-year and nonbenchmark-year
estimates Current quarterly estimates
(Indicator series used to extrapolate annual estimates)
34 Missiles DOD production control reports, “budget exhibit” data, and financial reports on disbursements.
DOD production control reports, “budget exhibit” data, and financial reports on disbursements when available, or MTS data on outlays.
DOD production control reports, DOD “budget exhibit” data, and various PPIs and IPDs.
35 Ships MTS data on outlays. Same as for annual estimates. Various PPIs.
36 Vehicles DOD production control reports, “budget exhibit” data, and financial reports on disbursements.
DOD production control reports, “budget exhibit” data, and financial reports on disbursements when available, or MTS data on outlays.
DOD production control reports, DOD “budget exhibit” data, and various PPIs and IPDs.
37 Electronics and software
Electronics and computers: DOD financial reports on disbursements, DOD contract awards data, and data from the Federal Procurement Data System. Software: for benchmark year, BEA’s benchmark input-output accounts, primarily based on receipts data from Census Bureau economic census; for nonbenchmark years, primarily based on SAS receipts data.
Electronics and computers: DOD financial reports on disbursements when available, or MTS data on outlays. Software: for third estimate, QSS total revenue data; for second and advance estimates, receipts from company reports to the Security and Exchange Commission.
Electronics and computers: various PPIs and IPDs. Software: BEA price/cost index for custom software.
38 Other equipment DOD financial reports on disbursements. DOD financial reports on disbursements when available, or MTS data on outlays.
Various PPIs.
18 Nondefense:
19 Structures:
New Primarily based on value put in place from MCS.
Same as for annual estimates. Turner Construction Co. building cost index, FHWA composite index for highway construction, Census Bureau single-family houses under construction index, and Bureau of Reclamation composite index of construction costs, Handy-Whitman construction cost indexes, and various IPDs.

CHAPTER 9: GOVERNMENT CONSUMPTION EXPENDITURES AND GROSS INVESTMENT
9-23
Table 9.B—Summary of Methodology Used to Prepare Estimates of Government Gross Investment
Line in NIPA table group
3.9, 3.11
Component
Current-dollar estimates Quantity and price estimates (Quantity estimate prepared by deflating with
price index unless otherwise indicated) Benchmark-year and nonbenchmark-year
estimates Current quarterly estimates
(Indicator series used to extrapolate annual estimates)
Net purchases of used structures
Based on data from GSA, Federal Housing Administration, and the Veterans’ Administration.
Judgmental trend. Unweighted average of Turner Construction Co. building cost index, FHWA composite index for highway construction, FHWA highway structures construction index, Census Bureau single-family houses under construction index, and Bureau of Reclamation composite index.
20 Equipment and software:
Equipment Computers: GSA data. Aerospace equipment: Federal budget data. Vehicles: GSA data. Enterprise equipment: Federal budget data.
Computers: same as for annual estimates. Aerospace equipment: judgmental trend. Vehicles: same as for annual estimates. Enterprise equipment: judgmental trend.
Computers: various IPDs. Aerospace equipment: various PPIs. Vehicles: various PPIs. Enterprise equipment: various PPIs.
Software For benchmark year, BEA’s benchmark I-O accounts, primarily based on receipts data from Census Bureau economic census; for nonbenchmark years, primarily based on SAS receipts data.
For third estimate, QSS total revenue data; for second and advance estimates, receipts from company reports.
BEA price/cost index for custom software and various PPIs.
23 State and local:
24 Structures:
New Primarily based on COG/GF data. Value put in place from MCS. Turner Construction Co. building cost index, Census Bureau single-family houses under construction index, Bureau of Reclamation composite index of construction costs, and Handy-Whitman construction cost indexes.
Net purchases of used structures
COG/GF data. Judgmental trend. BEA price indexes for new private nonfarm residential structures, for new private farm residential structures, and for new private nonresidential structures.
25 Equipment and software:
Equipment Computers and peripheral equipment: for benchmark year, BEA’s benchmark I-O accounts, primarily based on manufacturers’
Computers and peripheral equipment: primarily based on shipments from Census Bureau monthly survey of manufacturers’
Computers and peripheral equipment: BEA price index for investment in computers and peripheral equipment.

CHAPTER 9: GOVERNMENT CONSUMPTION EXPENDITURES AND GROSS INVESTMENT
9-24
Table 9.B—Summary of Methodology Used to Prepare Estimates of Government Gross Investment
Line in NIPA table group
3.9, 3.11
Component
Current-dollar estimates Quantity and price estimates (Quantity estimate prepared by deflating with
price index unless otherwise indicated) Benchmark-year and nonbenchmark-year
estimates Current quarterly estimates
(Indicator series used to extrapolate annual estimates)
shipments from Census Bureau economic census; for nonbenchmark years, primarily based on shipments data from Census Bureau annual survey of manufactures. Other components: COG/GF data.
shipments, inventories, and orders and from Federal Reserve Board industrial production index. Other components: judgmental trend.
Other components: various PPIs.
Software For benchmark year, BEA’s benchmark I-O accounts, primarily based on receipts data from Census Bureau economic census; for nonbenchmark years, primarily based on SAS receipts data.
For third estimate, QSS total revenue data; for second and advance estimates, receipts from company reports.
BEA price index for custom software and various PPIs.
BEA Bureau of Economic Analysis BLS Bureau of Labor Statistics CPI Consumer Price Index, BLS DOD Department of Defense FHWA Federal Highway Administration GSA Government Services Administration IPD Implicit Price Deflator, BEA MCS Monthly construction statistics, Census Bureau MTS Monthly Treasury Statement
NIPAs National Income and Product Accounts, BEA PPI Producer Price Index, BLS QSS Quarterly Services Survey, Census Bureau SAS Service Annual Survey, Census Bureau
Related Documents