Experiencing Sensation and Perception Page 9.1 Chapter 9: Constancy and Illusions Chapter 9 Constancy and Illusions Chapter Outline: I. Perceptual Constancy a. Size constancy b. Shape constancy c. Brightness/lightness constancy d. Color constancy II. Visual Illusions a. Illusions Based On Constancy Mechanisms i. Ponzo Illusion ii.Size Illusion with Figure on a Texture (GET THE NAME) iii. Muller-Lyer Illusion? iv. Moon Illusion v. Poggendorf and Perspective Constancy? b. Illusions Based on Contrast Effects i. Herring Illusion ii.Ebbinghaus Illusion iii. Tilt Contrast iv. Jastrow Illusion v. Brick Illusion c. Shape Illusions d. Multistable Figures

Welcome message from author
This document is posted to help you gain knowledge. Please leave a comment to let me know what you think about it! Share it to your friends and learn new things together.
Transcript
Experiencing Sensation and Perception Page 9.1Chapter 9: Constancy and Illusions
Chapter 9
Constancy and Illusions
Chapter Outline:I. Perceptual Constancy
a. Size constancyb. Shape constancyc. Brightness/lightness constancyd. Color constancy
II. Visual Illusionsa. Illusions Based On Constancy Mechanisms
i. Ponzo Illusionii.Size Illusion with Figure on a Texture (GET THE NAME)iii. Muller-Lyer Illusion?iv. Moon Illusionv. Poggendorf and Perspective Constancy?
b. Illusions Based on Contrast Effectsi. Herring Illusionii.Ebbinghaus Illusioniii. Tilt Contrastiv. Jastrow Illusionv. Brick Illusion
c. Shape Illusionsd. Multistable Figures
Experiencing Sensation and Perception Page 9.2Chapter 9: Constancy and Illusions
Constancy and IllusionsThe visual system’s purpose is to provide the best possible visual information to allow us to
function in the world around us. This is a world of objects, most of which have pretty fixed properties. The clothes you are currently are always the same color. Yes, children grow, but they tend to grow so slowly that we do not directly observe their growth but can only become aware of growth by looking back across time. Yet, the visual system must use the visual stimulus that enters the eye. The light that comes from a given object may or may not be as constant as the object is. Take the example of a person walking away from you. From Chapter 4, in our discussion of visual angle, it became apparent that as an object gets farther from the eye, the visual angle of that object gets smaller (refer back to Interactive Illustration 4.x, Visual Angle). So, as the person walks away from you, the retinal image gets smaller, but the person does not appear to shrink. In many ways the visual image entering our eyes does not stay constant from moment to moment. If we experienced all of the variability, the world would become a very confusing place. Sizes would depend upon distance; colors would depend upon the illuminating light or even the time of day. Such a visual system would be practically useless. One of the most fascinating aspects of the visual system is that it deals with these problems effectively, allowing us and other animals to function wonderfully well in the visual environment. The first part of this chapter will explore these issues related to the perception of constancy in the face of a variable visual image in more depth.
However, given the complexity of the visual world and the difficult job of the visual system, it is not surprising that occasionally something does not work quite as expected. Sometimes our perceptions systematically differ from the physical stimulus, and these lead to what are properly called visual illusions. These visual illusions can be useful ways of gaining insights into the operation of the visual system. In one sense, these visual illusions might be considered situations where the visual system breaks down or operates incorrectly. Studying these incorrect operations can lead to insights about the visual system much the same way an engineer might learn an unknown mechanical system by finding what causes it to break down. The last section of this chapter will examine a few common visual illusions. [The variability of the retinal image [what do I want to do here? Is above enough?]
Perceptual ConstancySize constancy
Open Interactive Illustration 9.x, Size, Distance, and Retinal Image Size [link to media]. This figure repeats the illustration of visual angle referred to above but on the top half of the screen. There are two arrows as stimuli visible all of the time. You cannot turn one off as in the last illustration. You can adjust the distance of the red arrow from the eye. The distance of the blue arrow is fixed. Below the eye and the arrows, the actual sizes and distances and visual angles of the two arrows are indicated in a text with a matching color. In the white text are the relative heights of the two arrows and the relative distances are given such that the value for the red arrow is divided by the value for the blue arrow. When the illustration comes up, the two arrows are set to have a constant physical size so the ratio of the sizes is always 1.00. At the bottom half of the screen the arrows are redrawn so to indicate the relative sizes of the two retinal images. When the two arrows are the same distance from the eye, and since they have the same physical size, they will also have the same retinal image size. So when the ratio of the two distances are 1.00, the two arrows at the bottom of the screen are the same and the two values for the visual angles for each arrow will be the same as well. Now double the distance for the red arrow. When the red arrow is twice as far as the blue arrow is from the eye, its retinal image size will now be half as tall. Each time you double the relative distance of blue arrow, the relative height of the arrow is cut in half. If you make the red arrow half as far as the blue arrow is from the eye, the retinal image size for the red arrow will be twice the size of the blue arrow.
To put the changeable nature of the retinal image size into more concrete terms, a 6 foot tall person at 8 feet away from you will have the same height to his retinal image as a 3 foot tall child 4 feet away from you. At 16 feet distance, our 6 foot tall person would have the same height to his retinal image as a small newborn child of 18 inches at 4 feet away. Under most circumstances, we do not experience this radical change in perceived size of a person with changes in distance. We expect and experience people and objects to stay at a constant size and this perception is called size constancy [to glossary].
As might be expected, our ability to perceive size constancy depends upon our ability to perceive depth. Just as the change in the retinal image size is related to the distance an object is from the eye, so perceived size can be held constant by taking into account perceived distance. An experiment by Holway and Boring (1941) clearly demonstrate the role of depth cues in our ability to have size constancy. In this
Experiencing Sensation and Perception Page 9.3Chapter 9: Constancy and Illusions
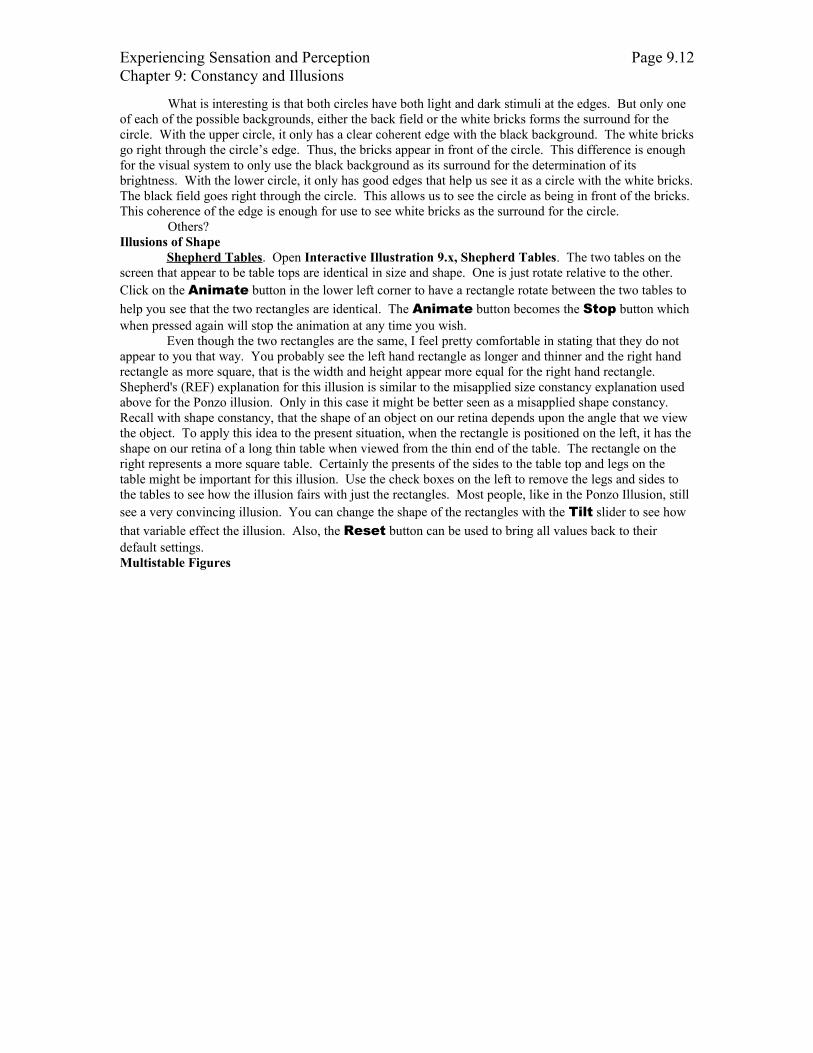
experiment, the subject sat in a corner of two halls that intersected at right angle in the psychology building at Harvard University [CHECK LOCATION]. Along the longer hallway, white discs were placed such that they always had the same retinal image size. That is, a circle 16 feet away had to have twice the diameter of a circle only 8 feet away. Along the shorter hallway, the participant had another circle that could be adjusted in size. See Figure 9.x for a diagram showing the layout of the experiment. The participant’s task was to adjust the size of the circle on the short hallway to match the sizes of the different circles, shown one at a time, along the long hallway. So, if the participant has perfect size constancy, their data should follow the line called “Law of Size Constancy” in Figure 9.x. Since the circles got progressively larger as they got farther away, the perception of size should follow that sequence. If the participant made all of their matches based upon retinal image size, their data should follow the line called “Law of Retinal Image” in Figure 9.x. Since the sizes of the circles were set up to all have the same retinal image size, so should their results, if retinal image size was responsible for our perception of size.
The participant made these judgments in four different conditions. In the first condition, the participant sat in normally lit hall, able to move their head normally and use both eyes. This condition was called the binocular condition. In the second condition, the participants had one eye covered, but the rest of the conditions were the same as the binocular condition. This was the monocular condition. In the third condition, the subject had to look through a small hole that smaller than their actual pupil. Since they could not move their head, this condition eliminated motion parallax, and the small size of the pupil eliminated any influence that accommodation might have had. This was the artificial pupil condition, the name for the small hole. The last condition combined the restrictions of the artificial pupil with trying to reduce as many depth cues in the hallway as possible. The hallway was draped in black cloth to cover the hall, and the only lights were the lights shining on the disks so that they almost appeared to be floating on a black void. Figure 9.x shows the results from the experiment. The perceived size of the circles closely followed the law of size constancy prediction for both the binocular and monocular conditions. The artificial pupil condition data falls between the laws of size constancy and retinal image predictions being close to neither on. The reduced cue condition results show almost no size constancy. As the depth cues are removed the subjects judgment of size moves away from the prediction of perfect size constancy towards the prediction that the retinal image drives the perception of size.
Open Interactive Illustration 9.x, Size Constancy [link to media] to interact directly with depth cues and see how their presence or absence influences our perception of size constancy. This figure is a repeat of a figure shown in Chapter 1. You will see two figures, each on a field that can simulate the appearance of depth using three depth cues: texture gradient, relative size, and relative height. The texture gradient is represented by the squares that get smaller in the distance. The relative size is represented by the fact that the figure that appears in the distance (the person in the white t-shirt) is smaller than the figure in the foreground (the person in the blue t-shirt). The relative height is shown by the person that appears in the distance being drawn higher up in the frame. On the right side of the figure there are three check boxes that allow the depth cues to be removed or added. When the figure comes up, all three depth cues are present so all three checkboxes are checked. While the size constancy is not perfect in this image, it is still working quite powerfully. The figure in the white t-shirt may look smaller, but it is not as small as it ought to appear. Click on the Relative Height check box and see how small the figure appears when it is drawn at the same level as the figure in the blue t-shirt. But careful measurement of the figure will show that it has not changed size, but has been merely moved. Click again on the Relative Height checkbox to restore the relative height depth cue, and then click on Relative Size check box so that that two figures are now drawn the same physical size. It might be hard for you to believe that the two figures are the same size, but they are. You can measure them. The sizes of the two figures are the same to the pixel. The near figure now looks a great deal smaller. Now restore the Relative Size, but remove the texture gradient by clicking on the Texture Gradient checkbox. Again, the difference in the size between the two figures is much more apparent. Add and remove the depth cues singly or in combination, and see how these depth cues are important to size constancy.
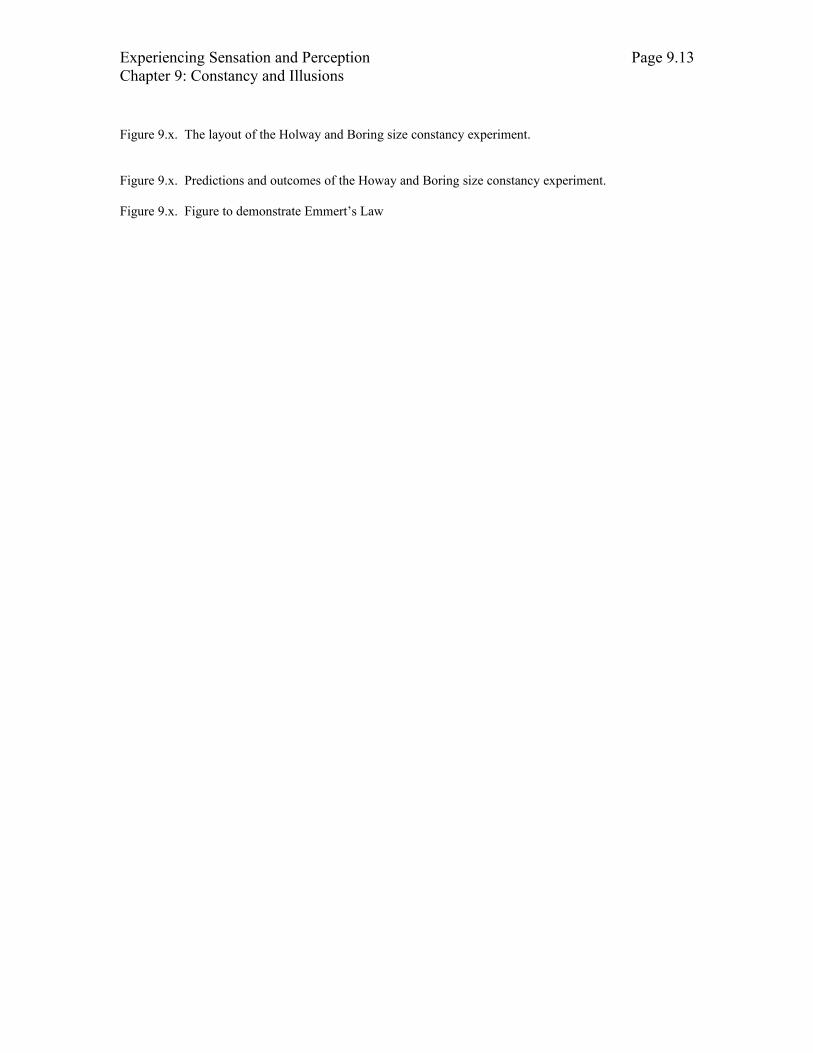
Emmert’s Law. There is a related phenomenon to size constancy that was originally described with aftereffects. Use Figure 9.x to create an aftereffect which will allow you to experience this phenomenon and then understand what is being discussed. Stare at the figure from a comfortable distance for about 30 seconds. After you are done, look up at a wall in the distance (the less cluttered the better) and then at a clean sheet of paper in front of you. Notice the size of the aftereffect. If the aftereffect fades, you can often bring it back by blinking.
Experiencing Sensation and Perception Page 9.4Chapter 9: Constancy and Illusions
When you looked in the wall, which was relatively more distant from you, the aftereffect seemed larger to you than when you look at it on the relatively close sheet of paper. Here perceived size does seem to very greatly with perceived distance. In this case, the greater the perceived distance, the greater the perceived size. This outcome seems to be a direct violation of size constancy but actually the result fall completely within this pheonemon. First of all, notice that with an aftereffect, there is no distance. The aftereffect, of this type, is thought to reside in the activity of the retina to a large extent (REF, XXXX). So, when you looked at the wall, the aftereffect was principally on your retina, but it appeared on the wall. When you looked at the paper and it was near to you, the aftereffect was still on your retina, and its retinal size remained unchanged, but it appeared to be much closer.
Open Interactive Illustration 9.x, Emmert’s Law vs. Size Constancy to see how Emmert’s law grows out of size constancy. In this illustration, which should look familiar, you will see an eye drawn at the left side of the screen and two arrows, one red and one blue. As with the earlier illustrations, the visual angles that arrows form are indicated. You can adjust the distance of the red angle by using the Distance slider at the bottom of the screen. As you adjust the distance of the red arrow, the sizes of the two arrows stay exactly the same because the illustration is set for the red arrow to have a Constant Physical Size when it first comes up. This situation is like the real world. As the distance between the eye and the red arrow increases, the visual angle and retinal image size of the red arrow shrinks, just like real world objects. Size constancy mechanisms compensate for this shrinking of the size of the arrow, so that it would be perceived to always be the same size as the blue arrow. Underneath the illustration of the eye and the arrows there is some useful summary information. The information for each arrow is written in a text color to match the arrow color. First, there are the sizes and distances of the two arrows, given in units of the dots on the screen (pixels.) At the end of the line for each arrow is the visual angle, or retinal image size, of that arrow. As you move the red arrow closer to the eye, the size of the arrow stays constant, but the retinal image size grows, as has been explained.
The aftereffect example that was done, however, behaves quite differently from this situation. Since the retinal image size does not change at all with perceived distance, it is like a situation where there are two objects at different distances, but both with the same retinal image size. You can simulate this situation in this illustration by clicking on the Constant Visual Angle checkbox at the bottom of the screen. Now, irregardless of the distance of the red arrow, its visual angle is identical to the visual angle of the blue arrow. With this option checked, the size of the red arrow will be adjusted so that it has the same visual angle as the blue arrow.
Move the red arrow so that it is closer to the eye than the blue arrow. The red arrow is the smaller of the two arrows. In fact, if you move the red arrow so that it is half the distance from the eye than the blue arrow, it also has to be half the size, so that it has the same visual angle. This outcome is the result of the necessity of fitting the two arrows into the same angle. In both size constancy and the Emmert’s law situation, size is scaled because of perceived distance, but for size constancy, the physical size is constant, and in the Emmert’s law situation, the visual angle is constant. In both cases, the scaling is the same. So Emmert’s law can be seen as a version of or a result of size constancy.
Emmert (1881) developed this law to explain this behavior of aftereffects, but it seems to apply in many situations. In fact, it is possible to say that Emmert’s law is general in any virtual reality situation. By virtual reality, I mean where there is no real depth of objects and the depth is either apparent or simulated via depth cues. For example, Emmert’s law seems to hold in computer generated stereoscopic images where depth is generated using disparity. Stereoscopic depth is often miscalled 3D images in the graphics and commercial worlds from the last chapter we know that the perception of depth depends on many depth cues and not just disparity. Open Interactive Illustration 9.x, Emmert’s Law and Stereoscopic Depth [link to media]. Put on your stereoscopic glasses. You will see two squares. On the right side of the screen is a Right Square Disparity slider. If you adjust the slider towards the top of the screen, you increase the amount of crossed disparity, making the square seem to move towards you. If you adjust the slider towards the bottom of the screen, you increase the amount of uncrossed disparity, making the square appear to move away from you. The slider on the left side of the screen will adjust the disparity of the left square. At the bottom of each slider is a Zero Disparity button that moves the respective slider to the middle of the range and places the respective square at screen depth.
Return the squares to zero disparity if they are not still at a zero disparity. Both squares are the same size, and appear to be the same size. Move the Right Square Disparity slider so that the
Experiencing Sensation and Perception Page 9.5Chapter 9: Constancy and Illusions
amount of crossed disparity increases. As the right square moves towards you, it appears to shrink, in accordance with Emmert’s law version of size constancy. Be careful not to move the Right Square Disparity slider too much. Try to keep the square in fusion, and, thus, within Panum’s Fusional Area. To make it easier to adjust the disparities, you can use the Max Disparity slider at the bottom of the screen.
To make the effect easier to see, move the Left Square Disparity slider to increase the amount of uncrossed disparity. This will make the amount of perceived difference in distance between the two squares greater. As you do this, the left square will appear to move farther away from you, and it will appear to grow in size. Again, this fits Emmert’s law. Remember, the depth is virtual. The squares are always at the same distance from you. They are both on the screen, and the perception of depth is created by drawing two images of each square and letting only one image go into each eye.
Now open Interactive Illustration 9.x, Emmert’s Law and Monocular Depth Cues [ link to media]. Virtual representations of depth are not limited to binocular depth cues. Every painting that represents depth and every photograph has a virtual representation of depth. When this illustration first is drawn, there are two circles on a texture gradient drawn near the bottom of the screen. The left circle is blue and is fixed. The right circle is red and you will be able to change its height in the screen. You can change the height of the red circle by using the Position slider on the right side of the screen or by clicking on the screen or by dragging the circle up and down on the screen. However you chose, move the red circle up the screen until it is over the part of the texture gradient that appears to be a distant wall. As the circle climbs the screen it appears to move farther away. It also appears to grow in size. You can adjust the number of lines used to draw the texture field with the Texture Detail slider on the left side of the screen. You can also try the simulation again but using photographs. Click on the Switch to Images checkbox below the Position slider. The first photograph to come up is a photograph of a hallway. The illustration works in the same way as with the drawn stimulus. You can select different photographs but selecting different numbers from the Image Select menu right above the Switch to Images checkbox. These photographs differ in where the horizon is in the image so you can see if horizon placement alters the effect. The degree of nearby texture also differs. Remember, in all cases, the screen is flat. The depth is virtual just as in the binocular depth illustration and the aftereffects that Emmert first used to develop his law.
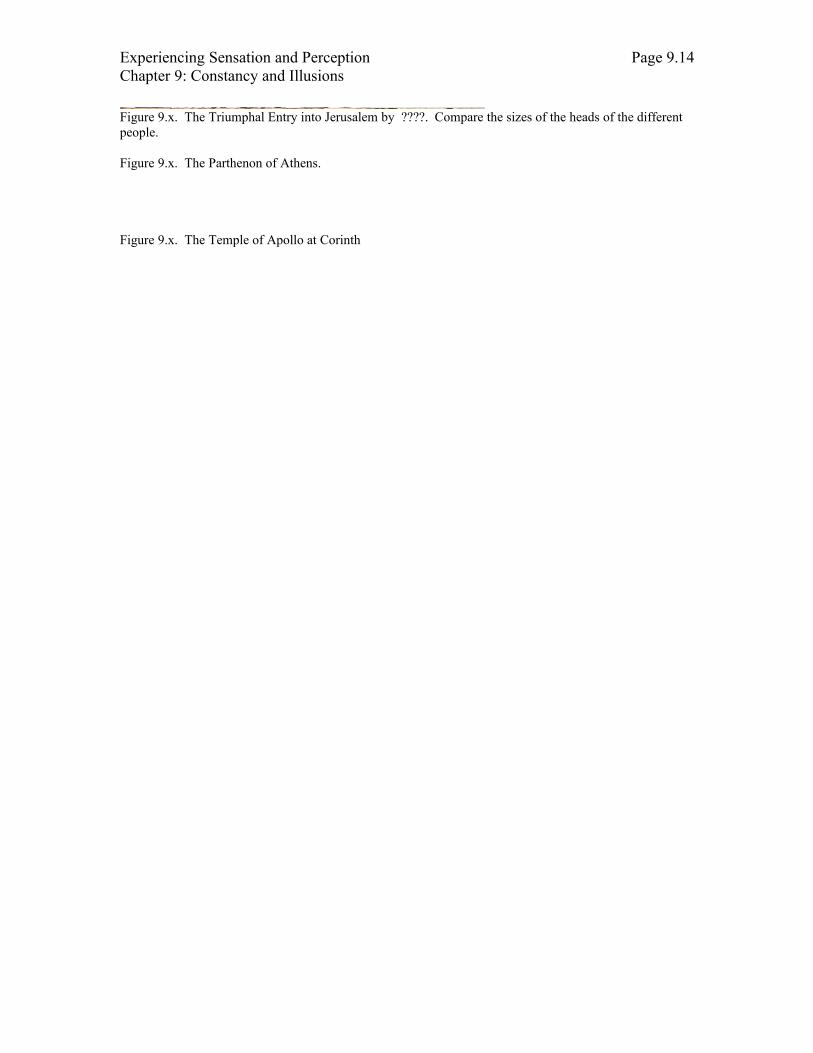
This observation about size in even a flat pictorial image has some interesting implications for art. Depending upon the intention of the artist, it is often the case that two objects that are the same size but drawn at different depths in the scene will often appear different sizes. A person who is in the background should be smaller or the person will appear as a giant compared to the people in the foreground. Figure 9.x show this effect in a famous painting from the fourteenth century. This is a painting of the triumphal entry of Christ into Jerusalem painted by Duccio Di Buoninsegna. This painting is heavily influenced by icon painting of the Orthodox Church so the use of cues is different than we are used to and the effects of size that will be pointed out are not necessarily mistakes. The artist has a different approach to representing a scene than most of us are used to. However, if you compare the size of the head of Christ in the foreground to the head of the man just under the arch, you will see that they are drawn to be exactly the same size. However, the head of the man in the background appears much larger than that of Christ. Again, Emmert’s law seems to hold nicely.
Shape ConstancyThe second constancy to be discussed draws of many of the same mechanisms as size constancy.
Take a coin and rotate it before you. As you watch the coin, the shape of the retinal image of the coin changes. When the coin is directly in front of you, it is a circle, as it rotates the image of the coin on the retina becomes a progressively flatter ellipse, until when you look at it on edge, the coin is a line. Then the shape change reverses itself back to the circle. [I COULD USE A SERIES OF PHOTOS OR A VIDEO TO ILLUSTRATE THIS]. Yet for most of the rotation, the coin looks circular even when the retinal image shape decidedly is not. This constancy is called shape constancy [to glossary]. The perceived shape does not change, even though the retinal image shape does change, as a result of not seeing the object from straight on. [THIS STRIKES ME AS VERY VAGUE]
Experiencing Sensation and Perception Page 9.6Chapter 9: Constancy and Illusions
Open Interactive Illustration 9.x, Shape Constancy [link to media] to illustrate this constancy. The main part of the screen is a texture gradient, with an ellipse drawn on the part that represents the floor of the room. There are four sliders to the left side of the screen. The far left Density slider controls the number of lines on the screen used to represent the texture. The next slider is the Depth slider, and it manipulates the perceived distance of the back area. The Position slider moves the ellipse up and down the screen so it can appear on the floor or the back wall. The most important slider is the Shape slider, which controls the shape of the circle. When the illustration first comes up, the ellipse is positioned on the floor, as represented on the screen. Adjust the shape slider until the ellipse appears as a circle. When you think you have a circle, use the Check button below the sliders to remove the texture gradient, and a window will pop up giving the ratio of the height to the width of your circle. Most people will have a ratio a good bit less than one which is the ratio of a true circle. [GET SOME DATA ON THIS TO MAKE THIS MORE CONCRETE] The fact that an ellipse appeared as a circle is clear with the texture removed from the screen, so the circle no longer appears to be on the floor. Close the results window, and you can press Reset to try it again. It is also interesting to move the circle up to the back wall and see that, it is easy to get a height to width ratio very close to 1. [AGAIN I NEED RESULTS HERE]
A similar pattern happens for rectangular shapes, and it helps illustrates the role that depth perception plays in shape constancy. Open Interactive Illustration 9.x, Shape Constancy and Depth Cues [link to media NEED BETTER PICTURES]. The first photograph that you see is the same photograph of the hallway. Look at the cabinets on the right side of the hallway. They are framed in oak and have glass fronts. They look reasonably rectangular but that is our shape constancy mechanisms working. Move your mouse and click on one corner of the cabinet. A small red square will be drawn where you clicked your mouse. Go around the outside of the cabinet and click on each successive corner. As you do this, another red rectangle will be drawn showing where you have clicked. When you have clicked all four corners, the shape will be closed. It should look closely to the rectangle shape of the cabinets. If you do not like your rectangle, you can just click the picture again and the old rectangle will be removed and a new first corner will be plotted, or you can click the Clear Shape button on the right side of the screen. When the shape is closed and it outlines the cabinet well, click on the Show Picture checkbox at the upper left corner of the screen to remove the photograph. Now, the trapezoidal image shape of the cabinet in the photograph is very apparent. As the cabinet gets farther away, its image size in the scene gets smaller, which is what we would expect from the relative size depth cue. You can select other pictures to allow you to further explore the relationship between size constancy and depth cues. Using the Image Select menu, select picture number 2. This is a photograph of windows from below looking up. In this case outline the central window. Pictures 3 and 4 are related. They are both pictures of the same painting. Picture 3 shows the painting from the side. Picture 4 shows the painting from close to straight on. In this case you can compare the shape of the same object from two different perspectives and see how these perspectives influence the perceived shape. So, like size constancy, shape constancy depends upon our ability to accurately perceive depth.
Brightness/Lightness ConstancyYou are reading a book. The paper on which this book is printed is white or close to it, and the
print is black. Remember, this paper does not generate its own light. The light entering your eye from this page is reflected from those objects around you that generate light. If you are inside, it will be an artificial light of some kind. Outside, it is the sun during the day. The lights in our rooms generate a lot of light, but not nearly as much as the sun at noon on a bright clear day. So, in your mind, take this paper outside. Because a lot more light is falling on the paper, a lot more light is entering your eye. The paper is still white, and has changed little if at all. Take the paper inside and the paper, though reflecting less light, does not become gray. In fact, if the day is bright enough, the black letters will reflect more light into your eyes outside than the white part of the page will inside, assuming standard lighting.
The amount of light that enters the eye changes dramatically, the appearance of the brightness or lightness of the paper and ink change very little. This is a very important constancy that allows us to recognize objects in a wide range of lighting conditions. Part of how this brightness constancy [to glossary] works is due to light/dark adaptation, discussed way back in Chapter 4. When we are in a
Experiencing Sensation and Perception Page 9.7Chapter 9: Constancy and Illusions
brighter environment we are less sensitive to light, so even though the white page is reflecting more light outside, the impact of that light on our visual system remains relatively the same.
Still, in our visual system there are other mechanisms that help support brightness constancy. One mechanism can be illustrated by Interactive Illustration 9.x, Brightness Constancy [link to media] [CAN I MAKE THIS AN EXPERIMENT?]. This illustration is similar to a classic experiment on brightness constancy conducted by NAME (CITE). In that experiment, the participants also saw two large circles with two smaller central circles. The task of the participant was to adjust the brightness of the central circle on the right hand side. That side was the comparison. If the visual system worked so that it perceived the absolute levels of light, then the right hand central circle should be adjusted so that it matched the light level of the left hand central circle. Use Interactive Illustration 9.x and try this task. Use the Match slider on the right side of the screen and adjust the light level of the right hand central circle until it matches in brightness the circle on the left. When you are finished, press the It Matches button underneath the Match slider.
When you press the It Matches button, a table covering your results is displayed. The first row of data in the table is for the standard circle, which is on the hand side of the screen. The second row of data is for the comparison circle on the right hand side of the screen. The last row gives some summary values that compare data from the comparison to the standard stimuli. The first column of data reports a measure related to the light level of the central circles. Let us examine these data first. If your perception of brightness is based on absolute light levels, then these two values should be the same. Remember in making this comparison, that rarely are we so accurate that our data will be exactly the same, but the two values should be close to each other. However, it is unlikely that the luminances for the two centers are even close to the same based upon past experiences collecting data with this activity. Our visual systems do not accept that in this situation equal light levels from the central circles should be perceived to be the same. If you have left all other settings the same, you can easily verify this for yourself. Close your results window and press the Reset button on the lower right corner of the screen. The default setting for the comparison surround light level is exactly the same as the standard central circle. However, most of you will perceive that the comparison surround will appear brighter than the standard center circle.
So far this experiment demonstrates that the human visual system does not perceived brightness or luminance in a strictly absolute manner. The same luminance can appear to be very different levels of brightness. This observation should not be terribly surprising. The fact that the visual system does not perceive light levels in an absolute fashion was discussed before. Recall Simultaneous Contrast from Chapter 5. To help you remember this effect open Interactive Illustration 9.x: Simultaneous Contrast [link to media]. In this figure there are two surround squares, a black one on the left and a white one on the right. The two central squares that are inside the surround squares are both the exact same level of gray. Still, most people perceive the right square to be darker than the left. You can see the instability of the perception of the brightness of the two central squares by pressing the Start button on the screen. As the left hand surround square gets brighter, the left hand central square gets darker. Without changing the luminance of the central square, perceived brightness changes.
As you may recall, simultaneous contrast was explained as one of the visual phenomena that were at least partially the result of the center-surround receptive fields discussed in Chapters 3 and 5. Open Interactive Illustration 9.x: Lateral Inhibition and Simultaneous Contrast [link to media]. This illustration is similar to one in Chapter 5 that used center surround receptive fields to explain several visual phenomena like Mach Bands and The Craik-O’Brien-Cornsweet effect. If you need to review the center-surround receptive fields, review the section entitled The Receptive Field starting on page XX in Chapter 3 and the sections Center-Surround Receptive Fields and Lateral Inhibition and The Role of Contour in Perception starting on page XX in Chapter 5. Briefly, Kuffler (1953) discovered that ganglion cells of the eye have the center-surround receptive field. Light falling in the central area will either excite or inhibit the cell, while light falling on the surrounding region has the opposite effect. When both the central and surrounding region so of the cell are filled with light, they tend to cancel each other out, causing very little response in the cell. For our considerations, only the receptive fields with excitatory central regions will be discussed. The receptive fields with the central region being inhibitory simply behave in the opposite fashion.
When you first open the illustration, there is a simultaneous contrast figure, similar to the last illustration, that is drawn as overlaying a series of several receptive fields. Below the figure is a bar graph
Experiencing Sensation and Perception Page 9.8Chapter 9: Constancy and Illusions
where the height of each bar is the firing rate of each receptive field, in order from the left side with one bar for each receptive field. The higher the bar the greater the firing rate of that cell. As the firing rate increases, the bar turns more green. The same color change is given to the respective receptive field. So at startup, the thirteenth cell from the left has the highest firing rate. This fact is shown by the height of its bar, the green color at the top of the bar and the green color for the circles on the simultaneous contrast image that represent this receptive field. Those receptive fields that have a firing rate below the background firing rate are darker than the rest of the receptive fields. The firing rate is determined according to the principles discussed in Chapters 3 and 5. If you recall, the firing rate for a receptive field filled with no light (black), is very similar to the firing rate of a receptive field that is completely filled with light (white), because the excitatory and inhibitory regions tend to cancel each other out. From this fact alone, it is clear that the information being sent to the brain by the retina is not a direct result of the light level falling on the retina. If you look at the graph, the only cells whose firing rate is either greater to or less than the background firing rate are the cells that happen to have a contour of the image fall it its receptive field. Looking at the gray square on the left, the receptive field that has its center in the dark area but is right at the edge of the gray square (cell number 3) has a firing rate lower than the background firing rate. The next cell (cell number 4) has its center on the gray patch and only part of its surround on the black, has a much higher firing rate than the background firing rate. If you recall from Chapter 5, this pattern of firing is always seen at edges that go from darker to lighter regions, in that order. The order of the cells’ firing rate is reversed for the gray patch on the right side of the screen. Looking at cells number 16 and 17, the firing rate goes from greater than the background firing rate to less than the background firing rate. You can change the cell types to off center receptive fields using the Cell Type menu, and you can adjust the two background light levels in a manner similar to the last interactive illustration using the Increase Left and Decrease Left buttons. As you increase the light level of the left surround, you will decrease the light level of the right surround in an analogous fashion, and vice versa. In summary, the two gray squares, both with the same luminance, cause very different effects on these receptive fields. Each square gives a response that depends more upon its surround than its absolute light level. This is exactly the issue seen in the brightness constancy experiment that was discussed above by Author (XXXX). Both experiments suggest that the brightness of a perceived patch of light depends not only upon its luminance, but also its light level compared to its surrounding regions. This comparison of light level of one region to its neighboring regions is in part explained by the receptive fields that had been discussed earlier in the book.
To summarize, the ability of the visual system to create brightness constancy depends on several factors. First, there is the overall state of adaptation. Second, there is the comparison of the luminance of the object against its neighboring regions. The center-surround receptive fields of the ganglion cells and lateral geniculate nucleus certainly play a role in helping with brightness constancy, but they will not be the only feature of our visual system that is relevant.
Color ConstancyOpen Interactive Illustration 9.x, Light and Color. This is a modification of an illustration
from Chapter 5 that illustrated the effects of changing the wavelengths in the illumination on the color of objects. Remember that most objects that we see reflect light off of their surfaces, and do not generate their own light. The light coming off of your shirt is not determined merely by your shirt, but is also influenced by the light falling on the shirt. Say your shirt is red. Your shirt reflects a high percentage of long wavelengths of light and a low percentage of other wavelengths. That means that your shirt will reflect back to whoever is looking at your shirt a high proportion of the long wavelengths, and a very small proportion of any other wavelengths. But remember, reflectance is proportional. If you are in a room, and the room lighting does not have any long wavelengths in it, that shirt will appear to be black. The shirt cannot reflect light that does not exist in the environment.
This example is extreme, but less extreme variations in the wavelengths often occur in the light that illumines the scenes we see. Illumination is different inside and outside. It is different even at different times of the day outside. If your room light is a standard incandescent light bulb, that light is generated by heating a tungsten filament. The metal glows as a result of this heating. Tungsten is usually heated in a way that generates a lot of long wavelengths, and not as many short wavelengths. This balance of wavelengths leads many people to describe incandescent lights as warm. If you are in a classroom, you probably have fluorescent lights overhead. These lights generally emit a lot more short wavelengths that
Experiencing Sensation and Perception Page 9.9Chapter 9: Constancy and Illusions
compared to tungsten light. Sunlight depends on the time of day with there being relatively more short wavelengths in the light at noon and relatively more long wavelengths in the morning and evenings, though overall there are even more short wavelengths in the light than seen in fluorescent lamps [I COULD USE A FIGURE HERE OF THE WAVELENGTHS]. As a result of all of these variations, the absolute and even relative amount of different wavelengths coming off of an object towards your eyes varies quite frequently.
Figure 9.x allows you to simulate the impact of these different types of illuminants on the wavelengths coming off objects. There is a photograph and when you first bring up the illustration, the photograph is shown unaltered. The computer does its best to reproduce the photograph as it was seen at the time it was taken. To the right of the photograph are controls to change the effective light falling on the people and objects in the photograph. Of most importance for the current discussion are the Illuminant Type buttons. There are Tungsten, Fluorescent, and Sunlight buttons that can be pressed to simulate the changes in the light falling on the objects in these lighting conditions. Above these buttons, are sliders where you can more directly control the illuminant. The height of these sliders indicate how much of the red, green and blue primaries are being used to create the illuminant. When the illustration first comes up, all sliders are at their maximal levels. When you press the Tungsten button, the image appears much more reddish than before. Since the tungsten light generates a lot more red light than was originally present, each of the objects reflect a lot more red than when these same objects and people reflected at the time the picture was taken. The relative intensity red vs. green vs. blue light are shown by the relative heights of the three sliders. You can alternately press the Tungsten and Reset or Sunlight buttons to switch between the original image and the tungsten image. The Sunlight button is a good choice because it is balanced for the brightness of tungsten and fluorescent illuminants. When you press the Fluorescent button the people and landscape appear to be a little bluer than under the tungsten illumination, because of the greater proportion of short wavelengths present in fluorescent light. However, in Sunlight there is even more short wavelengths than in the fluorescent illuminant.
You might have noticed something odd in this illustration. In this example, changing the apparent illumination changed the appearance of the image, but when you carry a real photograph from location to location, the colors don’t change nearly as much. In fact, under most circumstances you would say that the colors do not change at all. While the colors do not change, at least not much in most circumstances, the wavelengths and the relative intensity of different wavelengths do change a great deal under these circumstances. This lack of change of color when the stimulus wavelengths do change is color constancy [to glossary]. Color constancy even works in this example. Click on the Tungsten button and observe the photograph for a brief period of about 30 seconds. The colors begin to appear more normal. Then, if you click back on the Sunlight button, you might see that the image looks a bit too blue, even though it is in the original wavelengths.
Color constancy, like brightness constancy, owes part of its explanation to our ability to adapt. Remember the color aftereffects. Try Experiment 9.x, Color Aftereffects [link to media]. This experiment is a repeat of the experiment demonstrating color aftereffects from Chapter 6. The first page is the setup page. At the bottom of the page is the Test Type menu. Select the Comparison Test type from the menu. There will now be two color wheels on the screen. Use the left hand color wheel to select as pure a blue as you can. Use the right hand color wheel to select the complement to the first color which should be a yellow. When you have selected your colors press, the Done button. On the next page there is a fixation mark in the middle of the screen with a Start button at the bottom of the screen. Click the Start button to begin adaptation. Keep your eyes on the fixation mark and the adaptation will last 30 seconds, if you do not adjust the duration of the adaptation. There will be a blue circle on the left hand side and a yellow circle on the right hand side of the fixation mark. When you have done the adaptation, come back to the text.
After adaptation you probably say a yellow circle on the left side of the fixation mark, where you had seen the blue circle during adaptation. You will also have seen a blue circle on the right side of the fixation mark, where you had seen the yellow circle earler. As was discussed in Chapter 6, the duration of the extended exposure to the blue circle reduced your sensitivity to short wavelengths, which is why you saw the complement when exposed to the white page during the test phase of the experiment. Color constancy probably takes advantage of color adaptation. Being in a room full of tungsten light, which has a greater amount of long wavelengths will cause us to adapt to these long wavelengths and make us less
Experiencing Sensation and Perception Page 9.10Chapter 9: Constancy and Illusions
sensitive to them, and as a result we will not perceived the increased amount of long wavelengths being reflected off of the objects.
In addition, there is evidence that, like brightness constancy, the color of an object is determined not just by the wavelengths coming off of that object, but also by the wavelengths of the lights coming from neighboring objects. One of the classic demonstrations of our ability to see color constancy by comparison is what has been called the mondrian experiments by Edwin Land (1964, 1974). In these experiments, a surface with a random collection of rectangles of different sizes and colors of matte paper is presented to the participants. Each rectangle is surrounded by rectangles of different color. The illumination of the surface is provided by three projectors each of which projects a different narrow band of wavelengths. One projector emits long wavelengths, the second emits middle wavelengths, and the last projector emits short wavelengths. When all give light with the same level of illuminations, these three projectors are a match for white light.
The method for these experiments are fairly complicated so let me take awhile to explain them. First, a participant is asked to look at one square, say a red one. At this point in time, the three projectors are adjusted so the light coming off of the red square that is being watched reflects twice as much middle wavelength as long wavelength. The question for the participant is what is the color now for this red square? Since the square was red, when the participant first saw the square it reflected far more long wavelength than middle wavelength. After the adjustment of the projector, the reverse is true. Still, the participants say that rectangle that they have been focused on the whole time looks red. Within wide ranges of illumination, the wavelength coming off of the square does not change its color appearance. Once red always red. The fact that each square is surrounded by squares of different colors seems very important to the outcome of this experiment. Thus, the comparison of each area with the varied colors around it is important.
[do physiology of color constancy – look in zeki for some information]
Visual Illusions
The human visual system is remarkably adapted to serve our visual need to allow us to function in the world. However, it is still possible to create situations where the visual system gives some incorrect answers. Open Interactive Illustration 9.x, XXXXXX[Pick an Illusion] [link to media]. [DESCRIBE THIS ILLUSION].
As this illustration clearly shows, errors in our perception can be quite large. These errors are known as visual illusions [to glossary], and they have been studied for several centuries. Visual illusions have been known at least since the time of the classical age of Greece, as can be seen in the building of the Parthenon (Figure 9.x) (Coren, XXXX). The Parthenon is often seen as a classic building of proportion and regularity. Yet, it is a carefully constructed structure that by its design overcomes several perceptual illusions. One in the Parthenon is an illusion that tends to make its vertical columns appear to lean out. Examine Figure 9.x, which is a photograph of the Doric Temple of Apollo at Corinth. These three columns are all that remain after an earthquake knocked down the rest of the temple. Still, these remaining columns are perfectly vertical and you can use a ruler or protractor to check this claim. While the columns are vertical, they do not appear vertical, but they really appear to be leaning out from each other. This illusion seems to be due to the fact that these Doric columns are narrower at the top than at the bottom (Krantz and Terry, XXXX). On the Parthenon, the columns actually lean in towards each other to compensate for this illusion. More recently, the study of illustions can be dated to XXXXX. [CHECK ON THIS].
The question remains, why should psychology be so interested in these illusions? Two quick answers might be given. First, as can be seen from the example above, illusions are inherently interesting figures. Second, there is a sort of an engineering interest. As scientists, we are approaching the visual system as a mechanism. We are trying to figure out how this mechanism works and we can draw on the approaches from other people that study how mechanisms work. One group that can face similar problems are engineers faced with figuring out how an unknown device works. There are several ways to figure out how this device works, but one way is to study how the device fails, or does not work correctly. It can be argued that visual illusions are examples of situations where the visual system does not work correctly, so the study of illusions helps to give us an understanding of how the visual system works normally, from studying how it fails.
Experiencing Sensation and Perception Page 9.11Chapter 9: Constancy and Illusions
There are many ways to group illusions. The approach taken here will group illusions based upon how we conceive of how they work. This grouping will put illusions together that seem to have a common explanations for their occurance.
Illusions Based On Constancy MechanismsThe first illusions to be discussed are illusions that seem to result from the very mechanisms that
we have already been discussing in this chapter: Constancy. In particular, size constancy seems to be a powerful mechanism for producing different illusions. This it seems fitting to start with these illusions.
Ponzo Illusion. The Ponzo illusion is illustrate in Interactive Illustration 9.x, The Ponzo Illusion [link to media]. Open it now. When you first open it, you will see the illusion in a very common setup. There are two white vertical lines tilted towards each other. Towards the top of the two lines is a red horizontal bar and towards the bottom is a cyan horizontal bar. The red bar is the comparison and the cyan bar is the standard. Your task is to use the Comparison Length slider at the top of the screen to adjust the length of the red bar until it looks to be the same length as the cyan bar. When you have made the match press the Match button at the bottom left corner of the screen. When you are done, return to the text.
Your results report the length of the comparison bar, the standard bar, and the ratio of their two lengths. It is last value that is of most interest. The ratio has the length of the comparison divided by the length of the standard. If your perception is accurate this ratio should be close to 1.0. But most people find that their ratio is less than one indicating that the red line is shorter than the cyan line when they were seen to be the same length.
Several studies have indicated that size constancy may be the culprit in this illusion (e.g., Leibowitz, et al. XXXX). The argument claims that the two horizontal lines are perspective cues that activate our size constancy mechanisms. In perspective, as two parallel lines recede in depth they approach each other much like the tilted lines of the Ponzo illusion. Thus, since the red bar is near the top where the lines are together, the red line appears to be farther away than the cyan line so that our size constancy mechanism makes the red bar appear larger. Leibowitz, et al, found that the illusion was strong the more depth cues were added. You can simulate a part of this experiment by clicking on the Show Texture checkbox on the left side of the screen. This checkbox will add a series of horizontal white lines which makes the titled lines look more like a railroad receding into the distance. Repeat the experiment and see if you do not have a smaller ratio which indicates a stronger illusion. You can also manipulate the Distance from Middle the two bars are and the Tilt of the two vertical white lines.
Size Illusion with Figure on a Texture (GET THE NAME)Muller-Lyer Illusion?Moon IllusionPoggendorf and Perspective Constancy?
Illusions Based on Contrast EffectsAnother class of illusions deals with contrasting one stimulus with its surround. As we saw with
brightness and color constancy, comparison is a powerful force in the way our visual system works. Herring IllusionEbbinghaus IllusionTilt contrastJastrowBrick Illusion. Open Interactive Illustration 9.x, The Brick Illusion [link to media]. This
illusion is a very interesting type of contrast illusion. It seems to borrow some features from simultaneous contrast but it has some interesting differences. The stimulus, as presented on the screen, is a series of white bricks on a black background. There is one circle in the upper left part of the stimulus that appears to be behind the bricks. This circle looks relatively light. There is another circle, down and to the right, that appears to be on the front of the bricks and appears to be dark. In fact this second circle, appears to be much darker than the first circle. As you can probably guess by this time, the two circles are identical. You can verify this fact by clicking on the Hide Bricks checkbox in the upper left corner of the screen. Click on the Hide Bricks checkbox again and restore the bricks. This is a contrast illusion. The upper brick that appears behind the bricks has the back as its surround making it look lighter. The lower brick that appears on top of the bricks has the light bricks as its surround making it look darker.
Experiencing Sensation and Perception Page 9.12Chapter 9: Constancy and Illusions
What is interesting is that both circles have both light and dark stimuli at the edges. But only one of each of the possible backgrounds, either the back field or the white bricks forms the surround for the circle. With the upper circle, it only has a clear coherent edge with the black background. The white bricks go right through the circle’s edge. Thus, the bricks appear in front of the circle. This difference is enough for the visual system to only use the black background as its surround for the determination of its brightness. With the lower circle, it only has good edges that help us see it as a circle with the white bricks. The black field goes right through the circle. This allows us to see the circle as being in front of the bricks. This coherence of the edge is enough for use to see white bricks as the surround for the circle.
Others?Illusions of Shape
Shepherd Tables. Open Interactive Illustration 9.x, Shepherd Tables. The two tables on the screen that appear to be table tops are identical in size and shape. One is just rotate relative to the other. Click on the Animate button in the lower left corner to have a rectangle rotate between the two tables to help you see that the two rectangles are identical. The Animate button becomes the Stop button which when pressed again will stop the animation at any time you wish.
Even though the two rectangles are the same, I feel pretty comfortable in stating that they do not appear to you that way. You probably see the left hand rectangle as longer and thinner and the right hand rectangle as more square, that is the width and height appear more equal for the right hand rectangle. Shepherd's (REF) explanation for this illusion is similar to the misapplied size constancy explanation used above for the Ponzo illusion. Only in this case it might be better seen as a misapplied shape constancy. Recall with shape constancy, that the shape of an object on our retina depends upon the angle that we view the object. To apply this idea to the present situation, when the rectangle is positioned on the left, it has the shape on our retina of a long thin table when viewed from the thin end of the table. The rectangle on the right represents a more square table. Certainly the presents of the sides to the table top and legs on the table might be important for this illusion. Use the check boxes on the left to remove the legs and sides to the tables to see how the illusion fairs with just the rectangles. Most people, like in the Ponzo Illusion, still see a very convincing illusion. You can change the shape of the rectangles with the Tilt slider to see how that variable effect the illusion. Also, the Reset button can be used to bring all values back to their default settings.Multistable Figures
Experiencing Sensation and Perception Page 9.13Chapter 9: Constancy and Illusions
Figure 9.x. The layout of the Holway and Boring size constancy experiment.
Figure 9.x. Predictions and outcomes of the Howay and Boring size constancy experiment.
Figure 9.x. Figure to demonstrate Emmert’s Law
Experiencing Sensation and Perception Page 9.14Chapter 9: Constancy and Illusions
Figure 9.x. The Triumphal Entry into Jerusalem by ????. Compare the sizes of the heads of the different people.
Figure 9.x. The Parthenon of Athens.
Figure 9.x. The Temple of Apollo at Corinth
Related Documents