WG III contribution to the Sixth Assessment Report List of corrigenda to be implemented The corrigenda listed below will be implemented in the Chapter during copy-editing. CHAPTER 8 Document (Chapter, Annex, Supp. Material) Page (Based on the final pdf FGD version) Line Detailed information on correction to make Chapter 8 41 16-20 Replace: However, there is significant regional variation; between 2000 and 2040, 12.5% of cropland in China and 7.5% of cropland in the Middle East and North Africa could be displaced due to urban expansion, compared to the world average of 3.7% (van Vliet et al. 2017). With However, there is significant regional variation; between 2000 and 2040, 12.5% of cropland in China and 7.5% of cropland in the Middle East and North Africa could potentially be displaced due to urban expansion, compared to the world average of 3.7% (van Vliet et al. 2017).

Welcome message from author
This document is posted to help you gain knowledge. Please leave a comment to let me know what you think about it! Share it to your friends and learn new things together.
Transcript
WG III contribution to the Sixth Assessment Report List of corrigenda to be implemented
The corrigenda listed below will be implemented in the Chapter during copy-editing.
CHAPTER 8
Document (Chapter,
Annex, Supp.
Material)
Page (Based on the final pdf FGD version)
Line Detailed information on correction to make
Chapter 8 41 16-20 Replace: However, there is significant regional variation; between 2000 and 2040, 12.5% of cropland in China and 7.5% of cropland in the Middle East and North Africa could be displaced due to urban expansion, compared to the world average of 3.7% (van Vliet et al. 2017). With However, there is significant regional variation; between 2000 and 2040, 12.5% of cropland in China and 7.5% of cropland in the Middle East and North Africa could potentially be displaced due to urban expansion, compared to the world average of 3.7% (van Vliet et al. 2017).
Do Not Cite, Quote or Distribute 8-1 Total pages: 157
1
Chapter 8: Urban Systems and Other Settlements 2
3 Coordinating Lead Authors: Shuaib Lwasa (Uganda), Karen C. Seto (the United States of America) 4
5 Lead Authors: Xuemei Bai (Australia), Hilda Blanco (the United States of America), Kevin Gurney 6
(the United States of America), Şiir Kılkış (Turkey), Oswaldo Lucon (Brazil), Jin Murakami (Japan), 7
Jiahua Pan (China), Ayyoob Sharifi (Japan/Iran), Yoshiki Yamagata (Japan) 8
9 Contributing Authors: Vanesa Castan Broto (United Kingdom/Spain), Winston Chow (Singapore), 10
Galina Churkina (the Russian Federation,/Germany), Felix Creutzig (Germany), David Dodman 11
(Jamaica/United Kingdom), Rafiq Hamdi (Belgium), Burak Güneralp (Turkey/ the United States of 12
America), Bronwyn Hayward (New Zealand), Angel Hsu (the United States of America), Lucy Hutyra 13
(the United States of America), Nadja Kabisch (Germany), Meredith Keller (the United States of 14
America), Timon McPhearson (the United States of America), Peter Newman (Australia), David 15
Nowak (the United States of America), Alan Organschi (the United States of America), Minal Pathak 16
(India), Mark Pelling (United Kingdom), Clara Pregitzer (the United States of America), Anu 17
Ramaswami (the United States of America), Mia Reback (the United States of America), Diana Reckien 18
(Germany), Jen Shin (the United States of America), Michael Westphal (the United States of America), 19
Lee White (Australia) 20
21 Review Editors: Carolina Dubeux (Brazil), Diana Ürge-Vorsatz (Hungary) 22 23 Chapter Scientists: Meredith Keller (the United States of America), Enock Ssekuubwa (Uganda) 24 25 Date of Draft: 27/11/2021 26
ACCEPTED VERSION
SUBJECT TO FIN
AL EDITS
Final Government Distribution Chapter 8 IPCC AR6 WGIII
Do Not Cite, Quote or Distribute 8-2 Total pages: 157
1
Table of Contents 2
Chapter 8: Urban Systems and Other Settlements ......................................................................... 8-1 3
Executive summary ............................................................................................................ 8-4 4
8.1 Introduction ............................................................................................................. 8-8 5
8.1.1 What is new since AR5 .................................................................................... 8-8 6
8.1.2 Preparing for the Special Report on Cities and Climate Change in AR7 ...... 8-10 7
8.1.3 The scope of the chapter: a focus on urban systems ...................................... 8-10 8
8.1.4 The urban century .......................................................................................... 8-11 9
8.1.5 Urbanization in developing countries ............................................................ 8-15 10
8.1.6 Urban carbon footprint ................................................................................... 8-15 11
8.2 Co-Benefits and trade-offs of urban mitigation strategies .................................... 8-18 12
8.2.1 Sustainable development ............................................................................... 8-18 13
8.2.2 Economic development, competitiveness, and equity ................................... 8-23 14
8.2.3 Coupling mitigation and adaptation ............................................................... 8-24 15
Cross-Working Group Box 2: Cities and Climate Change ........................................... 8-25 16
8.3 Urban systems and GHG emissions ...................................................................... 8-30 17
8.3.1 Trends in urban land use and the built environment ...................................... 8-30 18
8.3.2 Informal urban settlements ............................................................................ 8-35 19
8.3.3 Trends in urban GHG emissions .................................................................... 8-36 20
8.3.4 Scenarios of future urbanization and GHG emissions ................................... 8-40 21
8.4 Urban mitigation options ....................................................................................... 8-51 22
8.4.1 Avoiding carbon lock-in ................................................................................ 8-54 23
8.4.2 Spatial planning, urban form, and infrastructure ........................................... 8-54 24
8.4.3 Electrification and switching to net zero emissions resources ....................... 8-58 25
8.4.4 Urban green and blue infrastructure .............................................................. 8-63 26
8.4.5 Socio-behavioural aspects .............................................................................. 8-71 27
8.4.6 Urban-rural linkages ...................................................................................... 8-73 28
8.4.7 Cross-sectoral integration .............................................................................. 8-74 29
8.5 Governance, institutions, and finance ................................................................... 8-76 30
8.5.1 Multi-level governance .................................................................................. 8-76 31
8.5.2 Mitigation potential of urban subnational actors ........................................... 8-78 32
8.5.3 Urban climate networks and transnational governance ................................. 8-79 33
8.5.4 Financing urban mitigation ............................................................................ 8-81 34
8.5.5 Barriers and enablers for implementation ...................................................... 8-83 35
8.6 A roadmap for integrating mitigation strategies for different urbanization typologies36
8-86 37
ACCEPTED VERSION
SUBJECT TO FIN
AL EDITS
Final Government Distribution Chapter 8 IPCC AR6 WGIII
Do Not Cite, Quote or Distribute 8-3 Total pages: 157
8.6.1 Mitigation opportunities for established cities .............................................. 8-89 1
8.6.2 Mitigation opportunities for rapidly growing cities....................................... 8-90 2
8.6.3 Mitigation opportunities for new and emerging cities ................................... 8-91 3
8.5 Knowledge Gaps ................................................................................................... 8-94 4
8.6.4 COVID-19 and cities ..................................................................................... 8-95 5
8.6.5 Future urban emissions scenarios .................................................................. 8-96 6
8.6.6 Urban emissions data ..................................................................................... 8-96 7
Frequently Asked Questions ............................................................................................ 8-97 8
References ........................................................................................................................ 8-99 9
10
11
ACCEPTED VERSION
SUBJECT TO FIN
AL EDITS
Final Government Distribution Chapter 8 IPCC AR6 WGIII
Do Not Cite, Quote or Distribute 8-4 Total pages: 157
Executive summary 1
Although urbanization is a global trend often associated with increased incomes and higher 2
consumption, the growing concentration of people and activities is an opportunity to increase 3
resource efficiency and decarbonize at scale (very high confidence). The same urbanization level can 4
have large variations in per capita urban carbon emissions. For most regions, per capita urban emissions 5
are lower than per capita national emissions. {8.1.4, 8.3.3, 8.4, Box 8.1} 6
7
Most future urban population growth will occur in developing countries, where per capita 8
emissions are currently low but expected to increase with the construction and use of new 9
infrastructure and the built environment, and changes in incomes and lifestyles (very high 10
confidence). The drivers of urban Greenhouse Gas (GHG) emissions are complex and include an 11
interplay of population size, income, state of urbanization, and how cities are laid out. How new cities 12
and towns are designed, constructed, managed, and powered will lock-in behaviour, lifestyles, and 13
future urban GHG emissions. Low-emission urbanization can improve well-being while minimizing 14
impact on GHG emissions, but there is risk that urbanization can lead to increased global GHG 15
emissions through increased emissions outside the city’s boundaries. {8.1.4, 8.3, Box 8.1, 8.4, 8.6} 16
17
The urban share of global GHG emissions (including CO2 and CH4) is substantive and continues 18
to increase (high confidence). Total urban emissions based on consumption-based accounting were 19
estimated to be 24.5 GtCO2-eq, or 62% of the global total in 2015, excluding aviation, shipping and 20
biogenics, and increased to an estimated 28.5 ± 0.1 GtCO2-eq in 2020, representing about 67-72% of 21
global emissions. About 100 of the highest emitting urban areas account for approximately 18% of the 22
global carbon footprint. {8.1.6, 8.3.3} 23
24
The urban share of regional GHG emissions increased between 2000 and 2015, with much inter-25
region variation in the magnitude of the increase (high confidence). Globally, the urban share of 26
national emissions increased 6 percentage points, from 56% in 2000 to 62% in 2015. For 2000 to 2015, 27
the urban emissions share across WGIII AR6 regions increased from 28% to 38% in Africa, from 46% 28
to 54% in Asia and Developing Pacific, from 62% to 72% in Developed Countries, from 57% to 62% 29
in Eastern Europe and West-Central Asia, from 55% to 66% in Latin America and Caribbean, and from 30
68% to 69% in the Middle East. {8.1.6, 8.3.3} 31
32
Per capita urban GHG emissions increased between 2000 and 2015, with cities in the Developed 33
Countries region producing nearly seven times more per capita than the lowest emitting region 34
(medium confidence). From 2000 to 2015, the global urban GHG emissions per capita increased from 35
5.5 to 6.2 tCO2-eq/person (an increase of 11.8%); Africa increased from 1.3 to 1.5 tCO2-eq per person 36
(22.6%); Asia and Developing Pacific increased from 3.0 to 5.1 tCO2-eq per person (71.7%); Eastern 37
Europe and West-Central Asia increased from 6.9 to 9.8 tCO2-eq/person (40.9%); Latin America and 38
the Caribbean increased from 2.7 to 3.7 tCO2-eq/person (40.4%); and Middle East increased from 7.4 39
to 9.6 tCO2-eq/person (30.1%). Albeit starting from the highest level, Developed Countries had a 40
decline of 11.4 to 10.7 tCO2-eq/person (-6.5%). {8.3.3} 41
42
The global share of future urban GHG emissions is expected to increase through 2050 with 43
moderate to no mitigation efforts due to growth trends in population, urban land expansion and 44
infrastructure and service demands, but the extent of the increase depends on the scenario and 45
the scale and timing of urban mitigation action (medium confidence). With aggressive and immediate 46
mitigation policies to limit global warming below 1.5°C by the end of the century, including high levels 47
of electrification, energy and material efficiency, renewable energy preferences, and socio-behavioural 48
responses, urban GHG emissions could approach net zero and reach a maximum of 3 GtCO2-eq in 2050. 49
ACCEPTED VERSION
SUBJECT TO FIN
AL EDITS
Final Government Distribution Chapter 8 IPCC AR6 WGIII
Do Not Cite, Quote or Distribute 8-5 Total pages: 157
Under a scenario with aggressive but not immediate urban mitigation policies to limit global warming 1
to 2°C, urban emissions could reach 17 GtCO2-eq in 2050. With no urban mitigation efforts, urban 2
emissions could more than double from 2020 levels and reach 65 GtCO2-eq in 2050, while being limited 3
to 34 GtCO2-eq in 2050 with only moderate mitigation efforts. {8.3.4} 4
5
Urban land areas could triple between 2015 and 2050, with significant implications for future 6
carbon lock-in. There is a large range in the forecasts of urban land expansion across scenarios and 7
models, which highlights an opportunity to shape future urban development towards low- or net zero 8
GHG emissions and minimize the loss of carbon stocks and sequestration in the AFOLU sector due to 9
urban land conversion (medium confidence). By 2050, urban areas could increase up to 211% over the 10
2015 global urban extent, with the median projected increase ranging from 43% to 106%. While the 11
largest absolute amount of new urban land is forecasted to occur in Asia and Developing Pacific, and 12
in Developed Countries, the highest rate of urban land growth is projected to occur in Africa, Eastern 13
Europe and West-Central Asia, and in the Middle East. The infrastructure that will be constructed 14
concomitant with urban land expansion will lock-in patterns of energy consumption that will persist for 15
decades if not generations. Furthermore, given past trends, the expansion of urban areas is likely to take 16
place on agricultural lands and forests, with implications for the loss of carbon stocks and sequestration. 17
{8.3.1, 8.3.4, 8.4.1, 8.6} 18
19
The construction of new, and upgrading of, existing urban infrastructure through 2030 will result 20
in significant emissions (very high confidence). The construction of new and upgrading of existing 21
urban infrastructure using conventional practices and technologies can result in significant committed 22
CO2 emissions, ranging from 8.5 GtCO2 to 14 GtCO2 annually up to 2030 and more than double annual 23
resource requirements for raw materials to about 90 billion tonnes per year by 2050, up from 40 billion 24
tonnes in 2010 (medium evidence, high agreement).{8.4.1, 8.6} 25
26
Given the dual challenges of rising urban GHG emissions and future projections of more frequent 27
extreme climate events, there is an urgent need to integrate urban mitigation and adaptation 28
strategies for cities to address climate change and withstand its effects (very high confidence). 29
Mitigation strategies can enhance resilience against climate change impacts while contributing to social 30
equity, public health, and human well-being. Urban mitigation actions that facilitate economic 31
decoupling can have positive impacts on employment and local economic competitiveness.{8.2, Cross-32
Working Group Box 2, 8.4} 33
34
Cities can only achieve net zero or near net zero GHG emissions through deep decarbonisation 35
and systemic transformation (very high confidence). Urban deep decarbonisation entails 36
implementing three broad strategies concurrently: (1) reducing urban energy consumption across all 37
sectors, including through compact and efficient urban forms and supporting infrastructure; (2) 38
electrification and switching to net zero emissions resources; and (3) enhancing carbon uptake and 39
stocks (medium evidence, high agreement). Given the regional and global reach of urban supply chains, 40
a city cannot achieve net zero GHG emissions by only focusing on reducing emissions within its 41
administrative boundaries. {8.1.6, 8.3.4, 8.4, 8.6} 42
43
Packages of mitigation policies that implement multiple urban-scale interventions can have 44
cascading effects across sectors, reduce GHG emissions outside of a city’s administrative 45
boundaries, and reduce more emissions than the net sum of individual interventions, particularly 46
if multiple scales of governance are included (high confidence). Cities have the ability to implement 47
policy packages across sectors using an urban systems approach, especially those that affect key 48
infrastructure based on spatial planning, electrification of the urban energy system, and urban green and 49
blue infrastructure. The institutional capacity of cities to develop, coordinate, and integrate sectoral 50
ACCEPTED VERSION
SUBJECT TO FIN
AL EDITS
Final Government Distribution Chapter 8 IPCC AR6 WGIII
Do Not Cite, Quote or Distribute 8-6 Total pages: 157
mitigation strategies within their jurisdiction varies by context, particularly those related to governance, 1
the regulatory system, and budgetary control. {8.4, 8.5, 8.6} 2
3
Integrated spatial planning to achieve compact and resource-efficient urban growth through co-4
location of higher residential and job densities, mixed land use, and transit-oriented development 5
could reduce GHG emissions between 23-26% by 2050 compared to the business-as-usual 6
scenario (robust evidence, high agreement, very high confidence). Compact cities with shortened 7
distances between housing and jobs, and interventions that support a modal shift away from private 8
motor vehicles towards walking, cycling, and low-emissions shared and public transportation, passive 9
energy comfort in buildings, and urban green infrastructure can deliver significant public health benefits 10
and have lower GHG emissions. {8.2, 8.3.4, 8.4, 8.6} 11
12
Urban green and blue infrastructure can mitigate climate change through carbon sequestration, 13
avoided emissions, and reduced energy use while offering multiple co-benefits (robust evidence, 14
high agreement). Urban green and blue infrastructure, including urban forests and street trees, 15
permeable surfaces, and green roofs offer potentials to mitigate climate change directly through 16
sequestering and storing carbon, and indirectly by inducing a cooling effect that reduces energy demand 17
and reducing energy use for water treatment. Global urban trees store approximately 7.4 billion tonnes 18
of carbon, and sequester approximately 217 million tonnes of carbon annually, although urban tree 19
carbon storage and sequestration are highly dependent on biome. Among the multiple co-benefits of 20
green and blue infrastructure are reducing the urban heat island (UHI) effect and heat stress, reducing 21
stormwater runoff, improving air quality, and improving mental and physical health of urban dwellers. 22
{8.2, 8.4.4} 23
24
The potentials and sequencing of mitigation strategies to reduce GHG emissions will vary 25
depending on a city’s land use and spatial form and its state of urbanization, whether it is an 26
established city with existing infrastructure, a rapidly growing city with new infrastructure, or 27
an emerging city with infrastructure build-up (medium confidence). The long lifespan of urban 28
infrastructures locks in behaviour and committed emissions. Urban infrastructures and urban form can 29
enable socio-cultural and lifestyle changes that can significantly reduce carbon footprints. Rapidly 30
growing cities can avoid higher future emissions through urban planning to co-locate jobs and housing 31
to achieve compact urban form, and by leapfrogging to low-carbon technologies. Established cities will 32
achieve the largest GHG emissions savings by replacing, repurposing, or retrofitting the building stock, 33
strategic infilling and densifying, as well as through modal shift and the electrification of the urban 34
energy system. New and emerging cities have unparalleled potential to become low or net zero GHG 35
emissions while achieving high quality of life by creating compact, co-located, and walkable urban 36
areas with mixed land use and transit-oriented design, that also preserve existing green and blue assets 37
{8.2, 8.4, 8.6} 38
39
With over 880 million people living in informal settlements, there are opportunities to harness 40
and enable informal practices and institutions in cities related to housing, waste, energy, water, 41
and sanitation to reduce resource use and mitigate climate change (low evidence, medium 42
agreement). The upgrading of informal settlements and inadequate housing to improve resilience and 43
well-being offers a chance to create a low-carbon transition. However, there is limited quantifiable data 44
on these practices and their cumulative impacts on GHG emissions. {8.1.4, 8.2.2, Cross-Working Group 45
Box 2, 8.3.2, 8.4, 8.6, 8.7} 46
47
Achieving transformational changes in cities for climate change mitigation and adaptation will 48
require engaging multiple scales of governance, including governments and non-state actors, and 49
in connection with substantive financing beyond sectoral approaches (very high confidence). Large 50
ACCEPTED VERSION
SUBJECT TO FIN
AL EDITS
Final Government Distribution Chapter 8 IPCC AR6 WGIII
Do Not Cite, Quote or Distribute 8-7 Total pages: 157
and complex infrastructure projects for urban mitigation are often beyond the capacity of local 1
municipality budgets, jurisdictions, and institutions. Partnerships between cities and international 2
institutions, national and region governments, transnational networks, and local stakeholders play a 3
pivotal role in mobilizing global climate finance resources for a range of infrastructure projects with 4
low-carbon emissions and related spatial planning programs across key sectors. {8.4, 8.5} 5
6
ACCEPTED VERSION
SUBJECT TO FIN
AL EDITS
Final Government Distribution Chapter 8 IPCC AR6 WGIII
Do Not Cite, Quote or Distribute 8-8 Total pages: 157
1
8.1 Introduction 2
8.1.1 What is new since AR5 3
The Fifth Assessment Report (AR5) of the Intergovernmental Panel on Climate Change (IPCC) was 4
the first IPCC report that had a standalone chapter on urban mitigation of climate change. The starting 5
point for that chapter was how the spatial organization of urban settlements affects greenhouse gas 6
(GHG) emissions and how urban form and infrastructure could facilitate mitigation of climate change. 7
A main finding in AR5 was that urban form shapes urban energy consumption and GHG emissions. 8
Since AR5, there has been growing scientific literature and policy foci on urban strategies for climate 9
change mitigation. There are three possible reasons for this. First, according to AR5 Working Group III 10
(WGIII) Chapter 12 on Human Settlements, Infrastructure, and Spatial Planning, urban areas generate 11
between 71–76% of carbon dioxide (CO2) emissions from global final energy use and between 67–76% 12
of global energy (Seto et al. 2014). Thus, focusing on ‘urban systems’ (see Glossary and Figure 8.15) 13
addresses one of the key drivers of emissions. Second, more than half of the world population lives in 14
urban areas, and by mid-century 7 out of 10 people on the planet will live in a town or a city (UN DESA 15
2019). Thus, coming up with mitigation strategies that are relevant to urban settlements is critical for 16
successful mitigation of climate change. Third, beyond climate change, there is growing attention on 17
cities as major catalysts of change and to help achieve the objectives outlined in multiple international 18
frameworks and assessments. 19
Cities are also gaining traction within the work of the IPCC. The IPCC Special Report on Global 20
Warming of 1.5°C (SR1.5 Chapter 4) identified four systems that urgently need to change in 21
fundamental and transformative ways: urban infrastructure, land use and ecosystems, industry, and 22
energy. Urban infrastructure was singled out but urban systems form a pivotal part of the other three 23
systems requiring change (IPCC 2018a) (see ‘infrastructure’ in Glossary). The IPCC Special Report on 24
Climate Change and Land (SRCCL) identified cities not only as spatial units for land-based mitigation 25
options but also places for managing demand for natural resources including food, fibre, and water 26
(IPCC 2019). 27
Other international frameworks are highlighting the importance of cities. For example, the 28
Intergovernmental Science-Policy Platform on Biodiversity and Ecosystem Services (IPBES) report on 29
nature’s contribution to people is clear: cities straddle the biodiversity sphere in the sense that they 30
present spatial units of ecosystem fragmentation and degradation while at the same time contain spatial 31
units where the concentration of biodiversity compares favourably with some landscapes (IPBES 32
2019a). Cities are also featured as a key element in the transformational governance to tackle both 33
climate change and biodiversity and ecosystem challenges in the first-ever IPCC-IPBES co-sponsored 34
workshop report (Pörtner et al. 2021) (see Section 8.5 and ‘governance’ in Glossary). 35
The UN Sustainable Development Goals (SDGs) further underscore the importance of cities in the 36
international arena with the inclusion of SDG 11 on Sustainable Cities and Communities for ‘inclusive, 37
safe, resilient and sustainable’ cities and human settlements (United Nations 2015; Queiroz et al. 2017; 38
United Nations 2019). Additionally, UN-Habitat’s New Urban Agenda (NUA) calls for various 39
measures, including integrated spatial planning at the city-regional scale, to address the systemic 40
challenges included in greening cities, among which is emissions reduction and avoidance (United 41
Nations 2017). 42
Since AR5, there has also been an increase in scientific literature on urban mitigation of climate change, 43
including more diversity of mitigation strategies than were covered during AR5 (Lamb et al. 2018), as 44
well as a growing focus on how strategies at the urban scale can have compounding or additive effects 45
beyond urban areas (e.g., in rural areas, land use planning, and the energy sector). 46
ACCEPTED VERSION
SUBJECT TO FIN
AL EDITS
Final Government Distribution Chapter 8 IPCC AR6 WGIII
Do Not Cite, Quote or Distribute 8-9 Total pages: 157
There is also more literature on using a systems approach to understand the interlinkages between 1
mitigation and adaptation, and situating GHG emissions reduction targets within broader social, 2
economic, and human well-being context and goals (Bai et al. 2018; Ürge-Vorsatz et al. 2018; Lin et 3
al. 2021). In particular, the nexus approach, such as the water and energy nexus and the water-energy-4
food nexus, is increasingly being used to understand potential emissions and energy savings from cross-5
sectoral linkages that occur in cities (Wang and Chen 2016; Engström et al. 2017; Valek et al. 2017). 6
There is also a growing literature that aims to quantify transboundary urban GHG emissions and carbon 7
footprint beyond urban and national administrative boundaries (Chen et al. 2016; Hu et al. 2016). Such 8
a scope provides a more complete understanding of how local urban emissions or local mitigation 9
strategies can have effects on regions’ carbon footprint or GHG emissions. 10
City Climate Action 11
Moreover, cities around the world are putting increasing focus on tackling climate change. Since AR5: 12
● Climate leadership at the local scale is growing with commitment from city decision-makers 13
and policymakers to implement local-scale mitigation strategies (GCoM 2018, 2019; ICLEI 14
2019a; C40 Cities 2020a). 15
● More than 360 cities announced at the Paris Climate Conference that the collective impact of 16
their commitments will lead to reducing up to 3.7 GtCO2-eq (CO2-equivalent) of urban 17
emissions annually by 2030 (Cities for Climate 2015). 18
● The Global Covenant of Mayors (GCoM), a transnational network comprised of more than 19
10,000 cities, have made commitments to reduce urban GHG emissions up to 1.4–2.3 GtCO2-20
eq annually by 2030 and 2.8–4.2 GtCO2-eq annually by 2050, compared to business-as-usual 21
(GCoM 2018, 2019). 22
● More than 800 cities have made commitments to achieve net zero GHG emissions (see 23
Glossary), either economy-wide or in a particular sector (NewClimate Institute and Data-24
Driven EnviroLab 2020). 25
Although most cities and other subnational actors (see Glossary) are yet to meet their net zero GHG or 26
CO2 emissions commitments, the growing numbers of those commitments, alongside organizations 27
enabled to facilitate reaching those targets, underscore the growing support for climate action by city 28
and other subnational leaders. 29
Historical and future urban emissions 30
One major innovation in this assessment report is the inclusion of historical and future urban GHG 31
emissions. Urban emissions based on consumption-based accounting by regions has been put forth for 32
the timeframe 1990–2100 using multiple datasets with projections given in the framework of the Shared 33
Socioeconomic Pathway (SSP) - Representative Concentration Pathway (RCP) scenarios. This advance 34
has provided a time dimension to urban footprints considering different climate scenarios with 35
implications for urban mitigation, allowing a comparison of the way urban emissions and their reduction 36
can evolve given different scenario contexts (see Glossary for definitions of various ‘pathways’ and 37
‘scenarios’ in the context of climate change mitigation, including ‘SSPs’ and ‘RCPs’). 38
Sustainable development linkages and feasibility assessment 39
Special emphasis is placed on the co-benefits of urban mitigation options, including an evaluation of 40
linkages with the SDGs based on synergies and/or trade-offs. Urban mitigation options are further 41
evaluated based on multiple dimensions according to the feasibility assessment (see Section 8.5.5, 42
Figure 8.19, and SM 8.2) indicating the enablers and barriers of implementation. These advances 43
provide additional guidance for urban mitigation. 44
ACCEPTED VERSION
SUBJECT TO FIN
AL EDITS
Final Government Distribution Chapter 8 IPCC AR6 WGIII
Do Not Cite, Quote or Distribute 8-10 Total pages: 157
1
8.1.2 Preparing for the Special Report on Cities and Climate Change in AR7 2
At the 43rd Session of the IPCC in 2016, the IPCC approved a Special Report on Climate Change and 3
Cities during the Seventh Assessment Cycle of the IPCC (AR7). To stimulate scientific research 4
knowledge exchange, the IPCC and nine global partners co-sponsored the IPCC Cities and Climate 5
Change Science Conference, which brought together over 700 researchers, policymakers, and 6
practitioners from 80 countries. 7
The conference identified key research priorities including the need for an overarching systems 8
approach to understanding how sectors interact in cities as drivers for GHG emissions and the 9
relationship between climate and other urban processes, as well as achieving transformation towards 10
low-carbon and resilient futures (Bai et al. 2018). The subsequent report on global research and action 11
agenda identifies scale, informality, green and blue infrastructure, governance and transformation, as 12
well as financing climate action, as areas for scientific research during the AR6 cycle and beyond 13
(WCRP 2019). 14
8.1.3 The scope of the chapter: a focus on urban systems 15
This chapter takes an urban systems approach and covers the full range of urban settlements, including 16
towns, cities, and metropolitan areas. By ‘urban system’ (see Figure 8.15), this chapter refers to two 17
related concepts. First, an urban systems approach recognizes that cities do not function in isolation. 18
Rather, cities exhibit strong interdependencies across scales, whether it is within a region, a country, a 19
continent, or worldwide. Cities are embedded in broader ecological, economic, technical, institutional, 20
legal, and governance structures that often constrain their systemic function, which cannot be separated 21
from wider power relations (Bai et al. 2016). 22
The notion of a system of cities has been around for nearly 100 years and recognizes that cities are 23
interdependent, in that significant changes in one city, such as economic activities, income, or 24
population, will affect other cities in the system (Christaller 1933; Berry 1964; Marshall 1989). This 25
perspective of an urban system emphasizes the connections between a city and other cities, as well as 26
between a city and its hinterlands (Hall and Hay 1980; Ramaswami et al. 2017b; Xu et al. 2018c). An 27
important point is that growth in one city affects growth in other cities in the global, national or regional 28
system of cities (Gabaix 1999; Scholvin et al. 2019; Knoll 2021). 29
Moreover, there is a hierarchy of cities (Taylor 1997; Liu et al. 2014), with very large cities at the top 30
of the hierarchy concentrating political power and financial resources, but of which there are very few. 31
Rather, the urban system is dominated by small- and medium-sized cities and towns. With globalization 32
and increased interconnectedness of financial flows, labour, and supply chains, cities across the world 33
today have long-distance relationships on multiple dimensions but are also connected to their 34
hinterlands for resources. 35
The second key component of the urban systems lens identifies the activities and sectors within a city 36
as being inter-connected—that cities are ecosystems (Rees 1997; Grimm et al. 2000; Newman and 37
Jennings 2008; Acuto et al. 2019; Abdullah and Garcia-Chueca 2020; Acuto and Leffel 2021). This 38
urban systems perspective emphasizes linkages and interrelations within cities. The most evident 39
example of this is urban form and infrastructure, which refer to the patterns and spatial arrangements of 40
land use, transportation systems, and urban design. Changes in urban form and infrastructure can 41
simultaneously affect multiple sectors, such as buildings, energy, and transport. 42
This chapter assesses urban systems beyond simply jurisdictional boundaries. Using an urban systems 43
lens has the potential to accelerate mitigation beyond a single sector or purely jurisdictional approach 44
(see Section 8.4). An urban systems perspective presents both challenges and opportunities for urban 45
mitigation strategies. It shows that any mitigation option potentially has positive or negative 46
ACCEPTED VERSION
SUBJECT TO FIN
AL EDITS
Final Government Distribution Chapter 8 IPCC AR6 WGIII
Do Not Cite, Quote or Distribute 8-11 Total pages: 157
consequences in other sectors, other settlements, cities, or other parts of the world, and requires more 1
careful and comprehensive considerations on the broader impacts, including equity and social justice 2
(see Glossary for a comprehensive definition of ‘equity’ in the context of mitigation and adaption). This 3
chapter focuses on cities, city regions, metropolitan regions, megalopitans, mega-urban regions, towns, 4
and other types of urban configurations because they are the primary sources of urban GHG emissions 5
and tend to be where mitigation action can be most impactful. 6
There is no internationally agreed upon definition of urban, urban population, or urban area. Countries 7
develop their own definitions of urban, often based on a combination of population size or density, and 8
other criteria including the percentage of population not employed in agriculture, the availability of 9
electricity, piped water, or other infrastructures, and characteristics of the built environment, such as 10
dwellings and built structures. This chapter assesses urban systems, which includes cities and towns. It 11
uses a similar framework as Chapter 6 of AR6 IPCC WGII, referring to cities and urban settlements as 12
‘concentrated human habitation centres that exist along a continuum’ (Dodman et al. 2022) (for further 13
definitions of ‘urban,’ ‘cities,’ ‘settlements,’ and related terms, see Glossary, and WGII Chapter 6). 14
15
8.1.4 The urban century 16
The 21st century will be the urban century, defined by a massive increase in global urban populations 17
and a significant building up of new urban infrastructure stock to accommodate the growing urban 18
population. Six trends in urbanization are especially important in the context of climate change 19
mitigation. 20
First, the size and relative proportion of the urban population is unprecedented and continues to increase. 21
As of 2018, approximately 55% of the global population lives in urban areas (about 4.3 billion people) 22
(UN DESA 2019). It is predicted that 68% of the world population will live in urban areas by 2050. 23
This will mean adding 2.5 billion people to urban areas between 2018 and 2050, with 90% of this 24
increase taking place in Africa and Asia. There is a strong correlation between the level of urbanization 25
and the level of national income, with considerable variation and complexity in the relationship between 26
the two (UN DESA 2019). In general, countries with levels of urbanization of 75% or greater all have 27
high national incomes, whereas countries with low levels of urbanization under 35% have low national 28
incomes (UN DESA 2019). In general, there is a clear positive correlation between the level of 29
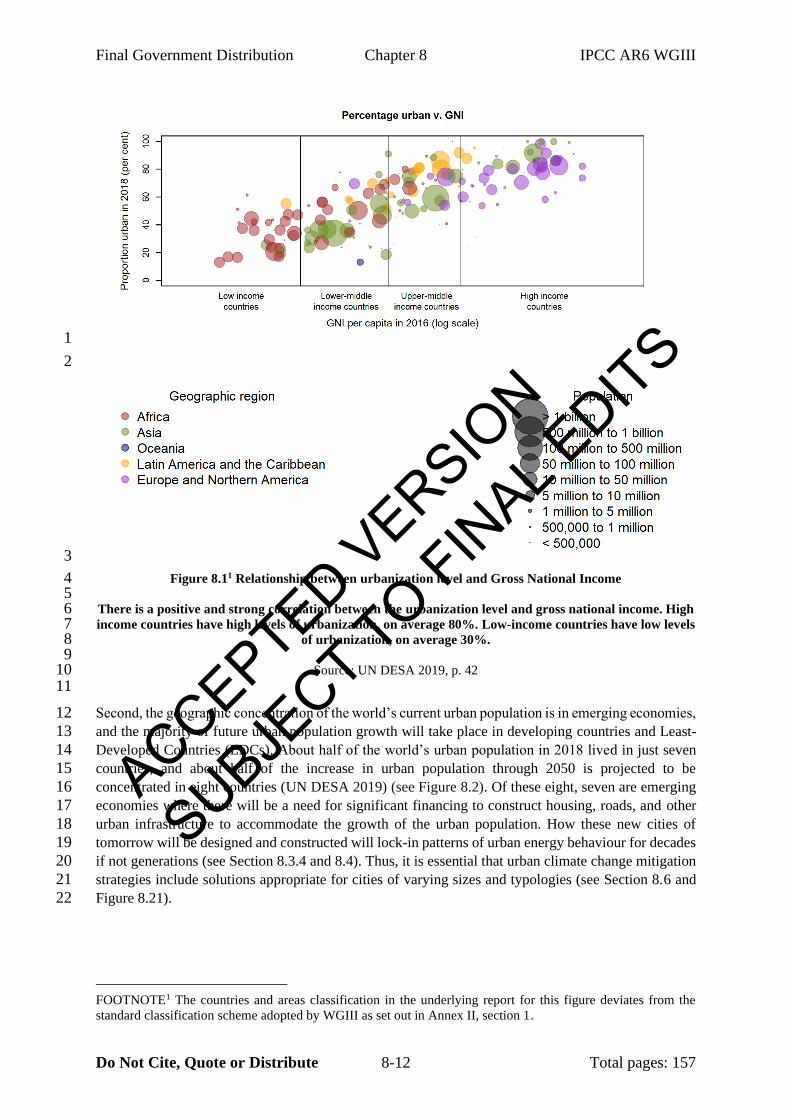
urbanization and income levels (see Figure 8.1, also Box 8.1). 30
31
32
33 ACCEPTED VERSION
SUBJECT TO FIN
AL EDITS
Final Government Distribution Chapter 8 IPCC AR6 WGIII
Do Not Cite, Quote or Distribute 8-12 Total pages: 157
1
2
3
Figure 8.11 Relationship between urbanization level and Gross National Income 4 5
There is a positive and strong correlation between the urbanization level and gross national income. High 6 income countries have high levels of urbanization, on average 80%. Low-income countries have low levels 7
of urbanization, on average 30%. 8 9
Source: UN DESA 2019, p. 42 10 11
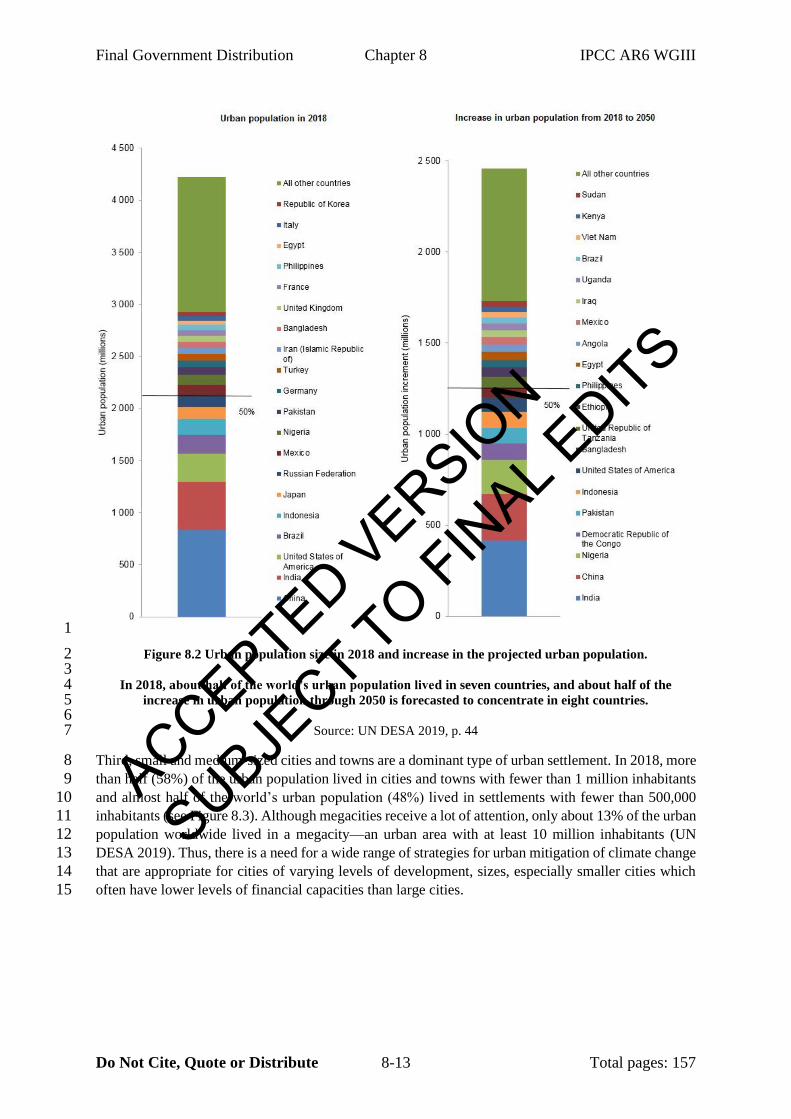
Second, the geographic concentration of the world’s current urban population is in emerging economies, 12
and the majority of future urban population growth will take place in developing countries and Least-13
Developed Countries (LDCs). About half of the world’s urban population in 2018 lived in just seven 14
countries, and about half of the increase in urban population through 2050 is projected to be 15
concentrated in eight countries (UN DESA 2019) (see Figure 8.2). Of these eight, seven are emerging 16
economies where there will be a need for significant financing to construct housing, roads, and other 17
urban infrastructure to accommodate the growth of the urban population. How these new cities of 18
tomorrow will be designed and constructed will lock-in patterns of urban energy behaviour for decades 19
if not generations (see Section 8.3.4 and 8.4). Thus, it is essential that urban climate change mitigation 20
strategies include solutions appropriate for cities of varying sizes and typologies (see Section 8.6 and 21
Figure 8.21). 22
FOOTNOTE1 The countries and areas classification in the underlying report for this figure deviates from the
standard classification scheme adopted by WGIII as set out in Annex II, section 1.
ACCEPTED VERSION
SUBJECT TO FIN
AL EDITS
Final Government Distribution Chapter 8 IPCC AR6 WGIII
Do Not Cite, Quote or Distribute 8-13 Total pages: 157
1
Figure 8.2 Urban population size in 2018 and increase in the projected urban population. 2 3
In 2018, about half of the world’s urban population lived in seven countries, and about half of the 4 increase in urban population through 2050 is forecasted to concentrate in eight countries. 5
6 Source: UN DESA 2019, p. 44 7
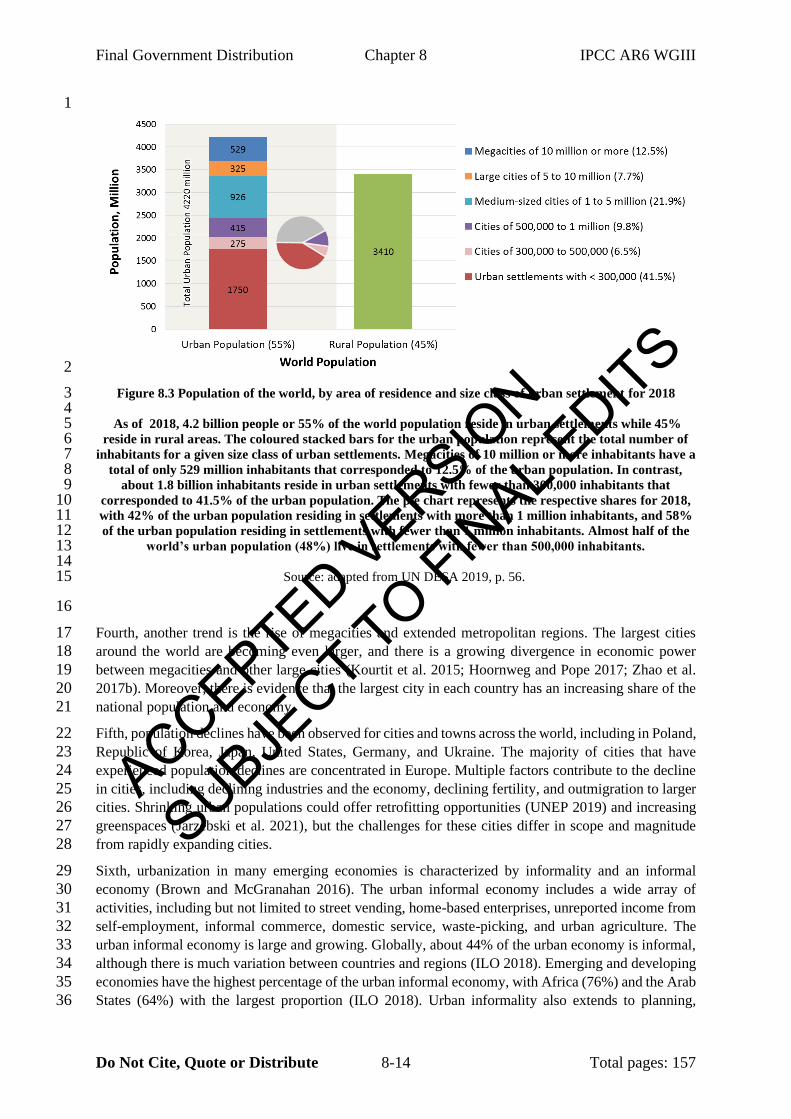
Third, small and medium-sized cities and towns are a dominant type of urban settlement. In 2018, more 8
than half (58%) of the urban population lived in cities and towns with fewer than 1 million inhabitants 9
and almost half of the world’s urban population (48%) lived in settlements with fewer than 500,000 10
inhabitants (see Figure 8.3). Although megacities receive a lot of attention, only about 13% of the urban 11
population worldwide lived in a megacity—an urban area with at least 10 million inhabitants (UN 12
DESA 2019). Thus, there is a need for a wide range of strategies for urban mitigation of climate change 13
that are appropriate for cities of varying levels of development, sizes, especially smaller cities which 14
often have lower levels of financial capacities than large cities. 15
ACCEPTED VERSION
SUBJECT TO FIN
AL EDITS
Final Government Distribution Chapter 8 IPCC AR6 WGIII
Do Not Cite, Quote or Distribute 8-14 Total pages: 157
1
2
Figure 8.3 Population of the world, by area of residence and size class of urban settlement for 2018 3 4
As of 2018, 4.2 billion people or 55% of the world population reside in urban settlements while 45% 5 reside in rural areas. The coloured stacked bars for the urban population represent the total number of 6
inhabitants for a given size class of urban settlements. Megacities of 10 million or more inhabitants have a 7 total of only 529 million inhabitants that corresponded to 12.5% of the urban population. In contrast, 8
about 1.8 billion inhabitants reside in urban settlements with fewer than 300,000 inhabitants that 9 corresponded to 41.5% of the urban population. The pie chart represents the respective shares for 2018, 10 with 42% of the urban population residing in settlements with more than 1 million inhabitants, and 58% 11 of the urban population residing in settlements with fewer than 1 million inhabitants. Almost half of the 12
world’s urban population (48%) live in settlements with fewer than 500,000 inhabitants. 13 14
Source: adapted from UN DESA 2019, p. 56. 15
16
Fourth, another trend is the rise of megacities and extended metropolitan regions. The largest cities 17
around the world are becoming even larger, and there is a growing divergence in economic power 18
between megacities and other large cities (Kourtit et al. 2015; Hoornweg and Pope 2017; Zhao et al. 19
2017b). Moreover, there is evidence that the largest city in each country has an increasing share of the 20
national population and economy. 21
Fifth, population declines have been observed for cities and towns across the world, including in Poland, 22
Republic of Korea, Japan, United States, Germany, and Ukraine. The majority of cities that have 23
experienced population declines are concentrated in Europe. Multiple factors contribute to the decline 24
in cities, including declining industries and the economy, declining fertility, and outmigration to larger 25
cities. Shrinking urban populations could offer retrofitting opportunities (UNEP 2019) and increasing 26
greenspaces (Jarzebski et al. 2021), but the challenges for these cities differ in scope and magnitude 27
from rapidly expanding cities. 28
Sixth, urbanization in many emerging economies is characterized by informality and an informal 29
economy (Brown and McGranahan 2016). The urban informal economy includes a wide array of 30
activities, including but not limited to street vending, home-based enterprises, unreported income from 31
self-employment, informal commerce, domestic service, waste-picking, and urban agriculture. The 32
urban informal economy is large and growing. Globally, about 44% of the urban economy is informal, 33
although there is much variation between countries and regions (ILO 2018). Emerging and developing 34
economies have the highest percentage of the urban informal economy, with Africa (76%) and the Arab 35
States (64%) with the largest proportion (ILO 2018). Urban informality also extends to planning, 36
ACCEPTED VERSION
SUBJECT TO FIN
AL EDITS
Final Government Distribution Chapter 8 IPCC AR6 WGIII
Do Not Cite, Quote or Distribute 8-15 Total pages: 157
governance and institutions (Roy 2009; EU 2016; Lamson-Hall et al. 2019). Given its prevalence, it is 1
important for urban climate change mitigation strategies to account for informality, especially in 2
emerging and developing countries (see Section 8.3.2). 3
4
8.1.5 Urbanization in developing countries 5
Urbanization in the 21st century will be dominated by population and infrastructure growth in 6
developing countries, and as such it is important to highlight three aspects that are unique and especially 7
relevant for climate change mitigation. First, urbanization will increase in speed and magnitude. Given 8
their significant impact on emissions, mitigation action in Asian cities, especially the large and rapidly 9
growing cities, will have significant implications on global ambitions (see Section 8.3.4). 10
Second, a number of cities in developing countries lack institutional, financial and technical capacities 11
to enable local climate change action (Sharifi et al. 2017; Fuhr et al. 2018). While these capacities differ 12
across contexts (Hickmann et al. 2017), several governance challenges are similar across cities 13
(Gouldson et al. 2015). These factors also influence the ability of cities to innovate and effectively 14
implement mitigation action (Nagendra et al. 2018) (see Chapter 17). 15
Third, there are sizable economic benefits in developing country cities that can provide an opportunity 16
to enhance political momentum and institutions (Colenbrander et al. 2016). The co-benefits approach 17
(see Section 8.2), which frames climate objectives alongside other development benefits, is increasingly 18
seen as an important concept justifying and driving climate change action in developing countries (Sethi 19
and Puppim de Oliveira 2018). 20
Large-scale system transformations are also deeply influenced by factors outside governance and 21
institutions such as private interests and power dynamics (Jaglin 2014; Tyfield 2014). In some cases, 22
these private interests are tied up with international flows of capital. In India, adaptation plans involving 23
networks of private actors and related mitigation actions have resulted in the dominance of private 24
interests. This has led to trade-offs and adverse impacts on the poor (Chu 2016; Mehta et al. 2019). 25
When planning and implementing low-carbon transitions, it is important to consider the socio-economic 26
context. An inclusive approach emphasizes the need to engage non-state actors, including businesses, 27
research organizations, non-profit organizations and citizens (Lee and Painter 2015; Hale et al. 2020). 28
For example, engaging people in defining locally relevant mitigation targets and actions has enabled 29
successful transformations in China (Engels 2018), Africa (Göpfert et al. 2019) and Malaysia (Ho et al. 30
2015). An active research and government collaboration through multiple stakeholder interactions in a 31
large economic corridor in Malaysia led to the development and implementation of a low-carbon 32
blueprint for the region (Ho et al. 2013). Many cities in LDCs and developing countries lack adequate 33
urban infrastructure and housing. An equitable transformation in these cities entails prioritizing energy 34
access and basic services including safe drinking water and sanitation, to meet basic needs of their 35
populations. 36
37
8.1.6 Urban carbon footprint 38
Urban areas concentrate GHG fluxes because of the size of the urban population, the size and nature of 39
the urban economy, the energy and GHGs embodied in the infrastructure (see Glossary for a definition 40
of ‘embodied emissions’), and the goods and services imported and exported to and from cities 41
(USGCRP 2018). 42
8.1.6.1 Urban carbon cycle 43
In cities, carbon cycles through natural (e.g., vegetation and soils) and managed (e.g., reservoirs and 44
anthropogenic—buildings, transportation) pools. The accumulation of carbon in urban pools, such as 45
ACCEPTED VERSION
SUBJECT TO FIN
AL EDITS
Final Government Distribution Chapter 8 IPCC AR6 WGIII
Do Not Cite, Quote or Distribute 8-16 Total pages: 157
buildings or landfills, results from the local or global transfer of carbon-containing energy and raw 1
materials used in the city (Churkina 2008; Pichler et al. 2017; Chen et al. 2020b). Quantitative 2
understanding of these transfers and the resulting emissions and uptake with an urban area is essential 3
for accurate urban carbon accounting (USGCRP 2018). Currently, urban areas are a net source of carbon 4
because they emit more carbon than they uptake. Thus, urban mitigation strategies require a twofold 5
strategy: reducing urban emissions of carbon into the atmosphere, and enhancing uptake of carbon in 6
urban pools (Churkina 2012) (for a broader definition of ‘carbon cycle’ and related terms such as 7
‘carbon sink,’ carbon stock,’ ‘carbon neutrality,’ ‘GHG neutrality,’ and others, see Glossary). 8
Burning fossil fuels to generate energy for buildings, transportation, industry, and other sectors is a 9
major source of urban GHG emissions (Gurney et al. 2015). At the same time, most cities do not 10
generate within their boundaries all of the resources they use, such as electricity, gasoline, cement, 11
water, and food needed for local homes and businesses to function (Jacobs 1969), requiring 12
consideration of GHG emissions embodied in supply chains serving cities. Furthermore, urban 13
vegetation, soils, and aquatic systems can both emit or remove carbon from the urban atmosphere and 14
are often heavily managed. For example, urban parks, forests, and street trees actively remove carbon 15
from the atmosphere through growing season photosynthesis. They can become a net source of carbon 16
most often during the dormant season or heat waves. Some of the sequestered carbon can be stored in 17
the biomass of urban trees, soils, and aquatic systems. Urban infrastructures containing cement also 18
uptake carbon through the process of carbonation. The uptake of carbon by urban trees is at least two 19
orders of magnitude faster than by cement-containing infrastructures (Churkina 2012) (see Section 20
8.4.4, and Figures 8.17 and 8.18). 21
8.1.6.2 Urban emissions accounting 22
Urban GHG emissions accounting can determine critical conceptual and quantitative aspects of urban 23
GHG emissions. The accounting framework chosen can therefore predetermine the emissions 24
responsibility, the mitigation options available, and the level of effort required to correctly account for 25
emissions (Afionis et al. 2017). 26
Two main urban carbon accounting advances have occurred since AR5. The first includes efforts to 27
better understand and clarify how the different urban GHG accounting frameworks that have emerged 28
over the past 15 years are inter-related, require different methodological tools, and reflect differing 29
perspectives on emissions responsibility and quantification effort. The second main advance lies in a 30
series of methodological innovations facilitating practical implementation, emissions verification, and 31
scaling-up of the different GHG accounting approaches. This section provides an overview of the most 32
used GHG urban accounting frameworks followed by a review of the advances since AR5. 33
Numerous studies have reviewed urban GHG accounting frameworks and methods with somewhat 34
different nomenclatures and categorical divisions (Lin et al. 2015; Lombardi et al. 2017; Chen et al. 35
2019b; Arioli et al. 2020; Heinonen et al. 2020; Hachaichi and Baouni 2021; Ramaswami et al. 2021). 36
Furthermore, accounting frameworks are reflected in multiple protocols used by urban practitioners 37
(BSI 2013; Fong et al. 2014; ICLEI 2019b). Synthesis of these reviews and protocols, as well as the 38
many individual methodological studies available, point to four general frameworks of urban GHG 39
accounting: (1) territorial accounting (TA); (2) communitywide infrastructure supply chain foot-40
printing (CIF); and (3 and 4) consumption-based carbon footprint accounting (CBCF) (Wiedmann and 41
Minx 2008). The last, CBCF, can be further divided into accounting with a focus on household or 42
personal consumption—(3) the personal carbon footprint (PCF)—and an approach in which one 43
includes final consumption in an area by all consumers—(4) the areal carbon footprint (ACF) (Heinonen 44
et al. 2020). A number of small variations to these general categories are found in the literature (Lin et 45
al. 2015; Chen et al. 2020a), but these four general frameworks capture the important distinctive (i.e., 46
policy-relevant) features of urban GHG accounting. 47
ACCEPTED VERSION
SUBJECT TO FIN
AL EDITS
Final Government Distribution Chapter 8 IPCC AR6 WGIII
Do Not Cite, Quote or Distribute 8-17 Total pages: 157
All these approaches are foundationally rooted in the concept of urban metabolism that is, the tracking 1
of material and energy flows into, within, and out of cities (Wolman 1965). These frameworks all aim 2
to quantify urban GHG emissions but reflect different perspectives on where the emission responsibility 3
is allocated in addition to how much and which components of the GHG emissions associated with the 4
import and export of good and services to and from a city (‘transboundary embedded/embodied GHG 5
emissions’) are included in a given urban emissions account. The four frameworks share some common, 6
overlapping GHG emission quantities and their inter-relationships have been defined mathematically 7
(Chavez and Ramaswami 2013). 8
A key advance since AR5 lies in understanding the different GHG accounting frameworks in terms of 9
what they imply for responsibility—shared or otherwise—and what they imply for the depth and 10
breadth of GHG emission reductions. TA focuses on in-city direct emission of GHGs to the atmosphere 11
(e.g., combustion, net ecosystem exchange, methane – CH4 – leakage) within a chosen geographic area 12
(Sovacool and Brown 2010; Gurney et al. 2019). CIF connects essential infrastructure use and demand 13
activities in cities with their production, by combining TA emissions with the transboundary supply 14
chain emissions associated with imported electricity, fuels, food, water, building materials, and waste 15
management services used in cities (Ramaswami et al. 2008; Kennedy et al. 2009; Chavez and 16
Ramaswami 2013). 17
CBCF considers not only the supply-chain-related GHG emissions of key infrastructure, but also 18
emissions associated with all goods and services across a city, often removing emissions associated 19
with goods and services exported from a city (Wiedmann et al. 2016, 2021). The distinction between 20
the PCF and ACF variants of the CBCF are primarily associated with whether the agents responsible 21
for the final demand are confined to only city residents (PCF) or all consumers in a city (ACF), which 22
can include government consumers, capital formation, and other final demand categories (Heinonen et 23
al. 2020). 24
A recent synthesis of these frameworks in the context of a net zero GHG emissions target suggests that 25
the four frameworks contribute to different aspects of decarbonization policy and can work together to 26
inform the overall process of decarbonization (Ramaswami et al. 2021). Furthermore, the relative 27
magnitude of GHG emissions for a given city resulting from the different frameworks is often a 28
reflection of the city’s economic structure as a ‘consumer-’ or producer city’ (Chavez and Ramaswami 29
2013; Sudmant et al. 2018). 30
The TA framework is unique in that it can be independently verified through direct measurement of 31
GHGs in the atmosphere, offering a check on the integrity of emission estimates (Lauvaux et al. 2020; 32
Mueller et al. 2021). It is traditionally simpler to estimate by urban practitioners given the lower data 33
requirements, and it can be relevant to policies aimed specifically at energy consumption and mobility 34
activities within city boundaries. However, it will not reflect electricity imported for use in cities or 35
lifecycle emissions associated with in-city consumption of goods and services. 36
The CIF framework adds to the TA framework by including GHG emissions associated with electricity 37
imports and the lifecycle GHG emissions associated with key infrastructure provisioning activities in 38
cities, serving all homes, businesses, and industries. This widens both the number of emitting categories 39
and the responsibility for those emissions by including infrastructure-related supply chain emissions. 40
The CIF framework enables individual cities to connect communitywide demand for infrastructure 41
and food with their transboundary production, strategically aligning their net zero emissions plans with 42
larger-scale net zero efforts (Ramaswami and Chavez 2013; Ramaswami et al. 2021; Seto et al. 2021). 43
The PCF version of the CBCF shifts the focus of the consumption and associated supply chain emissions 44
to only household consumption of goods and services (Jones and Kammen 2014). This both reduces 45
the TA emissions considered and the supply chain emissions, excluding all emissions associated with 46
government, capital formation, and exports. The ACF, by contrast, widens the perspective considerably, 47
ACCEPTED VERSION
SUBJECT TO FIN
AL EDITS
Final Government Distribution Chapter 8 IPCC AR6 WGIII
Do Not Cite, Quote or Distribute 8-18 Total pages: 157
including the TA and supply chain emissions of all consumers in a city, but often removing emissions 1
associated with exports. 2
An additional distinction is the ability to sum up accounts from individual cities in a region or country, 3
for example, directly to arrive at a regional or national total. This can only be done for the TA and PCF 4
frameworks. The ACF and CIF frameworks would require adjustment to avoid double-counting 5
emissions (Chen et al. 2020a). 6
A second major area of advance since AR5 has been in methods to implement, verify and scale up the 7
different GHG foot-printing approaches. Advances have been made in six key areas: (1) advancing 8
urban metabolism accounts integrating stocks and flows, and considering biogenic and fossil-fuel-based 9
emissions (Chen et al. 2020b); (2) improving fine-scale and near-real-time urban use-activity data 10
through new urban data science (Gately et al. 2017; Gurney et al. 2019; Turner et al. 2020; Yadav et al. 11
2021); (3) using atmospheric monitoring from the ground, aircraft, and satellites combined with inverse 12
modelling to independently quantify TA emissions (Lamb et al. 2016; Lauvaux et al. 2016, 2020; Davis 13
et al. 2017; Mitchell et al. 2018; Sargent et al. 2018; Turnbull et al. 2019; Wu et al. 2020a); (4) 14
improving supply chain and input-output modelling, including the use of physically based input-output 15
models (Wachs and Singh 2018); (5) establishing the global multi-region input-output models (Lenzen 16
et al. 2017; Wiedmann et al. 2021); and (6) generating multi-sector use and supply activity data across 17
all cities in a nation, in a manner where data aggregate consistently across city, province, and national 18
scales (Tong et al. 2021) (see Section 8.3). 19
20
8.2 Co-Benefits and trade-offs of urban mitigation strategies 21
Co-benefits are ‘the positive effects that a policy or measure aimed at one objective might have on other 22
objectives, thereby increasing the total benefits to the society or environment’ (Matthews et al. 2018). 23
AR5 WGIII Chapter 12 reported a range of co-benefits associated with urban climate change mitigation 24
strategies, including public savings, air quality and associated health benefits, and productivity 25
increases in urban centres (Seto et al. 2014). Since AR5, evidence continues to mount on the co-benefits 26
of urban mitigation. Highlighting co-benefits could make a strong case for driving impactful mitigation 27
action (Bain et al. 2016), especially in developing countries, where development benefits can be the 28
argument for faster implementation (Sethi and Puppim de Oliveira 2018). Through co-benefits, urban 29
areas can couple mitigation, adaptation, and sustainable development while closing infrastructure gaps 30
(Thacker et al. 2019; Kamiya et al. 2020). 31
The urgency of coupling mitigation and adaptation is emphasized through a special Cross-Working 32
Group Box on ‘Cities and Climate Change’ (see Section 8.2.3 and Cross-Working Group Box 2). This 33
section further addresses synergies and trade-offs for sustainable development with a focus on linkages 34
with the SDGs and perspectives for economic development, competitiveness, and equity. 35
8.2.1 Sustainable development 36
Sustainable development is a wide concept, encompassing socioeconomic and environmental 37
dimensions, envisaging long-term permanence and improvement. Whilst long-term effects are more 38
related to resilience—and hence carry co-benefits and synergies with the mitigation of GHG 39
emissions—some short-term milestones were defined by the post-2015 UN Sustainable Development 40
Agenda SDGs, including a specific goal on climate change (SDG 13) and one on making cities 41
inclusive, safe, resilient and sustainable (SDG 11) (United Nations 2015). The SDGs and related 42
indicators can be an opportunity to improve cities by using science-based decision-making and 43
engaging a diverse set of stakeholders (Simon et al. 2016; Klopp and Petretta 2017; Kutty et al. 2020). 44
ACCEPTED VERSION
SUBJECT TO FIN
AL EDITS
Final Government Distribution Chapter 8 IPCC AR6 WGIII
Do Not Cite, Quote or Distribute 8-19 Total pages: 157
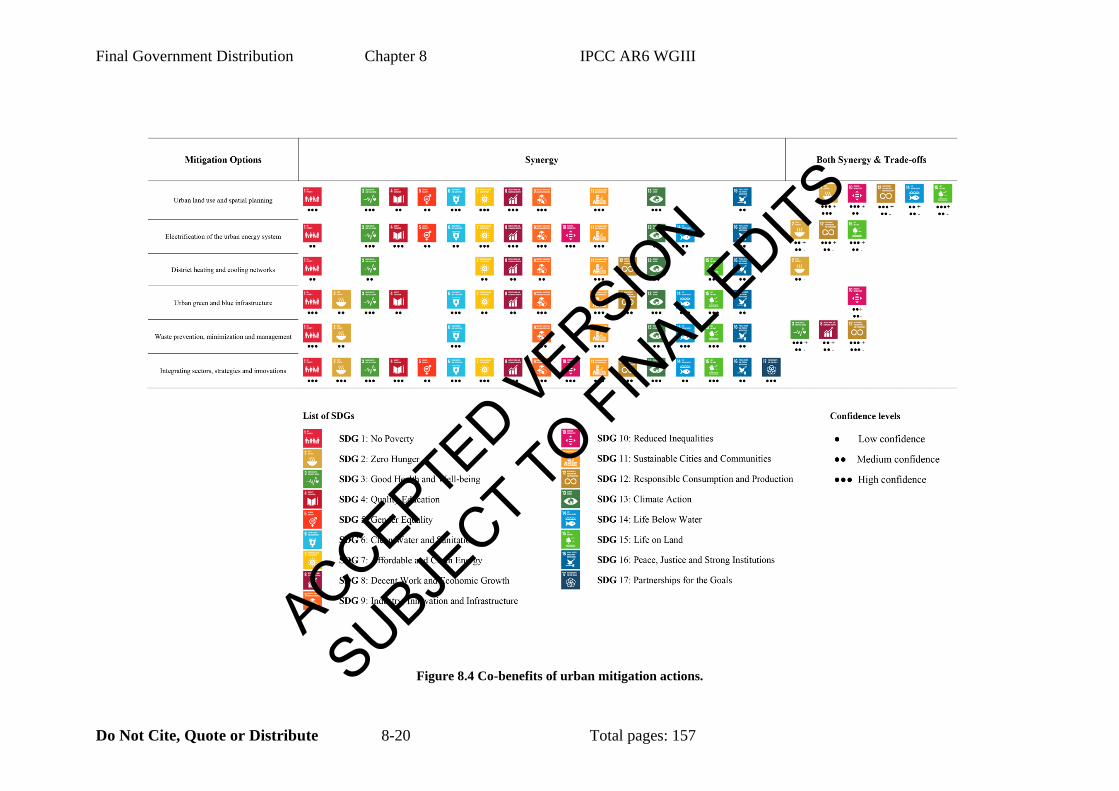
There are multiple ways that development pathways can be shifted towards sustainability (see Section 1
4.3.3, Cross-Chapter Box 5 in Chapter 4, Chapter 17, and Figure 17.1). Urban areas can work to redirect 2
development pathways towards sustainability while increasing co-benefits for urban inhabitants. Figure 3
8.4 indicates that mitigation options for urban systems can provide synergistic linkages across a wide 4
range of SDGs, and some cases where linkages can produce both synergies and trade-offs. While 5
linkages are based on context and the scale of implementation, synergies can be most significant when 6
urban areas pursue integrated approaches where one mitigation option supports the other (see also 7
Sections 8.4 and 8.6). 8
ACCEPTED VERSION
SUBJECT TO FIN
AL EDITS
Final Government Distribution Chapter 8 IPCC AR6 WGIII
Do Not Cite, Quote or Distribute 8-20 Total pages: 157
Figure 8.4 Co-benefits of urban mitigation actions.
ACCEPTED VERSION
SUBJECT TO FIN
AL EDITS
Final Government Distribution Chapter 8 IPCC AR6 WGIII
Do Not Cite, Quote or Distribute 8-21 Total pages: 157
The first column lists urban mitigation options. The second column indicates synergies with the SDGs. The third column indicates both synergies and/or trade-offs.
The dots represent confidence levels with the number of dots representing levels from low to high. In the last column, confidence levels for synergies and/or trade-
offs are provided separately. A plus sign (+) represents synergy and a minus sign (-) represents a trade-off. Supplementary Material SM8.1 provides 64 references
and extends the SDG mappings that are provided in Thacker et al. (2019) and Fuso Nerini et al. (2018). Please see Supplementary Material Table 17.1 for details
and Annex II for the methodology of the SDG assessment.
ACCEPTED VERSION
SUBJECT TO FIN
AL EDITS
Final Government Distribution Chapter 8 IPCC AR6 WGIII
Do Not Cite, Quote or Distribute 8-22 Total pages: 157
1
2
Figure 8.4 summarizes an evaluation of the synergies and/or trade-offs with the SDGs for the mitigation 3
options for urban systems based on Supplementary Material (SM) 8.1 (SM8.1). The evaluations depend 4
on the specific urban context with synergies and/or trade-offs being more significant in certain contexts 5
than others. Urban mitigation with a view of the SDGs can support shifting pathways of urbanization 6
towards greater sustainability. The feasibility of urban mitigation options is also malleable and can 7
increase with more ‘enabling conditions’ (see Glossary), provided, perhaps, though institutional (i.e., 8
financial or governmental) support (see Section 8.5). Strengthened institutional capacity that supports 9
the coordination of mitigation options can increase linkages with the SDGs and their synergies. For 10
example, urban land use and spatial planning for walkable and co-located densities together with 11
electrification of the urban energy system can hold more benefits for the SDGs than any one of the 12
mitigation options alone (see Sections 8.4.2.2, 8.4.3.1, and 8.6). 13
Evidence on the co-benefits of urban mitigation measures for human health has increased significantly 14
since AR5, especially through the use of health impact assessments, where energy savings and cleaner 15
energy supply structures based on measures for urban planning, heating, and transport have reduced 16
CO2, nitrogen oxides (NOx), and coarse particulate matter (PM10) emissions (Diallo et al. 2016). Some 17
measures, especially those related to land-use planning and transportation, have also increased 18
opportunities for physical activity for improved health (Diallo et al. 2016). In developing countries, the 19
co-benefits approach has been effective in justifying climate change mitigation actions at the local level 20
(Puppim de Oliveira and Doll 2016). Mixed-use compact development with sufficient land use diversity 21
can have a positive influence on urban productivity (see Section 8.4.2). Conversely, urban spatial 22
structures that increase walking distances and produce car dependency have negative impacts on urban 23
productivity considering congestion as well as energy costs (Salat et al. 2017). 24
There is increasing evidence that climate mitigation measures can lower health risks that are related to 25
energy poverty, especially among vulnerable groups such as the elderly and in informal settlements 26
(Monforti-Ferrario et al. 2018). Measures such as renewable energy-based electrification of the energy 27
system not only reduce outdoor air pollution, but also enhance indoor air quality by promoting smoke-28
free heating and cooking in buildings (Kjellstrom and McMichael 2013). The environmental and 29
ecological benefits of electrification of the urban energy system include improved air quality based on 30
a shift to non-polluting energy sources (Jacobson et al. 2018; Ajanovic and Haas 2019; Bagheri et al. 31
2019; Gai et al. 2020). Across 74 metropolitan areas around the world, an estimated 408,270 lives per 32
year are saved due to air quality improvements that stem from a move to 100% renewable energy 33
(Jacobson et al. 2020). Other studies indicate that there is potential to reduce premature mortality by up 34
to 7,000 people in 53 towns and cities, to create 93,000 new jobs, and to lower global climate costs and 35
personal energy costs, through renewable energy transformations (Jacobson et al. 2018). 36
Across 146 signatories of a city climate network, local energy-savings measures led to 6,596 avoided 37
premature deaths and 68,476 years of life saved due to improved air quality (Monforti-Ferrario et al. 38
2018). Better air quality further reinforces the health co-benefits of climate mitigation measures based 39
on walking and bicycling since evidence suggests that increased physical activity in urban outdoor 40
settings with low levels of black carbon improves lung function (Laeremans et al. 2018). Physical 41
activity can also be fostered through urban design measures and policies that promote the development 42
of ample and well-connected parks and open spaces, and can lead to physical and mental health benefits 43
(Kabisch et al. 2016) (see Section 8.4.4 and Figure 8.18). 44
Cities in India, Indonesia, Vietnam, and Thailand show that reducing emissions from major sources 45
(e.g., transport, residential burning, biomass open burning and industry) could bring substantial co-46
benefits of avoided deaths from reduced PM2.5 (fine inhalable particulates) emissions and radiative 47
ACCEPTED VERSION
SUBJECT TO FIN
AL EDITS
Final Government Distribution Chapter 8 IPCC AR6 WGIII
Do Not Cite, Quote or Distribute 8-23 Total pages: 157
forcing from black carbon (Pathak and Shukla 2016; Dhar et al. 2017; Permadi et al. 2017; Karlsson et 1
al. 2020), reduced noise, and reduced traffic injuries (Kwan and Hashim 2016). Compact city policies 2
and interventions that support a modal shift away from private motor vehicles towards walking, cycling, 3
and low-emission public transport delivers significant public health benefits (Creutzig 2016; Ürge-4
Vorsatz et al. 2018). Trade-offs associated with compact development include the marginal health costs 5
of transport air pollution (Lohrey and Creutzig 2016) and stress from traffic noise (Gruebner et al. 2017) 6
(Section 8.4.2.2). 7
Urban green and blue infrastructure—a subset of nature-based solutions (NBS)—acts as both climate 8
mitigation and adaptation measures by reducing heat stress (Kim and Coseo 2018; Privitera and La 9
Rosa 2018; Herath et al. 2021) improving air quality, reducing noise (Scholz et al. 2018; De la Sota et 10
al. 2019), improving urban biodiversity (Hall et al. 2017b), and enhancing well-being, including 11
contributions to local development (Lwasa et al. 2015). Health benefits from urban forestry and green 12
infrastructure include reduced cardiovascular morbidity, improved mental health (van den Bosch and 13
Ode Sang 2017; Vujcic et al. 2017; Al-Kindi et al. 2020; Sharifi et al. 2021), raised birth weight 14
(Dzhambov et al. 2014), and increased life expectancy (Jonker et al. 2014). Urban agriculture, including 15
urban orchards, roof-top gardens, and vertical farming contribute to enhancing food security and 16
fostering healthier diets (Cole et al. 2018; Petit-Boix and Apul 2018; De la Sota et al. 2019) (see Section 17
8.4.4, Figure 8.18, and Box 8.2). 18
19
8.2.2 Economic development, competitiveness, and equity 20
Sustainable management of urban ecosystems entails addressing economic growth, equity, and good 21
governance. In total, 102 SDG targets (99 synergies and 51 trade-offs) are identified with published 22
evidence of relationships with urban ecosystems—out of the 169 in the 2030 Agenda (Maes et al. 2019). 23
The targets require action in relation to urban ecosystem management, environmental improvements, 24
equality related to basic services, long-term economic growth, economic savings, stronger governance, 25
and policy development at multiple scales. 26
Mitigation measures related to different sectors can provide co-benefits and reduce social inequities. 27
Transport-related measures, such as transportation demand management, transit-oriented development 28
(TOD), and promotion of active transport modes provide economic co-benefits through, for example, 29
reducing healthcare costs linked with pollution and cardiovascular diseases, improving labour 30
productivity, and decreasing congestion costs (including waste of time and money) (Sharifi et al. 2021). 31
As a case-in-point, data from cities such as Bangkok, Kuala Lumpur, Jakarta, Manila, Beijing, Mexico 32
City, Dakar, and Buenos Aires indicate that economic costs of congestion account for a considerable 33
share of their gross domestic product (GDP) (ranging from 0.7% to 15.0%) (Dulal 2017) (see Section 34
8.4.2). 35
Since policy interventions can result in negative impacts or trade-offs with other objectives, fostering 36
accessibility, equity, and inclusivity for disadvantaged groups is essential (Viguié and Hallegatte 2012; 37
Sharifi 2020; Pörtner et al. 2021). Anti-sprawl policies that aim to increase density or introduction of 38
large green areas in cities could increase property prices, resulting in trade-offs with affordable housing 39
and pushing urban poor further away from cities (Reckien et al. 2017; Alves et al. 2019). Deliberate 40
strategies can improve access of low income populations to jobs, and gender-responsive transport 41
systems that can enhance women’s mobility and financial independence (Viguié and Hallegatte 2012; 42
Lecompte and Juan Pablo 2017; Reckien et al. 2017; Priya Uteng and Turner 2019). 43
Low-carbon urban development that triggers economic decoupling and involves capacity building 44
measures could have a positive impact on employment and local competitiveness (Dodman 2009; 45
Kalmykova et al. 2015; Chen et al. 2018b; García-Gusano et al. 2018; Hu et al. 2018; Shen et al. 2018). 46
Sustainable and low-carbon urban development that integrates issues of equity, inclusivity, and 47
ACCEPTED VERSION
SUBJECT TO FIN
AL EDITS
Final Government Distribution Chapter 8 IPCC AR6 WGIII
Do Not Cite, Quote or Distribute 8-24 Total pages: 157
affordability while safeguarding urban livelihoods, providing access to basic services, lowering energy 1
bills, addressing energy poverty, and improving public health, can also improve the distributional 2
effects of existing and future urbanization (Friend et al. 2016; Claude et al. 2017; Colenbrander et al. 3
2017; Ma et al. 2018; Mrówczyńska et al. 2018; Pukšec et al. 2018; Wiktorowicz et al. 2018; 4
Ramaswami 2020). 5
Depending on the context, green and blue infrastructure can also offer considerable economic co-6
benefits. For example, green roofs and facades and other urban greening efforts such as urban 7
agriculture and greening streets can improve microclimatic conditions and enhance thermal comfort, 8
thereby reducing utility and healthcare costs. The presence of green and blue infrastructure may also 9
increase the economic values of nearby properties (Votsis 2017; Alves et al. 2019) (see Section 8.4.4 10
and Figure 8.18). 11
Studies in the UK show that beneficiaries are willing to pay (WTP) an additional fee (up to 2% more in 12
monthly rent) for proximity to green and blue infrastructure, with the WTP varying depending on the 13
size and nature of the green space (Mell et al. 2013, 2016). Urban agriculture can not only reduce 14
household food expenditure, but also provide additional sources of revenue for the city (Ayerakwa 15
2017; Alves et al. 2019). Based on the assessed literature, there is high agreement on the economic co-16
benefits of green and blue infrastructure, but supporting evidence is still limited (see Section 8.7). 17
Implementing waste management and wastewater recycling measures can provide additional sources of 18
income for citizens and local authorities. Wastewater recycling can minimize the costs associated with 19
the renewal of centralized wastewater treatment plants (Bernstad Saraiva Schott and Cánovas 2015; 20
Gharfalkar et al. 2015; Gonzalez-Valencia et al. 2016; Herrero and Vilella 2018; Matsuda et al. 2018; 21
Nisbet et al. 2019). Waste management and wastewater recycling is also a pathway for inclusion of the 22
informal sector into the urban economy with high agreement and medium evidence (Sharifi 2021). 23
Additionally, authorities can sell energy generated from wastewater recycling to compensate for the 24
wastewater management costs (Colenbrander et al. 2017; Gondhalekar and Ramsauer 2017). Another 25
measure that contributes to reducing household costs is the promotion of behavioural measures such as 26
dietary changes that can decrease the demand for costly food sources and reduce healthcare costs 27
through promoting healthy diets (Hoppe et al. 2016) (see Sections 8.4.5 and 8.4.6). 28
In addition to cost savings, various measures such as stormwater management and urban greening can 29
enhance social equity and environmental justice. For example, the thermal comfort benefits provided 30
by green and blue infrastructure and passive design measures can address issues related to energy 31
poverty and unaffordability of expensive air conditioning systems for some social groups (Sharma et 32
al. 2018; He et al. 2019). To achieve such benefits, however, the costs of integrating green and blue 33
infrastructure and passive design measures into building design would need to be minimized. Another 34
example is the flood mitigation benefits of stormwater management measures that can reduce impacts 35
on urban poor who often reside in flood-prone and low-lying areas of cities (Adegun 2017; He et al. 36
2019). Generally, the urban poor are expected to be disproportionately affected by climate change 37
impacts. Carefully designed measures that reduce such disproportionate impacts by involving experts, 38
authorities and citizens would enhance social equity (Pandey et al. 2018; He et al. 2019; Mulligan et al. 39
2020). 40
41
8.2.3 Coupling mitigation and adaptation 42
There are numerous synergies that come from coupling urban adaptation and mitigation. A number of 43
studies have developed methods to assess the synergies between mitigation and adaptation strategies, 44
as well as their co-benefits (Solecki et al. 2015; Buonocore et al. 2016; Chang et al. 2017; Helgenberger 45
and Jänicke 2017). Co-benefits occur when implementing mitigation (or adaptation) measures that have 46
positive effects on adaptation (or mitigation) (Sharifi 2021). In contrast, the trade-offs emerge when 47
ACCEPTED VERSION
SUBJECT TO FIN
AL EDITS
Final Government Distribution Chapter 8 IPCC AR6 WGIII
Do Not Cite, Quote or Distribute 8-25 Total pages: 157
measures aimed at improving mitigation (adaptation) undermine the ability to pursue adaptation 1
(mitigation) targets (Sharifi 2020). The magnitude of such co-benefits and trade-offs may vary 2
depending on various factors. A systematic review of over 50 climate change articles provides evidence 3
that mitigation can contribute to resilience—especially to temperature changes and flooding—with 4
varying magnitudes depending on factors, such as the type of mitigation measure and the scale of 5
implementation (Sharifi 2019). 6
Measures from different sectors that can provide both mitigation and adaptation benefits involve urban 7
planning (see Section 8.4.2), buildings (Sections 8.4.3.2 and 8.4.4), energy (Section 8.4.3), green and 8
blue infrastructure (Section 8.4.4), transportation (Section 8.4.2), socio-behavioural aspects (Section 9
8.4.5), urban governance (Section 8.5), waste (Section 8.4.5.2), and water (Section 8.4.6). In addition 10
to their energy-saving and carbon-sequestration benefits, many measures can also enhance adaptation 11
to climate threats, such as extreme heat, energy shocks, floods, and droughts (Sharifi 2021). Existing 12
evidence is mainly related to urban green infrastructure, urban planning, transportation, and buildings. 13
There has been more emphasis on the potential co-benefits of measures, such as proper levels of density, 14
building energy efficiency, distributed and decentralized energy infrastructure, green roofs and facades, 15
and public/active transport modes. Renewable-based distributed and decentralized energy systems 16
improve resilience to energy shocks and can enhance adaptation to water stress considering the water-17
energy nexus. By further investment on these measures, planners and decision makers can ensure 18
enhancing achievement of mitigation/adaptation co-benefits at the urban level (Sharifi 2021). 19
As for trade-offs, some mitigation efforts may increase exposure to stressors such as flooding and the 20
urban heat island (UHI) effect (see Glossary), thereby reducing the adaptive capacity of citizens. For 21
instance, in some contexts, high-density areas that lack adequate provision of green and open spaces 22
may intensify the UHI effect (Pierer and Creutzig 2019; Xu et al. 2019). There are also concerns that 23
some mitigation efforts may diminish adaptive capacity of urban poor and marginalized groups through 24
increasing costs of urban services and/or eroding livelihood options. Environmental policies designed 25
to meet mitigation targets through phasing out old vehicles may erode livelihood options of poor 26
households, thereby decreasing their adaptive capacity (Colenbrander et al. 2017). Ambitious mitigation 27
and adaptation plans could benefit private corporate interests resulting in adverse effects on the urban 28
poor (Chu et al. 2018; Mehta et al. 2019). 29
Urban green and blue infrastructure such as urban trees, greenspaces, and urban waterways can 30
sequester carbon and reduce energy demand, and provide adaptation co-benefits by mitigating the UHI 31
effect (Berry et al. 2015; Wamsler and Pauleit 2016; WCRP 2019) (see Section 8.4.4, Figure 8.18, and 32
Box 8.2). 33
34
START CROSS-WORKING GROUP BOX 2 HERE 35
Cross-Working Group Box in Working Group II, Chapter 6 36
Cross-Working Group Box 2: Cities and Climate Change 37 Authors: Xuemei Bai (Australia), Vanesa Castan Broto (United Kingdom/Spain), Winston Chow 38
(Singapore), Felix Creutzig (Germany), David Dodman (Jamaica/United Kingdom), Rafiq Hamdi 39
(Belgium), Bronwyn Hayward (New Zealand), Şiir Kılkış (Turkey), Shuaib Lwasa (Uganda), Timon 40
McPhearson (the United States of America), Minal Pathak (India), Mark Pelling (United Kingdom), 41
Diana Reckien (Germany), Karen Seto (the United States of America), Ayyoob Sharifi (Japan/Iran), 42
Diána Ürge-Vorsatz (Hungary) 43
Introduction 44
This Cross-Working Group Box on Cities and Climate Change responds to the critical role of 45
urbanization as a mega-trend impacting climate adaptation and mitigation. Issues associated with cities 46
ACCEPTED VERSION
SUBJECT TO FIN
AL EDITS
Final Government Distribution Chapter 8 IPCC AR6 WGIII
Do Not Cite, Quote or Distribute 8-26 Total pages: 157
and urbanization are covered in substantial depth within all three Working Groups (including WGI Box 1
TS.14, WGII Chapter 6 ‘Cities, settlements and key infrastructure,’ WGII regional chapters, WGII 2
Cross-Chapter Paper ‘Cities and settlements by the sea’, and WGIII Chapter 8 ‘Urban systems and other 3
settlements’). This Box highlights key findings from WGII and III and substantial gaps in literature 4
where more research is urgently needed relating to policy action in cities. It describes methods of 5
addressing mitigation and adaptation in an integrated way across sectors and cities to advance 6
sustainable development and equity outcomes and assesses the governance and finance solutions 7
required to support climate resilient responses. 8
Urbanization: A megatrend driving global climate risk and potential for low-carbon and resilient 9
futures 10
Severe weather events, exacerbated by anthropogenic emissions, are already having devastating impacts 11
on people who live in urban areas, on the infrastructure that supports these communities, as well as 12
people living in distant places (high confidence) (Cai et al. 2019; Folke et al. 2021). Between 2000 and 13
2015, the global population in locations that were affected by floods grew by 58–86 million (Tellman 14
et al. 2021). The direct economic costs of all extreme events reached USD 210-268 billion in 2020 (Aon 15
2021; Munich RE 2021; WMO 2021) or about USD 0.7 billion per day; this figure does not include 16
knock-on costs in supply chains (Kii 2020) or lost days of work, implying that the actual economic 17
costs could be far higher. Depending on RCP, between half (RCP2.6) and three-quarters (RCP8.5) of 18
the global population could be exposed to periods of life-threatening climatic conditions arising from 19
coupled impacts of extreme heat and humidity by 2100 (Mora et al. 2017; Huang et al. 2019) (see WGII 20
Section 6.2.2.1, WGII Figure 6.3, and WGIII Sections 8.2 and 8.3.4). 21
Urban systems are now global, as evidenced by the interdependencies between infrastructure, services, 22
and networks driven by urban production and consumption; remittance flows and investments reach 23
into rural places shaping natural resource use far from the city and bring risk to the city when these 24
places are impacted by climate change (see WGIII Sections 8.4 and WGIII Figure 8.15). This megatrend 25
(Kourtit et al. 2015) amplifies as well as shapes the potential impacts of climate events and integrates 26
the aims and approaches for delivering mitigation, adaptation, and sustainable development (medium 27
evidence, high agreement) (Dawson et al. 2018; Tsavdaroglou et al. 2018; Zscheischler et al. 2018). For 28
cities facing flood damage, wide-ranging impacts have been recorded on other urban areas near and far 29
(Carter et al. 2021; Simpson et al. 2021) as production and trade is disrupted (Shughrue et al. 2020). In 30
the absence of integrated mitigation and adaptation across and between infrastructure systems and local 31
places, impacts that bring urban economies to a standstill can extend into supply chains and across 32
energy networks causing power outages. 33
Urban settlements contribute to climate change, generating about 70% of global CO2-eq emissions (high 34
confidence) (see WGI Box TS.14, WGII Sections 6.1 and 6.2, and WGIII Section 8.3). This global 35
impact feeds back to cities through the exposure of infrastructure, people, and business to the impacts 36
of climate-related hazards. Particularly in larger cities, this climate feedback is exacerbated by local 37
choices in urban design, land use, building design, and human behaviour (Viguié et al. 2020) that shape 38
local environmental conditions. Both the local and global combine to increase hazardousness. Certain 39
configurations of urban form and their elements can add up to 2°C to warming; concretisation of open 40
space can increase run-off, and building height and orientation influences wind direction and strength 41
(see WGII Section 6.3 and WGIII Section 8.4.2). 42
Designing for resilient and low-carbon cities today is far easier than retrofitting for risk reduction 43
tomorrow. As urbanization unfolds, its legacy continues to be the locking-in of emissions and 44
vulnerabilities (high confidence) (Seto et al. 2016; Ürge-Vorsatz et al. 2018) (see WGIII Section 8.4 45
and Figure 8.15). Retrofitting, disaster reconstruction, and urban regeneration programmes offer scope 46
for strategic direction changes to low-carbon and high-resilience urban form and function, so long as 47
they are inclusive in design and implementation. Rapid urban growth means new investment, new 48
ACCEPTED VERSION
SUBJECT TO FIN
AL EDITS
Final Government Distribution Chapter 8 IPCC AR6 WGIII
Do Not Cite, Quote or Distribute 8-27 Total pages: 157
buildings and infrastructure, new demands for energy and transport and new questions about what a 1
healthy and fulfilling urban life can be. The USD 90 trillion expected to be invested in new urban 2
development by 2030 (NCE 2018) is a global opportunity to place adaptation and mitigation directly 3
into urban infrastructure and planning, as well as to consider social policy including education, 4
healthcare, and environmental management (Ürge-Vorsatz et al. 2018). If this opportunity is missed, 5
and business-as-usual urbanization persists, social and physical vulnerability will become much more 6
challenging to address. 7
The benefits of actions taken to reduce GHG emissions and climate stressors diminish with delayed 8
action, indicating the necessity for rapid responses. Delaying the same actions for increasing the 9
resilience of infrastructure from 2020 to 2030 is estimated to have a median cost of at least USD 1 10
trillion (Hallegatte et al. 2019) while also missing the carbon emissions reductions required in the 11
narrowing window of opportunity to limit global warming to 1.5°C (WGI). In contrast, taking integrated 12
actions towards mitigation, adaptation, and sustainable development will provide multiple benefits for 13
the health and well-being of urban inhabitants and avoid stranded assets (see WGII Section 6.3, WGII 14
Chapter 17, Cross-Chapter Box FEASIBILITY in WGII Chapter 18, WGIII Chapter 5, and WGIII 15
Section 8.2). 16
The policy-action gap: urban low-carbon and climate resilient development 17
Cities are critical places to realize both adaptation and mitigation actions simultaneously with potential 18
co-benefits that extend far beyond cities (medium evidence high agreement) (Göpfert et al. 2019; 19
Grafakos et al. 2020). Given rapid changes in the built environment, transforming the use of materials 20
and the land intensiveness of urban development, including in many parts of the Global South, will be 21
critical in the next decades, as well as mainstreaming low-carbon development principles in new urban 22
development in all regions. Much of this development will be self-built and ‘informal’—and new modes 23
of governance and planning will be required to engage with this. Integrating mitigation and adaptation 24
now rather than later, through reshaping patterns of urban development and associated decision-making 25
processes, is a prerequisite for attaining resilient and zero-carbon cities (see WGIII Sections 8.4 and 26
8.6, and WGIII Figure 8.21). 27
While more cities have developed plans for climate adaptation and mitigation since AR5, many remain 28
to be implemented (limited evidence, high agreement) (Araos et al. 2017; Aguiar et al. 2018; Olazabal 29
and Ruiz De Gopegui 2021). A review of local climate mitigation and adaptation plans across 885 urban 30
areas of the European Union suggests mitigation plans are more common than adaptation plans—and 31
that city size, national legislation, and international networks can influence the development of local 32
climate and adaptation plans with an estimated 80% of those cities with above 500,000 inhabitants 33
having a mitigation and/or an adaptation plan (Reckien et al. 2018). 34
Integrated approaches to tackle common drivers of emissions and cascading risks provide the basis for 35
strengthening synergies across mitigation and adaptation, and help manage possible trade-offs with 36
sustainable development (limited evidence, medium agreement) (Grafakos et al. 2019; Landauer et al. 37
2019; Pierer and Creutzig 2019). An analysis of 315 local authority emission reduction plans reveals 38
that the most common policies cover municipal assets and structures (Palermo et al. 2020a). Estimates 39
of emission reductions by non-state and sub-state actors in ten high-emitting economies projected GHG 40
emissions in 2030 would be 1.2–2.0 GtCO2-eq per year or 3.8–5.5% lower compared to scenario 41
projections for current national policies (31.6–36.8 GtCO2-eq per year) if the policies are fully 42
implemented and do not change the pace of action elsewhere (Kuramochi et al. 2020). The value of 43
integrating mitigation and adaptation is underscored in the opportunities for decarbonizing existing 44
urban areas, and investing in social, ecological, and technological infrastructure resilience (WGII 45
Section 6.4). Integrating mitigation and adaption is challenging (Landauer et al. 2019) but can provide 46
multiple benefits for the health and well-being of urban inhabitants (Sharifi 2021) (See WGIII Section 47
8.2.3). 48
ACCEPTED VERSION
SUBJECT TO FIN
AL EDITS
Final Government Distribution Chapter 8 IPCC AR6 WGIII
Do Not Cite, Quote or Distribute 8-28 Total pages: 157
Effective climate strategies combine mitigation and adaptation responses, including through linking 1
adaptive urban land use with GHG emission reductions (medium evidence, high agreement) (Xu et al. 2
2019; Patterson 2021). For example, urban green and blue infrastructure can provide co-benefits for 3
mitigation and adaptation (Ürge-Vorsatz et al. 2018) and is an important entry point for integrating 4
adaptation and mitigation at the urban level (Frantzeskaki et al. 2019) (see WGIII Section 8.4.4 and 5
WGIII Figure 8.18). Grey and physical infrastructure, such as sea defences can immediately reduce 6
risk, but also transfer risk and limit future options. Social policy interventions including social safety 7
nets provide financial security for the most at-risk and can manage vulnerability determined by specific 8
hazards or independently. 9
Hazard-independent mechanisms for vulnerability reduction—such as population-wide social 10
security—provide resilience in the face of unanticipated cascading impacts or surprise and novel 11
climate-related hazard exposure. Social interventions can also support or be led by ambitions to reach 12
the SDGs (Archer 2016). Climate-resilient development invites planners to develop interventions and 13
monitor the effectiveness of outcomes beyond individual projects and across wider remits that consider 14
sustainable development. Curbing the emission impacts of urban activities to reach net zero emissions 15
in the next decades, while improving the resilience of urban areas, necessitates an integrated response 16
now. 17
Key gaps in knowledge include: urban-enabling environments; the role of smaller settlements, low-18
income communities, and informal settlements, as well as those in rental housing spread across the city; 19
and the ways in which actions to reduce supply chain risk can be supported to accelerate equitable and 20
sustainable adaptation in the face of financial and governance constraints (Birkmann et al. 2016; Shi et 21
al. 2016; Rosenzweig et al. 2018; Dulal 2019). 22
Enabling action 23
Innovative governance and finance solutions are required to manage complex and interconnected risks 24
across essential key infrastructures, networks, and services, as well as to meet basic human needs in 25
urban areas (medium confidence) (Colenbrander et al. 2018a; Moser et al. 2019). There are many 26
examples of ‘ready-to-use’ policy tools, technologies, and practical interventions for policymakers 27
seeking to act on adaptation and mitigation (Bisaro and Hinkel 2018; Keenan et al. 2019; Chirambo 28
2021) (see WGIII Section 8.5.4). Tax and fiscal incentives for businesses and individuals can help 29
support city-wide behaviour change towards low-carbon and risk reducing choices. Change can start 30
where governments have most control—often in public sector institutions and investment—but the 31
challenge ahead requires partnership with private sector and community actors acting at scale and with 32
accountability. Urban climate governance and finance needs to address urban inequalities at the 33
forefront if the urban opportunity is to realize the ambition of the SDGs. 34
Increasing the pace of investments will put pressure on governance capability, transparency, and 35
accountability of decision-making (medium confidence) (see WGII Section 6.4.5). Urban climate action 36
that actively includes local actors is more likely to avoid unintended, negative maladaptive impacts and 37
mobilize a wide range of local capacities. In the long run, this is also more likely to carry public support, 38
even if some experiments and investments do not deliver the intended social benefits. Legislation, 39
technical capacity, and governance capability is required to be able to absorb additional finance. 40
In recent years, about USD 384 billion of climate finance has been invested in urban areas per year. 41
This remains at about 10% of the annual climate finance that would be necessary for low-carbon and 42
resilient urban development at a global scale (Negreiros et al. 2021). Rapid deployment of funds to 43
stimulate economies in the recovery from COVID-19 has highlighted the pitfalls of funding expansion 44
ahead of policy innovation and capacity building. The result can be an intensification of existing carbon-45
intensive urban forms—exactly the kinds of ‘carbon lock-in’ (see WGIII Glossary and WGIII Section 46
ACCEPTED VERSION
SUBJECT TO FIN
AL EDITS
Final Government Distribution Chapter 8 IPCC AR6 WGIII
Do Not Cite, Quote or Distribute 8-29 Total pages: 157
8.4.1) that have contributed to risk creation and its concentration amongst those with little public voice 1
or economic power. 2
Iterative and experimental approaches to climate adaptation and mitigation decision-making grounded 3
in data and co-generated in partnership with communities can advance low-carbon climate resilience 4
(medium evidence, high confidence) (Culwick et al. 2019; Caldarice et al. 2021; van der Heijden and 5
Hong 2021). Conditions of complexity, uncertainty, and constrained resources require innovative 6
solutions that are both adaptive and anticipatory. Complex interactions among multiple agents in times 7
of uncertainty makes decision-making about social, economic, governance, and infrastructure choices 8
challenging and can lead decision-makers to postpone action. This is the case for those balancing 9
household budgets, residential investment portfolios, and city-wide policy responsibilities. Living with 10
climate change requires changes to business-as-usual design-making. Co-design and collaboration with 11
communities through iterative policy experimentation can point the way towards climate resilient 12
development pathways (Ataöv and Peker 2021). Key to successful learning is transparency in 13
policymaking, inclusive policy processes, and robust local modelling, monitoring, and evaluation, 14
which are not yet widely undertaken (Sanchez Rodriguez et al. 2018; Ford et al. 2019). 15
The diversity of cities’ experiences of climate mitigation and adaptation strategies brings an advantage 16
for those city governments and other actors willing to ‘learn together’ (limited evidence, high 17
confidence) (Bellinson and Chu 2019; Haupt and Coppola 2019). While contexts are varied, policy 18
options are often similar enough for the sharing of experiments and policy champions. Sharing expertise 19
can build on existing regional and global networks, many of which have already placed knowledge, 20
learning, and capacity-building at the centre of their agendas. Learning from innovative forms of 21
governance and financial investment, as well as strengthening coproduction of policy through inclusive 22
access to knowledge and resources, can help address mismatches in local capacities and strengthen 23
wider SDGs and COVID-19 recovery agendas (limited evidence, medium agreement). Perceptions of 24
risk can greatly influence the reallocation of capital and shift financial resources (Battiston et al. 2021). 25
Coupling mitigation and adaptation in an integrated approach offers opportunities to enhance efficiency, 26
increases the coherence of urban climate action, generates cost savings, and provides opportunities to 27
reinvest the savings into new climate action projects to make all urban areas and regions more resilient. 28
Local governments play an important role in driving climate action across mitigation and adaptation as 29
managers of assets, regulators, mobilizers, and catalysts of action, but few cities are undertaking 30
transformative climate adaptation or mitigation actions (limited evidence, medium confidence) 31
(Heikkinen et al. 2019). Local actors are providers of infrastructure and services, regulators of zoning, 32
and can be conveners and champions of an integrated approach for mitigation and adaptation at multiple 33
levels (limited evidence high confidence). New opportunities in governance and finance can enable 34
cities to pool resources together and aggregate interventions to innovate ways of mobilizing urban 35
climate finance at scale (Colenbrander et al. 2019; Simpson et al. 2019; White and Wahba 2019). 36
However, research increasingly points towards the difficulties faced during the implementation of 37
climate financing in situ, such as the fragmentation of structures of governance capable of managing 38
large investments effectively (Mohammed et al. 2019) (see WGIII Section 8.5 and WGIII Chapter 13). 39
Scaling up transformative place-based action for both adaptation and mitigation requires enabling 40
conditions, including land-based financing, intermediaries, and local partnerships (medium evidence, 41
high agreement) (Chu et al. 2019; Chaudhuri, 2020) supported by a new generation of big data 42
approaches. Governance structures that combine actors working at different levels with a different mix 43
of tools are effective in addressing challenges related to implementation of integrated action while 44
cross-sectoral coordination is necessary (Singh et al. 2020). Joint institutionalization of mitigation and 45
adaptation in local governance structures can also enable integrated action (Göpfert et al. 2020; 46
Hurlimann et al. 2021). However, the proportion of international finance that reaches local recipients 47
remains low, despite the repeated focus of climate policy on place-based adaptation and mitigation 48
ACCEPTED VERSION
SUBJECT TO FIN
AL EDITS
Final Government Distribution Chapter 8 IPCC AR6 WGIII
Do Not Cite, Quote or Distribute 8-30 Total pages: 157
(Manuamorn et al. 2020). Green financing instruments that enable local climate action without 1
exacerbating current forms of inequality can jointly address mitigation, adaptation, and sustainable 2
development. Climate finance that also reaches beyond larger non-state enterprises (e.g., small and 3
medium-sized enterprises, local communities, non-governmental organizations—NGOs, etc.), and is 4
inclusive in responding to the needs of all urban inhabitants (e.g., disabled individuals, citizens of 5
different races or ethnicities, etc.) is essential for inclusive and resilient urban development 6
(Colenbrander et al. 2019; Gabaldón-Estevan et al. 2019; Frenova 2021). Developing networks that can 7
exert climate action at scale is another priority for climate finance. 8
The urban megatrend is an opportunity to transition global society. Enabling urban governance to avert 9
cascading risk and achieve low-carbon, resilient development will involve the coproduction of policy 10
and planning, rapid implementation and greater cross sector coordination, and monitoring and 11
evaluation (limited evidence, medium agreement) (Di Giulio et al. 2018; Grafakos et al. 2019). New 12
constellations of responsible actors are required to manage hybrid local-city or cross-city risk 13
management and decarbonization initiatives (limited evidence, medium agreement). These may 14
increasingly benefit from linkages across more urban and more rural space as recognition of cascading 15
and systemic risk brings recognition of supply chains, remittance flows, and migration trends as vectors 16
of risk and resilience. Urban governance will be better prepared in planning, prioritizing, and financing 17
the kind of measures that can reduce GHG emissions and improve resilience at scale when they consider 18
a view of cascading risks and carbon lock-ins globally, while also acting locally to address local 19
limitations and capacities, including the needs and priorities of urban citizens (Colenbrander et al. 20
2018a; Rodrigues 2019). 21
END CROSS-WORKING GROUP BOX 2 HERE 22
8.3 Urban systems and GHG emissions 23
This section assesses trends in urban land use, the built environment, and urban GHG emissions, as well 24
as forecasts for urban land use and emissions under certain scenarios to 2050 or 2100. These trends and 25
scenarios hold implications for optimizing the approaches to urban climate change mitigation discussed 26
in Section 8.4 and 8.6. 27
8.3.1 Trends in urban land use and the built environment 28
Urban land use is one of the most intensive human impacts on the planet (Pouyat et al. 2007; Grimm et 29
al. 2008). Urban land expansion to accommodate a growing urban population has resulted in the 30
conversion of agricultural land (Pandey et al. 2018; Liu et al. 2019), deforestation (van Vliet 2019), 31
habitat fragmentation (Liu et al. 2016b), biodiversity loss (McDonald et al. 2018, 2020), and the 32
modification of urban temperatures and regional precipitation patterns (Li et al. 2017; Krayenhoff et al. 33
2018; Liu and Niyogi 2019; Zhang et al. 2019). 34
Urban land use and the associated built environment and infrastructure shape urban GHG emissions 35
through the demand for materials and the ensuing energy-consuming behaviours. In particular, the 36
structure of the built environment (i.e., its density, form, and extent) have long-lasting influence on 37
urban GHG emissions, especially those from transport and building energy use, as well as the embodied 38
emissions of the urban infrastructure (Butler et al. 2014; Salat et al. 2014; Ramaswami et al. 2016; Seto 39
et al. 2016; d’Amour et al. 2017). Thus, understanding trends in urban land use is essential for assessing 40
energy behaviour in cities as well as long-term mitigation potential (see Sections 8.4 and 8.6, and Figure 41
8.21). 42
This section draws on the literature to discuss three key trends in urban land expansion, and how those 43
relate to GHG emissions. 44
ACCEPTED VERSION
SUBJECT TO FIN
AL EDITS
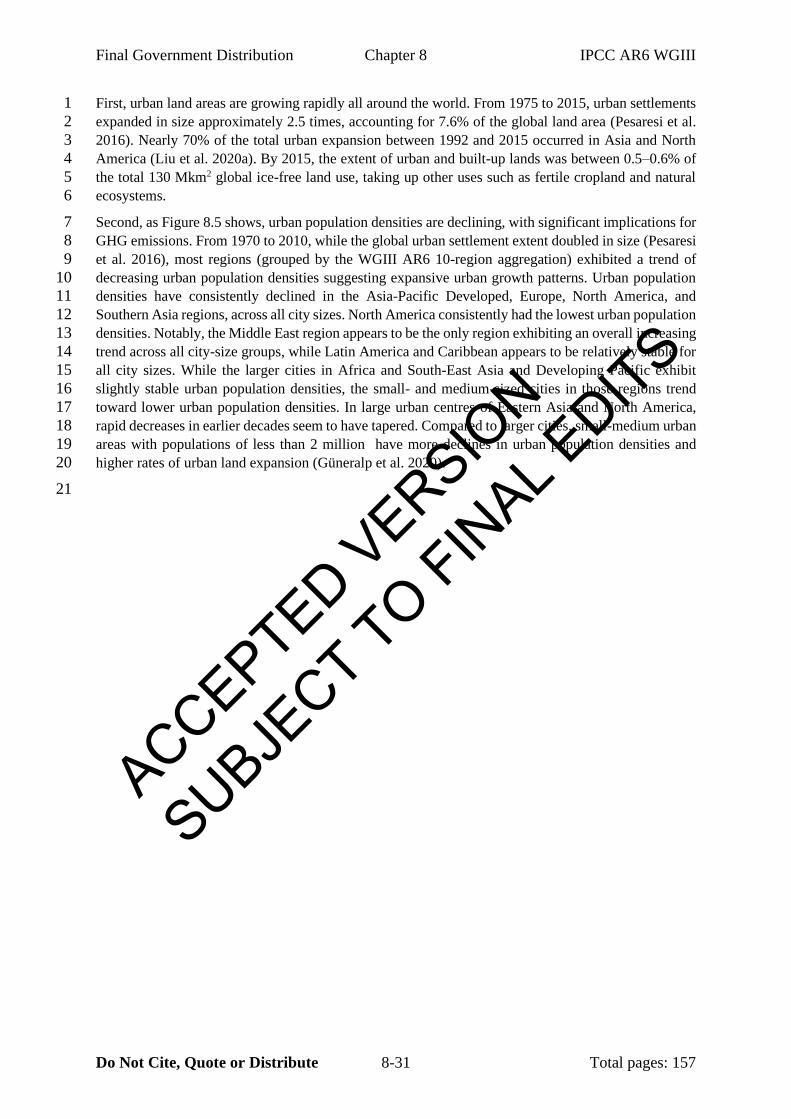
Final Government Distribution Chapter 8 IPCC AR6 WGIII
Do Not Cite, Quote or Distribute 8-31 Total pages: 157
First, urban land areas are growing rapidly all around the world. From 1975 to 2015, urban settlements 1
expanded in size approximately 2.5 times, accounting for 7.6% of the global land area (Pesaresi et al. 2
2016). Nearly 70% of the total urban expansion between 1992 and 2015 occurred in Asia and North 3
America (Liu et al. 2020a). By 2015, the extent of urban and built-up lands was between 0.5–0.6% of 4
the total 130 Mkm2 global ice-free land use, taking up other uses such as fertile cropland and natural 5
ecosystems. 6
Second, as Figure 8.5 shows, urban population densities are declining, with significant implications for 7
GHG emissions. From 1970 to 2010, while the global urban settlement extent doubled in size (Pesaresi 8
et al. 2016), most regions (grouped by the WGIII AR6 10-region aggregation) exhibited a trend of 9
decreasing urban population densities suggesting expansive urban growth patterns. Urban population 10
densities have consistently declined in the Asia-Pacific Developed, Europe, North America, and 11
Southern Asia regions, across all city sizes. North America consistently had the lowest urban population 12
densities. Notably, the Middle East region appears to be the only region exhibiting an overall increasing 13
trend across all city-size groups, while Latin America and Caribbean appears to be relatively stable for 14
all city sizes. While the larger cities in Africa and South-East Asia and Developing Pacific exhibit 15
slightly stable urban population densities, the small- and medium-sized cities in those regions trend 16
toward lower urban population densities. In large urban centres of Eastern Asia and North America, 17
rapid decreases in earlier decades seem to have tapered. Compared to larger cities, small-medium urban 18
areas with populations of less than 2 million have more declines in urban population densities and 19
higher rates of urban land expansion (Güneralp et al. 2020). 20
21
ACCEPTED VERSION
SUBJECT TO FIN
AL EDITS
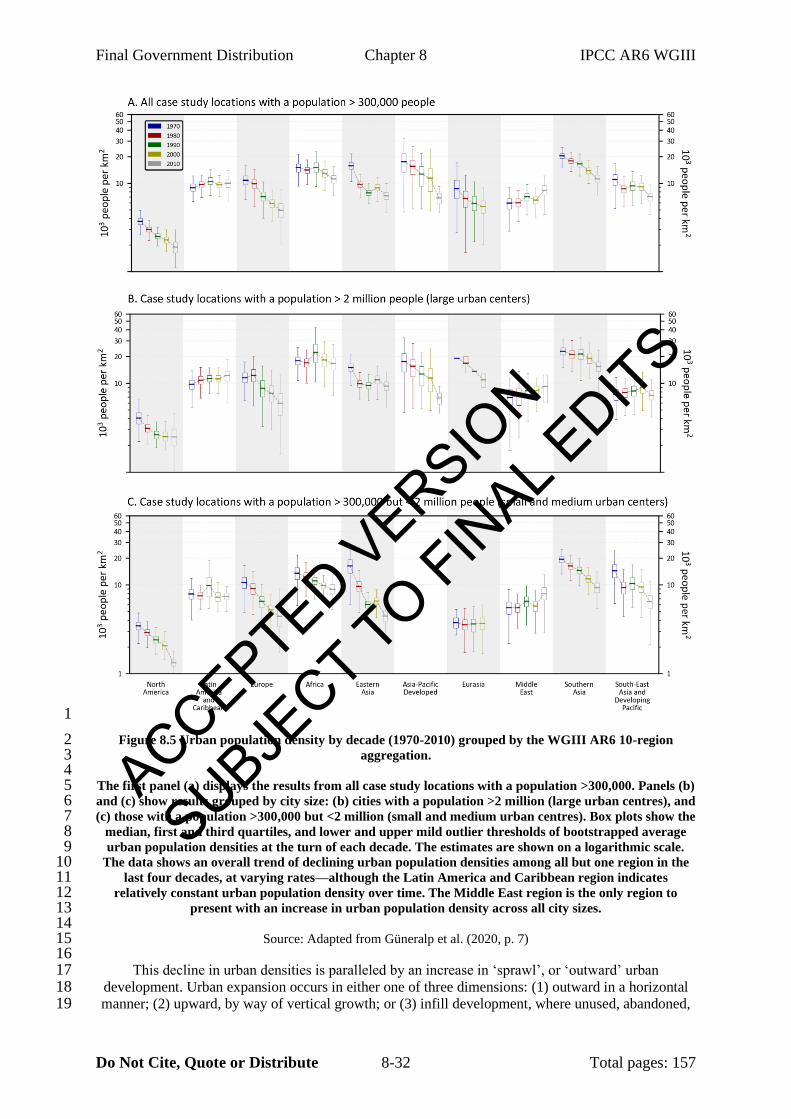
Final Government Distribution Chapter 8 IPCC AR6 WGIII
Do Not Cite, Quote or Distribute 8-32 Total pages: 157
1
Figure 8.5 Urban population density by decade (1970-2010) grouped by the WGIII AR6 10-region 2 aggregation. 3
4 The first panel (a) displays the results from all case study locations with a population >300,000. Panels (b) 5 and (c) show results grouped by city size: (b) cities with a population >2 million (large urban centres), and 6 (c) those with a population >300,000 but <2 million (small and medium urban centres). Box plots show the 7
median, first and third quartiles, and lower and upper mild outlier thresholds of bootstrapped average 8 urban population densities at the turn of each decade. The estimates are shown on a logarithmic scale. 9
The data shows an overall trend of declining urban population densities among all but one region in the 10 last four decades, at varying rates—although the Latin America and Caribbean region indicates 11
relatively constant urban population density over time. The Middle East region is the only region to 12 present with an increase in urban population density across all city sizes. 13
14 Source: Adapted from Güneralp et al. (2020, p. 7) 15
16 This decline in urban densities is paralleled by an increase in ‘sprawl’, or ‘outward’ urban 17
development. Urban expansion occurs in either one of three dimensions: (1) outward in a horizontal 18 manner; (2) upward, by way of vertical growth; or (3) infill development, where unused, abandoned, 19
ACCEPTED VERSION
SUBJECT TO FIN
AL EDITS
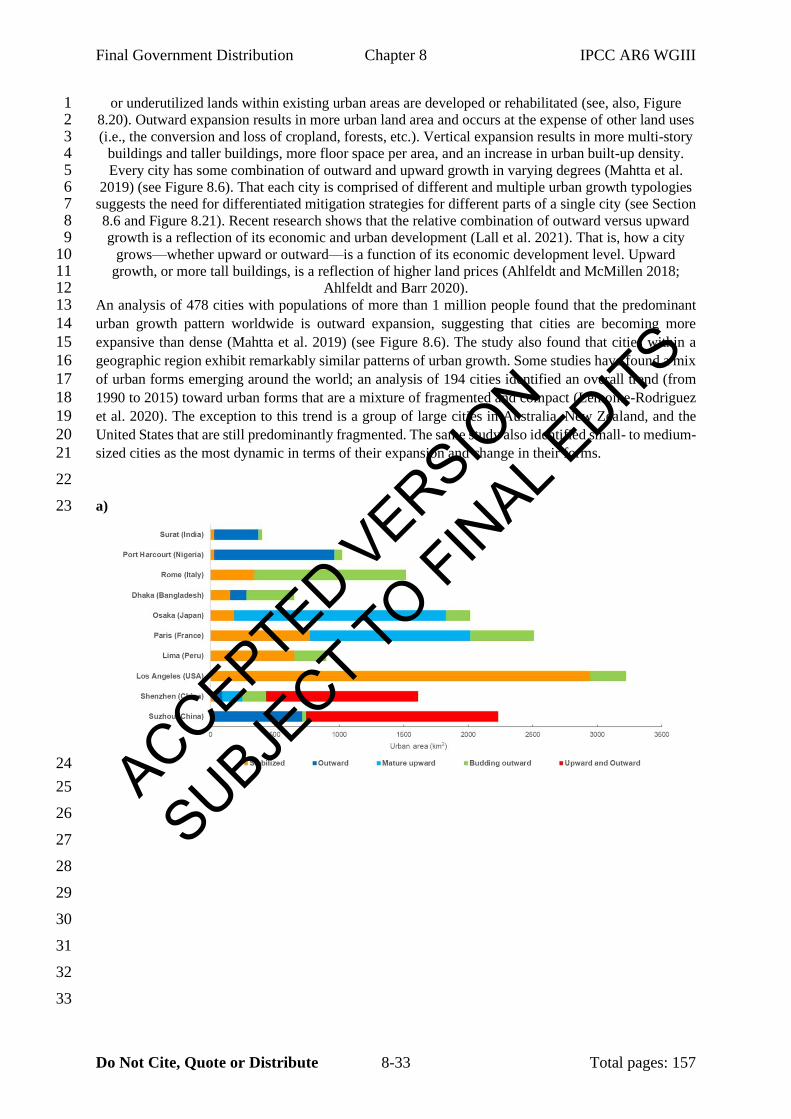
Final Government Distribution Chapter 8 IPCC AR6 WGIII
Do Not Cite, Quote or Distribute 8-33 Total pages: 157
or underutilized lands within existing urban areas are developed or rehabilitated (see, also, Figure 1 8.20). Outward expansion results in more urban land area and occurs at the expense of other land uses 2 (i.e., the conversion and loss of cropland, forests, etc.). Vertical expansion results in more multi-story 3
buildings and taller buildings, more floor space per area, and an increase in urban built-up density. 4 Every city has some combination of outward and upward growth in varying degrees (Mahtta et al. 5
2019) (see Figure 8.6). That each city is comprised of different and multiple urban growth typologies 6 suggests the need for differentiated mitigation strategies for different parts of a single city (see Section 7 8.6 and Figure 8.21). Recent research shows that the relative combination of outward versus upward 8 growth is a reflection of its economic and urban development (Lall et al. 2021). That is, how a city 9
grows—whether upward or outward—is a function of its economic development level. Upward 10 growth, or more tall buildings, is a reflection of higher land prices (Ahlfeldt and McMillen 2018; 11
Ahlfeldt and Barr 2020). 12 An analysis of 478 cities with populations of more than 1 million people found that the predominant 13
urban growth pattern worldwide is outward expansion, suggesting that cities are becoming more 14
expansive than dense (Mahtta et al. 2019) (see Figure 8.6). The study also found that cities within a 15
geographic region exhibit remarkably similar patterns of urban growth. Some studies have found a mix 16
of urban forms emerging around the world; an analysis of 194 cities identified an overall trend (from 17
1990 to 2015) toward urban forms that are a mixture of fragmented and compact (Lemoine-Rodriguez 18
et al. 2020). The exception to this trend is a group of large cities in Australia, New Zealand, and the 19
United States that are still predominantly fragmented. The same study also identified small- to medium-20
sized cities as the most dynamic in terms of their expansion and change in their forms. 21
22
a) 23
24
25
26
27
28
29
30
31
32
33
ACCEPTED VERSION
SUBJECT TO FIN
AL EDITS
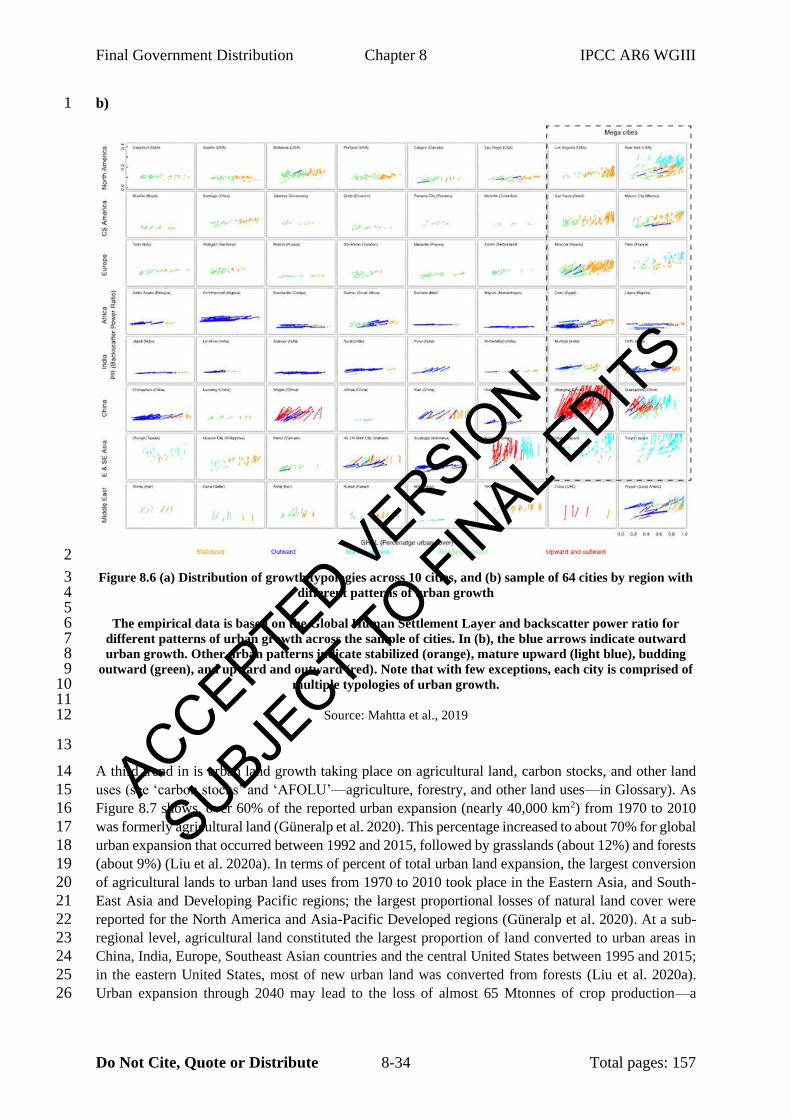
Final Government Distribution Chapter 8 IPCC AR6 WGIII
Do Not Cite, Quote or Distribute 8-34 Total pages: 157
b) 1
2
Figure 8.6 (a) Distribution of growth typologies across 10 cities, and (b) sample of 64 cities by region with 3 different patterns of urban growth 4
5 The empirical data is based on the Global Human Settlement Layer and backscatter power ratio for 6
different patterns of urban growth across the sample of cities. In (b), the blue arrows indicate outward 7 urban growth. Other urban patterns indicate stabilized (orange), mature upward (light blue), budding 8
outward (green), and upward and outward (red). Note that with few exceptions, each city is comprised of 9 multiple typologies of urban growth. 10
11 Source: Mahtta et al., 2019 12
13
A third trend in is urban land growth taking place on agricultural land, carbon stocks, and other land 14
uses (see ‘carbon stocks’ and ‘AFOLU’—agriculture, forestry, and other land uses—in Glossary). As 15
Figure 8.7 shows, over 60% of the reported urban expansion (nearly 40,000 km2) from 1970 to 2010 16
was formerly agricultural land (Güneralp et al. 2020). This percentage increased to about 70% for global 17
urban expansion that occurred between 1992 and 2015, followed by grasslands (about 12%) and forests 18
(about 9%) (Liu et al. 2020a). In terms of percent of total urban land expansion, the largest conversion 19
of agricultural lands to urban land uses from 1970 to 2010 took place in the Eastern Asia, and South-20
East Asia and Developing Pacific regions; the largest proportional losses of natural land cover were 21
reported for the North America and Asia-Pacific Developed regions (Güneralp et al. 2020). At a sub-22
regional level, agricultural land constituted the largest proportion of land converted to urban areas in 23
China, India, Europe, Southeast Asian countries and the central United States between 1995 and 2015; 24
in the eastern United States, most of new urban land was converted from forests (Liu et al. 2020a). 25
Urban expansion through 2040 may lead to the loss of almost 65 Mtonnes of crop production—a 26
ACCEPTED VERSION
SUBJECT TO FIN
AL EDITS
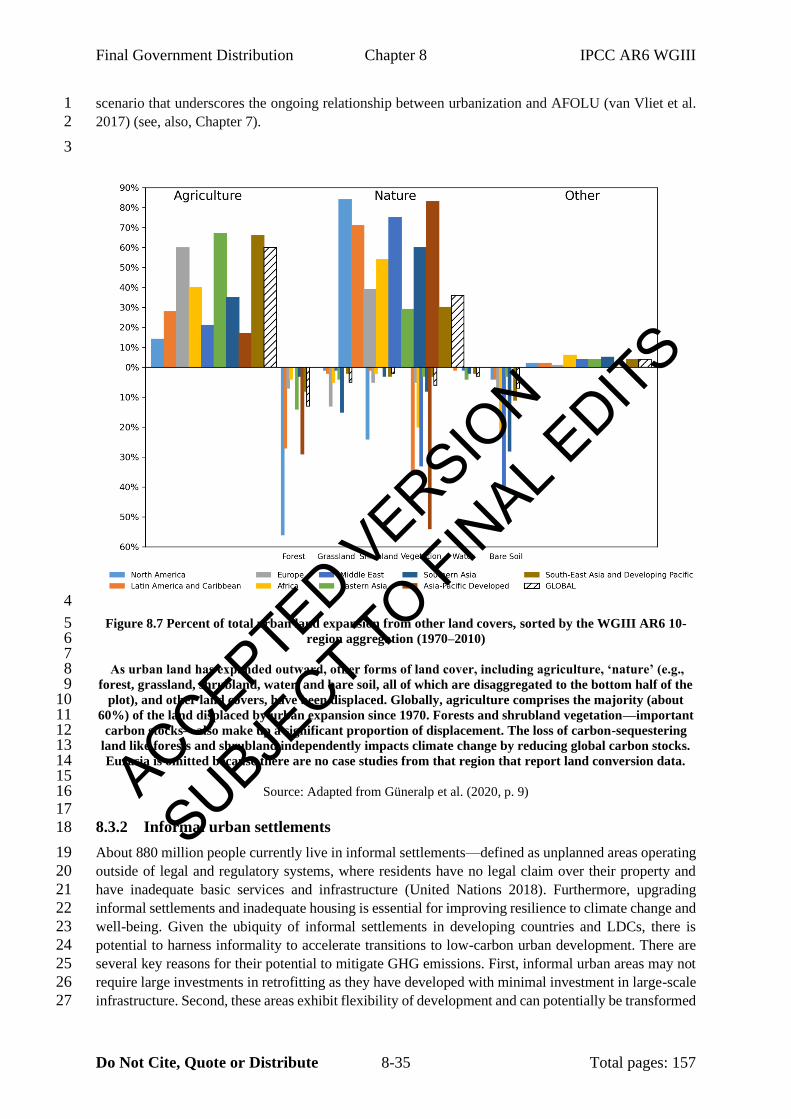
Final Government Distribution Chapter 8 IPCC AR6 WGIII
Do Not Cite, Quote or Distribute 8-35 Total pages: 157
scenario that underscores the ongoing relationship between urbanization and AFOLU (van Vliet et al. 1
2017) (see, also, Chapter 7). 2
3
4
Figure 8.7 Percent of total urban land expansion from other land covers, sorted by the WGIII AR6 10-5 region aggregation (1970–2010) 6
7 As urban land has expanded outward, other forms of land cover, including agriculture, ‘nature’ (e.g., 8
forest, grassland, shrubland, water, and bare soil, all of which are disaggregated to the bottom half of the 9 plot), and other land covers, have been displaced. Globally, agriculture comprises the majority (about 10
60%) of the land displaced by urban expansion since 1970. Forests and shrubland vegetation—important 11 carbon stocks—also make up a significant proportion of displacement. The loss of carbon-sequestering 12
land like forests and shrubland independently impacts climate change by reducing global carbon stocks. 13 Eurasia is omitted because there are no case studies from that region that report land conversion data. 14
15 Source: Adapted from Güneralp et al. (2020, p. 9) 16
17
8.3.2 Informal urban settlements 18
About 880 million people currently live in informal settlements—defined as unplanned areas operating 19
outside of legal and regulatory systems, where residents have no legal claim over their property and 20
have inadequate basic services and infrastructure (United Nations 2018). Furthermore, upgrading 21
informal settlements and inadequate housing is essential for improving resilience to climate change and 22
well-being. Given the ubiquity of informal settlements in developing countries and LDCs, there is 23
potential to harness informality to accelerate transitions to low-carbon urban development. There are 24
several key reasons for their potential to mitigate GHG emissions. First, informal urban areas may not 25
require large investments in retrofitting as they have developed with minimal investment in large-scale 26
infrastructure. Second, these areas exhibit flexibility of development and can potentially be transformed 27
ACCEPTED VERSION
SUBJECT TO FIN
AL EDITS
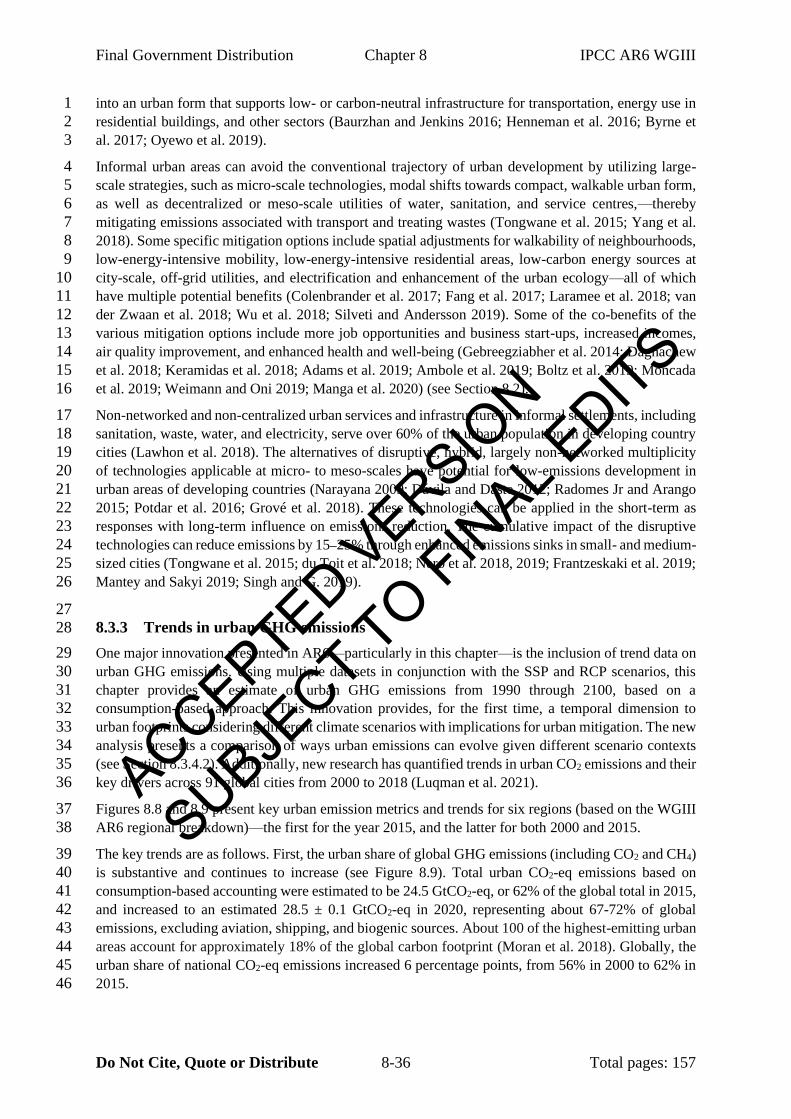
Final Government Distribution Chapter 8 IPCC AR6 WGIII
Do Not Cite, Quote or Distribute 8-36 Total pages: 157
into an urban form that supports low- or carbon-neutral infrastructure for transportation, energy use in 1
residential buildings, and other sectors (Baurzhan and Jenkins 2016; Henneman et al. 2016; Byrne et 2
al. 2017; Oyewo et al. 2019). 3
Informal urban areas can avoid the conventional trajectory of urban development by utilizing large-4
scale strategies, such as micro-scale technologies, modal shifts towards compact, walkable urban form, 5
as well as decentralized or meso-scale utilities of water, sanitation, and service centres,—thereby 6
mitigating emissions associated with transport and treating wastes (Tongwane et al. 2015; Yang et al. 7
2018). Some specific mitigation options include spatial adjustments for walkability of neighbourhoods, 8
low-energy-intensive mobility, low-energy-intensive residential areas, low-carbon energy sources at 9
city-scale, off-grid utilities, and electrification and enhancement of the urban ecology—all of which 10
have multiple potential benefits (Colenbrander et al. 2017; Fang et al. 2017; Laramee et al. 2018; van 11
der Zwaan et al. 2018; Wu et al. 2018; Silveti and Andersson 2019). Some of the co-benefits of the 12
various mitigation options include more job opportunities and business start-ups, increased incomes, 13
air quality improvement, and enhanced health and well-being (Gebreegziabher et al. 2014; Dagnachew 14
et al. 2018; Keramidas et al. 2018; Adams et al. 2019; Ambole et al. 2019; Boltz et al. 2019; Moncada 15
et al. 2019; Weimann and Oni 2019; Manga et al. 2020) (see Section 8.2). 16
Non-networked and non-centralized urban services and infrastructure in informal settlements, including 17
sanitation, waste, water, and electricity, serve over 60% of the urban population in developing country 18
cities (Lawhon et al. 2018). The alternatives of disruptive, hybrid, largely non-networked multiplicity 19
of technologies applicable at micro- to meso-scales have potential for low-emissions development in 20
urban areas of developing countries (Narayana 2009; Dávila and Daste 2012; Radomes Jr and Arango 21
2015; Potdar et al. 2016; Grové et al. 2018). These technologies can be applied in the short-term as 22
responses with long-term influence on emissions reduction. The cumulative impact of the disruptive 23
technologies can reduce emissions by 15–25% through enhanced emissions sinks in small- and medium-24
sized cities (Tongwane et al. 2015; du Toit et al. 2018; Nero et al. 2018, 2019; Frantzeskaki et al. 2019; 25
Mantey and Sakyi 2019; Singh and G. 2019). 26
27
8.3.3 Trends in urban GHG emissions 28
One major innovation presented in AR6—particularly in this chapter—is the inclusion of trend data on 29
urban GHG emissions. Using multiple datasets in conjunction with the SSP and RCP scenarios, this 30
chapter provides an estimate of urban GHG emissions from 1990 through 2100, based on a 31
consumption-based approach. This innovation provides, for the first time, a temporal dimension to 32
urban footprints considering different climate scenarios with implications for urban mitigation. The new 33
analysis presents a comparison of ways urban emissions can evolve given different scenario contexts 34
(see Section 8.3.4.2). Additionally, new research has quantified trends in urban CO2 emissions and their 35
key drivers across 91 global cities from 2000 to 2018 (Luqman et al. 2021). 36
Figures 8.8 and 8.9 present key urban emission metrics and trends for six regions (based on the WGIII 37
AR6 regional breakdown)—the first for the year 2015, and the latter for both 2000 and 2015. 38
The key trends are as follows. First, the urban share of global GHG emissions (including CO2 and CH4) 39
is substantive and continues to increase (see Figure 8.9). Total urban CO2-eq emissions based on 40
consumption-based accounting were estimated to be 24.5 GtCO2-eq, or 62% of the global total in 2015, 41
and increased to an estimated 28.5 ± 0.1 GtCO2-eq in 2020, representing about 67-72% of global 42
emissions, excluding aviation, shipping, and biogenic sources. About 100 of the highest-emitting urban 43
areas account for approximately 18% of the global carbon footprint (Moran et al. 2018). Globally, the 44
urban share of national CO2-eq emissions increased 6 percentage points, from 56% in 2000 to 62% in 45
2015. 46
ACCEPTED VERSION
SUBJECT TO FIN
AL EDITS
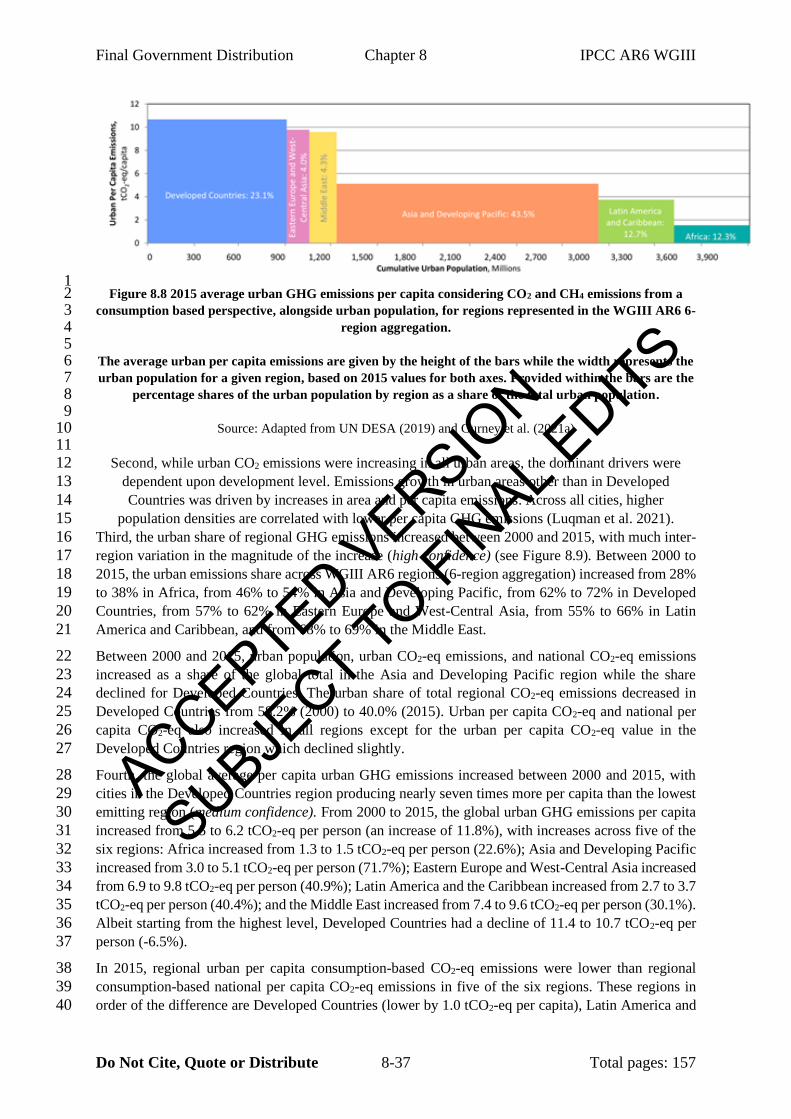
Final Government Distribution Chapter 8 IPCC AR6 WGIII
Do Not Cite, Quote or Distribute 8-37 Total pages: 157
1 Figure 8.8 2015 average urban GHG emissions per capita considering CO2 and CH4 emissions from a 2
consumption based perspective, alongside urban population, for regions represented in the WGIII AR6 6-3 region aggregation. 4
5 The average urban per capita emissions are given by the height of the bars while the width represents the 6 urban population for a given region, based on 2015 values for both axes. Provided within the bars are the 7
percentage shares of the urban population by region as a share of the total urban population. 8 9
Source: Adapted from UN DESA (2019) and Gurney et al. (2021a) 10 11
Second, while urban CO2 emissions were increasing in all urban areas, the dominant drivers were 12
dependent upon development level. Emissions growth in urban areas other than in Developed 13
Countries was driven by increases in area and per capita emissions. Across all cities, higher 14
population densities are correlated with lower per capita GHG emissions (Luqman et al. 2021). 15
Third, the urban share of regional GHG emissions increased between 2000 and 2015, with much inter-16
region variation in the magnitude of the increase (high confidence) (see Figure 8.9). Between 2000 to 17
2015, the urban emissions share across WGIII AR6 regions (6-region aggregation) increased from 28% 18
to 38% in Africa, from 46% to 54% in Asia and Developing Pacific, from 62% to 72% in Developed 19
Countries, from 57% to 62% in Eastern Europe and West-Central Asia, from 55% to 66% in Latin 20
America and Caribbean, and from 68% to 69% in the Middle East. 21
Between 2000 and 2015, urban population, urban CO2-eq emissions, and national CO2-eq emissions 22
increased as a share of the global total in the Asia and Developing Pacific region while the share 23
declined for Developed Countries. The urban share of total regional CO2-eq emissions decreased in 24
Developed Countries from 58.2% (2000) to 40.0% (2015). Urban per capita CO2-eq and national per 25
capita CO2-eq also increased in all regions except for the urban per capita CO2-eq value in the 26
Developed Countries region which declined slightly. 27
Fourth, the global average per capita urban GHG emissions increased between 2000 and 2015, with 28
cities in the Developed Countries region producing nearly seven times more per capita than the lowest 29
emitting region (medium confidence). From 2000 to 2015, the global urban GHG emissions per capita 30
increased from 5.5 to 6.2 tCO2-eq per person (an increase of 11.8%), with increases across five of the 31
six regions: Africa increased from 1.3 to 1.5 tCO2-eq per person (22.6%); Asia and Developing Pacific 32
increased from 3.0 to 5.1 tCO2-eq per person (71.7%); Eastern Europe and West-Central Asia increased 33
from 6.9 to 9.8 tCO2-eq per person (40.9%); Latin America and the Caribbean increased from 2.7 to 3.7 34
tCO2-eq per person (40.4%); and the Middle East increased from 7.4 to 9.6 tCO2-eq per person (30.1%). 35
Albeit starting from the highest level, Developed Countries had a decline of 11.4 to 10.7 tCO2-eq per 36
person (-6.5%). 37
In 2015, regional urban per capita consumption-based CO2-eq emissions were lower than regional 38
consumption-based national per capita CO2-eq emissions in five of the six regions. These regions in 39
order of the difference are Developed Countries (lower by 1.0 tCO2-eq per capita), Latin America and 40
ACCEPTED VERSION
SUBJECT TO FIN
AL EDITS
Final Government Distribution Chapter 8 IPCC AR6 WGIII
Do Not Cite, Quote or Distribute 8-38 Total pages: 157
Caribbean (lower by 0.8 tCO2-eq per capita), Eastern Europe and West-Central Asia (lower by 0.7 tCO2-1
eq per capita), Middle East (lower by 0.4 tCO2-eq per capita), and Africa (lower by 0.2 tCO2-eq per 2
capita), while higher only in the Asia and Developing Pacific region (higher by 0.9 tCO2-eq per capita). 3
All regions show convergence of the urban and national per capita CO2-eq, as the urban share of national 4
emissions increases and dominates the regional total. 5
6
7
Figure 8.9 Changes in six metrics associated with urban and national-scale CO2 and CH4 emissions 8 represented in the WGIII AR6 6-region aggregation, with (a) 2000 and (b) 2015 9
10 The trends in Luqman et al. (2021) were combined with the work of Moran et al. (2018) to estimate the 11 regional urban CO2-eq share of global urban emissions, the urban share of national CO2-eq emissions, 12 and the urban per capita CO2-eq emissions by region. The total values exclude aviation, shipping, and 13
biogenic sources. The dashed grey line represents the global average urban per capita CO2-eq emissions. 14
ACCEPTED VERSION
SUBJECT TO FIN
AL EDITS
Final Government Distribution Chapter 8 IPCC AR6 WGIII
Do Not Cite, Quote or Distribute 8-39 Total pages: 157
The regional urban population share, regional CO2-eq share in total emissions, and national per capita 1 CO2-eq emissions by region are given for comparison. 2
3 Source: Adapted from Gurney et al. (2021) 4
5
START BOX 8.1 HERE 6
7
Box 8.1 Does urbanization drive emissions? 8 9 Urbanization can drive emissions if the process is accompanied by an income increase and higher levels 10
of consumption (Sudmant et al. 2018). This is typically observed in countries with a large urban-rural 11
disparity in income and basic services, and where urbanization is accompanied by economic growth 12
that is coupled to emissions. In addition, the outward expansion of urban land areas often results in the 13
conversion and loss of agricultural land (Pandey et al. 2018; Liu et al. 2019), forests (Austin et al. 2019), 14
and other vegetated areas, thereby reducing carbon uptake and storage (Quesada et al. 2018) (see 15
Section 8.3.1). Furthermore, the build-up and use of urban infrastructure (e.g., buildings, power, 16
sanitation) requires large amounts of embodied energy and carbon (see Figures 8.17 and 8.22). Building 17
new and upgrading existing urban infrastructure could produce a cumulative emissions of 226 GtCO2 18
by 2050 (Bai et al. 2018). 19
However, for the same level of consumption and basic services, an average urban dweller often requires 20
less energy than their rural counterparts, due to higher population densities that enable sharing of 21
infrastructure and services, and economies of scale. Whether and to what extent such emission reduction 22
potentials can be realized depends on how cities are designed and laid out (i.e., urban form – see Section 23
8.4.2) as well as how urban infrastructure is built and powered, such as the energy intensity of the city’s 24
transportation system, type and level of urban services, the share of renewable energy, as well as the 25
broader national and international economic and energy structure that supports the function of the cities 26
(see Sections 8.4.3 and 8.6). 27
Although population-dense cities can be more efficient than rural areas in terms of per capita energy 28
use, and cities contribute less GHG emissions per person than low-density suburbs (Jones and Kammen 29
2014), there is some, albeit limited, evidence that larger cities are not more efficient than smaller ones 30
(Fragkias et al. 2013; Ribeiro et al. 2019). A number of studies comparing urban and rural residents in 31
the same country have shown that urban residents have higher per capita energy consumption and CO2 32
emissions (Chen et al. 2019a; Hachaichi and Baouni 2021). There is some evidence that the benefits of 33
higher urban densities on reducing per capita urban GHG emissions may be offset by higher incomes, 34
smaller household sizes, and, most importantly, higher consumption levels, thus creating a counter-35
effect that could increase GHG emissions with urbanization (Gill and Moeller 2018). 36
Many studies have shown that the relationship between urbanization and GHG emissions is dependent 37
on the level and stage of urban development, and follows an inverted U-shaped relationship of the 38
environmental Kuznets curve (Wang et al. 2016, 2022; Zhang et al. 2017; Xu et al. 2018a; Zhou et al. 39
2019) (see Sections 8.3.1 and 8.6, and Figure 8.20). Considering existing trends, earlier phases of 40
urbanization accompanied by rapid industrialization, development of secondary industries, and high 41
levels of economic growth, are correlated with higher levels of energy consumption and GHG 42
emissions. However, more mature phases of urbanization, with higher levels of economic development 43
and establishment of the service sector, are correlated with lower levels of energy consumption and 44
GHG emissions (Khan and Su 2021). 45
END BOX 8.1 HERE 46
47
ACCEPTED VERSION
SUBJECT TO FIN
AL EDITS
Final Government Distribution Chapter 8 IPCC AR6 WGIII
Do Not Cite, Quote or Distribute 8-40 Total pages: 157
8.3.4 Scenarios of future urbanization and GHG emissions 1
This section assesses scenarios of future urban land expansion and urban GHG emissions. These 2
scenarios have implications for the urban climate change mitigation strategies discussed in Sections 8.4 3
and 8.6—in particular, in the context of the potential mitigation and development pathways for urban 4
areas under certain scenarios. 5
8.3.4.1 Urban land expansion and GHG emissions 6
The uncertainties across urban land expansion forecasts, and associated SSPs, highlight an opportunity 7
to pursue compact, low- or net zero GHG emissions development that minimizes land-use competition, 8
avoids carbon lock-in, and preserves carbon-sequestering areas like forests and grasslands (see Sections 9
8.4. and 8.6, and Figure 8.21). Among the forecasts available are six global-scale spatially explicit 10
studies of urban land expansion that have been published since AR5; four of the six, which present 11
forecasts for each of the five SSPs, are considered in Table 8.1 and Figure 8.10 (Huang et al. 2019; Li 12
et al. 2019b; Chen et al. 2020a; Gao and O’Neill 2020). All four have forecasts to 2050 but only three 13
to 2100. One of the two not included here (van Vliet et al. 2017) also forecasts land displacement due 14
to urban land expansion. 15
Four overarching findings can be gleaned from these studies. 16
First, urban land areas will expand significantly by 2050—by as much as 211% (see SSP5 forecast in 17
Huang et al. 2019), but likely within a large potential range of about 43–106% over the 2015 extent by 18
2050—to accommodate the growing urban population (see Table 8.1). Globally, there are large 19
uncertainties and variations among the studies—and between the SSPs—about the rates and extent of 20
future urban expansion, owing to uncertainties about economic development and population growth 21
(ranges of estimates are provided in Table 8.1). Overall, the largest urban extents are forecasted under 22
SSP5 (fossil fuel-intensive development) for both 2050 and 2100, whereas the smallest forecasted urban 23
extents are under SSP3 (‘regional rivalry’). Forecasted global urban extents could reach between 1 and 24
2.2 million km2 (median of 1.4 million km2, a 106% increase) in 2050 under SSP5, and between 0.85 25
and 1.5 million km2 (median of 1 million km2, a 43% increase) in 2050 under SSP3. Under SSP1, which 26
is characterized by a focus on sustainability with more compact, low-emissions development, urban 27
extents could reach 1 million km2 (range of 0.9 to 2 million km2), a 49% increase, in 2050. By 2100, 28
the forecasted urban extents reach between 1.4 and 3.6 million km2 (median 2.5 million km2) under 29
SSP5 and between 1 and 1.5 million km2 (median 1.3 million km2) under SSP3. Across the studies, 30
substantially larger amounts of urban land expansion are expected after 2050 under SSP5 compared to 31
other SSPs. 32
Second, there is a wide variation in estimates of urban land expansion across regions (using the WGIII 33
AR6 6-region aggregation). Across all four sets of forecasts, current urban land (circa 2015) is the 34
largest in Developed Countries and in the Asia and Developing Pacific region, with approximately two-35
thirds of the current urban extent occurring in those two regions (see Table 8.1 and Figure 8.10). The 36
largest increases in urban land by 2050 are expected in the Asia and Developing Pacific and Developed 37
Countries regions, across all the SSPs. However, the rate of increase in urban land in Eastern Europe 38
and West-Central Asia, Latin America and the Caribbean, and the Middle East is significant and urban 39
land could more than double by 2050. One-third of the studies conclude that the United States, China, 40
and India will experience continued urban land expansion at least until 2050 (Huang et al. 2019; Li et 41
al. 2019b). However, Li et al. (2019) report that, after 2050, China could experience a decrease in the 42
rate of urban land expansion, while growth will continue for India. This is not surprising since India’s 43
urban demographic transition will only get underway after the middle of the century, when the urban 44
population is expected to exceed the rural population. In contrast, China’s urban demographic transition 45
could be nearly complete by 2050. 46
ACCEPTED VERSION
SUBJECT TO FIN
AL EDITS
Final Government Distribution Chapter 8 IPCC AR6 WGIII
Do Not Cite, Quote or Distribute 8-41 Total pages: 157
Third, in spite of these general trends, there are differences in forecasted urban expansion in each region 1
across the SSPs and studies, with Huang et al. (2019) forecasting the most future urban land expansion 2
between 2015 and 2050. The range across studies is significant. Under SSP1, urban land areas could 3
increase by between 69,000 and 459,000 km2 in Developed Countries, 77,000–417,000 km2 in Asia and 4
Developing Pacific, and 28,000–216,000 km2 in Africa. Under SSP3, where urban land expansion is 5
forecasted to be the lowest, urban land areas could increase by between 23,000 and 291,000 km2 in 6
Developed Countries, 57,000–168,000 km2 in Asia and Developing Pacific, and 16,000–149,000 km2 7
in Africa. Under SSP5, where urban land expansion is forecasted to be the highest, urban land area 8
could increase by 129,000 to 573,000 km2 in Developed Countries, 83,000–472,000 km2 in Asia and 9
Developing Pacific, and 40,000–222,000 km2 in Africa (Huang et al. 2019; Li et al. 2019b; Chen et al. 10
2020a; Gao and O’Neill 2020). By 2100, however, the Developed Countries region is expected to have 11
the most urban expansion only in SSP5. In SSP2 and SSP4, the Developed Countries and Asia and 12
Developing Pacific regions have about equal amounts of new urban land; in SSP3, Asia and Developing 13
Pacific has more new urban land forecasted. 14
Fourth, both the range of estimates and their implications on land-use competition and urban life point 15
to an opportunity for urban areas to consider their urban form when developing. Under the current 16
urbanization trajectory, 50–63% of newly expanded urban areas are expected to occur on current 17
croplands (Chen et al. 2020a). However, there is significant regional variation; between 2000 and 2040, 18
12.5% of cropland in China and 7.5% of cropland in the Middle East and North Africa could be 19
displaced due to urban expansion, compared to the world average of 3.7% (van Vliet et al. 2017). As 20
urban clusters increase in size and green space is converted, future urban land expansion is expected to 21
intensify UHIs and exacerbate night-time extreme temperatures. An urban footprint increase of 78–22
171% by 2050 over the urban footprint in 2015 is expected to result in average summer daytime and 23
night-time warming in air temperature of 0.5°C–0.7°C, even up to about 3°C in certain locations (Huang 24
et al. 2019). Furthermore, this urban expansion-induced warming is on average about half—and in 25
certain locations nearly twice—as strong as warming that will be caused by GHG emissions based on 26
the multi-model ensemble average forecasts in RCP4.5. In short, future urban expansion will amplify 27
the background warming caused by GHG emissions, with extreme warming most pronounced during 28
night-time (very high confidence) (Huang et al. 2019). These findings corroborate those in the Technical 29
Summary of AR6 WGI (Arias et al. 2021). 30
The forecasted amounts and patterns of urban expansion presented here bear significant uncertainty due 31
to underlying factors beyond mere methodological differences between the studies. These factors 32
include potential changes in the social, economic, and institutional dynamics that drive urban land 33
development across the world (Güneralp and Seto 2013). Some of these changes may come in the form 34
of sudden shocks such as another global economic crisis or pandemic. The forecasts presented here do 35
not take such factors into account. 36
37
38
39
40
41
42
43
44
45
ACCEPTED VERSION
SUBJECT TO FIN
AL EDITS
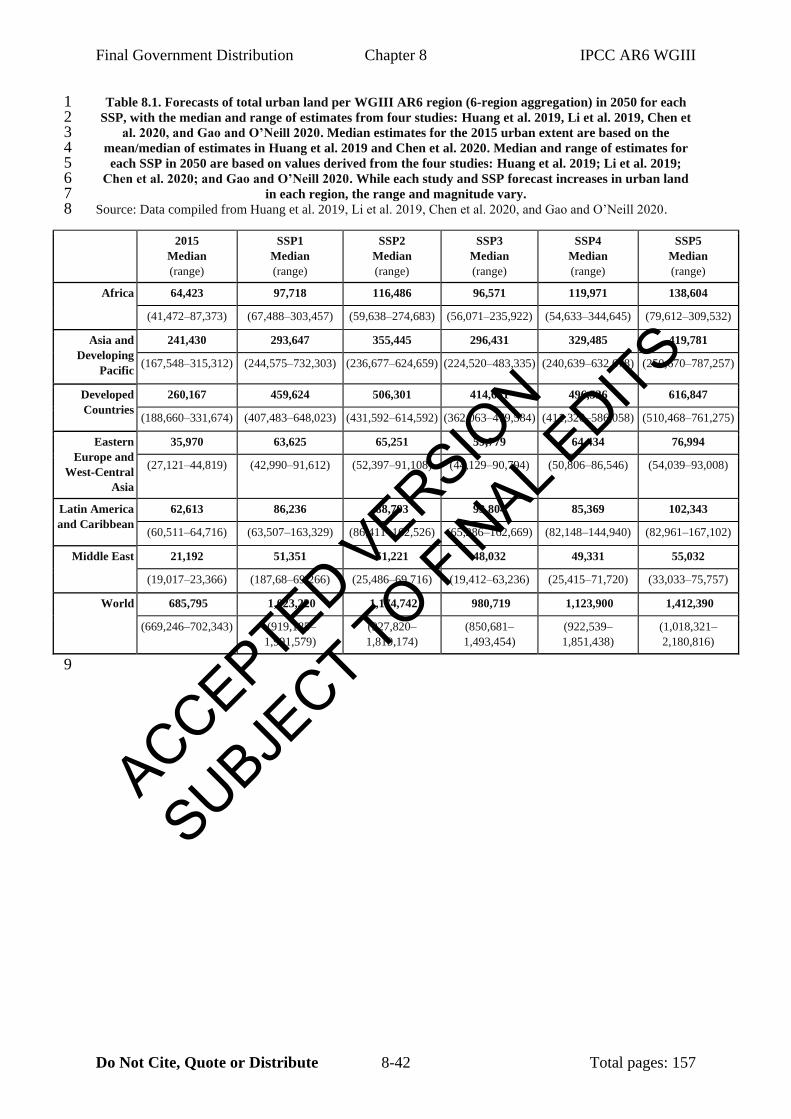
Final Government Distribution Chapter 8 IPCC AR6 WGIII
Do Not Cite, Quote or Distribute 8-42 Total pages: 157
Table 8.1. Forecasts of total urban land per WGIII AR6 region (6-region aggregation) in 2050 for each 1 SSP, with the median and range of estimates from four studies: Huang et al. 2019, Li et al. 2019, Chen et 2
al. 2020, and Gao and O’Neill 2020. Median estimates for the 2015 urban extent are based on the 3 mean/median of estimates in Huang et al. 2019 and Chen et al. 2020. Median and range of estimates for 4 each SSP in 2050 are based on values derived from the four studies: Huang et al. 2019; Li et al. 2019; 5
Chen et al. 2020; and Gao and O’Neill 2020. While each study and SSP forecast increases in urban land 6 in each region, the range and magnitude vary. 7
Source: Data compiled from Huang et al. 2019, Li et al. 2019, Chen et al. 2020, and Gao and O’Neill 2020. 8
2015
Median
(range)
SSP1
Median
(range)
SSP2
Median
(range)
SSP3
Median
(range)
SSP4
Median
(range)
SSP5
Median
(range)
Africa 64,423 97,718 116,486 96,571 119,971 138,604
(41,472–87,373) (67,488–303,457) (59,638–274,683) (56,071–235,922) (54,633–344,645) (79,612–309,532)
Asia and
Developing
Pacific
241,430 293,647 355,445 296,431 329,485 419,781
(167,548–315,312) (244,575–732,303) (236,677–624,659) (224,520–483,335) (240,639–632,678) (250,670–787,257)
Developed
Countries
260,167 459,624 506,301 414,661 496,526 616,847
(188,660–331,674) (407,483–648,023) (431,592–614,592) (362,063–479,584) (411,320–586,058) (510,468–761,275)
Eastern
Europe and
West-Central
Asia
35,970 63,625 65,251 59,779 64,434 76,994
(27,121–44,819) (42,990–91,612) (52,397–91,108) (44,129–90,794) (50,806–86,546) (54,039–93,008)
Latin America
and Caribbean
62,613 86,236 88,793 93,804 85,369 102,343
(60,511–64,716) (63,507–163,329) (86,411–162,526) (65,286–162,669) (82,148–144,940) (82,961–167,102)
Middle East 21,192 51,351 51,221 48,032 49,331 55,032
(19,017–23,366) (187,68–69,266) (25,486–69,716) (19,412–63,236) (25,415–71,720) (33,033–75,757)
World 685,795 1,023,220 1,174,742 980,719 1,123,900 1,412,390
(669,246–702,343) (919,185–
1,991,579)
(927,820–
1,819,174)
(850,681–
1,493,454)
(922,539–
1,851,438)
(1,018,321–
2,180,816)
9
ACCEPTED VERSION
SUBJECT TO FIN
AL EDITS
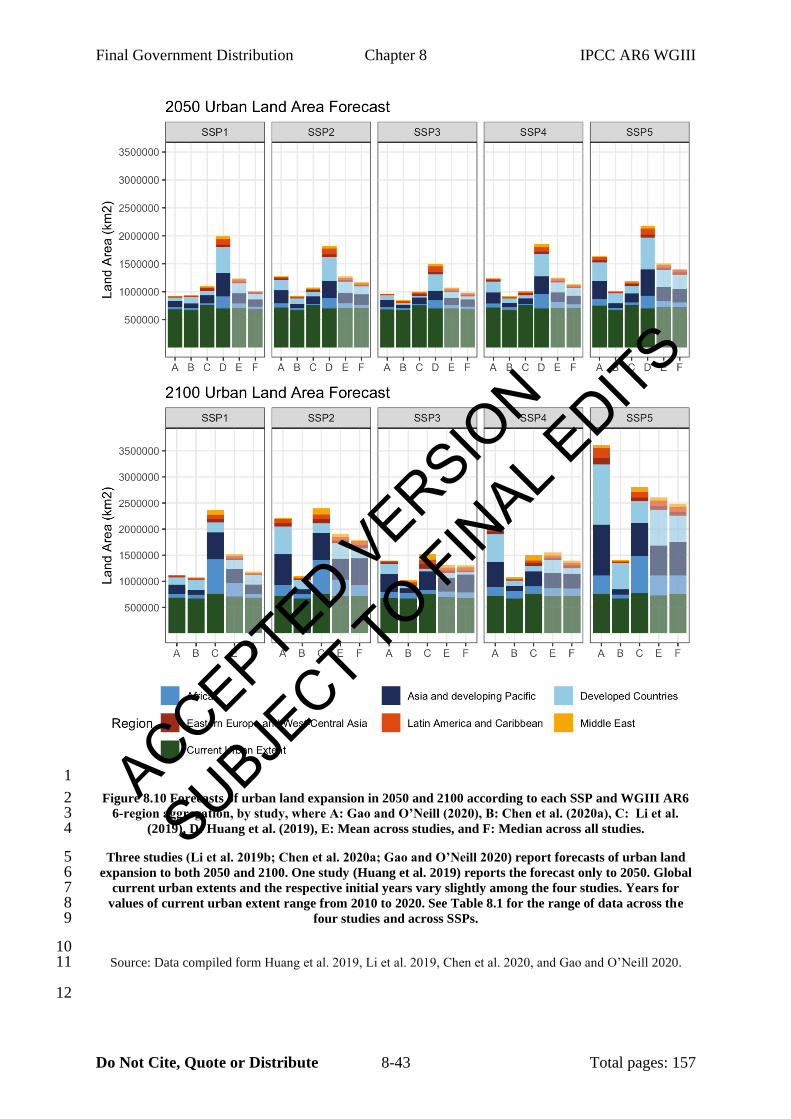
Final Government Distribution Chapter 8 IPCC AR6 WGIII
Do Not Cite, Quote or Distribute 8-43 Total pages: 157
1
Figure 8.10 Forecasts of urban land expansion in 2050 and 2100 according to each SSP and WGIII AR6 2 6-region aggregation, by study, where A: Gao and O’Neill (2020), B: Chen et al. (2020a), C: Li et al. 3
(2019), D: Huang et al. (2019), E: Mean across studies, and F: Median across all studies. 4
Three studies (Li et al. 2019b; Chen et al. 2020a; Gao and O’Neill 2020) report forecasts of urban land 5 expansion to both 2050 and 2100. One study (Huang et al. 2019) reports the forecast only to 2050. Global 6
current urban extents and the respective initial years vary slightly among the four studies. Years for 7 values of current urban extent range from 2010 to 2020. See Table 8.1 for the range of data across the 8
four studies and across SSPs. 9
10 Source: Data compiled form Huang et al. 2019, Li et al. 2019, Chen et al. 2020, and Gao and O’Neill 2020. 11
12
ACCEPTED VERSION
SUBJECT TO FIN
AL EDITS

Final Government Distribution Chapter 8 IPCC AR6 WGIII
Do Not Cite, Quote or Distribute 8-44 Total pages: 157
8.3.4.2 Scenarios of future urban GHG emissions 1
There remains little globally comprehensive literature on projections of future baseline GHG emissions 2
from urban areas or scenarios deploying urban mitigation actions on the part of city or regional 3
governments. This dearth of research rests on limited urban emissions data that are consistent and 4
comparable across the globe, making review and synthesis challenging (Creutzig et al. 2016b). Some 5
research has presented urban emissions forecasts and related projections, including estimated urban 6
energy use in 2050 (Creutzig et al. 2015), energy savings for low-carbon development (Creutzig et al. 7
2016b), emission savings from existing and new infrastructure (Creutzig et al. 2016a) (see Figure 8.12), 8
and urban emissions from buildings, transport, industry, and agriculture (IEA 2016a). 9
In its study of about 700 urban areas with a population of at least 750,000, the Coalition for Urban 10
Transitions (2019), attempts to quantify the urban portion of global GHG emissions, including the 11
residential and commercial building, transport, waste, and material production (focusing on cement, 12
aluminium, and steel) sectors, along with mitigation wedges aimed at staying below a 2°C level of 13
atmospheric warming (Figure 8.11). Starting in 2015 with a global urban emissions total of almost 14 14
GtCO2-eq, the study projects an increase to 17.3 GtCO2-eq by 2050—but this reduces to 1.8 GtCO2-eq 15
by 2050 with the inclusion of mitigation wedges: 58% from buildings, 21% from transport, 15% 16
materials efficiency, and 5% waste, with decarbonization of electricity supply as a cross-cutting strategy 17
across the wedges. 18
Similar analysis by the urban networks C40 and GCoM examine current and future GHG emissions on 19
smaller subsets of global cities, offering further insight on the potential emissions impacts of urban 20
mitigation options. However, this analysis is limited to just a sample of the global urban landscape and 21
primarily focused on cities in the Global North (GCoM 2018, 2019; C40 Cities et al. 2019) with methods 22
to project avoided emissions in development (Kovac et al. 2020). Different scopes of analysis between 23
sectors, as well as limited knowledge of the impact of existing and new urban infrastructure, limit the 24
possibility of direct comparisons in emissions. Still, the shares of urban mitigation potential ranges 25
between 77.7% and 78.9% for combined strategies that involve decarbonized buildings and transport 26
in urban infrastructure, and the wedges approach the remaining emissions reductions also considering 27
construction materials and waste. This data supports urban areas pursuing a package of multiple, 28
integrated mitigation strategies in planning for decarbonization (see Sections 8.4 and 8.6, and Figure 29
8.21). 30
31
ACCEPTED VERSION
SUBJECT TO FIN
AL EDITS
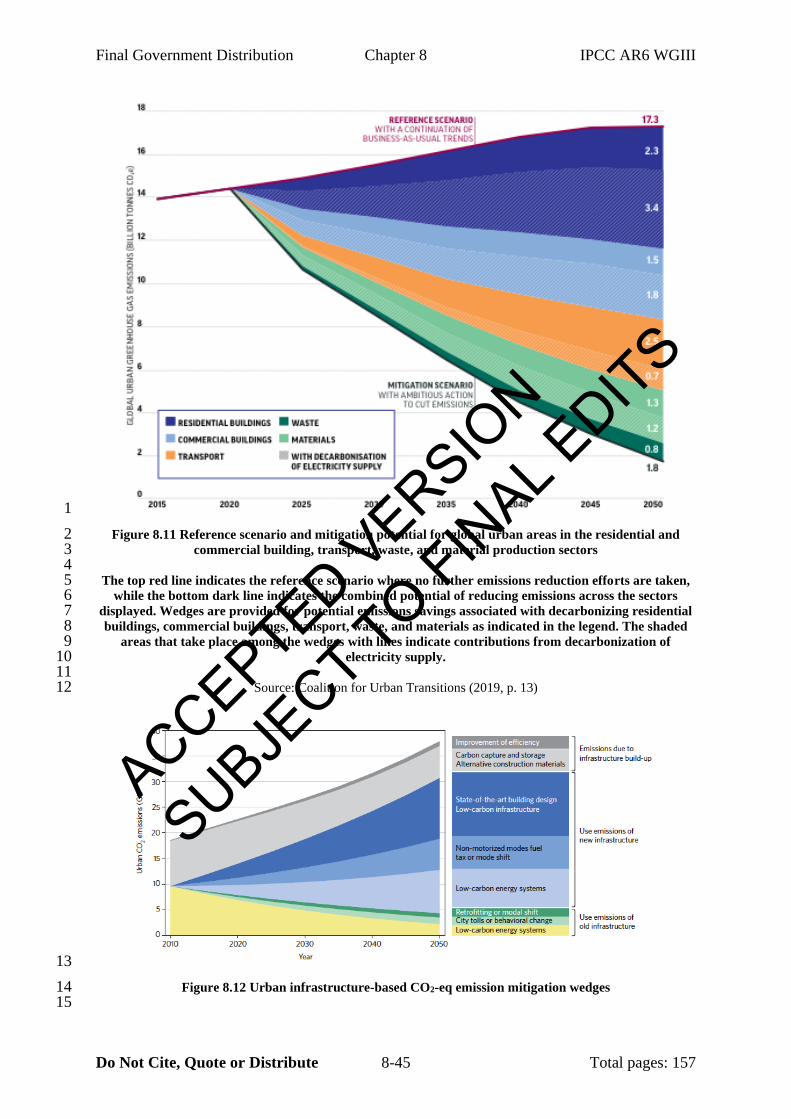
Final Government Distribution Chapter 8 IPCC AR6 WGIII
Do Not Cite, Quote or Distribute 8-45 Total pages: 157
1
Figure 8.11 Reference scenario and mitigation potential for global urban areas in the residential and 2 commercial building, transport, waste, and material production sectors 3
4 The top red line indicates the reference scenario where no further emissions reduction efforts are taken, 5
while the bottom dark line indicates the combined potential of reducing emissions across the sectors 6 displayed. Wedges are provided for potential emissions savings associated with decarbonizing residential 7 buildings, commercial buildings, transport, waste, and materials as indicated in the legend. The shaded 8
areas that take place among the wedges with lines indicate contributions from decarbonization of 9 electricity supply. 10
11 Source: Coalition for Urban Transitions (2019, p. 13) 12
13
Figure 8.12 Urban infrastructure-based CO2-eq emission mitigation wedges 14 15
ACCEPTED VERSION
SUBJECT TO FIN
AL EDITS
Final Government Distribution Chapter 8 IPCC AR6 WGIII
Do Not Cite, Quote or Distribute 8-46 Total pages: 157
Urban infrastructure-based CO2-eq emission mitigation wedges across categories of existing 1 (yellow/green), new (blue), and construction (grey) of urban infrastructure. The wedges include low-2
carbon energy systems and infrastructure, modal shift, tolls/tax, or behavioural change, and reductions 3 from construction materials. 4
5 Source: Creutzig et al. (2016a, p. 1056) 6
7
The most comprehensive approach to-date for quantifying urban emissions within the global context 8
(Gurney et al. 2021a) combines the per capita carbon footprint estimates for 13,000 cities from Moran 9
et al. (2018) with projections of the share of urban population (Jiang and O’Neill 2017) within the 10
IPCCs SSP-RCP framework (van Vuuren et al. 2014, 2017a; Riahi et al. 2017). Urban emissions in 11
seven SSP-RCP scenarios are shown in Figure 8.13 along with an estimate of the global total CO2-eq 12
for context. 13
In 2020, total urban emissions (including CO2 and CH4) derived from consumption-based accounting 14
were estimated to be 28.5 ± 0.1 GtCO2-eq, representing between 67% and 72% of global CO2 and CH4 15
emissions, excluding aviation, shipping, and biogenic sources of emissions. By 2050, with no or 16
moderate urban mitigation efforts, urban emissions are projected to rise to 34–65 GtCO2-eq—driven by 17
growing urban population, infrastructure, and service demands. However, scenarios that involve rapid 18
urbanization can have different outcomes as seen in SSP1-RCP1.9 based on green growth, versus SSP5-19
RCP8.5 with the strongest carbon lock-in lacking any decarbonization. Other scenarios involve mixed 20
and/or low urbanization, along with other differences, including the implementation of electrification, 21
energy, and material efficiency, technology development and innovation, renewable energy 22
preferences, and behavioural, lifestyle, and dietary responses (see Table 8.2). With aggressive and 23
immediate mitigation policies to limit global warming below 1.5°C by the end of the century, urban 24
GHG emissions could approach net zero and reach a maximum of 3.3 GtCO2-eq in 2050, compared to 25
28.6 GtCO2-eq in 2020 (SSP1-RCP1.9). Under aggressive but not immediate urban mitigation policies 26
to limit global warming to 2°C, urban emissions could reach 17.2 GtCO2-eq in 2050 (SSP1-RCP2.6). 27
When 2020 levels are compared to the values for the year 2030, urban areas that utilize multiple 28
opportunities towards resource-efficient and walkable urbanization are estimated to represent a savings 29
potential of 9.8 GtCO2-eq of urban emissions, under SSP1-RCP1.9 scenario conditions, on the path 30
towards net zero CO2 and CH4 emissions. In contrast, urban emissions would increase by 3.4 GtCO2-31
eq from 2020 levels in 2030 under SSP2-RCP4.5 scenario conditions with moderate changes lacking 32
ambitious mitigation action (see Figure 8.14). 33
ACCEPTED VERSION
SUBJECT TO FIN
AL EDITS
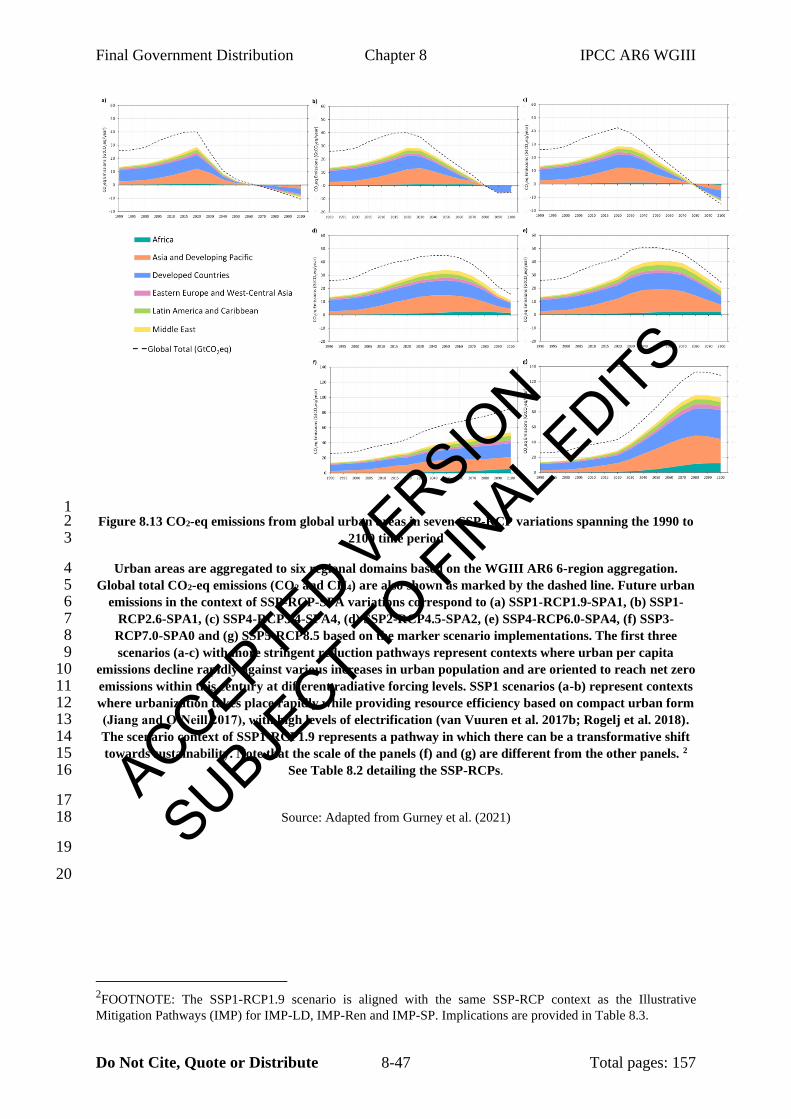
Final Government Distribution Chapter 8 IPCC AR6 WGIII
Do Not Cite, Quote or Distribute 8-47 Total pages: 157
1 Figure 8.13 CO2-eq emissions from global urban areas in seven SSP-RCP variations spanning the 1990 to 2
2100 time period 3
Urban areas are aggregated to six regional domains based on the WGIII AR6 6-region aggregation. 4 Global total CO2-eq emissions (CO2 and CH4) are also shown as marked by the dashed line. Future urban 5
emissions in the context of SSP-RCP-SPA variations correspond to (a) SSP1-RCP1.9-SPA1, (b) SSP1-6 RCP2.6-SPA1, (c) SSP4-RCP3.4-SPA4, (d) SSP2-RCP4.5-SPA2, (e) SSP4-RCP6.0-SPA4, (f) SSP3-7
RCP7.0-SPA0 and (g) SSP5-RCP8.5 based on the marker scenario implementations. The first three 8 scenarios (a-c) with more stringent reduction pathways represent contexts where urban per capita 9
emissions decline rapidly against various increases in urban population and are oriented to reach net zero 10 emissions within this century at different radiative forcing levels. SSP1 scenarios (a-b) represent contexts 11 where urbanization takes place rapidly while providing resource efficiency based on compact urban form 12 (Jiang and O’Neill 2017), with high levels of electrification (van Vuuren et al. 2017b; Rogelj et al. 2018). 13 The scenario context of SSP1-RCP1.9 represents a pathway in which there can be a transformative shift 14 towards sustainability. Note that the scale of the panels (f) and (g) are different from the other panels. 2 15
See Table 8.2 detailing the SSP-RCPs. 16
17 Source: Adapted from Gurney et al. (2021) 18
19
20
2FOOTNOTE: The SSP1-RCP1.9 scenario is aligned with the same SSP-RCP context as the Illustrative
Mitigation Pathways (IMP) for IMP-LD, IMP-Ren and IMP-SP. Implications are provided in Table 8.3.
ACCEPTED VERSION
SUBJECT TO FIN
AL EDITS
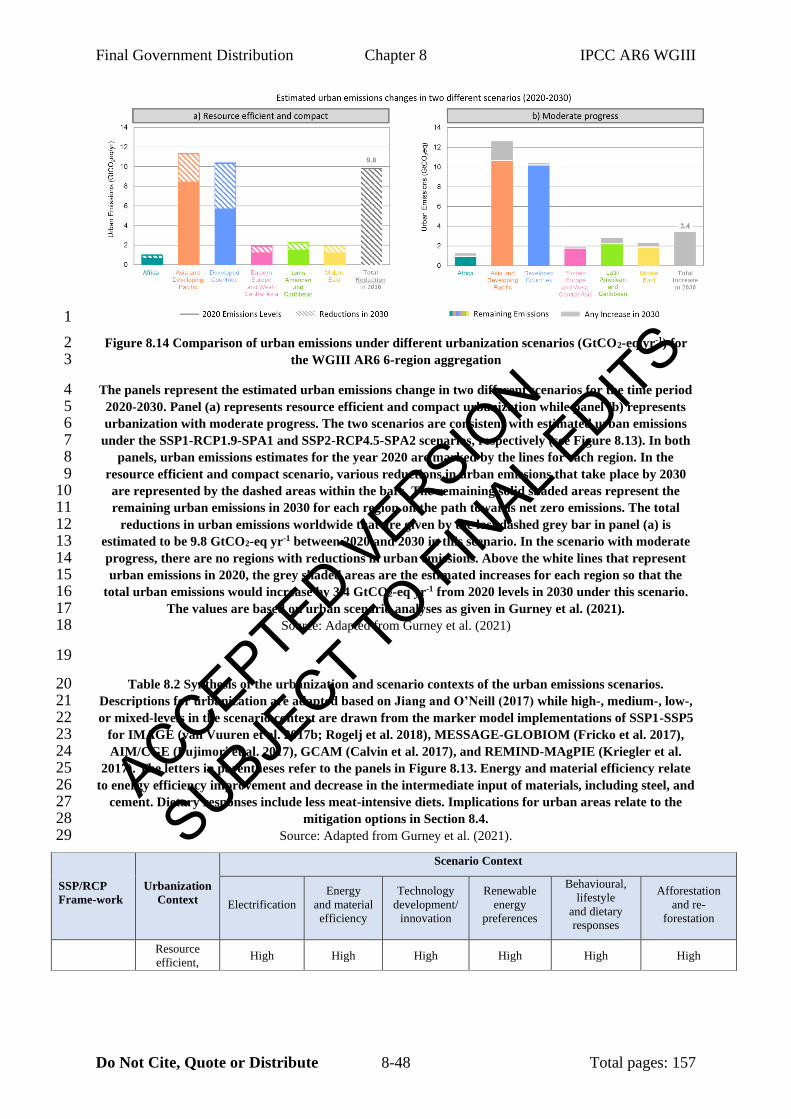
Final Government Distribution Chapter 8 IPCC AR6 WGIII
Do Not Cite, Quote or Distribute 8-48 Total pages: 157
1
Figure 8.14 Comparison of urban emissions under different urbanization scenarios (GtCO2-eq yr-1) for 2 the WGIII AR6 6-region aggregation 3
The panels represent the estimated urban emissions change in two different scenarios for the time period 4 2020-2030. Panel (a) represents resource efficient and compact urbanization while panel (b) represents 5 urbanization with moderate progress. The two scenarios are consistent with estimated urban emissions 6
under the SSP1-RCP1.9-SPA1 and SSP2-RCP4.5-SPA2 scenarios, respectively (see Figure 8.13). In both 7 panels, urban emissions estimates for the year 2020 are marked by the lines for each region. In the 8
resource efficient and compact scenario, various reductions in urban emissions that take place by 2030 9 are represented by the dashed areas within the bars. The remaining solid shaded areas represent the 10 remaining urban emissions in 2030 for each region on the path towards net zero emissions. The total 11
reductions in urban emissions worldwide that are given by the last dashed grey bar in panel (a) is 12 estimated to be 9.8 GtCO2-eq yr-1 between 2020 and 2030 in this scenario. In the scenario with moderate 13 progress, there are no regions with reductions in urban emissions. Above the white lines that represent 14 urban emissions in 2020, the grey shaded areas are the estimated increases for each region so that the 15
total urban emissions would increase by 3.4 GtCO2-eq yr-1 from 2020 levels in 2030 under this scenario. 16 The values are based on urban scenario analyses as given in Gurney et al. (2021). 17
Source: Adapted from Gurney et al. (2021) 18
19
Table 8.2 Synthesis of the urbanization and scenario contexts of the urban emissions scenarios. 20 Descriptions for urbanization are adapted based on Jiang and O’Neill (2017) while high-, medium-, low-, 21 or mixed-levels in the scenario context are drawn from the marker model implementations of SSP1-SSP5 22
for IMAGE (van Vuuren et al. 2017b; Rogelj et al. 2018), MESSAGE-GLOBIOM (Fricko et al. 2017), 23 AIM/CGE (Fujimori et al. 2017), GCAM (Calvin et al. 2017), and REMIND-MAgPIE (Kriegler et al. 24
2017). The letters in parentheses refer to the panels in Figure 8.13. Energy and material efficiency relate 25 to energy efficiency improvement and decrease in the intermediate input of materials, including steel, and 26
cement. Dietary responses include less meat-intensive diets. Implications for urban areas relate to the 27 mitigation options in Section 8.4. 28
Source: Adapted from Gurney et al. (2021). 29
SSP/RCP
Frame-work
Urbanization
Context
Scenario Context
Electrification
Energy
and material
efficiency
Technology
development/
innovation
Renewable
energy
preferences
Behavioural,
lifestyle
and dietary
responses
Afforestation
and re-
forestation
Resource
efficient, High High High High High High
ACCEPTED VERSION
SUBJECT TO FIN
AL EDITS
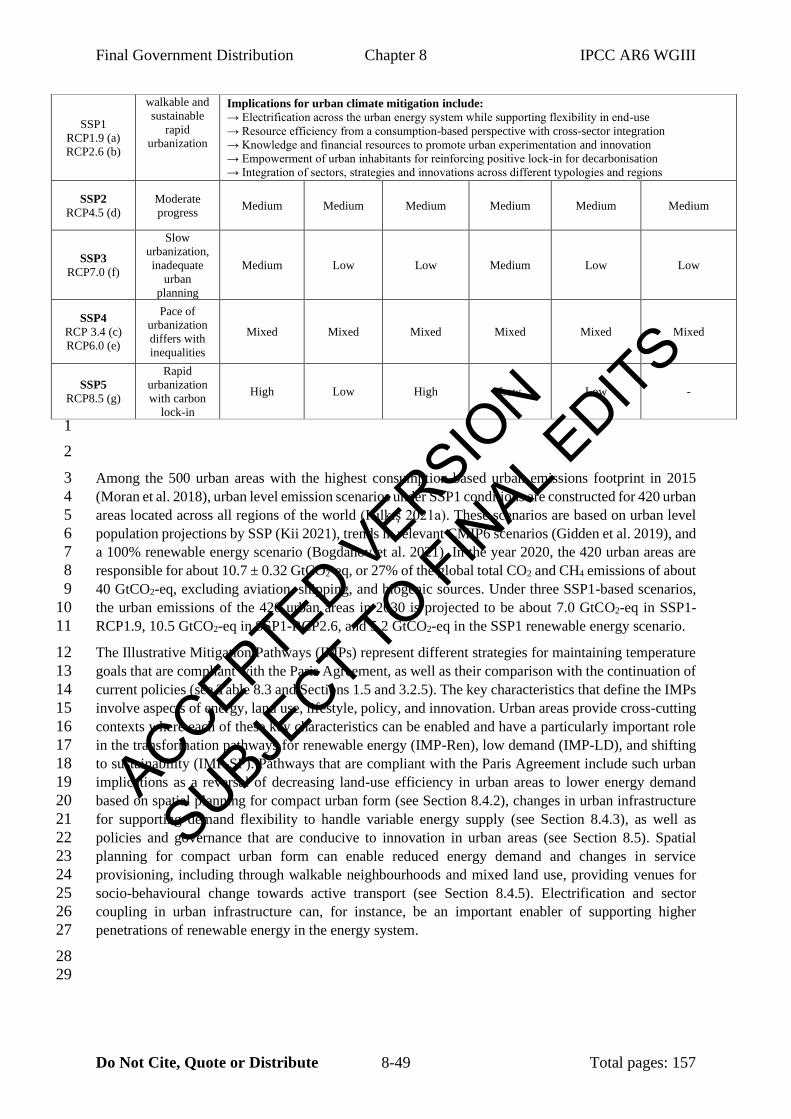
Final Government Distribution Chapter 8 IPCC AR6 WGIII
Do Not Cite, Quote or Distribute 8-49 Total pages: 157
SSP1
RCP1.9 (a)
RCP2.6 (b)
walkable and
sustainable
rapid
urbanization
Implications for urban climate mitigation include:
→ Electrification across the urban energy system while supporting flexibility in end-use
→ Resource efficiency from a consumption-based perspective with cross-sector integration
→ Knowledge and financial resources to promote urban experimentation and innovation
→ Empowerment of urban inhabitants for reinforcing positive lock-in for decarbonisation
→ Integration of sectors, strategies and innovations across different typologies and regions
SSP2
RCP4.5 (d)
Moderate
progress Medium Medium Medium Medium Medium Medium
SSP3
RCP7.0 (f)
Slow
urbanization,
inadequate
urban
planning
Medium Low Low Medium Low Low
SSP4
RCP 3.4 (c)
RCP6.0 (e)
Pace of
urbanization
differs with
inequalities
Mixed Mixed Mixed Mixed Mixed Mixed
SSP5
RCP8.5 (g)
Rapid
urbanization
with carbon
lock-in
High Low High Low Low -
1
2
Among the 500 urban areas with the highest consumption-based urban emissions footprint in 2015 3
(Moran et al. 2018), urban level emission scenarios under SSP1 conditions are constructed for 420 urban 4
areas located across all regions of the world (Kılkış 2021a). These scenarios are based on urban level 5
population projections by SSP (Kii 2021), trends in relevant CMIP6 scenarios (Gidden et al. 2019), and 6
a 100% renewable energy scenario (Bogdanov et al. 2021). In the year 2020, the 420 urban areas are 7
responsible for about 10.7 ± 0.32 GtCO2-eq, or 27% of the global total CO2 and CH4 emissions of about 8
40 GtCO2-eq, excluding aviation, shipping, and biogenic sources. Under three SSP1-based scenarios, 9
the urban emissions of the 420 urban areas in 2030 is projected to be about 7.0 GtCO2-eq in SSP1-10
RCP1.9, 10.5 GtCO2-eq in SSP1-RCP2.6, and 5.2 GtCO2-eq in the SSP1 renewable energy scenario. 11
The Illustrative Mitigation Pathways (IMPs) represent different strategies for maintaining temperature 12
goals that are compliant with the Paris Agreement, as well as their comparison with the continuation of 13
current policies (see Table 8.3 and Sections 1.5 and 3.2.5). The key characteristics that define the IMPs 14
involve aspects of energy, land use, lifestyle, policy, and innovation. Urban areas provide cross-cutting 15
contexts where each of these key characteristics can be enabled and have a particularly important role 16
in the transformation pathways for renewable energy (IMP-Ren), low demand (IMP-LD), and shifting 17
to sustainability (IMP-SP). Pathways that are compliant with the Paris Agreement include such urban 18
implications as a reversal of decreasing land-use efficiency in urban areas to lower energy demand 19
based on spatial planning for compact urban form (see Section 8.4.2), changes in urban infrastructure 20
for supporting demand flexibility to handle variable energy supply (see Section 8.4.3), as well as 21
policies and governance that are conducive to innovation in urban areas (see Section 8.5). Spatial 22
planning for compact urban form can enable reduced energy demand and changes in service 23
provisioning, including through walkable neighbourhoods and mixed land use, providing venues for 24
socio-behavioural change towards active transport (see Section 8.4.5). Electrification and sector 25
coupling in urban infrastructure can, for instance, be an important enabler of supporting higher 26
penetrations of renewable energy in the energy system. 27
28
29
ACCEPTED VERSION
SUBJECT TO FIN
AL EDITS
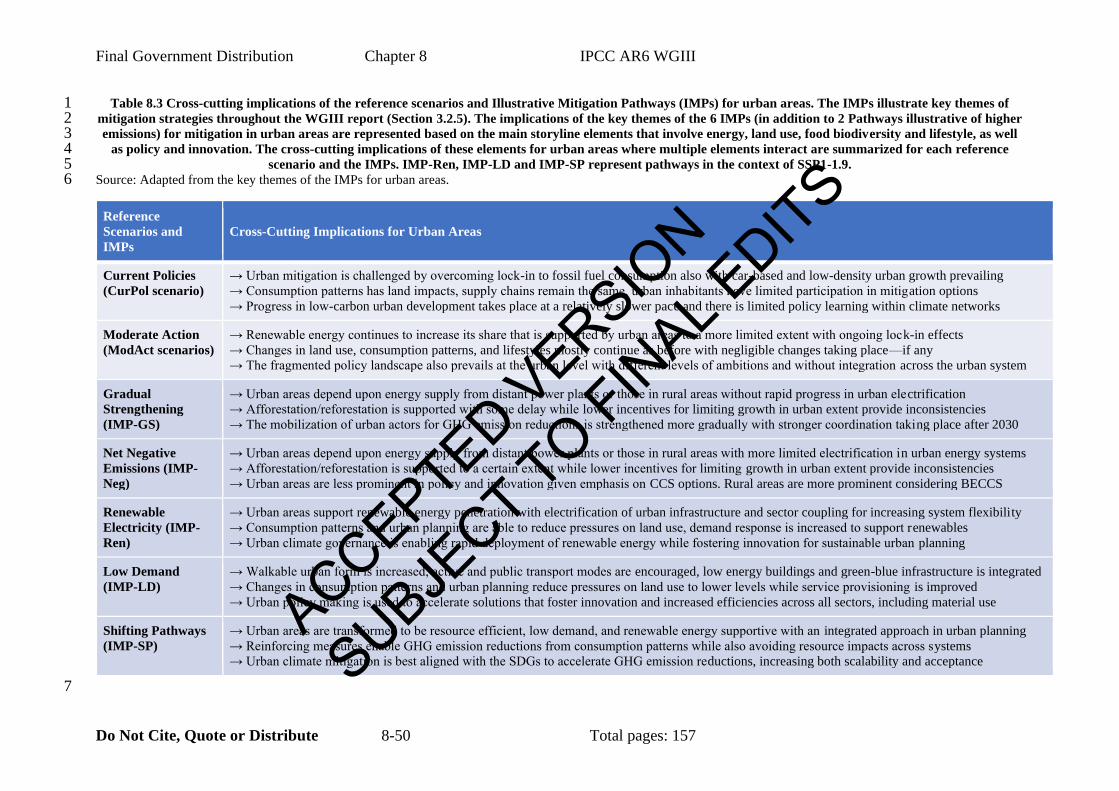
Final Government Distribution Chapter 8 IPCC AR6 WGIII
Do Not Cite, Quote or Distribute 8-50 Total pages: 157
Table 8.3 Cross-cutting implications of the reference scenarios and Illustrative Mitigation Pathways (IMPs) for urban areas. The IMPs illustrate key themes of 1 mitigation strategies throughout the WGIII report (Section 3.2.5). The implications of the key themes of the 6 IMPs (in addition to 2 Pathways illustrative of higher 2 emissions) for mitigation in urban areas are represented based on the main storyline elements that involve energy, land use, food biodiversity and lifestyle, as well 3
as policy and innovation. The cross-cutting implications of these elements for urban areas where multiple elements interact are summarized for each reference 4 scenario and the IMPs. IMP-Ren, IMP-LD and IMP-SP represent pathways in the context of SSP1-1.9. 5
Source: Adapted from the key themes of the IMPs for urban areas. 6
Reference
Scenarios and
IMPs
Cross-Cutting Implications for Urban Areas
Current Policies
(CurPol scenario)
→ Urban mitigation is challenged by overcoming lock-in to fossil fuel consumption also with car-based and low-density urban growth prevailing
→ Consumption patterns has land impacts, supply chains remain the same, urban inhabitants have limited participation in mitigation options
→ Progress in low-carbon urban development takes place at a relatively slower pace and there is limited policy learning within climate networks
Moderate Action
(ModAct scenarios)
→ Renewable energy continues to increase its share that is supported by urban areas to a more limited extent with ongoing lock-in effects
→ Changes in land use, consumption patterns, and lifestyles mostly continue as before with negligible changes taking place—if any
→ The fragmented policy landscape also prevails at the urban level with different levels of ambitions and without integration across the urban system
Gradual
Strengthening
(IMP-GS)
→ Urban areas depend upon energy supply from distant power plants or those in rural areas without rapid progress in urban electrification
→ Afforestation/reforestation is supported with some delay while lower incentives for limiting growth in urban extent provide inconsistencies
→ The mobilization of urban actors for GHG emission reductions is strengthened more gradually with stronger coordination taking place after 2030
Net Negative
Emissions (IMP-
Neg)
→ Urban areas depend upon energy supply from distant power plants or those in rural areas with more limited electrification in urban energy systems
→ Afforestation/reforestation is supported to a certain extent while lower incentives for limiting growth in urban extent provide inconsistencies
→ Urban areas are less prominent in policy and innovation given emphasis on CCS options. Rural areas are more prominent considering BECCS
Renewable
Electricity (IMP-
Ren)
→ Urban areas support renewable energy penetration with electrification of urban infrastructure and sector coupling for increasing system flexibility
→ Consumption patterns and urban planning are able to reduce pressures on land use, demand response is increased to support renewables
→ Urban climate governance is enabling rapid deployment of renewable energy while fostering innovation for sustainable urban planning
Low Demand
(IMP-LD)
→ Walkable urban form is increased, active and public transport modes are encouraged, low energy buildings and green-blue infrastructure is integrated
→ Changes in consumption patterns and urban planning reduce pressures on land use to lower levels while service provisioning is improved
→ Urban policy making is used to accelerate solutions that foster innovation and increased efficiencies across all sectors, including material use
Shifting Pathways
(IMP-SP)
→ Urban areas are transformed to be resource efficient, low demand, and renewable energy supportive with an integrated approach in urban planning
→ Reinforcing measures enable GHG emission reductions from consumption patterns while also avoiding resource impacts across systems
→ Urban climate mitigation is best aligned with the SDGs to accelerate GHG emission reductions, increasing both scalability and acceptance
7
ACCEPTED VERSION
SUBJECT TO FIN
AL EDITS
Final Government Distribution Chapter 8 IPCC AR6 WGIII
Do Not Cite, Quote or Distribute 8-51 Total pages: 157
8.4 Urban mitigation options 1
Urban mitigation options can be categorized into three broad strategies: (1) reducing urban energy 2
consumption across all sectors, including through spatial planning and infrastructure; (2) electrification 3
and switching to net zero emissions resources; and (3) enhancing carbon stocks and uptake through 4
urban green and blue infrastructure, which can also offer multiple co-benefits. A fourth, socio-5
behavioural aspects, can shift energy demand and emerge as the result of implementing the strategies. 6
Urban mitigation options covered in this section are organized around these three strategies and can 7
facilitate deep decarbonization through systemic transformation (see Section 8.6 and Figure 8.21 for 8
prioritizing mitigation options based on urban form and urban growth typologies). 9
Urban areas are systems where multiple mitigation options—especially when integrated—have 10
cascading effects across transport, energy, buildings, land use, and behaviour. These cascading effects 11
take place both within and across urban systems (see Figure 8.15). Mitigation actions also occur at 12
multiple urban scales, from households and blocks to districts and city regions, and can be implemented 13
as standalone sectoral strategies, such as increasing energy efficiency for appliances, and also as system-14
wide actions. In reducing emissions locally, urban areas can help lower emissions outside of their 15
administrative boundaries through their use of materials and resources, and by increasing the efficiency 16
of infrastructure and energy use beyond what is possible with individual sectoral strategies. Urban 17
mitigation policies that implement multiple integrated interventions will provide more emissions 18
savings than the sum of individual interventions (Sethi et al. 2020). 19
Integrated action also has a key role in providing benefits for human well-being. Urban mitigation 20
options and strategies that are effective, efficient, and fair can also support broader sustainability goals 21
(Güneralp et al. 2017; Kona et al. 2018; Pasimeni et al. 2019). Due to the complex and intensive 22
interactions in urban systems and the interlinked nature among the SDGs, cities can be important 23
intervention points to harness synergies and co-benefits for achieving emissions reductions along with 24
other SDGs (Nilsson et al. 2016; Corbett and Mellouli 2017) (see Section 8.2 and Figure 8.4). 25
26
27
28
29
30
31
32
33
34
35
36
37
38
39
40
41
ACCEPTED VERSION
SUBJECT TO FIN
AL EDITS
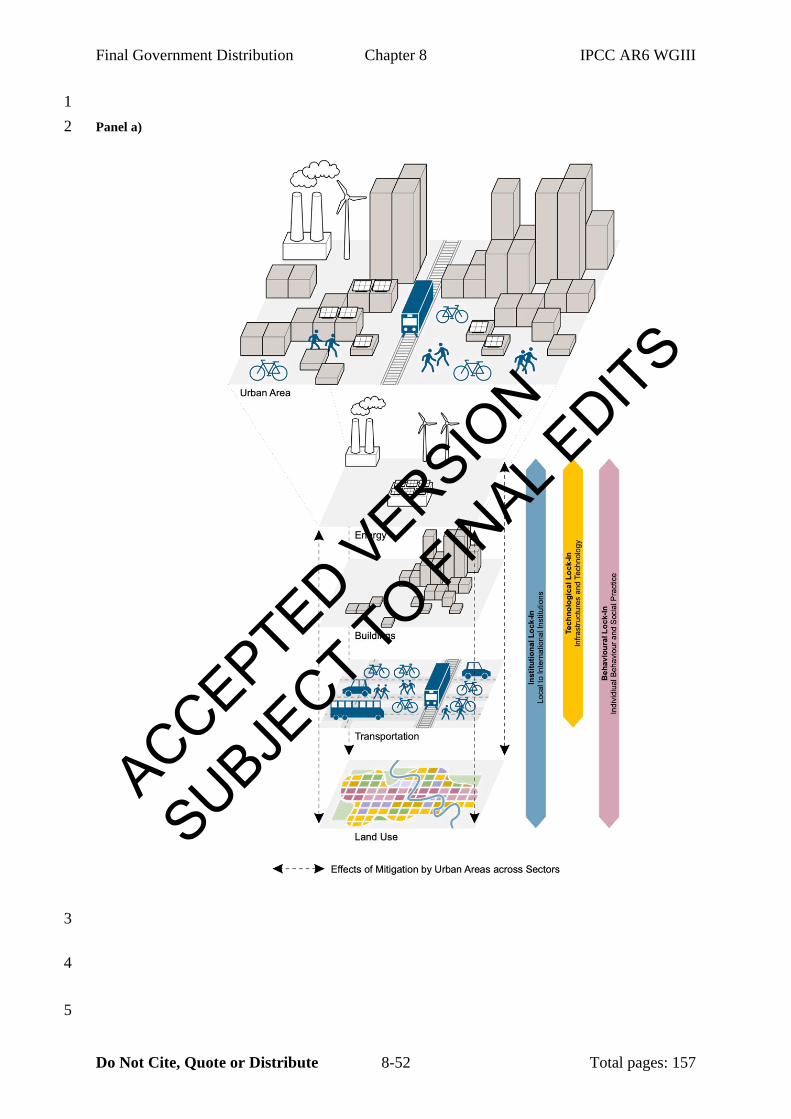
Final Government Distribution Chapter 8 IPCC AR6 WGIII
Do Not Cite, Quote or Distribute 8-52 Total pages: 157
1
Panel a) 2
3
4
5
ACCEPTED VERSION
SUBJECT TO FIN
AL EDITS
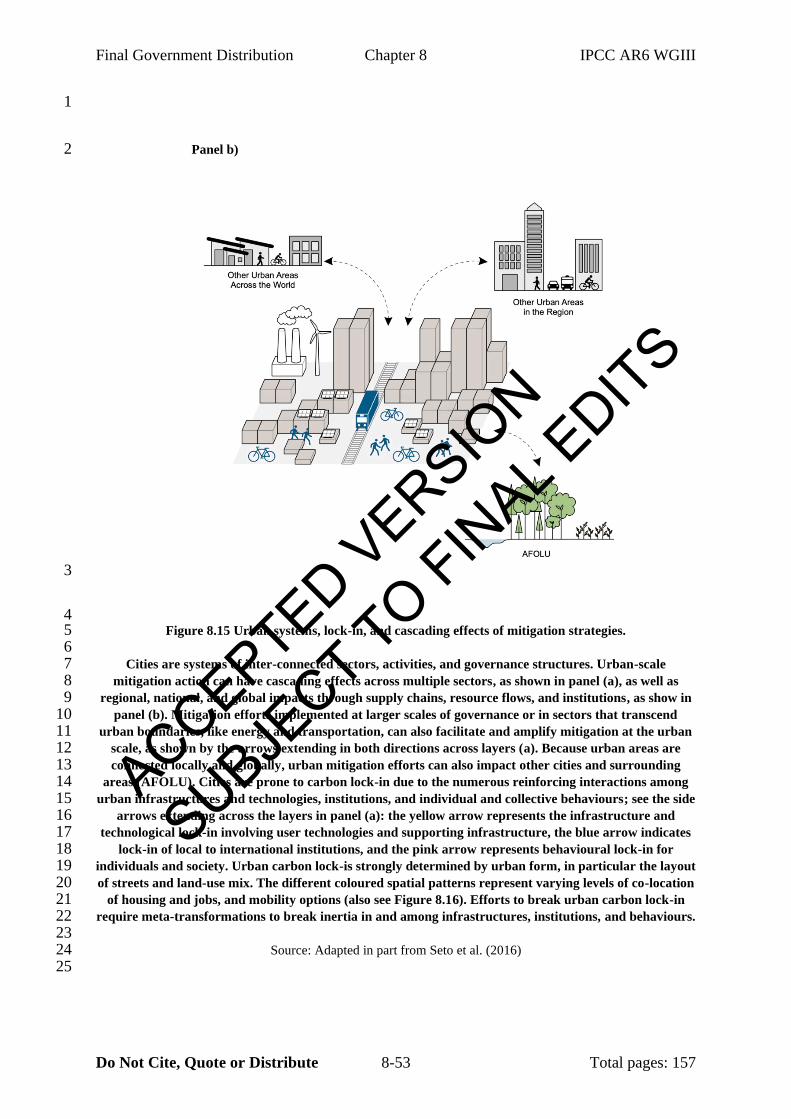
Final Government Distribution Chapter 8 IPCC AR6 WGIII
Do Not Cite, Quote or Distribute 8-53 Total pages: 157
1
Panel b) 2
3
4 Figure 8.15 Urban systems, lock-in, and cascading effects of mitigation strategies. 5
6 Cities are systems of inter-connected sectors, activities, and governance structures. Urban-scale 7
mitigation action can have cascading effects across multiple sectors, as shown in panel (a), as well as 8 regional, national, and global impacts through supply chains, resource flows, and institutions, as show in 9
panel (b). Mitigation efforts implemented at larger scales of governance or in sectors that transcend 10 urban boundaries, like energy and transportation, can also facilitate and amplify mitigation at the urban 11
scale, as shown by the arrows extending in both directions across layers (a). Because urban areas are 12 connected locally and globally, urban mitigation efforts can also impact other cities and surrounding 13
areas (AFOLU). Cities are prone to carbon lock-in due to the numerous reinforcing interactions among 14 urban infrastructures and technologies, institutions, and individual and collective behaviours; see the side 15
arrows extending across the layers in panel (a): the yellow arrow represents the infrastructure and 16 technological lock-in involving user technologies and supporting infrastructure, the blue arrow indicates 17
lock-in of local to international institutions, and the pink arrow represents behavioural lock-in for 18 individuals and society. Urban carbon lock-is strongly determined by urban form, in particular the layout 19 of streets and land-use mix. The different coloured spatial patterns represent varying levels of co-location 20
of housing and jobs, and mobility options (also see Figure 8.16). Efforts to break urban carbon lock-in 21 require meta-transformations to break inertia in and among infrastructures, institutions, and behaviours. 22
23 Source: Adapted in part from Seto et al. (2016) 24
25
ACCEPTED VERSION
SUBJECT TO FIN
AL EDITS
Final Government Distribution Chapter 8 IPCC AR6 WGIII
Do Not Cite, Quote or Distribute 8-54 Total pages: 157
8.4.1 Avoiding carbon lock-in 1
Carbon lock-in occurs as the result of interactions between different geographic and administrative 2
scales (institutional lock-in) and across sectors (infrastructural and technological lock-in), which create 3
the conditions for behavioural lock-in covering both individual and social structural behaviours (Seto 4
et al. 2016) (see Glossary for a broader definition of ‘lock-in’). The way that urban areas are designed, 5
laid out, and built affects and is affected by the interactions across the different forms of carbon lock-6
in (see Figures 8.15 and 8.16). Cities are especially prone to carbon lock-in because of the multiple 7
interactions of technological, institutional, and behavioural systems, which create inertia and path 8
dependency that are difficult to break. For example, the lock-in of gasoline cars is reinforced by 9
highway and energy infrastructures that are further locked-in by social and cultural preferences for 10
individual mobility options. The dominance of cars and their supporting infrastructures in auto-centric 11
urban forms is further reinforced by zoning and urban development patterns, such as dispersed and low-12
density housing distantly located from jobs, that create obstacles to create alternative mobility options 13
(Seto et al. 2016) (see Figure 8.16 on urban form). (Linton et al. 2021) 14
Urban infrastructures and the built environment are long-lived assets, embodying triple carbon lock-ins 15
in terms of their construction, operations, and demolition (Creutzig et al. 2016b; Seto et al. 2016; Ürge-16
Vorsatz et al. 2018). There is much focus in the climate change literature on the operational lifetimes 17
of the energy sector, especially power plants and the electricity grid, which are between 30 and 60 years 18
(Rode et al. 2017). Yet, in reality, the lifespans of urban infrastructures, especially the basic layout of 19
roadways, are often much longer (Reyna and Chester 2015). A number of detailed case studies on the 20
evolution of urban road networks for cities around the world reveal that the current layout of streets 21
grew out of street networks that were established hundreds of years ago (Strano et al. 2012; Masucci et 22
al. 2013; Mohajeri and Gudmundsson 2014). Furthermore, there is evidence that urban street layout, 23
population growth, urban development, and automobile ownership co-evolve (Li et al. 2019a). 24
For cities to break out of mutually reinforcing carbon lock-in, it will require systematic transformation 25
and systems-based planning that integrates mitigation strategies across sectors and geo-political scales. 26
Urban energy demand patterns are locked-in whenever incremental urban design and planning 27
decisions, coupled with investments in long-lasting infrastructure, such as roads and buildings, take 28
place (Seto et al. 2016). The fundamental building blocks of cities are based on the layout of the street 29
network, the size of city blocks, and the density of street intersections. If not significantly altered, these 30
three factors will continue to shape and lock-in energy demand for decades after their initial 31
construction, influencing the mitigation potential of urban areas (see Section 8.4.2 and Figure 8.22). 32
Avoiding carbon lock-in inherently involves decisions that extend beyond the administrative boundaries 33
of cities. This includes pricing of low-emissions technology or materials, such as electric battery or 34
hydrogen vehicles and buses, although cities can support their development and deployment (see Cross-35
Chapter Box 12 in Chapter 16 on Transition Dynamics). In contrast, urban governments in most parts 36
of the world do have powers to set building codes that regulate materials and construction standards for 37
buildings, including heating and cooling technologies, and major appliances. Other examples include 38
zoning that determines the location of buildings, land uses, standards for densities, and the inclusion of 39
energy planning in their building standards and public works, including streets, parks, and open spaces 40
(Blanco et al. 2011; Raven et al. 2018). 41
42 8.4.2 Spatial planning, urban form, and infrastructure 43
Urban form is the resultant pattern and spatial layout of land use, transportation networks, and urban 44
design elements, including the physical urban extent, configuration of streets and building orientation, 45
and the spatial figuration within and throughout cities and towns (Lynch 1981; Handy 1996). 46
Infrastructure describes the physical structures, social and ecological systems, and corresponding 47
ACCEPTED VERSION
SUBJECT TO FIN
AL EDITS
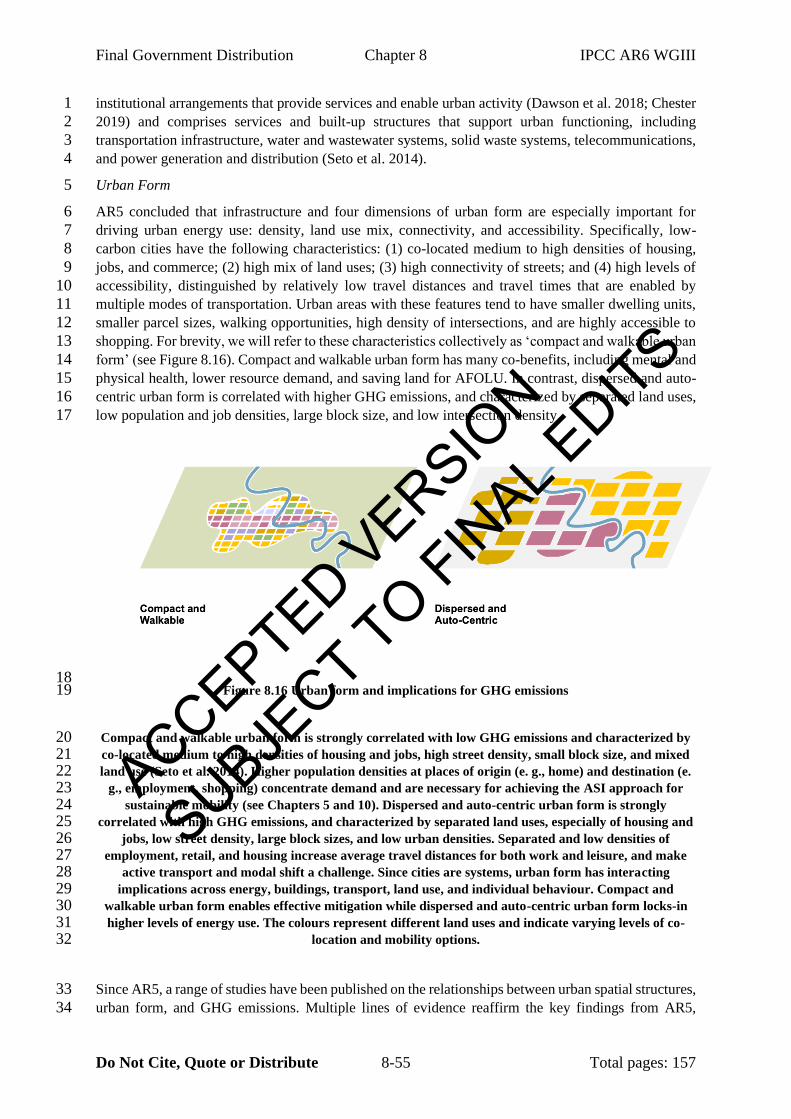
Final Government Distribution Chapter 8 IPCC AR6 WGIII
Do Not Cite, Quote or Distribute 8-55 Total pages: 157
institutional arrangements that provide services and enable urban activity (Dawson et al. 2018; Chester 1
2019) and comprises services and built-up structures that support urban functioning, including 2
transportation infrastructure, water and wastewater systems, solid waste systems, telecommunications, 3
and power generation and distribution (Seto et al. 2014). 4
Urban Form 5
AR5 concluded that infrastructure and four dimensions of urban form are especially important for 6
driving urban energy use: density, land use mix, connectivity, and accessibility. Specifically, low-7
carbon cities have the following characteristics: (1) co-located medium to high densities of housing, 8
jobs, and commerce; (2) high mix of land uses; (3) high connectivity of streets; and (4) high levels of 9
accessibility, distinguished by relatively low travel distances and travel times that are enabled by 10
multiple modes of transportation. Urban areas with these features tend to have smaller dwelling units, 11
smaller parcel sizes, walking opportunities, high density of intersections, and are highly accessible to 12
shopping. For brevity, we will refer to these characteristics collectively as ‘compact and walkable urban 13
form’ (see Figure 8.16). Compact and walkable urban form has many co-benefits, including mental and 14
physical health, lower resource demand, and saving land for AFOLU. In contrast, dispersed and auto-15
centric urban form is correlated with higher GHG emissions, and characterized by separated land uses, 16
low population and job densities, large block size, and low intersection density. 17
18 Figure 8.16 Urban form and implications for GHG emissions 19
Compact and walkable urban form is strongly correlated with low GHG emissions and characterized by 20 co-located medium to high densities of housing and jobs, high street density, small block size, and mixed 21 land use (Seto et al. 2014). Higher population densities at places of origin (e. g., home) and destination (e. 22
g., employment, shopping) concentrate demand and are necessary for achieving the ASI approach for 23 sustainable mobility (see Chapters 5 and 10). Dispersed and auto-centric urban form is strongly 24
correlated with high GHG emissions, and characterized by separated land uses, especially of housing and 25 jobs, low street density, large block sizes, and low urban densities. Separated and low densities of 26
employment, retail, and housing increase average travel distances for both work and leisure, and make 27 active transport and modal shift a challenge. Since cities are systems, urban form has interacting 28
implications across energy, buildings, transport, land use, and individual behaviour. Compact and 29 walkable urban form enables effective mitigation while dispersed and auto-centric urban form locks-in 30 higher levels of energy use. The colours represent different land uses and indicate varying levels of co-31
location and mobility options. 32
Since AR5, a range of studies have been published on the relationships between urban spatial structures, 33
urban form, and GHG emissions. Multiple lines of evidence reaffirm the key findings from AR5, 34
ACCEPTED VERSION
SUBJECT TO FIN
AL EDITS
Final Government Distribution Chapter 8 IPCC AR6 WGIII
Do Not Cite, Quote or Distribute 8-56 Total pages: 157
especially regarding the mitigation benefits associated with reducing vehicle miles or kilometres 1
travelled (VMT/VKT) through spatial planning. There are important cascading effects not only for 2
transport but also other key sectors and consumption patterns, such as in buildings, households, and 3
energy. However, these benefits can be attained only when the existing spatial structure of an urban 4
area does not limit locational and mobility options, thereby avoiding carbon lock-in through the 5
interaction of infrastructure and the resulting socio-behavioural aspects. 6
Modifying the layout of emerging urbanization to be more compact, walkable, and co-located can 7
reduce future urban energy use by 20–25% in 2050 while providing a corresponding mitigation potential 8
of 23–26% (Creutzig et al. 2015, 2016b; Sethi et al. 2020), forming the basis for other urban mitigation 9
options. Cross-Chapter Box 7 in Chapter 10 provides perspectives on simultaneously reducing urban 10
transport emissions, avoiding infrastructure lock-in, and providing accessible services (see Chapter 10). 11
The systemic nature of compact urban form and integrated spatial planning influences ‘Avoid-Shift-12
Improve’ (ASI, see Glossary) options across several sectors simultaneously, including for mobility and 13
shelter (for an in-depth discussion on the integration of service provision solutions within the ASI 14
framework, see Section 5.3). 15
8.4.2.1 Co-located housing and jobs, mixed land use, and high street connectivity 16
Integrated spatial planning, co-location of higher residential and job densities, and systemic approaches 17
are widely identified with development that is characterized by the 5Ds of TOD based on density, 18
diversity (mixed land uses), design (street connectivity), destination accessibility, and distance to 19
transit. Spatial strategies that integrate the 5Ds are shown to reduce VMT/VKT, and thereby transport-20
related GHG emissions through energy savings. The effect of urban form and built environment 21
strategies on VMT per capita varies by a number of factors (Ewing and Cervero 2010; Stevens 2017; 22
Blanco and Wikstrom 2018). Density and destination accessibility have the highest elasticities, followed 23
by design (Stevens 2017). Population-weighted densities for 121 metropolitan areas have further found 24
that the concentration of population and jobs along mass transit corridors decreases VMT/VKT 25
significantly when compared to more dispersed metropolitan areas. In this sample, elasticity rates were 26
twice as high for dense metropolitan areas located along mass transit lines (Lee and Lee 2020). 27
Meta-analyses of the reduction in VMT and the resulting GHG emissions consider the existing and still 28
dominant use of emitting transportation technology, transportation fleets, and urban form 29
characteristics. Varied historical legacies of transportation and the built environment, which can be 30
utilized to develop more sustainable cities (Newman et al. 2016, 2017), are often not taken into account 31
directly. Metropolitan policies and spatial planning, as evident in Copenhagen’s Finger Plan, as well as 32
strategic spatial planning in Stockholm and Seoul, have been major tools to restructure urban regions 33
and energy patterns (Sung and Choi 2017). Road prices and congestion charges can provide the 34
conditions for urban inhabitants to shift mobility demands and reduce vehicle use (see Section 5.6.2). 35
Surprisingly, even cities with higher population densities and a greater range of land uses can show 36
declines in these important attributes, which can lead to emissions increases, such as found in a study 37
of 323 East and South East Asian cities (Chen et al. 2020c). Conversely, the annual CO2 emissions 38
reduction of passenger cars in compact versus dispersed urban form scenarios can include at least a 39
10% reduction by 2030 (Matsuhashi and Ariga 2016). When combined with advances in transport 40
technology, this share increases to 64–70% in 2050 based on compact urban form scenarios for 1,727 41
municipalities (Kii 2020). 42
As a reaffirmation of AR5, population density reduces emissions per capita in the transport, building, 43
and energy sectors (Baur et al. 2015; Gudipudi et al. 2016; Wang et al. 2017; Yi et al. 2017) (see also 44
Sections 8.3.1 and 8.3.4 on past trends and forecasts of urban population density and land expansion). 45
Urban compactness tends to reduce emissions per capita in the transport sector, especially for 46
commuting (Matsuhashi and Ariga 2016; Lee and Lim 2018; Lee and Lee 2020). The relative 47
accessibility of neighbourhoods to the rest of the region, in addition to the density of individual 48
ACCEPTED VERSION
SUBJECT TO FIN
AL EDITS
Final Government Distribution Chapter 8 IPCC AR6 WGIII
Do Not Cite, Quote or Distribute 8-57 Total pages: 157
neighbourhoods, is important (Ewing et al. 2018). Creating higher residential and employment 1
densities, developing smaller block sizes, and increasing housing opportunities in an employment area 2
can significantly reduce household car ownership and car driving, and increase the share of transit, 3
walk, and bicycle commuting (Ding et al. 2018). In addition to population density, land-use mix, rail 4
transit accessibility, and street design reduce emissions from transport (Dou et al. 2016; Cao and Yang 5
2017; Choi 2018). The impact of population density and urban compactness on emissions per capita in 6
the household or energy sector is also associated with socioeconomic characteristics or lifestyle 7
preferences (Baiocchi et al. 2015; Miao 2017). Changes in the attributes of urban form and spatial 8
structure have influences on overall energy demand across spatial scales, particularly street, block, 9
neighbourhood, and city scales, as well as across the building (housing) and transport (mobility) sectors 10
(Silva et al. 2017). Understanding the existing trade-offs (or synergetic links) between urban form 11
variables across major emissions source sectors, and how they impact the size of energy flows within 12
the urban system, is key to prioritizing action for energy-efficient spatial planning strategies, which are 13
likely to vary across urban areas. 14
15
8.4.2.2 Urban form, growth, and sustainable development 16
Spatial planning for compact urban form is a system-wide intervention (Sethi et al. 2020) and has 17
potential to be combined with sustainable development objectives while pursuing climate mitigation 18
for urban systems (Große et al. 2016; Cheshmehzangi and Butters 2017; Facchini et al. 2017; Lwasa 19
2017; Stokes and Seto 2019). Compact urban form can enable positive impacts on employment and 20
green growth given that the local economy is decoupled from GHG emissions and related parameters 21
while the concentration of people and activity can increase productivity based on both proximity and 22
efficiency (Lee and Erickson 2017; Salat et al. 2017; Gao and Newman 2018; Han et al. 2018; Li and 23
Liu 2018; Lall et al. 2021) 24
Public acceptance can have a positive impact on integrated spatial planning especially when there is a 25
process of co-design (Grandin et al. 2018; Webb et al. 2018). The quality of spatial planning can also 26
increase co-benefits for health and well-being, including decisions to balance urban green areas with 27
density (Li et al. 2016; Sorkin 2018; Pierer and Creutzig 2019). The distributional effects of spatial 28
planning can depend on the policy tools that shape the influence of urban densification on affordable 29
housing while evidence for transit-induced gentrification is found to be partial and inconclusive (Chava 30
and Newman 2016; Jagarnath and Thambiran 2018; Padeiro et al. 2019; Debrunner and Hartmann 2020) 31
(see Sections 8.2 and 8.4.4). 32
Reducing GHG emissions across different urban growth typologies (see Figure 8.20) depends in part 33
on the ability to integrate opportunities for climate mitigation with co-benefits for health and well-being 34
(Grandin et al. 2018). At the same time, requirements for institutional capacity and governance for 35
cross-sector coordination for integrated urban planning is high given the complex relations between 36
urban mobility, buildings, energy systems, water systems, ecosystem services, other urban sectors, and 37
climate adaptation (Große et al. 2016; Castán Broto 2017a; Endo et al. 2017; Geneletti et al. 2017). The 38
capacity for implementing land-use zoning and regulations in a way that is consistent with supporting 39
spatial planning for compact urban form is not equal across urban areas and depends on different 40
contexts as well as institutional capacities (Bakır et al. 2018; Deng et al. 2018; Shen et al. 2019). 41
Currently, integrating spatial planning, urban form, and infrastructure in urban mitigation strategies 42
remains limited in mainstream practices, including in urban areas targeting an emissions reduction of 43
36–80% in the next decades (Asarpota and Nadin 2020). Capacity building for integrated spatial 44
planning for urban mitigation includes increasing collaboration among city departments and with civil 45
society to develop robust mitigation strategies, bringing together civil engineers, architects, urban 46
ACCEPTED VERSION
SUBJECT TO FIN
AL EDITS
Final Government Distribution Chapter 8 IPCC AR6 WGIII
Do Not Cite, Quote or Distribute 8-58 Total pages: 157
designers, public policy and spatial planners, and enhancing the education of urban professionals 1
(Asarpota and Nadin 2020) (see Section 8.5). 2
Spatial planning for compact urban form is a prerequisite for efficient urban infrastructure, including 3
district heating and/or cooling networks (Swilling et al. 2018; Möller et al. 2019; Persson et al. 2019; 4
UNEP and IRP 2020). District heating and cooling networks benefit from urban design parameters, 5
including density, block area, and elongation that represent the influence of urban density on energy 6
density (Fonseca and Schlueter 2015; Shi et al. 2020). Heat-demand density is a function of both 7
population density and heat demand per capita and can be equally present in urban areas with high 8
population density or high heat demand per capita (Möller et al. 2019; Persson et al. 2019). Low-9
temperature networks that utilize waste heat or renewable energy can provide an option to avoid carbon 10
lock-in to fossil fuels while layout and eco-design principles can further optimize such networks (Gang 11
et al. 2016; Buffa et al. 2019; Dominković and Krajačić 2019). Replacing gas-based heating and cooling 12
with electrified district heating and cooling networks, for instance, provide 65% emissions reductions 13
also involving carbon-aware scheduling for grid power (De Chalendar et al. 2019). The environmental 14
and ecological benefits increase through the interaction of urban energy and spatial planning (Tuomisto 15
et al. 2015; Bartolozzi et al. 2017; Dénarié et al. 2018; Zhai et al. 2020). These interactions include 16
support for demand-side flexibility, spatial planning using geographic information systems, and access 17
to renewable and urban waste heat sources (Möller et al. 2018; REN21 2020; Sorknæs et al. 2020; 18
Dorotić et al. 2019) (see Table SM8.2 for other references). 19
20
8.4.3 Electrification and switching to net zero emissions resources 21
Pursuing the electrification mobility, heating, and cooling systems, while decarbonizing electricity and 22
energy carriers, and switching to net zero materials and supply chains, represent important strategies 23
for urban mitigation. Electrification of energy end uses in cities and efficient energy demand for heating, 24
transport, and cooking through multiple options and urban infrastructure, has an estimated mitigation 25
potential of at least 6.9 GtCO2-eq by 2030 and 15.3 GtCO2-eq by 2050 (Coalition for Urban Transitions 26
2019). Energy efficiency measures in urban areas can be enabled by urban form, building codes, 27
retrofitting and renovation, modal shifts, and other options. Decarbonizing electricity supply raises the 28
mitigation potential of efficient buildings and transport in urban areas to about 75% of the total estimate 29
(Coalition for Urban Transitions 2019). In addition, relatively higher-density urban areas enable more 30
cost-effective infrastructure investments, including electric public transport and large-scale heat pumps 31
in districts that support electrification. Urban policymakers can play a key role in supporting carbon-32
neutral energy systems by acting as target setters and planners, demand aggregators, regulators, 33
operators, conveners, and facilitators for coordinated planning and implementation across sectors, urban 34
form, and demand (IEA 2021a; IRENA 2021). 35
36
8.4.3.1 Electrification and decarbonization of the urban energy system 37
Urban energy infrastructures often operate as part of larger energy systems that can be electrified, 38
decarbonized, and become enablers of urban system flexibility through demand-side options. With 39
multiple end-use sectors (e.g., transport, buildings) and their interactions with land use drawing on the 40
same urban energy system(s), increasing electrification is essential for rapid decarbonization, renewable 41
energy penetration, and demand flexibility (Kammen and Sunter 2016) (see IMPs in Sections 3.2.5 and 42
8.3.4). The mitigation potential of electrification is ultimately dependent on the carbon intensity of the 43
electricity grid (Kennedy 2015; Hofmann et al. 2016; Peng et al. 2018; Zhang and Fujimori 2020) and 44
starts providing lifecycle emission savings for carbon intensities below a threshold of 600 tCO2-eq 45
GWh-1 (Kennedy et al. 2019). Integrated systems of roof-top photovoltaics (PVs) and all-electric 46
vehicles (EVs) alone could supply affordable carbon-free electricity to cities and reduce CO2 emissions 47
ACCEPTED VERSION
SUBJECT TO FIN
AL EDITS
Final Government Distribution Chapter 8 IPCC AR6 WGIII
Do Not Cite, Quote or Distribute 8-59 Total pages: 157
by 54%–95% (Brenna et al. 2014; Kobashi et al. 2021). Furthermore, electrification and 1
decarbonization of the urban energy system holds widespread importance for climate change mitigation 2
across different urban growth typologies and urban form (see Section 8.6 and Figure 8.21) and leads to 3
a multitude of public health co-benefits (see Section 8.2). 4
Strategies that can bring together electrification with reduced energy demand based on walkable and 5
compact urban form can accelerate and amplify decarbonization. Taking these considerations—across 6
the energy system, sectors, and land use—contributes to avoiding, or breaking out of, carbon lock-in 7
and allows continued emission savings as the energy supply is decarbonized (Kennedy et al. 2018; 8
Teske et al. 2018; Seto et al. 2021). Indeed, electrification is already transforming urban areas and 9
settlements and has the potential to continue transforming urban areas into net-negative electric cities 10
that may sequester more carbon than emitted (Kennedy et al. 2018; Seto et al. 2021). 11
In its simplest form, electrification involves the process of replacing fossil fuel-based technologies with 12
electrified innovations such as electric vehicles, buses, streetcars, and trains (see Sections 10.4.1 and 13
10.4.2), heat pumps, PVs (see Section 6.4.2.1), electric cook-stoves (see Section 9.8.2.1), and other 14
technologies (Stewart et al. 2018). Cost-effective decarbonisation of energy use can be supported by 15
electrification in urban areas if there is also demand-side flexibility for power, heat, mobility, and water 16
with sector coupling (Guelpa et al. 2019; Pfeifer et al. 2021). Overall, demand-side flexibility across 17
sectors in urban areas is supported by smart charging, electric mobility, electrified urban rail, power-18
to-heat, demand side response, and water desalination (Lund et al. 2015; Calvillo et al. 2016; Salpakari 19
et al. 2016; Newman 2017; Meschede 2019). 20
As an enabler, electrification supports integrating net zero energy sources in urban infrastructure across 21
sectors, especially when there is more flexible energy demand in mobility, heating, and cooling to 22
absorb greater shares of variable renewable energy. In the transport sector, smart charging can reduce 23
electric vehicle impacts on peak demand by 60% (IEA 2021a). Urban areas that connect efficient 24
building clusters with the operation of smart thermal grids in district heating and cooling networks with 25
large-scale heat pumps can support higher penetrations of variable renewable energy in smart energy 26
systems (Lund et al. 2014, 2017). Higher urban densities provide the advantage of increasing the 27
penetration of renewable power for deep decarbonization, including mixed-use neighbourhoods for grid 28
balancing and electric public transport (Hsieh et al. 2017; Tong et al. 2017; Fichera et al. 2018; Kobashi 29
et al. 2020). Based on these opportunities, urban areas that provide low-cost options to energy storage 30
for integrating the power sector with multiple demands reduce investment needs in grid electricity 31
storage capacities (Mathiesen et al. 2015; Lund et al. 2018). 32
Electrification at the urban scale encompasses strategies to aggregate energy loads for demand response 33
in the urban built environment to reduce the curtailment of variable renewable energy and shifting time-34
of-use based on smart charging for redistributing energy demands (O’Dwyer et al. 2019). Peak shaving 35
or shifting takes place among frequent interventions at the urban level (Sethi et al. 2020). Business 36
models and utility participation, including municipal level demonstrations, can allow for upscaling 37
(Gjorgievski et al. 2020; Meha et al. 2020). The urban system can support increasing demand-side 38
flexibility in energy systems, including in contexts of 100% renewable energy systems (Drysdale et al. 39
2019; Thellufsen et al. 2020). 40
Smart grids in the urban system 41
Smart electricity grids enable peak demand reductions, energy conservation, and renewable energy 42
penetration, and are a subset of smart energy systems. GHG emission reductions from smart grids range 43
from 10 to 180 gCO2 kWh-1 (grams of CO2 per kilowatt-hour) with a median value of 89 gCO2 kWh-1, 44
depending on the electricity mix, penetration of renewable energy, and the system boundary (Moretti 45
et al. 2017). Smart electricity grids are characterized by bi-directional flows of electricity and 46
information between generators and consumers, although some actors can be both as ‘prosumer’ (see 47
ACCEPTED VERSION
SUBJECT TO FIN
AL EDITS
Final Government Distribution Chapter 8 IPCC AR6 WGIII
Do Not Cite, Quote or Distribute 8-60 Total pages: 157
Glossary). Two-way power flows can be used to establish peer-to-peer trading (P2P) (Hansen et al. 1
2020). Business models based on local citizen utilities (Green and Newman 2017; Green et al. 2020; 2
Syed et al. 2020) and community batteries (Mey and Hicks 2019; Green et al. 2020) can support the 3
realization of distributed energy and solar energy cities (Galloway and Newman 2014; Byrne and 4
Taminiau 2016; Stewart et al. 2018; Allan 2020). 5
Currently, despite power outages that are costly to local economies, the adoption of smart electricity 6
grids or smart energy systems have been slow in many developing regions, including in Sub-Saharan 7
Africa (Westphal et al. 2017; Kennedy et al. 2019). This is due to a number of different factors, such as 8
unreliable existing infrastructure, fractured fiscal authority, lack of electricity access in urban areas, 9
upfront cost, financial barriers, inefficient pricing of electricity, and low consumer education and 10
engagement (Venkatachary et al. 2018; Acakpovi et al. 2019; Cirolia 2020). 11
Pathways and trade-offs of electrification in urban systems 12
Urbanization and population density are one of the key drivers for enabling access to electricity across 13
the world with benefits for sustainable development (Aklin et al. 2018). Grid-connected PV systems for 14
urban locations that currently lack electricity access can allow urban areas to leapfrog based on green 15
electrification (Abid et al. 2021). In the Global South, the conversion of public transport to electric 16
transport, especially municipal buses (e.g., Bengaluru, India; Jakarta, Indonesia; Medellín, Colombia; 17
Rio de Janeiro, Brazil; Quito, Ecuador) and micro-mobility (e.g., e-trikes in Manila, Philippines) have 18
been quantified based on reductions in GHG and PM2.5 emissions, avoided premature deaths, and 19
increases in life expectancies (IEA 2014; C40 Cities 2018, 2020b,c,d,e). In 22 Latin American cities, 20
converting 100% of buses and taxis in 2030 to electric were estimated to result in a reduction of 300 21
MtCO2-eq compared to 2017 (ONU Medio Ambiente 2017). Yet the scaling up of electric vehicles in 22
cities can be examined within a larger set of possible social objectives, such as reducing congestion and 23
the prioritization of other forms of mobility. 24
Electrification requires a layering of policies at the national, state, and local levels. Cities have roles as 25
policy architects, including transit planning (e.g., EV targets and low-emissions zones, restrictions on 26
the types of energy use in new buildings, etc.), implementers (e.g., building codes and compliance 27
checking, financial incentives to encourage consumer uptake of EV’s and heat pumps, etc.), and 28
complementary partners to national and state policymaking (e.g., permitting or installation of charging 29
infrastructure) (Broekhoff et al. 2015). The number of cities that have instituted e-mobility targets that 30
aim for a certain percentage of EV’s sold, in circulation or registered, is increasing (REN21 2021). 31
Realizing the mitigation potential of electrification will require fiscal and regulatory policies and public 32
investment (Hall et al. 2017a; Deason and Borgeson 2019; Wappelhorst et al. 2020) (see Section 8.5). 33
EVs are most rapidly deployed when there has been a suite of policies, including deployment targets, 34
regulations and use incentives (e.g., zero-emission zone mandates, fuel economy standards, building 35
codes), financial incentives (e.g., vehicles, chargers), industrial policies (e.g., subsidies), and fleet 36
procurement (IEA 2016b, 2017, 2018, 2020a; Cazzola et al. 2019). The policy mix has included 37
mandates for bus deployment, purchase subsidies, or split ownership of buses and chargers (IEA 2021b) 38
(see Chapter 10). Subsidies are often critical to address the often-higher upfront costs of electric devices. 39
In other instances, the uptake of electric induction stoves was increased through government credit and 40
allotment of free electricity (Martínez et al. 2017; Gould et al. 2018). 41
Bringing multiple stakeholders together in local decision-making for smart energy systems requires 42
effort beyond usual levels while multi-actor settings can be increased to enable institutional conditions 43
(Lammers and Hoppe 2019). Public participation and community involvement in the planning, design 44
and operation of urban energy projects can be an enabler of decarbonizing local energy demands 45
(Corsini et al. 2019). Cooperation across institutions is important for municipalities that are engaged in 46
strategic energy planning and implementation for smart energy systems (Krog 2019) (see Section 8.5). 47
ACCEPTED VERSION
SUBJECT TO FIN
AL EDITS
Final Government Distribution Chapter 8 IPCC AR6 WGIII
Do Not Cite, Quote or Distribute 8-61 Total pages: 157
Electrification technologies can present potential trade-offs that can be minimized through governance 1
strategies, smart grid technologies, circular economy practices, and international cooperation. One 2
consideration is the increase in electricity demand (see 5.3.1.1). Across 23 megacities in the world 3
(population greater than 10 million people), electrification of the entire gasoline vehicle fleet could 4
increase electricity demand on average by 18% (Kennedy et al. 2018). How grid capacity will be 5
impacted is dependent on the match between daily electricity loads and supply (Tarroja et al. 2018). 6
Materials recycling of electrification technologies are also key to minimising potential environmental 7
and social costs (Church and Crawford 2018; Gaustad et al. 2018; Sovacool et al. 2020) and can ensure 8
electrification reaches its complete mitigation potential. Circular economy strategies are particularly 9
valuable to this goal by creating closed-loop supply chains through recycling, material recovery, repair, 10
and reuse. For instance, the PV Cycle program in Europe prevented more than 30,000 metric tonnes of 11
renewable technology from reaching the waste stream (Sovacool et al. 2020) (see Box 10.7 as well as 12
‘circular economy’ in Glossary). 13
8.4.3.2 Switching to net zero emissions materials and supply chains 14
For the carbon embodied in supply chains to become net zero, all key infrastructure and provisioning 15
systems will need to be decarbonized, including electricity, mobility, food, water supply, and 16
construction (Seto et al. 2021). The growth of global urban populations that is anticipated over the next 17
several decades will create significant demand for buildings and infrastructure. As cities expand in size 18
and density, there is an increase in the production of mineral-based structural materials and enclosure 19
systems that are conventionally associated with mid- and high-rise urban construction morphologies, 20
including concrete, steel, aluminium, and glass. This will create a significant spike in GHG emissions 21
and discharge of CO2 at the beginning of each building lifecycle, necessitating alternatives (Churkina 22
et al. 2020). 23
The initial carbon debt incurred in the production stage, even in sustainable buildings, can take decades 24
to offset through operational stage energy efficiencies alone. Increased reduction in the energy demands 25
and GHG emissions associated with the manufacture of mineral-based construction materials will be 26
challenging, as these industries have already optimized their production processes. Among the category 27
of primary structural materials, it is estimated that final energy demand for steel production can be 28
reduced by nearly 30% compared to 2010 levels, with 12% efficiency improvement for cement 29
(Lechtenböhmer et al. 2016). Even when industries are decarbonized, residual CO2 emissions will 30
remain from associated chemical reactions that take place in calcination and use of coke from coking 31
coal to reduce iron oxide (Davis et al. 2018). Additionally, carbon sequestration by cement occurs over 32
the course of the building lifecycle in quantities that would offset only a fraction of their production 33
stage carbon spike (Xi et al. 2016; Davis et al. 2018). Moreover, there are collateral effects on the carbon 34
cycle related to modern construction and associated resource extraction. The production of cement, 35
asphalt, and glass requires large amounts of sand extracted from beaches, rivers, and seafloors, 36
disturbing aquatic ecosystems and reducing their capacity to absorb atmospheric carbon. The mining of 37
ore can lead to extensive local deforestation and soil degradation (Sonter et al. 2017). Deforestation 38
significantly weakens the converted land as a carbon sink and in severe cases may even create a net 39
emissions source. 40
A broad-based substitution of monolithic engineered timber systems for steel and concrete in mid-rise 41
urban buildings offers the opportunity to transform cityscapes from their current status as net sources 42
of GHG emissions into large-scale, human-made carbon sinks. The storage of photosynthetic forest 43
carbon through the substitution of biomass-based structural materials for emissions-intensive steel and 44
concrete is an opportunity for urban infrastructure. The construction of timber buildings for 2.3 billion 45
new urban dwellers from 2020 to 2050 could store between 0.01 and 0.68 GtCO2 per year depending 46
on the scenario and the average floor area per capita. Over thirty years, wood-based construction can 47
ACCEPTED VERSION
SUBJECT TO FIN
AL EDITS
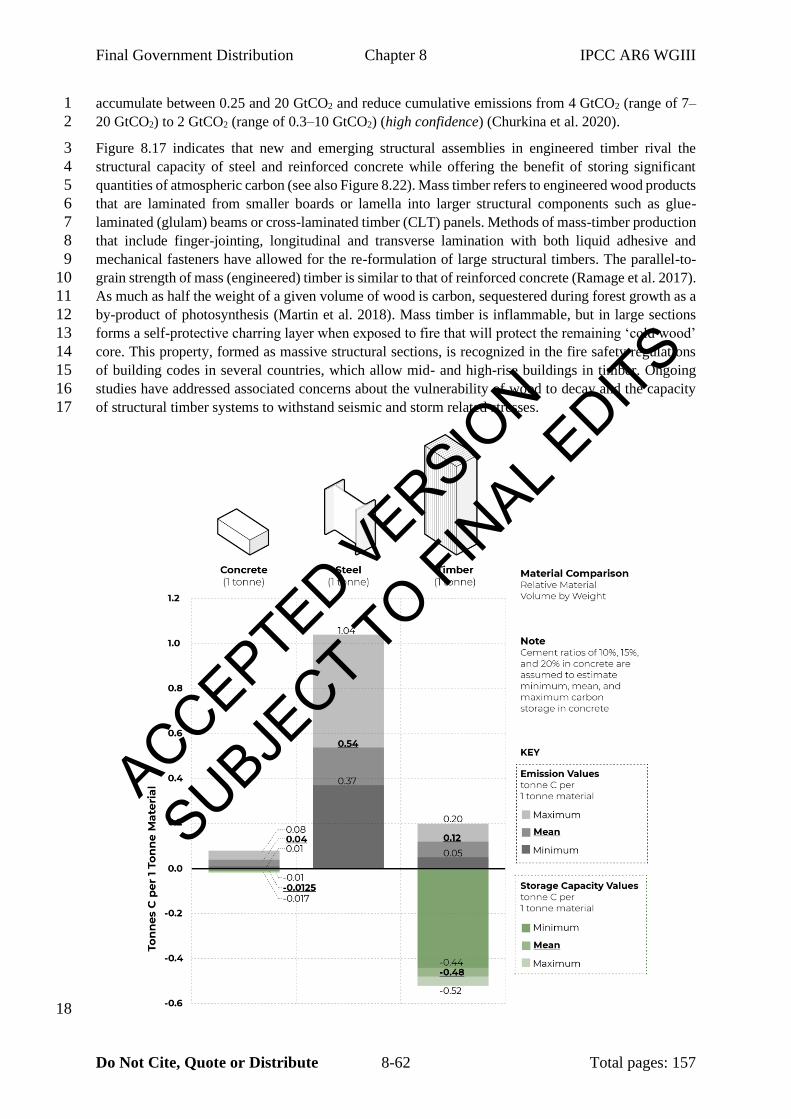
Final Government Distribution Chapter 8 IPCC AR6 WGIII
Do Not Cite, Quote or Distribute 8-62 Total pages: 157
accumulate between 0.25 and 20 GtCO2 and reduce cumulative emissions from 4 GtCO2 (range of 7–1
20 GtCO2) to 2 GtCO2 (range of 0.3–10 GtCO2) (high confidence) (Churkina et al. 2020). 2
Figure 8.17 indicates that new and emerging structural assemblies in engineered timber rival the 3
structural capacity of steel and reinforced concrete while offering the benefit of storing significant 4
quantities of atmospheric carbon (see also Figure 8.22). Mass timber refers to engineered wood products 5
that are laminated from smaller boards or lamella into larger structural components such as glue-6
laminated (glulam) beams or cross-laminated timber (CLT) panels. Methods of mass-timber production 7
that include finger-jointing, longitudinal and transverse lamination with both liquid adhesive and 8
mechanical fasteners have allowed for the re-formulation of large structural timbers. The parallel-to-9
grain strength of mass (engineered) timber is similar to that of reinforced concrete (Ramage et al. 2017). 10
As much as half the weight of a given volume of wood is carbon, sequestered during forest growth as a 11
by-product of photosynthesis (Martin et al. 2018). Mass timber is inflammable, but in large sections 12
forms a self-protective charring layer when exposed to fire that will protect the remaining ‘cold wood’ 13
core. This property, formed as massive structural sections, is recognized in the fire safety regulations 14
of building codes in several countries, which allow mid- and high-rise buildings in timber. Ongoing 15
studies have addressed associated concerns about the vulnerability of wood to decay and the capacity 16
of structural timber systems to withstand seismic and storm related stresses. 17
18
ACCEPTED VERSION
SUBJECT TO FIN
AL EDITS
Final Government Distribution Chapter 8 IPCC AR6 WGIII
Do Not Cite, Quote or Distribute 8-63 Total pages: 157
Figure 8.17 Relative volume of a given weight, its carbon emissions, and carbon storage capacity of 1 primary structural materials comparing one tonne of concrete, steel, and timber 2
3 Concrete and steel have substantial embodied carbon emissions with minimal carbon storage capacities, 4
while timber stores a considerable quantity of carbon with a relatively small ratio of carbon emissions-to-5 material volume. The displayed carbon storage of concrete is the theoretical maximum value, which may 6
be achieved after hundreds of years. Cement ratios of 10%, 15%, and 20% are assumed to estimate 7 minimum, mean, and maximum carbon storage in concrete. Carbon storage of steel is not displayed as it 8
is negligible (0.004 tonne C per tonne of steel). The middle-stacked bars represent the mean carbon 9 emission or mean carbon storage values displayed in bold font and underlined. The darker and lighter 10
coloured stacked bars depict the minimum and maximum values. Grey tones represent carbon emissions 11 and green tones are given for storage capacity values. Construction materials have radically different 12 volume-to-weight ratios, as well as material intensity (see representation by a structural column in the 13 upper panel. These differences should be accounted for in the estimations of their carbon storage and 14
emissions (see also Figure 8.22). 15 16
Source: Adapted from Churkina et al. (2020) 17 18
Transitioning to biomass-based building materials, implemented through the adoption of engineered 19 structural timber products and assemblies, will succeed as a mitigation strategy only if working forests 20 are managed and harvested sustainably (Churkina et al. 2020). Since future urban growth and the 21 construction of timber cities may lead to increased timber demand in regions with low forest cover, it 22 is necessary to systematically analyse timber demand, supply, trade, and potential competition for 23 agricultural land in different regions (Pomponi et al. 2020). The widespread adoption of biomass-based 24 urban construction materials and techniques will demand more robust forest and urban land governance 25 and management policies, as well as internationally standardized carbon accounting methods to 26 properly value and incentivize forest restoration, afforestation, and sustainable silviculture. 27
28 Expansion of agroforestry practices may help to reduce land-use conflicts between forestry and 29
agriculture. Harvesting pressures on forests can be reduced through the reuse and recycling of wooden 30
components from dismantled timber buildings. Potential synergies between the carbon sequestration 31
capacity of forests and the associated carbon storage capacity of dense mid-rise cities built from 32
engineered timber offer the opportunity to construct carbon sinks deployed at the scale of landscapes, 33
sinks that are at least as durable as other buildings (Churkina et al. 2020). Policies and practices 34
promoting design for disassembly and material reuse will increase their durability. 35
36
8.4.4 Urban green and blue infrastructure 37
The findings of AR6 WGI and WGII have underscored the importance of urban green and blue 38
infrastructure for reducing the total warming in urban areas due to its local cooling effect on temperature 39
and its benefits for climate adaptation (IPCC 2021; Cross-Working Group Box 2 in this chapter). Urban 40
green and blue infrastructure in the context of NBS involves the protection, sustainable management, 41
and restoration of natural or modified ecosystems while simultaneously providing benefits for human 42
well-being and biodiversity (IUCN 2021) (see Glossary for additional definitions). As an umbrella 43
concept, urban NBS integrates established ecosystem-based approaches that provide multiple 44
ecosystem services and are important in the context of societal challenges related to urbanization, 45
climate change, and reducing GHG emissions through the conservation and expansion of carbon sinks 46
(Naumann et al. 2014; Raymond et al. 2017) (see Section 8.1.6.1). 47
Urban green and blue infrastructure includes a wide variety of options, from street trees, parks, and 48
sustainable urban drainage systems (Davis and Naumann 2017), to building-related green roofs or green 49
facades, including green walls and vertical forests (Enzi et al. 2017). Figure 8.18 synthesizes urban 50
green and blue infrastructure based on urban forests, street trees, green roofs, green walls, blue spaces, 51
ACCEPTED VERSION
SUBJECT TO FIN
AL EDITS
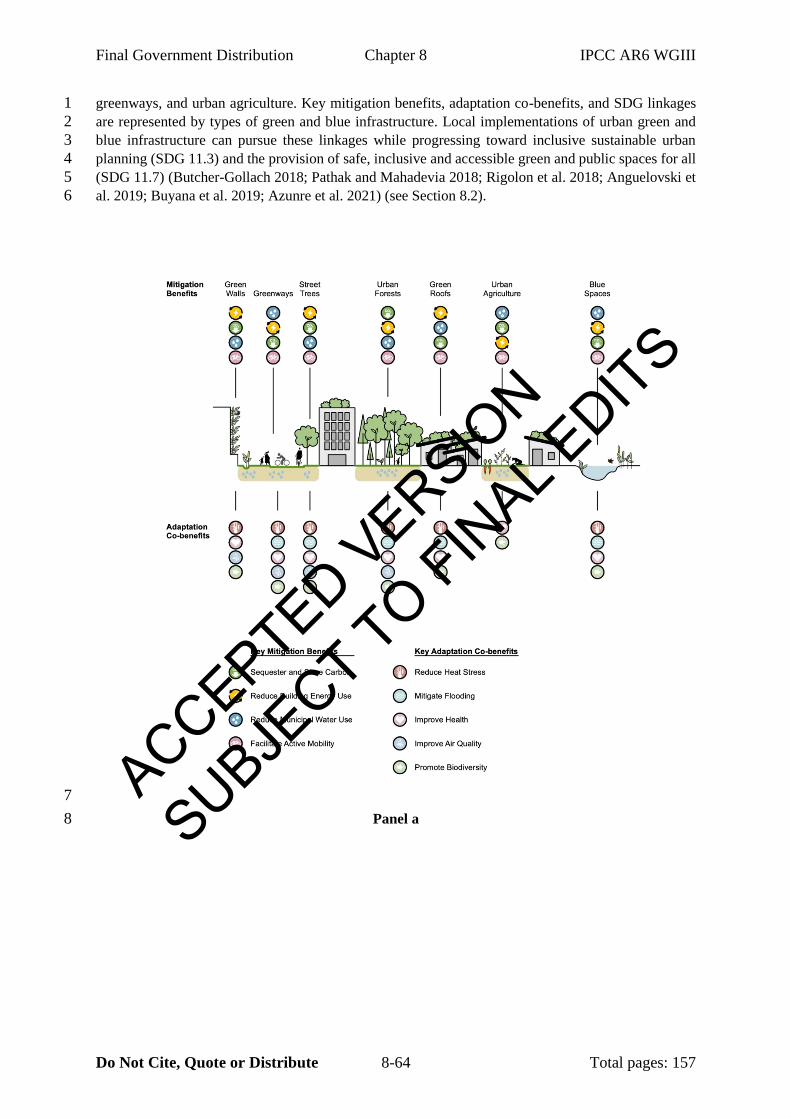
Final Government Distribution Chapter 8 IPCC AR6 WGIII
Do Not Cite, Quote or Distribute 8-64 Total pages: 157
greenways, and urban agriculture. Key mitigation benefits, adaptation co-benefits, and SDG linkages 1
are represented by types of green and blue infrastructure. Local implementations of urban green and 2
blue infrastructure can pursue these linkages while progressing toward inclusive sustainable urban 3
planning (SDG 11.3) and the provision of safe, inclusive and accessible green and public spaces for all 4
(SDG 11.7) (Butcher-Gollach 2018; Pathak and Mahadevia 2018; Rigolon et al. 2018; Anguelovski et 5
al. 2019; Buyana et al. 2019; Azunre et al. 2021) (see Section 8.2). 6
7
Panel a 8
ACCEPTED VERSION
SUBJECT TO FIN
AL EDITS
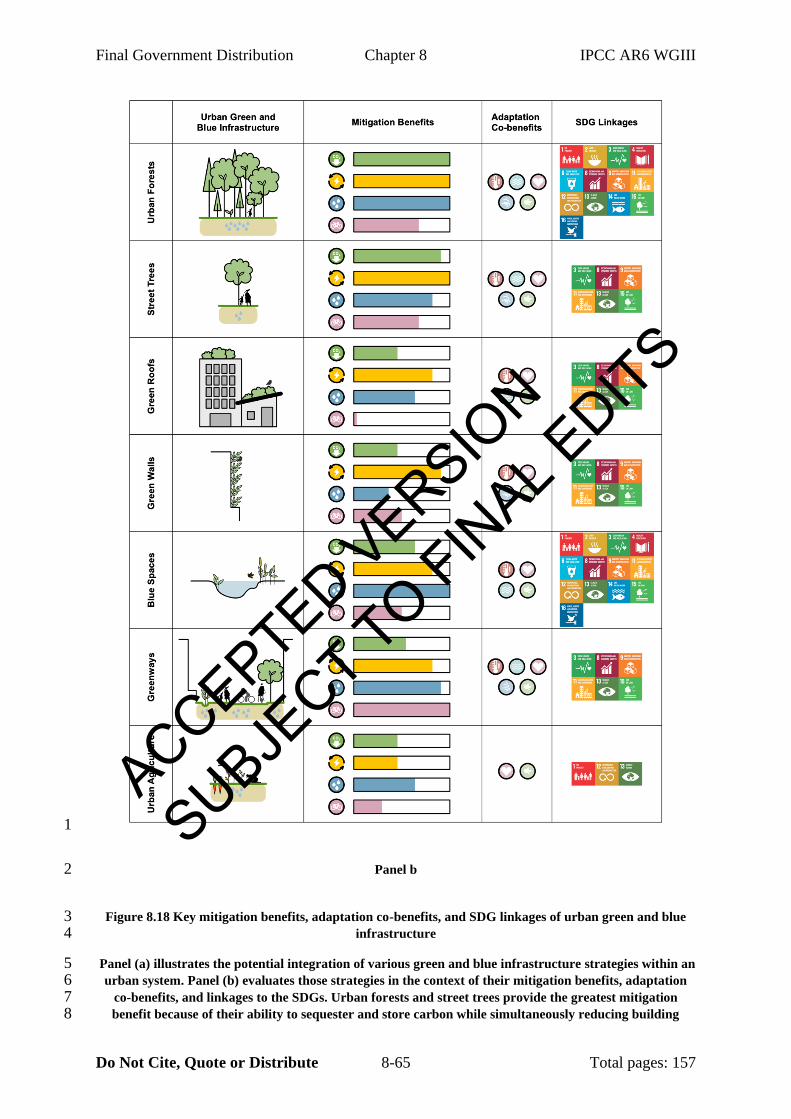
Final Government Distribution Chapter 8 IPCC AR6 WGIII
Do Not Cite, Quote or Distribute 8-65 Total pages: 157
1
Panel b 2
Figure 8.18 Key mitigation benefits, adaptation co-benefits, and SDG linkages of urban green and blue 3 infrastructure 4
Panel (a) illustrates the potential integration of various green and blue infrastructure strategies within an 5 urban system. Panel (b) evaluates those strategies in the context of their mitigation benefits, adaptation 6
co-benefits, and linkages to the SDGs. Urban forests and street trees provide the greatest mitigation 7 benefit because of their ability to sequester and store carbon while simultaneously reducing building 8
ACCEPTED VERSION
SUBJECT TO FIN
AL EDITS
Final Government Distribution Chapter 8 IPCC AR6 WGIII
Do Not Cite, Quote or Distribute 8-66 Total pages: 157
energy demand. Moreover, they provide multiple adaptation co-benefits and synergies based on the 1 linkages to the SDGs (see Figure 8.4). The assessments of mitigation benefits are dependent on context, 2
scale, and spatial arrangement of each green and blue infrastructure type and their proximity to 3 buildings. Mitigation benefits due to reducing municipal water use are based on reducing wastewater 4 loads that reduce energy use in wastewater treatment plants. The sizes in the bars are illustrative and 5
their relative size is based on the authors' best understanding and assessment of the literature. 6
7
8.4.4.1 The mitigation potential of urban trees and associated co-benefits 8
Due to their potential to store relatively high amounts of carbon compared to other types of urban 9
vegetation, as well as their ability to provide many climate mitigation co-benefits (medium agreement, 10
limited evidence), natural area protection and natural forest management in urban areas is an important 11
priority for cities looking to mitigate climate change. Globally, urban tree cover averages 26.5%, but 12
varies from an average of 12% in deserts to 30.4% in forested regions (Nowak and Greenfield 2020). 13
Global urban tree carbon storage is approximately 7.4 billion tonnes (GtC) given 363 million hectares 14
of urban land, 26.5% tree cover, and an average carbon storage density of urban tree cover of 7.69 15
kgC/m2 (kilograms carbon per square metre) (Nowak et al. 2013; World Bank et al. 2013). Estimated 16
global annual carbon sequestration by urban trees is approximately 217 million tonnes (MtC) given an 17
average carbon sequestration density per unit urban tree cover of 0.226 kgC/m2 (Nowak et al. 2013). 18
With an average plantable (non-tree and non-impervious) space of 48% globally (Nowak and 19
Greenfield 2020), the carbon storage value could nearly triple if all this space is converted to tree cover. 20
In Europe alone, if 35% of the urban surfaces (26450 km2) were transformed into green surfaces, the 21
mitigation potential based on carbon sequestration would be an estimated 25.9 MtCO2 year−1 with the 22
total mitigation benefit being 55.8 MtCO2 year−1, including an energy saving of about 92 TWh year−1 23
(Quaranta et al. 2021). Other co-benefits include reducing urban runoff by about 17.5% and reducing 24
summer temperatures by 2.5°C–6°C (Quaranta et al. 2021). 25
Urban tree carbon storage is highly dependent on biome. For example, carbon sequestered by vegetation 26
in Amazonian forests is two- to five-times higher compared to boreal and temperate forests (Blais et al. 27
2005). At the regional level, the estimated carbon storage density rates of tree cover include a range of 28
3.14–14.1 kgC/m2 in the United States, 3.85–5.58 kgC/m2 in South Korea, 1.53–9.67 kgC/m2 in 29
Barcelona, 28.1–28.9 kgC/m2 in Leicester, England, and an estimated 6.82 kgC/m2 in Leipzig, Germany 30
and 4.28 kgC/m2 in Hangzhou, China (Nowak et al. 2013). At the local scale, above- and below-ground 31
tree carbon densities can vary substantially, as with carbon in soils and dead woody materials. The 32
conservation of natural mangroves have been shown to provide urban mitigation benefits through 33
carbon sequestration, as demonstrated in the Philippines (Abino et al. 2014). Research on urban carbon 34
densities from the Southern hemisphere will contribute to better estimates. 35
On a per-tree basis, urban trees offer the most potential to mitigate climate change through both carbon 36
sequestration and GHG emissions reduction from reduced energy use in buildings (Nowak et al. 2017). 37
Maximum possible street tree planting among 245 world cities could reduce residential electricity use 38
by about 0.9–4.8% annually (McDonald et al. 2016). Urban forests in the United States reduce building 39
energy use by 7.2%, equating to an emissions reduction of 43.8 MtCO2 annually (Nowak et al. 2017). 40
Urban trees can also mitigate some of the impacts of climate change by reducing the UHI effect and 41
heat stress, reducing stormwater runoff, improving air quality, and supporting health and well-being in 42
areas where the majority of the world’s population resides (Nowak and Dwyer 2007). Urban forest 43
planning and management can maximize these benefits for present and future generations by sustaining 44
optimal tree cover and health (also see SDG linkages in Figure 8.4). Urban and peri-urban (see 45
Glossary) agriculture can also have economic benefits from fruit, ornamental, and medicinal trees 46
(Gopal and Nagendra 2014; Lwasa 2017; Lwasa et al. 2018). 47
ACCEPTED VERSION
SUBJECT TO FIN
AL EDITS
Final Government Distribution Chapter 8 IPCC AR6 WGIII
Do Not Cite, Quote or Distribute 8-67 Total pages: 157
1
START BOX 8.2 HERE 2 3
Box 8.2 Urban carbon storage: An example from New York City 4
The structure, composition, extent, and growing conditions of vegetation in cities has an influence on 5
their potential for mitigating climate change (Pregitzer et al. 2021). Urban natural areas, particularly 6
forested natural areas, grow in patches and contain many of the same components as non-urban forests, 7
such as high tree density, down woody material, and regenerating trees (see Figure 1). 8
Urban forested natural areas have unique benefits as they can provide habitat for native plants and 9
animals, protecting local biodiversity in a fragmented landscape (Di Giulio et al. 2009). Forests can 10
have a greater cooling effect on cities than designed greenspaces, and the bigger the forest the greater 11
the effect (Jaganmohan et al. 2016). In New York City, urban forested natural areas have been found to 12
account for the majority of trees estimated in the city (69%), but are a minority of the total tree canopy 13
(25%, or 5.5% of the total city land area) (Pregitzer et al. 2019a). In New York City, natural areas are 14
estimated to store a mean of 263.5 Mg C ha-1 (megagram carbon per hectare), adding up to 1.86 TgC 15
(teragram carbon) across the city, with the majority of carbon (86%) being stored in the trees and soils 16
(Pregitzer et al. 2021). These estimates are similar to per-hectare estimates of carbon storage across 17
different pools in non-urban forest types (see Table 1), and 1.5-times greater than estimates for carbon 18
stored in just trees across the entire city (Pregitzer et al. 2021). 19
Within urban natural areas, the amount of carbon stored varies widely based on vegetation type, tree 20
density, and the species composition (see Figure 1). The oak-hardwood forest type is one of the most 21
abundant in New York City’s natural areas and is characterized by large and long-lived native hardwood 22
tree species, with relatively dense wood. These forests store an estimated 311.5 Mg C ha-1. However, 23
non-native exotic invasive species can be prevalent in the understory vegetation layer (<1m height), 24
and account for about 50% of cover in New York City (Pregitzer et al. 2019b). 25
This could lead to a trajectory where exotic understory species, which are often herbaceous, out-26
compete regenerating trees in the understory layer, alter the soil (Ward et al. 2020), and alter the forest 27
canopy (Matthews et al. 2016). A change in New York City’s vegetation structure and composition to 28
a more open vegetation type could reduce the carbon storage by over half (open grassland 120.1 Mg C 29
ha-1). 30
When compared to estimates of carbon storage presented in other studies, the components (pools) of 31
the natural area forests in New York City store carbon in similar proportions to other non-urban forests 32
(see Table 1). This might suggest that in other geographies, similar adjacent non-urban forest types may 33
store similar carbon stocks per unit area (medium confidence). However, despite similarities to non-34
urban forests, the urban context can lead to altered forest function and carbon cycling that should be 35
considered. For example, trees growing in urban areas have been observed to grow at much higher rates 36
due to higher access to light, nutrients, and increased temperatures (Gregg et al. 2003; Reinmann et al. 37
2020). 38
Higher growth rates coupled with the UHI effect have also been suggested to yield greater evaporative 39
cooling by urban canopies relative to rural forests (Winbourne et al. 2020). Based on estimates in New 40
York City, it is likely that the majority of tree biomass, and carbon in trees in cities, could be found in 41
urban natural area forest patches (medium agreement, limited evidence). More research is needed to 42
map urban natural areas, assess vegetation, and differentiate tree canopy types (natural vs. non-natural) 43
at fine scales within many cities and geographies. Accurate maps, as well as greater understanding of 44
definitions of urban canopies and vegetation, could lead to better accounts for carbon stocks and the 45
many other unique benefits they provide (Raciti et al. 2012; Pregitzer et al. 2019a). 46
ACCEPTED VERSION
SUBJECT TO FIN
AL EDITS
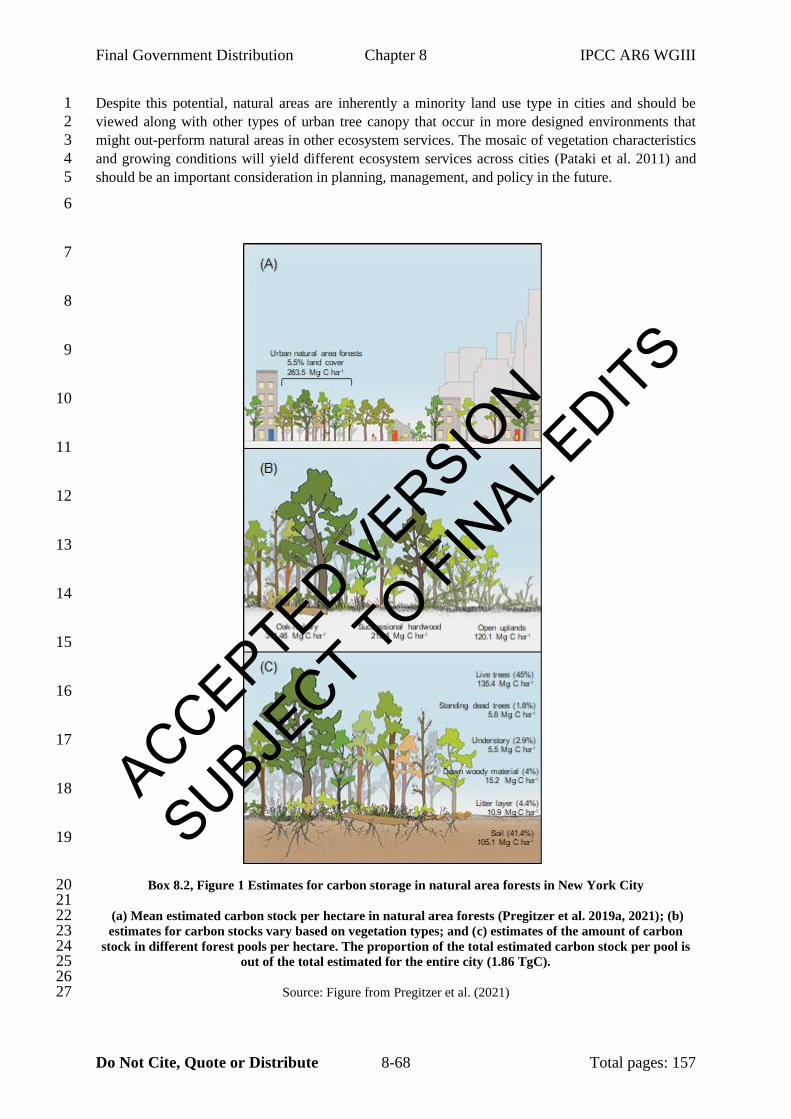
Final Government Distribution Chapter 8 IPCC AR6 WGIII
Do Not Cite, Quote or Distribute 8-68 Total pages: 157
Despite this potential, natural areas are inherently a minority land use type in cities and should be 1
viewed along with other types of urban tree canopy that occur in more designed environments that 2
might out-perform natural areas in other ecosystem services. The mosaic of vegetation characteristics 3
and growing conditions will yield different ecosystem services across cities (Pataki et al. 2011) and 4
should be an important consideration in planning, management, and policy in the future. 5
6
7
8
9
10
11
12
13
14
15
16
17
18
19
Box 8.2, Figure 1 Estimates for carbon storage in natural area forests in New York City 20 21
(a) Mean estimated carbon stock per hectare in natural area forests (Pregitzer et al. 2019a, 2021); (b) 22 estimates for carbon stocks vary based on vegetation types; and (c) estimates of the amount of carbon 23
stock in different forest pools per hectare. The proportion of the total estimated carbon stock per pool is 24 out of the total estimated for the entire city (1.86 TgC). 25
26 Source: Figure from Pregitzer et al. (2021)27
ACCEPTED VERSION
SUBJECT TO FIN
AL EDITS
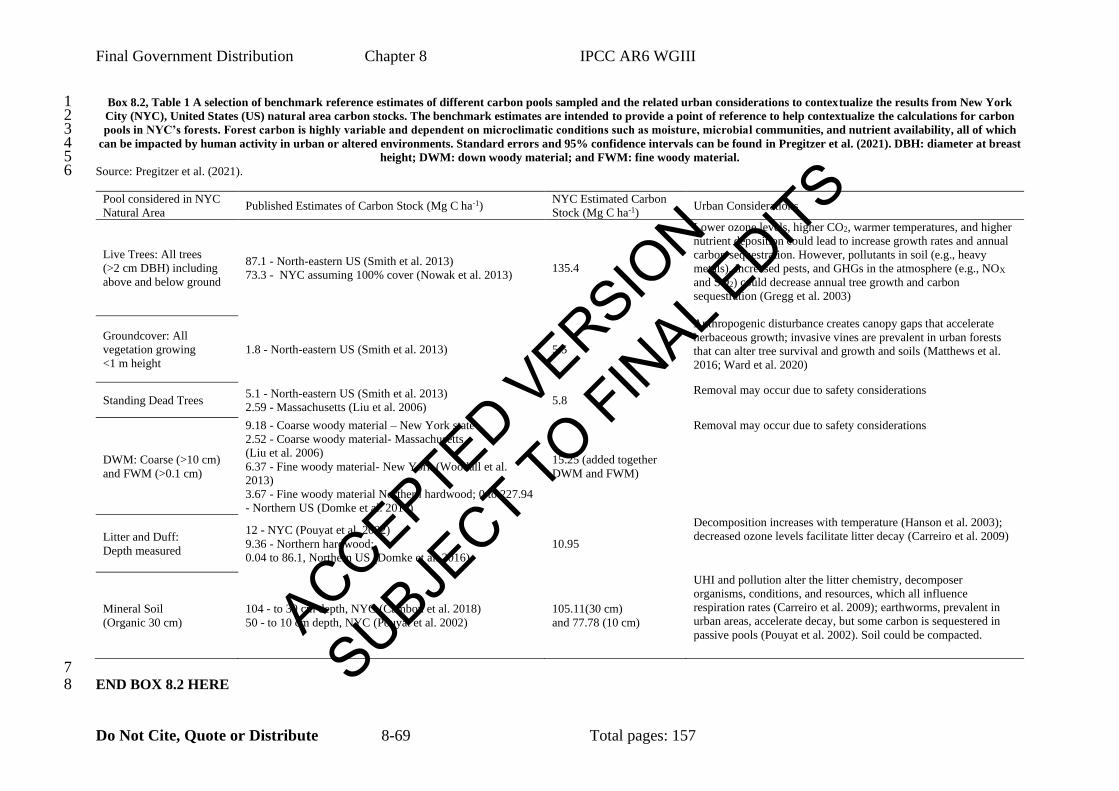
Final Government Distribution Chapter 8 IPCC AR6 WGIII
Do Not Cite, Quote or Distribute 8-69 Total pages: 157
Box 8.2, Table 1 A selection of benchmark reference estimates of different carbon pools sampled and the related urban considerations to contextualize the results from New York 1 City (NYC), United States (US) natural area carbon stocks. The benchmark estimates are intended to provide a point of reference to help contextualize the calculations for carbon 2 pools in NYC’s forests. Forest carbon is highly variable and dependent on microclimatic conditions such as moisture, microbial communities, and nutrient availability, all of which 3
can be impacted by human activity in urban or altered environments. Standard errors and 95% confidence intervals can be found in Pregitzer et al. (2021). DBH: diameter at breast 4 height; DWM: down woody material; and FWM: fine woody material. 5
Source: Pregitzer et al. (2021). 6
Pool considered in NYC
Natural Area Published Estimates of Carbon Stock (Mg C ha-1)
NYC Estimated Carbon
Stock (Mg C ha-1) Urban Considerations
Live Trees: All trees
(>2 cm DBH) including
above and below ground
87.1 - North-eastern US (Smith et al. 2013)
73.3 - NYC assuming 100% cover (Nowak et al. 2013) 135.4
Lower ozone levels, higher CO2, warmer temperatures, and higher
nutrient deposition could lead to increase growth rates and annual
carbon sequestration. However, pollutants in soil (e.g., heavy
metals), increased pests, and GHGs in the atmosphere (e.g., NOX
and SO2) could decrease annual tree growth and carbon
sequestration (Gregg et al. 2003)
Groundcover: All
vegetation growing
<1 m height
1.8 - North-eastern US (Smith et al. 2013) 5.5
Anthropogenic disturbance creates canopy gaps that accelerate
herbaceous growth; invasive vines are prevalent in urban forests
that can alter tree survival and growth and soils (Matthews et al.
2016; Ward et al. 2020)
Standing Dead Trees 5.1 - North-eastern US (Smith et al. 2013)
2.59 - Massachusetts (Liu et al. 2006) 5.8
Removal may occur due to safety considerations
DWM: Coarse (>10 cm)
and FWM (>0.1 cm)
9.18 - Coarse woody material – New York state
2.52 - Coarse woody material- Massachusetts
(Liu et al. 2006)
6.37 - Fine woody material- New York (Woodall et al.
2013)
3.67 - Fine woody material Northern hardwood; 0 to 227.94
- Northern US (Domke et al. 2016)
15.25 (added together
DWM and FWM)
Removal may occur due to safety considerations
Litter and Duff:
Depth measured
12 - NYC (Pouyat et al. 2002)
9.36 - Northern hardwood;
0.04 to 86.1, Northern US (Domke et al. 2016)
10.95
Decomposition increases with temperature (Hanson et al. 2003);
decreased ozone levels facilitate litter decay (Carreiro et al. 2009)
Mineral Soil
(Organic 30 cm)
104 - to 30 cm depth, NYC (Cambou et al. 2018)
50 - to 10 cm depth, NYC (Pouyat et al. 2002)
105.11(30 cm)
and 77.78 (10 cm)
UHI and pollution alter the litter chemistry, decomposer
organisms, conditions, and resources, which all influence
respiration rates (Carreiro et al. 2009); earthworms, prevalent in
urban areas, accelerate decay, but some carbon is sequestered in
passive pools (Pouyat et al. 2002). Soil could be compacted.
7 END BOX 8.2 HERE8
ACCEPTED VERSION
SUBJECT TO FIN
AL EDITS
Final Government Distribution Chapter 8 IPCC AR6 WGIII
Do Not Cite, Quote or Distribute 8-70 Total pages: 157
1
8.4.4.2 Benefits of green roofs, green walls, and greenways 2
Green roofs and green walls have potential to mitigate air and surface temperature, improve thermal 3
comfort, and mitigate UHI effects (Jamei et al. 2021; Wong et al. 2021), while lowering the energy 4
demand of buildings (Susca 2019) (see Figure 8.18). Green roofs have the highest median cooling effect 5
in dry climates (3°C) and the lowest cooling effect in hot, humid climates (1°C) (Jamei et al. 2021). 6
These mitigation potentials depend on numerous factors and the scale of implementation. The 7
temperature reduction potential for green roofs when compared to conventional roofs can be about 4°C 8
in winter and about 12°C during summer conditions (Bevilacqua et al. 2016). Green roofs can reduce 9
building heating demands by about 10–30% compared to conventional roofs (Besir and Cuce 2018), 10
60–70% compared to black roofs, and 45–60% compared to white roofs (Silva et al. 2016). Green walls 11
or facades can provide a temperature difference between air temperature outside and behind a green 12
wall of up to 10°C, with an average difference of 5°C in Mediterranean contexts in Europe (Perini et 13
al. 2017). The potential of saving energy for air conditioning by green facades can be around 26% in 14
summer months. Considerations of the spatial context are essential given their dependence on climatic 15
conditions (Susca 2019). Cities are diverse and emissions savings potentials depend on several factors, 16
while the implementation of green roofs or facades may be prevented in heritage structures. 17
Green roofs have been shown to have beneficial effects in stormwater reduction (Andrés-Doménech et 18
al. 2018). A global meta-analysis of 75 international studies on the potential of green roofs to mitigate 19
runoff indicate that the runoff retention rate was on average 62% but with a wide range (0–100%) 20
depending on a number of interdependent factors (Zheng et al. 2021). These factors relate to the 21
characteristics of the rainfall event (e.g., intensity) and characteristics of the green roof (e.g., substrate, 22
vegetation type, and size), and of the climate and season type. A hydrologic modelling approach applied 23
to an Italian case demonstrated that implementing green roofs may reduce peak runoff rates and water 24
volumes by up to 35% in a 100% green roof conversion scenario (Masseroni and Cislaghi 2016). 25
Greenways support stormwater management to mitigate water runoff and urban floods by reducing the 26
water volume (e.g., through infiltration) and by an attenuation or temporal shift of water discharge (Fiori 27
and Volpi 2020; Pour et al. 2020). Using green infrastructure delays the time to runoff and reduces 28
water volume but depends on the magnitude of floods (Qin et al. 2013). Measures are most effective 29
for flood mitigation at a local scale; however, as the size of the catchment increases, the effectiveness 30
of reducing peak discharge decreases (Fiori and Volpi 2020). Reduction of water volume through 31
infiltration can be more effective with rainfall events on a lower return rate. Overall, the required 32
capacity for piped engineered systems for water runoff attenuation and mitigation can be reduced while 33
lowering flow rates, controlling pollution transport, and increasing the capacity to store stormwater 34
(Srishantha and Rathnayake 2017). Benefits for flood mitigation require a careful consideration of the 35
spatial context of the urban area, the heterogeneity of the rainfall events, and characteristics of 36
implementation (Qiu et al. 2021). Maintenance costs and stakeholder coordination are other aspects 37
requiring attention (Mguni et al. 2016). 38
Providing a connected system of greenspace throughout the urban area may promote active 39
transportation (Nieuwenhuijsen and Khreis 2016), thereby reducing GHG emissions. Soft solutions for 40
improving green infrastructure connectivity for cycling is an urban NBS mitigation measure, although 41
there is low evidence for emissions reductions. In the city of Lisbon, Portugal, improvements in cycling 42
infrastructure and bike-sharing system resulted in 3.5-times more cyclists within two years (Félix et al. 43
2020). In Copenhagen, the cost of cycling (Euro 0.08/km) is declining and is about six times lower than 44
car driving (Euro 0.50/km) (Vedel et al. 2017). In addition, participants were willing to cycle 1.84 km 45
longer if the route has a designated cycle track and 0.8 km more if there are also green surroundings. 46
Changes in urban landscapes, including through the integration of green infrastructure in sustainable 47
ACCEPTED VERSION
SUBJECT TO FIN
AL EDITS
Final Government Distribution Chapter 8 IPCC AR6 WGIII
Do Not Cite, Quote or Distribute 8-71 Total pages: 157
urban and transport planning, can support the transition from private motorized transportation to public 1
and physically active transportation in carbon-neutral, more liveable and healthier cities 2
(Nieuwenhuijsen and Khreis 2016; Nieuwenhuijsen 2020). Car infrastructure can be also transferred 3
into public open and green space, such as in the Superblock model in Barcelona’s neighbourhoods 4
(Rueda 2019). Health impact assessment models estimated that 681 premature deaths may be prevented 5
annually with this implementation (Mueller et al. 2020) and the creation of greenways in Maanshan, 6
China has stimulated interests in walking or cycling (Zhang et al. 2020). 7
8
8.4.5 Socio-behavioural aspects 9
Urban systems shape the behaviour and social structures of their residents through urban form, energy 10
systems, and infrastructure—all of which provide a range of options for consumers to make choices 11
about residential location, mobility, energy sources, and the consumption of materials, food, and other 12
resources. The relative availability of options across these sectors has implications on urban emissions 13
through individual behaviour. In turn, urban GHG emissions, as well as emissions from the supply 14
chains of cities, are driven by the behaviour and consumption patterns of residents, with households 15
accounting for over 60% of carbon emissions globally (Ivanova et al. 2016). The exclusion of 16
consumption-based emissions and emissions that occur outside of city boundaries as a result of urban 17
activities will lead to significant undercounting to the effect of undercounting 41% of territorial 18
emissions and 4% of global emissions annually, respectively (Wiedmann et al. 2021). 19
Changes in behaviour across all areas (e.g., transport, buildings, food, etc.) could reduce an individual’s 20
emissions by 5.6–16.2% relative to the accumulated GHG emissions from 2011 to 2050 in a baseline 21
scenario modelled with the Global Change Assessment Model (van de Ven et al. 2018). In other models, 22
behaviour change in transport and residential energy use could reduce emissions by 2 GtCO2-eq in 2030 23
compared to 2019 (IEA 2020b) (see Chapter 5). Voluntary behaviour change can support emissions 24
reduction, but behaviours that are not convenient to change are unlikely to shift without changes to 25
policy (Sköld et al. 2018). Cities can increase the capability of citizens to make sustainable choices by 26
making these choices less onerous, through avenues such as changing urban form to increase locational 27
and mobility options and providing feedback mechanisms to support socio-behavioural change. 28
Transport emissions can be reduced by options including telecommuting (0.3%), taking closer holidays 29
(0.5%), avoiding short flights (0.5%), using public transit (0.7%), cycling (0.6%), car sharing (1.1%), 30
and carpool commuting (1.2%); all reduction estimates reflect cumulative per capita emission savings 31
relative to baseline emissions for the period 2011–2050, and assume immediate adoption of behavioural 32
changes (van de Ven et al. 2018). Cities can support voluntary shift to walking, cycling, and transit 33
instead of car use through changes to urban form, such as TOD (Kamruzzaman et al. 2015), increased 34
density of form with co-location of activities (Ma et al. 2015; Ding et al. 2017; Duranton and Turner 35
2018; Masoumi 2019), and greater intersection density and street integration (Koohsari et al. 2016). 36
Mechanisms such as providing financial incentives or disincentives for car use can also be effective in 37
reducing emissions (Wynes et al. 2018) (see Section 8.4.2). 38
Adopting energy efficient practices in buildings could decrease global building energy demand in 2050 39
by 33–44% compared to a business-as-usual scenario (Levesque et al. 2019). Reductions in home 40
energy use can be achieved by reducing floor area (0.5–3.0%), utilising more efficient appliances and 41
lighting (2.7–5.0%), optimising thermostat settings (8.3–11%), using efficient heating and cooling 42
technologies (6.7–10%), improving building insulation (2.9–4.0%), optimising clothes washing (5.0–43
5.7%), and optimising dishwashing (1–1.1%) (Levesque et al. 2019). Building standards and mandates 44
could work towards making these options required or more readily available and accessible. Residential 45
appliance use, water heating, and thermostat settings can be influenced by feedback on energy use, 46
particularly when paired with real-time feedback and/or instructions on how to reduce energy use 47
ACCEPTED VERSION
SUBJECT TO FIN
AL EDITS
Final Government Distribution Chapter 8 IPCC AR6 WGIII
Do Not Cite, Quote or Distribute 8-72 Total pages: 157
(Kastner and Stern 2015; Stern et al. 2016; Wynes et al. 2018; Tiefenbeck et al. 2019). The energy-1
saving potentials of changing occupant behaviour can range between 10% and 25% for residential 2
buildings, and between 5% and 30% for commercial buildings (Zhang et al. 2018). Households are 3
more likely to invest in energy-related home technologies if they believe it financially benefits (rather 4
than disadvantages) them, increases comfort, or will benefit the natural environment (Kastner and Stern 5
2015). Social influences and availability of funding for household energy measures also support 6
behaviour change (Kastner and Stern 2015). 7
8
8.4.5.1 Increasing locational and mobility options 9
Spatial planning, urban form, and infrastructure can be utilized to deliberately increase both locational 10
and mobility options for socio-behavioural change in support of urban mitigation. The mitigation 11
impacts of active travel can include a reduction of mobility-related lifecycle CO2 emissions by about 12
0.5 tonnes over a year when an average person cycles one trip per day more, and drives one trip per day 13
less, for 200 days a year (Brand et al. 2021). Urban areas that develop and implement effective 15/20-14
minute city programs are very likely to reduce urban energy use and multiply emission reductions, 15
representing an important cascading effect. 16
Accessibility as a criterion widens the focus beyond work trips and VMTs, paying attention to a broader 17
set of destinations beyond workplaces, as well as walking and biking trips or active travel. It holds 18
promise for targeting and obtaining greater reductions in GHG emissions in household travel by 19
providing access through walking, biking, and public transit. Accessibility as a criterion for urban form 20
has been embedded in neighbourhood form models since at least the last century and in more recent 21
decades in the urban village concept of the New Urbanism (Duany and Plater-Zyberck 1991) and TODs 22
(Calthorpe 1993). However, accessibility did not gain much traction in urban planning and 23
transportation until the last decade. The experience of cities and metropolitan areas with the COVID-24
19 pandemic has led to a further resurgence in interest and importance (Handy 2020; Hu et al. 2020), 25
and is becoming a criterion at the core of the concept of the 15/20-minute city (Moreno et al. 2021; 26
Pozoukidou and Chatziyiannaki 2021). Initially, neighbourhoods have been designed to provide quality, 27
reliable services within 15 or 20 minutes of active transport (i.e., walking or cycling), as well as a variety 28
of housing options and open space (Portland Bureau of Planning and Sustainability 2012; Pozoukidou 29
and Chatziyiannaki 2021; State Government of Victoria 2021). Community life circles strategy for 30
urban areas have also emphasized walking access and health (Weng et al. 2019; Wu et al. 2021). The 31
growing popularity of the 15/20-minute city movement has significant potential for reducing 32
VMT/VKT and associated GHG emissions. 33
34
8.4.5.2 Avoiding, minimizing, and recycling waste 35
The waste sector is a significant source of GHG emissions, particularly CH4 (Gonzalez-Valencia et al. 36
2016; Nisbet et al. 2019). Currently, the sector remains the largest contributor to urban emissions after 37
the energy sector, even in low-carbon cities (Lu and Li 2019). Since waste management systems are 38
usually under the control of municipal authorities, they are a prime target for city-level mitigation efforts 39
with co-benefits (EC 2015, 2020; Gharfalkar et al. 2015; Herrero and Vilella 2018; Zaman and Ahsan 40
2019). Despite general agreement on mitigation impacts, quantification remains challenging due to 41
differing assumptions for system boundaries and challenges related to measuring avoided waste (Zaman 42
and Lehmann 2013; Bernstad Saraiva Schott and Cánovas 2015; Matsuda et al. 2018). 43
The implementation of the waste hierarchy from waste prevention onward, as well as the effectiveness 44
of waste separation at source, involves socio-behavioural options in the context of urban infrastructure 45
(Sun et al. 2018a; Hunter et al. 2019). Managing and treating waste as close to the point of generation 46
as possible, including distributed waste treatment facilities, can minimize transport-related emissions, 47
ACCEPTED VERSION
SUBJECT TO FIN
AL EDITS
Final Government Distribution Chapter 8 IPCC AR6 WGIII
Do Not Cite, Quote or Distribute 8-73 Total pages: 157
congestion, and air pollution. Home composting and compact urban form can also reduce waste 1
transport emissions (Oliveira et al. 2017). Decentralized waste management can reinforce source-2
separation behaviour since the resulting benefits can be more visible (Eisted et al. 2009; Hoornweg and 3
Bhada-Tata 2012; Linzner and Lange 2013). Public acceptance for waste management is greatest when 4
system costs for citizens are reduced, there is greater awareness of primary waste separation at source, 5
and there are positive behavioural spill-over across environmental policies (Milutinović et al. 2016; 6
Boyer and Ramaswami 2017; Díaz-Villavicencio et al. 2017; Slorach et al. 2020). In addition to the 7
choice of technology, the costs of waste management options depends on the awareness of system users 8
that can represent time-dependent costs (Khan et al. 2016; Chifari et al. 2017; Ranieri et al. 2018; Tomić 9
and Schneider 2020). Waste management systems and the inclusion of materials from multiple urban 10
sectors for alternative by-products can increase scalability (Eriksson et al. 2015; Boyer and Ramaswami 11
2017; D’Adamo et al. 2021). As a broader concept, circular economy approaches can contribute to 12
managing waste (see Box 12.2) with varying emissions impacts (see Section 5.3.4). 13
The generation and composition of waste varies considerably from region to region and city to city. So 14
do the levels of institutional management, infrastructure, and (informal) work in waste disposal 15
activities. Depending on context, policy priorities are directed towards reducing waste generation and 16
transforming waste to energy or other products in a circular economy (Diaz 2017; Ezeudu and Ezeudu 17
2019; Joshi et al. 2019; Calderón Márquez and Rutkowski 2020; Fatimah et al. 2020). Similarly, waste 18
generation, waste collection coverage, recycling, and composting rates, as well as the means of waste 19
disposal and treatment, differ widely, including the logistics of urban waste management systems. 20
Multiple factors influence waste generation, and regions with similar urbanization rates can generate 21
different levels of waste per capita (Kaza et al. 2018). 22
Under conventional practices, municipal solid waste is projected to increase by about 1.4 Gt between 23
2016 and 2050, reaching 3.4 Gt in 2050 (Kaza et al. 2018). Integrated policymaking can increase the 24
energy, material, and emissions benefits in the waste management sector (Hjalmarsson 2015; Fang et 25
al. 2017; Jiang et al. 2017). Organisational structure and program administration poses demands for 26
institutional capacity, governance, and cross-sectoral coordination for obtaining the maximum benefit 27
(Hjalmarsson 2015; Kalmykova et al. 2016; Conke 2018; Marino et al. 2018; Yang et al. 2018). 28
The informal sector plays a critical role in waste management, particularly but not exclusively in 29
developing countries (Linzner and Lange 2013; Dias 2016). Sharing of costs and benefits, and 30
transforming informality of waste recycling activities into programs, can support distributional effects 31
(Conke 2018; Grové et al. 2018). Balancing centralized and decentralized waste management options 32
along low-carbon objectives can address potential challenges in transforming informality (de Bercegol 33
and Gowda 2019). Overall, the positive impacts of waste management on employment and economic 34
growth can be increased when informality is transformed to stimulate employment opportunities for 35
value-added products with an estimated 45 million jobs in the waste management sector by 2030 36
(Alzate-Arias et al. 2018; Coalition for Urban Transitions 2020; Soukiazis and Proença 2020). 37
38
8.4.6 Urban-rural linkages 39
Urban-rural linkages, especially through waste, food, and water, are prominent elements of the urban 40
system, given that cities are open systems that depend on their hinterlands for imports and exports 41
(Pichler et al. 2017), and include resources, products for industrial production or final use (see Section 42
8.1.6). As supply chains are becoming increasingly global in nature, so are the resource flows with the 43
hinterlands of cities. In addition to measures within the jurisdictional boundaries of cities, cities can 44
influence large upstream emissions through their supply chains, as well as through activities that rely 45
on resources outside city limits. The dual strategy of implementing local actions and taking 46
responsibility for the entire supply chains of imported and exported goods can reduce GHG emissions 47
outside of a city’s administrative boundaries (see Figure 8.15). 48
ACCEPTED VERSION
SUBJECT TO FIN
AL EDITS
Final Government Distribution Chapter 8 IPCC AR6 WGIII
Do Not Cite, Quote or Distribute 8-74 Total pages: 157
Waste prevention, minimisation, and management provides the potential of alleviating resource usage 1
and upstream emissions from urban settlements (Swilling et al. 2018; Chen et al. 2020a; Harris et al. 2
2020). Integrated waste management and zero-waste targets can allow urban areas to maximize the 3
mitigation potential while reducing pressures on land use and the environment. This mitigation option 4
reduces emissions due to (1) avoided emissions upstream in the supply chain of materials based on 5
measures for recycling and the reuse of materials, (2) avoided emissions due to land use changes as well 6
as emissions that are released into the atmosphere from waste disposal, and (3) avoided primary energy 7
(see Glossary) spending and emissions. Socio-behavioural change that reduces waste generation 8
combined with technology and infrastructure according to the waste hierarchy can be especially 9
effective. The mitigation potential of waste-to-energy depends on the technological choices that are 10
undertaken (e.g., anaerobic digestion of the organic fraction), the emissions factor of the energy mix 11
that it replaces, and its broader role within integrated municipal solid management practices (Eriksson 12
et al. 2015; Potdar et al. 2016; Yu and Zhang 2016; Soares and Martins 2017; Alzate-Arias et al. 2018; 13
Islam 2018). The climate mitigation potential of anaerobic digestion plants can increase when power, 14
heat and/or cold is co-produced (Thanopoulos et al. 2020). 15
Urban food systems, as well as city-regional production and distribution of food, factors into supply 16
chains. Reducing food demand from urban hinterlands can have a positive impact on energy and water 17
demand for food production (Eigenbrod and Gruda 2015) (see ‘food system’ in Glossary). Managing 18
food waste in urban areas through recycling or reduction of food waste at source of consumption would 19
require behavioural change (Gu et al. 2019). Urban governments could also support shifts towards more 20
climate-friendly diets, including through procurement policies. These strategies have created economic 21
opportunities or have enhanced food security while reducing the emissions that are associated with 22
waste and the transportation of food. Strategies for managing food demand in urban areas would depend 23
on the integration of food systems in urban planning. 24
Urban and peri-urban agriculture and forestry is pursued by both developing and some developed 25
country cities. There is increasing evidence for economically feasible, socially acceptable, and 26
environmentally supportive urban and peri-urban agricultural enterprises although these differ between 27
cities (Brown 2015; Eigenbrod and Gruda 2015; Blay-Palmer et al. 2019; De la Sota et al. 2019). The 28
pathways include integrated crop-livestock systems, urban agroforestry systems, aquaculture-livestock-29
crop systems, and crop systems (Lwasa et al. 2015), while the mitigation potential of urban and peri-30
urban agriculture has medium agreement and low evidence. Strategies for urban food production in 31
cities have also relied on recycling nutrients from urban waste and utilisation of harvested rainwater or 32
wastewater. 33
Systems for water reallocation between rural areas and urban areas will require change by leveraging 34
technological innovations for water capture, water purification, and reducing water wastage either by 35
plugging leakages or changing behaviour in regard to water use (Eigenbrod and Gruda 2015; Prior et 36
al. 2018). Reducing energy use for urban water systems involves reducing energy requirements for 37
water supply, purification, distribution, and drainage (Ahmad et al. 2020). Various levels of rainwater 38
harvesting in urban settings for supplying end-use water demands or supporting urban food production 39
can reduce municipal water demands, including by up to 20% or more in Cape Town (Fisher-Jeffes et 40
al. 2017). 41
42
8.4.7 Cross-sectoral integration 43
There are two broad categories of urban mitigation strategies. One is from the perspective of key sectors, 44
including clean energy, sustainable transport, and construction (Rocha et al. 2017; Álvarez Fernández 45
2018; Magueta et al. 2018; Seo et al. 2018; Waheed et al. 2018); the coupling of these sectors can be 46
enabled through electrification (see Section 8.4.3.1). The other looks at the needs for emissions through 47
a more systematic or fundamental understanding of urban design, urban form, and urban spatial 48
ACCEPTED VERSION
SUBJECT TO FIN
AL EDITS
Final Government Distribution Chapter 8 IPCC AR6 WGIII
Do Not Cite, Quote or Distribute 8-75 Total pages: 157
planning (Wang et al. 2017; Privitera et al. 2018), and proposes synergistic scenarios for their 1
integration for carbon neutrality (Ravetz et al. 2020). 2
Single-sector analysis in low-carbon urban planning examines solutions in supply, demand, operations, 3
and assets management either from technological efficiency or from a system approach. For example, 4
the deployment of renewable energy technologies for urban mitigation can be evaluated in detail and 5
the transition to zero-carbon energy in energy systems and EVs in the transport sector can bring about 6
a broad picture for harvesting substantial low-carbon potentials through urban planning (Álvarez 7
Fernández 2018; Tarigan and Sagala 2018) (high agreement, robust evidence). 8
The effect of urban carbon lock-in on land use, energy demand, and emissions vary depending on 9
national circumstances (Wang et al. 2017; Pan 2020). Systematic consideration of urban spatial 10
planning and urban forms, such as polycentric urban regions and rational urban population density, is 11
essential not only for liveability but also for achieving net zero GHG emissions as it aims to shorten 12
commuting distances and is able to make use of NBS for energy and resilience (high agreement, medium 13
evidence). However, crucial knowledge gaps remain in this field. There is a shortage of consistent and 14
comparable GHG emissions data at the city level and a lack of in-depth understanding of how urban 15
renewal and design can contribute to carbon neutrality (Mi et al. 2019). 16
An assessment of opportunities suggests that strategies for material efficiency that cross-cut sectors will 17
have greater impact than those that focus one dimensionally on a single sector (UNEP and IRP 2020). 18
In the urban context, this implies using less material by the design of physical infrastructure based on 19
light-weighting and down-sizing, material substitution, prolonged use, as well as enhanced recycling, 20
recovery, remanufacturing, and reuse of materials and related components. For example, light-weight 21
design in residential buildings and passenger vehicles can enable about 20% reductions in lifecycle 22
material-related GHG emissions (UNEP and IRP 2020). 23
The context of urban areas as the nexus of both sectors (i.e., energy, and urban form and planning) 24
underlines the role of urban planning and policies in contributing to reductions in material-related GHG 25
emissions while enabling housing and mobility services for the benefit of inhabitants. In addition, 26
combining resource efficiency measures with strategic densification can increase the GHG reduction 27
potential and lower resource impacts. While resource efficiency measures are estimated to reduce GHG 28
emissions, land use, water consumption, and metal use impacts from a lifecycle assessment perspective 29
by 24–47% over a baseline, combining resource efficiency with strategic densification can increase this 30
range to about 36–54% over the baseline for a sample of 84 urban settlements worldwide (Swilling et 31
al. 2018). 32
Evidence from a systematic scoping of urban solutions further indicates that the GHG abatement 33
potential of integrating measures across urban sectors is greater than the net sum of individual 34
interventions due to the potential of realizing synergies when realized in tandem, such as urban energy 35
infrastructure and renewable energy (Sethi et al. 2020). Similarly, system-wide interventions, such as 36
sustainable urban form, are important for increasing the GHG abatement potential of interventions 37
based on individual sectoral projects (Sethi et al. 2020). Overall, the pursuit of inter-linkages among 38
urban interventions are important for accelerating GHG reductions in urban areas (Sethi et al. 2020); 39
this is also important for reducing reliance on carbon capture and storage technologies (CCS) at the 40
global scale (Figures 8.15 and 8.21). 41
Currently, cross-sectoral integration is one of the main thematic areas of climate policy strategies among 42
the actions that are adopted by signatories to an urban climate and energy network (Hsu et al. 2020c). 43
Although not as prevalent as those for efficiency, municipal administration, and urban planning 44
measures (Hsu et al. 2020c), strategies that are cross-cutting in nature across sectors can provide 45
important emission saving opportunities for accelerating the pace of climate mitigation in urban areas. 46
Cross-sectoral integration also involves mobilizing urban actors to increase innovation in energy 47
ACCEPTED VERSION
SUBJECT TO FIN
AL EDITS
Final Government Distribution Chapter 8 IPCC AR6 WGIII
Do Not Cite, Quote or Distribute 8-76 Total pages: 157
services and markets beyond individual energy efficiency actions (Hsu et al. 2020c). Indeed, single-1
sector versus cross-sector strategies for 637 cities from a developing country can enable an additional 2
15–36% contribution to the national climate mitigation reduction potential (Ramaswami et al. 2017a). 3
The strategies at the urban level involved those for energy cascading and exchange of materials that 4
connected waste, heat, and electricity strategies (Section 8.5 and Box 8.4). 5
The feasibility of upscaling multiple response options depends on the urban context as well as the stage 6
of urban development with certain stages providing additional opportunities over others (Dienst et al. 7
2015; Maier 2016; Affolderbach and Schulz 2017; Roldán-Fontana et al. 2017; Zhao et al. 2017a; Beygo 8
and Yüzer 2017; Lwasa 2017; Pacheco-Torres et al. 2017; Alhamwi et al. 2018; Kang and Cho 2018; 9
Lin et al. 2018; Collaço et al. 2019) (see Figures 8.19 and 8.21, and SM8.2). 10
11
8.5 Governance, institutions, and finance 12
Governance and other institutions act as core components to urban systems by facilitating and managing 13
linkages between different sectors, geographic regions, and stakeholders. This position renders 14
subnational governments and institutions key enablers of climate change mitigation (Seto et al. 2016, 15
2021; Hsu et al. 2018, 2020c; ; Vedeld et al. 2021) (see Section 8.4.1). Indeed, since AR5 more research 16
has emerged identifying theses actors as vehicles through which to accelerate local-to-global efforts to 17
decarbonize (IPCC 2018a; Hsu et al. 2020b; Salvia et al. 2021; Seto et al. 2021) (see also Chapter 13, 18
and Sections 4.2.3, 14.5.5, 15.6.5 and 16.4.7, and ‘subnational actors’ in Glossary). The current extent 19
(Section 8.3.3) and projected rise (Section 8.3.4.2) in the urban share of global emissions underscores 20
the transformative global impact of supporting urban climate governance and institutions (see also 21
Section 8.5.2). Further, the multisector approach to mitigation emphasized in this chapter (see Sections 22
8.4 and 8.6, and Figure 8.21) highlights the need for facilitation across sectors (Hsu et al. 2020c) (see 23
also Figure 8.19). 24
25
8.5.1 Multi-level governance 26
SR1.5 identified multilevel governance (see Glossary for full definition) as an enabling condition that 27
facilitates systemic transformation consistent with keeping global temperatures below 1.5°C (IPCC 28
2018a, 18–19). The involvement of governance at multiple levels is necessary to enable cities to plan 29
and implement emissions reductions targets (high confidence) (Seto et al. 2021) (see Boxes 8.3 and 30
8.4). Further, regional, national, and international climate goals are most impactful when local 31
governments are involved alongside higher levels, rendering urban areas key foci of climate governance 32
more broadly (high confidence) ( Fuhr et al. 2018; Kern 2019; Hsu et al. 2020b). 33
Since AR5, multilevel governance has grown in influence within the literature and has been defined as 34
a framework to understanding the complex interaction of the many players involved in GHG generation 35
and mitigation across geographic scales—the ‘vertical’ levels of governance from neighbourhoods to 36
the national and international levels, and those ‘horizontal’ networks of non-state and subnational actors 37
at various scales (Corfee-Morlot et al. 2009; Seto et al. 2014; Castán Broto 2017b; Fuhr et al. 2018; 38
Peng and Bai 2018; Kern 2019), and well as the complex linkages between them (Vedeld et al. 2021). 39
This more inclusive understanding of climate governance provides multiple pathways through which 40
urban actors can engage in climate policy to reduce emissions. 41
Multilevel, multi-player climate governance in practice 42
A multilevel, multi-player framework highlights both the opportunities and constraints on local 43
autonomy to engage in urban mitigation efforts (Castán Broto 2017b; Fuhr et al. 2018; Vedeld et al. 44
2021). When multiple actors—national, regional, and urban policymakers, as well as nonstate actors 45
ACCEPTED VERSION
SUBJECT TO FIN
AL EDITS
Final Government Distribution Chapter 8 IPCC AR6 WGIII
Do Not Cite, Quote or Distribute 8-77 Total pages: 157
and civil society—work together to exploit the opportunities, it leads to the most impactful mitigation 1
gains (Melica et al. 2018). This framework also highlights the multiple paths and potential synergies 2
available to actors who wish to pursue mitigation policies despite not having a full slate of enabling 3
conditions (Castán Broto 2017b; Keller 2017; Fuhr et al. 2018; Hsu et al. 2020b,a; Seto et al. 2021). 4
For example, Section 8.4.3. and 8.4.5 highlight how instigating the electrification of urban energy 5
systems requires a ‘layered’ approach to policy implementation across different levels of governance 6
(see Section 8.4.3.1 for specific policy mechanisms associated with electrification), with cities playing 7
a key role in setting standards, particularly through mechanisms like building codes (Hsu et al. 2020c; 8
Salvia et al. 2021), as well as through facilitation between stakeholders (e.g., consumers, government, 9
utilities, etc.) to advocate for zero-emissions targets (Linton et al. 2021; Seto et al. 2021). Local 10
governments can minimize trade-offs associated with electrification technologies by enabling circular 11
economy practices and opportunities (Pan et al. 2015; Gaustad et al. 2018; Sovacool et al. 2020). These 12
include public-private partnerships between consumers and producers, financial and institutional 13
support, and networking for stakeholders like entrepreneurs, so as to increase accessibility and 14
efficiency of recycling for consumers by providing a clear path from consumer waste back to the 15
producers (Pan et al. 2015; Prendeville et al. 2018; Fratini et al. 2019). Box 8.3 discusses the mitigation 16
benefits of coordination between local and central government in the context of Shanghai’s GHG 17
emissions reductions goals. 18
Still, there are constraints on urban autonomy that might limit urban mitigation influence. The capacity 19
of subnational governments to autonomously pursue emissions reductions on their own depends on 20
different political systems and other aspects of multilevel governance, such as innovation, legitimacy, 21
and institutional fit, as well as the resources, capacity, and knowledge available to subnational 22
technicians and other officials (Widerberg and Pattberg 2015; Valente de Macedo et al. 2016; Green 23
2017; Roger et al. 2017). Financing is considered one of the most crucial facets of urban climate change 24
mitigation. It is also considered one of the biggest barriers given the limited financial capacities of local 25
and regional governments (see Section 8.5.4 and 8.5.5). 26
When sufficient local autonomy is present, local policies have the ability to upscale to higher levels of 27
authority imparting influence at higher geographic scales. Established urban climate leaders with large 28
institutional capacity can influence small and mid-sized cities, or other urban areas with less 29
institutional capacity, to enact effective climate policies, by engaging with those cities through 30
transnational networks and by adopting a public presence of climate leadership (Chan et al. 2015; Kern 31
2019; Seto et al. 2021) (see Section 8.5.3). Increasingly, subnational actors are also influencing their 32
national and international governments through lobbying efforts that call on them to adopt more 33
ambitious climate goals and provide more support for subnational GHG mitigation effort. These 34
dynamics underscore the importance of relative local autonomy in urban GHG mitigation policy. They 35
also highlight the growing recognition of subnational authorities’ role in climate change mitigation by 36
national and international authorities. 37
The confluence of political will and policy action at the local level, and growing resources offered 38
through municipal and regional networks and agreements, have provided a platform for urban actors to 39
engage in international climate policy (see Section 8.5.3). This phenomena is recognized in the Paris 40
Agreement, which, for the first time in a multilateral climate treaty, referenced the crucial role 41
subnational and nonstate actors like local communities have in meeting the goals set forth in the 42
agreement (UNFCCC 2015). The Durban Platform for Enhanced Action (Widerberg and Pattberg 2015) 43
as well as UN Habitat’s NUA and the 2030 Development Agenda are other examples of the international 44
sphere elevating the local level to global influence (Fuhr et al. 2018). Another facet of local-to-global 45
action is the emergence of International Cooperative Initiatives (ICIs) (Widerberg and Pattberg 2015). 46
One such ICI, the City Hall Declaration, was signed alongside the Paris Agreement during the first 47
Climate Summit for Local Leaders. Signatories included hundreds of local government leaders, private 48
ACCEPTED VERSION
SUBJECT TO FIN
AL EDITS
Final Government Distribution Chapter 8 IPCC AR6 WGIII
Do Not Cite, Quote or Distribute 8-78 Total pages: 157
sector representatives, and NGOs, who pledged to enact the goals of the Paris Agreement through their 1
own spheres of influence (Cities for Climate 2015). A similar Summit has been held at each subsequent 2
UNFCCC COP. Like transnational climate networks, these platforms provide key opportunities to local 3
governments to further their own mitigation goals, engage in knowledge transfer with other cities and 4
regions, and shape policies at higher levels of authority (Cities for Climate 2015; Castán Broto 2017b). 5
6
START BOX 8.3 HERE 7
Box 8.3 Coordination of fragmented policymaking for low-carbon urban development: example 8
from Shanghai 9
As a growing megacity in the Global South, Shanghai represents the challenge of becoming low carbon 10
despite its economic growth and population size (Chen et al. 2017). Shanghai was designated as one of 11
the pilot low-carbon cities by the central government. The city utilized a coordination mechanism for 12
joining fragmented policymaking across the city’s economy, energy, and environment. The 13
coordination mechanism was supported by a direct fund that enabled implementation of cross-sector 14
policies beyond a single-sector focus across multiple institutions while increasing capacity for enabling 15
a low carbon transition for urban sustainability (Peng and Bai 2020). 16
Implementation and governance process 17
In Shanghai, coordination between the central and local governments had an instrumental role for 18
encouraging low-carbon policy experimentation. Using a nested governance framework, the central 19
government provided target setting and performance evaluation while the local government initiated 20
pilot projects for low-carbon development. The policy practices in Shanghai surpassed the top-down 21
targets and annual reporting of GHG emissions, including carbon labelling standards at the local level, 22
pilot programs for transitioning sub-urban areas, and the engagement of public utilities (Peng and Bai 23
2018). 24
Towards low-carbon urban development 25
New policy measures in Shanghai were built upon a series of related policies from earlier, ranging from 26
general energy saving measures to air pollution reduction. This provided a continuum of policy learning 27
for implementing low-carbon policy measures. An earlier policy was a green electricity scheme based 28
on the Jade Electricity Program while the need for greater public awareness was one aspect requiring 29
further attention in policy design (Baeumler et al. 2012), supporting policy-learning for policies later 30
on. The key point here is that low-carbon policies were built on and learned from earlier policies with 31
similar goals. 32
Outcomes and impacts of the policy mix 33
Trends during 1998 and 2015 indicate that energy intensity decreased from about 130 ton per million 34
RMB to about 45 ton per million RMB and carbon intensity decreased from about 0.35 Mt per billion 35
RMB to 0.10 Mt per billion RMB (Peng and Bai 2018). These impacts on energy and carbon intensities 36
represent progress while challenges remain. Among the challenges are the need for investment in low 37
carbon technology and increases in urban carbon sinks (Yang and Li 2018) while cross-sector 38
interaction and complexity are increasing. 39
END BOX 8.3 HERE 40
41
8.5.2 Mitigation potential of urban subnational actors 42
A significant research question that has been paid more attention in both the scientific and policy 43
communities is related to subnational actors’ role in and contribution to global climate mitigation. The 44
ACCEPTED VERSION
SUBJECT TO FIN
AL EDITS
Final Government Distribution Chapter 8 IPCC AR6 WGIII
Do Not Cite, Quote or Distribute 8-79 Total pages: 157
2018 UN Environment Programme’s (UNEP) annual Emissions Gap report in 2018 included for the 1
first time a special chapter on subnational and non-state (i.e., businesses and private actors) and assessed 2
the landscape of studies aiming to quantify their contributions to global climate mitigation. Non-state 3
action on net zero GHG or CO2 emissions continues to be emphasized (UNEP 2021) (see Box 8.4). 4
There has been an increase in the number of studies aiming to quantify the overall aggregate mitigation 5
impact of subnational climate action globally. Estimates for the significance of their impact vary widely, 6
from up to 30 MtCO2-eq from 25 cities in the United States in 2030 (Roelfsema 2017), to a 2.3 GtCO2-7
eq reduction in 2030 compared to a current policy scenario from over 10,239 cities participating in 8
GCoM (Hsu et al. 2018; GCoM 2019). For regional governments, the Under 2 Coalition, which includes 9
260 governments pledging goals to keep global temperature rise below 2°C, is estimated to reduce 10
emissions by 4.2 GtCO2-eq in 2030, compared to a current policy scenario (Kuramochi et al. 2020). 11
Some studies suggest that subnational mitigation actions (Roelfsema 2017; Kuramochi et al. 2020) are 12
in addition to national government mitigation efforts and can therefore reduce emissions even beyond 13
current national policies, helping to ‘bridge the gap’ between emissions trajectories consistent with 14
least-cost scenarios for limiting temperature rise below 1.5°C or 2°C (Blok et al. 2012). In some 15
countries, such as the United States, where national climate policies have been curtailed, the potential 16
for cities and regions’ emissions reduction pledges to make up the country’s Paris NDC is assessed to 17
be significant (Kuramochi et al. 2020). 18
These estimates are also often contingent on assumptions that subnational actors fulfil their pledges and 19
that these actions do not result in rollbacks in climate action (i.e., weakening of national climate 20
legislation) from other actors or rebound in emissions growth elsewhere, but data tracking or 21
quantifying the likelihood of their implementation remains rare (Chan et al. 2018; Hsu et al. 2019; Hale 22
et al. 2020; Kuramochi et al. 2020). Reporting networks may attract high-performing cities, suggesting 23
an artificially high level of cities interested in taking climate action or piloting solutions that may not 24
be effective elsewhere (van der Heijden 2018). These studies could also present a conservative view of 25
potential mitigation impact because they draw upon publicly reported mitigation actions and inventory 26
data, excluding subnational actors that may be taking actions but not reporting them (Kuramochi et al. 27
2020). The nuances of likelihood, and the drivers and obstacles of climate action across different 28
contexts is a key source of uncertainty around subnational actors’ mitigation impacts. 29
30
8.5.3 Urban climate networks and transnational governance 31
As of 2019, more than 10,000 cities and regions (Hsu et al. 2020a) have recorded participation in a 32
transnational or cooperative climate action network, which are voluntary membership networks of a 33
range of subnational governments such as cities, as well as regional governments like states and 34
provinces (Hsu et al. 2020a). These organizations, often operating across and between national 35
boundaries, entail some type of action on climate change. Among the most prominent climate networks 36
are GCoM, ICLEI, and C40, all of which ask its members to adopt emission reduction commitments, 37
develop climate action plans, and regularly report on emissions inventories. 38
Municipal and regional networks and agreements have provided a platform for urban actors to engage 39
in international climate policy (Fraundorfer 2017; Keller 2017; Fuhr et al. 2018; Hsu et al. 2018, 2020b; 40
Westman and Broto 2018; Kern 2019; Seto et al. 2021). Their impact comes through (1) providing 41
resources for cities and regions to reduce their GHG emissions and improve environmental quality more 42
generally, independent of national policy; (2) encouraging knowledge transfer between member cities 43
and regions; and (3) as platforms of national and international policy influence (Castán Broto 2017b; 44
Fuhr et al. 2018). 45
Subnational governments that participate in transnational climate networks, however, are primarily 46
located in developed countries, particularly Europe and North America, with far less representation in 47
ACCEPTED VERSION
SUBJECT TO FIN
AL EDITS
Final Government Distribution Chapter 8 IPCC AR6 WGIII
Do Not Cite, Quote or Distribute 8-80 Total pages: 157
developing countries. In one of the largest studies of subnational climate mitigation action, more than 1
93% of just over 6,000 quantifiable subnational climate commitments come from cities and regions 2
based in the European Union (NewClimate Institute et al. 2019). Such gaps in geographic coverage 3
have been attributed to factors such as the dominating role of Global North actors in the convening and 4
diffusion of ‘best practices’ related to climate action (Bouteligier 2013), or the more limited autonomy 5
or ability of subnational or non-state actors in Global South countries to define boundaries and interests 6
separately from national governments, particularly those that exercise top-down decision-making or 7
have vertically-integrated governance structures (Bulkeley et al. 2012). Many of the participating 8
subnational actors from under-represented regions are large mega-cities (of 10 million people or more) 9
that will play a pivotal role in shaping emissions trajectories (Data Driven Yale et al. 2018; NewClimate 10
Institute et al. 2019). 11
While these networks have proven to be an important resource in local-level mitigation, their long-term 12
effects and impact at larger scales is less certain (Valente de Macedo et al. 2016; Fuhr et al. 2018). Their 13
influence is most effective when multiple levels of governance are aligned in mitigation policy. 14
Nevertheless, these groups have become essential resources to cities and regions with limited 15
institutional capacity and support (Kern 2019) (for more on transnational climate networks and 16
transnational governance more broadly, see Sections 13.5 and 14.5). 17
18
START BOX 8.4 HERE 19
Box 8.4 Net zero targets and urban settlements 20
Around the world, net zero emissions targets, whether economy-wide or targeting a specific sector (e.g., 21
transport, buildings) or emissions scope (e.g., direct scope 1, or both scope 1 and 2), have been adopted 22
by at least 826 cities and 103 regions that represent 11% of the global population with 846 million 23
people across 6 continents (NewClimate Institute and Data-Driven EnviroLab 2020). In some countries, 24
the share of such cities and regions have reached a critical mass by representing more than 70% of their 25
total populations with or without net zero emissions targets at the national level. 26
In some cases, the scope of these targets extends beyond net zero emissions from any given sector based 27
on direct emissions (see Glossary) and encompass downstream emissions from a consumption-based 28
perspective with 195 targets that are found to represent economy-wide targets. These commitments 29
range from ‘carbon neutrality’ (see Glossary) or net zero GHG emissions targets, which entail near 30
elimination of city’s own direct or electricity-based emissions but could involve some type of carbon 31
offsetting, to more stringent net zero emissions goals (Data-Driven EnviroLab and NewClimate 32
Institute 2020) (for related definitions, such as ‘carbon neutral,’ ‘net zero CO2 emissions,’ ‘net zero 33
GHG emissions’ and ‘offset,’ see Glossary). 34
Currently, 43% of the urban areas with net zero emissions targets have also put into place related action 35
plans while about 24% have integrated net zero emissions targets into formal policies and legislation 36
(Data-Driven EnviroLab and NewClimate Institute 2020). Moreover, thousands of urban areas have 37
adopted renewable energy-specific targets for power, heating/cooling and transport and about 600 cities 38
are pursuing 100% renewable energy targets (REN21 2019, 2021) with some cities already achieving 39
it. 40
The extent of realising and implementing these targets with the collective contribution of urban areas 41
to net zero emissions scenarios with sufficient timing and pace of emission reductions will require a 42
coordinated integration of sectors, strategies, and innovations (Swilling et al. 2018; Hsu et al. 2020c; 43
Sethi et al. 2020; UNEP and IRP 2020). In turn, the transformation of urban systems can significantly 44
impact net zero emissions trajectories within mitigation pathways. Institutional capacity, governance, 45
ACCEPTED VERSION
SUBJECT TO FIN
AL EDITS
Final Government Distribution Chapter 8 IPCC AR6 WGIII
Do Not Cite, Quote or Distribute 8-81 Total pages: 157
financing, and cross-sector coordination is crucial for enabling and accelerating urban actions for rapid 1
decarbonization. 2
END BOX 8.4 HERE 3
4
8.5.4 Financing urban mitigation 5
Meeting the goals of the Paris Agreement will require fundamental changes that will be most successful 6
when cities work together with provincial and national leadership and legislation, third-sector 7
leadership, transformative action, and supportive financing. Urban governments often obtain their 8
powers from provincial, state and/or national governments, and are subjected to laws and regulations to 9
regulate development and implement infrastructure. In addition, the sources of revenue are often set at 10
these levels so that many urban governments rely on state/provincial and national government funds for 11
improving infrastructure, especially transit infrastructure. The increasing financialisation of urban 12
infrastructures is another factor that can make it more difficult for local governments to determine 13
infrastructure choices (O’Brien et al. 2019). Urban transit system operations, in particular, are heavily 14
subsidized in many countries, both locally and by higher levels of government. As a result of this 15
interplay of policy and legal powers among various levels of government, the lock-in nature of urban 16
infrastructures and built environments will require multi-level governance response to ensure meeting 17
decarbonization targets. The reliance on state and national policy and/or funding can accelerate or 18
impede the decarbonization of urban environments (McCarney et al. 2011; McCarney 2019). 19
The world’s infrastructure spending is expected to more than double from 2015 to 2030 under a low-20
carbon and climate resilient scenario. More than 70% of the infrastructure will concentrate in urban 21
areas by requiring USD 4.5-5.4 trillion per year (CCFLA 2015) . However, today’s climate finance 22
flows for cities or ‘urban climate finance,’ estimated at USD 384 billion annually on average in 2017/18, 23
are insufficient to meet the USD 4.5 trillion to USD 5.4 trillion-dollar annual investment needs for urban 24
mitigation actions across key sectors (CCFLA 2015; CPI and World Bank 2021; Negreiros et al. 2021). 25
Low-carbon urban form (e.g., compact, high-density, and mixed-use characteristics) is likely to 26
economize spending in infrastructure along with the application of new technologies and renewable 27
energies that would be able to recover the increasing upfront cost of low-carbon infrastructure from 28
more efficient operating and energy savings (Global Commission on the Economy and Climate 2014; 29
Foxon et al. 2015; Bhattacharya et al. 2016; Floater et al. 2017; Colenbrander et al. 2018b) (medium 30
evidence, high agreement). 31
Governments have traditionally financed a large proportion of infrastructure investment. When budget 32
powers remain largely centralized, intergovernmental transfers will be needed to fund low-carbon 33
infrastructure in cities. During the COVID-19 pandemic, cities tend to rely more on intergovernmental 34
transfers in the form of stimulus packages for economic recovery. Nonetheless, the risk of high carbon 35
lock-ins is likely to increase in rapidly growing cities if long-term urban mitigation strategies are not 36
incorporated into short-term economic recovery actions (Granoff et al. 2016; Floater et al. 2017; 37
Colenbrander et al. 2018b; CPI and World Bank 2021; Negreiros et al. 2021). Indeed, large and complex 38
infrastructure projects for urban mitigation are often beyond the capacity of both national government 39
and local municipality budgets. Additionally, the COVID-19 pandemic necessitates large government 40
expenditures for public health programs and decimates municipal revenue sources for urban 41
infrastructure projects in cities. 42
To meet the multi-trillion-dollar annual investment needs in urban areas, cities in partnership with 43
international institutions, national governments, and local stakeholders increasingly play a pivotal role 44
in mobilizing global climate finance resources for a range of low-carbon infrastructure projects and 45
related urban land use and spatial planning programs across key sectors (high confidence). In particular, 46
ACCEPTED VERSION
SUBJECT TO FIN
AL EDITS
Final Government Distribution Chapter 8 IPCC AR6 WGIII
Do Not Cite, Quote or Distribute 8-82 Total pages: 157
national governments are expected to set up enabling conditions for the mobilization of urban climate 1
finance resource by articulating various goals and strategies, improving pricing, regulation and 2
standards, and developing investment vehicles and risk sharing instruments (Qureshi 2015; Bielenberg 3
et al. 2016; Granoff et al. 2016; Floater et al. 2017; Sudmant et al. 2017; Colenbrander et al. 2018b; 4
Zhan and de Jong 2018; Hadfield and Cook 2019; CPI and World Bank 2021; Negreiros et al. 2021). 5
Indeed, 75% of the global climate finance for both mitigation and adaptation in 2017 and 2018 took the 6
form of commercial financing (e.g., balance sheets, commercial-rate loans, and equity), while 25% 7
came from the form of concessionary financing (e.g., grants, below-market-rate loans, etc.). However, 8
cities in developing countries are facing difficulty making use of commercial financing and gaining 9
access to international credit markets. Cities without international creditworthiness currently rely on 10
local sources, including domestic commercial banks (Global Commission on the Economy and Climate 11
2014; CCFLA 2015; Floater et al. 2017; Buchner et al. 2019) (medium evidence, high agreement). 12
Cities with creditworthiness have rapidly become issuers of ‘green bonds’ eligible for renewable 13
energy, energy efficiency, low-carbon transport, sustainable water, waste, and pollution, and other 14
various climate mitigation projects across the global regions since 2013. The world’s green bond market 15
reached USD 1 trillion in cumulative issuance, with issuance of USD 280 billion in 2020, during the 16
COVID-19 pandemic. While green municipal bonds still account for a small share of the whole green 17
bond market in 2020, scale is predicted to grow further in emerging markets over the coming years. 18
Green municipal bonds have great potential for cities to expand and diversify their investor base. In 19
addition, the process of issuing green municipal bonds is expected to promote cross-sector cooperation 20
within a city by bringing together various agencies responsible for finance, climate change, 21
infrastructure, planning and design, and operation. Indeed, the demand for green bonds presently 22
outstrips supply as being constantly over-subscripted (Global Commission on the Economy and Climate 23
2014; Saha and D’Almeida 2017; Amundi and IFC 2021) (robust evidence, high agreement). 24
On the other hand, cities without creditworthiness face difficulty making use of commercial financing 25
and getting access to international credit markets (Global Commission on the Economy and Climate 26
2014; CCFLA 2015; Floater et al. 2017). The lack of creditworthiness is one of the main problems 27
preventing cities from issuing green municipal bonds in developing countries. As a prerequisite for the 28
application of municipal debt-financing, it is an essential condition for cities to ensure sufficient own 29
revenues from low-carbon urbanization, or the default risk becomes too high for potential investors. 30
Indeed, many cities in developed countries and emerging economies have already accumulated 31
substantial amounts of debts through bond insurances, and on-going debt payments prevent new 32
investments in low-carbon infrastructure projects. 33
National governments and multilateral development banks might be able to provide support for debt 34
financing by developing municipal creditworthiness programs and issuing sovereign bonds or providing 35
national guarantees for investors (Floater et al. 2017). Another problem with green municipal bonds is 36
the lack of aggregation mechanisms to support various small-scale projects in cities. Asset-backed 37
securities are likely to reduce the default risk for investors through portfolio diversification and create 38
robust pipelines for a bundle of smalls-scale projects (Granoff et al. 2016; Floater et al. 2017; Saha and 39
D’Almeida 2017). 40
In principle, the upfront capital costs of various low-carbon infrastructure projects, including the costs 41
of urban climate finance (dividend and interest payments), are eventually transferred to users and other 42
stakeholders in the forms of taxes, charges, fees, and other revenue sources. Nevertheless, small cities 43
in developing countries are likely to have a small revenue base, most of which is committed to recurring 44
operating costs, associated with weak revenue collection and management systems. In recent years, 45
there has been scope to apply not only user-based but also land-based funding instruments for the 46
recovery of upfront capital costs (Braun and Hazelroth 2015; Kościelniak and Górka 2016; Floater et 47
al. 2017; Colenbrander et al. 2018b; Zhan and de Jong 2018; Zhan et al. 2018a). 48
ACCEPTED VERSION
SUBJECT TO FIN
AL EDITS
Final Government Distribution Chapter 8 IPCC AR6 WGIII
Do Not Cite, Quote or Distribute 8-83 Total pages: 157
In practice, however, the application of land-based or ‘land value capture’ funding requires cities to 1
arrange various instruments, including property (both land and building taxes), betterment levies/special 2
assessments, impact fees (exactions), tax increment financing, land readjustment/land pooling, sales of 3
public land/development rights, recurring lease payments, and transfer taxes/stamp duties, across 4
sectors in different urban contexts (Suzuki et al. 2015; Chapman 2017; Walters and Gaunter 2017; 5
Berrisford et al. 2018). Land value capture is expected not only for cities to generate additional revenue 6
streams but also to prevent low-density urban expansion around city-fringe locations. Inversely, land 7
value capture is supposed to perform well when accompanied by low-carbon urban form and private 8
real estate investments along with the application of green building technologies (Suzuki et al. 2015; 9
Floater et al. 2017; Colenbrander et al. 2018b) (robust evidence, high agreement). 10
For the implementation of land-based funding, property rights are essential. However, weak urban-rural 11
governance leads to corruption in land occupancy and administration, especially in developing countries 12
with no land information system or less reliable paper-based land records under a centralized 13
registration system. The lack of adequate property rights seriously discourages low-carbon 14
infrastructure and real estate investments in growing cities. 15
The emerging application of blockchain technology for land registry and real estate investment is 16
expected to change the governance framework, administrative feasibility, allocative efficiency, public 17
accountability, and political acceptability of land-based funding in cities across developed countries, 18
emerging economies, and developing countries (Graglia and Mellon 2018; Kshetri and Voas 2018). 19
Particularly, the concept of a transparent, decentralized public ledger is adapted to facilitate value-added 20
property transactions on a P2P basis without centralized intermediate parties and produce land-based 21
funding opportunities for low-carbon infrastructure and real estate development district-wide and city-22
wide in unconventional ways (Veuger 2017; Nasarre-Aznar 2018). 23
The consolidation of local transaction records into national or supranational registries is likely to 24
support large-scale land formalisation, but most pilot programs are not yet at the scale (Graglia and 25
Mellon 2018). Moreover, the potential application of blockchain for land-based funding instruments is 26
possibly associated with urban form attributes, such as density, compactness, and land use mixture, to 27
disincentivize urban expansion and emissions growth around city-fringe locations (medium confidence) 28
(Allam and Jones 2019). 29
30
8.5.5 Barriers and enablers for implementation 31
Irrespective of geography or development level, many cities face similar climate governance challenges 32
such as lacking institutional, financial, and technical capacities (Gouldson et al. 2015; Hickmann and 33
Stehle 2017; Sharifi et al. 2017; Fuhr et al. 2018). Large-scale system transformations are also deeply 34
influenced by factors outside governance and institutions such as private interests and power dynamics 35
(Jaglin 2014; Tyfield 2014). In some cases, these private interests are tied up with international flows 36
of capital. At the local level, a lack of empowerment, high upfront costs, inadequate and uncertain 37
funding for mitigation, diverse and conflicting policy objectives, multiple agencies and actors with 38
diverse interests, high levels of informality, and a siloed approach to climate action are constraining 39
factors to mainstreaming climate action (Beermann et al. 2016; Gouldson et al. 2016; Pathak and 40
Mahadevia 2018; Khosla and Bhardwaj 2019). 41
Yet urban mitigation options that can be implemented to transform urban systems involve the interplay 42
of multiple enablers and barriers. Based on a framework for assessing feasibility from a multi-43
dimensional perspective, feasibility is malleable and various enablers can be brought into play to 44
increase the implementation of mitigation options. The scope of this assessment enables an approach 45
for considering multiple aspects that have an impact on feasibility as a tool for policy support (Singh et 46
al. 2020). In Figure 8.19, the assessment framework that is based on geophysical, environmental-47
ACCEPTED VERSION
SUBJECT TO FIN
AL EDITS
Final Government Distribution Chapter 8 IPCC AR6 WGIII
Do Not Cite, Quote or Distribute 8-84 Total pages: 157
ecological, technological, economic, socio-cultural, and institutional dimensions is applied to identify 1
the enablers and/or barriers in implementing mitigation options in urban systems. The feasibility of 2
options may differ across context, time, and scale (see Supplementary Material 8.2). The line of sight 3
upon which the assessment is based includes urban case studies (Lamb et al. 2019) and assessments of 4
land use and spatial planning in IPCC SR1.5 (IPCC 2018a). 5
Across the enablers and barriers of different mitigation options, urban land use and spatial planning for 6
increasing co-located densities in urban areas has positive impacts in multiple indicators, particularly 7
reducing land use and preserving carbon sinks when the growth in urban extent is reduced and avoided, 8
which if brought into interplay in decision-making, can support the enablers for its implementation. 9
Improvements in air quality are possible when higher urban densities are combined with modes of active 10
transport, electrified mobility as well as urban green and blue infrastructure (see Sections 8.3.4, 8.4 and 11
8.6). The demands on geophysical resources, including materials for urban development, will depend 12
on whether additional strategies are in place with largely negative impacts under conventional practices. 13
The technological scalability of multiple urban mitigation options is favourable while varying according 14
to the level of existing urban development and scale of implementation (see Tables SM8.3 - SM8.4 in 15
Supplementary Material 8.2). 16
Similarly, multiple mitigation options have positive impacts on employment and economic growth, 17
especially when urban densities enable productivity. Possible distributional effects, including 18
availability of affordable accommodation and access to greenspace, are best addressed when urban 19
policy packages combine more than one policy objective. Such an approach can provide greater support 20
to urban mitigation efforts with progress towards shifting urban development to sustainability. The 21
electrification of the urban energy system involves multiple enablers that support the feasibility of this 22
mitigation option, including positive impacts on health and well-being. In addition, increases in urban 23
densities can support the planning of district heating and cooling networks that can decarbonize the 24
built environment at scale with technology readiness levels increasing for lower temperature supply 25
options. Preventing, minimizing, and managing waste as an urban mitigation option can be enabled 26
when informality in the sector is transformed to secure employment effects and value addition based on 27
the more circular use of resources (see Tables SM8.3 and SM8.4 in Supplementary Material 8.2, and 28
Sections 8.4.3 and 8.4.5). 29
As a combined evaluation, integrating multiple mitigation options in urban systems involves the greatest 30
requirement for strengthening institutional capacity and governance through cross-sectoral coordination 31
(see Section 8.4 and 8.6, and Figure 8.21). Notably, integrated action requires significant effort to 32
coordinate sectors and strategies across urban growth typologies (see Section 8.6). Institutional 33
capacity, if not strengthened to a suitable level to handle this process—especially to break out of carbon 34
lock-in—can fall short of the efforts this entails. These conditions can pose barriers for realizing cross-35
sectoral coordination while the formation of partnerships and stakeholder engagement take place as 36
important enablers. Overcoming institutional challenges for cross-sectoral coordination can support 37
realizing synergies among the benefits that each mitigation option can offer within and across urban 38
systems, including for the SDGs. These include those that can be involved in co-located and walkable 39
urban form together with decarbonizing and electrifying the urban energy system as well as urban green 40
and blue infrastructure, providing the basis for more liveable, resource efficient and compact urban 41
development with benefits for urban inhabitants (see Section 8.2). 42
ACCEPTED VERSION
SUBJECT TO FIN
AL EDITS
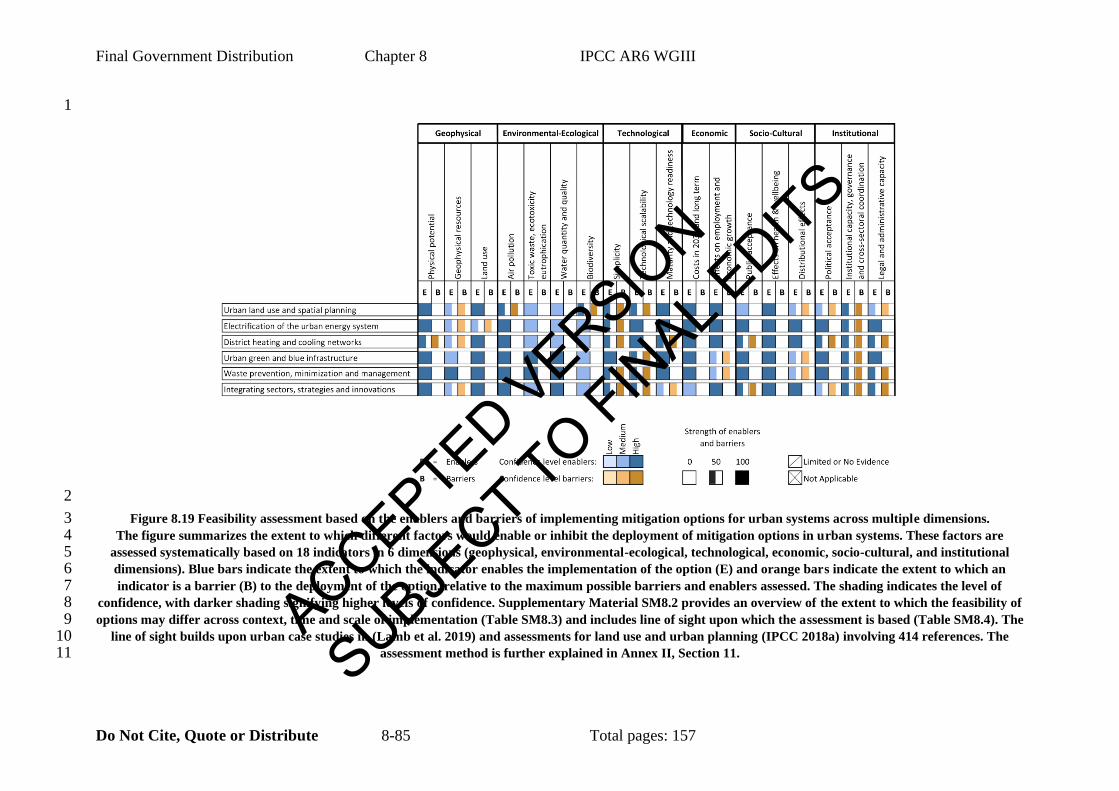
Final Government Distribution Chapter 8 IPCC AR6 WGIII
Do Not Cite, Quote or Distribute 8-85 Total pages: 157
1
2
Figure 8.19 Feasibility assessment based on the enablers and barriers of implementing mitigation options for urban systems across multiple dimensions. 3 The figure summarizes the extent to which different factors would enable or inhibit the deployment of mitigation options in urban systems. These factors are 4
assessed systematically based on 18 indicators in 6 dimensions (geophysical, environmental-ecological, technological, economic, socio-cultural, and institutional 5 dimensions). Blue bars indicate the extent to which the indicator enables the implementation of the option (E) and orange bars indicate the extent to which an 6 indicator is a barrier (B) to the deployment of the option, relative to the maximum possible barriers and enablers assessed. The shading indicates the level of 7
confidence, with darker shading signifying higher levels of confidence. Supplementary Material SM8.2 provides an overview of the extent to which the feasibility of 8 options may differ across context, time and scale of implementation (Table SM8.3) and includes line of sight upon which the assessment is based (Table SM8.4). The 9
line of sight builds upon urban case studies in (Lamb et al. 2019) and assessments for land use and urban planning (IPCC 2018a) involving 414 references. The 10 assessment method is further explained in Annex II, Section 11. 11
ACCEPTED VERSION
SUBJECT TO FIN
AL EDITS
Final Government Distribution Chapter 8 IPCC AR6 WGIII
Do Not Cite, Quote or Distribute 8-86 Total pages: 157
8.6 A roadmap for integrating mitigation strategies for different 1
urbanization typologies 2
The most effective and appropriate packages of mitigation strategies will vary depending on several 3
dimensions of a city. This section brings together the urban mitigation options described in Section 8.4 4
and assesses the range of mitigation potentials for different types of cities. There is consensus in the 5
literature that mitigation strategies are most effective when multiple interventions are coupled together. 6
Urban-scale interventions that implement multiple strategies concurrently through policy packages are 7
more effective and have greater emissions savings than when single interventions are implemented 8
separately. This is because a citywide strategy can have cascading effects across sectors, that have 9
multiplicative effects on GHG emissions reduction within and outside a city’s administrative 10
boundaries. Therefore, city-scale strategies can reduce more emissions than the net sum of individual 11
interventions, particularly if multiple scales of governance are included (see Sections 8.4 and 8.5). 12
Furthermore, cities have the ability to implement policy packages across sectors using an urban systems 13
approach, such as through planning, particularly those that affect key infrastructures (see Figures 8.15, 14
8.17 and 8.22). 15
The way that cities are laid out and built will shape the entry points for realising systemic transformation 16
across urban form and infrastructure, energy systems, and supply chains. Section 8.3.1 discusses the 17
ongoing trend of rapid urbanization—and how it varies through different forms of urban development 18
or ‘typologies’ (see Figure 8.6). Below, Figure 8.20 distils the typologies of urban growth across three 19
categories: emerging, rapidly growing, and established. Urban growth is relatively stabilized in 20
established urban areas with mature urban form while newly taking shape in emerging urban areas. In 21
contrast, rapidly growing urban areas experience pronounced changes in outward and/or upward 22
growth. These typologies are not mutually exclusive, and can co-exist within an urban system; cities 23
typically encompass a spectrum of development, with multiple types of urban form and various 24
typologies (Mahtta et al. 2019). 25
Taken together, urban form (Figure 8.16) and growth typology (Figure 8.20) can act as a roadmap for 26
cities or sub-city communities looking to identify their urban context and, by extension, the mitigation 27
opportunities with the greatest potential to reduction GHG emissions. Specifically, this considers 28
whether a city is established with existing and managed infrastructure, rapidly growing with new and 29
actively developing infrastructure, or emerging with large amounts of infrastructure build-up. The long 30
lifespan of urban infrastructure locks in behaviour and committed emissions. Therefore, the sequencing 31
of mitigation strategies is important for determining emissions savings in the short- and long-term. 32
Hence, different types of cities will have different mitigation pathways, depending upon a city’s urban 33
form and state of that city’s urban development and infrastructure; the policy packages and 34
implementation plan that provide the highest mitigation potential for rapidly growing cities with new 35
infrastructures will differ from those for established cities with existing infrastructure. 36
Mitigation options that involve spatial planning, urban form, and infrastructure—particularly co-located 37
and mixed land use, as well as TOD—provide the greatest opportunities when urban areas are rapidly 38
growing or emerging (see Section 8.4.2). Established urban areas that are already compact and walkable 39
have captured mitigation benefits from these illustrative strategies to various extents. Conversely, 40
established urban areas that are dispersed and auto-centric have foregone these opportunities with the 41
exception of urban infill and densification that can be used to transform or continue to transform the 42
existing urban form. Figure 8.21 underscores that urban mitigation options and illustrative strategies 43
differ by urban growth typologies and urban form. Cities can identify their entry points for sequencing 44
mitigation strategies. 45
The emissions reduction potential of urban mitigation options further varies based on governance 46
contexts, institutional capacity, economic structure, as well as human and physical geography. 47
ACCEPTED VERSION
SUBJECT TO FIN
AL EDITS
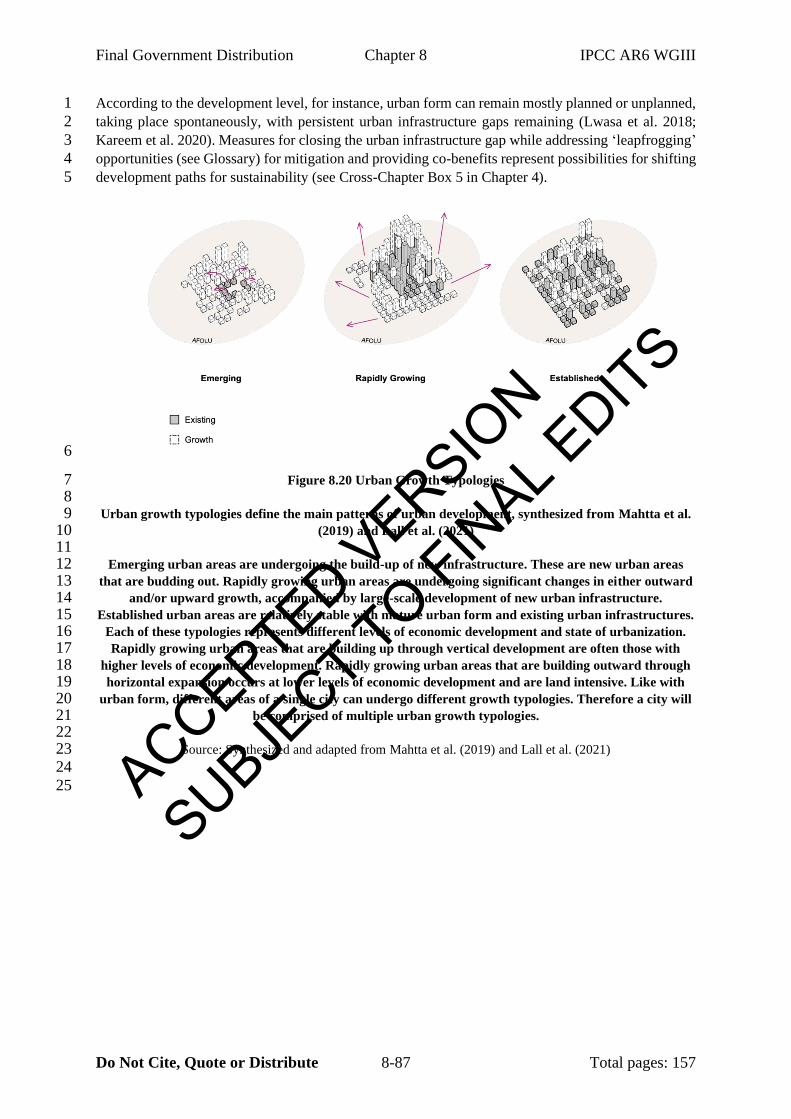
Final Government Distribution Chapter 8 IPCC AR6 WGIII
Do Not Cite, Quote or Distribute 8-87 Total pages: 157
According to the development level, for instance, urban form can remain mostly planned or unplanned, 1
taking place spontaneously, with persistent urban infrastructure gaps remaining (Lwasa et al. 2018; 2
Kareem et al. 2020). Measures for closing the urban infrastructure gap while addressing ‘leapfrogging’ 3
opportunities (see Glossary) for mitigation and providing co-benefits represent possibilities for shifting 4
development paths for sustainability (see Cross-Chapter Box 5 in Chapter 4). 5
6
Figure 8.20 Urban Growth Typologies 7 8
Urban growth typologies define the main patterns of urban development, synthesized from Mahtta et al. 9 (2019) and Lall et al. (2021) 10
11 Emerging urban areas are undergoing the build-up of new infrastructure. These are new urban areas 12
that are budding out. Rapidly growing urban areas are undergoing significant changes in either outward 13 and/or upward growth, accompanied by large-scale development of new urban infrastructure. 14
Established urban areas are relatively stable with mature urban form and existing urban infrastructures. 15 Each of these typologies represents different levels of economic development and state of urbanization. 16 Rapidly growing urban areas that are building up through vertical development are often those with 17
higher levels of economic development. Rapidly growing urban areas that are building outward through 18 horizontal expansion occurs at lower levels of economic development and are land intensive. Like with 19
urban form, different areas of a single city can undergo different growth typologies. Therefore a city will 20 be comprised of multiple urban growth typologies. 21
22 Source: Synthesized and adapted from Mahtta et al. (2019) and Lall et al. (2021) 23
24
25 ACCEPTED VERSION
SUBJECT TO FIN
AL EDITS
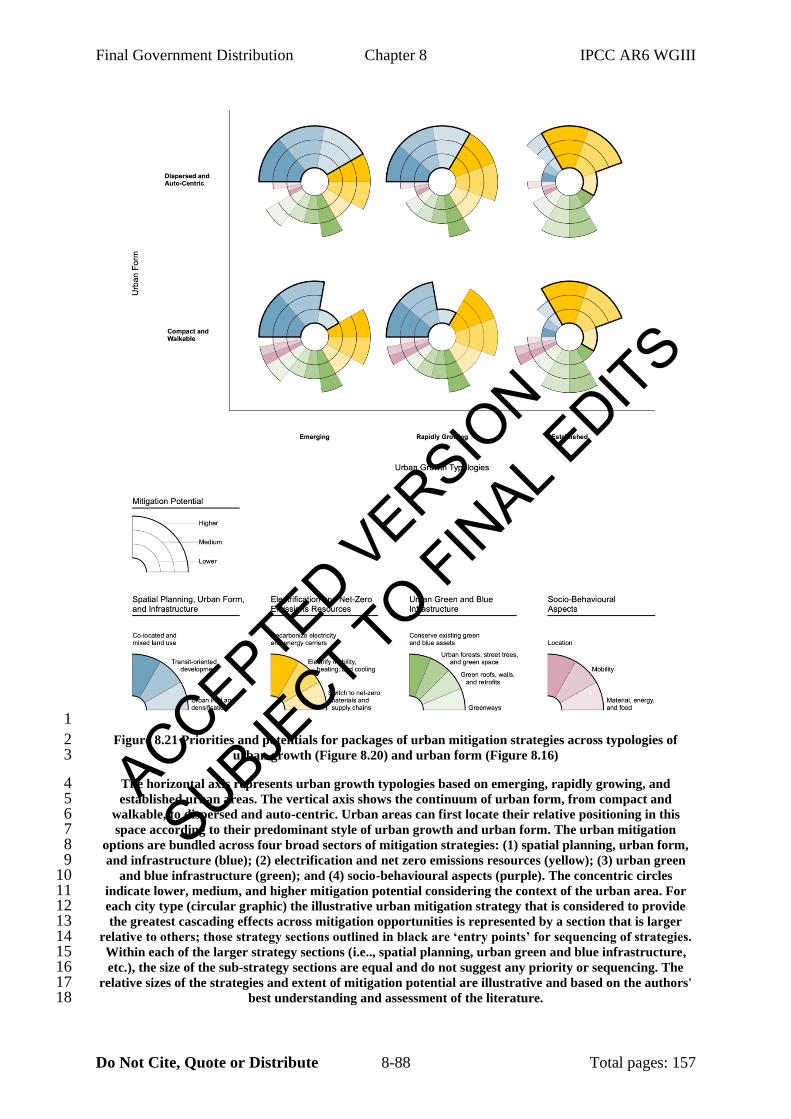
Final Government Distribution Chapter 8 IPCC AR6 WGIII
Do Not Cite, Quote or Distribute 8-88 Total pages: 157
1
Figure 8.21 Priorities and potentials for packages of urban mitigation strategies across typologies of 2 urban growth (Figure 8.20) and urban form (Figure 8.16) 3
The horizontal axis represents urban growth typologies based on emerging, rapidly growing, and 4 established urban areas. The vertical axis shows the continuum of urban form, from compact and 5
walkable, to dispersed and auto-centric. Urban areas can first locate their relative positioning in this 6 space according to their predominant style of urban growth and urban form. The urban mitigation 7
options are bundled across four broad sectors of mitigation strategies: (1) spatial planning, urban form, 8 and infrastructure (blue); (2) electrification and net zero emissions resources (yellow); (3) urban green 9
and blue infrastructure (green); and (4) socio-behavioural aspects (purple). The concentric circles 10 indicate lower, medium, and higher mitigation potential considering the context of the urban area. For 11 each city type (circular graphic) the illustrative urban mitigation strategy that is considered to provide 12 the greatest cascading effects across mitigation opportunities is represented by a section that is larger 13
relative to others; those strategy sections outlined in black are ‘entry points’ for sequencing of strategies. 14 Within each of the larger strategy sections (i.e.., spatial planning, urban green and blue infrastructure, 15 etc.), the size of the sub-strategy sections are equal and do not suggest any priority or sequencing. The 16
relative sizes of the strategies and extent of mitigation potential are illustrative and based on the authors' 17 best understanding and assessment of the literature. 18
ACCEPTED VERSION
SUBJECT TO FIN
AL EDITS
Final Government Distribution Chapter 8 IPCC AR6 WGIII
Do Not Cite, Quote or Distribute 8-89 Total pages: 157
1
8.6.1 Mitigation opportunities for established cities 2
Established cities will achieve the largest GHG emissions savings by replacing, repurposing, or 3
retrofitting the building stock, encouraging modal shift, electrifying the urban energy system, as well 4
as infilling and densifying urban areas. 5
Shifting pathways to low-carbon development for established cities with existing infrastructures and 6
locked-in behaviours and lifestyles is admittedly challenging. Urban infrastructures such as buildings, 7
roads, and pipelines often have long lifetimes that lock-in emissions, as well as institutional and 8
individual behaviour. Although the expected lifetime of buildings varies considerably by geography, 9
design, and materials, typical lifespans are at minimum 30 years to more than 100 years. 10
Cities where urban infrastructure has already been built have opportunities to increase energy efficiency 11
measures, prioritize compact and mixed-use neighbourhoods through urban regeneration, advance the 12
urban energy system through electrification, undertake cross-sector synergies, integrate urban green and 13
blue infrastructure, encourage behavioural and lifestyle change to reinforce climate mitigation, and put 14
into place a wide range of enabling conditions as necessary to guide and coordinate actions in the urban 15
system and its impacts in the global system. Retrofitting buildings with state of the art deep energy 16
retrofit measures could reduce emissions of the existing stock by about 30–60% (Creutzig et al. 2016a) 17
and in some cases up to 80% (Ürge-Vorsatz et al. 2020) (see Section 8.4.3). 18
Established cities that are compact and walkable are likely to have low per capita emissions, and thus 19
can keep emissions low by focusing on electrification of all urban energy services and using urban green 20
and blue infrastructure to sequester and store carbon while reducing urban heat stress. Illustrative 21
mitigation strategies with the highest mitigation potential are decarbonizing electricity and energy 22
carriers while electrifying mobility, heating, and cooling (see Table 8.3 and Figure 8.19). Within 23
integrated strategies, the importance of urban forests, street trees, and green space as well as green roofs, 24
walls, and retrofits, also have high mitigation potential (see Section 8.4.4 and Figure 8.18). 25
Established cities that are dispersed and auto-centric are likely to have higher per capita emissions and 26
thus can reduce emissions by focusing on creating modal shift and improving public transit systems in 27
order to reduce urban transport emissions, as well as focusing on infilling and densifying. Only then 28
can the urban form constraints on locational and mobility options be increased. Among mitigation 29
options based on spatial planning, urban form, and infrastructure, urban infill and densification has 30
priority. For these cities, the use of urban green and blue infrastructure will be essential to offset residual 31
emissions that cannot be reduced because their urban form is already established and difficult to change. 32
System-wide energy savings and emissions reductions for low-carbon urban development is widely 33
recognized to require both behavioural and structural changes (Zhang and Li 2017). Synergies between 34
social and ecological innovation can reinforce the sustainability of urban systems while decoupling 35
energy usage and economic growth (Hu et al. 2018; Ma et al. 2018). In addition, an integrated 36
sustainable development approach that enables cross-sector energy efficiency, sustainable transport, 37
renewable energy, and local development in urban neighbourhoods can address issues of energy poverty 38
(Pukšec et al. 2018). In this context, cross-sectoral, multi-scale, and public-private collaborative action 39
is crucial to steer societies and cities closer to low-carbon futures (Hölscher et al. 2019). Such action 40
includes those for guiding residential living area per capita, limiting private vehicle growth, expanding 41
public transport, improving the efficiency of urban infrastructure, enhancing urban carbon pools, and 42
minimizing waste through sustainable, ideally circular, waste management (Lin et al. 2018). Through a 43
coordinated approach, urban areas can be transformed into hubs for renewable and distributed energy, 44
sustainable mobility, as well as inclusivity and health (Newman et al. 2017; Newman 2020). 45
ACCEPTED VERSION
SUBJECT TO FIN
AL EDITS
Final Government Distribution Chapter 8 IPCC AR6 WGIII
Do Not Cite, Quote or Distribute 8-90 Total pages: 157
Urban design for existing urban areas include strategies for urban energy transitions for carbon 1
neutrality based on renewable energy, district heating for the city centre and suburbs, as well as green 2
and blue interfaces (Pulselli et al. 2021). Integrated modelling approaches for urban energy system 3
planning, including land-use and transport and flexible demand-side options, is increased when 4
municipal actors are also recognized as energy planners (Yazdanie and Orehounig 2021) (see Section 5
8.4.3). Enablers for action can include the co-design of infill residential development through an 6
inclusive and participatory process with citizen utilities and disruptive innovation that can support net 7
zero carbon power while contributing to 1.5°C pathways, the SDGs, and affordable housing 8
simultaneously (Wiktorowicz et al. 2018). Cross-sectoral strategies for established cities, including 9
those taking place among 120 urban areas, also involve opportunities for sustainable development 10
(Kılkış 2019, 2021b). 11
A shared understanding for urban transformation through a participatory approach can largely avoid 12
maladaptation and contribute to equity (Moglia et al. 2018). Transformative urban futures that are 13
radically different from the existing trajectories of urbanization, including in developing countries, can 14
remain within planetary boundaries while being inclusive of the urban poor (Friend et al. 2016). At the 15
urban policy level, an analysis of 12,000 measures in urban-level monitoring emissions inventories 16
based on the mode of governance further suggests that local authorities with lower population have 17
primarily relied on municipal self-governing while local authorities with higher population more 18
frequently adopted regulatory measures as well as financing and provision (Palermo et al. 2020b). 19
Policies that relate to education and enabling were uniformly adopted regardless of population size 20
(Palermo et al. 2020b). Multi-disciplinary teams, including urban planners, engineers, architects, and 21
environmental institutions, can support local decision-making capacities, including for increasing 22
energy efficiency and renewable energy considering building intensity and energy use (Mrówczyńska 23
et al. 2021) (see also Section 8.5). 24
8.6.2 Mitigation opportunities for rapidly growing cities 25
Rapidly growing cities with new and actively developing infrastructures can avoid higher future 26
emissions through using urban planning to co-locate jobs and housing, and achieve compact urban 27
form; leapfrogging to low-carbon technologies; electrifying all urban services, including 28
transportation, cooling, heating, cooking, recycling, water extraction, wastewater recycling, etc.; and 29
preserving and managing existing green and blue assets. 30
Rapidly growing cities have significant opportunities for integrating climate mitigation response 31
options in earlier stages of urban development, which can provide even greater opportunities for 32
avoiding carbon lock-in and shifting pathways towards net zero GHG emissions. In growing cities that 33
are expected to experience large increases in population, a significant share of urban development 34
remains to be planned and built. The ability to shift these investments towards low-carbon development 35
earlier in the process represents an important opportunity for contributing to net zero GHG emissions 36
at the global scale. In particular, evidence suggests that investment in low-carbon development 37
measures and re-investment based on the returns of the measures even without considering substantial 38
co-benefits can provide tipping points for climate mitigation action and reaching peak emissions at 39
lower levels while decoupling emissions from economic growth, even in fast-growing megacity 40
contexts with well-established infrastructure (Colenbrander et al. 2017). 41
At the same time, some of the rapidly growing cities in developing countries can have existing walkable 42
urban design that can be maintained and supported with electrified urban rail plus renewable-energy-43
based solutions to avoid a shift to private vehicles (Sharma 2018). In addition, community-based 44
distributed renewable electricity can be applicable for the regeneration of informal settlements rather 45
than more expensive informal settlement clearance (Teferi and Newman 2018). Scalable options for 46
decentralized energy, water, and wastewater systems, as well as spatial planning and urban agriculture 47
and forestry, are applicable to urban settlements across multiple regions simultaneously (Lwasa 2017). 48
ACCEPTED VERSION
SUBJECT TO FIN
AL EDITS
Final Government Distribution Chapter 8 IPCC AR6 WGIII
Do Not Cite, Quote or Distribute 8-91 Total pages: 157
Rapidly urbanizing areas can experience pressure for rapid growth in urban infrastructure to address 1
growth in population. This challenge can be addressed with coordinated urban planning and support 2
from enabling conditions for pursuing effective climate mitigation (see Section 8.5 and Box 8.3). The 3
ability to mobilize low-carbon development will also increase opportunities for capturing co-benefits 4
for urban inhabitants while reducing embodied and operational emissions. Transforming urban growth, 5
including its impacts on energy and materials, can be carefully addressed with the integration of cross-6
sectoral strategies and policies. 7
Rapidly growing cities have entry points into an integrated strategy based on spatial planning, urban 8
form and infrastructure (see Figure 8.21). For rapidly growing cities that may be co-located and 9
walkable at present, remaining compact is better ensured when co-location and mixed land use as well 10
as TOD continues to be prioritized (see Section 8.4.2). Concurrently, ensuring that electricity and 11
energy carriers are decarbonized while electrifying mobility, heating and cooling will support the 12
mitigation potential of these cities. Along with an integrated approach across other illustrative 13
strategies, switching to net zero materials and supply chains holds importance (see Section 8.4.3). Cities 14
that remain compact and walkable can provide a greater array of locational and mobility options to the 15
inhabitants that can be adopted for mitigation benefits. Rapidly growing cities that may currently be 16
dispersed and auto-centric can capture high mitigation potential through urban infill and densification. 17
Conserving existing green and blue assets, thereby protecting sources of carbon storage and 18
sequestration, as well as biodiversity, have high potential for both kinds of existing urban form, 19
especially when the rapid growth can be controlled. 20
8.6.3 Mitigation opportunities for new and emerging cities 21
New and emerging cities have unparalleled potential to become low or net zero emissions urban areas 22
while achieving high quality of life by creating compact, co-located, and walkable urban areas with 23
mixed land use and TOD, that also preserve existing green and blue assets. 24
The fundamental building blocks that make up the physical attributes of cities, such as the layout of 25
streets, the size of the city blocks, the location of where people live versus where they work, can affect 26
and lock in energy demand for long time periods (Seto et al. 2016) (see Section 8.4.1). A large share of 27
urban infrastructures that will be in place by 2050 has yet to be constructed and their design and 28
implementation will determine both future GHG emissions as well as the ability to meet mitigation 29
goals (Creutzig et al. 2016a) (see Figure 8.10 and Table 8.1). Thus, there are tremendous opportunities 30
for new and emerging cities to be designed and constructed to be low-emissions while providing high 31
quality of life for their populations. 32
The UN International Resource Panel (IRP) estimates that building future cities under conventional 33
practices will require a more than doubling of material consumption, from 40 billion tonnes annually in 34
2010 to about 90 billion tonnes annually by 2050 (Swilling et al. 2018). Thus, the demand that new and 35
emerging cities will place on natural resource use, materials, and emissions can be minimized and 36
avoided only if urban settlements are planned and built much differently than today, including 37
minimized impacts on land use based on compact urban form, lowered use of materials, and related 38
cross-sector integration, including energy-driven urban design for sustainable urbanization. 39
Minimising and avoiding raw material demands depend on alternative options while accommodating 40
the urban population. In addition, operational emissions that can be committed by new urban 41
infrastructure can range between 8.5 GtCO2 and 14 GtCO2 annually up to 2030 (Erickson and Tempest 42
2015). Buildings and road networks are strongly influenced by urban layouts, densities, and specific 43
uses. Cities that are planned and built much differently than today through light-weighting, material 44
substitution, resource efficiency, renewable energy, and compact urban form, have the potential to 45
support more sustainable urbanization and provide co-benefits for inhabitants (see Figures 8.17 and 46
8.22). 47
ACCEPTED VERSION
SUBJECT TO FIN
AL EDITS
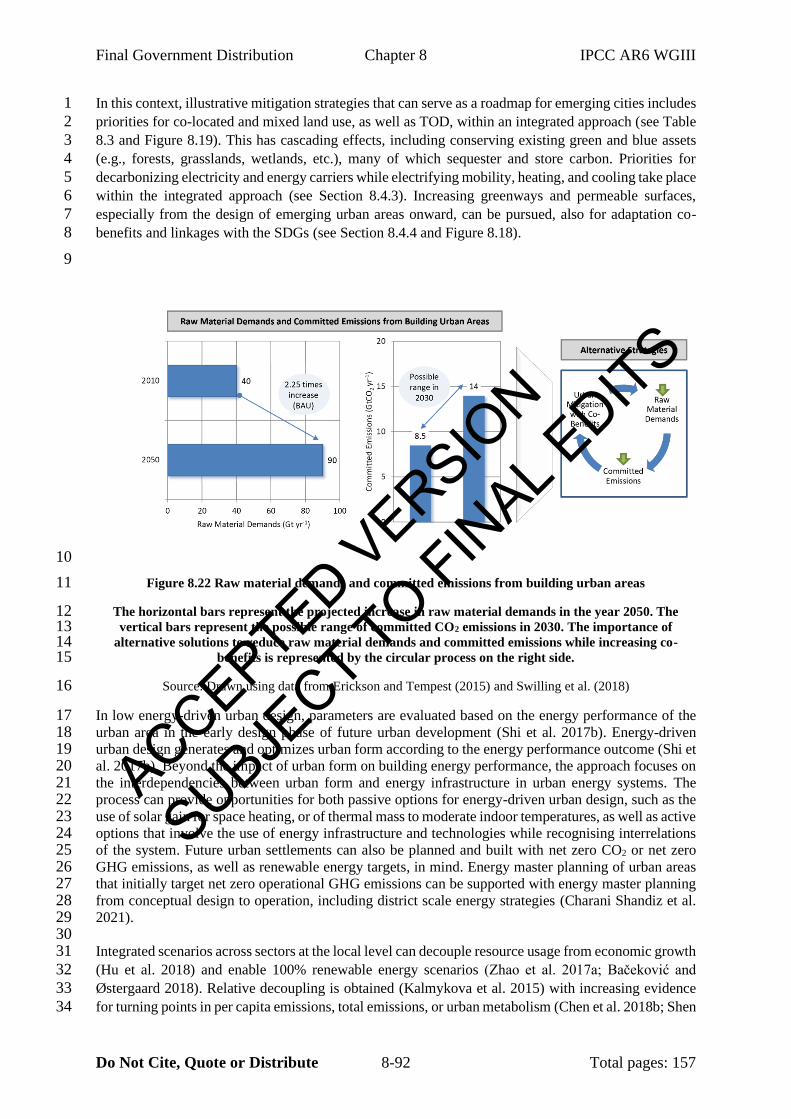
Final Government Distribution Chapter 8 IPCC AR6 WGIII
Do Not Cite, Quote or Distribute 8-92 Total pages: 157
In this context, illustrative mitigation strategies that can serve as a roadmap for emerging cities includes 1
priorities for co-located and mixed land use, as well as TOD, within an integrated approach (see Table 2
8.3 and Figure 8.19). This has cascading effects, including conserving existing green and blue assets 3
(e.g., forests, grasslands, wetlands, etc.), many of which sequester and store carbon. Priorities for 4
decarbonizing electricity and energy carriers while electrifying mobility, heating, and cooling take place 5
within the integrated approach (see Section 8.4.3). Increasing greenways and permeable surfaces, 6
especially from the design of emerging urban areas onward, can be pursued, also for adaptation co-7
benefits and linkages with the SDGs (see Section 8.4.4 and Figure 8.18). 8
9
10
Figure 8.22 Raw material demands and committed emissions from building urban areas 11
The horizontal bars represent the projected increase in raw material demands in the year 2050. The 12 vertical bars represent the possible range of committed CO2 emissions in 2030. The importance of 13
alternative solutions to reduce raw material demands and committed emissions while increasing co-14 benefits is represented by the circular process on the right side. 15
Source: Drawn using data from Erickson and Tempest (2015) and Swilling et al. (2018) 16
In low energy-driven urban design, parameters are evaluated based on the energy performance of the 17 urban area in the early design phase of future urban development (Shi et al. 2017b). Energy-driven 18 urban design generates and optimizes urban form according to the energy performance outcome (Shi et 19 al. 2017b). Beyond the impact of urban form on building energy performance, the approach focuses on 20 the interdependencies between urban form and energy infrastructure in urban energy systems. The 21 process can provide opportunities for both passive options for energy-driven urban design, such as the 22 use of solar gain for space heating, or of thermal mass to moderate indoor temperatures, as well as active 23 options that involve the use of energy infrastructure and technologies while recognising interrelations 24 of the system. Future urban settlements can also be planned and built with net zero CO2 or net zero 25 GHG emissions, as well as renewable energy targets, in mind. Energy master planning of urban areas 26 that initially target net zero operational GHG emissions can be supported with energy master planning 27 from conceptual design to operation, including district scale energy strategies (Charani Shandiz et al. 28 2021). 29
30 Integrated scenarios across sectors at the local level can decouple resource usage from economic growth 31
(Hu et al. 2018) and enable 100% renewable energy scenarios (Zhao et al. 2017a; Bačeković and 32
Østergaard 2018). Relative decoupling is obtained (Kalmykova et al. 2015) with increasing evidence 33
for turning points in per capita emissions, total emissions, or urban metabolism (Chen et al. 2018b; Shen 34
ACCEPTED VERSION
SUBJECT TO FIN
AL EDITS
Final Government Distribution Chapter 8 IPCC AR6 WGIII
Do Not Cite, Quote or Distribute 8-93 Total pages: 157
et al. 2018). The importance of integrating energy and resource efficiency in sustainable and low-carbon 1
city planning (Dienst et al. 2015), structural changes, as well as forms of disruptive social innovation, 2
such as the ‘sharing economy’ (see Glossary), is also evident based on analyses for multiple cities, 3
including those that can be used to lower the carbon footprints of urban areas relative to sub-urban areas 4
(Chen et al. 2018a). 5
To minimize carbon footprints, new cities can utilize new intelligence functions as well as changes in 6
energy sources and material processes. Core design strategies of a compact city can be facilitated by 7
data-driven decision-making so that new urban intelligence functions are holistic and pro-active rather 8
than reactive (Bibri 2020). In mainstream practices, for example, many cities use environmental impact 9
reviews to identify potentially negative consequences of individual development projects on 10
environmental conditions in a piecemeal project basis. 11
New cities can utilize: system-wide analyses of construction materials, or renewable power sources, 12
that minimize ecosystem disruption and energy use, through the use of lifecycle assessments for 13
building types permitted in the new city (Ingrao et al. 2019); urban-scale metabolic impact assessments 14
for neighbourhoods in the city (Pinho and Fernandes 2019); strategic environmental assessments 15
(SEAs) that go beyond the individual project and assess plans for neighbourhoods (Noble and 16
Nwanekezie 2017); or the modelling of the type and location of building masses, tree canopies and 17
parks, and temperature (surface conditions) and prevailing winds profiles to reduce the combined effects 18
of climate change and UHI phenomena, thus minimising the need for air conditioning (Matsuo and 19
Tanaka 2019). 20
Resource-efficient, compact, sustainable, and liveable urban areas can be enabled with an integrated 21
approach across sectors, strategies, and innovations. From a geophysical perspective, the use of 22
materials with lower lifecycle GHG impacts, including the use of timber in urban infrastructure and the 23
selection of urban development plans, with lower material and land demand can lower the emission 24
impacts of existing and future cities (Müller et al. 2013; Carpio et al. 2016; Liu et al. 2016a; Ramage et 25
al. 2017; Shi et al. 2017a; Stocchero et al. 2017; Bai et al. 2018; Zhan et al. 2018b; Swilling et al. 2018; 26
Xu et al. 2018b; UNEP and IRP 2020) (see Figure 8.17). The capacity to implement relevant policy 27
instruments in an integrated and coordinated manner within a policy mix while leveraging multilevel 28
support as relevant can increase the enabling conditions for urban system transformation (Agyepong 29
and Nhamo 2017; Roppongi et al. 2017). 30
The integration of urban land use and spatial planning, electrification of urban energy systems, 31
renewable energy district heating and cooling networks, urban green and blue infrastructure, and 32
circular economy can also have positive impacts on improving air and environmental quality with 33
related co-benefits for health and well-being (Diallo et al. 2016; Nieuwenhuijsen and Khreis 2016; 34
Shakya 2016; Liu et al. 2017; Ramaswami et al. 2017a; Sun et al. 2018b; Tayarani et al. 2018; Park and 35
Sener 2019; González-García et al. 2021). Low-carbon development options can be implemented in 36
ways that reduce impacts on water use, including water use efficiency, demand management, and water 37
recycling, while increasing water quality (Koop and van Leeuwen 2015; Topi et al. 2016; Drangert and 38
Sharatchandra 2017; Lam et al. 2017, 2018; Vanham et al. 2017; Kim and Chen 2018). The ability for 39
enhancing biodiversity while addressing climate change depends on improving urban metabolism and 40
biophilic urbanism towards urban areas that are able to regenerate natural capital (Thomson and 41
Newman 2018; IPBES 2019b). 42
There are readily available solutions for low-carbon urban development that can be further supported 43
by new emerging ones, such as tools for optimising the impact of urban form on energy infrastructure 44
(Hu et al. 2015; Shi et al. 2017b; Xue et al. 2017; Dobler et al. 2018; Egusquiza et al. 2018; Pedro et al. 45
2018; Soilán et al. 2018). The costs of low-carbon urban development are manageable and enhanced 46
with a portfolio approach for cost-effective, cost-neutral, and re-investment options with evidence 47
across different urban typologies (Colenbrander et al. 2015, 2017; Gouldson et al. 2015; 48
ACCEPTED VERSION
SUBJECT TO FIN
AL EDITS
Final Government Distribution Chapter 8 IPCC AR6 WGIII
Do Not Cite, Quote or Distribute 8-94 Total pages: 157
Nieuwenhuijsen and Khreis 2016; Saujot and Lefèvre 2016; Sudmant et al. 2016; Brozynski and 1
Leibowicz 2018). 2
Low-carbon urban development that triggers economic decoupling can have a positive impact on 3
employment and local competitiveness (Kalmykova et al. 2015; Chen et al. 2018b; García-Gusano et 4
al. 2018; Hu et al. 2018; Shen et al. 2018). In addition, sustainable urban transformation can be 5
supported with participatory approaches that provide a shared understanding of future opportunities and 6
challenges where public acceptance increases with citizen engagement and citizen empowerment as 7
well as an awareness of co-benefits (Blanchet 2015; Bjørkelund et al. 2016; Flacke and de Boer 2017; 8
Gao et al. 2017; Neuvonen and Ache 2017; Sharp and Salter 2017; Wiktorowicz et al. 2018; Fastenrath 9
and Braun 2018; Gorissen et al. 2018; Herrmann et al. 2018; Moglia et al. 2018). Sustainable and low-10
carbon urban development that integrates issues of equity, inclusivity, and affordability, while 11
safeguarding urban livelihoods, providing access to basic services, lowering energy bills, addressing 12
energy poverty, and improving public health can also improve the distributional effects of existing and 13
future urbanization (Friend et al. 2016; Claude et al. 2017; Colenbrander et al. 2017; Ma et al. 2018; 14
Mrówczyńska et al. 2018; Pukšec et al. 2018; Wiktorowicz et al. 2018) (see Section 8.2). 15
Information and communications technologies can play an important role for integrating mitigation 16
options at the urban systems level for achieving zero-carbon cities. Planning for decarbonisation at the 17
urban systems level involves integrated considerations of the interaction among sectors, including 18
synergies and trade-offs among households, businesses, transport, land use, and lifestyles. The 19
utilisation of big data, artificial intelligence and Internet of Things (IoT) technologies can be used to 20
plan, evaluate and integrate rapidly progressing transport and building technologies, such as 21
autonomous EVs, zero energy buildings and districts as an urban system, including energy-driven urban 22
design (Creutzig et al. 2020; Yamagata et al. 2020). Community level energy sharing systems will 23
contribute to realising the decarbonization potential of urban systems at community scale, including in 24
smart cities (see Section 4.2.5.9 in Chapter 4, Box 10.2 in Chapter 10 and Cross-Chapter Box 11 in 25
Chapter 16). 26
27
8.5 Knowledge Gaps 28
While there is growing literature on urban NBS, which encompasses urban green and blue infrastructure 29
in cities, there is still a knowledge gap regarding how these climate mitigation actions can be integrated 30
in urban planning and design, as well as their mitigation potential, especially for cities that have yet to 31
be built. In moving forward with the research agenda on cities and climate change science, 32
transformation of urban systems will be critical; however, understanding this transformation and how 33
best to assess mitigation action remain key knowledge gaps (Butcher-Gollach 2018; Pathak and 34
Mahadevia 2018; Rigolon et al. 2018; Anguelovski et al. 2019; Buyana et al. 2019; Trundle 2020; 35
Azunre et al. 2021). 36
There is a key knowledge gap in respect to the potential of the informal sector in developing country 37
cities. Informality extends beyond illegality of economic activities to include housing, locally developed 38
off-grid infrastructure, and alternative waste management strategies. Limited literature and 39
understanding of the mitigation potential of enhanced informal sector is highlighted in the key research 40
agenda on cities from the cities and climate change science conference (Prieur-Richard et al. 2018). 41
City-level models and data for understanding of urban systems is another knowledge gap. With 42
increased availability of open data systems, big data and computing capacities, there is an opportunity 43
for analysis of urban systems (Frantzeskaki et al. 2019). 44
While there is much literature on urban climate governance, there is still limited understanding of the 45
governance models and regimes that support multi-level decision making for mitigation and climate 46
ACCEPTED VERSION
SUBJECT TO FIN
AL EDITS
Final Government Distribution Chapter 8 IPCC AR6 WGIII
Do Not Cite, Quote or Distribute 8-95 Total pages: 157
action in general. Transformative climate action will require changing relationships between actors to 1
utilize the knowledge from data and models and deepen understanding of the urban system to support 2
decision-making. 3
4
8.6.4 COVID-19 and cities 5
The COVID-19 pandemic has disrupted many aspects of urban life while raising questions about urban 6
densities, transportation, public space, and other urban issues. The impact of COVID-19 on urban 7
activity and urban GHG emissions may offer insights into urban emissions and their behavioural drivers 8
and may include structural shifts in emissions that last into the future. The science is unclear as to the 9
links between urban characteristics and COVID-19, and involves multiple aspects. For example, some 10
research shows higher COVID-19 infection rates with city size (e.g., Dalziel et al. 2018; Stier et al. 11
2021), as well as challenges to epidemic preparedness due to high population density and high volume 12
of public transportation (Layne et al. 2020; Lee et al. 2020). Other research from 913 metropolitan areas 13
shows that density is unrelated to COVID-19 infection rates and, in fact, has been inversely related to 14
COVID-19 mortality rates when controlled by metropolitan population. 15
Dense counties are found to have significantly lower mortality rates, possibly due to such advantages 16
as better health care systems as well as greater adherence to social-distancing measures (Hamidi et al. 17
2020). Sustainable urbanization and urban infrastructure that address the SDGs can also improve 18
preparedness and resilience against future pandemics. For example, long-term exposure to air pollution 19
has been found to exacerbate the impacts of COVID-19 infections (Wu et al. 2020b), while urban areas 20
with cleaner air from clean energy and greenspace, can provide advantages. 21
Some studies indicate that socio-economic factors, such as poverty, racial and ethnic disparities, and 22
crowding are more significant than density in COVID-19 spread and associated mortality rate (Borjas 23
2020; Maroko et al. 2020; Lamb et al. 2021). The evidence for the connection between household 24
crowding and the risk of contagion from infectious diseases is also strong. A 2018 World Health 25
Organisation (WHO) systematic review of the effect of household crowding on health concluded that a 26
majority of studies of the risk of non-tuberculosis infectious diseases, including flu-related illnesses, 27
were associated with household crowding (Shannon et al. 2018). 28
Though preliminary, some studies suggest that urban areas saw larger overall declines in emissions 29
because of lower commuter activity and associated emissions. For example, researchers have explored 30
the COVID-19 impact in the cities of Los Angeles, Baltimore, Washington, DC, and San Francisco Bay 31
Area in the United States. In the San Francisco region, a decline of 30% in anthropogenic CO2 was 32
observed, which was primarily due to changes in on-road traffic (Turner et al. 2020). Declines in the 33
Washington, DC/Baltimore region and in the Los Angeles urban area were 33% and 34%, respectively, 34
in the month of April compared to previous years (Yadav et al. 2021). 35
At the global scale COVID-related lock-down and travel restrictions reduced daily CO2 emissions by -36
17% in early April 2020 compared to 2019 values (Le Quéré et al. 2020; Liu et al. 2020b), though 37
subsequent studies have questioned the accuracy of the indirect proxy data used (Gurney et al. 2021b; 38
Oda et al. 2021). Research at the national scale in the United States found that daily CO2 emissions 39
declined -15% during the late March to early June time period (Gillingham et al. 2020). Sector analysis 40
indicates that gasoline transportation and electricity generation contributed to the majority of the April-41
May 2020 decline (Gurney et al. 2021b). Research in China estimated that the first quarter of 2020 saw 42
an 11.5% decline in CO2 emissions relative to 2019 (Zheng et al. 2020; Han et al. 2021). In Europe, 43
estimates indicated a -12.5% decline in the first half of 2020 compared to 2019 (Andreoni 2021). 44
Rebound to pre-COVID trajectories has been evidenced following the ease of travel restrictions 45
(Gurney et al. 2021b; Le Quéré et al. 2021). It remains unclear to what extent COVID resulted in any 46
structural change in the underlying drivers of urban emissions. 47
ACCEPTED VERSION
SUBJECT TO FIN
AL EDITS
Final Government Distribution Chapter 8 IPCC AR6 WGIII
Do Not Cite, Quote or Distribute 8-96 Total pages: 157
Changes in local air pollution emissions, particularly due to altered transportation patterns, have caused 1
temporary air quality improvements in many cities around the world (see critical review by a Adam et 2
al. 2021). Many outdoor air pollutants, such as particulates, nitrogen dioxide, carbon monoxide, and 3
volatile organic compounds declined during national lockdowns. Levels of tropospheric ozone, 4
however, remained constant or increased. A promising transformation that has been observed in many 5
cities is an increase in the share of active travel modes such as cycling and walking (Sharifi and 6
Khavarian-Garmsir 2020). While this may be temporary, other trends, such as increased rates of 7
teleworking and/or increased reliance on smart solutions that allow remote provision of services provide 8
an unprecedented opportunity to transform urban travel patterns (Belzunegui-Eraso and Erro-Garcés 9
2020; Sharifi and Khavarian-Garmsir 2020). 10
Related to the transport sector, the pandemic has resulted in concerns regarding the safety of public 11
transport modes, which has resulted in significant reductions in public transport ridership in some cities 12
(Bucsky 2020; de Haas et al. 2020) while providing opportunities for urban transitions in others 13
(Newman AO 2020). Considering the significance of public transportation for achieving low-carbon 14
and inclusive urban development, appropriate response measures could enhance health safety of public 15
transport modes and regain public trust (Sharifi and Khavarian-Garmsir 2020). Similarly, there is a 16
perceived correlation between the higher densities of urban living and the risk of increased virus 17
transmission (Hamidi et al. 2020; Khavarian-Garmsir et al. 2021). 18
While city size could be a risk factor with higher transmission in larger cities (Hamidi et al. 2020; Stier 19
et al. 2021), there is also evidence showing that density is not a major risk factor and indeed cities that 20
are more compact have more capacity to respond to and control the pandemic (Hamidi et al. 2020). 21
Considering the spatial pattern of density, even distribution of density can reduce the possibility of 22
crowding that is found to contribute to the scale and length of virus outbreak in cities. Overall, more 23
research is needed to better understand the impacts of density on outbreak dynamics and address public 24
health concerns for resilient cities. 25
Cities could seize this opportunity to provide better infrastructure to further foster active transportation. 26
This could, for example, involve measures, such as expanding cycling networks and restricting existing 27
streets to make them more pedestrian- and cycling-friendly contributing to health and adaptation co-28
benefits as discussed in Section 8.2 (Sharifi 2021). Strengthening the science-policy interface is another 29
consideration that could support urban transformation (also see Cross-chapter Box 1 in Chapter 1). 30
31
8.6.5 Future urban emissions scenarios 32
The urban share of global emissions is significant and is expected to increase in the coming decades. 33
This places emphasis on the need to expand development of urban emissions scenarios within climate 34
mitigation scenarios (Gurney et al. 2021a). The literature on globally comprehensive analysis of urban 35
emissions within the existing IPCC scenario framework remain very limited curtailing understanding 36
of urban emissions tipping points, mitigation opportunities and overall climate policy complexity. A 37
recent review of the applications of the SSP/RCP scenario framework recommends downscaling global 38
SSPs to improve the applicability of this framework to regional and local scales (O’Neill et al. 2020). 39
This remains an urgent need and will require multi-disciplinary research efforts, particularly as net zero 40
emissions targets are emphasized. 41
42
8.6.6 Urban emissions data 43
Though there has been a rapid rise in quantification and analysis of urban emissions, gaps remain in 44
comprehensive global coverage, particularly in the Global South, and reliance on standardized 45
frameworks and systematic data is lacking (Gurney and Shepson 2021; Mueller et al. 2021). The 46
ACCEPTED VERSION
SUBJECT TO FIN
AL EDITS
Final Government Distribution Chapter 8 IPCC AR6 WGIII
Do Not Cite, Quote or Distribute 8-97 Total pages: 157
development of protocols by (BSI 2013; Fong et al. 2014; ICLEI 2019b) that urban areas can use to 1
organize emissions accounts has been an important step forward, but no single agreed-upon reporting 2
framework exists (Lombardi et al. 2017; Chen et al. 2019b; Ramaswami et al. 2021). Additionally, there 3
is no standardisation of emissions data and limited independent validation procedures (Gurney and 4
Shepson 2021). This is partly driven by the recognition that urban emissions can be conceptualized 5
using different frameworks, each of which has a different meaning for different urban communities (see 6
section 8.1.6.2). Equally important is the recognition that acquisition and analysis of complex data used 7
to populate urban GHG inventory protocols remains a barrier for local practitioners (Creutzig et al. 8
2019). The limited standardization has also led to incomparability of the many individual or city cluster 9
analyses that have been accomplished since AR5. Finally, comprehensive, global quantification of 10
urban emissions remains incomplete in spite of recent efforts (Moran et al. 2018; Zheng et al. 2018; 11
Harris et al. 2020; Jiang et al. 2020; Wei et al. 2021; Wiedmann et al. 2021). 12
Similarly, independent verification or evaluation of urban GHG emissions has seen a large number of 13
research studies (e.g., Wu et al. 2016; Sargent et al. 2018; Whetstone 2018; Lauvaux et al. 2020). This 14
has been driven by the recognition that self-reported approaches may not provide adequate accuracy to 15
track emissions changes and provide confidence for mitigation investment (Gurney and Shepson 2021). 16
The most promising approach to independent verification of urban emissions has been the use of urban 17
atmospheric monitoring (direct flux and/or concentration) as a means to assess and track urban GHG 18
emissions (Davis et al. 2017). However, like the basic accounting approach itself, standardization and 19
practical deployment and scaling is an essential near-term need. 20
21
Frequently Asked Questions 22
FAQ 8.1 Why are urban areas important to global climate change mitigation? 23
Over half of the world’s population currently resides in urban areas—a number forecasted to increase 24
to nearly 70% by 2050. Urban areas also account for a growing proportion of national and global 25
emissions depending on emissions scope and geographic boundary. These trends are projected to grow 26
in the coming decades; in 2100, some scenarios show the urban share of global emissions above 80%, 27
with 63% being at the minimum for any scenario (with the shares being in different contexts of 28
emissions reduction or increase) (Sections 8.3.3 and 8.3.4). As such, urban climate change mitigation 29
considers the majority of the world’s population, as well some of the key drivers of global emissions. 30
In general, emissions scenarios with limited outward urban land expansion are also associated with a 31
smaller rise in global temperature (Section 8.3.4). 32
The urban share of global emissions and its projected growth stem in part from urban carbon lock-in—33
that is, the path dependency and inertia of committed emissions through the long lifespan of urban 34
layout, infrastructures, and behaviour. As such, urban mitigation efforts that address lock-in can 35
significantly reduce emissions (Section 8.4.1). Electrification of urban energy systems in tandem with 36
implementing multiple urban-scale mitigation strategies, could reduce urban emissions by 90% by 37
2050--thereby significantly reducing global emissions (Section 8.3.4). Urban areas can also act as points 38
of intervention to amplify synergies and co-benefits for accomplishing the Sustainable Development 39
Goals (Section 8.2). 40
FAQ 8.2 What are the most impactful options cities can take to mitigate urban emissions, and 41
how can these be best implemented? 42
The most impactful urban mitigation plans reduce urban GHG emissions by considering the long 43
lifespan of urban layout and urban infrastructures (Section 8.4.1 and 8.6). Chapter 8 identifies three 44
overarching mitigation strategies with the largest potential to decrease current, and avoid future, urban 45
ACCEPTED VERSION
SUBJECT TO FIN
AL EDITS
Final Government Distribution Chapter 8 IPCC AR6 WGIII
Do Not Cite, Quote or Distribute 8-98 Total pages: 157
emissions: (1) reduce urban energy consumption across all sectors including through spatial planning 1
and infrastructure that supports compact, walkable urban form (Section 8.4.2); (2) decarbonize through 2
electrification of the urban energy system, and switch to net zero emissions resources (i.e., low-carbon 3
infrastructure) (Section 8.4.3); and (3) enhance carbon sequestration through urban green and blue 4
infrastructure (e.g., green roofs, urban forests and street trees, etc.), which can also offer multiple co-5
benefits like reducing ground temperatures and supporting public health and well-being (Section 8.4.4). 6
Integrating these mitigation strategies across sectors, geographic scales, and levels of governance will 7
yield the greatest emissions savings (Sections 8.4 and 8.5). 8
A city’s layout, patterns, and spatial arrangements of land use, transportation systems, and built 9
environment (urban form), as well as its state and form(s) of development (urban growth typology), can 10
inform the most impactful emissions savings ‘entry point’ and priorities for urban mitigation strategies 11
(Sections 8.4.2 and 8.6). For rapidly growing and emerging urban areas, there is the opportunity to 12
avoid carbon lock-in by focusing on urban form that promotes low-carbon infrastructure and enables 13
low-impact behaviour facilitated by co-located medium to high densities of jobs and housing, 14
walkability, and transit-oriented development (Sections 8.6.2 and 8.6.3). For established cities, 15
strategies include electrification of the grid and transport, and implementing energy efficiency across 16
sectors (Section 8.6.1). 17
FAQ 8.3 How do we estimate global emissions from cities, and how reliable are the estimates? 18
There are two different emissions estimation techniques applied, individually or in combination, to the 19
four frameworks outlined in Section 8.1.6.2 to estimate urban GHG emissions: ‘top-down’ and ‘bottom-20
up.’ The top-down technique uses atmospheric GHG concentrations and atmospheric modelling to 21
estimate direct (scope 1) emissions (see Glossary). The bottom-up technique estimates emissions using 22
local activity data or direct measurements such as in smokestacks, traffic data, energy consumption 23
information, and building use. Bottom-up techniques will often include 'indirect emissions (see 24
Glossary) from purchased electricity (scope 2) and the urban supply chain (scope 3). Inclusion of 25
supply-chain emissions often requires additional data such as consumer purchasing data and supply 26
chain emission factors. Some researchers also take a hybrid approach combining top-down and bottom-27
up estimation techniques to quantify territorial emissions. Individual self-reported urban inventories 28
from cities have shown chronic underestimation when compared to estimates using combined top-29
down/bottom-up atmospherically calibrated estimation techniques. 30
No approach has been systematically applied to all cities worldwide. Rather, they have been applied 31
individually or in combination to subsets of global cities. Considerable uncertainty remains in 32
estimating urban emissions. However, top-down approaches have somewhat more objective techniques 33
for uncertainty estimation in comparison to bottom-up approaches. Furthermore, supply chain 34
estimation typically has more uncertainty than direct or territorial emission frameworks.35 ACCEPTED VERSION
SUBJECT TO FIN
AL EDITS
Final Government Distribution Chapter 8 IPCC AR6 WGIII
Do Not Cite, Quote or Distribute 8-99 Total pages: 157
1
References 2
Abdullah, H., and E. Garcia-Chueca, 2020: Cacophony or Complementarity? The Expanding 3 Ecosystem of City Networks Under Scrutiny. In: City Diplomacy [Amiri, S. and E. Sevin, (eds.)], 4 Palgrave Macmillan, Cham, Switzerland, pp. 37–58. 5
Abid, H., J. Thakur, D. Khatiwada, and D. Bauner, 2021: Energy storage integration with solar PV for 6 increased electricity access: A case study of Burkina Faso. Energy, 230, 120656, 7 doi:10.1016/j.energy.2021.120656. 8
Abino, A. C., J. A. A. Castillo, and Y. J. Lee, 2014: Assessment of species diversity, biomass and carbon 9 sequestration potential of a natural mangrove stand in Samar, the Philippines. Forest Sci. Technol., 10 10(1), 2–8, doi:10.1080/21580103.2013.814593. 11
Acakpovi, A., R. Abubakar, N. Y. Asabere, and I. B. Majeed, 2019: Barriers and prospects of smart 12 grid adoption in Ghana. Procedia Manuf., 35, 1240–1249, doi:10.1016/j.promfg.2019.06.082. 13
Acuto, M., and B. Leffel, 2021: Understanding the global ecosystem of city networks. Urban Stud., 14 58(9), 1758–1774, doi:10.1177/0042098020929261. 15
Acuto, M., K. Steenmans, E. Iwaszuk, and L. Ortega-Garza, 2019: Informing urban governance? 16 Boundary-spanning organisations and the ecosystem of urban data. Wiley Online Libr., 51(1), 94–17 103, doi:10.1111/area.12430. 18
Adam, M. G., P. T. M. Tran, and R. Balasubramanian, 2021: Air quality changes in cities during the 19 COVID-19 lockdown: A critical review. Atmos. Res., 264, 105823, 20 doi:10.1016/j.atmosres.2021.105823. 21
Adams, E. A., H. Price, and J. Stoler, 2019: Urban slums, drinking water, and health: Trends and lessons 22 from Sub-Saharan Africa. In: Handbook of Global Urban Health [Vojnovic, I., A.L. Pearson, A. 23 Gershim, G. DeVerteuil, and A. Allen, (eds.)], Routledge, New York, pp. 533–552. 24
Adegun, O. B., 2017: Green infrastructure in relation to informal urban settlements. J. Archit. Urban., 25 41(1), 22–33, doi:10.3846/20297955.2017.1296791. 26
Affolderbach, J., and C. Schulz, 2017: Positioning Vancouver through urban sustainability strategies? 27 The Greenest City 2020 Action Plan. J. Clean. Prod., 164, 676–685, 28 doi:10.1016/j.jclepro.2017.06.234. 29
Afionis, S., M. Sakai, K. Scott, J. Barrett, and A. Gouldson, 2017: Consumption-based carbon 30 accounting: does it have a future? Wiley Interdiscip. Rev. Clim. Chang., 8, e438, 31 doi:10.1002/wcc.438. 32
Aguiar, F. C. et al., 2018: Adaptation to climate change at local level in Europe: An overview. Environ. 33 Sci. Policy, 86, 38–63, doi:10.1016/j.envsci.2018.04.010. 34
Agyepong, A. O., and G. Nhamo, 2017: Green procurement in South Africa: perspectives on legislative 35 provisions in metropolitan municipalities. Environ. Dev. Sustain., 19(6), 2457–2474, 36 doi:10.1007/s10668-016-9865-9. 37
Ahlfeldt, G. M., and D. P. McMillen, 2018: Tall buildings and land values: Height and construction 38 cost elasticities in Chicago, 1870-2010. Rev. Econ. Stat., 100(5), 861–875, 39 doi:10.1162/rest_a_00734. 40
ACCEPTED VERSION
SUBJECT TO FIN
AL EDITS
Final Government Distribution Chapter 8 IPCC AR6 WGIII
Do Not Cite, Quote or Distribute 8-100 Total pages: 157
Ahlfeldt, G. M., and J. Barr, 2020: Viewing urban spatial history from tall buildings. Reg. Sci. Urban 1 Econ., , 103618, doi:10.1016/j.regsciurbeco.2020.103618. 2
Ahmad, S., H. Jia, Z. Chen, Q. Li, and C. Xu, 2020: Water-energy nexus and energy efficiency: A 3 systematic analysis of urban water systems. Renew. Sustain. Energy Rev., 134, 110381, 4 doi:10.1016/j.rser.2020.110381. 5
Ajanovic, A., and R. Haas, 2019: On the environmental benignity of electric vehicles. J. Sustain. Dev. 6 Energy, Water Environ. Syst., 7(3), 416–431, doi:10.13044/j.sdewes.d6.0252. 7
Aklin, M., S. P. Harish, and J. Urpelainen, 2018: A global analysis of progress in household 8 electrification. Energy Policy, 122, 421–428, doi:10.1016/j.enpol.2018.07.018. 9
Al-Kindi, S. G., R. D. Brook, S. Biswal, and S. Rajagopalan, 2020: Environmental determinants of 10 cardiovascular disease: lessons learned from air pollution. Nat. Rev. Cardiol., 17(10), 11 doi:10.1038/s41569-020-0371-2. 12
Alhamwi, A., W. Medjroubi, T. Vogt, and C. Agert, 2018: Modelling urban energy requirements using 13 open source data and models. Appl. Energy, 231, 1100–1108, 14 doi:10.1016/j.apenergy.2018.09.164. 15
Allam, Z., and D. Jones, 2019: The Potential of Blockchain within Air Rights Development as a 16 Prevention Measure against Urban Sprawl. Urban Sci., 3(1), 38, doi:10.3390/urbansci3010038. 17
Allan, A., 2020: Book Reviews: Resilient Cities: Overcoming Fossil Fuel Dependence. Urban Policy 18 Res., 38(1), 74–79, doi:10.1080/08111146.2019.1687399. 19
Álvarez Fernández, R., 2018: A more realistic approach to electric vehicle contribution to greenhouse 20 gas emissions in the city. J. Clean. Prod., 172, 949–959, doi:10.1016/j.jclepro.2017.10.158. 21
Alves, A., B. Gersonius, Z. Kapelan, Z. Vojinovic, and A. Sanchez, 2019: Assessing the Co-Benefits 22 of green-blue-grey infrastructure for sustainable urban flood risk management. J. Environ. 23 Manage., 239, 244–254, doi:10.1016/j.jenvman.2019.03.036. 24
Alzate-Arias, S., Á. Jaramillo-Duque, F. Villada, and B. Restrepo-Cuestas, 2018: Assessment of 25 government incentives for energy from waste in Colombia. Sustain., 10(4), 1294, 26 doi:10.3390/su10041294. 27
Ambole, A. et al., 2019: Mediating household energy transitions through co-design in urban Kenya, 28 Uganda and South Africa. Energy Res. Soc. Sci., 55, 208–217, doi:10.1016/j.erss.2019.05.009. 29
Amundi, and IFC, 2021: Emerging Market Green Bonds Report 2020. Amundi Asset Management 30 (Amundi) and International Finance Corporation (IFC), Washington, D.C., 38 pp. 31
Andreoni, V., 2021: Estimating the European CO2 emissions change due to COVID-19 restrictions. 32 Sci. Total Environ., 769, 145115, doi:10.1016/j.scitotenv.2021.145115. 33
Andrés-Doménech, I., S. Perales-Momparler, A. Morales-Torres, and I. Escuder-Bueno, 2018: 34 Hydrological Performance of Green Roofs at Building and City Scales under Mediterranean 35 Conditions. Sustainability, 10(9), 3105, doi:10.3390/su10093105. 36
Anguelovski, I., C. Irazábal-Zurita, and J. J. T. Connolly, 2019: Grabbed Urban Landscapes: Socio-37 spatial Tensions in Green Infrastructure Planning in Medellín. Int. J. Urban Reg. Res., 43(1), 133–38 156, doi:10.1111/1468-2427.12725. 39
ACCEPTED VERSION
SUBJECT TO FIN
AL EDITS
Final Government Distribution Chapter 8 IPCC AR6 WGIII
Do Not Cite, Quote or Distribute 8-101 Total pages: 157
Aon, 2021: Weather, Climate & Catastrophe Insight: 2020 Annual Report. Aon, Chicago, 81 pp. 1 https://www.aon.com/global-weather-catastrophe-natural-disasters-costs-climate-change-2020-2 annual-3 report/index.html?utm_source=prnewswire&utm_medium=mediarelease&utm_campaign=natca4 t21. 5
Araos, M., J. Ford, L. Berrang-Ford, R. Biesbroek, and S. Moser, 2017: Climate change adaptation 6 planning for Global South megacities: the case of Dhaka. J. Environ. Policy Plan., 19(6), 682–7 696, doi:10.1080/1523908X.2016.1264873. 8
Archer, D., 2016: Building urban climate resilience through community-driven approaches to 9 development. Int. J. Clim. Chang. Strateg. Manag., 8(5), 654–669, doi:10.1108/IJCCSM-03-10 2014-0035. 11
Arias, P. A. et al., 2021: Technical Summary. In: Climate Change 2021: The Physical Science Basis. 12 Contribution of Working Group I to the Sixth Assessment Report of the Intergovernmental Panel 13 on Climate Change [Masson-Delmotte, V. et al., (eds.)], Cambridge University Press (In Press), 14 Cambridge and New York. 15
Arioli, M. S., M. de A. D’Agosto, F. G. Amaral, and H. B. B. Cybis, 2020: The evolution of city-scale 16 GHG emissions inventory methods: A systematic review. Environ. Impact Assess. Rev., 80, 17 106316, doi:10.1016/j.eiar.2019.106316. 18
Asarpota, K., and V. Nadin, 2020: Energy strategies, the Urban dimension, and spatial planning. 19 Energies, 13(14), 3642, doi:10.3390/en13143642. 20
Ataöv, A., and E. Peker, 2021: Co-designing Local Climate Action: A Methodological Framework from 21 a Democratic Perspective. In: Governance of Climate Responsive Cities. The Urban Book Series 22 [Ataöv, A. and E. Peker, (eds.)], Springer, Cham, pp. 147–164. 23
Austin, K. G., A. Schwantes, Y. Gu, and P. S. Kasibhatla, 2019: What causes deforestation in Indonesia? 24 Environ. Res. Lett., 14(2), 024007, doi:10.1088/1748-9326/AAF6DB. 25
Ayerakwa, H. M., 2017: Urban households’ engagement in agriculture: implications for household food 26 security in Ghana’s medium sized cities. Geogr. Res., 55(2), 217–230, doi:10.1111/1745-27 5871.12205. 28
Azunre, G. A., O. Amponsah, S. A. Takyi, and H. Mensah, 2021: Informality-sustainable city nexus: 29 The place of informality in advancing sustainable Ghanaian cities. Sustain. Cities Soc., 67, 30 102707, doi:10.1016/j.scs.2021.102707. 31
Bačeković, I., and P. A. Østergaard, 2018: A smart energy system approach vs a non-integrated 32 renewable energy system approach to designing a future energy system in Zagreb. Energy, 155, 33 824–837, doi:10.1016/j.energy.2018.05.075. 34
Baeumler, A., E. Ijjasz-Vasquez, and S. Mehndiratta, 2012: Sustainable Low-Carbon City Development 35 in China. [Baeumler, A., E. Ijjasz-Vasquez, and S. Mehndiratta, (eds.)]. The World Bank, 36 Washington, DC, 516 pp. 37
Bagheri, M., S. H. Delbari, M. Pakzadmanesh, and C. A. Kennedy, 2019: City-integrated renewable 38 energy design for low-carbon and climate-resilient communities. Appl. Energy, 239, 1212–1225, 39 doi:10.1016/j.apenergy.2019.02.031. 40
Bai, X. et al., 2016: Defining and advancing a systems approach for sustainable cities. Curr. Opin. 41 Environ. Sustain., 23, 69–78, doi:10.1016/j.cosust.2016.11.010. 42
ACCEPTED VERSION
SUBJECT TO FIN
AL EDITS
Final Government Distribution Chapter 8 IPCC AR6 WGIII
Do Not Cite, Quote or Distribute 8-102 Total pages: 157
Bai, X. et al., 2018: Six research priorities for cities and climate change. Nature, 555(7694), 23–25, 1 doi:10.1038/d41586-018-02409-z. 2
Bain, P. G. et al., 2016: Co-benefits of addressing climate change can motivate action around the world. 3 Nat. Clim. Chang., 6(2), 154–157, doi:10.1038/nclimate2814. 4
Baiocchi, G., F. Creutzig, J. Minx, and P. P. Pichler, 2015: A spatial typology of human settlements 5 and their CO2 emissions in England. Glob. Environ. Chang., 34, 13–21, 6 doi:10.1016/j.gloenvcha.2015.06.001. 7
Bakır, Y., D. Neşe, K. Umut, M. Güngör, and B. Bostancı, 2018: Planned development versus 8 unplanned change: The effects on urban planning in Turkey. Land use policy, 77, 310–321, 9 doi:10.1016/j.landusepol.2018.05.036. 10
Bartolozzi, I., F. Rizzi, and M. Frey, 2017: Are district heating systems and renewable energy sources 11 always an environmental win-win solution? A life cycle assessment case study in Tuscany, Italy. 12 Renew. Sustain. Energy Rev., 80(C), 408–420, doi:10.1016/j.rser.2017.05.231. 13
Battiston, S., I. Monasterolo, K. Riahi, and B. J. van Ruijven, 2021: Accounting for finance is key for 14 climate mitigation pathways. Science, 372(6545), 918–920, doi:10.1126/science.abf3877. 15
Baur, A. H., M. Förster, and B. Kleinschmit, 2015: The spatial dimension of urban greenhouse gas 16 emissions: analyzing the influence of spatial structures and LULC patterns in European cities. 17 Landsc. Ecol., 30(7), 1195–1205, doi:10.1007/s10980-015-0169-5. 18
Baurzhan, S., and G. P. Jenkins, 2016: An economic appraisal of solar versus combined cycle electricity 19 generation for African countries that are capital constrained. Energy Environ., 27(2), 241–256, 20 doi:10.1177/0958305X15627546. 21
Beermann, J., A. Damodaran, K. Jörgensen, and M. A. Schreurs, 2016: Climate action in Indian cities: 22 an emerging new research area. J. Integr. Environ. Sci., 13(1), 55–66, 23 doi:10.1080/1943815X.2015.1130723. 24
Bellinson, R., and E. Chu, 2019: Learning pathways and the governance of innovations in urban climate 25 change resilience and adaptation. J. Environ. Policy Plan., 21(1), 76–89, 26 doi:10.1080/1523908X.2018.1493916. 27
Belzunegui-Eraso, A., and A. Erro-Garcés, 2020: Teleworking in the context of the Covid-19 crisis. 28 Sustain., 12(9), 3662, doi:10.3390/su12093662. 29
Bernstad Saraiva Schott, A., and A. Cánovas, 2015: Current practice, challenges and potential 30 methodological improvements in environmental evaluations of food waste prevention – A 31 discussion paper. Resour. Conserv. Recycl., 101, 132–142, doi:10.1016/j.resconrec.2015.05.004. 32
Berrisford, S., L. R. Cirolia, and I. Palmer, 2018: Land-based financing in sub-Saharan African cities. 33 Environ. Urban., 30(1), 35–52, doi:10.1177/0956247817753525. 34
Berry, B. L. J., 1964: Cities as Systems within Systems of Cities. Pap. Reg. Sci. Assoc., 13, 146–163, 35 doi:10.1007/BF01942566. 36
Berry, P. M. et al., 2015: Cross-sectoral interactions of adaptation and mitigation measures. Clim. 37 Change, 128(3), 381–393, doi:10.1007/s10584-014-1214-0. 38
Besir, A. B., and E. Cuce, 2018: Green roofs and facades: A comprehensive review. Renew. Sustain. 39 Energy Rev., 82(Part 1), 915–939, doi:10.1016/j.rser.2017.09.106. 40
ACCEPTED VERSION
SUBJECT TO FIN
AL EDITS
Final Government Distribution Chapter 8 IPCC AR6 WGIII
Do Not Cite, Quote or Distribute 8-103 Total pages: 157
Bevilacqua, P., D. Mazzeo, R. Bruno, and A. Natale, 2016: Experimental investigation of the thermal 1 performances of an extensive green roof in the Mediterranean area. Energy Build., 122, 63–79, 2 doi:10.1016/j.enbuild.2016.03.062. 3
Beygo, K., and M. A. Yüzer, 2017: Early energy simulation of urban plans and building forms. A/Z ITU 4 J. Fac. Archit., 14(1), 13–23, doi:10.5505/itujfa.2017.67689. 5
Bhattacharya, A., J. Meltzer, J. Oppenheim, Z. Qureshi, and N. Stern, 2016: Delivering on Sustainable 6 Infrastructure for Better Development and Better Climate. The Brookings Institution, The New 7 Climate Economy, and the Grantham Research Institute on Climate Change and the Environment, 8 Washington, D.C., 160 pp. https://www.brookings.edu/wp-9 content/uploads/2016/12/global_122316_delivering-on-sustainable-infrastructure.pdf (Accessed 10 June 7, 2019). 11
Bibri, S. E., 2020: Compact urbanism and the synergic potential of its integration with data-driven smart 12 urbanism : An extensive interdisciplinary literature review. Land use policy, 97, 104703, 13 doi:10.1016/j.landusepol.2020.104703. 14
Bielenberg, A., M. Kerlin, J. Oppenheim, and M. Roberts, 2016: Financing change: How to mobilize 15 private sector financing for sustainable infrastructure. McKinsey Center for Business and 16 Environment, Washington D.C, 68 pp. https://newclimateeconomy.report/workingpapers/wp-17 content/uploads/sites/5/2016/04/Financing_change_How_to_mobilize_private-18 sector_financing_for_sustainable-_infrastructure.pdf. 19
Birkmann, J., T. Welle, W. Solecki, S. Lwasa, and M. Garschagen, 2016: Boost resilience of small and 20 mid-sized cities. Nature, 537, 605–608, doi:10.1038/537605a. 21
Bisaro, A., and J. Hinkel, 2018: Mobilizing private finance for coastal adaptation: A literature review. 22 WIREs Clim. Chang., 9(3), doi:10.1002/wcc.514. 23
Bjørkelund, O. A., H. Degerud, and E. Bere, 2016: Socio-demographic, personal, environmental and 24 behavioral correlates of different modes of transportation to work among Norwegian parents. 25 Arch. Public Heal., 74, 43, doi:10.1186/s13690-016-0155-7. 26
Blais, A.-M., S. Lorrain, Y. Plourde, and L. Varfalvy, 2005: Organic Carbon Densities of Soils and 27 Vegetation of Tropical, Temperate and Boreal Forests. In: Greenhouse Gas Emissions — Fluxes 28 and Processes [Tremblay, A., L. Varfalvy, C. Roehm, and M. Garneau, (eds.)], Springer-Verlag, 29 Berlin and Heidelberg, pp. 155–185. 30
Blanchet, T., 2015: Struggle over energy transition in Berlin: How do grassroots initiatives affect local 31 energy policy-making? Energy Policy, 78, 246–254, doi:10.1016/j.enpol.2014.11.001. 32
Blanco, H., and A. Wikstrom, 2018: Transit-Oriented Development Opportunities Among Failing 33 Malls. National Center for Sustainable Transportation (NCST), Davis, CA, 25 pp. 34
Blanco, H., P. McCarney, S. Parnell, M. Schmidt, and K. C. Seto, 2011: The role of urban land in 35 climate change. In: Climate Change and Cities: First Assessment Report of the Urban Climate 36 Change Research Network [Rosenzweig, C., W.D. Solecki, S.A. Hammer, and S. Mehrotra, 37 (eds.)], Cambridge University Press, Cambridge, pp. 217–248. 38
Blay-Palmer, A., D. Conaré, K. Meter, and A. Di Battista, 2019: Sustainable food system assessment: 39 lessons from global practice. 1st ed. [Blay-Palmer, A., D. Conaré, K. Meter, A. Di Battista, and 40 J. Carla, (eds.)]. Routledge, London, 282 pp. 41
Blok, K., N. Höhne, K. van der Leun, and N. Harrison, 2012: Bridging the greenhouse-gas emissions 42
ACCEPTED VERSION
SUBJECT TO FIN
AL EDITS

Final Government Distribution Chapter 8 IPCC AR6 WGIII
Do Not Cite, Quote or Distribute 8-104 Total pages: 157
gap. Nat. Clim. Chang., 2(7), 471–474, doi:10.1038/nclimate1602. 1
Bogdanov, D., A. Gulagi, M. Fasihi, and C. Breyer, 2021: Full energy sector transition towards 100% 2 renewable energy supply: Integrating power, heat, transport and industry sectors including 3 desalination. Appl. Energy, 283, 116273, doi:10.1016/j.apenergy.2020.116273. 4
Boltz, M., K. Marazyan, and P. Villar, 2019: Income hiding and informal redistribution: A lab-in-the-5 field experiment in Senegal. J. Dev. Econ., 137, 78–92, doi:10.1016/j.jdeveco.2018.11.004. 6
Borjas, G., 2020: Demographic Determinants of Testing Incidence and COVID-19 Infections in New 7 York City Neighborhoods. National Bureau of Economic Research (NBER), Cambridge, MA, 29 8 pp. 9
Bouteligier, S., 2013: Inequality in new global governance arrangements: the North-South divide in 10 transnational municipal networks. Innovation, 26(3), 251–267, 11 doi:10.1080/13511610.2013.771890. 12
Boyer, D., and A. Ramaswami, 2017: What Is the Contribution of City-Scale Actions to the Overall 13 Food System’s Environmental Impacts?: Assessing Water, Greenhouse Gas, and Land Impacts of 14 Future Urban Food Scenarios. Environ. Sci. Technol., 51(20), 12035–12045, 15 doi:10.1021/acs.est.7b03176. 16
Brand, C. et al., 2021: The climate change mitigation impacts of active travel: Evidence from a 17 longitudinal panel study in seven European cities. Glob. Environ. Chang., 67, 102224, 18 doi:10.1016/j.gloenvcha.2021.102224. 19
Braun, G., and S. Hazelroth, 2015: Energy Infrastructure Finance: Local Dollars for Local Energy. 20 Electr. J., 28(5), 6–21, doi:10.1016/j.tej.2015.05.008. 21
Brenna, M., A. Dolara, F. Foiadelli, S. Leva, and M. Longo, 2014: Urban Scale Photovoltaic Charging 22 Stations for Electric Vehicles. IEEE Trans. Sustain. Energy, 5(4), 1234–1241, 23 doi:10.1109/TSTE.2014.2341954. 24
Broekhoff, D., P. Erickson, and C. Lee, 2015: What cities do best: Piecing together an efficient global 25 climate governance. Stockholm Environment Institute (SEI), Seattle, 38 pp. 26 https://mediamanager.sei.org/documents/Publications/Climate/SEI-WP-2015-15-Cities-vertical-27 climate-governance.pdf. 28
Brown, A. M., 2015: Sustaining African Cities: Urban Hunger and Sustainable Development in East 29 Africa. Int. J. Environ. Cult. Econ. Soc. Sustain. Annu. Rev., 11, 1–12, doi:10.18848/1832-30 2077/cgp/v11/55133. 31
Brown, D., and G. McGranahan, 2016: The urban informal economy, local inclusion and achieving a 32 global green transformation. Habitat Int., 53, 97–105, doi:10.1016/j.habitatint.2015.11.002. 33
Brozynski, M. T., and B. D. Leibowicz, 2018: Decarbonizing power and transportation at the urban 34 scale: An analysis of the Austin, Texas Community Climate Plan. Sustain. Cities Soc., 43, 41–54, 35 doi:10.1016/j.scs.2018.08.005. 36
BSI, 2013: PAS 2070: Incorporating Amendment No. 1: Specification for the assessment of greenhouse 37 gas emissions of a city: direct plus supply chain and consumption-based methodologies. BSI 38 Standards Limited, London, 26 pp. 39
Buchner, B. et al., 2019: Global Landscape of Climate Finance 2019. Climate Policy Initiative (CPI), 40 London, 36 pp. 41
ACCEPTED VERSION
SUBJECT TO FIN
AL EDITS
Final Government Distribution Chapter 8 IPCC AR6 WGIII
Do Not Cite, Quote or Distribute 8-105 Total pages: 157
Bucsky, P., 2020: Modal share changes due to COVID-19: The case of Budapest. Transp. Res. 1 Interdiscip. Perspect., 8, 100141, doi:10.1016/j.trip.2020.100141. 2
Buffa, S., M. Cozzini, M. D’Antoni, M. Baratieri, and R. Fedrizzi, 2019: 5th generation district heating 3 and cooling systems: A review of existing cases in Europe. Renew. Sustain. Energy Rev., 104, 4 504–522, doi:10.1016/j.rser.2018.12.059. 5
Bulkeley, H. et al., 2012: Governing Climate Change Transnationally: Assessing the Evidence from a 6 Database of Sixty Initiatives. Environ. Plan. C Gov. Policy, 30(4), 591–612, doi:10.1068/c11126. 7
Buonocore, J. J. et al., 2016: Health and climate benefits of different energy-efficiency and renewable 8 energy choices. Nat. Clim. Chang., 6, 100–106, doi:10.1038/nclimate2771. 9
Butcher-Gollach, C., 2018: Planning and Urban Informality—Addressing Inclusiveness for Climate 10 Resilience in the Pacific. In: Climate Change Impacts and Adaptation Strategies for Coastal 11 Communities [Filho, W.L., (ed.)], Springer International Publishing, Span, Switzerland, pp. 43–12 68. 13
Butler, D. et al., 2014: A New Approach to Urban Water Management: Safe and Sure. 16th Conference 14 on Water Distribution System Analysis, Vol. 89 of, Bari, Italy, Procedia Engineering, 347–354. 15
Buyana, K., D. Byarugaba, H. Sseviiri, G. Nsangi, and P. Kasaija, 2019: Experimentation in an African 16 Neighborhood: Reflections for Transitions to Sustainable Energy in Cities. Urban Forum, 30(2), 17 191–204, doi:10.1007/s12132-018-9358-z. 18
Byrne, J., and J. Taminiau, 2016: A review of sustainable energy utility and energy service utility 19 concepts and applications: realizing ecological and social sustainability with a community utility. 20 Wiley Interdiscip. Rev. Energy Environ., 5(2), 136–154, doi:10.1002/wene.171. 21
Byrne, J., J. Taminiau, K. N. Kim, J. Lee, and J. Seo, 2017: Multivariate analysis of solar city 22 economics: impact of energy prices, policy, finance, and cost on urban photovoltaic power plant 23 implementation. Wiley Interdiscip. Rev. Energy Environ., 6(4), doi:10.1002/wene.241. 24
C40 Cities, 2018: Benefits of Urban Climate Action: C40 Cities Technical Assistance Report 2018 - 25 Quito. C40 Cities, 1–5 pp. https://c40.ent.box.com/s/fpxk4j5xjhxrewbpyer6ciuk38cpc5t2. 26
C40 Cities, 2020a: 1,000 cities racing to zero emissions. UNFCCC,. https://racetozero.unfccc.int/1000-27 cities-racing-to-zero-emissions/. (Accessed January 6, 2021). 28
C40 Cities, 2020b: Benefits of Urban Climate Action: C40 Cities Technical Assistance Report 2019 - 29 Rio de Janeiro. C40 Cities, 1–5 pp. 30 https://c40.ent.box.com/s/pllwmupmsdro15jabnmez7lwv3krtl6w. 31
C40 Cities, 2020c: Benefits of Urban Climate Action: C40 Cities Technical Assistance Report July 2020 32 - Bengaluru Electric Buses. C40 Cities, 1–5 pp. 33 https://c40.ent.box.com/s/vg8galdyb108lcaar6luwvub4wz78tpm. 34
C40 Cities, 2020d: Benefits of Urban Climate Action: C40 Cities Technical Assistance Report 2020 - 35 Jakarta Electric Buses. C40 Cities, 1–6 pp. 36 https://c40.ent.box.com/s/5ochjfppuprp7bl08z00w4cl8ybwpjcb. 37
C40 Cities, 2020e: Benefits of Urban Climate Action: C40 Cities Technical Assistance Report May 38 2020 - Medellín Electric Buses. C40 Cities, 1–5 pp. 39 https://c40.ent.box.com/s/n8qnv8tbiyc6tlbxibem280p1tlol7yr. 40
ACCEPTED VERSION
SUBJECT TO FIN
AL EDITS
Final Government Distribution Chapter 8 IPCC AR6 WGIII
Do Not Cite, Quote or Distribute 8-106 Total pages: 157
C40 Cities, ARUP, and University of Leeds, 2019: The Future of Urban Consumption in a 1.5C World 1 - C40 Cities Headline Report. C40 Cities, ARUP, and the University of Leeds, New York, 68 pp. 2 https://c40-production-3 images.s3.amazonaws.com/other_uploads/images/2270_C40_CBE_MainReport_250719.origina4 l.pdf?1564075036. 5
Cai, B. et al., 2019: China city-level greenhouse gas emissions inventory in 2015 and uncertainty 6 analysis. Appl. Energy, 253, 113579, doi:10.1016/j.apenergy.2019.113579. 7
Caldarice, O., N. Tollin, and M. Pizzorni, 2021: The relevance of science-policy-practice dialogue. 8 Exploring the urban climate resilience governance in Italy. City, Territ. Archit., 8, 9, 9 doi:10.1186/s40410-021-00137-y. 10
Calderón Márquez, A. J., and E. W. Rutkowski, 2020: Waste management drivers towards a circular 11 economy in the global south – The Colombian case. Waste Manag., 110, 53–65, 12 doi:10.1016/J.WASMAN.2020.05.016. 13
Calthorpe, P., 1993: The Next American Metropolis: Ecology, Community, and the American Dream. 14 Princeton Architectural Press, Princeton, NK, 180 pp. 15
Calvillo, C. F., A. Sánchez-Miralles, and J. Villar, 2016: Energy management and planning in smart 16 cities. Renew. Sustain. Energy Rev., 55, 273–287, doi:10.1016/j.rser.2015.10.133. 17
Calvin, K. et al., 2017: The SSP4: A world of deepening inequality. Glob. Environ. Chang., 42, 284–18 296, doi:10.1016/j.gloenvcha.2016.06.010. 19
Cambou, A. et al., 2018: Estimation of soil organic carbon stocks of two cities, New York City and 20 Paris. Sci. Total Environ., 644, 452–464, doi:10.1016/j.scitotenv.2018.06.322. 21
Cao, X., and W. Yang, 2017: Examining the effects of the built environment and residential self-22 selection on commuting trips and the related CO2 emissions: An empirical study in Guangzhou, 23 China. Transp. Res. Part D Transp. Environ., 52, 480–494, doi:10.1016/j.trd.2017.02.003. 24
Carpio, M., J. Roldán-Fontana, R. Pacheco-Torres, and J. Ordóñez, 2016: Construction waste 25 estimation depending on urban planning options in the design stage of residential buildings. 26 Constr. Build. Mater., 113, 561–570, doi:10.1016/j.conbuildmat.2016.03.061. 27
Carreiro, M. M., R. V. Pouyat, C. E. Tripler, and W. X. Zhu, 2009: Carbon and nitrogen cycling in soils 28 of remnant forests along urban–rural gradients: Case studies in the New York metropolitan area 29 and Louisville, Kentucky. In: Ecology of Cities and Towns: A Comparative Approach 30 [McDonnell, M.J., A.K. Hahs, and J.H. Breuste, (eds.)], Cambridge University Press, Cambridge, 31 pp. 308–328. 32
Carter, T. R. et al., 2021: A conceptual framework for cross-border impacts of climate change. Glob. 33 Environ. Chang., 69, 102307, doi:10.1016/j.gloenvcha.2021.102307. 34
Castán Broto, V., 2017a: Energy landscapes and urban trajectories towards sustainability. Energy 35 Policy, 108, 755–764, doi:10.1016/j.enpol.2017.01.009. 36
Castán Broto, V., 2017b: Urban Governance and the Politics of Climate change. World Dev., 93, 1–15, 37 doi:10.1016/j.worlddev.2016.12.031. 38
Cazzola, P. et al., 2019: Global EV Outlook 2019: Scaling up the transition to electric mobility. 39 OECD/IEA, Paris, France, 232 pp. https://www.iea.org/reports/global-ev-outlook-2019. 40
ACCEPTED VERSION
SUBJECT TO FIN
AL EDITS
Final Government Distribution Chapter 8 IPCC AR6 WGIII
Do Not Cite, Quote or Distribute 8-107 Total pages: 157
CCFLA, 2015: The State of City Climate Finance 2015. Cities Climate Finance Leadership Alliance 1 (CCFLA), New York, 1–68 pp. http://www.citiesclimatefinance.org/2015/12/the-state-of-city-2 climate-finance-2015-2/. 3
Chan, S. et al., 2015: Reinvigorating International Climate Policy: A Comprehensive Framework for 4 Effective Nonstate Action. Glob. Policy, 6(4), 466–473, doi:10.1111/1758-5899.12294. 5
Chan, S., R. Falkner, M. Goldberg, and H. van Asselt, 2018: Effective and geographically balanced? 6 An output-based assessment of non-state climate actions. Clim. Policy, 18(1), 24–35, 7 doi:10.1080/14693062.2016.1248343. 8
Chang, K. M. et al., 2017: Ancillary health effects of climate mitigation scenarios as drivers of policy 9 uptake: a review of air quality, transportation and diet co-benefits modeling studies. Environ. Res. 10 Lett., 12(11), 113001, doi:10.1088/1748-9326/aa8f7b. 11
Chapman, J., 2017: Value Capture Taxation as an Infrastructure Funding Technique. Public Work. 12 Manag. Policy, 22(1), 31–37, doi:10.1177/1087724X16670395. 13
Charani Shandiz, S., B. Rismanchi, and G. Foliente, 2021: Energy master planning for net-zero 14 emission communities: State of the art and research challenges. Renew. Sustain. Energy Rev., 137, 15 110600, doi:10.1016/j.rser.2020.110600. 16
Chava, J., and P. Newman, 2016: Stakeholder deliberation on developing affordable housing strategies: 17 Towards inclusive and sustainable transit-oriented developments. Sustain., 8(10), 11–13, 18 doi:10.3390/su8101024. 19
Chavez, A., and A. Ramaswami, 2013: Articulating a trans-boundary infrastructure supply chain 20 greenhouse gas emission footprint for cities: Mathematical relationships and policy relevance. 21 Energy Policy, 54, 376–384, doi:10.1016/j.enpol.2012.10.037. 22
Chen, C. et al., 2019a: Energy consumption and carbon footprint accounting of urban and rural residents 23 in Beijing through Consumer Lifestyle Approach. Ecol. Indic., 98, 575–586, 24 doi:10.1016/j.ecolind.2018.11.049. 25
Chen, G., T. Wiedmann, Y. Wang, and M. Hadjikakou, 2016: Transnational city carbon footprint 26 networks – Exploring carbon links between Australian and Chinese cities. Appl. Energy, 184, 27 1082–1092, doi:10.1016/j.apenergy.2016.08.053. 28
Chen, G., M. Hadjikakou, T. Wiedmann, and L. Shi, 2018a: Global warming impact of suburbanization: 29 The case of Sydney. J. Clean. Prod., 172, 287–301, doi:10.1016/j.jclepro.2017.10.161. 30
Chen, G. et al., 2019b: Review on City-Level Carbon Accounting. Environ. Sci. Technol., 53(10), 5545–31 5558, doi:10.1021/acs.est.8b07071. 32
Chen, G. et al., 2020a: Global projections of future urban land expansion under shared socioeconomic 33 pathways. Nat. Commun., 11, 537, doi:10.1038/s41467-020-14386-x. 34
Chen, Q. et al., 2017: CO2 emission data for Chinese cities. Resour. Conserv. Recycl., 126, 198–208, 35 doi:10.1016/j.resconrec.2017.07.011. 36
Chen, S., B. Xu, and B. Chen, 2018b: Unfolding the interplay between carbon flows and socioeconomic 37 development in a city: What can network analysis offer? Appl. Energy, 211, 403–412, 38 doi:10.1016/j.apenergy.2017.11.064. 39
Chen, S. et al., 2020b: Physical and virtual carbon metabolism of global cities. Nat. Commun., 11, 219–40
ACCEPTED VERSION
SUBJECT TO FIN
AL EDITS
Final Government Distribution Chapter 8 IPCC AR6 WGIII
Do Not Cite, Quote or Distribute 8-108 Total pages: 157
235, doi:10.1038/s41467-019-13757-3. 1
Chen, T. L., H. W. Chiu, and Y. F. Lin, 2020c: How do East and Southeast Asian cities differ from 2 Western cities? A systematic review of the urban form characteristics. Sustainability, 12(6), 3 doi:10.3390/su12062423. 4
Cheshmehzangi, A., and C. Butters, 2017: Chinese urban residential blocks: Towards improved 5 environmental and living qualities. Urban Des. Int., 22(3), 219–235, doi:10.1057/s41289-016-6 0013-9. 7
Chester, M. V., 2019: Sustainability and infrastructure challenges. Nat. Sustain., 2(4), 265–266, 8 doi:10.1038/s41893-019-0272-8. 9
Chifari, R., S. Lo Piano, S. Matsumoto, and T. Tasaki, 2017: Does recyclable separation reduce the cost 10 of municipal waste management in Japan? Waste Manag., 60, 32–41, 11 doi:10.1016/j.wasman.2017.01.015. 12
Chirambo, D., 2021: Corporate Sector Policy Innovations for Sustainable Development Goals (SDGs) 13 Implementation in the Global South: The Case of sub-Saharan Africa. Hapres J. Sustain. Res., 14 3(2), e210011, doi:10.20900/jsr20210011. 15
Choi, K., 2018: The influence of the built environment on household vehicle travel by the urban 16 typology in Calgary, Canada. Cities, 75, 101–110, doi:10.1016/j.cities.2018.01.006. 17
Christaller, W., 1933: Die zentralen Orte in Suddeutschland. Prentice Hall,. 18
Chu, E., 2016: The political economy of urban climate adaptation and development planning in Surat, 19 India. Environ. Plan. C Gov. Policy, 34(2), 281–298, doi:10.1177/0263774X15614174. 20
Chu, E., S. Hughes, and S. G. Mason, 2018: Conclusion: Multilevel Governance and Climate Change 21 Innovations in Cities. In: Climate Change in Cities: Innovations in Multi-Level Governance 22 [Hughes, S., E.K. Chu, and S.G. Mason, (eds.)], Springer, Cham, Switzerland, pp. 361–378. 23
Chu, E. et al., 2019: Unlocking the Potential for Transformative Climate Adaptation in Cities. World 24 Resources Institute (WRI), Washington, DC and Rotterdam, 76 pp. https://gca.org/wp-25 content/uploads/2020/12/UnlockingThePotentialForTransformativeAdaptationInCities.pdf. 26
Church, C., and A. Crawford, 2018: Green Conflict Minerals: The fuels of conflict in the transition to 27 a low-carbon economy. International Institute for Sustainable Development (IISD), Winnipeg, 49 28 pp. https://www.iisd.org/system/files/publications/green-conflict-minerals.pdf. 29
Churkina, G., 2008: Modeling the carbon cycle of urban systems. Ecol. Modell., 216(2), 107–113, 30 doi:10.1016/j.ecolmodel.2008.03.006. 31
Churkina, G., 2012: Carbonization of Urban Areas. In: Recarbonization of the Biosphere: Ecosystems 32 and the Global Carbon Cycle [Lal, R., K. Lorenz, R.F. Hüttl, B.U. Schneider, and J. Von Braun, 33 (eds.)], Springer Netherlands, Dordrecht, pp. 369–382. 34
Churkina, G. et al., 2020: Buildings as a global carbon sink. Nat. Sustain., 3(4), 269–276, 35 doi:10.1038/s41893-019-0462-4. 36
Cirolia, L. R., 2020: Fractured fiscal authority and fragmented infrastructures: Financing sustainable 37 urban development in Sub-Saharan Africa. Habitat Int., 104, 102233, 38 doi:10.1016/j.habitatint.2020.102233. 39
ACCEPTED VERSION
SUBJECT TO FIN
AL EDITS
Final Government Distribution Chapter 8 IPCC AR6 WGIII
Do Not Cite, Quote or Distribute 8-109 Total pages: 157
Cities for Climate, 2015: Paris City Hall Declaration: A Decisive Contribution to COP21. Climate 1 Summit for Local Leaders, Paris, 1 2 https://www.uclg.org/sites/default/files/climate_summit_final_declaration.pdf (Accessed 3 October 31, 2021). 4
Claude, S., S. Ginestet, M. Bonhomme, N. Moulène, and G. Escadeillas, 2017: The Living Lab 5 methodology for complex environments: Insights from the thermal refurbishment of a historical 6 district in the city of Cahors, France. Energy Res. Soc. Sci., 32, 121–130, 7 doi:10.1016/j.erss.2017.01.018. 8
Coalition for Urban Transitions, 2019: Climate Emergency, Urban Opportunity. C40 Cities Climate 9 Leadership Group (C40) and World Resources Institute (WRI) Ross Center for Sustainable Cities, 10 London and Washington, DC, 160 pp. https://urbantransitions.global/urban-opportunity/. 11
Coalition for Urban Transitions, 2020: Seizing the Urban Opportunity: Supporting National 12 Governments to Unlock the Economic Power of Low Carbon, Resilient and Inclusive Cities. 13 Coalition for Urban Transitions (CUT), Washington, DC, 48 pp. 14 https://urbantransitions.global/wp-15 content/uploads/2020/10/Seizing_the_Urban_Opportunity_web_FINAL.pdf. 16
Cole, M. B., M. A. Augustin, M. J. Robertson, and J. M. Manners, 2018: The science of food security. 17 npj Sci. Food, 2, 14, doi:10.1038/s41538-018-0021-9. 18
Colenbrander, S., A. Gouldson, A. H. Sudmant, and E. Papargyropoulou, 2015: The economic case for 19 low-carbon development in rapidly growing developing world cities: A case study of Palembang, 20 Indonesia. Energy Policy, 80, 24–35, doi:10.1016/j.enpol.2015.01.020. 21
Colenbrander, S. et al., 2016: Exploring the economic case for early investment in climate change 22 mitigation in middle-income countries: a case study of Johor Bahru, Malaysia. Clim. Dev., 8(4), 23 351–364, doi:10.1080/17565529.2015.1040367. 24
Colenbrander, S. et al., 2017: Can low-carbon urban development be pro-poor? The case of Kolkata, 25 India. Environ. Urban., 29(1), 139–158, doi:10.1177/0956247816677775. 26
Colenbrander, S., D. Dodman, and D. Mitlin, 2018a: Using climate finance to advance climate justice: 27 the politics and practice of channelling resources to the local level. Clim. Policy, 18(7), 902–915, 28 doi:10.1080/14693062.2017.1388212. 29
Colenbrander, S., M. Lindfield, J. Lufkin, and N. Quijano, 2018b: Financing Low-Carbon, Climate-30 Resilient Cities. Coalition for Urban Transitions (CUT), London and Washington, DC, 44 pp. 31 www.coalitionforurbantransitions.org (Accessed May 20, 2019). 32
Colenbrander, S., A. Sudmant, N. Chilundika, and A. Gouldson, 2019: The scope for low‐carbon 33 development in Kigali, Rwanda: An economic appraisal. Sustain. Dev., 27(3), 349–365, 34 doi:10.1002/sd.1906. 35
Collaço, F. M. de A. et al., 2019: The dawn of urban energy planning – Synergies between energy and 36 urban planning for São Paulo (Brazil) megacity. J. Clean. Prod., 215, 458–479, 37 doi:10.1016/j.jclepro.2019.01.013. 38
Conke, L. S., 2018: Barriers to waste recycling development: Evidence from Brazil. Resour. Conserv. 39 Recycl., 134, 129–135, doi:10.1016/j.resconrec.2018.03.007. 40
Corbett, J., and S. Mellouli, 2017: Winning the SDG battle in cities: how an integrated information 41 ecosystem can contribute to the achievement of the 2030 sustainable development goals. Inf. Syst. 42
ACCEPTED VERSION
SUBJECT TO FIN
AL EDITS
Final Government Distribution Chapter 8 IPCC AR6 WGIII
Do Not Cite, Quote or Distribute 8-110 Total pages: 157
J., 27(4), 427–461, doi:10.1111/isj.12138. 1
Corfee-Morlot, J. et al., 2009: Cities, Climate Change and Multilevel Governance. OECD, Paris, 1–123 2 pp. https://www.oecd.org/env/cc/44242293.pdf. 3
Corsini, F., C. Certomà, M. Dyer, and M. Frey, 2019: Participatory energy: Research, imaginaries and 4 practices on people’ contribute to energy systems in the smart city. Technol. Forecast. Soc. 5 Change, 142, 322–332, doi:10.1016/j.techfore.2018.07.028. 6
CPI, and World Bank, 2021: The State of Cities Climate Finance Executive Summary. Climate Policy 7 Initiative (CPI) and World Bank, San Francisco, 16 pp. 8
Creutzig, F., 2016: Evolving Narratives of Low-Carbon Futures in Transportation. Transp. Rev., 36(3), 9 341–360, doi:10.1080/01441647.2015.1079277. 10
Creutzig, F., G. Baiocchi, R. Bierkandt, P.-P. Pichler, and K. C. Seto, 2015: Global typology of urban 11 energy use and potentials for an urbanization mitigation wedge. PNAS, 112(20), 6283–6288, 12 doi:10.1073/pnas.1315545112. 13
Creutzig, F. et al., 2016a: Urban infrastructure choices structure climate solutions. Nat. Clim. Chang., 14 6(12), 1054–1056, doi:10.1038/nclimate3169. 15
Creutzig, F. et al., 2016b: Beyond Technology: Demand-Side Solutions for Climate Change Mitigation. 16 Annu. Rev. Environ. Resour., 41, 173–198, doi:10.1146/annurev-environ-110615-085428. 17
Creutzig, F. et al., 2019: Upscaling urban data science for global climate solutions. Glob. Sustain., 2, 18 e2, doi:10.1017/sus.2018.16. 19
Creutzig, F., X. Bai, R. Khosla, V. Viguie, and Y. Yamagata, 2020: Systematizing and upscaling urban 20 climate change mitigation. Environ. Res. Lett., 15(10), 100202, doi:10.1088/1748-9326/abb0b2. 21
Culwick, C. et al., 2019: CityLab reflections and evolutions: nurturing knowledge and learning for 22 urban sustainability through co-production experimentation. Curr. Opin. Environ. Sustain., 39, 9–23 16, doi:10.1016/j.cosust.2019.05.008. 24
D’Adamo, I., P. M. Falcone, D. Huisingh, and P. Morone, 2021: A circular economy model based on 25 biomethane: What are the opportunities for the municipality of Rome and beyond? Renew. Energy, 26 163, 1660–1672, doi:10.1016/j.renene.2020.10.072. 27
d’Amour, C. B. et al., 2017: Future urban land expansion and implications for global croplands. Proc. 28 Natl. Acad. Sci., 114(34), 8939–8944, doi:10.1073/PNAS.1606036114. 29
Dagnachew, A. G., P. L. Lucas, A. F. Hof, and D. P. van Vuuren, 2018: Trade-offs and synergies 30 between universal electricity access and climate change mitigation in Sub-Saharan Africa. Energy 31 Policy, 114, 355–366, doi:10.1016/j.enpol.2017.12.023. 32
Dalziel, B. D. et al., 2018: Urbanization and humidity shape the intensity of influenza epidemics in U.S. 33 cities. Science, 362(6410), 75–79, doi:10.1126/science.aat6030. 34
Data-Driven EnviroLab, and NewClimate Institute, 2020: Accelerating Net Zero: Exploring Cities, 35 Regions, and Companies’ Pledges to Decarbonise. [Hsu, A. et al., (eds.)]. New Climate Institute, 36 Singapore, 24 pp. http://datadrivenlab.org/wp-37 content/uploads/2020/09/Accelerating_Net_Zero_Report_Sept2020.pdf. 38
Data Driven Yale, NewClimate Institute, and PBL, 2018: Global climate action of regions, states and 39
ACCEPTED VERSION
SUBJECT TO FIN
AL EDITS
Final Government Distribution Chapter 8 IPCC AR6 WGIII
Do Not Cite, Quote or Distribute 8-111 Total pages: 157
businesses. [Hsu, A. et al., (eds.)]. Data Driven Yale, NewClimate Institute, PBL Netherlands 1 Environmental Assessment Agency, 107 pp. http://bit.ly/yale-nci-pbl-global-climate-action. 2
Dávila, J. D., and D. Daste, 2012: Medellin’s aerial cable-cars: social inclusion and reduced emissions. 3 Development Planning Unit, University College London (UCL), London, 4 pp. 4 https://www.ucl.ac.uk/bartlett/development/sites/bartlett/files/davila-daste-2012-unep.pdf 5 (Accessed October 31, 2021). 6
Davis, K. J. et al., 2017: The Indianapolis Flux Experiment (INFLUX): A test-bed for developing urban 7 greenhouse gas emission measurements. Elem Sci Anth, 5, 21, doi:10.1525/elementa.188. 8
Davis, M., and S. Naumann, 2017: Making the Case for Sustainable Urban Drainage Systems as a 9 Nature-Based Solution to Urban Flooding. In: Nature-Based Solutions to Climate Change 10 Adaptation in Urban Areas: Linkages between Science, Policy and Practice [Kabisch, N., H. 11 Korn, J. Stadler, and A. Bonn, (eds.)], Springer International Publishing, Cham, Switzerland, pp. 12 123–137. 13
Davis, S. J. et al., 2018: Net-zero emissions energy systems. Science, 360(6396), eaas9793, 14 doi:10.1126/science.aas9793. 15
Dawson, R. J. et al., 2018: A systems framework for national assessment of climate risks to 16 infrastructure. Philos. Trans. A. Math. Phys. Eng. Sci., 376(2121), 20170298, 17 doi:10.1098/rsta.2017.0298. 18
de Bercegol, R., and S. Gowda, 2019: A new waste and energy nexus? Rethinking the modernisation 19 of waste services in Delhi. Urban Stud., 56(11), 2297–2314, doi:10.1177/0042098018770592. 20
De Chalendar, J. A., P. W. Glynn, and S. M. Benson, 2019: City-scale decarbonization experiments 21 with integrated energy systems. Energy Environ. Sci., 12(5), 1695–1707, doi:10.1039/c8ee03706j. 22
de Haas, M., R. Faber, and M. Hamersma, 2020: How COVID-19 and the Dutch ‘intelligent lockdown’ 23 change activities, work and travel behaviour: Evidence from longitudinal data in the Netherlands. 24 Transp. Res. Interdiscip. Perspect., 6, 100150, doi:10.1016/j.trip.2020.100150. 25
De la Sota, C., V. J. Ruffato-Ferreira, L. Ruiz-García, and S. Alvarez, 2019: Urban green infrastructure 26 as a strategy of climate change mitigation. A case study in northern Spain. Urban For. Urban 27 Green., 40, 145–151, doi:10.1016/j.ufug.2018.09.004. 28
Deason, J., and M. Borgeson, 2019: Electrification of Buildings: Potential, Challenges, and Outlook. 29 Curr. Sustain. Energy Reports, 6(4), 131–139, doi:10.1007/s40518-019-00143-2. 30
Debrunner, G., and T. Hartmann, 2020: Strategic use of land policy instruments for affordable housing 31 – Coping with social challenges under scarce land conditions in Swiss cities. Land use policy, 99, 32 104993, doi:10.1016/j.landusepol.2020.104993. 33
Dénarié, A., M. Calderoni, and M. Aprile, 2018: Multicriteria Approach for a Multisource District 34 Heating. In: Smart and Sustainable Planning for Cities and Regions [Bisello, A., D. Vettorato, P. 35 Laconte, and S. Costa, (eds.)], Springer, Cham, Cham, Switzerland, pp. 21–33. 36
Deng, Y., B. Fu, and C. Sun, 2018: Effects of urban planning in guiding urban growth: Evidence from 37 Shenzhen, China. Cities, 83, 118–128, doi:10.1016/j.cities.2018.06.014. 38
Dhar, S., M. Pathak, and P. R. Shukla, 2017: Electric vehicles and India’s low carbon passenger 39 transport: a long-term co-benefits assessment. J. Clean. Prod., 146, 139–148, 40 doi:10.1016/j.jclepro.2016.05.111. 41
ACCEPTED VERSION
SUBJECT TO FIN
AL EDITS

Final Government Distribution Chapter 8 IPCC AR6 WGIII
Do Not Cite, Quote or Distribute 8-112 Total pages: 157
Di Giulio, G. M., A. M. B. Bedran-Martins, M. da P. Vasconcellos, W. C. Ribeiro, and M. C. Lemos, 1 2018: Mainstreaming climate adaptation in the megacity of São Paulo, Brazil. Cities, 72, 237–2 244, doi:10.1016/j.cities.2017.09.001. 3
Di Giulio, M., R. Holderegger, and S. Tobias, 2009: Effects of habitat and landscape fragmentation on 4 humans and biodiversity in densely populated landscapes. J. Environ. Manage., 90(10), 2959–5 2968, doi:10.1016/j.jenvman.2009.05.002. 6
Diallo, T., N. Cantoreggi, and J. Simos, 2016: Health Co-benefits of climate change mitigation policies 7 at local level: Case Study Geneva. Environnement, Risques et Sante, 15(4), 332–340, 8 doi:10.1684/ers.2016.0890. 9
Dias, S. M., 2016: Waste pickers and cities. Environ. Urban., 28(2), 375–390, 10 doi:10.1177/0956247816657302. 11
Díaz-Villavicencio, G., S. R. Didonet, and A. Dodd, 2017: Influencing factors of eco-efficient urban 12 waste management: Evidence from Spanish municipalities. J. Clean. Prod., 164, 1486–1496, 13 doi:10.1016/j.jclepro.2017.07.064. 14
Diaz, L. F., 2017: Waste management in developing countries and the circular economy. Waste Manag. 15 Res., 35(1), 1–2, doi:10.1177/0734242X16681406. 16
Dienst, C. et al., 2015: Wuxi – a Chinese City on its Way to a Low Carbon Future. J. Sustain. Dev. 17 Energy, Water Environ. Syst., 3(1), 12–25, doi:10.13044/j.sdewes.2015.03.0002. 18
Ding, C., D. Wang, C. Liu, Y. Zhang, and J. Yang, 2017: Exploring the influence of built environment 19 on travel mode choice considering the mediating effects of car ownership and travel distance. 20 Transp. Res. Part A Policy Pract., 100, 65–80, doi:10.1016/j.tra.2017.04.008. 21
Ding, C., Y. Wang, T. Tang, S. Mishra, and C. Liu, 2018: Joint analysis of the spatial impacts of built 22 environment on car ownership and travel mode choice. Transp. Res. Part D Transp. Environ., 60, 23 28–40, doi:10.1016/j.trd.2016.08.004. 24
Dobler, C., D. Pfeifer, and W. Streicher, 2018: Reaching energy autonomy in a medium-sized city - 25 three scenarios to model possible future energy developments in the residential building sector. 26 Sustain. Dev., 26(6), 859–869, doi:10.1002/sd.1855. 27
Dodman, D., 2009: Blaming cities for climate change? An analysis of urban greenhouse gas emissions 28 inventories. Environ. Urban., 21(1), 185–201, doi:10.1177/0956247809103016. 29
Dodman, D. et al., 2022: Cities, Settlements and Key Infrastructure. In: Climate Change 2022: Impacts, 30 Adaptation and Vulnerability. Contribution of Working Group II to the Sixth Assessment Report 31 of the Intergovernmental Panel on Climate Change, Cambridge University Press (In Press), 32 Cambridge. 33
Dominković, D. F., and G. Krajačić, 2019: District cooling versus individual cooling in urban energy 34 systems: The impact of district energy share in cities on the optimal storage sizing. Energies, 35 12(3), 407, doi:10.3390/en12030407. 36
Domke, G. M. et al., 2016: Estimating litter carbon stocks on forest land in the United States. Sci. Total 37 Environ., 557–558, 469–478, doi:10.1016/j.scitotenv.2016.03.090. 38
Dorotić, H., T. Pukšec, and N. Duić, 2019: Multi-objective optimization of district heating and cooling 39 systems for a one-year time horizon. Energy, 169, 319–328, doi:10.1016/j.energy.2018.11.149. 40
ACCEPTED VERSION
SUBJECT TO FIN
AL EDITS
Final Government Distribution Chapter 8 IPCC AR6 WGIII
Do Not Cite, Quote or Distribute 8-113 Total pages: 157
Dou, Y. et al., 2016: An empirical study on transit-oriented low-carbon urban land use planning: 1 Exploratory Spatial Data Analysis (ESDA) on Shanghai, China. Habitat Int., 53, 379–389, 2 doi:10.1016/j.habitatint.2015.12.005. 3
Drangert, J.-O., and H. C. Sharatchandra, 2017: Addressing urban water scarcity: reduce, treat and reuse 4 – the third generation of management to avoid local resources boundaries. Water Policy, 19(5), 5 978–996, doi:10.2166/wp.2017.152. 6
Drysdale, D., B. V. Mathiesen, and H. Lund, 2019: From carbon calculators to energy system analysis 7 in cities. Energies, 12(12), 2307, doi:10.3390/en12122307. 8
du Toit, M. J. et al., 2018: Urban green infrastructure and ecosystem services in sub-Saharan Africa. 9 Landsc. Urban Plan., 180, 249–261, doi:10.1016/j.landurbplan.2018.06.001. 10
Duany, A., and E. Plater-Zyberck, 1991: Towns and town-making principles. 1st ed. Harvard Graduate 11 School of Design and Rizzoli, Cambridge, MA and New York, 120 pp. 12
Dulal, H. B., 2017: Making cities resilient to climate change: identifying “win–win” interventions. 13 Local Environ., 22(1), 106–125, doi:10.1080/13549839.2016.1168790. 14
Dulal, H. B., 2019: Cities in Asia: how are they adapting to climate change? J. Environ. Stud. Sci., 9, 15 13–24, doi:10.1007/s13412-018-0534-1. 16
Duranton, G., and M. A. Turner, 2018: Urban form and driving: Evidence from US cities. J. Urban 17 Econ., 108, 170–191, doi:10.1016/j.jue.2018.10.003. 18
Dzhambov, A. M., D. D. Dimitrova, and E. D. Dimitrakova, 2014: Association between residential 19 greenness and birth weight: Systematic review and meta-analysis. Urban For. Urban Green., 20 13(4), 621–629, doi:10.1016/j.ufug.2014.09.004. 21
EC, 2015: Closing the loop - An EU action plan for the Circular Economy (Communication from the 22 Commission to the European Parliament, the Council, the European Economic and Social 23 Committee of the Regions). European Commission (EC), Brussels,. 24
EC, 2020: A new Circular Economy Action Plan For a cleaner and more competitive Europe. European 25 Commission (EC), Brussels,. 26
Egusquiza, A., I. Prieto, J. L. Izkara, and R. Béjar, 2018: Multi-scale urban data models for early-stage 27 suitability assessment of energy conservation measures in historic urban areas. Energy Build., 164, 28 87–98, doi:10.1016/j.enbuild.2017.12.061. 29
Eigenbrod, C., and N. Gruda, 2015: Urban vegetable for food security in cities. A review. Agron. 30 Sustain. Dev., 35, 483–498, doi:10.1007/s13593-014-0273-y. 31
Eisted, R., A. W. Larsen, and T. H. Christensen, 2009: Collection, transfer and transport of waste: 32 accounting of greenhouse gases and global warming contribution: Waste Manag. Res., 27(8), 738–33 745, doi:10.1177/0734242X09347796. 34
Endo, A., I. Tsurita, K. Burnett, and P. M. Orencio, 2017: A review of the current state of research on 35 the water, energy, and food nexus. J. Hydrol. Reg. Stud., 11, 20–30, 36 doi:10.1016/j.ejrh.2015.11.010. 37
Engels, A., 2018: Understanding how China is championing climate change mitigation. Palgrave 38 Commun., 4, 101, doi:10.1057/s41599-018-0150-4. 39
ACCEPTED VERSION
SUBJECT TO FIN
AL EDITS
Final Government Distribution Chapter 8 IPCC AR6 WGIII
Do Not Cite, Quote or Distribute 8-114 Total pages: 157
Engström, R. E. et al., 2017: Connecting the resource nexus to basic urban service provision – with a 1 focus on water-energy interactions in New York City. Sustain. Cities Soc., 31, 83–94, 2 doi:10.1016/j.scs.2017.02.007. 3
Enzi, V. et al., 2017: Nature-Based Solutions and Buildings – The Power of Surfaces to Help Cities 4 Adapt to Climate Change and to Deliver Biodiversity. In: Nature-Based Solutions to Climate 5 Change Adaptation in Urban Areas: Linkages between Science, Policy and Practice [Kabisch, N., 6 H. Korn, J. Stadler, and A. Bonn, (eds.)], Springer International Publishing, Cham, pp. 159–183. 7
Erickson, P., and K. Tempest, 2015: Keeping cities green: Avoiding carbon lock-in due to urban 8 development. Stockholm Environment Institute (SEI), Seattle, 28 pp. www.sei-international.org 9 (Accessed June 5, 2020). 10
Eriksson, M., I. Strid, and P.-A. Hansson, 2015: Carbon footprint of food waste management options 11 in the waste hierarchy – a Swedish case study. J. Clean. Prod., 93, 115–125, 12 doi:10.1016/j.jclepro.2015.01.026. 13
EU, 2016: Urban Agenda for the EU ‘Pact of Amsterdam.’ Informal Meeting of EU Ministers 14 Responsible for Urban Matters, Amsterdam, 36 pp. 15 https://ec.europa.eu/regional_policy/sources/policy/themes/urban-development/agenda/pact-of-16 amsterdam.pdf. 17
Ewing, R., and R. Cervero, 2010: Travel and the Built Environment. J. Am. Plan. Assoc., 76(3), 265–18 294, doi:10.1080/01944361003766766. 19
Ewing, R. et al., 2018: Testing Newman and Kenworthy’s Theory of Density and Automobile 20 Dependence. J. Plan. Educ. Res., 38(2), 167–182, doi:10.1177/0739456X16688767. 21
Ezeudu, O. B., and T. S. Ezeudu, 2019: Implementation of Circular Economy Principles in Industrial 22 Solid Waste Management: Case Studies from a Developing Economy (Nigeria). Recycling, 4(4), 23 42, doi:10.3390/RECYCLING4040042. 24
Facchini, A., C. Kennedy, I. Stewart, and R. Mele, 2017: The energy metabolism of megacities. Appl. 25 Energy, 186(Part 2), 86–95, doi:10.1016/j.apenergy.2016.09.025. 26
Fang, K. et al., 2017: Carbon footprints of urban transition: Tracking circular economy promotions in 27 Guiyang, China. Ecol. Modell., 365, 30–44, doi:10.1016/j.ecolmodel.2017.09.024. 28
Fastenrath, S., and B. Braun, 2018: Ambivalent urban sustainability transitions: Insights from 29 Brisbane’s building sector. J. Clean. Prod., 176, 581–589, doi:10.1016/j.jclepro.2017.12.134. 30
Fatimah, Y. A., K. Govindan, R. Murniningsih, and A. Setiawan, 2020: Industry 4.0 based sustainable 31 circular economy approach for smart waste management system to achieve sustainable 32 development goals: A case study of Indonesia. J. Clean. Prod., 269, 122263, 33 doi:10.1016/J.JCLEPRO.2020.122263. 34
Félix, R., P. Cambra, and F. Moura, 2020: Build it and give ‘em bikes, and they will come: The effects 35 of cycling infrastructure and bike-sharing system in Lisbon. Case Stud. Transp. Policy, 8(2), 672–36 682, doi:10.1016/j.cstp.2020.03.002. 37
Fichera, A., M. Frasca, V. Palermo, and R. Volpe, 2018: An optimization tool for the assessment of 38 urban energy scenarios. Energy, 156, 418–429, doi:10.1016/j.energy.2018.05.114. 39
Fiori, A., and E. Volpi, 2020: On the Effectiveness of LID Infrastructures for the Attenuation of Urban 40 Flooding at the Catchment Scale. Water Resour. Res., 56(5), e2020WR027121, 41
ACCEPTED VERSION
SUBJECT TO FIN
AL EDITS
Final Government Distribution Chapter 8 IPCC AR6 WGIII
Do Not Cite, Quote or Distribute 8-115 Total pages: 157
doi:10.1029/2020WR027121. 1
Fisher-Jeffes, L., N. Armitage, and K. Carden, 2017: The viability of domestic rainwater harvesting in 2 the residential areas of the Liesbeek River Catchment, Cape Town. Water SA, 43(1), 81–90, 3 doi:10.4314/wsa.v43i1.11. 4
Flacke, J., and C. de Boer, 2017: An Interactive Planning Support Tool for Addressing Social 5 Acceptance of Renewable Energy Projects in The Netherlands. ISPRS Int. J. Geo-Information, 6 6(10), 313, doi:10.3390/ijgi6100313. 7
Floater, G. et al., 2017: Global Review of Finance For Sustainable Urban Infrastructure. The Coalition 8 for Urban Transitions (CUT), 1–60 pp. http://newclimateeconomy.net/content/cities-working-9 papers. 10
Folke, C. et al., 2021: Our future in the Anthropocene biosphere. Ambio, 50(4), 834–869, 11 doi:10.1007/s13280-021-01544-8. 12
Fong, W. K. et al., 2014: Global Protocol for Community-Scale Greenhouse Gas Emission Inventories: 13 An Accounting and Reporting Standard for Cities. World Resources Institute (WRI), C40 Cities 14 (C40), and ICLEI, Washington, DC, 176 pp. http://c40-production-15 images.s3.amazonaws.com/other_uploads/images/143_GHGP_GPC_1.0.original.pdf?1426866616 13. 17
Fonseca, J. A., and A. Schlueter, 2015: Integrated model for characterization of spatiotemporal building 18 energy consumption patterns in neighborhoods and city districts. Appl. Energy, 142, 247–265, 19 doi:10.1016/j.apenergy.2014.12.068. 20
Ford, A. et al., 2019: A multi-scale urban integrated assessment framework for climate change studies: 21 A flooding application. Comput. Environ. Urban Syst., 75, 229–243, 22 doi:10.1016/j.compenvurbsys.2019.02.005. 23
Foxon, T. J. et al., 2015: Low carbon infrastructure investment: extending business models for 24 sustainability. Infrastruct. Complex., 2, 4, doi:10.1186/s40551-015-0009-4. 25
Fragkias, M., J. Lobo, D. Strumsky, and K. C. Seto, 2013: Does Size Matter? Scaling of CO2 Emissions 26 and U.S. Urban Areas. PLoS One, 8(6), e64727, doi:10.1371/journal.pone.0064727. 27
Frantzeskaki, N. et al., 2019: Nature-Based Solutions for Urban Climate Change Adaptation: Linking 28 Science, Policy, and Practice Communities for Evidence-Based Decision-Making. Bioscience, 29 69(6), 455–466, doi:10.1093/biosci/biz042. 30
Fratini, C. F., S. Georg, and M. S. Jørgensen, 2019: Exploring circular economy imaginaries in 31 European cities: A research agenda for the governance of urban sustainability transitions. J. Clean. 32 Prod., 228, 974–989, doi:10.1016/j.jclepro.2019.04.193. 33
Fraundorfer, M., 2017: The Role of Cities in Shaping Transnational Law in Climate Governance. Glob. 34 Policy, 8(1), 23–31, doi:10.1111/1758-5899.12365. 35
Frenova, S., 2021: Orchestrating the Participation of Women Organisations in the UNFCCC Led 36 Climate Finance Decision Making. Climate, 9(9), 135, doi:10.3390/cli9090135. 37
Fricko, O. et al., 2017: The marker quantification of the Shared Socioeconomic Pathway 2: A middle-38 of-the-road scenario for the 21st century. Glob. Environ. Chang., 42, 251–267, 39 doi:10.1016/j.gloenvcha.2016.06.004. 40
ACCEPTED VERSION
SUBJECT TO FIN
AL EDITS
Final Government Distribution Chapter 8 IPCC AR6 WGIII
Do Not Cite, Quote or Distribute 8-116 Total pages: 157
Friend, R. M. et al., 2016: Re-imagining Inclusive Urban Futures for Transformation. Curr. Opin. 1 Environ. Sustain., 20, 67–72, doi:10.1016/j.cosust.2016.06.001. 2
Fuhr, H., T. Hickmann, and K. Kern, 2018: The role of cities in multi-level climate governance: local 3 climate policies and the 1.5 °C target. Curr. Opin. Environ. Sustain., 30, 1–6, 4 doi:10.1016/j.cosust.2017.10.006. 5
Fujimori, S. et al., 2017: SSP3: AIM implementation of Shared Socioeconomic Pathways. Glob. 6 Environ. Chang., 42, 268–283, doi:10.1016/j.gloenvcha.2016.06.009. 7
Fuso Nerini, F. et al., 2018: Mapping synergies and trade-offs between energy and the Sustainable 8 Development Goals. Nat. Energy, 3, 10–15, doi:10.1038/s41560-017-0036-5. 9
Gabaix, X., 1999: Zipf’s Law for Cities: An Explanation. Q. J. Econ., 114(3), 739–767, 10 doi:10.1162/003355399556133. 11
Gabaldón-Estevan, D., K. Orru, C. Kaufmann, and H. Orru, 2019: Broader impacts of the fare-free 12 public transportation system in Tallinn. Int. J. Urban Sustain. Dev., 11(3), 332–345, 13 doi:10.1080/19463138.2019.1596114. 14
Gai, Y. et al., 2020: Health and climate benefits of Electric Vehicle Deployment in the Greater Toronto 15 and Hamilton Area. Environ. Pollut., 265, 114983, doi:10.1016/j.envpol.2020.114983. 16
Galloway, D., and P. Newman, 2014: How to design a sustainable heavy industrial estate. Renew. 17 Energy, 67, 46–52, doi:10.1016/j.renene.2013.11.018. 18
Gang, W., S. Wang, F. Xiao, and D. C. Gao, 2016: District cooling systems: Technology integration, 19 system optimization, challenges and opportunities for applications. Renew. Sustain. Energy Rev., 20 53, 253–264, doi:10.1016/j.rser.2015.08.051. 21
Gao, J., and B. C. O’Neill, 2020: Mapping global urban land for the 21st century with data-driven 22 simulations and Shared Socioeconomic Pathways. Nat. Commun., 11, 2302, doi:10.1038/s41467-23 020-15788-7. 24
Gao, J. et al., 2017: Perceptions of Health Co-Benefits in Relation to Greenhouse Gas Emission 25 Reductions: A Survey among Urban Residents in Three Chinese Cities. Int. J. Environ. Res. Public 26 Health, 14(3), 298, doi:10.3390/ijerph14030298. 27
Gao, Y., and P. Newman, 2018: Beijing’s peak car transition: Hope for emerging cities in the 1.5 °C 28 agenda. Urban Plan., 3(2), 82–93, doi:10.17645/up.v3i2.1246. 29
García-Gusano, D., D. Iribarren, and J. Dufour, 2018: Towards Energy Self-sufficiency in Large 30 Metropolitan Areas: Business Opportunities on Renewable Electricity in Madrid. In: Renewable 31 Energies [Márquez, F.P.G., A. Karyotakis, and M. Papaelias, (eds.)], Springer International 32 Publishing, Cham, Switzerland, pp. 17–31. 33
Gately, C. K., L. R. Hutyra, S. Peterson, and I. Sue Wing, 2017: Urban emissions hotspots: Quantifying 34 vehicle congestion and air pollution using mobile phone GPS data. Environ. Pollut., 229, 496–35 504, doi:10.1016/j.envpol.2017.05.091. 36
Gaustad, G., M. Krystofik, M. Bustamante, and K. Badami, 2018: Circular economy strategies for 37 mitigating critical material supply issues. Resour. Conserv. Recycl., 135, 24–33, 38 doi:10.1016/j.resconrec.2017.08.002. 39
GCoM, 2018: Implementing Climate Ambition: Global Covenant of Mayors 2018 Global Aggregation 40
ACCEPTED VERSION
SUBJECT TO FIN
AL EDITS
Final Government Distribution Chapter 8 IPCC AR6 WGIII
Do Not Cite, Quote or Distribute 8-117 Total pages: 157
Report. The Global Covenant of Mayors for Climate and Energy (GCoM), Brussels, 6 pp. 1 https://www.globalcovenantofmayors.org/wp-2 content/uploads/2018/09/2018_GCOM_report_web.pdf. 3
GCoM, 2019: Climate Emergency: Unlocking the Urban Opportunity Together. The Global Covenant 4 of Mayors for Climate and Energy (GCoM), Brussels, 37 pp. 5 https://www.globalcovenantofmayors.org/wp-content/uploads/2019/12/2019-GCoM-6 Aggregation-Report.pdf. 7
Gebreegziabher, Z., L. Naik, R. Melamu, and B. B. Balana, 2014: Prospects and challenges for urban 8 application of biogas installations in Sub-Saharan Africa. Biomass and Bioenergy, 70, 130–140, 9 doi:10.1016/j.biombioe.2014.02.036. 10
Geneletti, D., D. La Rosa, M. Spyra, and C. Cortinovis, 2017: A review of approaches and challenges 11 for sustainable planning in urban peripheries. Landsc. Urban Plan., 165, 231–243, 12 doi:10.1016/j.landurbplan.2017.01.013. 13
Gharfalkar, M., R. Court, C. Campbell, Z. Ali, and G. Hillier, 2015: Analysis of waste hierarchy in the 14 European waste directive 2008/98/EC. Waste Manag., 39, 305–313, 15 doi:10.1016/j.wasman.2015.02.007. 16
Gidden, M. J. et al., 2019: Global emissions pathways under different socioeconomic scenarios for use 17 in CMIP6: A dataset of harmonized emissions trajectories through the end of the century. Geosci. 18 Model Dev., 12(4), 1443–1475, doi:10.5194/gmd-12-1443-2019. 19
Gill, B., and S. Moeller, 2018: GHG Emissions and the Rural-Urban Divide. A Carbon Footprint 20 Analysis Based on the German Official Income and Expenditure Survey. Ecol. Econ., 145, 160–21 169, doi:10.1016/j.ecolecon.2017.09.004. 22
Gillingham, K. T., C. R. Knittel, J. Li, M. Ovaere, and M. Reguant, 2020: The Short-run and Long-run 23 Effects of Covid-19 on Energy and the Environment. Joule, 4(7), 1337–1341, 24 doi:10.1016/j.joule.2020.06.010. 25
Gjorgievski, V. Z., N. Markovska, A. Abazi, and N. Duić, 2020: The potential of power-to-heat demand 26 response to improve the flexibility of the energy system: An empirical review. Renew. Sustain. 27 Energy Rev., 138, 110489, doi:10.1016/j.rser.2020.110489. 28
Global Commission on the Economy and Climate, 2014: Better Growth, Better Climate: The New 29 Climate Economy Report - Synthesis Report. New Climate Economy, Global Commission on the 30 Economy and Climate, Washington, DC, 72 pp. https://newclimateeconomy.report/2016/wp-31 content/uploads/sites/2/2014/08/BetterGrowth-BetterClimate_NCE_Synthesis-Report_web.pdf. 32
Gondhalekar, D., and T. Ramsauer, 2017: Nexus City: Operationalizing the urban Water-Energy-Food 33 Nexus for climate change adaptation in Munich, Germany. Urban Clim., 19, 28–40, 34 doi:10.1016/j.uclim.2016.11.004. 35
González-García, S., M. R. Caamaño, M. T. Moreira, and G. Feijoo, 2021: Environmental profile of 36 the municipality of Madrid through the methodologies of Urban Metabolism and Life Cycle 37 Analysis. Sustain. Cities Soc., 64, 102546, doi:10.1016/j.scs.2020.102546. 38
Gonzalez-Valencia, R., F. Magana-Rodriguez, J. Cristóbal, and F. Thalasso, 2016: Hotspot detection 39 and spatial distribution of methane emissions from landfills by a surface probe method. Waste 40 Manag., 55, 299–305, doi:10.1016/j.wasman.2016.03.004. 41
Gopal, D., and H. Nagendra, 2014: Vegetation in Bangalore’s slums: Boosting livelihoods, well-being 42
ACCEPTED VERSION
SUBJECT TO FIN
AL EDITS
Final Government Distribution Chapter 8 IPCC AR6 WGIII
Do Not Cite, Quote or Distribute 8-118 Total pages: 157
and social capital. Sustain., 6(5), 2459–2473, doi:10.3390/su6052459. 1
Göpfert, C., C. Wamsler, and W. Lang, 2019: A framework for the joint institutionalization of climate 2 change mitigation and adaptation in city administrations. Mitig. Adapt. Strateg. Glob. Chang., 24, 3 1–21, doi:10.1007/s11027-018-9789-9. 4
Göpfert, C., C. Wamsler, and W. Lang, 2020: Enhancing structures for joint climate change mitigation 5 and adaptation action in city administrations – Empirical insights and practical implications. City 6 Environ. Interact., 8, 100052, doi:10.1016/j.cacint.2020.100052. 7
Gorissen, L., F. Spira, E. Meynaerts, P. Valkering, and N. Frantzeskaki, 2018: Moving towards systemic 8 change? Investigating acceleration dynamics of urban sustainability transitions in the Belgian City 9 of Genk. J. Clean. Prod., 173, 171–185, doi:10.1016/j.jclepro.2016.12.052. 10
Gould, C. F. et al., 2018: Government policy, clean fuel access, and persistent fuel stacking in Ecuador. 11 Scaling Up Clean Fuel Cook. Programs, 46, 111–122, doi:10.1016/j.esd.2018.05.009. 12
Gouldson, A. et al., 2015: Exploring the economic case for climate action in cities. Glob. Environ. 13 Chang., 35, 93–105, doi:10.1016/j.gloenvcha.2015.07.009. 14
Gouldson, A. et al., 2016: Cities and climate change mitigation: Economic opportunities and 15 governance challenges in Asia. Cities, 54, 11–19, doi:10.1016/j.cities.2015.10.010. 16
Grafakos, S., K. Trigg, M. Landauer, L. Chelleri, and S. Dhakal, 2019: Analytical framework to 17 evaluate the level of integration of climate adaptation and mitigation in cities. Clim. Change, 18 154(1–2), 87–106, doi:10.1007/s10584-019-02394-w. 19
Grafakos, S. et al., 2020: Integration of mitigation and adaptation in urban climate change action plans 20 in Europe: A systematic assessment. Renew. Sustain. Energy Rev., 121, 109623, 21 doi:10.1016/j.rser.2019.109623. 22
Graglia, J. M., and C. Mellon, 2018: Blockchain and Property in 2018: At the End of the Beginning. 23 Innov. Technol. Governance, Glob., 12(1–2), 90–116, doi:10.1162/inov_a_00270. 24
Grandin, J., H. Haarstad, K. Kjærås, and S. Bouzarovski, 2018: The politics of rapid urban 25 transformation. Curr. Opin. Environ. Sustain., 31, 16–22, doi:10.1016/j.cosust.2017.12.002. 26
Granoff, I., J. R. Hogarth, and A. Miller, 2016: Nested barriers to low-carbon infrastructure investment. 27 Nat. Clim. Chang., 6(12), 1065–1071, doi:10.1038/nclimate3142. 28
Green, J., and P. Newman, 2017: Citizen utilities: The emerging power paradigm. Energy Policy, 105, 29 283–293, doi:10.1016/j.enpol.2017.02.004. 30
Green, J., P. Newman, and N. Forse, 2020: RENeW Nexus: Enabling resilient, low cost & localised 31 electricity markets through blockchain P2P & VPP trading. Power Ledger and Curtin University, 32 Perth, Australia, 62 pp. https://www.powerledger.io/wp-content/uploads/renew-nexus-project-33 report.pdf. 34
Green, J. F., 2017: The strength of weakness: pseudo-clubs in the climate regime. Clim. Change, 144, 35 41–52, doi:10.1007/s10584-015-1481-4. 36
Gregg, J. W., C. G. Jones, and T. E. Dawson, 2003: Urbanization effects on tree growth in the vicinity 37 of New York City. Nature, 424, 183–187, doi:10.1038/nature01728. 38
Grimm, N. B., J. M. Grove, S. T. A. Pickett, and C. L. Redman, 2000: Integrated approaches to long-39
ACCEPTED VERSION
SUBJECT TO FIN
AL EDITS
Final Government Distribution Chapter 8 IPCC AR6 WGIII
Do Not Cite, Quote or Distribute 8-119 Total pages: 157
term studies of urban ecological systems. Bioscience, 50(7), 571–584, doi:10.1641/0006-1 3568(2000)050[0571:IATLTO]2.0.CO;2. 2
Grimm, N. B. et al., 2008: Global Change and the Ecology of Cities. Science, 319(5864), 756–760, 3 doi:10.1126/SCIENCE.1150195. 4
Große, J., C. Fertner, and N. B. Groth, 2016: Urban Structure, Energy and Planning: Findings from 5 Three Cities in Sweden, Finland and Estonia. Urban Plan., 1(1), 24–40, 6 doi:10.17645/up.v1i1.506. 7
Grové, J., P. A. Lant, C. R. Greig, and S. Smart, 2018: Is MSW derived DME a viable clean cooking 8 fuel in Kolkata, India? Renew. Energy, 124, 50–60, doi:10.1016/j.renene.2017.08.039. 9
Gruebner, O. et al., 2017: Cities and Mental Health. Dtsch. Aerzteblatt Online, 114(121–127), 10 doi:10.3238/arztebl.2017.0121. 11
Gu, B., X. Zhang, X. Bai, B. Fu, and D. Chen, 2019: Four steps to food security for swelling cities. 12 Nature, 566, 31–33, doi:10.1038/d41586-019-00407-3. 13
Gudipudi, R., T. Fluschnik, A. G. C. Ros, C. Walther, and J. P. Kropp, 2016: City density and CO2 14 efficiency. Energy Policy, 91, 352–361, doi:10.1016/j.enpol.2016.01.015. 15
Guelpa, E., A. Sciacovelli, and V. Verda, 2019: Thermo-fluid dynamic model of large district heating 16 networks for the analysis of primary energy savings. Energy, 184, 34–44, 17 doi:10.1016/j.energy.2017.07.177. 18
Güneralp, B., and K. C. Seto, 2013: Futures of global urban expansion: Uncertainties and implications 19 for biodiversity conservation. Environ. Res. Lett., 8(1), 014025, doi:10.1088/1748-20 9326/8/1/014025. 21
Güneralp, B., S. Lwasa, H. Masundire, S. Parnell, and K. C. Seto, 2017: Urbanization in Africa: 22 challenges and opportunities for conservation. Environ. Res. Lett., 13, 015002, doi:10.1088/1748-23 9326/aa94fe. 24
Güneralp, B., M. Reba, B. U. Hales, E. A. Wentz, and K. C. Seto, 2020: Trends in urban land expansion, 25 density, and land transitions from 1970 to 2010: a global synthesis. Environ. Res. Lett., 15(4), 26 044015, doi:10.1088/1748-9326/ab6669. 27
Gurney, K., and P. Shepson, 2021: Opinion: The power and promise of improved climate data 28 infrastructure. Proc. Natl. Acad. Sci., 118(35), e2114115118, doi:10.1073/pnas.2114115118. 29
Gurney, K. R. et al., 2015: Climate change: Track urban emissions on a human scale. Nature, 525, 179–30 181, doi:10.1038/525179a. 31
Gurney, K. R. et al., 2019: The Hestia fossil fuel CO2 emissions data product for the Los Angeles 32 megacity (Hestia-LA). Earth Syst. Sci. Data, 11(3), 1309–1335, doi:10.5194/essd-11-1309-2019. 33
Gurney, K. R. et al., 2021a: Greenhouse Gas Emissions from Global Cities Under SSP/RCP Scenarios, 34 1990 to 2100. EarthArXiv, doi:10.31223/X5Z639. . 35
Gurney, K. R. et al., 2021b: Impact and rebound of near real-time United States fossil fuel carbon 36 dioxide emissions from COVID-19 and large differences with global estimates. EarthArXiv, 37 doi:10.31223/X5GC9Z. . 38
Hachaichi, M., and T. Baouni, 2021: Virtual carbon emissions in the big cities of middle-income 39
ACCEPTED VERSION
SUBJECT TO FIN
AL EDITS
Final Government Distribution Chapter 8 IPCC AR6 WGIII
Do Not Cite, Quote or Distribute 8-120 Total pages: 157
countries. Urban Clim., 40, 100986, doi:10.1016/j.uclim.2021.100986. 1
Hadfield, P., and N. Cook, 2019: Financing the Low-Carbon City: Can Local Government Leverage 2 Public Finance to Facilitate Equitable Decarbonisation? Urban Policy Res., 37(1), 13–29, 3 doi:10.1080/08111146.2017.1421532. 4
Hale, T. N. et al., 2020: Sub- and non-state climate action: a framework to assess progress, 5 implementation and impact. Clim. Policy, 21(3), 406–420, doi:10.1080/14693062.2020.1828796. 6
Hall, D., M. Moultak, and N. Lutsey, 2017a: Electric vehicle capitals of the world: Demonstrating the 7 path to electric drive. The International Council on Clean Transportation (ICCT), Washington, 8 DC, 57 pp. http://www.theicct.org/EV-capitals-of-the-world. 9
Hall, D. M. et al., 2017b: The city as a refuge for insect pollinators. Conserv. Biol., 31(1), 24–29, 10 doi:10.1111/cobi.12840. 11
Hall, P., and D. Hay, 1980: Growth centres in the European urban system. Heinemann Educational 12 Books, Ltd, London, 310 pp. 13
Hallegatte, S., J. Rentschler, and J. Rozenberg, 2019: Lifelines: The Resilient Infrastructure 14 Opportunity. The World Bank, Washington, DC, 224 pp. http://hdl.handle.net/10986/31805. 15
Hamidi, S., S. Sabouri, and R. Ewing, 2020: Does Density Aggravate the COVID-19 Pandemic?: Early 16 Findings and Lessons for Planners. J. Am. Plan. Assoc., 86(4), 495–509, 17 doi:10.1080/01944363.2020.1777891. 18
Han, F., R. Xie, Y. Lu, J. Fang, and Y. Liu, 2018: The effects of urban agglomeration economies on 19 carbon emissions: Evidence from Chinese cities. J. Clean. Prod., 172, 1096–1110, 20 doi:10.1016/j.jclepro.2017.09.273. 21
Han, P. et al., 2021: Assessing the recent impact of COVID-19 on carbon emissions from China using 22 domestic economic data. Sci. Total Environ., 750, 141688, 23 doi:10.1016/J.SCITOTENV.2020.141688. 24
Handy, S., 1996: Methodologies for exploring the link between urban form and travel behavior. Transp. 25 Res. Part D Transp. Environ., 1(2), 151–165, doi:10.1016/S1361-9209(96)00010-7. 26
Handy, S., 2020: Is accessibility an idea whose time has finally come? Transp. Res. Part D Transp. 27 Environ., 83, 102319, doi:10.1016/j.trd.2020.102319. 28
Hansen, P., G. M. Morrison, A. Zaman, and X. Liu, 2020: Smart technology needs smarter management: 29 Disentangling the dynamics of digitalism in the governance of shared solar energy in Australia. 30 Energy Res. Soc. Sci., 60, 101322, doi:10.1016/j.erss.2019.101322. 31
Hanson, P. J. et al., 2003: Soil Respiration and Litter Decomposition. In: North American temperate 32 deciduous forest responses to changing precipitation regimes [Hanson, P.J. and S.D. 33 Wullschleger, (eds.)], Springer, New York, NY, pp. 163–189. 34
Harris, S., J. Weinzettel, A. Bigano, and A. Källmén, 2020: Low carbon cities in 2050? GHG emissions 35 of European cities using production-based and consumption-based emission accounting methods. 36 J. Clean. Prod., 248, 119206, doi:10.1016/j.jclepro.2019.119206. 37
Haupt, W., and A. Coppola, 2019: Climate governance in transnational municipal networks: advancing 38 a potential agenda for analysis and typology. Int. J. Urban Sustain. Dev., 11(2), 123–140, 39 doi:10.1080/19463138.2019.1583235. 40
ACCEPTED VERSION
SUBJECT TO FIN
AL EDITS
Final Government Distribution Chapter 8 IPCC AR6 WGIII
Do Not Cite, Quote or Distribute 8-121 Total pages: 157
He, B.-J. et al., 2019: Co-benefits approach: Opportunities for implementing sponge city and urban heat 1 island mitigation. Land use policy, 86, 147–157, doi:10.1016/j.landusepol.2019.05.003. 2
Heikkinen, M., T. Ylä-Anttila, and S. Juhola, 2019: Incremental, reformistic or transformational: what 3 kind of change do C40 cities advocate to deal with climate change? J. Environ. Policy Plan., 21(1), 4 90–103, doi:10.1080/1523908X.2018.1473151. 5
Heinonen, J. et al., 2020: Spatial consumption-based carbon footprint assessments - A review of recent 6 developments in the field. J. Clean. Prod., 256, 120335, doi:10.1016/j.jclepro.2020.120335. 7
Helgenberger, S., and M. Jänicke, 2017: Mobilizing the co-benefits of climate change mitigation: 8 Connecting opportunities with interests in the new energy world of renewables. Institute for 9 Advanced Sustainability Studies (IASS), Potsdam, 20 pp. https://www.iass-10 potsdam.de/sites/default/files/files/iass_working_paper_co_benefits.pdf. 11
Henneman, L. R. F., P. Rafaj, H. J. Annegarn, and C. Klausbruckner, 2016: Assessing emissions levels 12 and costs associated with climate and air pollution policies in South Africa. Energy Policy, 89, 13 160–170, doi:10.1016/j.enpol.2015.11.026. 14
Herath, P., M. Thatcher, H. Jin, and X. Bai, 2021: Effectiveness of urban surface characteristics as 15 mitigation strategies for the excessive summer heat in cities. Sustain. Cities Soc., 72, 103072, 16 doi:10.1016/j.scs.2021.103072. 17
Herrero, A., and M. Vilella, 2018: ‘We have a right to breathe clean air’: the emerging environmental 18 justice movement against waste incineration in cement kilns in Spain. Sustain. Sci., 13(3), 721–19 731, doi:10.1007/s11625-017-0473-x. 20
Herrmann, A. et al., 2018: Household preferences for reducing greenhouse gas emissions in four 21 European high-income countries: Does health information matter? A mixed-methods study 22 protocol. BMC Public Health, 18, 71, doi:10.1186/s12889-017-4604-1. 23
Hickmann, T., and F. Stehle, 2017: Urban Climate Governance Experiments in South Africa: Insights 24 from Johannesburg, Cape Town, and Durban. ISA Annual Convention, Baltimore, 26 25 https://www.uni-potsdam.de/fileadmin01/projects/fuhr/ISA_Paper_Hickmann__StehleFinal.pdf. 26
Hickmann, T., H. Fuhr, C. Höhne, M. Lederer, and F. Stehle, 2017: Carbon Governance Arrangements 27 and the Nation-State: The Reconfiguration of Public Authority in Developing Countries. Public 28 Adm. Dev., 37(5), 331–343, doi:10.1002/pad.1814. 29
Hjalmarsson, L., 2015: Biogas as a boundary object for policy integration – the case of Stockholm. J. 30 Clean. Prod., 98, 185–193, doi:10.1016/j.jclepro.2014.10.042. 31
Ho, C. S., Y. Matsuoka, J. Simson, and K. Gomi, 2013: Low carbon urban development strategy in 32 Malaysia - The case of Iskandar Malaysia development corridor. Habitat Int., 37(SI), 43–51, 33 doi:10.1016/j.habitatint.2011.12.018. 34
Ho, C. S., L. W. Chau, B. T. Teh, Y. Matsuoka, and K. Gomi, 2015: “Science to action” of the 35 sustainable low carbon city-region: Lessons learnt from Iskandar Malaysia. In: Enabling Asia to 36 Stabilise the Climate [Nishioka, S., (ed.)], Springer Singapore, Singapore, pp. 119–150. 37
Hofmann, J., D. Guan, K. Chalvatzis, and H. Huo, 2016: Assessment of electrical vehicles as a 38 successful driver for reducing CO2 emissions in China. Appl. Energy, 184, 995–1003, 39 doi:10.1016/j.apenergy.2016.06.042. 40
Hölscher, K., N. Frantzeskaki, and D. Loorbach, 2019: Steering transformations under climate change: 41
ACCEPTED VERSION
SUBJECT TO FIN
AL EDITS
Final Government Distribution Chapter 8 IPCC AR6 WGIII
Do Not Cite, Quote or Distribute 8-122 Total pages: 157
capacities for transformative climate governance and the case of Rotterdam, the Netherlands. Reg. 1 Environ. Chang., 19(3), 791–805, doi:10.1007/s10113-018-1329-3. 2
Hoornweg, D., and P. Bhada-Tata, 2012: What a Waste : A Global Review of Solid Waste Management. 3 World Bank, Washington, D.C., 98 pp. 4
Hoornweg, D., and K. Pope, 2017: Population predictions for the world’s largest cities in the 21st 5 century. Environ. Urban., 29(1), 195–216, doi:10.1177/0956247816663557. 6
Hoppe, T., A. van der Vegt, and P. Stegmaier, 2016: Presenting a Framework to Analyze Local Climate 7 Policy and Action in Small and Medium-Sized Cities. Sustainability, 8(9), 847, 8 doi:10.3390/su8090847. 9
Hsieh, S. et al., 2017: Defining density and land uses under energy performance targets at the early 10 stage of urban planning processes. Energy Procedia, 122, 301–306, 11 doi:10.1016/j.egypro.2017.07.326. 12
Hsu, A. et al., 2018: Bridging the emissions gap - The role of non-state and subnational actors. In: The 13 Emissions Gap Report 2018, A UN Environment Synthesis Report, United Nations Environment 14 Programme (UNEP), Nairobi, p. pp. 27. 15
Hsu, A. et al., 2019: A research roadmap for quantifying non-state and subnational climate mitigation 16 action. Nat. Clim. Chang., 9, 11–17, doi:10.1038/s41558-018-0338-z. 17
Hsu, A. et al., 2020a: ClimActor, harmonized transnational data on climate network participation by 18 city and regional governments. Sci. Data, 7, 374, doi:10.1038/s41597-020-00682-0. 19
Hsu, A., N. Höhne, T. Kuramochi, V. Vilariño, and B. K. Sovacool, 2020b: Beyond states: Harnessing 20 sub-national actors for the deep decarbonisation of cities, regions, and businesses. Energy Res. 21 Soc. Sci., 70, 101738, doi:10.1016/j.erss.2020.101738. 22
Hsu, A. et al., 2020c: Performance determinants show European cities are delivering on climate 23 mitigation. Nat. Clim. Chang., 10(11), 1015–1022, doi:10.1038/s41558-020-0879-9. 24
Hu, J., G. Liu, and F. Meng, 2018: Estimates of The Effectiveness for Urban Energy Conservation and 25 Carbon Abatement Policies: The Case of Beijing City, China. J. Environ. Account. Manag., 6(3), 26 199–214, doi:10.5890/JEAM.2018.09.002. 27
Hu, L., J. Cao, and J. Yang, 2020: Planning for accessibility. Transp. Res. Part D Transp. Environ., 88, 28 102575, doi:10.1016/j.trd.2020.102575. 29
Hu, M.-C., C.-Y. Wu, and T. Shih, 2015: Creating a new socio-technical regime in China: Evidence 30 from the Sino-Singapore Tianjin Eco-City. Futures, 70, 1–12, doi:10.1016/j.futures.2015.04.001. 31
Hu, Y., J. Lin, S. Cui, and N. Z. Khanna, 2016: Measuring Urban Carbon Footprint from Carbon Flows 32 in the Global Supply Chain. Environ. Sci. Technol., 50(12), 6154–6163, 33 doi:10.1021/acs.est.6b00985. 34
Huang, K., X. Li, X. Liu, and K. C. Seto, 2019: Projecting global urban land expansion and heat island 35 intensification through 2050. Environ. Res. Lett., 14(11), 114037, doi:10.1088/1748-36 9326/ab4b71. 37
Hunter, R. G., J. W. Day, A. R. Wiegman, and R. R. Lane, 2019: Municipal wastewater treatment costs 38 with an emphasis on assimilation wetlands in the Louisiana coastal zone. Ecol. Eng., 137, 21–25, 39 doi:10.1016/j.ecoleng.2018.09.020. 40
ACCEPTED VERSION
SUBJECT TO FIN
AL EDITS

Final Government Distribution Chapter 8 IPCC AR6 WGIII
Do Not Cite, Quote or Distribute 8-123 Total pages: 157
Hurlimann, A., S. Moosavi, and G. R. Browne, 2021: Urban planning policy must do more to integrate 1 climate change adaptation and mitigation actions. Land use policy, 101, 105188, 2 doi:10.1016/j.landusepol.2020.105188. 3
ICLEI, 2019a: ICLEI in the urban era-2019 update. ICLEI - Local Governments for Sustainability 4 (ICLEI), Bonn, 140 pp. http://e-lib.iclei.org/wp-content/uploads/2019/07/ICLEI-in-the-Urban-5 Era-2019-edition.pdf. 6
ICLEI, 2019b: U.S. Community Protocol for Accounting and Reporting of Greenhouse Gas Emissions. 7 ICLEI—Local Governments for Sustainability (ICLEI), Bonn, 69 pp. 8 https://icleiusa.org/publications/us-community-protocol/. 9
IEA, 2014: EV City Casebook: 50 Big Ideas Shaping the Future of Electric Mobility. OECD/IEA, Paris, 10 74 pp. 11
IEA, 2016a: Energy Technology Perspectives 2016: Towards Sustainable Urban Energy Systems. 12 OECD/IEA, Paris, 418 pp. 13
IEA, 2016b: Global EV Outlook 2016: Beyond one million electric cars. Organisation for Economic 14 Co-operation and Development (OECD)/International Energy Agency (IEA), Paris, 49 pp. 15
IEA, 2017: Global EV Outlook 2017: Two million and counting. OECD/IEA, Paris, 71 pp. 16
IEA, 2018: Global EV Outlook 2018: Towards cross-modal electrification. OECD/IEA, Paris, 141 pp. 17
IEA, 2020a: Global EV Outlook 2020: Entering the decade of electric drive? OECD/IEA, Paris, 276 18 pp. https://www.iea.org/reports/global-ev-outlook-2020. 19
IEA, 2020b: World Energy Outlook 2020. International Energy Agency (IEA), Paris, 464 pp. 20 https://www.iea.org/reports/world-energy-outlook-2020. 21
IEA, 2021a: Empowering Cities for a Net Zero Future: Unlocking resilient, smart, sustainable urban 22 energy systems. International Energy Agency (IEA), Paris, 108 pp. 23
IEA, 2021b: Global EV Outlook 2021: Accelerating ambitions despite the pandemic. International 24 Energy Agency (IEA), Paris, 101 pp. https://www.iea.org/reports/global-ev-outlook-2021. 25
ILO, 2018: Women and men in the informal economy: A statistical picture. 3rd ed. International Labour 26 Office (ILO), Geneva, 156 pp. http://www.ilo.org/global/about-the-27 ilo/newsroom/news/WCMS_627189/lang--en/index.htm (Accessed December 30, 2020). 28
Ingrao, C., A. Messineo, R. Beltramo, T. Yigitcanlar, and G. Ioppolo, 2019: Application of life cycle 29 assessment in buildings: An overview of theoretical and practical information. In: The Routledge 30 Companion to Environmental Planning [Davoudi, S., R. Cowell, I. White, and H. Blanco, (eds.)], 31 Routledge, London, pp. 372–381. 32
IPBES, 2019a: Summary for policymakers of the global assessment report on biodiversity and 33 ecosystem services of the Intergovernmental Science-Policy Platform on Biodiversity and 34 Ecosystem Services. [Díaz, S. et al., (eds.)]. Intergovernmental Science-Policy Platform on 35 Biodiversity and Ecosystem Services (IPBES), Bonn, Germany, 56 pp. 36
IPBES, 2019b: Global assessment report on biodiversity and ecosystem services of the 37 Intergovernmental Science‐Policy Platform on Biodiversity and Ecosystem Services. [Brondizio, 38 E.S., J. Settele, S. Díaz, and H.T. Ngo, (eds.)]. Intergovernmental Science-Policy Platform on 39 Biodiversity and Ecosystem Services (IPBES), Bonn, Germany, 1148 pp. 40
ACCEPTED VERSION
SUBJECT TO FIN
AL EDITS
Final Government Distribution Chapter 8 IPCC AR6 WGIII
Do Not Cite, Quote or Distribute 8-124 Total pages: 157
https://www.ipbes.net/global-assessment. 1
IPCC, 2018a: Global Warming of 1.5°C. An IPCC Special Report on the impacts of global warming of 2 1.5°C above pre-industrial levels and related global greenhouse gas emission pathways, in the 3 context of strengthening the global response to the threat of climate change,. [Masson-Delmotte, 4 V. et al., (eds.)]. Intergovernmental Panel on Climate Change (IPCC), Geneva, 630 pp. 5 https://www.ipcc.ch/sr15/. 6
IPCC, 2018b: Summary for Policymakers. In: Global warming of 1.5°C. An IPCC Special Report on 7 the impacts of global warming of 1.5°C above pre-industrial levels and related global greenhouse 8 gas emission pathways, in the context of strengthening the global response to the threat of climate 9 change, [Masson-Delmotte, V. et al., (eds.)], Intergovernmental Panel on Climate Change (IPCC), 10 Geneva, pp. 1–24. 11
IPCC, 2019: Climate Change and Land: An IPCC Special Report on climate change, desertification, 12 land degradation, sustainable land management, food security, and greenhouse gas fluxes in 13 terrestrial ecosystems. [Shukla, P.R. et al., (eds.)]. Intergovernmental Panel on Climate Change 14 (IPCC), Geneva, 874 pp. 15
IPCC, 2021: Climate Change 2021: The Physical Science Basis. Contribution of Working Group I to 16 the Sixth Assessment Report of the Intergovernmental Panel on Climate Change. [Masson-17 Delmotte, V. et al., (eds.)]. Cambridge University Press (In Press), Cambridge,. 18
IRENA, 2021: World Energy Transitions Outlook: 1.5°C Pathway. International Renewable Energy 19 Agency (IRENA), Abu Dhabi, 312 pp. https://www.irena.org/publications/2021/Jun/World-20 Energy-Transitions-Outlook. 21
Islam, K. M. N., 2018: Municipal solid waste to energy generation: An approach for enhancing climate 22 co-benefits in the urban areas of Bangladesh. Renew. Sustain. Energy Rev., 81, 2472–2486, 23 doi:10.1016/j.rser.2017.06.053. 24
IUCN, 2021: Nature-based Solutions. https://www.iucn.org/theme/nature-based-solutions (Accessed 25 October 11, 2021). 26
Ivanova, D. et al., 2016: Environmental Impact Assessment of Household Consumption. J. Ind. Ecol., 27 20(3), 526–536, doi:10.1111/jiec.12371. 28
Jacobs, J., 1969: The economy of cities. Random House, New York, 283 pp. 29
Jacobson, M. Z. et al., 2018: 100% clean and renewable Wind, Water, and Sunlight (WWS) all-sector 30 energy roadmaps for 53 towns and cities in North America. Sustain. Cities Soc., 42, 22–37, 31 doi:10.1016/j.scs.2018.06.031. 32
Jacobson, M. Z. et al., 2020: Transitioning All Energy in 74 Metropolitan Areas, Including 30 33 Megacities, to 100% Clean and Renewable Wind, Water, and Sunlight (WWS). Energies, 13(18), 34 4934, doi:10.3390/en13184934. 35
Jaganmohan, M., S. Knapp, C. M. Buchmann, and N. Schwarz, 2016: The Bigger, the Better? The 36 Influence of Urban Green Space Design on Cooling Effects for Residential Areas. J. Environ. 37 Qual., 45(1), 134–145, doi:10.2134/jeq2015.01.0062. 38
Jagarnath, M., and T. Thambiran, 2018: Greenhouse gas emissions profiles of neighbourhoods in 39 Durban, South Africa – an initial investigation. Environ. Urban., 30(1), 191–214, 40 doi:10.1177/0956247817713471. 41
ACCEPTED VERSION
SUBJECT TO FIN
AL EDITS
Final Government Distribution Chapter 8 IPCC AR6 WGIII
Do Not Cite, Quote or Distribute 8-125 Total pages: 157
Jaglin, S., 2014: Urban Energy Policies and the Governance of Multilevel Issues in Cape Town. Urban 1 Stud., 51(7), 1394–1414, doi:10.1177/0042098013500091. 2
Jamei, E., H. W. Chau, M. Seyedmahmoudian, and A. Stojcevski, 2021: Review on the cooling potential 3 of green roofs in different climates. Sci. Total Environ., 791, 148407, 4 doi:10.1016/j.scitotenv.2021.148407. 5
Jarzebski, M. P. et al., 2021: Ageing and population shrinking: implications for sustainability in the 6 urban century. npj Urban Sustain., 1(1), 17, doi:10.1038/s42949-021-00023-z. 7
Jiang, L., and B. C. O’Neill, 2017: Global urbanization projections for the Shared Socioeconomic 8 Pathways. Glob. Environ. Chang., 42, 193–199, doi:10.1016/j.gloenvcha.2015.03.008. 9
Jiang, Y., E. van der Werf, E. C. van Ierland, and K. J. Keesman, 2017: The potential role of waste 10 biomass in the future urban electricity system. Biomass and Bioenergy, 107, 182–190, 11 doi:10.1016/j.biombioe.2017.10.001. 12
Jiang, Y., Y. Long, Q. Liu, K. Dowaki, and T. Ihara, 2020: Carbon emission quantification and 13 decarbonization policy exploration for the household sector - Evidence from 51 Japanese cities. 14 Energy Policy, 140, 111438, doi:10.1016/j.enpol.2020.111438. 15
Jones, C., and D. M. Kammen, 2014: Spatial distribution of U.S. household carbon footprints reveals 16 suburbanization undermines greenhouse gas benefits of urban population density. Environ. Sci. 17 Technol., 48(2), 895–902, doi:10.1021/es4034364. 18
Jonker, M. F., F. J. van Lenthe, B. Donkers, J. P. Mackenbach, and A. Burdorf, 2014: The effect of 19 urban green on small-area (healthy) life expectancy. J. Epidemiol. Community Health, 68(10), 20 999–1002, doi:10.1136/jech-2014-203847. 21
Joshi, C., J. Seay, and N. Banadda, 2019: A perspective on a locally managed decentralized circular 22 economy for waste plastic in developing countries. Environ. Prog. Sustain. Energy, 38(1), 3–11, 23 doi:10.1002/EP.13086. 24
Kabisch, N., M. Strohbach, D. Haase, and J. Kronenberg, 2016: Urban green space availability in 25 European cities. Ecol. Indic., 70, 586–596, doi:10.1016/j.ecolind.2016.02.029. 26
Kalmykova, Y., L. Rosado, and J. Patrício, 2015: Urban Economies Resource Productivity and 27 Decoupling: Metabolism Trends of 1996–2011 in Sweden, Stockholm, and Gothenburg. Environ. 28 Sci. Technol., 49(14), 8815–8823, doi:10.1021/acs.est.5b01431. 29
Kalmykova, Y., L. Rosado, and J. Patrício, 2016: Resource consumption drivers and pathways to 30 reduction: economy, policy and lifestyle impact on material flows at the national and urban scale. 31 J. Clean. Prod., 132, 70–80, doi:10.1016/j.jclepro.2015.02.027. 32
Kamiya, M., M. Prakash, and H. Berggren, 2020: Financing Sustainable Urbanization: Counting the 33 Costs and Closing the Gap. UN-Habitat, Nairob, 8 pp. 34 https://unhabitat.org/sites/default/files/2020/02/financing_sustainable_urbanization_-35 _counting_the_costs_and_closing_the_gap_february_2020.pdf. 36
Kammen, D. M., and D. A. Sunter, 2016: City-integrated renewable energy for urban sustainability. 37 Science )., 352(6288), 922–928, doi:10.1126/science.aad9302. 38
Kamruzzaman, M., F. M. Shatu, J. Hine, and G. Turrell, 2015: Commuting mode choice in transit 39 oriented development: Disentangling the effects of competitive neighbourhoods, travel attitudes, 40 and self-selection. Transp. Policy, 42, 187–196, doi:10.1016/j.tranpol.2015.06.003. 41
ACCEPTED VERSION
SUBJECT TO FIN
AL EDITS
Final Government Distribution Chapter 8 IPCC AR6 WGIII
Do Not Cite, Quote or Distribute 8-126 Total pages: 157
Kang, C.-N., and S.-H. Cho, 2018: Thermal and electrical energy mix optimization(EMO) method for 1 real large-scaled residential town plan. J. Electr. Eng. Technol., 13(1), 513–520, 2 doi:10.5370/JEET.2018.13.1.513. 3
Kareem, B. et al., 2020: Pathways for resilience to climate change in African cities. Environ. Res. Lett., 4 15(7), 73002, doi:10.1088/1748-9326/ab7951. 5
Karlsson, M., E. Alfredsson, and N. Westling, 2020: Climate policy co-benefits: a review. Clim. Policy, 6 20(3), 292–316, doi:10.1080/14693062.2020.1724070. 7
Kastner, I., and P. C. Stern, 2015: Examining the decision-making processes behind household energy 8 investments: A review. Energy Res. Soc. Sci., 10, 72–89, doi:10.1016/j.erss.2015.07.008. 9
Kaza, S., Y. Lisa, P. Bhada-Tata, and F. Van Woerden, 2018: What a Waste 2.0: A Global Snapshot of 10 Solid Waste Management to 2050. The World Bank, Washington D.C, 38 pp. 11
Keenan, J. M., E. Chu, and J. Peterson, 2019: From funding to financing: perspectives shaping a 12 research agenda for investment in urban climate adaptation. Int. J. Urban Sustain. Dev., 11(3), 13 297–308, doi:10.1080/19463138.2019.1565413. 14
Keller, M., 2017: Multilevel Governance Theory in Practice: How Converging Models Explain Urban 15 Climate Change Mitigation Policy in Bristol. University of Cambridge, 60 pp. 16
Kennedy, C. A., 2015: Key threshold for electricity emissions. Nat. Clim. Chang., 5(3), 179–181, 17 doi:10.1038/nclimate2494. 18
Kennedy, C. A. et al., 2009: Greenhouse Gas Emissions from Global Cities. Environ. Sci. Technol., 19 43(19), 7297–7302, doi:10.1021/es900213p. 20
Kennedy, C. A., I. D. Stewart, M. I. Westphal, A. Facchini, and R. Mele, 2018: Keeping global climate 21 change within 1.5 °C through net negative electric cities. Curr. Opin. Environ. Sustain., 30, 18–22 25, doi:10.1016/j.cosust.2018.02.009. 23
Kennedy, C. A., I. D. Stewart, and M. I. Westphal, 2019: Shifting Currents: Opportunities for Low 24 Carbon Electric Cities in the Global South. World Resources Institute (WRI), Washington, DC, 25 36 pp. https://wrirosscities.org/sites/default/files/19_WP_Shifting_Currents_final.pdf. 26
Keramidas, K. et al., 2018: Global Energy and Climate Outlook 2018: Sectoral mitigation options 27 towards a low-emissions economy – Global context to the EU strategy for long-term greenhouse 28 gas emissions reduction, EUR 29462 EN. European Union (EU), Luxembourg, 200 pp. 29
Kern, K., 2019: Cities as leaders in EU multilevel climate governance : embedded upscaling of local 30 experiments in Europe. Env. Polit., 28, 125–145, doi:10.1080/09644016.2019.1521979. 31
Khan, K., and C.-W. Su, 2021: Urbanization and carbon emissions: a panel threshold analysis. Environ. 32 Sci. Pollut. Res., 28(20), 26073–26081, doi:10.1007/S11356-021-12443-6. 33
Khan, M. M.-U.-H., S. Jain, M. Vaezi, and A. Kumar, 2016: Development of a decision model for the 34 techno-economic assessment of municipal solid waste utilization pathways. Waste Manag., 48, 35 548–564, doi:10.1016/j.wasman.2015.10.016. 36
Khavarian-Garmsir, A. R., A. Sharifi, and N. Moradpour, 2021: Are high-density districts more 37 vulnerable to the COVID-19 pandemic? Sustain. Cities Soc., 70, 102911, 38 doi:10.1016/j.scs.2021.102911. 39
ACCEPTED VERSION
SUBJECT TO FIN
AL EDITS
Final Government Distribution Chapter 8 IPCC AR6 WGIII
Do Not Cite, Quote or Distribute 8-127 Total pages: 157
Khosla, R., and A. Bhardwaj, 2019: Urbanization in the time of climate change: Examining the response 1 of Indian cities. Wiley Interdiscip. Rev. Clim. Chang., 10(1), e560, doi:10.1002/wcc.560. 2
Kii, M., 2020: Reductions in CO2 Emissions from Passenger Cars under Demography and Technology 3 Scenarios in Japan by 2050. Sustainability, 12(17), 6919, doi:10.3390/su12176919. 4
Kii, M., 2021: Projecting future populations of urban agglomerations around the world and through the 5 21st century. npj Urban Sustain., 1(1), 10, doi:10.1038/s42949-020-00007-5. 6
Kim, G., and P. Coseo, 2018: Urban Park Systems to Support Sustainability: The Role of Urban Park 7 Systems in Hot Arid Urban Climates. Forests, 9(7), 439, doi:10.3390/f9070439. 8
Kim, H., and W. Chen, 2018: Changes in energy and carbon intensity in Seoul’s water sector. Sustain. 9 Cities Soc., 41, 749–759, doi:10.1016/j.scs.2018.06.001. 10
Kılkış, Ş., 2019: Benchmarking the sustainability of urban energy, water and environment systems and 11 envisioning a cross-sectoral scenario for the future. Renew. Sustain. Energy Rev., 103, 529–545, 12 doi:10.1016/j.rser.2018.11.006. 13
Kılkış, Ş., 2021a: Urban-Level-Emission-Scenarios: Urban Level Emission Scenarios. Zenodo, 14 doi:10.5281/zenodo.5559792. . 15
Kılkış, Ş., 2021b: Transition towards urban system integration and benchmarking of an urban area to 16 accelerate mitigation towards net-zero targets. Energy, 236, 121394, 17 doi:10.1016/j.energy.2021.121394. 18
Kjellstrom, T., and A. J. McMichael, 2013: Climate change threats to population health and well-being: 19 the imperative of protective solutions that will last. Glob. Health Action, 6(1), 20816, 20 doi:10.3402/gha.v6i0.20816. 21
Klopp, J. M., and D. L. Petretta, 2017: The urban sustainable development goal: Indicators, complexity 22 and the politics of measuring cities. Cities, 63, 92–97, doi:10.1016/j.cities.2016.12.019. 23
Knoll, M., 2021: Cities–Regions–Hinterlands: Metabolisms, Markets, and Mobilities Revisited. [Knoll, 24 M., (ed.)]. StudienVerlag, 346 pp. 25
Kobashi, T. et al., 2020: On the potential of “Photovoltaics + Electric vehicles” for deep decarbonization 26 of Kyoto’s power systems: Techno-economic-social considerations. Appl. Energy, 275, 115419, 27 doi:10.1016/j.apenergy.2020.115419. 28
Kobashi, T., P. Jittrapirom, T. Yoshida, Y. Hirano, and Y. Yamagata, 2021: SolarEV City concept: 29 Building the next urban power and mobility systems. Environ. Res. Lett., 16(2), 024042, 30 doi:10.1088/1748-9326/abd430. 31
Kona, A., P. Bertoldi, F. Monforti-Ferrario, S. Rivas, and J. F. Dallemand, 2018: Covenant of mayors 32 signatories leading the way towards 1.5 degree global warming pathway. Sustain. Cities Soc., 41, 33 568–575, doi:10.1016/j.scs.2018.05.017. 34
Koohsari, M. J. et al., 2016: Street network measures and adults’ walking for transport: Application of 35 space syntax. Heal. Place, 38, 89–95, doi:10.1016/j.healthplace.2015.12.009. 36
Koop, S. H. A., and C. J. van Leeuwen, 2015: Assessment of the Sustainability of Water Resources 37 Management: A Critical Review of the City Blueprint Approach. Water Resour. Manag., 29(15), 38 5649–5670, doi:10.1007/s11269-015-1139-z. 39
ACCEPTED VERSION
SUBJECT TO FIN
AL EDITS
Final Government Distribution Chapter 8 IPCC AR6 WGIII
Do Not Cite, Quote or Distribute 8-128 Total pages: 157
Kościelniak, H., and A. Górka, 2016: Green Cities PPP as a Method of Financing Sustainable Urban 1 Development. Transp. Res. Procedia, 16, 227–235, doi:10.1016/j.trpro.2016.11.022. 2
Kourtit, K., P. Nijkamp, and H. Scholten, 2015: The Future of the New Urban World. Int. Plan. Stud., 3 20(1–2), 4–20, doi:10.1080/13563475.2014.938716. 4
Kovac, A., S. Mcdaniel, A. Kona, P. Bertoldi, and C. Chavara, 2020: Aggregating Cities’ GHG 5 Mitigation Targets with Modeled Emissions Scenarios. World Resources Institute (WRI), 6 Washington, DC, 16 pp. https://files.wri.org/s3fs-public/aggregating-cities-ghg-mitigation-7 targets.pdf. 8
Krayenhoff, E. S., M. Moustaoui, A. M. Broadbent, V. Gupta, and M. Georgescu, 2018: Diurnal 9 interaction between urban expansion, climate change and adaptation in US cities. Nat. Clim. 10 Chang., 8(12), 1097–1103, doi:10.1038/s41558-018-0320-9. 11
Kriegler, E. et al., 2017: Fossil-fueled development (SSP5): An energy and resource intensive scenario 12 for the 21st century. Glob. Environ. Chang., 42, 297–315, doi:10.1016/j.gloenvcha.2016.05.015. 13
Krog, L., 2019: How municipalities act under the new paradigm for energy planning. Sustain. Cities 14 Soc., 47, 101511, doi:10.1016/j.scs.2019.101511. 15
Kshetri, N., and J. Voas, 2018: Blockchain in Developing Countries. IT Prof., 20(2), 11–14, 16 doi:10.1109/MITP.2018.021921645. 17
Kuramochi, T. et al., 2020: Beyond national climate action: the impact of region, city, and business 18 commitments on global greenhouse gas emissions. Clim. Policy, 20(3), 275–291, 19 doi:10.1080/14693062.2020.1740150. 20
Kutty, A. A., G. M. Abdella, M. Kucukvar, N. C. Onat, and M. Bulu, 2020: A system thinking approach 21 for harmonizing smart and sustainable city initiatives with United Nations sustainable 22 development goals. Sustain. Dev., 28(5), 1347–1365, doi:10.1002/sd.2088. 23
Kwan, S. C., and J. H. Hashim, 2016: A review on co-benefits of mass public transportation in climate 24 change mitigation. Sustain. Cities Soc., 22, 11–18, doi:10.1016/j.scs.2016.01.004. 25
Laeremans, M. et al., 2018: Black Carbon Reduces the Beneficial Effect of Physical Activity on Lung 26 Function. Med. Sci. Sport. Exerc., 50(9), 1875–1881, doi:10.1249/MSS.0000000000001632. 27
Lall, S., M. Lebrand, H. Park, D. Sturm, and A. J. Venables, 2021: Pancakes to Pyramids: City Form 28 to Promote Sustainable Growth. International Bank for Reconstruction and Development (IBRD) 29 / The World Bank, Washington D.C, 154 pp. 30 https://www.worldbank.org/en/topic/urbandevelopment/publication/pancakes-to-pyramids. 31
Lam, K. L., S. J. Kenway, and P. A. Lant, 2017: Energy use for water provision in cities. J. Clean. 32 Prod., 143, 699–709, doi:10.1016/j.jclepro.2016.12.056. 33
Lam, K. L., P. A. Lant, and S. J. Kenway, 2018: Energy implications of the millennium drought on 34 urban water cycles in Southeast Australian cities. Water Supply, 18(1), 214–221, 35 doi:10.2166/ws.2017.110. 36
Lamb, B. K. et al., 2016: Direct and Indirect Measurements and Modeling of Methane Emissions in 37 Indianapolis, Indiana. Environ. Sci. Technol., 50(16), 8910–8917, doi:10.1021/acs.est.6b01198. 38
Lamb, M. R., S. Kandula, and J. Shaman, 2021: Differential COVID‐19 case positivity in New York 39 City neighborhoods: Socioeconomic factors and mobility. Influenza Other Respi. Viruses, 15(2), 40
ACCEPTED VERSION
SUBJECT TO FIN
AL EDITS
Final Government Distribution Chapter 8 IPCC AR6 WGIII
Do Not Cite, Quote or Distribute 8-129 Total pages: 157
209–217, doi:10.1111/irv.12816. 1
Lamb, W. F., M. W. Callaghan, F. Creutzig, R. Khosla, and J. C. Minx, 2018: The literature landscape 2 on 1.5°C climate change and cities. Curr. Opin. Environ. Sustain., 30, 26–34, 3 doi:10.1016/j.cosust.2018.02.008. 4
Lamb, W. F., F. Creutzig, M. W. Callaghan, and J. C. Minx, 2019: Learning about urban climate 5 solutions from case studies. Nat. Clim. Chang., 9(4), 279–287, doi:10.1038/s41558-019-0440-x. 6
Lammers, I., and T. Hoppe, 2019: Watt rules? Assessing decision-making practices on smart energy 7 systems in Dutch city districts. Energy Res. Soc. Sci., 47, 233–246, 8 doi:10.1016/j.erss.2018.10.003. 9
Lamson-Hall, P., S. Angel, D. DeGroot, R. Martin, and T. Tafesse, 2019: A new plan for African cities: 10 The Ethiopia Urban Expansion Initiative. Urban Stud., 56(6), 1234–1249, 11 doi:10.1177/0042098018757601. 12
Landauer, M., S. Juhola, and J. Klein, 2019: The role of scale in integrating climate change adaptation 13 and mitigation in cities. J. Environ. Plan. Manag., 62(5), 741–765, 14 doi:10.1080/09640568.2018.1430022. 15
Laramee, J., S. Tilmans, and J. Davis, 2018: Costs and benefits of biogas recovery from communal 16 anaerobic digesters treating domestic wastewater: Evidence from peri-urban Zambia. J. Environ. 17 Manage., 210, 23–35, doi:10.1016/j.jenvman.2017.12.064. 18
Lauvaux, T. et al., 2016: High-resolution atmospheric inversion of urban CO2 emissions during the 19 dormant season of the Indianapolis flux experiment (INFLUX). J. Geophys. Res., 121(10), 5213–20 5236, doi:10.1002/2015JD024473. 21
Lauvaux, T. et al., 2020: Policy-Relevant Assessment of Urban CO2 Emissions. Environ. Sci. Technol., 22 54(16), 10237–10245, doi:10.1021/acs.est.0c00343. 23
Lawhon, M., D. Nilsson, J. Silver, H. Ernstson, and S. Lwasa, 2018: Thinking through heterogeneous 24 infrastructure configurations. Urban Stud., 55(4), 720–732, doi:10.1177/0042098017720149. 25
Layne, S. P., J. M. Hyman, D. M. Morens, and J. K. Taubenberger, 2020: New coronavirus outbreak: 26 Framing questions for pandemic prevention. Sci. Transl. Med., 12(534), eabb1469, 27 doi:10.1126/scitranslmed.abb1469. 28
Le Quéré, C. et al., 2020: Temporary reduction in daily global CO2 emissions during the COVID-19 29 forced confinement. Nat. Clim. Chang., 10(7), 647–653, doi:10.1038/s41558-020-0797-x. 30
Le Quéré, C. et al., 2021: Fossil CO2 emissions in the post-COVID-19 era. Nat. Clim. Chang., 11(3), 31 197–199, doi:10.1038/s41558-021-01001-0. 32
Lechtenböhmer, S., L. J. Nilsson, M. Åhman, and C. Schneider, 2016: Decarbonising the energy 33 intensive basic materials industry through electrification – Implications for future EU electricity 34 demand. Energy, 115, 1623–1631, doi:10.1016/j.energy.2016.07.110. 35
Lecompte, M. C., and B. S. Juan Pablo, 2017: Transport systems and their impact con gender equity. 36 World Conference on Transport Research, Vol. 25 of, Shanghai, Elsevier B.V., 4245–4257. 37
Lee, C. M., and P. Erickson, 2017: How does local economic development in cities affect global GHG 38 emissions? Sustain. Cities Soc., 35, 626–636, doi:10.1016/j.scs.2017.08.027. 39
ACCEPTED VERSION
SUBJECT TO FIN
AL EDITS
Final Government Distribution Chapter 8 IPCC AR6 WGIII
Do Not Cite, Quote or Distribute 8-130 Total pages: 157
Lee, J. H., and S. Lim, 2018: The selection of compact city policy instruments and their effects on 1 energy consumption and greenhouse gas emissions in the transportation sector: The case of South 2 Korea. Sustain. Cities Soc., 37, 116–124, doi:10.1016/j.scs.2017.11.006. 3
Lee, S., and B. Lee, 2020: Comparing the impacts of local land use and urban spatial structure on 4 household VMT and GHG emissions. J. Transp. Geogr., 84, 102694, 5 doi:10.1016/j.jtrangeo.2020.102694. 6
Lee, T., and M. Painter, 2015: Comprehensive local climate policy: The role of urban governance. 7 Urban Clim., 14, 566–577, doi:10.1016/j.uclim.2015.09.003. 8
Lee, V. J. et al., 2020: Epidemic preparedness in urban settings: new challenges and opportunities. 9 Lancet Infect. Dis., 20(5), 527–529, doi:10.1016/S1473-3099(20)30249-8. 10
Lemoine-Rodriguez, R., L. Inostroza, and H. Zepp, 2020: Urban form datasets of 194 cities delineated 11 based on the contiguous urban fabric for 1990 and 2015. Data Br., 33, 106369, 12 doi:10.1016/J.DIB.2020.106369. 13
Lenzen, M. et al., 2017: The Global MRIO Lab – charting the world economy. Econ. Syst. Res., 29(2), 14 158–186, doi:10.1080/09535314.2017.1301887. 15
Levesque, A., R. C. Pietzcker, and G. Luderer, 2019: Halving energy demand from buildings: The 16 impact of low consumption practices. Technol. Forecast. Soc. Change, 146, 253–266, 17 doi:10.1016/j.techfore.2019.04.025. 18
Li, B. et al., 2016: Spatio-temporal assessment of urbanization impacts on ecosystem services: Case 19 study of Nanjing City, China. Ecol. Indic., 71, 416–427, doi:10.1016/j.ecolind.2016.07.017. 20
Li, R. et al., 2019a: Crowded urban traffic: co-evolution among land development, population, roads 21 and vehicle ownership. Nonlinear Dyn., 95(4), 2783–2795, doi:10.1007/S11071-018-4722-Z. 22
Li, X., Y. Zhou, J. Eom, S. Yu, and G. R. Asrar, 2019b: Projecting Global Urban Area Growth Through 23 2100 Based on Historical Time Series Data and Future Shared Socioeconomic Pathways. Earth’s 24 Futur., 7(4), 351–362, doi:10.1029/2019EF001152. 25
Li, X. X., Y. Zhou, G. R. Asrar, M. Imhoff, and X. X. Li, 2017: The surface urban heat island response 26 to urban expansion: A panel analysis for the conterminous United States. Sci. Total Environ., 605–27 606, 426–435, doi:10.1016/j.scitotenv.2017.06.229. 28
Li, Y., and X. Liu, 2018: How did urban polycentricity and dispersion affect economic productivity? A 29 case study of 306 Chinese cities. Landsc. Urban Plan., 173, 51–59, 30 doi:10.1016/j.landurbplan.2018.01.007. 31
Lin, B. B. et al., 2021: Integrating solutions to adapt cities for climate change. Lancet Planet. Heal., 32 5(7), e479–e486, doi:10.1016/S2542-5196(21)00135-2. 33
Lin, J., Y. Hu, S. Cui, J. Kang, and A. Ramaswami, 2015: Tracking urban carbon footprints from 34 production and consumption perspectives. Environ. Res. Lett., 10(5), 054001, doi:10.1088/1748-35 9326/10/5/054001. 36
Lin, J. et al., 2018: Scenario analysis of urban GHG peak and mitigation co-benefits: A case study of 37 Xiamen City, China. J. Clean. Prod., 171, 972–983, doi:10.1016/j.jclepro.2017.10.040. 38
Linton, S., A. Clarke, and L. Tozer, 2021: Strategies and governance for implementing deep 39 decarbonization plans at the local level. Sustainability, 13(1), 1–22, doi:10.3390/su13010154. 40
ACCEPTED VERSION
SUBJECT TO FIN
AL EDITS
Final Government Distribution Chapter 8 IPCC AR6 WGIII
Do Not Cite, Quote or Distribute 8-131 Total pages: 157
Linzner, R., and U. Lange, 2013: Role and size of informal sector in waste management – a review. 1 Proc. Inst. Civ. Eng. - Waste Resour. Manag., 166(2), 69–83, doi:10.1680/warm.12.00012. 2
Liu, F. et al., 2019: Chinese cropland losses due to urban expansion in the past four decades. Sci. Total 3 Environ., 650(1), 847–857, doi:10.1016/j.scitotenv.2018.09.091. 4
Liu, J., and D. Niyogi, 2019: Meta-analysis of urbanization impact on rainfall modification. Sci. Rep., 5 9, 7301, doi:10.1038/s41598-019-42494-2. 6
Liu, M. et al., 2017: Estimating health co-benefits of greenhouse gas reduction strategies with a 7 simplified energy balance based model: The Suzhou City case. J. Clean. Prod., 142, 3332–3342, 8 doi:10.1016/j.jclepro.2016.10.137. 9
Liu, W. H. et al., 2006: Woody debris contribution to the carbon budget of selectively logged and 10 maturing mid-latitude forests. Oecologia, 148, 108–117, doi:10.1007/s00442-006-0356-9. 11
Liu, X., B. Derudder, F. Witlox, and M. Hoyler, 2014: Cities As Networks within Networks of Cities: 12 The Evolution of the City/Firm-Duality in the World City Network, 2000-2010. Tijdschr. voor 13 Econ. en Soc. Geogr., 105(4), 465–482, doi:10.1111/tesg.12097. 14
Liu, X. et al., 2020a: High-spatiotemporal-resolution mapping of global urban change from 1985 to 15 2015. Nat. Sustain., 3(7), 564–570, doi:10.1038/s41893-020-0521-x. 16
Liu, Y., H. Guo, C. Sun, and W.-S. Chang, 2016a: Assessing Cross Laminated Timber (CLT) as an 17 Alternative Material for Mid-Rise Residential Buildings in Cold Regions in China—A Life-Cycle 18 Assessment Approach. Sustainability, 8(10), 1047, doi:10.3390/su8101047. 19
Liu, Z., C. He, and J. Wu, 2016b: The Relationship between Habitat Loss and Fragmentation during 20 Urbanization: An Empirical Evaluation from 16 World Cities. PLoS One, 11(4), e0154613, 21 doi:10.1371/JOURNAL.PONE.0154613. 22
Liu, Z. et al., 2020b: Near-real-time monitoring of global CO2 emissions reveals the effects of the 23 COVID-19 pandemic. Nat. Commun., 11, 5172, doi:10.1038/s41467-020-18922-7. 24
Lohrey, S., and F. Creutzig, 2016: A ‘sustainability window’ of urban form. Transp. Res. Part D Transp. 25 Environ., 45, 96–111, doi:10.1016/j.trd.2015.09.004. 26
Lombardi, M., E. Laiola, C. Tricase, and R. Rana, 2017: Assessing the urban carbon footprint: An 27 overview. Environ. Impact Assess. Rev., 66, 43–52, doi:10.1016/j.eiar.2017.06.005. 28
Lu, C., and W. Li, 2019: A comprehensive city-level GHGs inventory accounting quantitative 29 estimation with an empirical case of Baoding. Sci. Total Environ., 651, 601–613, 30 doi:10.1016/j.scitotenv.2018.09.223. 31
Lund, H. et al., 2014: 4th Generation District Heating (4GDH): Integrating smart thermal grids into 32 future sustainable energy systems. Energy, 68, 1–11, doi:10.1016/J.ENERGY.2014.02.089. 33
Lund, H., P. A. Østergaard, D. Connolly, and B. V. Mathiesen, 2017: Smart energy and smart energy 34 systems. Int. J. Sustain. Energy Plan. Manag., 11, 3–14, doi:10.1016/j.energy.2017.05.123. 35
Lund, H., N. Duic, P. A. Østergaard, and B. V. Mathiesen, 2018: Future district heating systems and 36 technologies: On the role of smart energy systems and 4th generation district heating. Energy, 37 165, 614–619, doi:10.1016/j.energy.2018.09.115. 38
Lund, P. D., J. Mikkola, and J. Ypyä, 2015: Smart energy system design for large clean power schemes 39
ACCEPTED VERSION
SUBJECT TO FIN
AL EDITS
Final Government Distribution Chapter 8 IPCC AR6 WGIII
Do Not Cite, Quote or Distribute 8-132 Total pages: 157
in urban areas. J. Clean. Prod., 103, 437–445, doi:10.1016/j.jclepro.2014.06.005. 1
Luqman, M., P. Rayner, and K. R. Gurney, 2021: On the impact of Urbanisation on CO2 Emissions. 2 EarthArXiv, doi:10.31223/X5D62Z. . 3
Lwasa, S., 2017: Options for reduction of greenhouse gas emissions in the low-emitting city and 4 metropolitan region of Kampala. Carbon Manag., 8(3), 263–276, 5 doi:10.1080/17583004.2017.1330592. 6
Lwasa, S. et al., 2015: A meta-analysis of urban and peri-urban agriculture and forestry in mediating 7 climate change. Curr. Opin. Environ. Sustain., 13, 68–73, doi:10.1016/j.cosust.2015.02.003. 8
Lwasa, S., K. Buyana, P. Kasaija, and J. Mutyaba, 2018: Scenarios for adaptation and mitigation in 9 urban Africa under 1.5°C global warming. Curr. Opin. Environ. Sustain., 30, 52–58, 10 doi:10.1016/j.cosust.2018.02.012. 11
Lynch, K., 1981: A Theory of Good City Form. 1st ed. MIT Press, Cambridge, MA, 532 pp. 12
Ma, J., Z. Liu, and Y. Chai, 2015: The impact of urban form on CO2 emission from work and non-work 13 trips: The case of Beijing, China. Habitat Int., 47, 1–10, doi:10.1016/j.habitatint.2014.12.007. 14
Ma, Y., K. Rong, D. Mangalagiu, T. F. Thornton, and D. Zhu, 2018: Co-evolution between urban 15 sustainability and business ecosystem innovation: Evidence from the sharing mobility sector in 16 Shanghai. J. Clean. Prod., 188, 942–953, doi:10.1016/j.jclepro.2018.03.323. 17
Maes, M. J. A. A., K. E. Jones, M. B. Toledano, and B. Milligan, 2019: Mapping synergies and trade-18 offs between urban ecosystems and the sustainable development goals. Environ. Sci. Policy, 93, 19 181–188, doi:10.1016/j.envsci.2018.12.010. 20
Magueta, D., M. Madaleno, M. Ferreira Dias, and M. Meireles, 2018: New cars and emissions: Effects 21 of policies, macroeconomic impacts and cities characteristics in Portugal. J. Clean. Prod., 181, 22 178–191, doi:10.1016/j.jclepro.2017.11.243. 23
Mahtta, R., A. Mahendra, and K. C. Seto, 2019: Building up or spreading out? Typologies of urban 24 growth across 478 cities of 1 million+. Environ. Res. Lett., 14(12), 124077, doi:10.1088/1748-25 9326/ab59bf. 26
Maier, S., 2016: Smart energy systems for smart city districts: case study Reininghaus District. Energy. 27 Sustain. Soc., 6, 23, doi:10.1186/s13705-016-0085-9. 28
Manga, M., J. Bartram, and B. E. Evans, 2020: Economic cost analysis of low-cost sanitation 29 technology options in informal settlement areas (case study: Soweto, Johannesburg). Int. J. Hyg. 30 Environ. Health, 223(1), 289–298, doi:10.1016/j.ijheh.2019.06.012. 31
Mantey, J., and E. K. Sakyi, 2019: A Study of Energy Related Greenhouse Gas Emissions of High 32 Income Urban Residents in the city of Accra, Ghana. OIDA Int. J. Sustain. Dev., 12(2), 41–60. 33
Manuamorn, O. P., R. Biesbroek, and V. Cebotari, 2020: What makes internationally-financed climate 34 change adaptation projects focus on local communities? A configurational analysis of 30 35 Adaptation Fund projects. Glob. Environ. Chang., 61, 102035, 36 doi:10.1016/j.gloenvcha.2020.102035. 37
Marino, A. L., G. de L. D. Chaves, and J. L. dos Santos Junior, 2018: Do Brazilian municipalities have 38 the technical capacity to implement solid waste management at the local level? J. Clean. Prod., 39 188, 378–386, doi:10.1016/j.jclepro.2018.03.311. 40
ACCEPTED VERSION
SUBJECT TO FIN
AL EDITS
Final Government Distribution Chapter 8 IPCC AR6 WGIII
Do Not Cite, Quote or Distribute 8-133 Total pages: 157
Maroko, A. R., D. Nash, and B. T. Pavilonis, 2020: COVID-19 and Inequity: a Comparative Spatial 1 Analysis of New York City and Chicago Hot Spots. J. Urban Heal., 97(4), 461–470, 2 doi:10.1007/s11524-020-00468-0. 3
Marshall, J. U., 1989: The Structure of Urban Systems. University of Toronto Press, Toronto, 394 pp. 4
Martin, A. R., M. Doraisami, and S. C. Thomas, 2018: Global patterns in wood carbon concentration 5 across the world’s trees and forests. Nat. Geosci., 11(12), 915–920, doi:10.1038/s41561-018-6 0246-x. 7
Martínez, J., J. Martí-Herrero, S. Villacís, A. J. Riofrio, and D. Vaca, 2017: Analysis of energy, CO2 8 emissions and economy of the technological migration for clean cooking in Ecuador. Energy 9 Policy, 107, 182–187, doi:10.1016/j.enpol.2017.04.033. 10
Masoumi, H. E., 2019: A discrete choice analysis of transport mode choice causality and perceived 11 barriers of sustainable mobility in the MENA region. Transp. Policy, 79, 37–53, 12 doi:10.1016/j.tranpol.2019.04.005. 13
Masseroni, D., and A. Cislaghi, 2016: Green roof benefits for reducing flood risk at the catchment scale. 14 Environ. Earth Sci., 75(7), 579, doi:10.1007/s12665-016-5377-z. 15
Masucci, A. P., K. Stanilov, and M. Batty, 2013: Limited Urban Growth: London’s Street Network 16 Dynamics since the 18th Century. PLoS One, 8(8), e69469, 17 doi:10.1371/JOURNAL.PONE.0069469. 18
Mathiesen, B. V. et al., 2015: Smart Energy Systems for coherent 100% renewable energy and transport 19 solutions. Appl. Energy, 145, 139–154, doi:10.1016/j.apenergy.2015.01.075. 20
Matsuda, T. et al., 2018: Monitoring environmental burden reduction from household waste prevention. 21 Waste Manag., 71, 2–9, doi:10.1016/j.wasman.2017.10.014. 22
Matsuhashi, K., and T. Ariga, 2016: Estimation of passenger car CO2 emissions with urban population 23 density scenarios for low carbon transportation in Japan. IATSS Res., 39(2), 117–120, 24 doi:10.1016/j.iatssr.2016.01.002. 25
Matsuo, K., and T. Tanaka, 2019: Analysis of spatial and temporal distribution patterns of temperatures 26 in urban and rural areas: Making urban environmental climate maps for supporting urban 27 environmental planning and management in Hiroshima. Sustain. Cities Soc., 47, 101419, 28 doi:10.1016/j.scs.2019.01.004. 29
Matthews, E. R., J. P. Schmit, and J. P. Campbell, 2016: Climbing vines and forest edges affect tree 30 growth and mortality in temperate forests of the U.S. Mid-Atlantic States. For. Ecol. Manage., 31 374, 166–173, doi:10.1016/j.foreco.2016.05.005. 32
Matthews, J. B. R. et al., 2018: Annex I: Glossary. In: Global warming of 1.5°C. An IPCC Special 33 Report on the impacts of global warming of 1.5°C above pre-industrial levels and related global 34 greenhouse gas emission pathways, in the context of strengthening the global response to the 35 threat of climate change, [Masson-Delmotte, V. et al., (eds.)], Intergovernmental Panel on Climate 36 Change (IPCC), Geneva, pp. 541–562. 37
McCarney, P., 2019: Cities leading: The pivotal role of local governance and planning for sustainable 38 development. In: The Routledge Companion to Environmental Planning [Davoudi, S., R. Cowell, 39 I. White, and H. Blanco, (eds.)], Routledge, London, pp. 200–208. 40
McCarney, P., H. Blanco, J. Carmin, and M. Colley, 2011: Cities and Climate Change: The challenges 41
ACCEPTED VERSION
SUBJECT TO FIN
AL EDITS
Final Government Distribution Chapter 8 IPCC AR6 WGIII
Do Not Cite, Quote or Distribute 8-134 Total pages: 157
for governance. In: Climate Change and Cities: First Assessment Report of the Urban Climate 1 Change Research Network [Rosenzweig, C., W.D. Solecki, S.A. Hammer, and S. Mehrotra, 2 (eds.)], Cambridge University Press, Cambridge, pp. 249–269. 3
McDonald, R. et al., 2016: Planting healthy air: A global analysis of the role of urban trees in 4 addressing particulate matter pollution and extreme heat. The Nature Conservancy (TNC), 5 Arlington, VA, 136 pp. https://thought-leadership-6 production.s3.amazonaws.com/2016/10/28/17/17/50/0615788b-8eaf-4b4f-a02a-7 8819c68278ef/20160825_PHA_Report_FINAL.pdf. 8
McDonald, R. I., B. Güneralp, C.-W. W. Huang, K. C. Seto, and M. You, 2018: Conservation priorities 9 to protect vertebrate endemics from global urban expansion. Biol. Conserv., 224, 290–299, 10 doi:10.1016/j.biocon.2018.06.010. 11
McDonald, R. I. et al., 2020: Research gaps in knowledge of the impact of urban growth on biodiversity. 12 Nat. Sustain., 3, 16–24, doi:10.1038/s41893-019-0436-6. 13
Meha, D., A. Pfeifer, N. Duić, and H. Lund, 2020: Increasing the integration of variable renewable 14 energy in coal-based energy system using power to heat technologies: The case of Kosovo. 15 Energy, 212, 118762, doi:10.1016/j.energy.2020.118762. 16
Mehta, L. et al., 2019: Climate change and uncertainty from ‘above’’ and “below’’: perspectives from 17 India.”’ Reg. Environ. Chang., 19(6), 1533–1547, doi:10.1007/s10113-019-01479-7. 18
Melica, G. et al., 2018: Multilevel governance of sustainable energy policies: The role of regions and 19 provinces to support the participation of small local authorities in the Covenant of Mayors. 20 Sustain. Cities Soc., 39, 729–739, doi:10.1016/j.scs.2018.01.013. 21
Mell, I. C., J. Henneberry, S. Hehl-Lange, and B. Keskin, 2013: Promoting urban greening: Valuing the 22 development of green infrastructure investments in the urban core of Manchester, UK. Urban For. 23 Urban Green., 12(3), 296–306, doi:10.1016/j.ufug.2013.04.006. 24
Mell, I. C., J. Henneberry, S. Hehl-Lange, and B. Keskin, 2016: To green or not to green: Establishing 25 the economic value of green infrastructure investments in The Wicker, Sheffield. Urban For. 26 Urban Green., 18, 257–267, doi:10.1016/j.ufug.2016.06.015. 27
Meschede, H., 2019: Increased utilisation of renewable energies through demand response in the water 28 supply sector – A case study. Energy, 175, 810–817, doi:10.1016/J.ENERGY.2019.03.137. 29
Mey, F., and J. Hicks, 2019: Community Owned Renewable Energy: Enabling the Transition Towards 30 Renewable Energy? In: Decarbonising the Built Environment: Charting the Transition [Newton, 31 P., D. Prasad, A. Sproul, and S. White, (eds.)], Palgrave Macmillan, Singapore, pp. 65–82. 32
Mguni, P., L. Herslund, and M. B. Jensen, 2016: Sustainable urban drainage systems: examining the 33 potential for green infrastructure-based stormwater management for Sub-Saharan cities. Nat. 34 Hazards, 82(S2), 241–257, doi:10.1007/s11069-016-2309-x. 35
Mi, Z. et al., 2019: Cities: The core of climate change mitigation. J. Clean. Prod., 207, 582–589, 36 doi:10.1016/j.jclepro.2018.10.034. 37
Miao, L., 2017: Examining the impact factors of urban residential energy consumption and CO2 38 emissions in China – Evidence from city-level data. Ecol. Indic., 73, 29–37, 39 doi:10.1016/j.ecolind.2016.09.031. 40
Milutinović, B., G. Stefanović, S. Milutinović, and Ž. Ćojbašić, 2016: Application of fuzzy logic for 41
ACCEPTED VERSION
SUBJECT TO FIN
AL EDITS
Final Government Distribution Chapter 8 IPCC AR6 WGIII
Do Not Cite, Quote or Distribute 8-135 Total pages: 157
evaluation of the level of social acceptance of waste treatment. Clean Technol. Environ. Policy, 1 18(6), 1863–1875, doi:10.1007/s10098-016-1211-2. 2
Mitchell, L. E. et al., 2018: Long-term urban carbon dioxide observations reveal spatial and temporal 3 dynamics related to urban characteristics and growth. Proc. Natl. Acad. Sci., 115(12), 2912–2917, 4 doi:10.1073/pnas.1702393115. 5
Moglia, M. et al., 2018: Urban transformation stories for the 21st century: Insights from strategic 6 conversations. Glob. Environ. Chang., 50, 222–237, doi:10.1016/j.gloenvcha.2018.04.009. 7
Mohajeri, N., and A. Gudmundsson, 2014: The Evolution and Complexity of Urban Street Networks. 8 Geogr. Anal., 46(4), 345–367, doi:10.1111/GEAN.12061. 9
Mohammed, M. U., N. I. Hassan, and M. M. Badamasi, 2019: In search of missing links: urbanisation 10 and climate change in Kano Metropolis, Nigeria. Int. J. Urban Sustain. Dev., 11(3), 309–318, 11 doi:10.1080/19463138.2019.1603154. 12
Möller, B., E. Wiechers, U. Persson, L. Grundahl, and D. Connolly, 2018: Heat Roadmap Europe: 13 Identifying local heat demand and supply areas with a European thermal atlas. Energy, 158, 281–14 292, doi:10.1016/j.energy.2018.06.025. 15
Möller, B. et al., 2019: Heat Roadmap Europe: Towards EU-Wide, local heat supply strategies. Energy, 16 177, 554–564, doi:10.1016/J.ENERGY.2019.04.098. 17
Moncada, S., H. Bambrick, and M. Briguglio, 2019: The health impacts of a community biogas facility 18 in an informal Urban settlement: does training matter? J. Dev. Eff., 11(2), 189–202, 19 doi:10.1080/19439342.2019.1638434. 20
Monforti-Ferrario, F., A. Kona, E. Peduzzi, D. Pernigotti, and E. Pisoni, 2018: The impact on air quality 21 of energy saving measures in the major cities signatories of the Covenant of Mayors initiative. 22 Environ. Int., 118, 222–234, doi:10.1016/j.envint.2018.06.001. 23
Mora, C. et al., 2017: Global risk of deadly heat. Nat. Clim. Chang., 7(7), 501–506, 24 doi:10.1038/nclimate3322. 25
Moran, D. et al., 2018: Carbon footprints of 13 000 cities. Environ. Res. Lett., 13(6), 064041, 26 doi:10.1088/1748-9326/aac72a. 27
Moreno, C., Z. Allam, D. Chabaud, C. Gall, and F. Pratlong, 2021: Introducing the “15-Minute City”: 28 Sustainability, Resilience and Place Identity in Future Post-Pandemic Cities. Smart Cities, 4(1), 29 93–111, doi:10.3390/smartcities4010006. 30
Moretti, M. et al., 2017: A systematic review of environmental and economic impacts of smart grids. 31 Renew. Sustain. Energy Rev., 68, 888–898, doi:10.1016/j.rser.2016.03.039. 32
Moser, S. C., J. A. Ekstrom, J. Kim, and S. Heitsch, 2019: Adaptation finance archetypes: local 33 governments’ persistent challenges of funding adaptation to climate change and ways to overcome 34 them. Ecol. Soc., 24(2), art28, doi:10.5751/ES-10980-240228. 35
Mrówczyńska, M., M. Skiba, A. Bazan-Krzywoszańska, D. Bazuń, and M. Kwiatkowski, 2018: Social 36 and Infrastructural Conditioning of Lowering Energy Costs and Improving the Energy Efficiency 37 of Buildings in the Context of the Local Energy Policy. Energies, 11(9), 2302, 38 doi:10.3390/en11092302. 39
Mrówczyńska, M. et al., 2021: Scenarios as a tool supporting decisions in urban energy policy: The 40
ACCEPTED VERSION
SUBJECT TO FIN
AL EDITS
Final Government Distribution Chapter 8 IPCC AR6 WGIII
Do Not Cite, Quote or Distribute 8-136 Total pages: 157
analysis using fuzzy logic, multi-criteria analysis and GIS tools. Renew. Sustain. Energy Rev., 1 137, 110598, doi:10.1016/j.rser.2020.110598. 2
Mueller, K. L. et al., 2021: An emerging GHG estimation approach can help cities achieve their climate 3 and sustainability goals. Environ. Res. Lett., 16(8), 084003, doi:10.1088/1748-9326/ac0f25. 4
Mueller, N. et al., 2020: Changing the urban design of cities for health: The superblock model. Environ. 5 Int., 134, 105132, doi:10.1016/j.envint.2019.105132. 6
Müller, D. B. et al., 2013: Carbon Emissions of Infrastructure Development. Environ. Sci. Technol., 7 47(20), 11739–11746, doi:10.1021/es402618m. 8
Mulligan, J. et al., 2020: Hybrid infrastructures, hybrid governance: New evidence from Nairobi 9 (Kenya) on green-blue-grey infrastructure in informal settlements. Anthropocene, 29, 100227, 10 doi:10.1016/j.ancene.2019.100227. 11
Munich RE, 2021: Record hurricane season and major wildfires – The natural disaster figures for 2020. 12 https://www.munichre.com/en/company/media-relations/media-information-and-corporate-13 news/media-information/2021/2020-natural-disasters-balance.html. 14
Nagendra, H., X. Bai, E. S. Brondizio, and S. Lwasa, 2018: The urban south and the predicament of 15 global sustainability. Nat. Sustain., 1(7), 341–349, doi:10.1038/s41893-018-0101-5. 16
Narayana, T., 2009: Municipal solid waste management in India: From waste disposal to recovery of 17 resources? Waste Manag., 29(3), 1163–1166, doi:10.1016/j.wasman.2008.06.038. 18
Nasarre-Aznar, S., 2018: Collaborative housing and blockchain. Administration, 66(2), 59–82, 19 doi:10.2478/admin-2018-0018. 20
Naumann, S., T. Kaphengst, K. McFarland, and J. Stadler, 2014: Nature-based approaches for climate 21 change mitigation and adaptation: The challenges of climate change - partnering with nature. 22 German Federal Agency for Nature Conservation (BfN), Ecologic Institute, Bonn, Germany, 22 23 pp. https://www.ecologic.eu/11240. 24
NCE, 2018: Unlocking the Inclusive Growth Story of the 21st Century: Accelerating Climate Action in 25 Urgent Times - Key Findings & Executive Summary. The Global Commission on the Economy 26 and Climate, Washington, DC, 16 pp. https://newclimateeconomy.report/2018/wp-27 content/uploads/sites/6/2018/09/NCE_2018_ExecutiveSummary_FINAL.pdf. 28
Negreiros, P. et al., 2021: The State of Cities Climate Finance Part 1: The Landscape of Urban Climate 29 Finance. Climate Policy Initiative (CPI), San Francisco, 82 pp. 30
Nero, B., D. Callo-Concha, and M. Denich, 2018: Structure, Diversity, and Carbon Stocks of the Tree 31 Community of Kumasi, Ghana. Forests, 9(9), 519, doi:10.3390/f9090519. 32
Nero, B., D. Callo-Concha, and M. Denich, 2019: Increasing Urbanisation and the Role of Green Spaces 33 in Urban Climate Resilience in Africa. In: Environmental Change and African Societies 34 [Haltermann, I. and J. Tischler, (eds.)], Vol. 5 of Climate and Culture, Brill, pp. 265–296. 35
Neuvonen, A., and P. Ache, 2017: Metropolitan vision making – using backcasting as a strategic 36 learning process to shape metropolitan futures. Futures, 86, 73–83, 37 doi:10.1016/j.futures.2016.10.003. 38
NewClimate Institute, and Data-Driven EnviroLab, 2020: Navigating the nuances of net-zero targets. 39 [Day, T. et al., (eds.)]. NewClimate Institute & Data-Driven EnviroLab, Cologne, 74 pp. 40
ACCEPTED VERSION
SUBJECT TO FIN
AL EDITS
Final Government Distribution Chapter 8 IPCC AR6 WGIII
Do Not Cite, Quote or Distribute 8-137 Total pages: 157
https://newclimate.org/wp-1 content/uploads/2020/10/NewClimate_NetZeroReport_October2020.pdf. 2
NewClimate Institute, Data-Driven Lab, German Development Institute/Deutsches Institut für 3 Entwicklungspolitik (DIE), and Blavatnik School of Government University of Oxford, 2019: 4 Global climate action from cities, regions and businesses: Impact of individual actors and 5 cooperative initiatives on global and national emissions. 2nd ed. [Kuramochi, T. et al., (eds.)]. 6 NewClimate Institute, Data-Driven Lab, PBL, German Development Institute/Deutsches Institut 7 für Entwicklungspolitik (DIE), Blavatnik School of Government, University of Oxford, 93 pp. 8 https://newclimate.org/wp-content/uploads/2019/09/Report-Global-Climate-Action-from-Cities-9 Regions-and-Businesses_2019.pdf. 10
Newman AO, P., 2020: COVID, CITIES and CLIMATE: Historical Precedents and Potential 11 Transitions for the New Economy. Urban Sci., 4(3), 32, doi:10.3390/urbansci4030032. 12
Newman, P., 2017: The rise and rise of renewable cities. Renew. Energy Environ. Sustain., 2, 10, 13 doi:10.1051/rees/2017008. 14
Newman, P., 2020: Cool planning: How urban planning can mainstream responses to climate change. 15 Cities, 103, 102651, doi:10.1016/j.cities.2020.102651. 16
Newman, P., and I. Jennings, 2008: Cities as Sustainable Ecosystems: Principles and Practices. Island 17 Press, Washington, D.C., 296 pp. 18
Newman, P., L. Kosonen, and J. Kenworthy, 2016: Theory of urban fabrics: planning the walking, 19 transit/public transport and automobile/motor car cities for reduced car dependency. Town Plan. 20 Rev., 87(4), 429–458, doi:10.3828/tpr.2016.28. 21
Newman, P., T. Beatley, and H. Boyer, 2017: Resilient Cities, Second Edition: Overcoming Fossil Fuel 22 Dependence. 2nd ed. Island Press, Washington, 264 pp. 23
Nieuwenhuijsen, M. J., 2020: Urban and transport planning pathways to carbon neutral, liveable and 24 healthy cities; A review of the current evidence. Environ. Int., 140, 105661, 25 doi:10.1016/j.envint.2020.105661. 26
Nieuwenhuijsen, M. J., and H. Khreis, 2016: Car free cities: Pathway to healthy urban living. Environ. 27 Int., 94, 251–262, doi:10.1016/j.envint.2016.05.032. 28
Nilsson, M., D. Griggs, and M. Visbeck, 2016: Policy: Map the interactions between Sustainable 29 Development Goals. Nature, 534, 320–322, doi:10.1038/534320a. 30
Nisbet, E. G. et al., 2019: Very Strong Atmospheric Methane Growth in the 4 Years 2014–2017: 31 Implications for the Paris Agreement. Global Biogeochem. Cycles, 33(3), 318–342, 32 doi:10.1029/2018GB006009. 33
Noble, B., and K. Nwanekezie, 2017: Conceptualizing strategic environmental assessment: Principles, 34 approaches and research directions. Environ. Impact Assess. Rev., 62, 165–173, 35 doi:10.1016/j.eiar.2016.03.005. 36
Nowak, D. J., and J. F. Dwyer, 2007: Understanding the Benefits and Costs of Urban Forest Ecosystems 37 BT - Urban and Community Forestry in the Northeast. In: Urban and Community Forestry in the 38 Northeast [Kuser, J.E., (ed.)], Springer Netherlands, Dordrecht, pp. 25–46. 39
Nowak, D. J., and E. J. Greenfield, 2020: The increase of impervious cover and decrease of tree cover 40 within urban areas globally (2012–2017). Urban For. Urban Green., 49, 126638, 41
ACCEPTED VERSION
SUBJECT TO FIN
AL EDITS
Final Government Distribution Chapter 8 IPCC AR6 WGIII
Do Not Cite, Quote or Distribute 8-138 Total pages: 157
doi:10.1016/j.ufug.2020.126638. 1
Nowak, D. J., E. J. Greenfield, R. E. Hoehn, and E. Lapoint, 2013: Carbon storage and sequestration 2 by trees in urban and community areas of the United States. Environ. Pollut., 178, 229–236, 3 doi:10.1016/j.envpol.2013.03.019. 4
Nowak, D. J., N. Appleton, A. Ellis, and E. Greenfield, 2017: Residential building energy conservation 5 and avoided power plant emissions by urban and community trees in the United States. Urban 6 For. Urban Green., 21, 158–165, doi:10.1016/j.ufug.2016.12.004. 7
O’Brien, P., P. O’Neill, and A. Pike, 2019: Funding, financing and governing urban infrastructures. 8 Urban Stud., 56(7), 1291–1303, doi:10.1177/0042098018824014. 9
O’Dwyer, E., I. Pan, S. Acha, and N. Shah, 2019: Smart energy systems for sustainable smart cities: 10 Current developments, trends and future directions. Appl. Energy, 237, 581–597, 11 doi:10.1016/j.apenergy.2019.01.024. 12
O’Neill, B. C. et al., 2020: Achievements and needs for the climate change scenario framework. Nat. 13 Clim. Chang., 10(12), 1074–1084, doi:10.1038/s41558-020-00952-0. 14
Oda, T., C. Haga, K. Hosomi, T. Matsui, and R. Bun, 2021: Errors and uncertainties associated with 15 the use of unconventional activity data for estimating CO2 emissions: the case for traffic emissions 16 in Japan. Environ. Res. Lett., 16(8), 084058, doi:10.1088/1748-9326/ac109d. 17
Olazabal, M., and M. Ruiz De Gopegui, 2021: Adaptation planning in large cities is unlikely to be 18 effective. Landsc. Urban Plan., 206, 103974, doi:10.1016/j.landurbplan.2020.103974. 19
Oliveira, L. S. B. L., D. S. B. L. Oliveira, B. S. Bezerra, B. Silva Pereira, and R. A. G. Battistelle, 2017: 20 Environmental analysis of organic waste treatment focusing on composting scenarios. J. Clean. 21 Prod., 155(Part I), 229–237, doi:10.1016/j.jclepro.2016.08.093. 22
ONU Medio Ambiente, 2017: Movilidad eléctrica: Oportunidades para Latinoamérica. ONU 23 Ambiente/ UN Environment, Panama City, 82 pp. http://movelatam.org/Movilidad electrica_ 24 Oportunidades para AL.pdf. 25
Oyewo, A. S., A. Aghahosseini, M. Ram, A. Lohrmann, and C. Breyer, 2019: Pathway towards 26 achieving 100% renewable electricity by 2050 for South Africa. Sol. Energy, 191, 549–565, 27 doi:10.1016/j.solener.2019.09.039. 28
Pacheco-Torres, R., J. Roldán, E. J. Gago, and J. Ordóñez, 2017: Assessing the relationship between 29 urban planning options and carbon emissions at the use stage of new urbanized areas: A case study 30 in a warm climate location. Energy Build., 136, 73–85, doi:10.1016/j.enbuild.2016.11.055. 31
Padeiro, M., A. Louro, and N. M. da Costa, 2019: Transit-oriented development and gentrification: a 32 systematic review. Transp. Rev., 39(6), 733–754, doi:10.1080/01441647.2019.1649316. 33
Palermo, V., P. Bertoldi, M. Apostolou, A. Kona, and S. Rivas, 2020a: Assessment of climate change 34 mitigation policies in 315 cities in the Covenant of Mayors initiative. Sustain. Cities Soc., 60, 35 102258, doi:10.1016/j.scs.2020.102258. 36
Palermo, V., P. Bertoldi, M. Apostolou, A. Kona, and S. Rivas, 2020b: Data on mitigation policies at 37 local level within the Covenant of Mayors’ monitoring emission inventories. Data Br., 32, 38 106217, doi:10.1016/j.dib.2020.106217. 39
Pan, J., 2020: Target Orientation of Addressing Climate Change during the Period of the 14th Five-40
ACCEPTED VERSION
SUBJECT TO FIN
AL EDITS
Final Government Distribution Chapter 8 IPCC AR6 WGIII
Do Not Cite, Quote or Distribute 8-139 Total pages: 157
Year Plan. Chinese J. Urban Environ. Stud., 8(2), 2050007, doi:10.1142/S2345748120500074. 1
Pan, S.-Y. et al., 2015: Strategies on implementation of waste-to-energy (WTE) supply chain for 2 circular economy system: a review. J. Clean. Prod., 108, 409–421, 3 doi:10.1016/j.jclepro.2015.06.124. 4
Pandey, R. et al., 2018: Climate change vulnerability in urban slum communities: Investigating 5 household adaptation and decision-making capacity in the Indian Himalaya. Ecol. Indic., 90, 379–6 391, doi:10.1016/j.ecolind.2018.03.031. 7
Park, E. S., and I. N. Sener, 2019: Traffic-related air emissions in Houston: Effects of light-rail transit. 8 Sci. Total Environ., 651, 154–161, doi:10.1016/j.scitotenv.2018.09.169. 9
Pasimeni, M. R., D. Valente, G. Zurlini, and I. Petrosillo, 2019: The interplay between urban mitigation 10 and adaptation strategies to face climate change in two European countries. Environ. Sci. Policy, 11 95, 20–27, doi:10.1016/j.envsci.2019.02.002. 12
Pataki, D. E. et al., 2011: Coupling biogeochemical cycles in urban environments: ecosystem services, 13 green solutions, and misconceptions. Front. Ecol. Environ., 9(1), 27–36, doi:10.1890/090220. 14
Pathak, M., and P. R. Shukla, 2016: Co-benefits of low carbon passenger transport actions in Indian 15 cities: Case study of Ahmedabad. Transp. Res. Part D Transp. Environ., 44, 303–316, 16 doi:10.1016/j.trd.2015.07.013. 17
Pathak, M., and D. Mahadevia, 2018: Urban Informality and Planning: Challenges to Mainstreaming 18 Resilience in Indian Cities. In: Resilience-Oriented Urban Planning: Theoretical and Empirical 19 Insights [Yamagata, Y. and A. Sharifi, (eds.)], Lecture Notes in Energy, Springer International 20 Publishing, Cham, Switzerland, pp. 49–66. 21
Patterson, J. J., 2021: More than planning: Diversity and drivers of institutional adaptation under climate 22 change in 96 major cities. Glob. Environ. Chang., 68, 102279, 23 doi:10.1016/j.gloenvcha.2021.102279. 24
Pedro, J., C. Silva, and M. D. Pinheiro, 2018: Scaling up LEED-ND sustainability assessment from the 25 neighborhood towards the city scale with the support of GIS modeling: Lisbon case study. Sustain. 26 Cities Soc., 41, 929–939, doi:10.1016/j.scs.2017.09.015. 27
Peng, W., J. Yang, X. Lu, and D. L. Mauzerall, 2018: Potential co-benefits of electrification for air 28 quality, health, and CO2 mitigation in 2030 China. Appl. Energy, 218, 511–519, 29 doi:10.1016/j.apenergy.2018.02.048. 30
Peng, Y., and X. Bai, 2018: Experimenting towards a low-carbon city: Policy evolution and nested 31 structure of innovation. J. Clean. Prod., 174, 201–212, doi:10.1016/J.JCLEPRO.2017.10.116. 32
Peng, Y., and X. Bai, 2020: Financing urban low-carbon transition: The catalytic role of a city-level 33 special fund in Shanghai. J. Clean. Prod., 282, 124514, doi:10.1016/j.jclepro.2020.124514. 34
Perini, K., F. Bazzocchi, L. Croci, A. Magliocco, and E. Cattaneo, 2017: The use of vertical greening 35 systems to reduce the energy demand for air conditioning. Field monitoring in Mediterranean 36 climate. Energy Build., 143, 35–42, doi:10.1016/j.enbuild.2017.03.036. 37
Permadi, D. A., N. T. Kim Oanh, and R. Vautard, 2017: Assessment of co-benefits of black carbon 38 emission reduction measures in Southeast Asia: Part 2 emission scenarios for 2030 and co-benefits 39 on mitigation of air pollution and climate forcing. Atmos. Chem. Phys. Discuss., 1–21, 40 doi:10.5194/acp-2017-316. 41
ACCEPTED VERSION
SUBJECT TO FIN
AL EDITS
Final Government Distribution Chapter 8 IPCC AR6 WGIII
Do Not Cite, Quote or Distribute 8-140 Total pages: 157
Persson, U., E. Wiechers, B. Möller, and S. Werner, 2019: Heat Roadmap Europe: Heat distribution 1 costs. Energy, 176, 604–622, doi:10.1016/j.energy.2019.03.189. 2
Pesaresi, M., M. Melchiorri, A. Siragusa, and T. Kemper, 2016: Atlas of the Human Planet 2016 - 3 Mapping Human Presence on Earth with the Global Human Settlement Layer, EUR 28116 EN. 4 European Union (EU), Luxembourg, 137 pp. 5
Petit-Boix, A., and D. Apul, 2018: From Cascade to Bottom-Up Ecosystem Services Model: How Does 6 Social Cohesion Emerge from Urban Agriculture? Sustainability, 10(4), 998, 7 doi:10.3390/su10040998. 8
Pfeifer, A., L. Herc, I. Batas Bjelić, and N. Duić, 2021: Flexibility index and decreasing the costs in 9 energy systems with high share of renewable energy. Energy Convers. Manag., 240, 114258, 10 doi:10.1016/j.enconman.2021.114258. 11
Pichler, P.-P.. et al., 2017: Reducing Urban Greenhouse Gas Footprints. Sci. Rep., 7, 14659, 12 doi:10.1038/s41598-017-15303-x. 13
Pierer, C., and F. Creutzig, 2019: Star-shaped cities alleviate trade-off between climate change 14 mitigation and adaptation. Environ. Res. Lett., 14, 085011, doi:10.1088/1748-9326/ab2081. 15
Pinho, P., and R. Fernandes, 2019: Urban metabolic impact assessment From concept to practice. In: 16 The Routledge Companion to Environmental Planning [Davoudi, S., R. Cowell, I. White, and H. 17 Blanco, (eds.)], Routledge, London, pp. 358–371. 18
Pomponi, F., J. Hart, J. H. Arehart, B. D’Amico, and B. D’Amico, 2020: Buildings as a Global Carbon 19 Sink? A Reality Check on Feasibility Limits. One Earth, 3(2), 157–161, 20 doi:10.1016/j.oneear.2020.07.018. 21
Portland Bureau of Planning and Sustainability, 2012: The Portland Plan. Portland Bureau of Planning 22 and Sustainability (BPS), Portland, OR, 164 pp. 23 https://www.portlandonline.com/portlandplan/index.cfm?c=58776. 24
Pörtner, H. O. et al., 2021: IPBES-IPCC co-sponsored workshop report on biodiversity and climate 25 change. Intergovernmental Science-Policy Platform on Biodiversity and Ecosystem Services 26 (IPBES) and Intergovernmental Panel on Climate Change (IPCC), Bonn, 28 pp. 27
Potdar, A. et al., 2016: Innovation in solid waste management through Clean Development Mechanism 28 in India and other countries. Process Saf. Environ. Prot., 101, 160–169, 29 doi:10.1016/j.psep.2015.07.009. 30
Pour, S. H., A. K. A. Wahab, S. Shahid, M. Asaduzzaman, and A. Dewan, 2020: Low impact 31 development techniques to mitigate the impacts of climate-change-induced urban floods: Current 32 trends, issues and challenges. Sustain. Cities Soc., 62, 102373, doi:10.1016/j.scs.2020.102373. 33
Pouyat, R., P. Groffman, I. Yesilonis, and L. Hernandez, 2002: Soil carbon pools and fluxes in urban 34 ecosystems. Environ. Pollut., 116(Supplement 1), S107–S118, doi:10.1016/S0269-35 7491(01)00263-9. 36
Pouyat, R. V. et al., 2007: Effects of Urban Land-Use Change on Biogeochemical Cycles. In: Terrestrial 37 Ecosystems in a Changing World — The IGBP Series [Canadell, J.G., D.E. Pataki, and L.F. 38 Pitelka, (eds.)], Springer Berlin Heidelberg, Berlin, Heidelberg, pp. 45–58. 39
Pozoukidou, G., and Z. Chatziyiannaki, 2021: 15-Minute City: Decomposing the New Urban Planning 40 Eutopia. Sustainability, 13(2), 928, doi:10.3390/su13020928. 41
ACCEPTED VERSION
SUBJECT TO FIN
AL EDITS
Final Government Distribution Chapter 8 IPCC AR6 WGIII
Do Not Cite, Quote or Distribute 8-141 Total pages: 157
Pregitzer, C. C. et al., 2019a: Defining and assessing urban forests to inform management and policy. 1 Environ. Res. Lett., 14(8), 085002, doi:10.1088/1748-9326/ab2552. 2
Pregitzer, C. C. et al., 2019b: A city‐scale assessment reveals that native forest types and overstory 3 species dominate New York City forests. Ecol. Appl., 29(1), e01819, doi:10.1002/eap.1819. 4
Pregitzer, C. C., C. Hanna, S. Charlop-Powers, and M. A. Bradford, 2021: Estimating carbon storage 5 in urban forests of New York City. Urban Ecosyst., 1–15, doi:10.1007/S11252-021-01173-9. 6
Prendeville, S., E. Cherim, and N. Bocken, 2018: Circular Cities: Mapping Six Cities in Transition. 7 Environ. Innov. Soc. Transitions, 26, 171–194, doi:10.1016/j.eist.2017.03.002. 8
Prieur-Richard, A.-H. et al., 2018: Global Research and Action Agenda on Cities and Climate Change 9 Science Urban Crosscutting Cities and Action Integrate Communicate. Intergovernmental Panel 10 on Climate Change (IPCC), 8 pp. https://www.ipcc.ch/site/assets/uploads/2019/07/Research-11 Agenda-Aug-10_Final_Short-version.pdf. 12
Prior, J. et al., 2018: Built environment interventions for human and planetary health: integrating health 13 in climate change adaptation and mitigation. Public Heal. Res. Pract., 28(4), e2841831, 14 doi:10.17061/phrp2841831. 15
Privitera, R., and D. La Rosa, 2018: Reducing Seismic Vulnerability and Energy Demand of Cities 16 through Green Infrastructure. Sustainability, 10(8), 2591, doi:10.3390/su10082591. 17
Privitera, R., V. Palermo, F. Martinico, A. Fichera, and D. La Rosa, 2018: Towards lower carbon cities: 18 urban morphology contribution in climate change adaptation strategies. Eur. Plan. Stud., 26(4), 19 812–837, doi:10.1080/09654313.2018.1426735. 20
Priya Uteng, T., and J. Turner, 2019: Addressing the Linkages between Gender and Transport in Low- 21 and Middle-Income Countries. Sustainability, 11(17), 4555, doi:10.3390/su11174555. 22
Pukšec, T., P. Leahy, A. Foley, N. Markovska, and N. Duić, 2018: Sustainable development of energy, 23 water and environment systems 2016. Renew. Sustain. Energy Rev., 82, 1685–1690, 24 doi:10.1016/J.RSER.2017.10.057. 25
Pulselli, R. M. et al., 2021: Future city visions. The energy transition towards carbon-neutrality: lessons 26 learned from the case of Roeselare, Belgium. Renew. Sustain. Energy Rev., 137, 110612, 27 doi:10.1016/j.rser.2020.110612. 28
Puppim de Oliveira, J. A., and C. N. H. Doll, 2016: Governance and networks for health co-benefits of 29 climate change mitigation: Lessons from two Indian cities. Environ. Int., 97, 146–154, 30 doi:10.1016/j.envint.2016.08.020. 31
Qin, H. peng, Z. xi Li, and G. Fu, 2013: The effects of low impact development on urban flooding under 32 different rainfall characteristics. J. Environ. Manage., 129, 577–585, 33 doi:10.1016/j.jenvman.2013.08.026. 34
Qiu, Y. et al., 2021: Space variability impacts on hydrological responses of nature-based solutions and 35 the resulting uncertainty: a case study of Guyancourt (France). Hydrol. Earth Syst. Sci., 25(6), 36 3137–3162, doi:10.5194/hess-25-3137-2021. 37
Quaranta, E., C. Dorati, and A. Pistocchi, 2021: Water, energy and climate benefits of urban greening 38 throughout Europe under different climatic scenarios. Sci. Rep., 11, 12163, doi:10.1038/s41598-39 021-88141-7. 40
ACCEPTED VERSION
SUBJECT TO FIN
AL EDITS
Final Government Distribution Chapter 8 IPCC AR6 WGIII
Do Not Cite, Quote or Distribute 8-142 Total pages: 157
Queiroz, A., F. T. Najafi, and P. Hanrahan, 2017: Implementation and Results of Solar Feed-In-Tariff 1 in Gainesville, Florida. J. Energy Eng., 143(1), 05016005, doi:10.1061/(ASCE)EY.1943-2 7897.0000373. 3
Quesada, B., A. Arneth, E. Robertson, and N. De Noblet-Ducoudré, 2018: Potential strong contribution 4 of future anthropogenic land-use and land-cover change to the terrestrial carbon cycle. Environ. 5 Res. Lett., 13(6), 064023, doi:10.1088/1748-9326/aac4c3. 6
Qureshi, Z., 2015: The Role of Public Policy in Sustainable Infrastructure. Brookings Institution, 7 Washington D.C., 19–23 pp. https://www.brookings.edu/wp-content/uploads/2016/07/public-8 policy-sustainable-infrastructure-qureshi-1.pdf. 9
Raciti, S. M., L. R. Hutyra, P. Rao, and A. C. Finzi, 2012: Inconsistent definitions of “urban” result in 10 different conclusions about the size of urban carbon and nitrogen stocks. Ecol. Appl., 22(3), 1015–11 1035, doi:10.1890/11-1250.1. 12
Radomes Jr, A. A., and S. Arango, 2015: Renewable energy technology diffusion: an analysis of 13 photovoltaic-system support schemes in Medellín, Colombia. J. Clean. Prod., 92, 152–161, 14 doi:10.1016/j.jclepro.2014.12.090. 15
Ramage, M. H. et al., 2017: The wood from the trees: The use of timber in construction. Renew. Sustain. 16 Energy Rev., 68, 333–359, doi:10.1016/j.rser.2016.09.107. 17
Ramaswami, A., 2020: Unpacking the Urban Infrastructure Nexus with Environment, Health, 18 Livability, Well-Being, and Equity. One Earth, 2(2), 120–124, doi:10.1016/j.oneear.2020.02.003. 19
Ramaswami, A., and A. Chavez, 2013: What metrics best reflect the energy and carbon intensity of 20 cities? Insights from theory and modeling of 20 US cities. Environ. Res. Lett., 8(3), 35011, 21 doi:10.1088/1748-9326/8/3/035011. 22
Ramaswami, A., T. Hillman, B. Janson, M. Reiner, and G. Thomas, 2008: A Demand-Centered, Hybrid 23 Life-Cycle Methodology for City-Scale Greenhouse Gas Inventories. Environ. Sci. Technol., 24 42(17), 6455–6461, doi:10.1021/es702992q. 25
Ramaswami, A. et al., 2016: Meta-principles for developing smart, sustainable, and healthy cities. 26 Science, 352(6288), 940–943, doi:10.1126/science.aaf7160. 27
Ramaswami, A. et al., 2017a: Urban cross-sector actions for carbon mitigation with local health co-28 benefits in China. Nat. Clim. Chang., 7(10), 736–742, doi:10.1038/nclimate3373. 29
Ramaswami, A. et al., 2017b: An urban systems framework to assess the trans-boundary food-energy-30 water nexus: implementation in Delhi, India. Environ. Res. Lett., 12(2), 025008, 31 doi:10.1088/1748-9326/aa5556. 32
Ramaswami, A. et al., 2021: Carbon analytics for net-zero emissions sustainable cities. Nat. Sustain., 33 4(6), 460–463, doi:10.1038/s41893-021-00715-5. 34
Ranieri, L., G. Mossa, R. Pellegrino, and S. Digiesi, 2018: Energy Recovery from the Organic Fraction 35 of Municipal Solid Waste: A Real Options-Based Facility Assessment. Sustainability, 10(2), 368, 36 doi:10.3390/su10020368. 37
Raven, J. et al., 2018: Urban Planning and Urban Design. In: Climate Change and Cities: Second 38 Assessment Report of the Urban Climate Change Research Network [Rosenzweig, C., W.D. 39 Solecki, P. Romero-Lankao, S. Mehrotra, S. Dhakal, and S.A. Ibrahim, (eds.)], Cambridge 40 University Press, New York, pp. 139–172. 41
ACCEPTED VERSION
SUBJECT TO FIN
AL EDITS
Final Government Distribution Chapter 8 IPCC AR6 WGIII
Do Not Cite, Quote or Distribute 8-143 Total pages: 157
Ravetz, J., A. Neuvonen, and R. Mäntysalo, 2020: The new normative: synergistic scenario planning 1 for carbon-neutral cities and regions. Reg. Stud., 55(1), 150–163, 2 doi:10.1080/00343404.2020.1813881. 3
Raymond, C. M. et al., 2017: A framework for assessing and implementing the co-benefits of nature-4 based solutions in urban areas. Environ. Sci. Policy, 77, 15–24, doi:10.1016/j.envsci.2017.07.008. 5
Reckien, D. et al., 2017: Climate change, equity and the Sustainable Development Goals: an urban 6 perspective. Environ. Urban., 29(1), 159–182, doi:10.1177/0956247816677778. 7
Reckien, D. et al., 2018: How are cities planning to respond to climate change? Assessment of local 8 climate plans from 885 cities in the EU-28. J. Clean. Prod., 191, 207–219, 9 doi:10.1016/j.jclepro.2018.03.220. 10
Rees, W., 1997: Urban ecosystems: the human dimension. Urban Ecosyst., 1, 63–75, 11 doi:10.1023/A:1014380105620. 12
Reinmann, A. B., I. A. Smith, J. R. Thompson, and L. R. Hutyra, 2020: Urbanization and fragmentation 13 mediate temperate forest carbon cycle response to climate. Environ. Res. Lett., 15(11), 114036, 14 doi:10.1088/1748-9326/abbf16. 15
REN21, 2019: Renewables in Cities: 2019 Global Status Report. REN21 Secretariat, Paris, 174 pp. 16 https://www.ren21.net/reports/cities-global-status-report/. 17
REN21, 2020: Renewables 2020 Global Status Report. REN21 Secretariat, Paris, 367 pp. 18 https://www.ren21.net/wp-content/uploads/2019/05/gsr_2020_full_report_en.pdf. 19
REN21, 2021: Renewables in Cities 2021 Global Status Report. REN21 Secretariat, Paris, 202 pp. 20 https://www.ren21.net/reports/cities-global-status-report/. 21
Reyna, J. L., and M. V Chester, 2015: The Growth of Urban Building Stock: Unintended Lock-in and 22 Embedded Environmental Effects. J. Ind. Ecol., 19(4), 524–537, doi:10.1111/jiec.12211. 23
Riahi, K. et al., 2017: The Shared Socioeconomic Pathways and their energy, land use, and greenhouse 24 gas emissions implications: An overview. Glob. Environ. Chang., 42, 153–168, 25 doi:10.1016/j.gloenvcha.2016.05.009. 26
Ribeiro, H. V, D. Rybski, and J. P. Kropp, 2019: Effects of changing population or density on urban 27 carbon dioxide emissions. Nat. Commun., 10, 3204, doi:10.1038/s41467-019-11184-y. 28
Rigolon, A., M. Browning, K. Lee, and S. Shin, 2018: Access to Urban Green Space in Cities of the 29 Global South: A Systematic Literature Review. Urban Sci., 2(3), 67, 30 doi:10.3390/urbansci2030067. 31
Rocha, L. C. S. et al., 2017: Photovoltaic electricity production in Brazil: A stochastic economic 32 viability analysis for small systems in the face of net metering and tax incentives. J. Clean. Prod., 33 168, 1448–1462, doi:10.1016/j.jclepro.2017.09.018. 34
Rode, D. C., P. S. Fischbeck, and A. R. Páez, 2017: The retirement cliff: Power plant lives and their 35 policy implications. Energy Policy, 106, 222–232, doi:10.1016/J.ENPOL.2017.03.058. 36
Rodrigues, C. U., 2019: Climate change and DIY urbanism in Luanda and Maputo: new urban 37 strategies? Int. J. Urban Sustain. Dev., 11(3), 319–331, doi:10.1080/19463138.2019.1585859. 38
Roelfsema, M., 2017: Assessment of US City Reduction Commitments, from a Country Perspective. 39
ACCEPTED VERSION
SUBJECT TO FIN
AL EDITS
Final Government Distribution Chapter 8 IPCC AR6 WGIII
Do Not Cite, Quote or Distribute 8-144 Total pages: 157
PBL Netherlands Environmental Assessment Agency, The Hague, 26 pp. 1 https://www.pbl.nl/sites/default/files/downloads/pbl-2017-assessment-of-us-city-reduction-2 commitments-from-a-country-perspective-1993.pdf (Accessed January 7, 2021). 3
Rogelj, J. et al., 2018: Scenarios towards limiting global mean temperature increase below 1.5 °C. Nat. 4 Clim. Chang., 8(4), 325–332, doi:10.1038/s41558-018-0091-3. 5
Roger, C., T. Hale, and L. Andonova, 2017: The Comparative Politics of Transnational Climate 6 Governance. Int. Interact., 43(1), 1–25, doi:10.1080/03050629.2017.1252248. 7
Roldán-Fontana, J., R. Pacheco-Torres, E. Jadraque-Gago, and J. Ordóñez, 2017: Optimization of CO2 8 emissions in the design phases of urban planning, based on geometric characteristics: a case study 9 of a low-density urban area in Spain. Sustain. Sci., 12, 65–85, doi:10.1007/s11625-015-0342-4. 10
Roppongi, H., A. Suwa, and J. A. Puppim De Oliveira, 2017: Innovating in sub-national climate policy: 11 the mandatory emissions reduction scheme in Tokyo. Clim. Policy, 17(4), 516–532, 12 doi:10.1080/14693062.2015.1124749. 13
Rosenzweig, C. et al., 2018: Climate Change and Cities: Second Assessment Report of the Urban 14 Climate Change Research Network. [Rosenzweig, C., W. Solecki, P. Romero-Lankao, S. 15 Mehrotra, S. Dhakal, and S.A. Ibrahim, (eds.)]. Cambridge University Press, New York, 311 pp. 16
Roy, A., 2009: Why India Cannot Plan Its Cities: Informality, Insurgence and the Idiom of 17 Urbanization. Plan. Theory, 8(1), 76–87, doi:10.1177/1473095208099299. 18
Rueda, S., 2019: Superblocks for the Design of New Cities and Renovation of Existing Ones: 19 Barcelona’s Case. In: Integrating Human Health into Urban and Transport Planning 20 [Nieuwenhuijsen, M.J. and H. Khreis, (eds.)], Springer International Publishing, Cham, 21 Switzerland, pp. 135–153. 22
Saha, D., and S. D’Almeida, 2017: Green municipal bonds. In: Finance for City Leaders, 2nd Edition 23 [Kamiya, M. and L.-Y. Zhang, (eds.)], UN-Habitat, Nairobi, pp. 98–118. 24
Salat, S., M. Chen, and F. L. Liu, 2014: Planning Energy Efficient and Livable Cities: Energy Efficient 25 Cities: Mayoral Guidance Note #6. Energy Sector Management Assistance Program, The World 26 Bank, 30 pp. https://www.semanticscholar.org/paper/Planning-energy-efficient-and-livable-27 cities-%3A-Salat-Chen/475a01c0bf911db4a435c1a2a37dabf53ff98f1d. 28
Salat, S., L. Bourdic, and M. Kamiya, 2017: Economic Foundations for Sustainable Urbanization: A 29 Study on Three-Pronged Approach: Planned City Extensions, Legal Framework, and Municipal 30 Finance. UN-Habitat, Paris, 136 pp. https://unhabitat.org/economic-foundations-for-sustainable-31 urbanization-a-study-on-three-pronged-approach-planned-city-extensions-legal-framework-and-32 municipal-finance. 33
Salpakari, J., J. Mikkola, and P. D. Lund, 2016: Improved flexibility with large-scale variable renewable 34 power in cities through optimal demand side management and power-to-heat conversion. Energy 35 Convers. Manag., 126, 649–661, doi:10.1016/j.enconman.2016.08.041. 36
Salvia, M. et al., 2021: Will climate mitigation ambitions lead to carbon neutrality? An analysis of the 37 local-level plans of 327 cities in the EU. Renew. Sustain. Energy Rev., 135, 110253. 38
Sanchez Rodriguez, R., D. Ürge-Vorsatz, and A. S. Barau, 2018: Sustainable Development Goals and 39 climate change adaptation in cities. Nat. Clim. Chang., 8(3), 181–183, doi:10.1038/s41558-018-40 0098-9. 41
ACCEPTED VERSION
SUBJECT TO FIN
AL EDITS
Final Government Distribution Chapter 8 IPCC AR6 WGIII
Do Not Cite, Quote or Distribute 8-145 Total pages: 157
Sargent, M. et al., 2018: Anthropogenic and biogenic CO2 fluxes in the Boston urban region. Proc. 1 Natl. Acad. Sci. U. S. A., 115(29), 7491–7496, doi:10.1073/pnas.1803715115. 2
Saujot, M., and B. Lefèvre, 2016: The next generation of urban MACCs. Reassessing the cost-3 effectiveness of urban mitigation options by integrating a systemic approach and social costs. 4 Energy Policy, 92, 124–138, doi:10.1016/j.enpol.2016.01.029. 5
Scholvin, S., M. Breul, and J. Revilla Diez, 2019: Urban Geography Revisiting gateway cities: 6 connecting hubs in global networks to their hinterlands. Taylor Fr., 40(9), 1291–1309, 7 doi:10.1080/02723638.2019.1585137. 8
Scholz, T., A. Hof, and T. Schmitt, 2018: Cooling Effects and Regulating Ecosystem Services Provided 9 by Urban Trees—Novel Analysis Approaches Using Urban Tree Cadastre Data. Sustainability, 10 10(3), 712, doi:10.3390/su10030712. 11
Seo, S., G. Foliente, and Z. Ren, 2018: Energy and GHG reductions considering embodied impacts of 12 retrofitting existing dwelling stock in Greater Melbourne. J. Clean. Prod., 170, 1288–1304, 13 doi:10.1016/j.jclepro.2017.09.206. 14
Sethi, M., and J. A. Puppim de Oliveira, 2018: Cities and Climate Co-benefits. In: Mainstreaming 15 Climate Co-Benefits in Indian Cities [Sethi, M. and J.A. Puppim de Oliveira, (eds.)], Springer, 16 Singapore, Singapore, pp. 3–45. 17
Sethi, M., W. Lamb, J. Minx, and F. Creutzig, 2020: Climate change mitigation in cities: a systematic 18 scoping of case studies. Environ. Res. Lett., 15(9), 093008, doi:10.1088/1748-9326/ab99ff. 19
Seto, K. C. et al., 2014: Human Settlements, Infrastructure, and Spatial Planning. In: Climate Change 20 2014: Mitigation of Climate Change. Contribution of Working Group III to the Fifth Assessment 21 Report of the Intergovernmental Panel on Climate Change [Edenhofer, O. et al., (eds.)], 22 Cambridge University Press, Cambridge and New York, pp. 923–1000. 23
Seto, K. C. et al., 2016: Carbon Lock-In: Types, Causes, and Policy Implications. Annu. Rev. Environ. 24 Resour., 41, 425–452, doi:10.1146/annurev-environ-110615-085934. 25
Seto, K. C. et al., 2021: From Low- to Net-Zero Carbon Cities: The Next Global Agenda. Annu. Rev. 26 Environ. Resour., 46, 377–415, doi:10.1146/annurev-environ-050120-113117. 27
Shakya, S. R., 2016: Benefits of Low Carbon Development Strategies in Emerging Cities of Developing 28 Country: a Case of Kathmandu. J. Sustain. Dev. Energy, Water Environ. Syst., 4(2), 141–160, 29 doi:10.13044/j.sdewes.2016.04.0012. 30
Shannon, H. et al., 2018: Web Annex A: report of the systematic review on the effect of household 31 crowding on health. In: WHO Housing and health guidelines, World Health Organization (WHO), 32 Geneva, p. pp. 105 p. 33
Sharifi, A., 2019: Resilient urban forms: A review of literature on streets and street networks. Build. 34 Environ., 147, 171–187, doi:10.1016/j.buildenv.2018.09.040. 35
Sharifi, A., 2020: Trade-offs and conflicts between urban climate change mitigation and adaptation 36 measures: A literature review. J. Clean. Prod., 276(10), 122813, 37 doi:10.1016/j.jclepro.2020.122813. 38
Sharifi, A., 2021: Co-benefits and synergies between urban climate change mitigation and adaptation 39 measures: A literature review. Sci. Total Environ., 750, 141642, 40 doi:10.1016/j.scitotenv.2020.141642. 41
ACCEPTED VERSION
SUBJECT TO FIN
AL EDITS
Final Government Distribution Chapter 8 IPCC AR6 WGIII
Do Not Cite, Quote or Distribute 8-146 Total pages: 157
Sharifi, A., and A. R. Khavarian-Garmsir, 2020: The COVID-19 pandemic: Impacts on cities and major 1 lessons for urban planning, design, and management. Sci. Total Environ., 749, 142391, 2 doi:10.1016/j.scitotenv.2020.142391. 3
Sharifi, A. et al., 2017: Conceptualizing Dimensions and Characteristics of Urban Resilience: Insights 4 from a Co-Design Process. Sustainability, 9(6), 1032, doi:10.3390/su9061032. 5
Sharifi, A., M. Pathak, C. Joshi, and B.-J. He, 2021: A systematic review of the health co-benefits of 6 urban climate change adaptation. Sustain. Cities Soc., 74, 103190, doi:10.1016/j.scs.2021.103190. 7
Sharma, A. et al., 2018: Role of green roofs in reducing heat stress in vulnerable urban communities—8 a multidisciplinary approach. Environ. Res. Lett., 13(9), 094011, doi:10.1088/1748-9326/aad93c. 9
Sharma, R., 2018: Financing Indian urban rail through land development: Case studies and implications 10 for the accelerated reduction in oil associated with 1.5 °C. Urban Plan., 3(2), 21–34, 11 doi:10.17645/up.v3i2.1158. 12
Sharp, D., and R. Salter, 2017: Direct Impacts of an Urban Living Lab from the Participants’ 13 Perspective: Livewell Yarra. Sustainability, 9(10), 1699, doi:10.3390/su9101699. 14
Shen, L. et al., 2018: Analysis on the evolution of low carbon city from process characteristic 15 perspective. J. Clean. Prod., 187, 348–360, doi:10.1016/j.jclepro.2018.03.190. 16
Shen, X., X. Wang, Z. Zhang, Z. Lu, and T. Lv, 2019: Evaluating the effectiveness of land use plans in 17 containing urban expansion: An integrated view. Land use policy, 80, 205–213, 18 doi:10.1016/j.landusepol.2018.10.001. 19
Shi, L. et al., 2016: Roadmap towards justice in urban climate adaptation research. Nat. Clim. Chang., 20 6(2), 131–137, doi:10.1038/nclimate2841. 21
Shi, Y., Y.-X. Yun, C. Liu, and Y.-Q. Chu, 2017a: Carbon footprint of buildings in the urban 22 agglomeration of central Liaoning, China. Chinese J. Appl. Ecol., 28(6), 2040–2046, 23 doi:10.13287/j.1001-9332.201706.007. 24
Shi, Z., J. A. Fonseca, and A. Schlueter, 2017b: A review of simulation-based urban form generation 25 and optimization for energy-driven urban design. Build. Environ., 121, 119–129, 26 doi:10.1016/j.buildenv.2017.05.006. 27
Shi, Z., S. Hsieh, J. A. Fonseca, and A. Schlueter, 2020: Street grids for efficient district cooling systems 28 in high-density cities. Sustain. Cities Soc., 60, 102224, doi:10.1016/j.scs.2020.102224. 29
Shughrue, C., B. Werner, and K. C. Seto, 2020: Global spread of local cyclone damages through urban 30 trade networks. Nat. Sustain., 3(8), 606–613, doi:10.1038/s41893-020-0523-8. 31
Silva, C. M., M. G. Gomes, and M. Silva, 2016: Green roofs energy performance in Mediterranean 32 climate. Energy Build., 116, 318–325, doi:10.1016/j.enbuild.2016.01.012. 33
Silva, M., V. Oliveira, and V. Leal, 2017: Urban Form and Energy Demand. J. Plan. Lit., 32(4), 346–34 365, doi:10.1177/0885412217706900. 35
Silveti, D., and K. Andersson, 2019: Challenges of governing off-grid “Productive” sanitation in peri-36 urban areas: Comparison of case studies in Bolivia and South Africa. Sustain., 11(12), 3468, 37 doi:10.3390/SU11123468. 38
Simon, D. et al., 2016: Developing and testing the Urban Sustainable Development Goal’s targets and 39
ACCEPTED VERSION
SUBJECT TO FIN
AL EDITS
Final Government Distribution Chapter 8 IPCC AR6 WGIII
Do Not Cite, Quote or Distribute 8-147 Total pages: 157
indicators – a five-city study. Environ. Urban., 28(1), 49–63, doi:10.1177/0956247815619865. 1
Simpson, N. P., K. J. Simpson, C. D. Shearing, and L. R. Cirolia, 2019: Municipal finance and resilience 2 lessons for urban infrastructure management: a case study from the Cape Town drought. Int. J. 3 Urban Sustain. Dev., 11(3), 257–276, doi:10.1080/19463138.2019.1642203. 4
Simpson, N. P. et al., 2021: A framework for complex climate change risk assessment. One Earth, 4(4), 5 489–501, doi:10.1016/j.oneear.2021.03.005. 6
Singh, C., J. Ford, D. Ley, A. Bazaz, and A. Revi, 2020: Assessing the feasibility of adaptation options: 7 methodological advancements and directions for climate adaptation research and practice. Clim. 8 Change, 162(2), 255–277, doi:10.1007/s10584-020-02762-x. 9
Singh, M., and L. G., 2019: Forecasting of GHG emission and linear pinch analysis of municipal solid 10 waste for the city of Faridabad, India. Energy Sources, Part A Recover. Util. Environ. Eff., 41(22), 11 2704–2714, doi:10.1080/15567036.2019.1568642. 12
Sköld, B. et al., 2018: Household Preferences to Reduce Their Greenhouse Gas Footprint: A 13 Comparative Study from Four European Cities. Sustainability, 10(11), 4044, 14 doi:10.3390/su10114044. 15
Slorach, P. C., H. K. Jeswani, R. Cuéllar-Franca, and A. Azapagic, 2020: Environmental sustainability 16 in the food-energy-water-health nexus: A new methodology and an application to food waste in a 17 circular economy. Waste Manag., 113, 359–368, doi:10.1016/j.wasman.2020.06.012. 18
Smith, J. E., L. S. Heath, and C. M. Hoover, 2013: Carbon factors and models for forest carbon estimates 19 for the 2005–2011 National Greenhouse Gas Inventories of the United States. For. Ecol. Manage., 20 307, 7–19, doi:10.1016/j.foreco.2013.06.061. 21
Soares, F. R., and G. Martins, 2017: Using Life Cycle Assessment to Compare Environmental Impacts 22 of Different Waste to Energy Options for Sao Paulo’s Municipal Solid Waste. J. Solid Waste 23 Technol. Manag., 43(1), 36–46, doi:10.5276/JSWTM.2017.36. 24
Soilán, M., B. Riveiro, P. Liñares, and M. Padín-Beltrán, 2018: Automatic Parametrization and Shadow 25 Analysis of Roofs in Urban Areas from ALS Point Clouds with Solar Energy Purposes. ISPRS 26 Int. J. Geo-Information, 7(8), 301, doi:10.3390/ijgi7080301. 27
Solecki, W. et al., 2015: A conceptual framework for an urban areas typology to integrate climate 28 change mitigation and adaptation. Urban Clim., 14, 116–137, doi:10.1016/j.uclim.2015.07.001. 29
Sonter, L. J. et al., 2017: Mining drives extensive deforestation in the Brazilian Amazon. Nat. Commun., 30 8, 1013, doi:10.1038/s41467-017-00557-w. 31
Sorkin, M., 2018: Vertical Urbanism. In: Vertical Urbanism: Designing Compact Cities in China [Lin, 32 Z. and J.L.S. Gámez, (eds.)], Routledge, New York, pp. 73–82. 33
Sorknæs, P. et al., 2020: The benefits of 4th generation district heating in a 100% renewable energy 34 system. Energy, 213, 119030, doi:10.1016/j.energy.2020.119030. 35
Soukiazis, E., and S. Proença, 2020: The determinants of waste generation and recycling performance 36 across the Portuguese municipalities – A simultaneous equation approach. Waste Manag., 114, 37 321–330, doi:10.1016/j.wasman.2020.06.039. 38
Sovacool, B. K., and M. A. Brown, 2010: Twelve metropolitan carbon footprints: A preliminary 39 comparative global assessment. Energy Policy, 38(9), 4856–4869, 40
ACCEPTED VERSION
SUBJECT TO FIN
AL EDITS
Final Government Distribution Chapter 8 IPCC AR6 WGIII
Do Not Cite, Quote or Distribute 8-148 Total pages: 157
doi:10.1016/j.enpol.2009.10.001. 1
Sovacool, B. K. et al., 2020: Sustainable minerals and metals for a low-carbon future. Science, 2 367(6473), 30–33, doi:10.1126/science.aaz6003. 3
Srishantha, U., and U. Rathnayake, 2017: Sustainable urban drainage systems (SUDS) – What it is and 4 where do we stand today? Eng. Appl. Sci. Res., 44(4), 235–241, doi:10.14456/easr.2017.36. 5
State Government of Victoria, 2021: 20-minute neighbourhoods. Plan Melb. 2017 - 2050,. 6 https://www.planning.vic.gov.au/policy-and-strategy/planning-for-melbourne/plan-7 melbourne/20-minute-neighbourhoods (Accessed October 25, 2021). 8
Stern, P. C. et al., 2016: Opportunities and insights for reducing fossil fuel consumption by households 9 and organizations. Nat. Energy, 1, 16043, doi:10.1038/nenergy.2016.43. 10
Stevens, M. R., 2017: Does Compact Development Make People Drive Less? J. Am. Plan. Assoc., 11 83(1), 7–18, doi:10.1080/01944363.2016.1240044. 12
Stewart, I. D., C. A. Kennedy, A. Facchini, and R. Mele, 2018: The Electric City as a Solution to 13 Sustainable Urban Development. J. Urban Technol., 25(1), 3–20, 14 doi:10.1080/10630732.2017.1386940. 15
Stier, A. J., M. G. Berman, and L. M. A. Bettencourt, 2021: Early pandemic COVID-19 case growth 16 rates increase with city size. npj Urban Sustain., 1, 31, doi:10.1038/s42949-021-00030-0. 17
Stocchero, A., J. K. Seadon, R. Falshaw, and M. Edwards, 2017: Urban Equilibrium for sustainable 18 cities and the contribution of timber buildings to balance urban carbon emissions: A New Zealand 19 case study. J. Clean. Prod., 143, 1001–1010, doi:10.1016/j.jclepro.2016.12.020. 20
Stokes, E. C., and K. C. Seto, 2019: Characterizing urban infrastructural transitions for the Sustainable 21 Development Goals using multi-temporal land, population, and nighttime light data. Remote Sens. 22 Environ., 234(11), 111430, doi:10.1016/j.rse.2019.111430. 23
Strano, E., V. Nicosia, V. Latora, S. Porta, and M. Barthélemy, 2012: Elementary processes governing 24 the evolution of road networks. Sci. Reports 2012 21, 2, 296, doi:10.1038/srep00296. 25
Sudmant, A., J. Millward-Hopkins, S. Colenbrander, and A. Gouldson, 2016: Low carbon cities: is 26 ambitious action affordable? Clim. Change, 138(3–4), 681–688, doi:10.1007/s10584-016-1751-27 9. 28
Sudmant, A. et al., 2017: Understanding the case for low-carbon investment through bottom-up 29 assessments of city-scale opportunities. Clim. Policy, 17(3), 299–313, 30 doi:10.1080/14693062.2015.1104498. 31
Sudmant, A., A. Gouldson, J. Millward-Hopkins, K. Scott, and J. Barrett, 2018: Producer cities and 32 consumer cities: Using production- and consumption-based carbon accounts to guide climate 33 action in China, the UK, and the US. J. Clean. Prod., 176, 654–662, 34 doi:10.1016/j.jclepro.2017.12.139. 35
Sun, L., M. Fujii, T. Tasaki, H. Dong, and S. Ohnishi, 2018a: Improving waste to energy rate by 36 promoting an integrated municipal solid-waste management system. Resour. Conserv. Recycl., 37 136, 289–296, doi:10.1016/j.resconrec.2018.05.005. 38
Sun, L. et al., 2018b: A completive research on the feasibility and adaptation of shared transportation 39 in mega-cities – A case study in Beijing. Appl. Energy, 230, 1014–1033, 40
ACCEPTED VERSION
SUBJECT TO FIN
AL EDITS
Final Government Distribution Chapter 8 IPCC AR6 WGIII
Do Not Cite, Quote or Distribute 8-149 Total pages: 157
doi:10.1016/j.apenergy.2018.09.080. 1
Sung, H., and C. G. Choi, 2017: The link between metropolitan planning and transit-oriented 2 development: An examination of the Rosario Plan in 1980 for Seoul, South Korea. Land use 3 policy, 63, 514–522, doi:10.1016/j.landusepol.2017.01.045. 4
Susca, T., 2019: Green roofs to reduce building energy use? A review on key structural factors of green 5 roofs and their effects on urban climate. Build. Environ., 162, 106273, 6 doi:10.1016/j.buildenv.2019.106273. 7
Suzuki, H., J. Murakami, Y.-H. Hong, and B. Tamayose, 2015: Financing Transit-Oriented 8 Development with Land Values: Adapting Land Value Capture in Developing Countries. The 9 World Bank, Washington, DC, 30 pp. 10
Swilling, M. et al., 2018: The Weight of Cities: Resource Requirements of Future Urbanization. United 11 Nations Environment Programme (UNEP), Nairobi, Kenya, 280 pp. 12 https://www.resourcepanel.org/sites/default/files/documents/document/media/the_weight_of_citi13 es_full_report_english.pdf. 14
Syed, M. M., G. M. Morrison, and J. Darbyshire, 2020: Shared solar and battery storage configuration 15 effectiveness for reducing the grid reliance of apartment complexes. Energies, 13(18), 4820, 16 doi:10.3390/en13184820. 17
Tarigan, A. K. M., and S. Sagala, 2018: The pursuit of greenness: explaining low-carbon urban 18 transformation in Indonesia. Int. Plan. Stud., 23(4), 408–426, 19 doi:10.1080/13563475.2018.1513360. 20
Tarroja, B. et al., 2018: Translating climate change and heating system electrification impacts on 21 building energy use to future greenhouse gas emissions and electric grid capacity requirements in 22 California. Appl. Energy, 225, 522–534, doi:10.1016/j.apenergy.2018.05.003. 23
Tayarani, M., A. Poorfakhraei, R. Nadafianshahamabadi, and G. Rowangould, 2018: Can regional 24 transportation and land-use planning achieve deep reductions in GHG emissions from vehicles? 25 Transp. Res. Part D Transp. Environ., 63, 222–235, doi:10.1016/j.trd.2018.05.010. 26
Taylor, P. J., 1997: Hierarchical tendencies amongst world cities: A global research proposal. Cities, 27 14(6), 323–332, doi:10.1016/s0264-2751(97)00023-1. 28
Teferi, Z. A., and P. Newman, 2018: Slum Upgrading: Can the 1.5 °C Carbon Reduction Work with 29 SDGs in these Settlements? Urban Plan., 3(2), 52–63, doi:10.17645/up.v3i2.1239. 30
Tellman, B. et al., 2021: Satellite imaging reveals increased proportion of population exposed to floods. 31 Nature, 596, 80–86, doi:10.1038/s41586-021-03695-w. 32
Teske, S., T. Pregger, S. Simon, and T. Naegler, 2018: High renewable energy penetration scenarios 33 and their implications for urban energy and transport systems. Curr. Opin. Environ. Sustain., 30, 34 89–102, doi:10.1016/j.cosust.2018.04.007. 35
Thacker, S. et al., 2019: Infrastructure for sustainable development. Nat. Sustain., 2(4), 324–331, 36 doi:10.1038/s41893-019-0256-8. 37
Thanopoulos, S. et al., 2020: Analysis of Alternative MSW Treatment Technologies with the Aim of 38 Energy Recovery in the Municipality of Vari-Voula-Vouliagmeni. Waste and Biomass 39 Valorization, 11(4), 1585–1601, doi:10.1007/s12649-018-0388-5. 40
ACCEPTED VERSION
SUBJECT TO FIN
AL EDITS
Final Government Distribution Chapter 8 IPCC AR6 WGIII
Do Not Cite, Quote or Distribute 8-150 Total pages: 157
Thellufsen, J. Z. et al., 2020: Smart energy cities in a 100% renewable energy context. Renew. Sustain. 1 Energy Rev., 129, 109922, doi:10.1016/j.rser.2020.109922. 2
Thomson, G., and P. Newman, 2018: Urban fabrics and urban metabolism – from sustainable to 3 regenerative cities. Resour. Conserv. Recycl., 132, 218–229, 4 doi:10.1016/j.resconrec.2017.01.010. 5
Tiefenbeck, V., A. Wörner, S. Schöb, E. Fleisch, and T. Staake, 2019: Real-time feedback promotes 6 energy conservation in the absence of volunteer selection bias and monetary incentives. Nat. 7 Energy, 4, 35–41, doi:10.1038/s41560-018-0282-1. 8
Tomić, T., and D. R. Schneider, 2020: Circular economy in waste management – Socio-economic effect 9 of changes in waste management system structure. J. Environ. Manage., 267, 110564, 10 doi:10.1016/j.jenvman.2020.110564. 11
Tong, K., A. S. Nagpure, and A. Ramaswami, 2021: All urban areas’ energy use data across 640 districts 12 in India for the year 2011. Sci. Data 2021 81, 8, 104, doi:10.1038/s41597-021-00853-7. 13
Tong, X., T. Wang, and W. Wang, 2017: Impact of Mixed Function Community on Distributed 14 Photovoltaic Application. Yingyong Jichu yu Gongcheng Kexue Xuebao/Journal Basic Sci. Eng., 15 25(4), 793–804, doi:10.16058/j.issn.1005-0930.2017.04.014. 16
Tongwane, M., S. Piketh, L. Stevens, and T. Ramotubei, 2015: Greenhouse gas emissions from road 17 transport in South Africa and Lesotho between 2000 and 2009. Transp. Res. Part D Transp. 18 Environ., 37, 1–13, doi:10.1016/j.trd.2015.02.017. 19
Topi, C., E. Esposto, and V. Marini Govigli, 2016: The economics of green transition strategies for 20 cities: Can low carbon, energy efficient development approaches be adapted to demand side urban 21 water efficiency? Environ. Sci. Policy, 58, 74–82, doi:10.1016/j.envsci.2016.01.001. 22
Trundle, A., 2020: Resilient cities in a Sea of Islands: Informality and climate change in the South 23 Pacific. Cities, 97, 102496, doi:10.1016/j.cities.2019.102496. 24
Tsavdaroglou, M., S. H. S. Al-Jibouri, T. Bles, and J. I. M. Halman, 2018: Proposed methodology for 25 risk analysis of interdependent critical infrastructures to extreme weather events. Int. J. Crit. 26 Infrastruct. Prot., 21, 57–71, doi:10.1016/j.ijcip.2018.04.002. 27
Tuomisto, J. T. et al., 2015: Building-related health impacts in European and Chinese cities: a scalable 28 assessment method. Environ. Heal., 14, 93, doi:10.1186/s12940-015-0082-z. 29
Turnbull, J. C. et al., 2019: Synthesis of Urban CO2 Emission Estimates from Multiple Methods from 30 the Indianapolis Flux Project (INFLUX). Environ. Sci. Technol., 53(1), 287–295, 31 doi:10.1021/acs.est.8b05552. 32
Turner, A. J. et al., 2020: Observed Impacts of COVID-19 on Urban CO2 Emissions. Geophys. Res. 33 Lett., 47(22), e2020GL090037, doi:10.1029/2020GL090037. 34
Tyfield, D., 2014: Putting the Power in ‘Socio-Technical Regimes’’ – E-Mobility Transition in China 35 as Political Process.’ Mobilities, 9(4), 585–603, doi:10.1080/17450101.2014.961262. 36
UN DESA, 2019: World Urbanization Prospects: The 2018 Revision. United Nations Department of 37 Economic and Social Affairs (UN DESA) Population Division, New York, 126 pp. 38 https://population.un.org/wup/ (Accessed July 8, 2019). 39
UNEP, 2019: Global Environment Outlook - GEO 6: Healthy Planet, Healthy People. Cambridge 40
ACCEPTED VERSION
SUBJECT TO FIN
AL EDITS

Final Government Distribution Chapter 8 IPCC AR6 WGIII
Do Not Cite, Quote or Distribute 8-151 Total pages: 157
University Press, Nairobi, 710 pp. 1
UNEP, 2021: Emissions Gap Report 2021: The Heat Is On – A World of Climate Promises Not Yet 2 Delivered – Executive Summary. United Nations Environment Programme (UNEP), Nairobi, 20 3 pp. 4
UNEP, and IRP, 2020: Resource Efficiency and Climate Change: Material Efficiency Strategies for a 5 Low-Carbon Future, A report of the International Resource Panel. International Resource Panel 6 (IRP), Nairobi, Kenya, 157 pp. https://www.resourcepanel.org/reports/resource-efficiency-and-7 climate-change. 8
UNFCCC, 2015: Report of the Conference of the Parties on its Twenty-First Session, Held in Paris 9 from 30 November to 13 December 2015 and Action Taken by the Conference of the Parties at its 10 Twenty-First Session, (Paris Agreement). United Nations General Assembly, Paris. 11
United Nations, 2015: Transforming our world: The 2030 agenda for sustainable development. United 12 Nations General Assembly, New York, 35 pp. 13 https://www.un.org/ga/search/view_doc.asp?symbol=A/RES/70/1&Lang=E. 14
United Nations, 2017: New Urban Agenda, A/RES/71/256. Habitat III and United Nations, New York, 15 66 pp. http://habitat3.org/wp-content/uploads/NUA-English.pdf. 16
United Nations, 2018: Report of the Special Rapporteur on adequate housing as a component of the 17 right to an adequate standard of living, and on the right to non-discrimination in this context. 18 United Nations General Assembly, New York. 19
United Nations, 2019: Sustainable Development Goals (SDGs). Sustain. Dev. Goals Knowl. Platf.,. 20 https://sustainabledevelopment.un.org/sdgs (Accessed October 11, 2021). 21
Ürge-Vorsatz, D. et al., 2018: Locking in positive climate responses in cities. Nat. Clim. Chang., 8(3), 22 174–177, doi:10.1038/s41558-018-0100-6. 23
Ürge-Vorsatz, D. et al., 2020: Advances Toward a Net-Zero Global Building Sector. Annu. Rev. 24 Environ. Resour., 45, 227–269, doi:10.1146/annurev-environ-012420-045843. 25
USGCRP, 2018: Second State of the Carbon Cycle Report (SOCCR2): A Sustained Assessment Report. 26 US Global Change Research Program (USGCRP), Washington, DC, 878 pp. 27 https://carbon2018.globalchange.govhttps//carbon2018.globalchange.gov/chapter/4. 28
Valek, A. M., J. Sušnik, and S. Grafakos, 2017: Quantification of the urban water-energy nexus in 29 México City, México, with an assessment of water-system related carbon emissions. Sci. Total 30 Environ., 590–591, 258–268, doi:10.1016/J.SCITOTENV.2017.02.234. 31
Valente de Macedo, L., J. Setzer, and F. Rei, 2016: Transnational Action Fostering Climate Protection 32 in the City of São Paulo and Beyond. disP - Plan. Rev., 52(2), 35–44, 33 doi:10.1080/02513625.2016.1195582. 34
van de Ven, D. J., M. González-Eguino, and I. Arto, 2018: The potential of behavioural change for 35 climate change mitigation: a case study for the European Union. Mitig. Adapt. Strateg. Glob. 36 Chang., 23(6), 853–886, doi:10.1007/s11027-017-9763-y. 37
van den Bosch, M., and Å. Ode Sang, 2017: Urban natural environments as nature-based solutions for 38 improved public health – A systematic review of reviews. Environ. Res., 158, 373–384, 39 doi:10.1016/j.envres.2017.05.040. 40
ACCEPTED VERSION
SUBJECT TO FIN
AL EDITS
Final Government Distribution Chapter 8 IPCC AR6 WGIII
Do Not Cite, Quote or Distribute 8-152 Total pages: 157
van der Heijden, J., 2018: City and subnational governance: high ambitions, innovative instruments and 1 polycentric collaborations? In: Governing Climate Change: Polycentricity in Action? [Jordan, A., 2 D. Huitema, H. Van Asselt, and J. Forster, (eds.)], Cambridge University Press, Cambridge, pp. 3 81–96. 4
van der Heijden, J., and S.-H. Hong, 2021: Urban Climate Governance Experimentation in Seoul: 5 Science, Politics, or a Little of Both? Urban Aff. Rev., 57(4), 1115–1148, 6 doi:10.1177/1078087420911207. 7
van der Zwaan, B., T. Kober, F. D. Longa, A. van der Laan, and G. Jan Kramer, 2018: An integrated 8 assessment of pathways for low-carbon development in Africa. Energy Policy, 117, 387–395, 9 doi:10.1016/j.enpol.2018.03.017. 10
van Vliet, J., 2019: Direct and indirect loss of natural area from urban expansion. Nat. Sustain., 2(8), 11 755–763, doi:10.1038/s41893-019-0340-0. 12
van Vliet, J., D. A. Eitelberg, and P. H. Verburg, 2017: A global analysis of land take in cropland areas 13 and production displacement from urbanization. Glob. Environ. Chang., 43, 107–115, 14 doi:10.1016/j.gloenvcha.2017.02.001. 15
van Vuuren, D. P. et al., 2014: A new scenario framework for Climate Change Research: scenario 16 matrix architecture. Clim. Change, 122(3), 373–386, doi:10.1007/s10584-013-0906-1. 17
van Vuuren, D. P. et al., 2017a: The Shared Socio-economic Pathways: Trajectories for human 18 development and global environmental change. Glob. Environ. Chang., 42, 148–152, 19 doi:10.1016/j.gloenvcha.2016.10.009. 20
van Vuuren, D. P. et al., 2017b: Energy, land-use and greenhouse gas emissions trajectories under a 21 green growth paradigm. Glob. Environ. Chang., 42, 237–250, 22 doi:10.1016/j.gloenvcha.2016.05.008. 23
Vanham, D., B. M. Gawlik, and G. Bidoglio, 2017: Food consumption and related water resources in 24 Nordic cities. Ecol. Indic., 74, 119–129, doi:10.1016/j.ecolind.2016.11.019. 25
Vedel, S. E., J. B. Jacobsen, and H. Skov-Petersen, 2017: Bicyclists’ preferences for route 26 characteristics and crowding in Copenhagen – A choice experiment study of commuters. Transp. 27 Res. Part A Policy Pract., 100, 53–64, doi:10.1016/j.tra.2017.04.006. 28
Vedeld, T., H. Hofstad, H. Solli, and G. S. Hanssen, 2021: Polycentric urban climate governance: 29 Creating synergies between integrative and interactive governance in Oslo. Environ. Policy Gov., 30 31(4), 347–360, doi:10.1002/eet.1935. 31
Venkatachary, S. K., J. Prasad, and R. Samikannu, 2018: Barriers to implementation of smart grids and 32 virtual power plant in sub-saharan region—focus Botswana. Energy Reports, 4, 119–128, 33 doi:10.1016/j.egyr.2018.02.001. 34
Veuger, J., 2017: Attention to Disruption and Blockchain Creates a Viable Real Estate Economy. J. US-35 China Public Adm., 14(5), 263–285, doi:10.17265/1548-6591/2017.05.003. 36
Viguié, V., and S. Hallegatte, 2012: Trade-offs and synergies in urban climate policies. Nat. Clim. 37 Chang., 2(5), 334–337, doi:10.1038/nclimate1434. 38
Viguié, V. et al., 2020: Early adaptation to heat waves and future reduction of air-conditioning energy 39 use in Paris. Environ. Res. Lett., 15(7), 75006, doi:10.1088/1748-9326/ab6a24. 40
ACCEPTED VERSION
SUBJECT TO FIN
AL EDITS
Final Government Distribution Chapter 8 IPCC AR6 WGIII
Do Not Cite, Quote or Distribute 8-153 Total pages: 157
Votsis, A., 2017: Planning for green infrastructure: The spatial effects of parks, forests, and fields on 1 Helsinki’s apartment prices. Ecol. Econ., 132, 279–289, doi:10.1016/j.ecolecon.2016.09.029. 2
Vujcic, M. et al., 2017: Nature based solution for improving mental health and well-being in urban 3 areas. Environ. Res., 158, 385–392, doi:10.1016/j.envres.2017.06.030. 4
Wachs, L., and S. Singh, 2018: A modular bottom-up approach for constructing physical input–output 5 tables (PIOTs) based on process engineering models. J. Econ. Struct., 7, 26, doi:10.1186/s40008-6 018-0123-1. 7
Waheed, R., D. Chang, S. Sarwar, and W. Chen, 2018: Forest, agriculture, renewable energy, and CO2 8 emission. J. Clean. Prod., 172, 4231–4238, doi:10.1016/j.jclepro.2017.10.287. 9
Walters, L., and L. P. Gaunter, 2017: Sharing the Wealth: Private Land Value and Public Benefit. In: 10 Finance for City Leaders, 2nd Edition [Kamiya, M. and L.-Y. Zhang, (eds.)], UN-Habitat, 11 Nairobi, pp. 192–215. 12
Wamsler, C., and S. Pauleit, 2016: Making headway in climate policy mainstreaming and ecosystem-13 based adaptation: two pioneering countries, different pathways, one goal. Clim. Change, 137(1–14 2), 71–87, doi:10.1007/s10584-016-1660-y. 15
Wang, M., M. Madden, and X. Liu, 2017: Exploring the Relationship between Urban Forms and CO2 16 Emissions in 104 Chinese Cities. J. Urban Plan. Dev., 143(4), 04017014, 17 doi:10.1061/(ASCE)UP.1943-5444.0000400. 18
Wang, Q., X. Wang, and R. Li, 2022: Does urbanization redefine the environmental Kuznets curve? An 19 empirical analysis of 134 Countries. Sustain. Cities Soc., 76, 103382, 20 doi:10.1016/J.SCS.2021.103382. 21
Wang, S., and B. Chen, 2016: Energy–water nexus of urban agglomeration based on multiregional 22 input–output tables and ecological network analysis: A case study of the Beijing–Tianjin–Hebei 23 region. Appl. Energy, 178, 773–783, doi:10.1016/j.apenergy.2016.06.112. 24
Wang, Y. et al., 2016: Does urbanization lead to more carbon emission? Evidence from a panel of 25 BRICS countries. Appl. Energy, 168, 375–380, doi:10.1016/J.APENERGY.2016.01.105. 26
Wappelhorst, S., D. Hall, M. Nicholas, and N. Lutsey, 2020: Analyzing Policies to Grow the Electric 27 Vehicle Market in European Cities. International Council on Clean Transportation (ICCT), Berlin, 28 43 pp. https://theicct.org/publications/electric-vehicle-policies-eu-cities. 29
Ward, E. B., C. C. Pregitzer, S. E. Kuebbing, and M. A. Bradford, 2020: Invasive lianas are drivers of 30 and passengers to altered soil nutrient availability in urban forests. Biol. Invasions, 22(3), 935–31 955, doi:10.1007/s10530-019-02134-2. 32
WCRP, 2019: Extended Version: Global Research and Action Agenda on Cities and Climate Change 33 Science. [Prieur-Richard, A.-H. et al., (eds.)]. World Climate Research Programme (WCRP), 34 Edmonton, 31 pp. 35
Webb, R. et al., 2018: Sustainable urban systems: Co-design and framing for transformation. Ambio, 36 47, 57–77, doi:10.1007/s13280-017-0934-6. 37
Wei, T., J. Wu, and S. Chen, 2021: Keeping Track of Greenhouse Gas Emission Reduction Progress 38 and Targets in 167 Cities Worldwide. Front. Sustain. Cities, 3, 64, doi:10.3389/frsc.2021.696381. 39
Weimann, A., and T. Oni, 2019: A Systematised Review of the Health Impact of Urban Informal 40
ACCEPTED VERSION
SUBJECT TO FIN
AL EDITS
Final Government Distribution Chapter 8 IPCC AR6 WGIII
Do Not Cite, Quote or Distribute 8-154 Total pages: 157
Settlements and Implications for Upgrading Interventions in South Africa, a Rapidly Urbanising 1 Middle-Income Country. Int. J. Environ. Res. Public Health, 16(19), 3608, 2 doi:10.3390/ijerph16193608. 3
Weng, M. et al., 2019: The 15-minute walkable neighborhoods: Measurement, social inequalities and 4 implications for building healthy communities in urban China. J. Transp. Heal., 13, 259–273, 5 doi:10.1016/j.jth.2019.05.005. 6
Westman, L., and V. C. Broto, 2018: Climate governance through partnerships: A study of 150 urban 7 initiatives in China. Glob. Environ. Chang., 50, 212–221, doi:10.1016/j.gloenvcha.2018.04.008. 8
Westphal, M. I., S. Martin, L. Zhou, D. Satterthwaite, and S. M. R. Philanthropies, 2017: Powering 9 Cities in the Global South: How Energy Access for All Benefits the Economy and the Environment. 10 World Resources Institute (WRI), Washington, DC, 55 pp. https://files.wri.org/s3fs-11 public/powering-cities-in-the-global-south.pdf. (Accessed December 18, 2020). 12
Whetstone, J. R., 2018: Advances in urban greenhouse gas flux quantification: The Indianapolis Flux 13 Experiment (INFLUX). Elem Sci Anth, 6, 24, doi:10.1525/elementa.282. 14
White, R., and S. Wahba, 2019: Addressing constraints to private financing of urban (climate) 15 infrastructure in developing countries. Int. J. Urban Sustain. Dev., 11(3), 245–256, 16 doi:10.1080/19463138.2018.1559970. 17
Widerberg, O., and P. Pattberg, 2015: International Cooperative Initiatives in Global Climate 18 Governance: Raising the Ambition Level or Delegitimizing the UNFCCC? Glob. Policy, 6(1), 19 45–56, doi:10.1111/1758-5899.12184. 20
Wiedmann, T., and J. Minx, 2008: A Definition of ‘Carbon Footprint.’ In: Ecological Economics 21 Research Trends, Nova Science Publishers, Hauppauge NY, USA, pp. 1–11. 22
Wiedmann, T. et al., 2021: Three-scope carbon emission inventories of global cities. J. Ind. Ecol., 25(3), 23 735–750, doi:10.1111/jiec.13063. 24
Wiedmann, T. O., G. Chen, and J. Barrett, 2016: The Concept of City Carbon Maps: A Case Study of 25 Melbourne, Australia. J. Ind. Ecol., 20(4), 676–691, doi:10.1111/jiec.12346. 26
Wiktorowicz, J. et al., 2018: WGV: An Australian Urban Precinct Case Study to Demonstrate the 1.5 27 °C Agenda Including Multiple SDGs. Urban Plan., 3(2), 64–81, doi:10.17645/up.v3i2.1245. 28
Winbourne, J. B. et al., 2020: Tree Transpiration and Urban Temperatures: Current Understanding, 29 Implications, and Future Research Directions. Bioscience, 70(7), 576–588, 30 doi:10.1093/biosci/biaa055. 31
WMO, 2021: State of the Global Climate 2021: WMO Provisional Report. 47 pp. 32 https://library.wmo.int/doc_num.php?explnum_id=10859. 33
Wolman, A., 1965: The Metabolism of Cities. Sci. Am., 213(3), 178–190, 34 doi:10.1038/scientificamerican0965-178. 35
Wong, N. H., C. L. Tan, D. D. Kolokotsa, and H. Takebayashi, 2021: Greenery as a mitigation and 36 adaptation strategy to urban heat. Nat. Rev. Earth Environ., 2(3), 166–181, doi:10.1038/s43017-37 020-00129-5. 38
Woodall, C. W. et al., 2013: Biomass and carbon attributes of downed woody materials in forests of the 39 United States. For. Ecol. Manage., 305, 48–59, doi:10.1016/j.foreco.2013.05.030. 40
ACCEPTED VERSION
SUBJECT TO FIN
AL EDITS
Final Government Distribution Chapter 8 IPCC AR6 WGIII
Do Not Cite, Quote or Distribute 8-155 Total pages: 157
World Bank, CIESIN, and Columbia University, 2013: Urban land area. 1 https://data.worldbank.org/indicator/AG.LND.TOTL.UR.K2 (Accessed January 7, 2020). 2
Wu, D., J. C. Lin, T. Oda, and E. A. Kort, 2020a: Space-based quantification of per capita CO2 3 emissions from cities. Environ. Res. Lett., 15(3), 035004, doi:10.1088/1748-9326/ab68eb. 4
Wu, H., L. Wang, Z. Zhang, and J. Gao, 2021: Analysis and optimization of 15-minute community life 5 circle based on supply and demand matching: A case study of Shanghai. PLoS One, 16(8), 6 e0256904, doi:10.1371/journal.pone.0256904. 7
Wu, L. et al., 2016: What would dense atmospheric observation networks bring to the quantification of 8 city CO2 emissions? Atmos. Chem. Phys., 16(12), 7743–7771, doi:10.5194/acp-16-7743-2016. 9
Wu, Q., H. Ren, W. Gao, P. Weng, and J. Ren, 2018: Coupling optimization of urban spatial structure 10 and neighborhood-scale distributed energy systems. Energy, 144, 472–481, 11 doi:10.1016/j.energy.2017.12.076. 12
Wu, X., R. C. Nethery, M. B. Sabath, D. Braun, and F. Dominici, 2020b: Air pollution and COVID-19 13 mortality in the United States: Strengths and limitations of an ecological regression analysis. Sci. 14 Adv., 6(45), eabd4049, doi:10.1126/sciadv.abd4049. 15
Wynes, S., K. A. Nicholas, J. Zhao, and S. D. Donner, 2018: Measuring what works: quantifying 16 greenhouse gas emission reductions of behavioural interventions to reduce driving, meat 17 consumption, and household energy use. Environ. Res. Lett., 13(11), 113002, doi:10.1088/1748-18 9326/aae5d7. 19
Xi, F. et al., 2016: Substantial global carbon uptake by cement carbonation. Nat. Geosci., 9(12), 880–20 883, doi:10.1038/ngeo2840. 21
Xu, L. et al., 2019: Identifying the trade-offs between climate change mitigation and adaptation in urban 22 land use planning: An empirical study in a coastal city. Environ. Int., 133, 105162, 23 doi:10.1016/j.envint.2019.105162. 24
Xu, Q., Y. Dong, and R. Yang, 2018a: Urbanization impact on carbon emissions in the Pearl River 25 Delta region: Kuznets curve relationships. J. Clean. Prod., 180, 514–523, 26 doi:10.1016/j.jclepro.2018.01.194. 27
Xu, Q., Y. Dong, and R. Yang, 2018b: Influence of the geographic proximity of city features on the 28 spatial variation of urban carbon sinks: A case study on the Pearl River Delta. Environ. Pollut., 29 243, 354–363, doi:10.1016/j.envpol.2018.08.083. 30
Xu, Q., X. Zheng, and C. Zhang, 2018c: Quantitative Analysis of the Determinants Influencing Urban 31 Expansion: A Case Study in Beijing, China. Sustainability, 10(5), 1630, doi:10.3390/su10051630. 32
Xue, Y. et al., 2017: Transport Emissions and Energy Consumption Impacts of Private Capital 33 Investment in Public Transport. Sustainability, 9(10), 1760, doi:10.3390/su9101760. 34
Yadav, V. et al., 2021: The Impact of COVID‐19 on CO2 Emissions in the Los Angeles and Washington 35 DC/Baltimore Metropolitan Areas. Geophys. Res. Lett., 48(11), e2021GL, 36 doi:10.1029/2021GL092744. 37
Yamagata, Y. et al., 2020: Chapter 2 - Urban systems and the role of big data. In: Urban Systems 38 Design: Creating Sustainable Smart Cities in the Internet of Things Era [Yamagata, Y. and P.P.J. 39 Yang, (eds.)], Elsevier, Amsterdam, pp. 23–58. 40
ACCEPTED VERSION
SUBJECT TO FIN
AL EDITS
Final Government Distribution Chapter 8 IPCC AR6 WGIII
Do Not Cite, Quote or Distribute 8-156 Total pages: 157
Yang, D., L. Xu, X. Gao, Q. Guo, and N. Huang, 2018: Inventories and reduction scenarios of urban 1 waste-related greenhouse gas emissions for management potential. Sci. Total Environ., 626, 727–2 736, doi:10.1016/j.scitotenv.2018.01.110. 3
Yang, X., and R. Li, 2018: Investigating low-carbon city: Empirical study of Shanghai. Sustain., 10(4), 4 1054, doi:10.3390/su10041054. 5
Yazdanie, M., and K. Orehounig, 2021: Advancing urban energy system planning and modeling 6 approaches: Gaps and solutions in perspective. Renew. Sustain. Energy Rev., 137, 110607, 7 doi:10.1016/j.rser.2020.110607. 8
Yi, Y., S. Ma, W. Guan, and K. Li, 2017: An empirical study on the relationship between urban spatial 9 form and CO2 in Chinese cities. Sustain., 9(4), 672, doi:10.3390/su9040672. 10
Yu, Y., and W. Zhang, 2016: Greenhouse gas emissions from solid waste in Beijing: The rising trend 11 and the mitigation effects by management improvements. Waste Manag. Res., 34(4), 368–377, 12 doi:10.1177/0734242X16628982. 13
Zaman, A., and T. Ahsan, 2019: Zero-Waste: Reconsidering Waste Management for the Future. 1st ed. 14 Routledge, London, 234 pp. 15
Zaman, A. U., and S. Lehmann, 2013: The zero waste index: A performance measurement tool for 16 waste management systems in a “zero waste city.” J. Clean. Prod., 50, 123–132, 17 doi:10.1016/j.jclepro.2012.11.041. 18
Zhai, Y. et al., 2020: Is energy the key to pursuing clean air and water at the city level? A case study of 19 Jinan City, China. Renew. Sustain. Energy Rev., 134, 110353, doi:10.1016/j.rser.2020.110353. 20
Zhan, C., and M. de Jong, 2018: Financing eco cities and low carbon cities: The case of Shenzhen 21 International Low Carbon City. J. Clean. Prod., 180, 116–125, 22 doi:10.1016/J.JCLEPRO.2018.01.097. 23
Zhan, C., M. de Jong, and H. de Bruijn, 2018a: Funding sustainable cities: A comparative study of Sino-24 Singapore Tianjin Eco-City and Shenzhen International Low-Carbon City. Sustain., 10(11), 25 doi:10.3390/su10114256. 26
Zhan, J., W. Liu, F. Wu, Z. Li, and C. Wang, 2018b: Life cycle energy consumption and greenhouse 27 gas emissions of urban residential buildings in Guangzhou city. J. Clean. Prod., 194, 318–326, 28 doi:10.1016/j.jclepro.2018.05.124. 29
Zhang, F., C. K. L. Chung, and Z. Yin, 2020: Green infrastructure for China’s new urbanisation: A case 30 study of greenway development in Maanshan. Urban Stud., 57(3), 508–524, 31 doi:10.1177/0042098018822965. 32
Zhang, H., C. Wu, W. Chen, and G. Huang, 2019: Effect of urban expansion on summer rainfall in the 33 Pearl River Delta, South China. J. Hydrol., 568, 747–757, doi:10.1016/j.jhydrol.2018.11.036. 34
Zhang, J., and F. Li, 2017: Energy consumption and low carbon development strategies of three global 35 cities in Asian developing countries. J. Renew. Sustain. Energy, 9(2), 021402, 36 doi:10.1063/1.4978467. 37
Zhang, N., K. Yu, and Z. Chen, 2017: How does urbanization affect carbon dioxide emissions? A cross-38 country panel data analysis. Energy Policy, 107, 678–687, doi:10.1016/j.enpol.2017.03.072. 39
Zhang, R., and S. Fujimori, 2020: The role of transport electrification in global climate change 40
ACCEPTED VERSION
SUBJECT TO FIN
AL EDITS
Final Government Distribution Chapter 8 IPCC AR6 WGIII
Do Not Cite, Quote or Distribute 8-157 Total pages: 157
mitigation scenarios. Environ. Res. Lett., 15(3), 034019, doi:10.1088/1748-9326/ab6658. 1
Zhang, Y., X. Bai, F. P. Mills, and J. C. V. V Pezzey, 2018: Rethinking the role of occupant behavior 2 in building energy performance: A review. Energy Build., 172, 279–294, 3 doi:10.1016/J.ENBUILD.2018.05.017. 4
Zhao, G., J. M. Guerrero, K. Jiang, and S. Chen, 2017a: Energy modelling towards low carbon 5 development of Beijing in 2030. Energy, 121, 107–113, doi:10.1016/j.energy.2017.01.019. 6
Zhao, S. X., N. S. Guo, C. L. K. Li, and C. Smith, 2017b: Megacities, the World’s Largest Cities 7 Unleashed: Major Trends and Dynamics in Contemporary Global Urban Development. World 8 Dev., 98, 257–289, doi:10.1016/j.worlddev.2017.04.038. 9
Zheng, B. et al., 2018: Infrastructure Shapes Differences in the Carbon Intensities of Chinese Cities. 10 Environ. Sci. Technol., 52(10), 6032–6041, doi:10.1021/acs.est.7b05654. 11
Zheng, B. et al., 2020: Satellite-based estimates of decline and rebound in China’s CO2 emissions 12 during COVID-19 pandemic. Sci. Adv., 6(49), eabd4998, doi:10.1126/SCIADV.ABD4998. 13
Zheng, X., Y. Zou, A. W. Lounsbury, C. Wang, and R. Wang, 2021: Green roofs for stormwater runoff 14 retention: A global quantitative synthesis of the performance. Resour. Conserv. Recycl., 170, 15 105577, doi:10.1016/j.resconrec.2021.105577. 16
Zhou, C., S. Wang, and J. Wang, 2019: Examining the influences of urbanization on carbon dioxide 17 emissions in the Yangtze River Delta, China: Kuznets curve relationship. Sci. Total Environ., 675, 18 472–482, doi:10.1016/J.SCITOTENV.2019.04.269. 19
Zscheischler, J. et al., 2018: Future climate risk from compound events. Nat. Clim. Chang., 8(6), 469–20 477, doi:10.1038/s41558-018-0156-3. 21
22
ACCEPTED VERSION
SUBJECT TO FIN
AL EDITS
Related Documents