Chapter 8 - 1 ISSUES TO ADDRESS... • How do cracks that lead to failure form? • How is fracture resistance quantified? How do the fracture resistances of the different material classes compare? • How do we estimate the stress to fracture? • How do loading rate, loading history, and temperature affect the failure behavior of materials? Ship-cyclic loading from waves. Computer chip-cyclic thermal loading. Hip implant-cyclic loading from walking. Adapted from Fig. 22.30(b), Callister 7e. (Fig. 22.30(b) is courtesy of National Semiconductor Corporation.) Adapted from Fig. 22.26(b), Callister 7e. Chapter 8: Mechanical Failure Adapted from chapter-opening photograph, Chapter 8, Callister & Rethwisch 8e. (by Neil Boenzi, The New York Times.)

Welcome message from author
This document is posted to help you gain knowledge. Please leave a comment to let me know what you think about it! Share it to your friends and learn new things together.
Transcript
Chapter 8 - 1
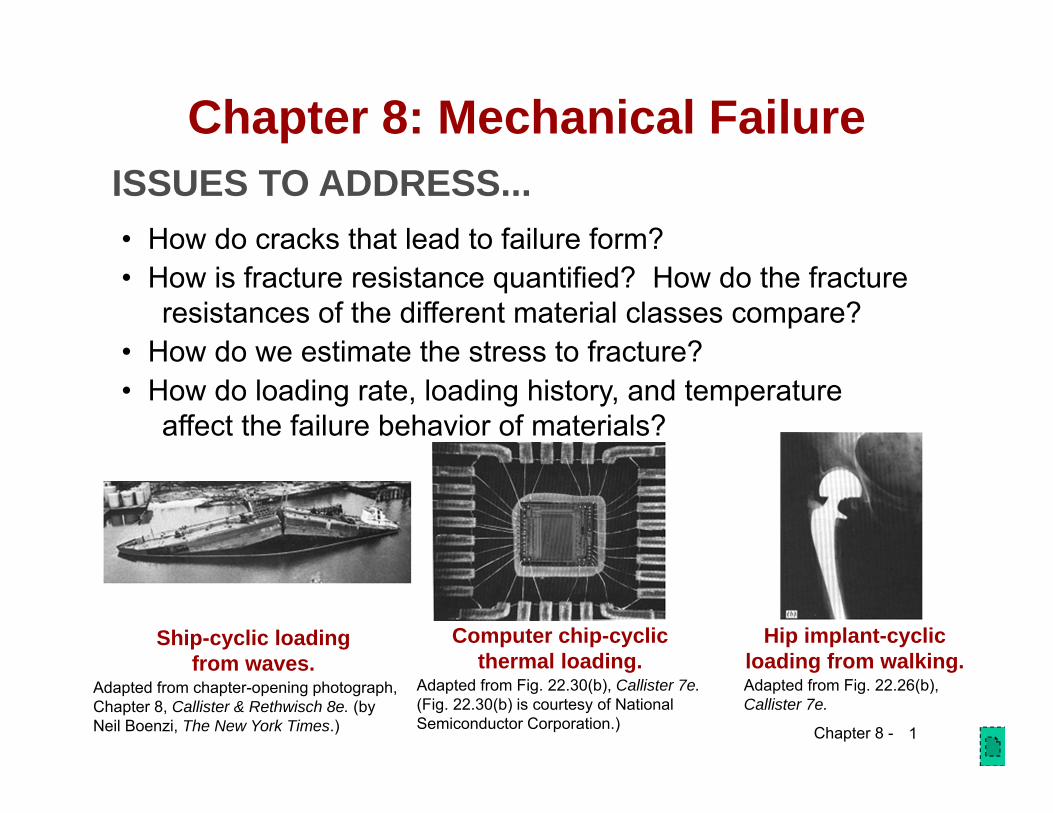
ISSUES TO ADDRESS...• How do cracks that lead to failure form?• How is fracture resistance quantified? How do the fracture
resistances of the different material classes compare?• How do we estimate the stress to fracture?• How do loading rate, loading history, and temperature
affect the failure behavior of materials?
Ship-cyclic loadingfrom waves.
Computer chip-cyclicthermal loading.
Hip implant-cyclicloading from walking.
Adapted from Fig. 22.30(b), Callister 7e.(Fig. 22.30(b) is courtesy of National Semiconductor Corporation.)
Adapted from Fig. 22.26(b), Callister 7e.
Chapter 8: Mechanical Failure
Adapted from chapter-opening photograph, Chapter 8, Callister & Rethwisch 8e. (by Neil Boenzi, The New York Times.)

Chapter 8 - 2
Chapter 8 - 3
Fracture mechanisms• Ductile fracture
– Accompanied by significant plastic deformation
• Brittle fracture– Little or no plastic deformation– Catastrophic
Chapter 8 - 4
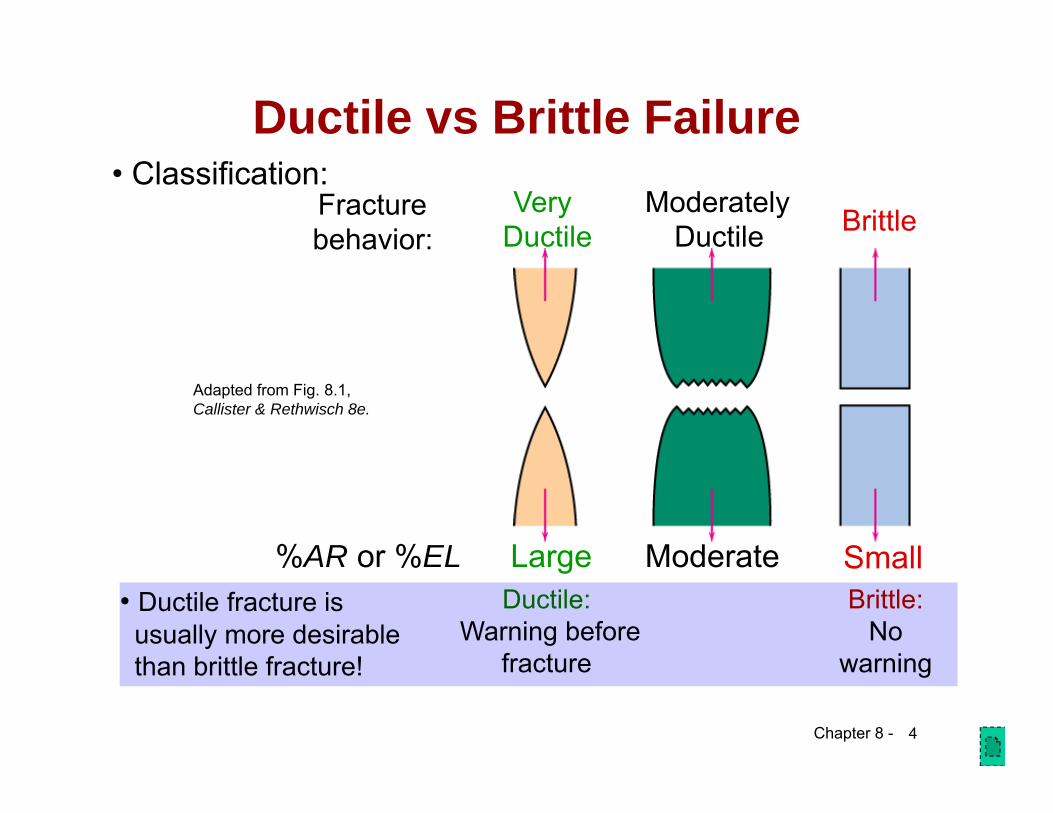
Ductile vs Brittle FailureVery
DuctileModerately
Ductile BrittleFracturebehavior:
Large Moderate%AR or %EL Small• Ductile fracture is usually more desirable than brittle fracture!
Adapted from Fig. 8.1, Callister & Rethwisch 8e.
• Classification:
Ductile:Warning before
fracture
Brittle:No
warning

Chapter 8 - 5
• Ductile failure:-- one piece-- large deformation
Figures from V.J. Colangelo and F.A. Heiser, Analysis of Metallurgical Failures(2nd ed.), Fig. 4.1(a) and (b), p. 66 John Wiley and Sons, Inc., 1987. Used with permission.
Example: Pipe Failures
• Brittle failure:-- many pieces-- small deformations
Chapter 8 - 6
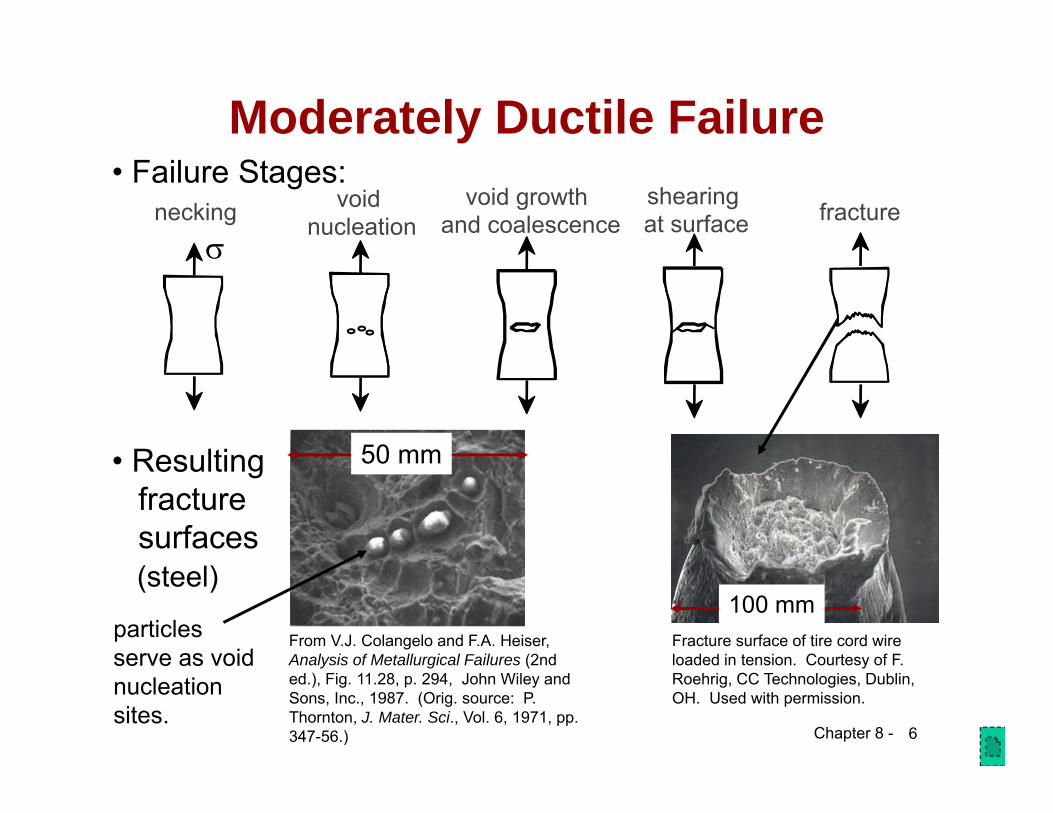
• Resultingfracturesurfaces(steel)
50 mm
particlesserve as voidnucleationsites.
50 mm
From V.J. Colangelo and F.A. Heiser, Analysis of Metallurgical Failures (2nd ed.), Fig. 11.28, p. 294, John Wiley and Sons, Inc., 1987. (Orig. source: P. Thornton, J. Mater. Sci., Vol. 6, 1971, pp. 347-56.)
100 mmFracture surface of tire cord wire loaded in tension. Courtesy of F. Roehrig, CC Technologies, Dublin, OH. Used with permission.
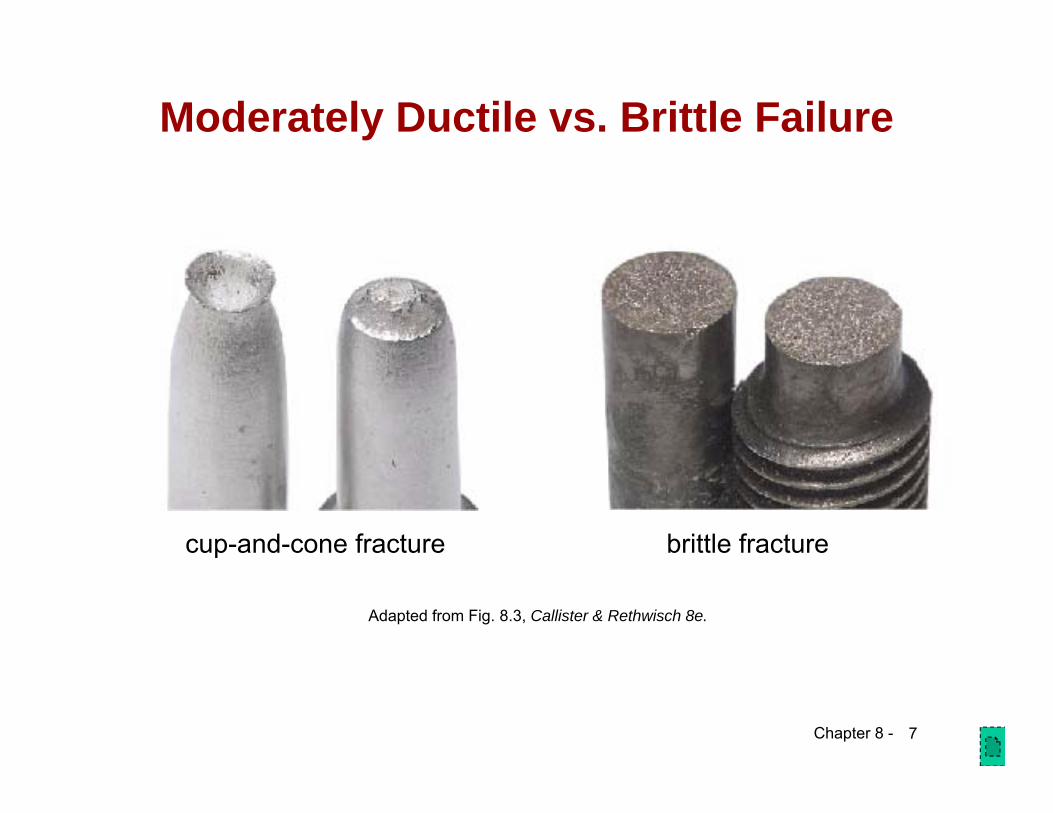
Moderately Ductile Failure• Failure Stages:
necking
void nucleation
void growthand coalescence
shearing at surface fracture
Chapter 8 - 7
Moderately Ductile vs. Brittle Failure
Adapted from Fig. 8.3, Callister & Rethwisch 8e.
cup-and-cone fracture brittle fracture

Chapter 8 - 8
Brittle FailureArrows indicate point at which failure originated
Adapted from Fig. 8.5(a), Callister & Rethwisch 8e.
Chapter 8 - 9
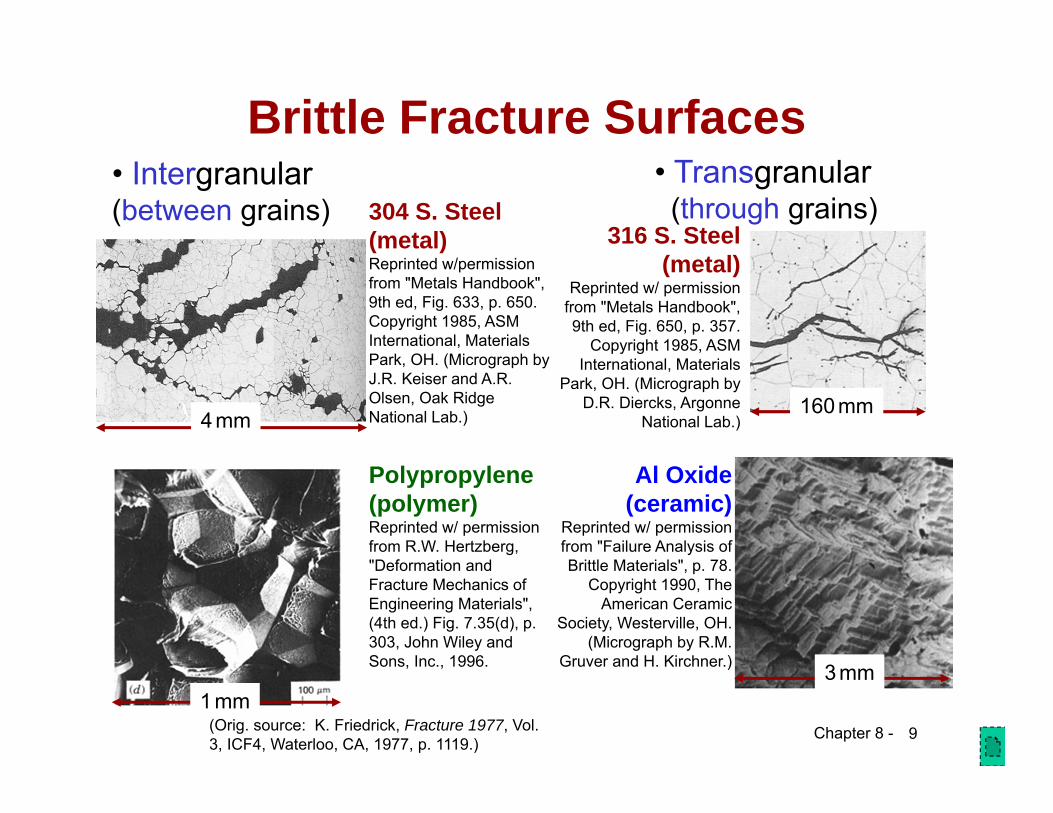
• Intergranular(between grains) 304 S. Steel
(metal)Reprinted w/permission from "Metals Handbook", 9th ed, Fig. 633, p. 650. Copyright 1985, ASM International, Materials Park, OH. (Micrograph by J.R. Keiser and A.R. Olsen, Oak Ridge National Lab.)
Polypropylene(polymer)Reprinted w/ permission from R.W. Hertzberg, "Deformation and Fracture Mechanics of Engineering Materials", (4th ed.) Fig. 7.35(d), p. 303, John Wiley and Sons, Inc., 1996.
4mm
• Transgranular(through grains)
Al Oxide(ceramic)
Reprinted w/ permission from "Failure Analysis of Brittle Materials", p. 78.
Copyright 1990, The American Ceramic
Society, Westerville, OH. (Micrograph by R.M.
Gruver and H. Kirchner.)
316 S. Steel (metal)
Reprinted w/ permission from "Metals Handbook", 9th ed, Fig. 650, p. 357.
Copyright 1985, ASM International, Materials
Park, OH. (Micrograph by D.R. Diercks, Argonne
National Lab.)
3mm
160mm
1mm(Orig. source: K. Friedrick, Fracture 1977, Vol. 3, ICF4, Waterloo, CA, 1977, p. 1119.)
Brittle Fracture Surfaces

Chapter 8 - 10
• Stress-strain behavior (Room T):
Ideal vs Real Materials
TS << TSengineeringmaterials
perfectmaterials
E/10
E/100
0.1
perfect mat’l-no flaws
carefully produced glass fiber
typical ceramic typical strengthened metaltypical polymer
• DaVinci (500 yrs ago!) observed...-- the longer the wire, the
smaller the load for failure.• Reasons:
-- flaws cause premature failure.-- larger samples contain longer flaws!
Reprinted w/ permission from R.W. Hertzberg, "Deformation and Fracture Mechanics of Engineering Materials", (4th ed.) Fig. 7.4. John Wiley and Sons, Inc., 1996.

Chapter 8 - 11

Chapter 8 - 12
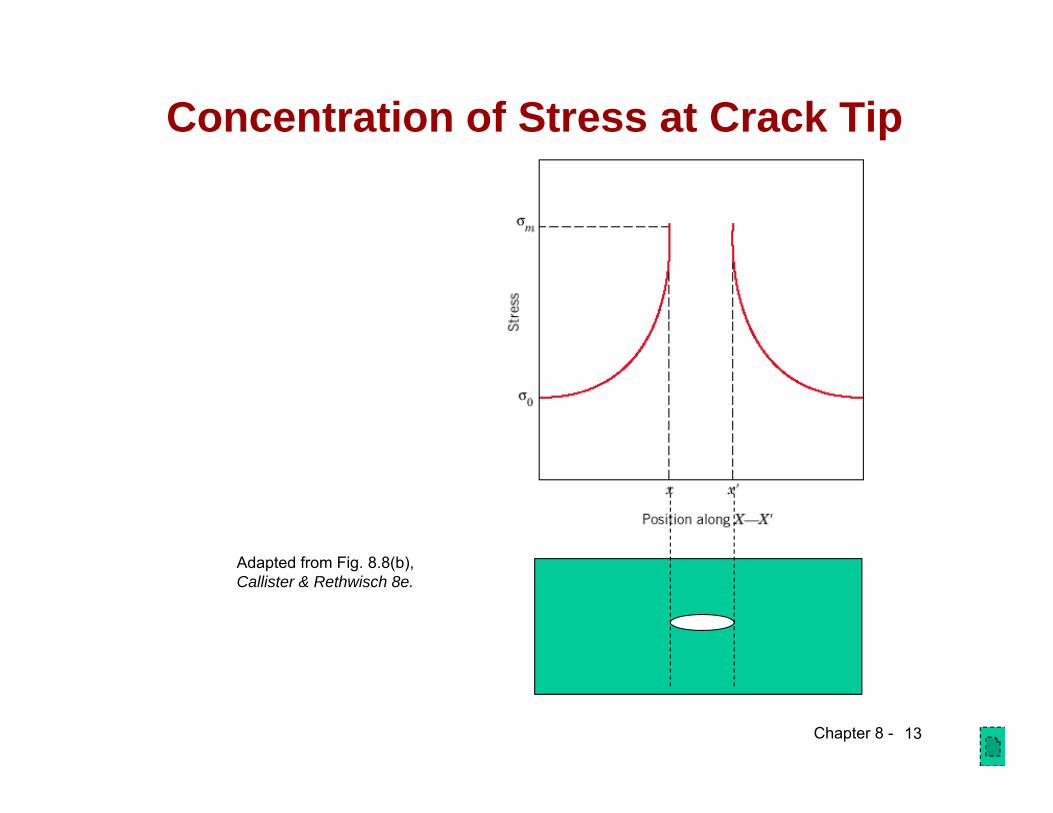
Flaws are Stress Concentrators!
• Griffith Crack
where t = radius of curvatureo = applied stressm = stress at crack tip
t
Adapted from Fig. 8.8(a), Callister & Rethwisch 8e.
ott
om K
2/1
2 a
Chapter 8 - 13
Concentration of Stress at Crack Tip
Adapted from Fig. 8.8(b), Callister & Rethwisch 8e.
Chapter 8 - 14
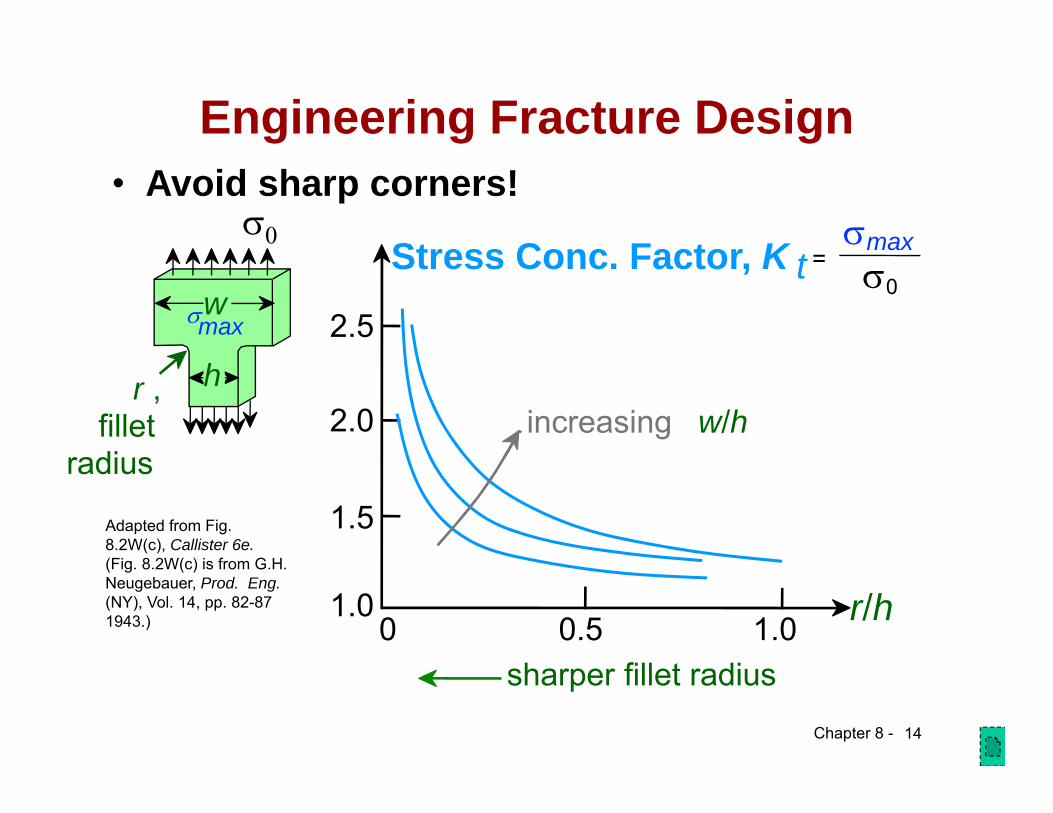
Engineering Fracture Design
r/h
sharper fillet radius
increasing w/h
0 0.5 1.01.0
1.5
2.0
2.5
Stress Conc. Factor, K t =
• Avoid sharp corners!
Adapted from Fig. 8.2W(c), Callister 6e.(Fig. 8.2W(c) is from G.H. Neugebauer, Prod. Eng.(NY), Vol. 14, pp. 82-87 1943.)
r , fillet
radius
w
h
max
max0

Chapter 8 - 15
Crack PropagationCracks having sharp tips propagate easier than cracks
having blunt tips• A plastic material deforms at a crack tip, which
“blunts” the crack.deformed region
brittle
Energy balance on the crack• Elastic strain energy-
• energy stored in material as it is elastically deformed• this energy is released when the crack propagates• creation of new surfaces requires energy
ductile
Chapter 8 - 16
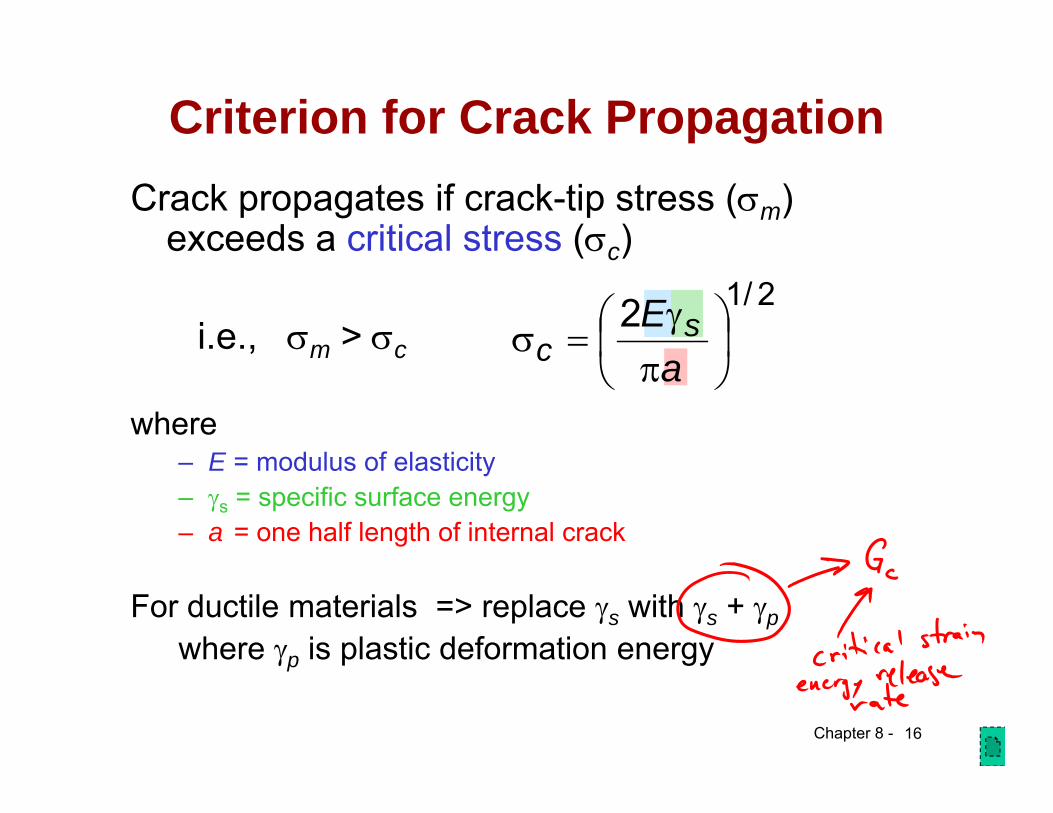
Criterion for Crack PropagationCrack propagates if crack-tip stress (m)
exceeds a critical stress (c)
where– E = modulus of elasticity– s = specific surface energy– a = one half length of internal crack
For ductile materials => replace s with s + pwhere p is plastic deformation energy
2/12
a
sc
Ei.e., m > c
Chapter 8 - 17
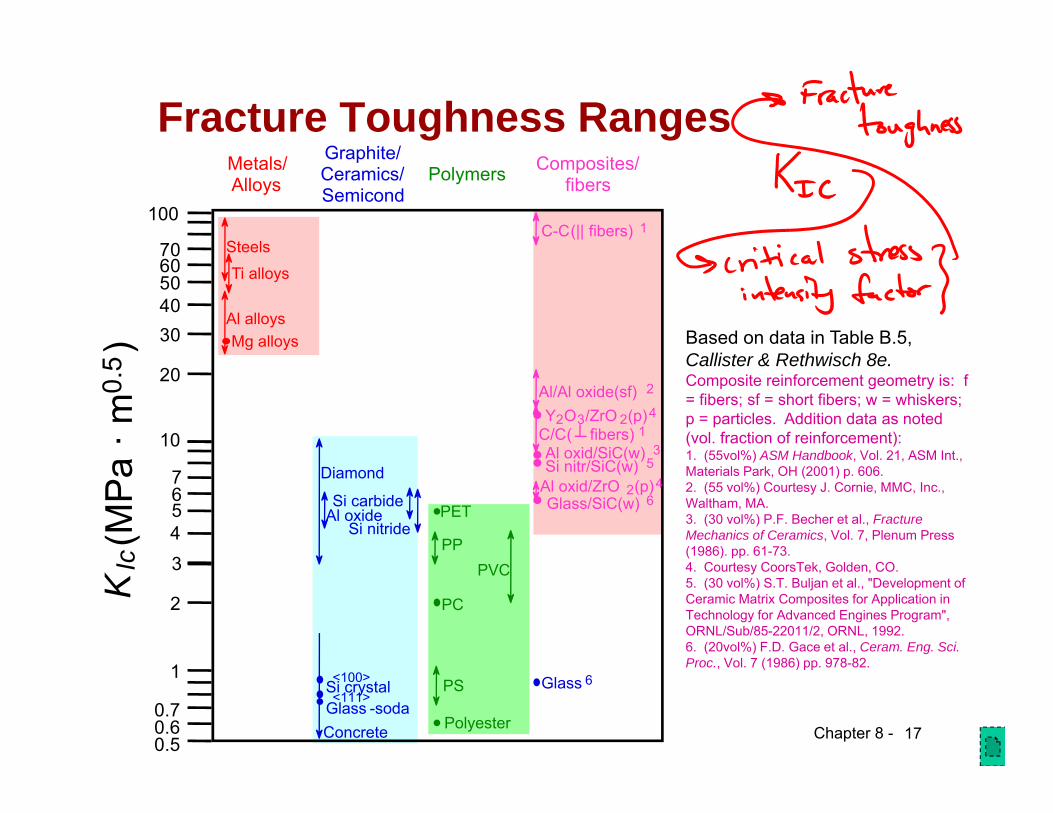
Fracture Toughness Ranges
Based on data in Table B.5,Callister & Rethwisch 8e.Composite reinforcement geometry is: f = fibers; sf = short fibers; w = whiskers; p = particles. Addition data as noted (vol. fraction of reinforcement):1. (55vol%) ASM Handbook, Vol. 21, ASM Int., Materials Park, OH (2001) p. 606.2. (55 vol%) Courtesy J. Cornie, MMC, Inc., Waltham, MA.3. (30 vol%) P.F. Becher et al., Fracture Mechanics of Ceramics, Vol. 7, Plenum Press (1986). pp. 61-73.4. Courtesy CoorsTek, Golden, CO.5. (30 vol%) S.T. Buljan et al., "Development of Ceramic Matrix Composites for Application in Technology for Advanced Engines Program", ORNL/Sub/85-22011/2, ORNL, 1992.6. (20vol%) F.D. Gace et al., Ceram. Eng. Sci. Proc., Vol. 7 (1986) pp. 978-82.
Graphite/ Ceramics/ Semicond
Metals/ Alloys
Composites/ fibersPolymers
5
KIc
(MP
a · m
0.5)
1
Mg alloysAl alloys
Ti alloys
Steels
Si crystalGlass -sodaConcrete
Si carbide
PC
Glass 6
0.5
0.7
2
43
10
20
30
<100><111>
Diamond
PVCPP
Polyester
PS
PET
C-C(|| fibers) 1
0.6
67
40506070
100
Al oxideSi nitride
C/C( fibers) 1
Al/Al oxide(sf) 2
Al oxid/SiC(w) 3
Al oxid/ZrO 2(p)4Si nitr/SiC(w) 5
Glass/SiC(w) 6
Y2O3/ZrO 2(p)4
Chapter 8 - 18
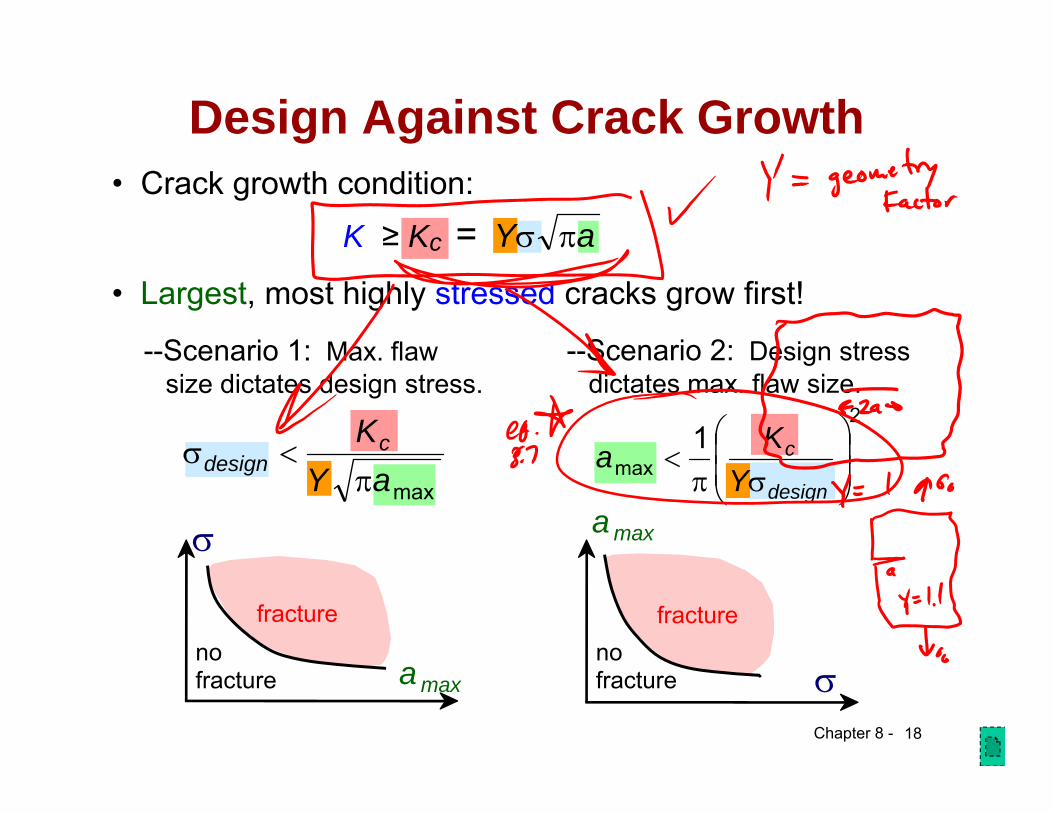
• Crack growth condition:
• Largest, most highly stressed cracks grow first!
Design Against Crack Growth
K ≥ Kc = aY
--Scenario 1: Max. flaw size dictates design stress.
maxa
YKc
design
amaxno fracture
fracture
--Scenario 2: Design stressdictates max. flaw size.
2
max1
design
c
YKa
amax
no fracture
fracture

Chapter 8 - 19
Chapter 8 - 20
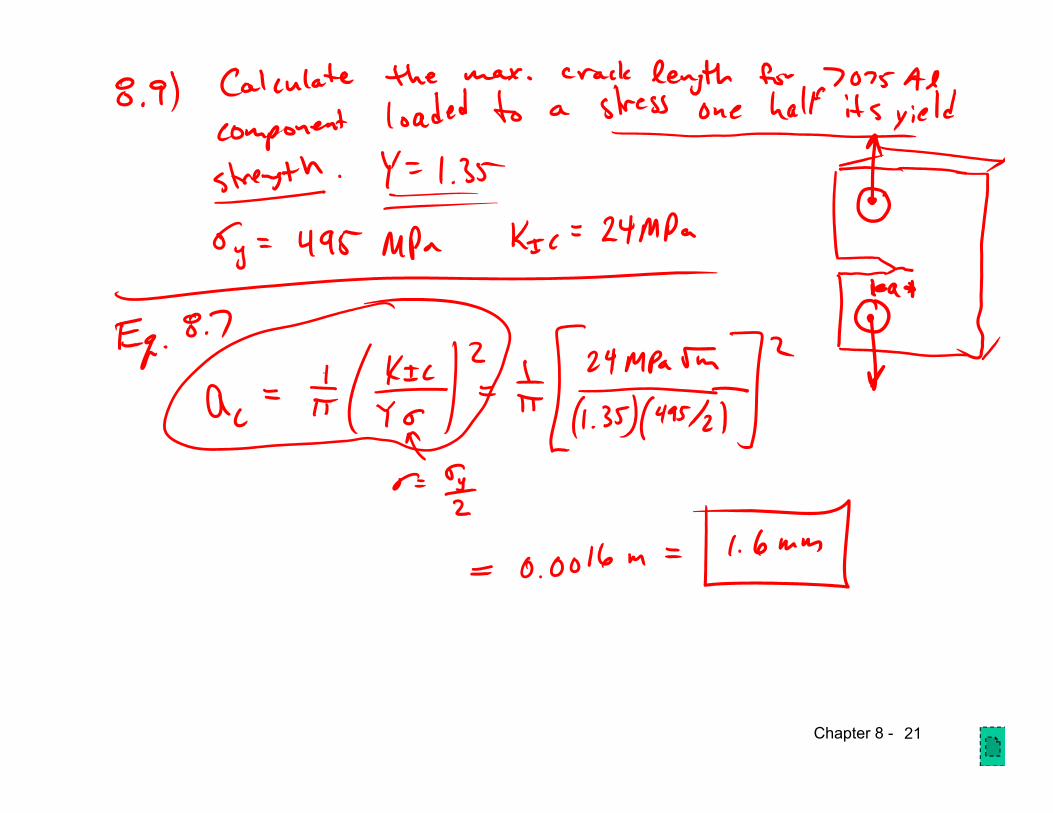
Chapter 8 - 21
Chapter 8 - 22
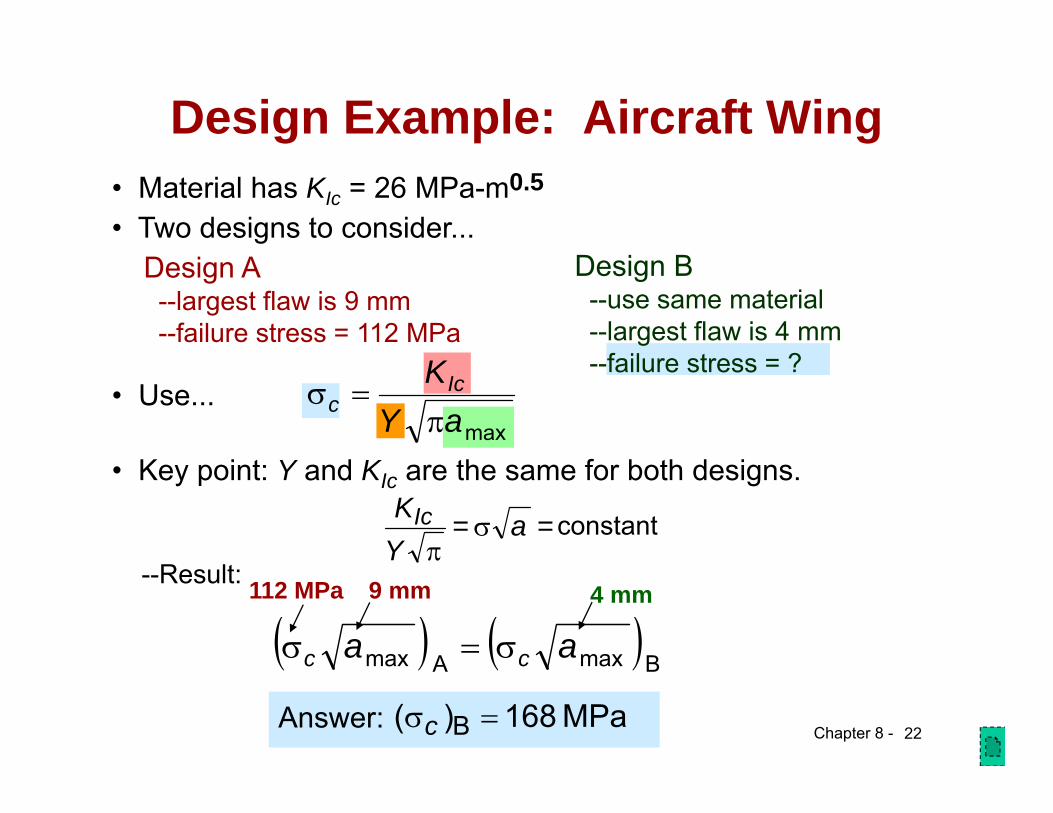
Design Example: Aircraft Wing
Answer: MPa 168)( B c
• Two designs to consider...Design A--largest flaw is 9 mm--failure stress = 112 MPa
Design B--use same material--largest flaw is 4 mm--failure stress = ?
• Key point: Y and KIc are the same for both designs.
• Material has KIc = 26 MPa-m0.5
• Use...maxa
Y
KIcc
B max Amax aa cc
9 mm112 MPa 4 mm--Result:
= a = Y
KIc constant

Chapter 8 - 23
Impact Testing
final height initial height
• Impact loading:-- severe testing case-- makes material more brittle-- decreases toughness
Adapted from Fig. 8.12(b), Callister & Rethwisch 8e. (Fig. 8.12(b) is adapted from H.W. Hayden, W.G. Moffatt, and J. Wulff, The Structure and Properties of Materials, Vol. III, Mechanical Behavior, John Wiley and Sons, Inc. (1965) p. 13.)
(Charpy)

Chapter 8 - 24
Influence of Temperature on Impact Energy
Adapted from Fig. 8.15, Callister & Rethwisch 8e.
• Ductile-to-Brittle Transition Temperature (DBTT)...
BCC metals (e.g., iron at T < 914ºC)
Impa
ct E
nerg
y
Temperature
High strength materials (y > E/150)
polymers
More DuctileBrittle
Ductile-to-brittle transition temperature
FCC metals (e.g., Cu, Ni)

Chapter 8 - 25
• Pre-WWII: The Titanic • WWII: Liberty ships
• Problem: Steels were used having DBTT’s just below room temperature.
Reprinted w/ permission from R.W. Hertzberg, "Deformation and Fracture Mechanics of Engineering Materials", (4th ed.) Fig. 7.1(a), p. 262, John Wiley and Sons, Inc., 1996. (Orig. source: Dr. Robert D. Ballard, The Discovery of the Titanic.)
Reprinted w/ permission from R.W. Hertzberg, "Deformation and Fracture Mechanics of Engineering Materials", (4th ed.) Fig. 7.1(b), p. 262, John Wiley and Sons, Inc., 1996. (Orig. source: Earl R. Parker, "Behavior of Engineering Structures", Nat. Acad. Sci., Nat. Res. Council, John Wiley and Sons, Inc., NY, 1957.)
Design Strategy:Stay Above The DBTT!

Chapter 8 - 26
Fatigue
Adapted from Fig. 8.18, Callister & Rethwisch 8e. (Fig. 8.18 is from Materials Science in Engineering, 4/E by Carl. A. Keyser, Pearson Education, Inc., Upper Saddle River, NJ.)
• Fatigue = failure under applied cyclic stress.
• Stress varies with time.-- key parameters are S, m, and
cycling frequency
max
min
time
mS
• Key points: Fatigue...--can cause part failure, even though max < y.--responsible for ~ 90% of mechanical engineering failures.
tension on bottom
compression on top
countermotor
flex coupling
specimen
bearing bearing
Chapter 8 - 27
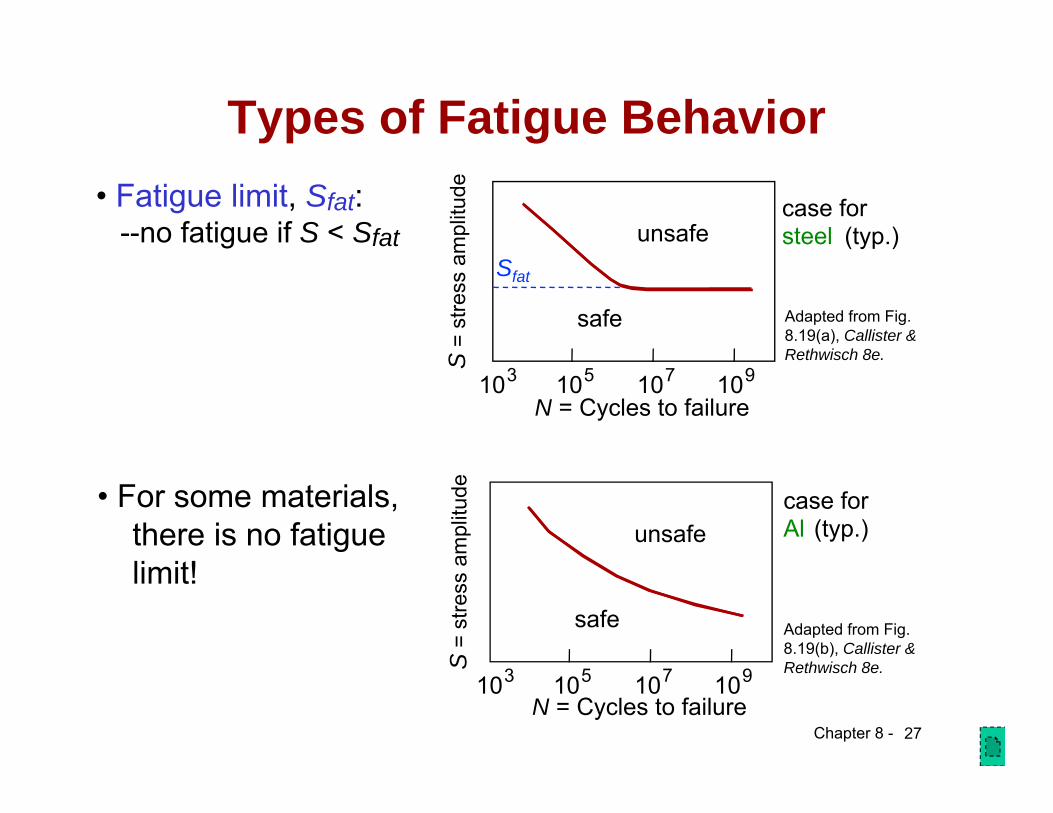
Adapted from Fig. 8.19(a), Callister & Rethwisch 8e.
Types of Fatigue Behavior• Fatigue limit, Sfat:
--no fatigue if S < SfatSfat
case for steel (typ.)
N = Cycles to failure103 105 107 109
unsafe
safe
S=
stre
ss a
mpl
itude
• For some materials, there is no fatigue limit!
Adapted from Fig. 8.19(b), Callister & Rethwisch 8e.
case for Al (typ.)
N = Cycles to failure103 105 107 109
unsafe
safe
S=
stre
ss a
mpl
itude
Chapter 8 - 28
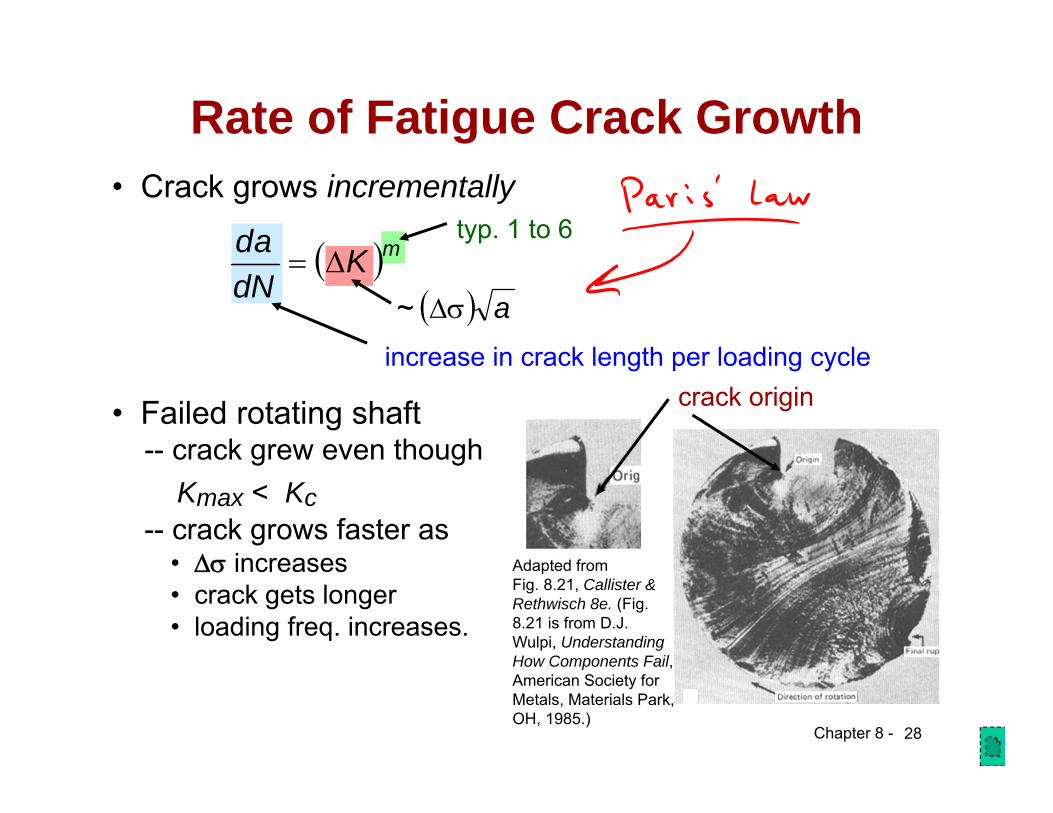
• Crack grows incrementallytyp. 1 to 6
a~increase in crack length per loading cycle
• Failed rotating shaft-- crack grew even though
Kmax < Kc-- crack grows faster as
• increases• crack gets longer• loading freq. increases.
crack origin
Adapted fromFig. 8.21, Callister & Rethwisch 8e. (Fig. 8.21 is from D.J. Wulpi, Understanding How Components Fail, American Society for Metals, Materials Park, OH, 1985.)
Rate of Fatigue Crack Growth
mKdNd
a
Chapter 8 - 29
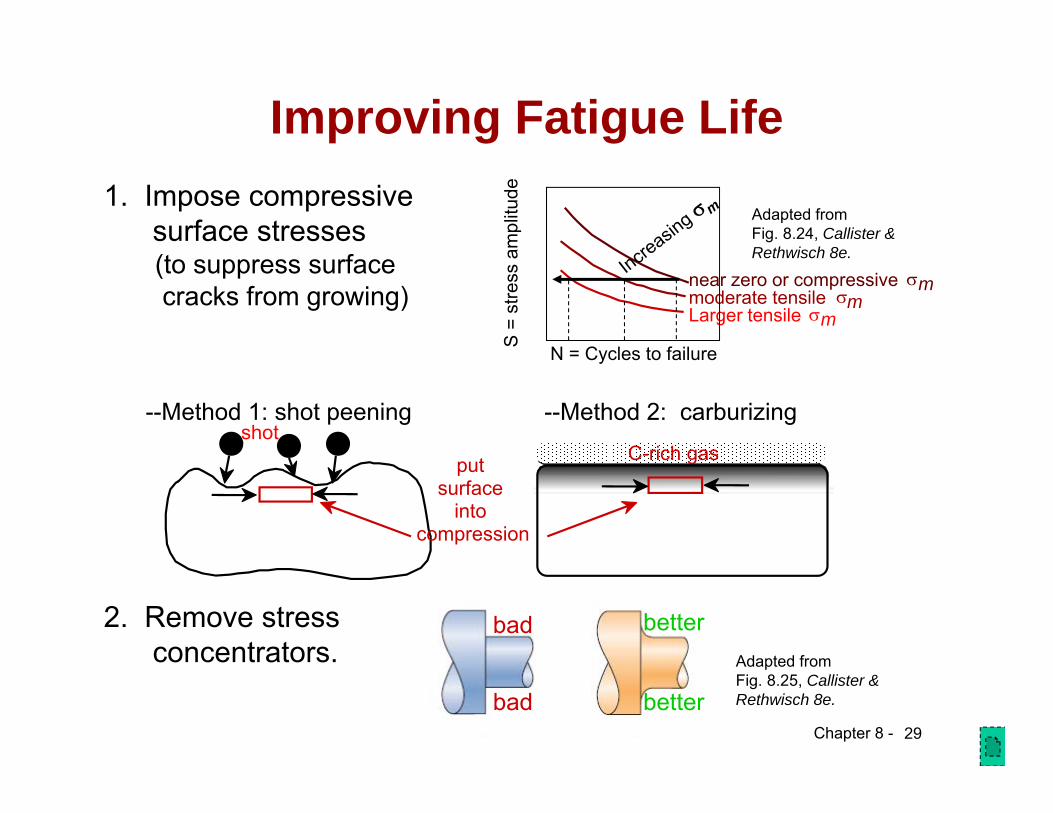
Improving Fatigue Life
2. Remove stressconcentrators. Adapted from
Fig. 8.25, Callister & Rethwisch 8e.
bad
bad
better
better
Adapted fromFig. 8.24, Callister & Rethwisch 8e.
1. Impose compressivesurface stresses(to suppress surfacecracks from growing)
N = Cycles to failure
moderate tensile mLarger tensile m
S =
stre
ss a
mpl
itude
near zero or compressive m
--Method 1: shot peening
put surface
into compression
shot--Method 2: carburizing
C-rich gas
Chapter 8 - 30
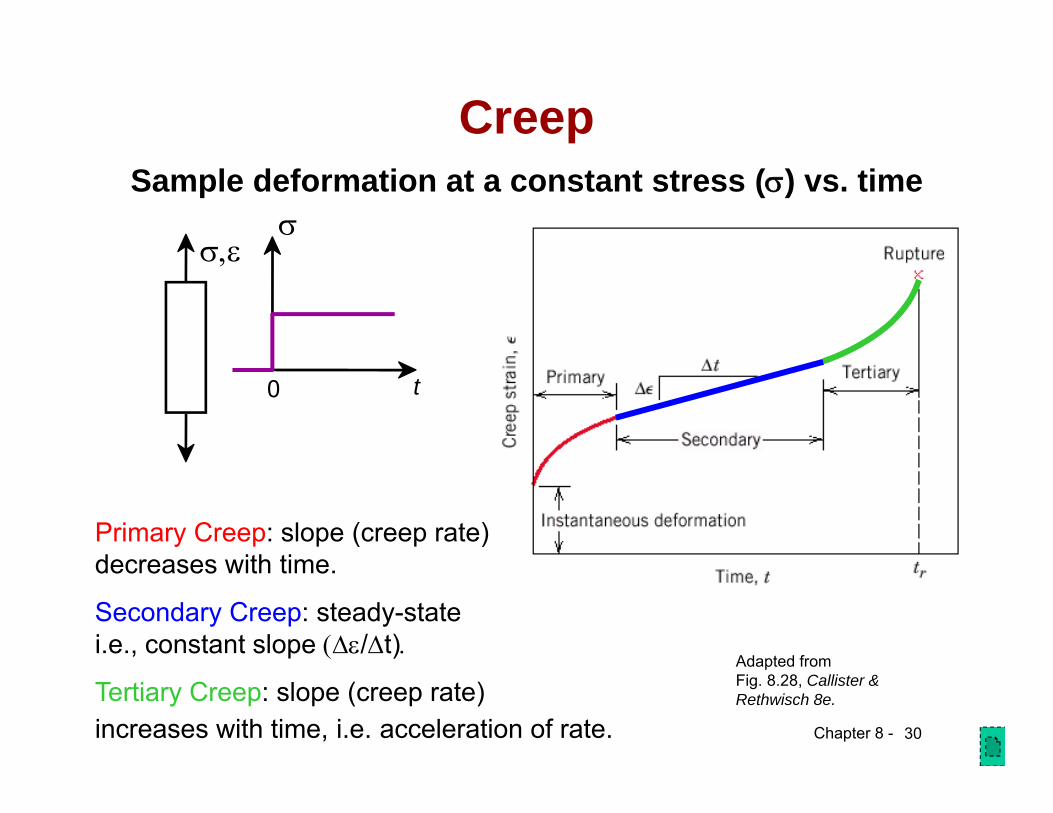
CreepSample deformation at a constant stress () vs. time
Adapted fromFig. 8.28, Callister & Rethwisch 8e.
Primary Creep: slope (creep rate) decreases with time.
Secondary Creep: steady-statei.e., constant slope /t)
Tertiary Creep: slope (creep rate) increases with time, i.e. acceleration of rate.
0 t

Chapter 8 - 31
• Occurs at elevated temperature, T > 0.4 Tm (in K)
Adapted from Fig. 8.29, Callister & Rethwisch 8e.
Creep: Temperature Dependence
elastic
primarysecondary
tertiary

Chapter 8 - 32
Secondary Creep• Strain rate is constant at a given T,
-- strain hardening is balanced by recoverystress exponent (material parameter)
strain rateactivation energy for creep(material parameter)
applied stressmaterial const.
• Strain rateincreaseswith increasingT,
102040
100200
10-2 10-1 1Steady state creep rate (%/1000hr)s
Stre
ss (M
Pa) 427ºC
538ºC
649ºC
Adapted fromFig. 8.31, Callister 7e. (Fig. 8.31 is from Metals Handbook: Properties and Selection: Stainless Steels, Tool Materials, and Special Purpose Metals, Vol. 3, 9th ed., D. Benjamin (Senior Ed.), American Society for Metals, 1980, p. 131.)
RTQK cn
s exp2
Chapter 8 -
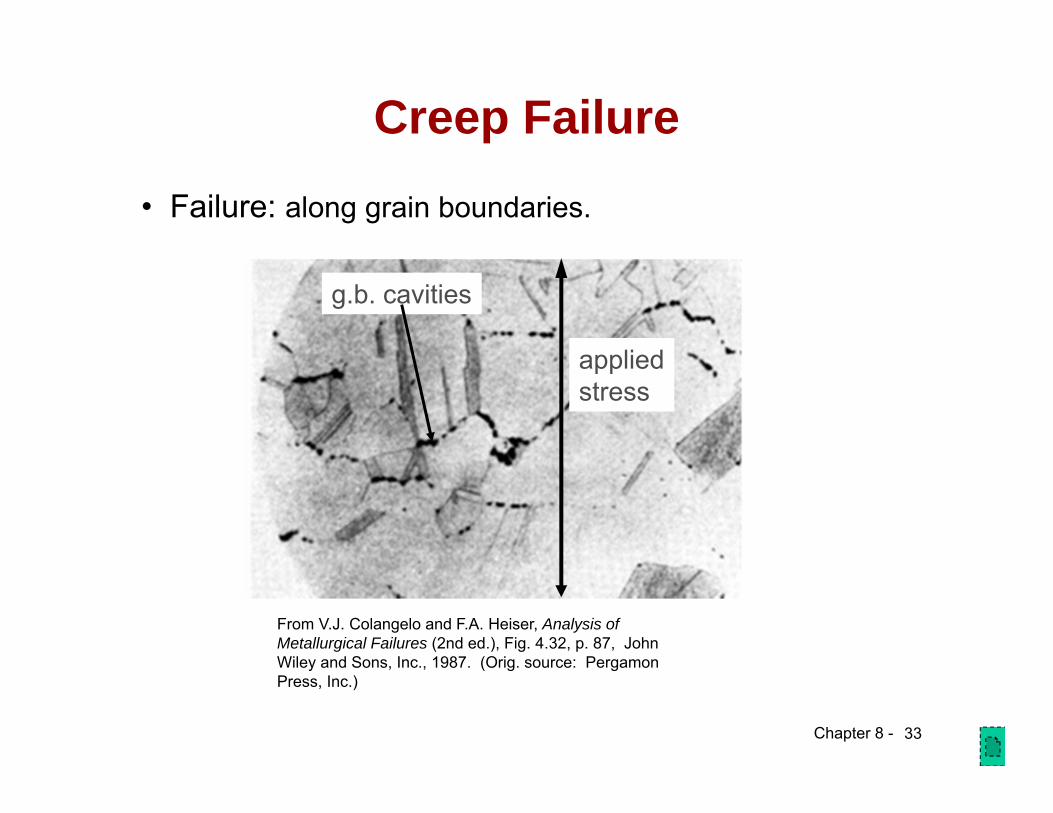
Creep Failure
• Failure: along grain boundaries.
appliedstress
g.b. cavities
From V.J. Colangelo and F.A. Heiser, Analysis of Metallurgical Failures (2nd ed.), Fig. 4.32, p. 87, John Wiley and Sons, Inc., 1987. (Orig. source: Pergamon Press, Inc.)
33
Chapter 8 -
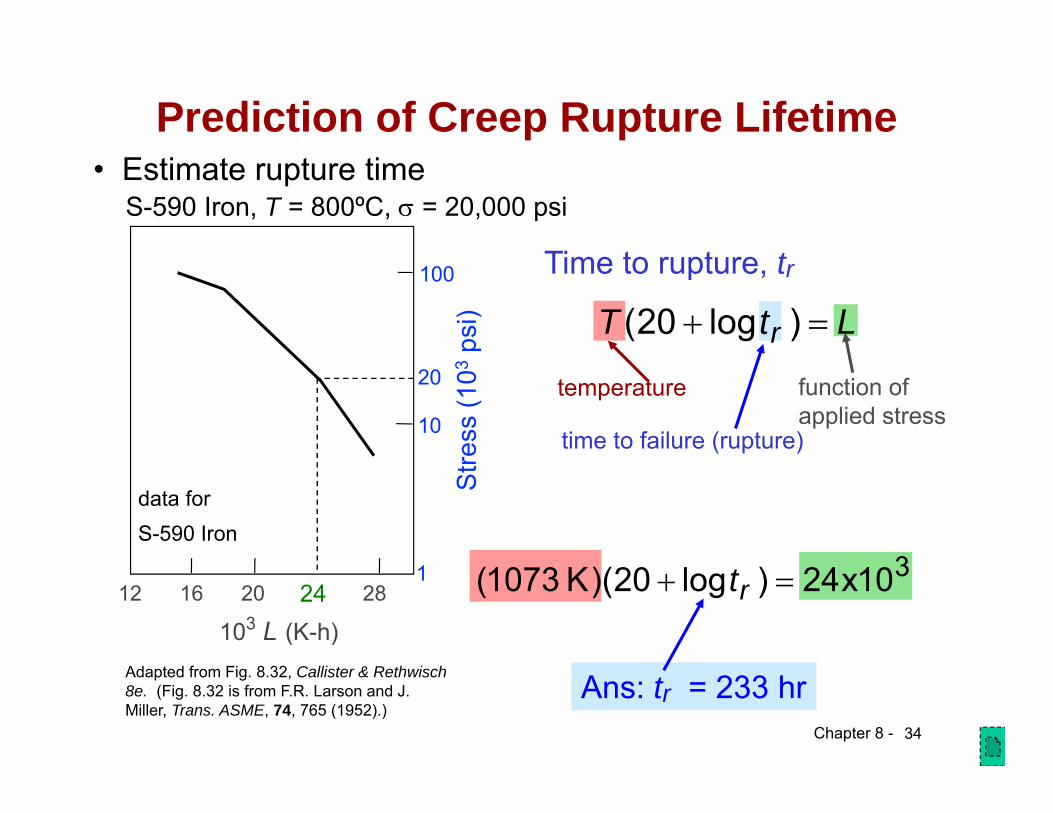
Prediction of Creep Rupture Lifetime• Estimate rupture time
S-590 Iron, T = 800ºC, = 20,000 psi
time to failure (rupture)
function ofapplied stress
temperature
LtT r )log20(
Time to rupture, tr
310x24)log20)(K 1073( rt
Ans: tr = 233 hrAdapted from Fig. 8.32, Callister & Rethwisch 8e. (Fig. 8.32 is from F.R. Larson and J. Miller, Trans. ASME, 74, 765 (1952).)
103 L (K-h)
Stre
ss (1
03ps
i)
100
10
112 20 24 2816
data for S-590 Iron
20
24
34
Chapter 8 -
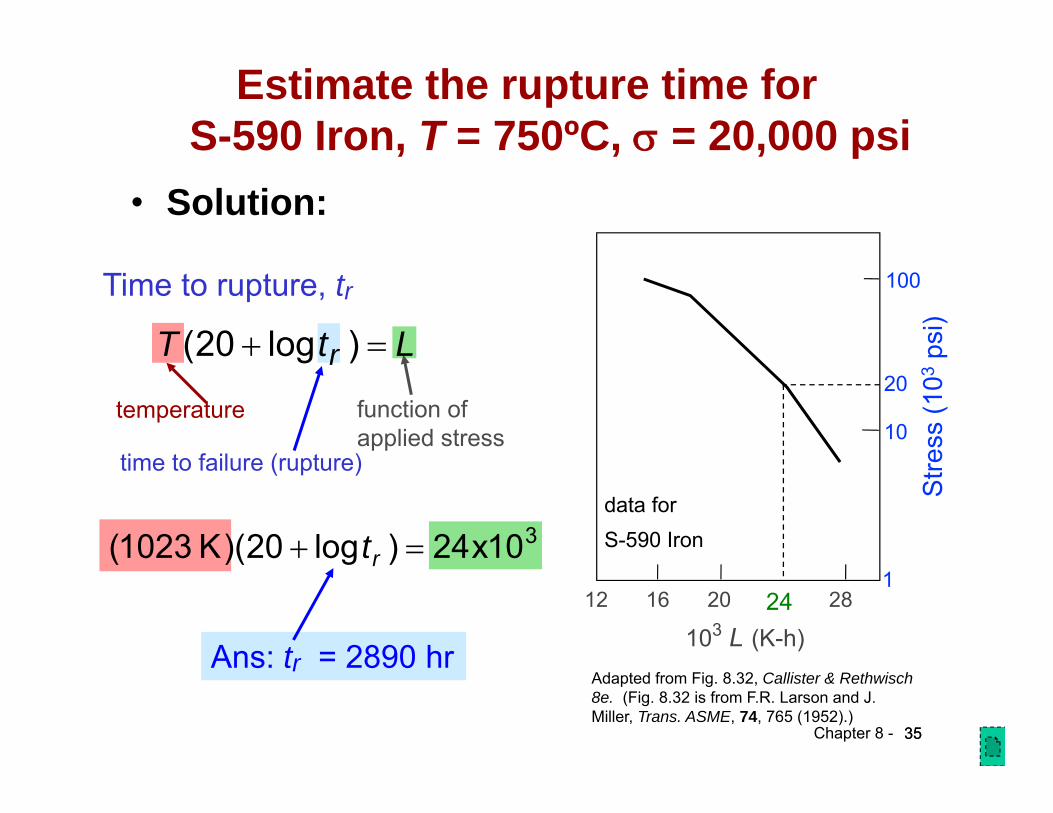
Estimate the rupture time forS-590 Iron, T = 750ºC, = 20,000 psi
• Solution:
3535
Adapted from Fig. 8.32, Callister & Rethwisch 8e. (Fig. 8.32 is from F.R. Larson and J. Miller, Trans. ASME, 74, 765 (1952).)
103 L (K-h)
Stre
ss (1
03ps
i)
100
10
112 20 24 2816
data for S-590 Iron
20
24
310x24)log20)(K 1023( rt
Ans: tr = 2890 hr
time to failure (rupture)
function ofapplied stress
temperature
LtT r )log20(
Time to rupture, tr
Chapter 8 - 36
• Sharp corners produce large stress concentrationsand premature failure.
SUMMARY• Engineering materials not as strong as predicted by theory• Flaws act as stress concentrators that cause failure at
stresses lower than theoretical values.
• Failure type depends on T and :-For simple fracture (noncyclic and T < 0.4Tm), failure stress
decreases with:- increased maximum flaw size,- decreased T,- increased rate of loading.
- For fatigue (cyclic :- cycles to fail decreases as increases.
- For creep (T > 0.4Tm):- time to rupture decreases as or T increases.
Chapter 8 - 37
Related Documents