April 2018 U.S. Energy Information Administration | Assumptions to the Annual Energy Outlook 2018: Electricity Market Module 1 Electricity Market Module The Electricity Market Module (EMM) in the National Energy Modeling System (NEMS) represents the capacity planning, dispatching, and pricing of electricity and is composed of four submodules: electricity load and demand, electricity capacity planning, electricity fuel dispatching, and electricity finance and pricing. The EMM also includes nonutility capacity and generation, as well as electricity transmission and trade. A detailed description of the EMM is provided in the EIA publication, The Electricity Market Module of the National Energy Modeling System: Model Documentation 2018, DOE/EIA-M068 (2018 – forthcoming). Based on fuel prices and electricity demands provided by the other modules of NEMS, the EMM determines the most economical way to supply electricity within environmental and operational constraints. Each EMM submodule includes assumptions about the operations of the electricity sector and the costs of various options. This section describes the model parameters and assumptions used in the EMM and discusses legislation and regulations that are incorporated in the EMM. EMM regions The supply regions used in the EMM were developed for the 2011 Annual Energy Outlook (AEO). They correspond to the North American Electric Reliability Corporation (NERC) regions in place at that time, divided into subregions, as shown in Figure 1. Figure 1. Electricity Market Module Regions

Welcome message from author
This document is posted to help you gain knowledge. Please leave a comment to let me know what you think about it! Share it to your friends and learn new things together.
Transcript
April 2018
U.S. Energy Information Administration | Assumptions to the Annual Energy Outlook 2018: Electricity Market Module 1
Electricity Market Module The Electricity Market Module (EMM) in the National Energy Modeling System (NEMS) represents the capacity planning, dispatching, and pricing of electricity and is composed of four submodules: electricity load and demand, electricity capacity planning, electricity fuel dispatching, and electricity finance and pricing. The EMM also includes nonutility capacity and generation, as well as electricity transmission and trade. A detailed description of the EMM is provided in the EIA publication, The Electricity Market Module of the National Energy Modeling System: Model Documentation 2018, DOE/EIA-M068 (2018 – forthcoming).
Based on fuel prices and electricity demands provided by the other modules of NEMS, the EMM determines the most economical way to supply electricity within environmental and operational constraints. Each EMM submodule includes assumptions about the operations of the electricity sector and the costs of various options. This section describes the model parameters and assumptions used in the EMM and discusses legislation and regulations that are incorporated in the EMM.
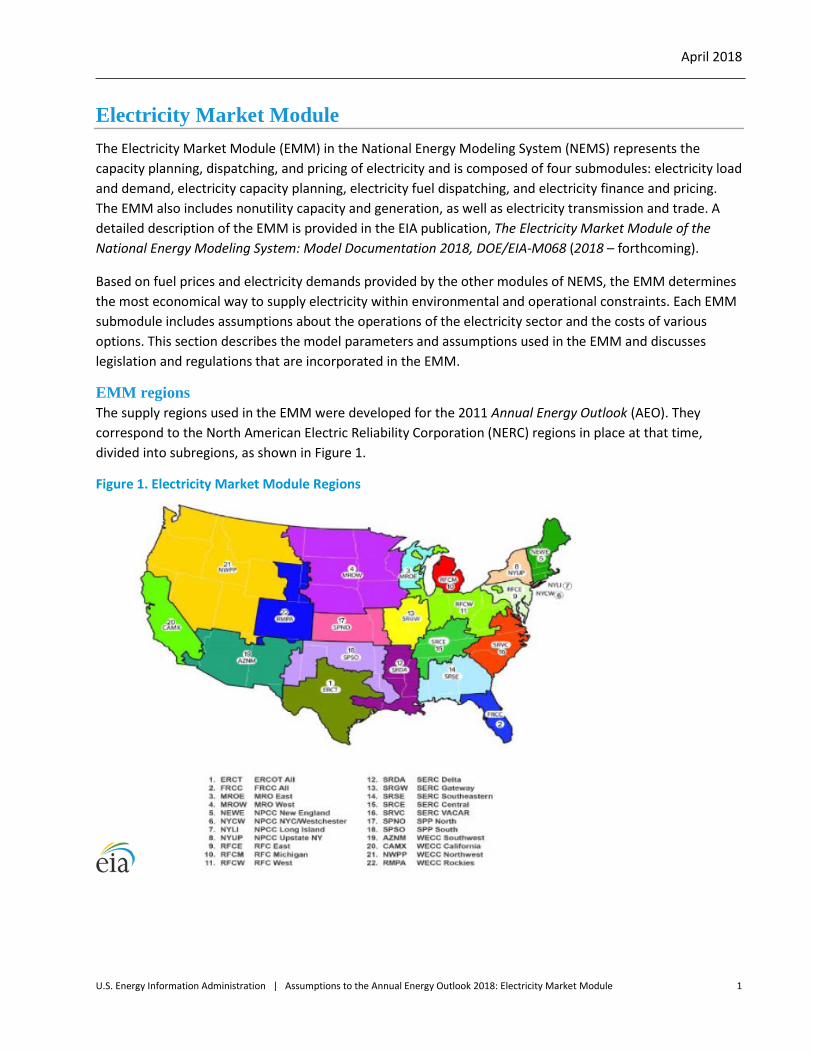
EMM regions The supply regions used in the EMM were developed for the 2011 Annual Energy Outlook (AEO). They correspond to the North American Electric Reliability Corporation (NERC) regions in place at that time, divided into subregions, as shown in Figure 1.
Figure 1. Electricity Market Module Regions

April 2018
U.S. Energy Information Administration | Assumptions to the Annual Energy Outlook 2018: Electricity Market Module 2
Model parameters and assumptions Generating capacity types The capacity types represented in the EMM are shown in Table 1.
Table 1. Generating capacity types represented in the Electricity Market Module
Capacity Type
Existing coal steam plants1
Ultra-Supercritical Coal (USC)2
Advanced Coal - Integrated Coal Gasification Combined-Cycle (IGCC)2
USC with 30% Carbon Capture and Sequestration (CCS)
USC with 90% CCS
Oil/Gas Steam - Oil/Gas Steam Turbine
Combined Cycle - Conventional Gas/Oil Combined-Cycle Combustion Turbine
Advanced Combined Cycle - Advanced Gas/Oil Combined-Cycle Combustion Turbine
Advanced Combined Cycle with CCS
Combustion Turbine - Conventional Combustion Turbine
Advanced Combustion Turbine - Steam Injected Gas Turbine
Molten Carbonate Fuel Cell
Conventional Nuclear
Advanced Nuclear - Advanced Light Water Reactor
Generic Distributed Generation – Base load
Generic Distributed Generation – Peak load
Conventional Hydropower - Hydraulic Turbine
Pumped Storage - Hydraulic Turbine Reversible
Battery Storage – four-hour battery
Geothermal
Municipal Solid Waste
Biomass - Fluidized Bed
Solar Thermal - Central Tower
Solar Photovoltaic (PV) – Single-Axis Tracking
Solar Photovoltaic (PV) – Fixed-Tilt
Wind
Wind Offshore 1 The EMM represents 32 different types of existing coal steam plants, based on the different possible configuration of nitrogen oxide (NOx), particulate and sulfur dioxide (SO2) emission control devices, as well as options for controlling mercury and carbon (see Table 9). 2 The AEO2018 assumes new coal plants without CCS cannot be built because of emission standards for new plants. These technologies exist in the modeling framework, but they are not assumed to be available to be built in the projections.
Source: U.S. Energy Information Administration.

April 2018
U.S. Energy Information Administration | Assumptions to the Annual Energy Outlook 2018: Electricity Market Module 3
New generating plant characteristics The cost and performance characteristics of new generating technologies are inputs to the electricity capacity planning submodule (Table 2). These characteristics are used in combination with fuel prices from the NEMS fuel supply modules and foresight on fuel prices to compare options when new capacity is needed. Heat rates for new fossil-fueled technologies are assumed to decline linearly through 2025.
For AEO2016, EIA commissioned an external consultant to update current cost estimates for certain utility-scale electric generating plants [1]. This report used a consistent methodology, similar to the one used to develop the estimates for previous AEOs, but accounted for more recent data and experience and also included alternative designs not previously considered. Updated costs were used for coal plants with 30% carbon capture and sequestration (CCS), the combined-cycle (without CCS) technologies, the combustion-turbine technologies, advanced nuclear, onshore wind, and solar photovoltaic (PV). After AEO2016 was completed, an addendum to the report was provided [2] that included costs for several additional technologies. Later AEOs incorporated the coal with 90% CCS technology from this report. Input costs for other technologies are consistent with AEO2016 assumptions. Initial costs shown in Table 2 also reflect adjustments for learning cost reductions based on capacity built since the cost estimates were prepared. A cost-adjustment factor, based on the producer price index for metals and metal products, allows the overnight costs to fall in the future if this index drops or to rise further if it increases.
The overnight costs shown in Table 2, except as noted below, represent the estimated cost of building a plant before adjusting for regional cost factors. Overnight costs exclude interest during plant construction and development. Technologies with limited commercial experience may include a technological optimism factor to account for the tendency during technology research and development to underestimate the full engineering and development costs for new technologies.
All technologies demonstrate some degree of variability in cost based on project size, location, and access to key infrastructure (such as grid interconnections, fuel supply, and transportation). For wind and solar PV in particular, the cost favorability of the lowest-cost regions compounds the underlying variability in regional cost and creates a significant differential between the unadjusted costs and the capacity-weighted average national costs as observed from recent market experience. To correct for this, Table 2 shows a weighted-average cost for both wind and solar PV based on the regional cost factors assumed for these technologies in AEO2018 and the actual regional distribution of wind and solar builds that occurred in 2016.
Table 3 lists the overnight capital costs for each technology and EMM region (Figure 1) for the resources or technologies that are available to be built in the given region. The regional costs reflect the impact of locational adjustments, including one to address ambient air conditions for technologies that include a combustion turbine and one to adjust for additional costs associated with accessing remote wind resources. Temperature, humidity, and air pressure can affect the available capacity of a combustion turbine, and EIA’s modeling addresses this through an additional cost multiplier by region. Unlike most other generation technologies where fuel can be transported to the plant, wind generators must be located in areas with the best wind resources. As sites near existing transmission, with access to a road network, or otherwise located on lower-development-cost lands are used, additional costs may be incurred to access sites with less favorable characteristics. EIA represents this through a multiplier applied to the wind plant capital costs that increases as the best sites in a given region are developed.

April 2018
U.S. Energy Information Administration | Assumptions to the Annual Energy Outlook 2018: Electricity Market Module 4
Table 2. Cost and performance characteristics of new central station electricity generating technologies
Technology
First available
year1 Size
(MW)
Lead time
(years)
Base overnight
cost (2017
$/kW)
Project Contin-
gency Factor2
Techno-logical
Optimism Factor3
Total overnight
cost4,10 (2017
$/kW)
Variable O&M5 (2017
$/MWh)
Fixed O&M
(2017$/ kW/yr)
Heat rate6 (Btu/kWh)
nth-of-a-kind heat
rate (Btu/kWh)
Coal with 30% carbon sequestration (CCS) 2021 650 4 4,641 1.07 1.03 5,089 7.17 70.70 9,750 9,221 Coal with 90% CCS 2021 650 4 5,132 1.07 1.03 5,628 9.70 82.10 11,650 9,257 Conv Gas/Oil Combined Cycle (CC) 2020 702 3 935 1.05 1.00 982 3.54 11.11 6,600 6,350 Adv Gas/Oil CC 2020 429 3 1,026 1.08 1.00 1,108 2.02 10.10 6,300 6,200 Adv CC with CCS 2020 340 3 1,936 1.08 1.04 2,175 7.20 33.75 7,525 7,493 Conv Combustion Turbine7 2019 100 2 1,054 1.05 1.00 1,107 3.54 17.67 9,880 9,600 Adv Combustion Turbine 2019 237 2 648 1.05 1.00 680 10.81 6.87 9,800 8,550 Fuel Cells 2020 10 3 6,192 1.05 1.10 7,132 45.64 0.00 9,500 6,960 Adv Nuclear 2022 2,234 6 5,148 1.10 1.05 5,946 2.32 101.28 10,460 10,460 Distributed Generation - Base 2020 2 3 1,479 1.05 1.00 1,553 8.23 18.52 8,969 8,900 Distributed Generation - Peak 2019 1 2 1,777 1.05 1.00 1,866 8.23 18.52 9,961 9,880 Battery Storage 2018 30 1 2,067 1.05 1.00 2,170 7.12 35.60 N/A N/A Biomass 2021 50 4 3,584 1.07 1.00 3,837 5.58 112.15 13,500 13,500 Geothermal8,9 2021 50 4 2,615 1.05 1.00 2,746 0.00 119.87 9,271 9,271 MSW - Landfill Gas 2020 50 3 8,170 1.07 1.00 8,742 9.29 417.02 18,000 18,000 Conventional Hydropower9 2021 500 4 2,634 1.10 1.00 2,898 1.33 40.05 9,271 9,271 Wind 2020 100 3 1,548 1.07 1.00 1,657 0.00 47.47 9,271 9,271 Wind Offshore8 2021 400 4 4,694 1.10 1.25 6,454 0.00 78.56 9,271 9,271 Solar Thermal8 2020 100 3 3,952 1.07 1.00 4,228 0.00 71.41 9,271 9,271 Solar PV - tracking8,11 2019 150 2 2,004 1.05 1.00 2,105 0.00 22.02 9,271 9,271 Solar PV - fixed tilt8,11 2019 150 2 1,763 1.05 1.00 1,851 0.00 22.02 9,271 9,271 1 - Represents the first year that a new unit could become operational. 2 - AACE International, the Association for the Advancement of Cost Engineering, has defined contingency as "An amount added to an estimate to allow for items, conditions, or events for which the state, occurrence, or effect is uncertain and that experience shows will likely result, in aggregate, in additional costs.” 3 - The technological optimism factor is applied to the first four units of a new, unproven design and reflects the demonstrated tendency to underestimate actual costs for a first-of-a-kind unit. 4 - Overnight capital cost including contingency factors, excluding regional multipliers (except as noted for wind and solar PV) and learning effects. Interest charges are also excluded. These represent current costs for plants that would come online in 2018. 5 - O&M = Operations and maintenance. 6 - For hydropower, wind, solar and geothermal technologies, the heat rate shown represents the average heat rate for conventional thermal generation as of 2016. This heat rate is used for purposes of calculating primary energy consumption displaced for these resources, and does not imply an estimate of their actual energy conversion efficiency. The nuclear average heat rate is the weighted average tested heat rate for nuclear units as reported on the Form EIA-860, "Annual Electric Generator Report." No heat rate is reported for battery storage because it is not a primary conversion technology; conversion losses are accounted for when the electricity is first generated; electricity-to-storage losses are accounted for through the additional demand for electricity required to meet load. 7 - Conventional combustion turbine units can be built by the model prior to 2019 if necessary to meet a given region's reserve margin. 8 - Capital costs are shown before investment tax credits are applied. 9 - Because geothermal and hydropower cost and performance characteristics are specific for each site, the table entries represent the cost of the least expensive plant that could be built in the Northwest Power Pool region, where most of the proposed sites are located. 10 - Wind and both solar PV technologies' total overnight cost shown in the table represents the average input value across all 22 electricity market regions, as weighted by the respective capacity of that type installed during 2016 in each region to account for the substantial regional variation in wind and solar costs (as shown in Table 3). The input value used for wind in AEO2018 was $1,887 per kilowatt (kW), for solar PV with tracking was $2,207/kW, and for solar PV fixed tilt was $2,068, representing the cost of building a plant excluding regional factors. Region-specific factors contributing to the substantial regional variation in cost include differences in typical project size across regions, accessibility of resources, and variation in labor and other construction costs through the country. 11 - Costs and capacities are expressed in terms of net AC power available to the grid for the installed capacity. Sources: Input costs are consistent with those used in AEO2017, and are primarily based on a report provided by external consultants, http://www.eia.gov/analysis/studies/powerplants/capitalcost/. The base costs above reflect calculated learning cost reductions based on recent builds occurring since the cost report was provided. The cost differential between the two PV technologies was based on Lawrence Berkeley National Lab's Utility-Scale Solar Report. Hydropower site costs for non-powered dams were updated for AEO2018 using data from Oak Ridge National Lab.

April 2018
U.S. Energy Information Administration | Assumptions to the Annual Energy Outlook 2018: Electricity Market Module 5
Table 3. Total overnight capital costs of new electricity generating technologies by region 2017 $/kW
Technology 1
(ERCT) 2
(FRCC) 3
(MROE) 4
(MROW) 5
(NEWE) 6
(NYCW) 7
(NYLI) 8
(NYUP) 9
(RFCE) 10
(RFCM) 11
(RFCW)
Coal with 30% CCS 4,560 4,764 5,034 4,893 5,334 N/A N/A 4,967 5,563 5,059 5,140
Coal with 90% CCS 5,043 5,268 5,549 5,409 5,867 N/A N/A 5,493 6,112 5,594 5,668 Conv Gas/Oil CC 899 928 937 959 1,091 1,583 1,583 1,109 1,162 981 1,006 Adv Gas/Oil CC 1,062 1,084 1,052 1,095 1,230 1,687 1,687 1,250 1,300 1,099 1,145 Adv CC with CCS 2,030 2,106 2,115 2,092 2,227 3,173 3,173 2,239 2,379 2,131 2,190 Conv Combustion Turbine 1,063 1,104 1,052 1,095 1,149 1,558 1,558 1,134 1,217 1,096 1,122 Adv Combustion Turbine 661 683 655 683 737 1,054 1,054 732 794 682 703 Fuel Cells 6,683 6,847 7,168 6,953 7,196 8,644 8,644 7,096 7,325 7,125 7,111 Adv Nuclear 5,702 5,785 5,987 5,860 6,195 N/A N/A 6,291 6,356 5,940 6,059 Distributed Generation - Base 1,382 1,423 1,524 1,519 1,775 2,537 2,537 1,797 1,859 1,577 1,594 Distributed Generation - Peak 1,792 1,862 1,773 1,846 1,938 2,628 2,628 1,912 2,052 1,849 1,892 Battery Storage 2,126 2,143 2,168 2,163 2,201 2,543 2,543 2,163 2,221 2,168 2,173 Biomass 3,538 3,638 3,910 3,714 3,952 4,708 4,708 3,968 4,086 3,818 3,875 Geothermal N/A N/A N/A N/A N/A N/A N/A N/A N/A N/A N/A MSW - Landfill Gas 8,043 8,296 8,812 8,465 8,821 11,015 11,015 8,733 9,030 8,716 8,689 Conventional Hydropower N/A 5,165 N/A 1,694 1,904 N/A N/A 3,896 4,047 N/A 3,527 Wind 1,573 N/A 2,371 1,604 2,510 N/A 2,725 2,246 2,132 2,475 1,817 Wind Offshore 5,893 6,454 6,493 6,524 6,622 8,268 8,268 6,396 6,622 6,422 6,493 Solar Thermal 3,603 3,831 N/A N/A N/A N/A N/A N/A N/A N/A N/A Solar PV - tracking 2,220 1,798 2,114 1,917 2,471 3,282 2,103 1,988 2,333 3,050 2,020 Solar PV - fixed tilt 2,081 1,685 1,982 1,797 2,316 3,076 1,970 1,863 2,186 2,859 1,893
Technology 12
(SRDA) 13
(SRGW) 14
(SRSE) 15
(SRCE) 16
(SRVC) 17
(SPNO) 18
(SPSO) 19
(AZNM) 20
(CAMX) 21
(NWPP) 22
(RMPA)
Coal with 30% CCS 4,642 5,171 4,601 4,652 4,489 4,896 4,759 4,942 5,665 5,008 4,876
Coal with 90% CCS 5,139 5,713 5,088 5,144 4,958 5,409 5,262 5,459 6,230 5,527 5,375 Conv Gas/Oil CC 896 1,018 923 901 874 973 938 1,072 1,237 1,021 1,149 Adv Gas/Oil CC 1,059 1,158 1,087 1,080 1,039 1,123 1,099 1,312 1,414 1,205 1,354 Adv CC with CCS 2,047 2,251 2,061 2,017 1,974 2,164 2,100 2,461 2,539 2,250 2,443 Conv Combustion Turbine 1,077 1,143 1,107 1,058 1,047 1,118 1,096 1,278 1,271 1,159 1,330 Adv Combustion Turbine 670 713 700 658 656 697 685 807 818 727 977 Fuel Cells 6,747 7,253 6,718 6,761 6,647 6,982 6,861 7,032 7,453 7,054 6,832 Adv Nuclear 5,738 6,035 5,720 5,749 5,684 5,874 5,803 5,904 N/A 5,963 5,946 Distributed Generation - Base 1,389 1,605 1,417 1,407 1,356 1,513 1,459 1,553 1,931 1,567 1,636 Distributed Generation - Peak 1,816 1,928 1,866 1,784 1,765 1,886 1,848 2,154 2,143 1,954 2,243 Battery Storage 2,139 2,191 2,134 2,137 2,126 2,159 2,146 2,160 2,254 2,177 2,149 Biomass 3,568 3,902 3,549 3,584 3,503 3,733 3,668 3,837 4,129 3,845 3,591 Geothermal N/A N/A N/A N/A N/A N/A N/A 4,070 2,802 2,746 N/A MSW - Landfill Gas 8,156 8,908 8,086 8,156 7,964 8,523 8,322 8,585 9,223 8,585 8,279 Conventional Hydropower N/A N/A 4,323 1,366 1,993 1,802 N/A 3,435 3,500 2,898 3,460 Wind 2,217 1,625 2,217 2,217 2,046 1,527 1,567 2,869 2,205 1,824 1,663 Wind Offshore 6,454 N/A 5,931 N/A 5,828 N/A N/A N/A 6,732 6,557 N/A Solar Thermal N/A N/A N/A N/A N/A N/A 3,878 4,152 4,727 4,178 3,894 Solar PV - tracking 1,917 1,673 1,684 1,423 1,762 1,473 1,904 2,266 2,383 1,493 1,957 Solar PV - fixed tilt 1,797 1,568 1,578 1,333 1,651 1,381 1,785 2,124 2,233 1,399 1,834 Costs include contingency factors and regional cost and ambient conditions multipliers. Interest charges are excluded. The costs are shown before investment tax credits are applied. N/A: Not available; plant type cannot be built in the region due to lack of resources, sites or specific state legislation. Electricity Market Module region map: http://www.eia.gov/outlooks/aeo/pdf/nerc_map.pdf
March 2018
U.S. Energy Information Administration | Assumptions to the Annual Energy Outlook 2018: Electricity Market Module 6
New construction financing The capacity planning module of the EMM assumes that new power plants are built in a competitive environment and that different generating technologies generally have the same financing assumptions, with a few exceptions described below. Projects are assumed to be financed by both debt and equity, and the after-tax1 weighted average cost of capital is used as the discount rate when calculating the discounted cash flow analysis for building and operating new plants.
In the AEO2018, the assumed debt fraction for new builds is 60%, with a corresponding 40% equity fraction. Because plants that receive a tax credit (either production tax credit, PTC, or investment tax credit, ITC) typically require a tax equity partner to take advantage of the credits, they will have a larger share of equity. Therefore, the EMM assumes that the debt fraction is lowered to 50% for technologies receiving a tax credit, but this fraction shifts back to 60% as the tax credits are phased out. If tax credits were extended, the difference in the debt fraction would remain (as in the No PTC/ITC Sunset case run for a forthcoming Issues in Focus article).
The cost of debt is based on the Industrial Baa bond rate, passed to the EMM as an annual projection from the Macroeconomic Module. The cost of debt in AEO2018 averages 6.7% for capacity builds from 2020 through 2050. The cost of equity is calculated using the Capital Asset Pricing Model (CAPM), which assumes the return is equal to a risk-free rate plus a risk premium specific to the industry (described in more detail in the EMM documentation). The average cost of equity in AEO2018 is 11.2% and the resulting discount rate with a 60/40 debt/equity split is 7.0% from 2020 through 2050.
In the AEO2018 Reference case, there is a three-percentage-point adder to the cost of capital (both equity and debt) when evaluating investments in new coal-fired power plants and new coal-to-liquids (CTL) plants without full CCS. AEO2018 also assumes pollution control retrofits to reflect financial risks associated with major investments in long-lived power plants with a relatively higher rate of carbon dioxide (CO2) emissions. Although only coal-fired technologies with CCS are assumed available for new builds, the technology that captures 30% of CO2 emissions is still considered a high emitter relative to other new sources and may continue to face potential financial risk if carbon emission controls are further strengthened. Only the technology designed to capture 90% of CO2 emissions does not receive the three-percentage-point increase in cost of capital.
Technological optimism and learning Overnight costs for each technology are calculated as a function of regional construction parameters, project contingency, and technological optimism and learning factors.
The technological optimism factor represents the demonstrated tendency to underestimate actual costs for a first-of-a-kind, unproven technology. As experience is gained (after building four units), the technological optimism factor is gradually reduced to 1.0.
The learning function in NEMS is determined at a component level. Each new technology is broken into its major components, and each component is identified as revolutionary, evolutionary, or mature. Different learning rates are assumed for each component, based on the level of experience with the
1 The AEO2018 was prepared prior to passage of the Tax Cuts and Jobs Act of 2017 and does not incorporate the change to the corporate tax rate or tax depreciation schedules.
March 2018
U.S. Energy Information Administration | Assumptions to the Annual Energy Outlook 2018: Electricity Market Module 7
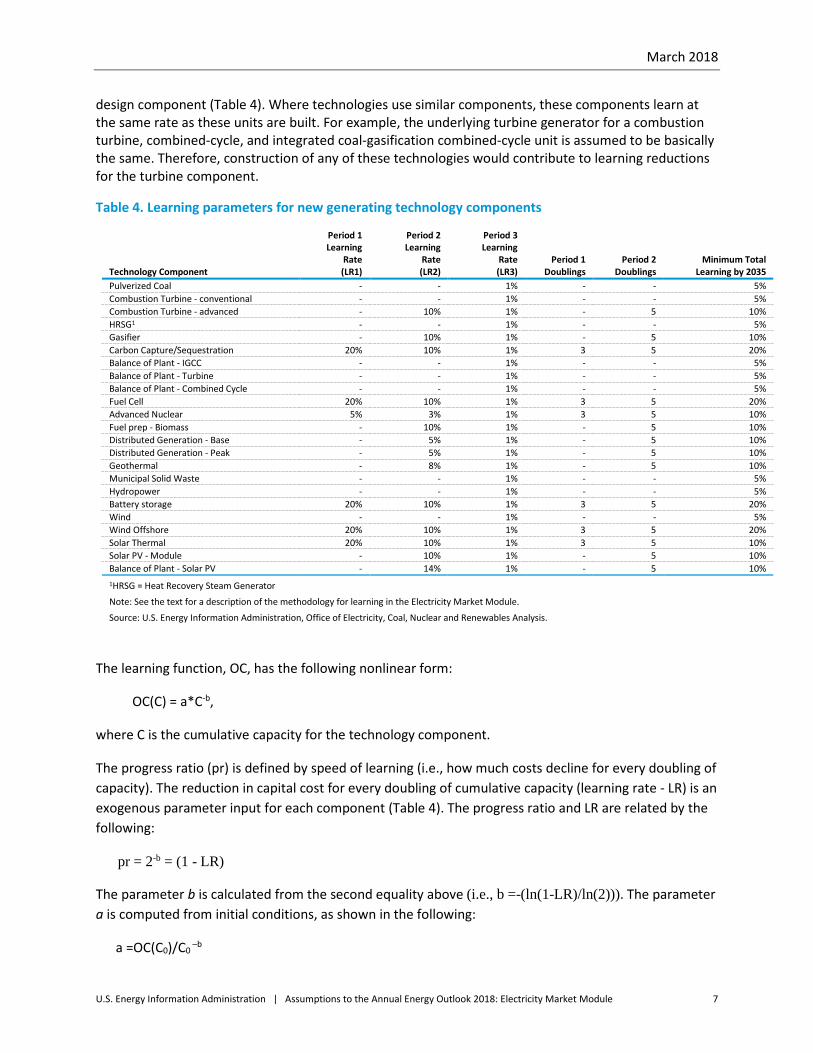
design component (Table 4). Where technologies use similar components, these components learn at the same rate as these units are built. For example, the underlying turbine generator for a combustion turbine, combined-cycle, and integrated coal-gasification combined-cycle unit is assumed to be basically the same. Therefore, construction of any of these technologies would contribute to learning reductions for the turbine component.
Table 4. Learning parameters for new generating technology components
Period 1 Period 2 Period 3
Learning
Rate Learning
Rate Learning
Rate Period 1 Period 2 Minimum Total Technology Component (LR1) (LR2) (LR3) Doublings Doublings Learning by 2035 Pulverized Coal - - 1% - - 5% Combustion Turbine - conventional - - 1% - - 5% Combustion Turbine - advanced - 10% 1% - 5 10% HRSG1 - - 1% - - 5% Gasifier - 10% 1% - 5 10% Carbon Capture/Sequestration 20% 10% 1% 3 5 20% Balance of Plant - IGCC - - 1% - - 5% Balance of Plant - Turbine - - 1% - - 5% Balance of Plant - Combined Cycle - - 1% - - 5% Fuel Cell 20% 10% 1% 3 5 20% Advanced Nuclear 5% 3% 1% 3 5 10% Fuel prep - Biomass - 10% 1% - 5 10% Distributed Generation - Base - 5% 1% - 5 10% Distributed Generation - Peak - 5% 1% - 5 10% Geothermal - 8% 1% - 5 10% Municipal Solid Waste - - 1% - - 5% Hydropower - - 1% - - 5% Battery storage 20% 10% 1% 3 5 20% Wind - - 1% - - 5% Wind Offshore 20% 10% 1% 3 5 20% Solar Thermal 20% 10% 1% 3 5 10% Solar PV - Module - 10% 1% - 5 10% Balance of Plant - Solar PV - 14% 1% - 5 10% 1HRSG = Heat Recovery Steam Generator
Note: See the text for a description of the methodology for learning in the Electricity Market Module.
Source: U.S. Energy Information Administration, Office of Electricity, Coal, Nuclear and Renewables Analysis.
The learning function, OC, has the following nonlinear form:
OC(C) = a*C-b,
where C is the cumulative capacity for the technology component.
The progress ratio (pr) is defined by speed of learning (i.e., how much costs decline for every doubling of capacity). The reduction in capital cost for every doubling of cumulative capacity (learning rate - LR) is an exogenous parameter input for each component (Table 4). The progress ratio and LR are related by the following:
pr = 2-b = (1 - LR)
The parameter b is calculated from the second equality above (i.e., b =-(ln(1-LR)/ln(2))). The parameter a is computed from initial conditions, as shown in the following:
a =OC(C0)/C0 –b
March 2018
U.S. Energy Information Administration | Assumptions to the Annual Energy Outlook 2018: Electricity Market Module 8
where C0 is the initial cumulative capacity. Once the rates of learning (LR) and the cumulative capacity (C0) are known for each interval, the parameters (a and b) can be computed. Three learning steps were developed to reflect different stages of learning as a new design is introduced into the market. New designs with a significant amount of untested technology will see high rates of learning initially, while more conventional designs will not have as much learning potential. Costs of all design components are adjusted to reflect a minimal amount of learning, even if new capacity additions are not projected. This methodology represents cost reductions due to future international development or increased research and development.
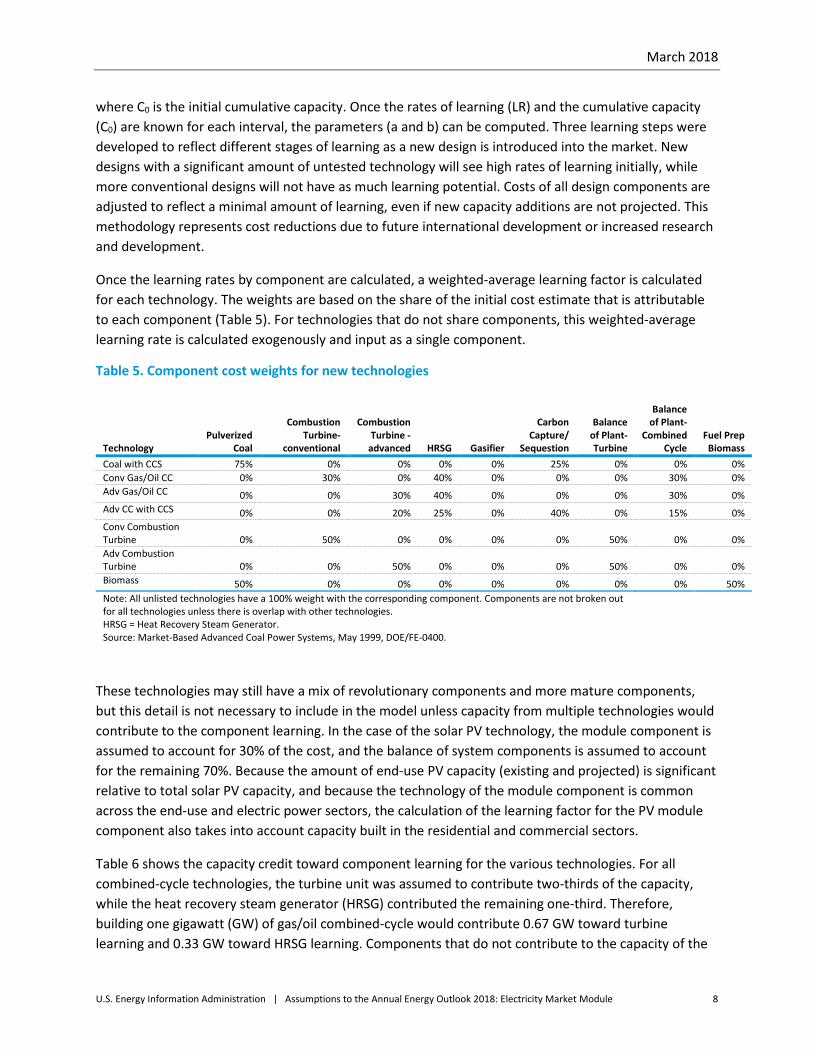
Once the learning rates by component are calculated, a weighted-average learning factor is calculated for each technology. The weights are based on the share of the initial cost estimate that is attributable to each component (Table 5). For technologies that do not share components, this weighted-average learning rate is calculated exogenously and input as a single component.
Table 5. Component cost weights for new technologies
Technology Pulverized
Coal
Combustion Turbine-
conventional
Combustion Turbine -
advanced
HRSG Gasifier
Carbon Capture/
Sequestion
Balance of Plant-Turbine
Balance of Plant-
Combined Cycle
Fuel Prep Biomass
Coal with CCS 75% 0% 0% 0% 0% 25% 0% 0% 0% Conv Gas/Oil CC 0% 30% 0% 40% 0% 0% 0% 30% 0% Adv Gas/Oil CC 0% 0% 30% 40% 0% 0% 0% 30% 0% Adv CC with CCS 0% 0% 20% 25% 0% 40% 0% 15% 0% Conv Combustion Turbine 0% 50% 0% 0% 0% 0% 50% 0% 0% Adv Combustion Turbine 0% 0% 50% 0% 0% 0% 50% 0% 0% Biomass 50% 0% 0% 0% 0% 0% 0% 0% 50% Note: All unlisted technologies have a 100% weight with the corresponding component. Components are not broken out for all technologies unless there is overlap with other technologies. HRSG = Heat Recovery Steam Generator. Source: Market-Based Advanced Coal Power Systems, May 1999, DOE/FE-0400.
These technologies may still have a mix of revolutionary components and more mature components, but this detail is not necessary to include in the model unless capacity from multiple technologies would contribute to the component learning. In the case of the solar PV technology, the module component is assumed to account for 30% of the cost, and the balance of system components is assumed to account for the remaining 70%. Because the amount of end-use PV capacity (existing and projected) is significant relative to total solar PV capacity, and because the technology of the module component is common across the end-use and electric power sectors, the calculation of the learning factor for the PV module component also takes into account capacity built in the residential and commercial sectors.
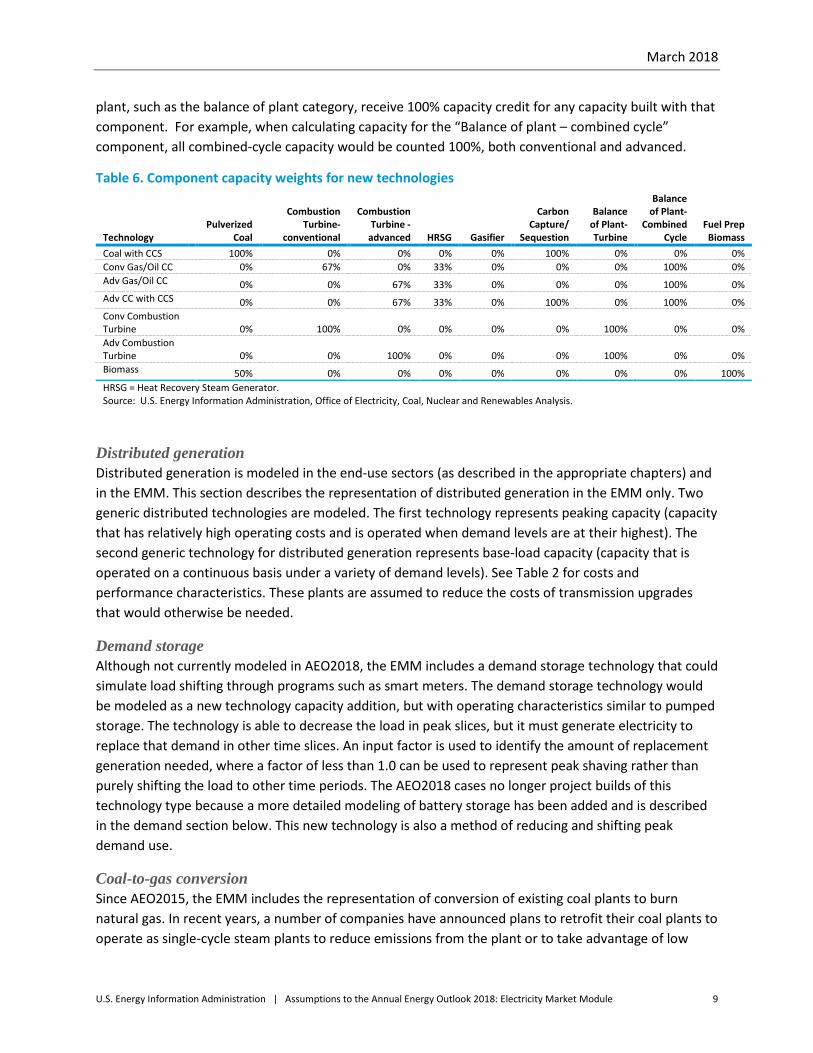
Table 6 shows the capacity credit toward component learning for the various technologies. For all combined-cycle technologies, the turbine unit was assumed to contribute two-thirds of the capacity, while the heat recovery steam generator (HRSG) contributed the remaining one-third. Therefore, building one gigawatt (GW) of gas/oil combined-cycle would contribute 0.67 GW toward turbine learning and 0.33 GW toward HRSG learning. Components that do not contribute to the capacity of the
March 2018
U.S. Energy Information Administration | Assumptions to the Annual Energy Outlook 2018: Electricity Market Module 9
plant, such as the balance of plant category, receive 100% capacity credit for any capacity built with that component. For example, when calculating capacity for the “Balance of plant – combined cycle” component, all combined-cycle capacity would be counted 100%, both conventional and advanced.
Table 6. Component capacity weights for new technologies
Technology Pulverized
Coal
Combustion Turbine-
conventional
Combustion Turbine -
advanced
HRSG Gasifier
Carbon Capture/
Sequestion
Balance of Plant-Turbine
Balance of Plant-
Combined Cycle
Fuel Prep Biomass
Coal with CCS 100% 0% 0% 0% 0% 100% 0% 0% 0% Conv Gas/Oil CC 0% 67% 0% 33% 0% 0% 0% 100% 0% Adv Gas/Oil CC 0% 0% 67% 33% 0% 0% 0% 100% 0% Adv CC with CCS 0% 0% 67% 33% 0% 100% 0% 100% 0% Conv Combustion Turbine 0% 100% 0% 0% 0% 0% 100% 0% 0% Adv Combustion Turbine 0% 0% 100% 0% 0% 0% 100% 0% 0% Biomass 50% 0% 0% 0% 0% 0% 0% 0% 100% HRSG = Heat Recovery Steam Generator. Source: U.S. Energy Information Administration, Office of Electricity, Coal, Nuclear and Renewables Analysis.
Distributed generation Distributed generation is modeled in the end-use sectors (as described in the appropriate chapters) and in the EMM. This section describes the representation of distributed generation in the EMM only. Two generic distributed technologies are modeled. The first technology represents peaking capacity (capacity that has relatively high operating costs and is operated when demand levels are at their highest). The second generic technology for distributed generation represents base-load capacity (capacity that is operated on a continuous basis under a variety of demand levels). See Table 2 for costs and performance characteristics. These plants are assumed to reduce the costs of transmission upgrades that would otherwise be needed.
Demand storage Although not currently modeled in AEO2018, the EMM includes a demand storage technology that could simulate load shifting through programs such as smart meters. The demand storage technology would be modeled as a new technology capacity addition, but with operating characteristics similar to pumped storage. The technology is able to decrease the load in peak slices, but it must generate electricity to replace that demand in other time slices. An input factor is used to identify the amount of replacement generation needed, where a factor of less than 1.0 can be used to represent peak shaving rather than purely shifting the load to other time periods. The AEO2018 cases no longer project builds of this technology type because a more detailed modeling of battery storage has been added and is described in the demand section below. This new technology is also a method of reducing and shifting peak demand use.
Coal-to-gas conversion Since AEO2015, the EMM includes the representation of conversion of existing coal plants to burn natural gas. In recent years, a number of companies have announced plans to retrofit their coal plants to operate as single-cycle steam plants to reduce emissions from the plant or to take advantage of low

March 2018
U.S. Energy Information Administration | Assumptions to the Annual Energy Outlook 2018: Electricity Market Module 10
natural gas prices [3]. AEO2018 includes explicit representation of conversions of 1.1 GW after 2017 by changing the plant type and fuel source for specific units, based on announced plans. Additionally, the EMM includes the option to convert additional coal plants to gas-fired steam plants if economic.
The modeling structure for coal-to-gas conversions was based on the Environmental Protection Agency’s (EPA) modeling for the Base Case v.5.13 [4]. For this modeling, coal-to-gas conversion refers to the modification of an existing boiler to allow it to fire natural gas. Coal-to-gas conversion, in this instance, does not refer to the addition of a gas turbine, the replacement of a coal boiler with a new natural gas combined-cycle plant, or to the gasification of coal for use in a combustion turbine. The cost for the retrofit option is composed of two components—boiler modification costs and the cost of extending natural gas lateral pipeline spurs from the boiler to a natural gas main pipeline.
Allowing natural gas firing in a coal boiler typically involves installation of new gas burners as well as modifications to the boiler and possibly environmental equipment. EPA’s estimates were developed by engineering staff and discussions with industry engineers and were designed to be applicable across the existing coal fleet. In the EMM, costs were estimated for eligible coal plants identified by EPA, which excluded units under 25 megawatts (MW), as well as units with fluidized-bed combustion or stoker boilers. The EMM does not include any capacity penalty for conversion to gas, but a 5% heat rate penalty is assumed in order to reflect reduced efficiency as a result of lower stack temperature and the corresponding higher moisture loss when gas is combusted instead of coal. Fixed O&M costs are assumed to be reduced by 33% for the converted plant because of reduced needs for operators, maintenance materials, and maintenance staff. Variable O&M costs are reduced by 25% because waste disposal and other costs would be lower. The incremental capital cost is described by the following functions:
For pulverized-coal-fired boilers:
Cost per kW = 267 * (75 / CAP)0.35
For cyclone boilers:
Cost per kW = 374 * (75 / CAP)0.35
Where CAP is the capacity of the unit in MW, and the calculated cost is in 2011 dollars per kilowatt (kW).
To get unit-specific costs, EIA used EPA’s assumptions regarding natural gas pipeline requirements, which were based on a detailed assessment for every coal boiler in the United States, to determine gas volumes needed, distance to the closest pipeline, and size of the lateral pipeline required. The resulting cost per kW of boiler capacity varies widely, with an average cost of $197/kW (in 2017 dollars).
Representation of electricity demand The annual electricity demand projections from the NEMS demand modules are converted into load-duration curves for each of the EMM regions (based on North American Electric Reliability Corporation regions and subregions) using historical hourly load data. The load-duration curve in the EMM has nine time slices. First, the load data are split into three seasons: winter (December through March), summer (June through September), and fall/spring. Within each season the load data are sorted from high to

March 2018
U.S. Energy Information Administration | Assumptions to the Annual Energy Outlook 2018: Electricity Market Module 11
low, and three load segments are created: a peak segment representing the top 1% of the load, and then two off-peak segments representing the next 49% and 50%, respectively. The seasons were defined to account for seasonal variation in supply availability.
Because solar and wind availability depends on time of day and season, additional data from the underlying hourly load shapes are also considered in the EMM to identify the coincidence of low load on the system and high levels of intermittent output. The impacts of solar and wind generation on system dispatch are considered on an hourly basis based on three day types per month for a total of 864 time slices. This hourly evaluation includes the impact on the minimum generation limits of other system resources and the time-of-day value of the solar and wind generation. Results of this evaluation are used to inform the overall system optimization for dispatch and capacity planning and could lead to curtailment of intermittent sources during some time slices. However, a four-hour battery storage technology was added for AEO2018 and is used to help balance the intermittent generation with demand.
To evaluate the value of battery storage, a simplified merit-order dispatch is performed at the more detailed 864 time slices described above, after adjusting load for any intermittent generation available in that hour. Storage capacity can be added if the net gain from operating and discharging the battery for a given month and day type is positive. This net gain is used to offset the investment cost when determining new builds in the electricity capacity planning model.
Although the annual demands from the end-use modules are typically provided net of any onsite generation, an enhancement was developed for AEO2017 and remains in place to account for behind-the-meter PV generation (i.e., rooftop PV generation) more explicitly in the EMM. Because the end-use models only provide an annual demand, they cannot accurately reflect when the PV generation occurs. Instead, the generation from these systems was modeled by approximating reductions in load for several specific end-use applications. The EMM now receives the total end-use demands without removing rooftop PV generation and then dispatches both power sector and end-use PV capacity using detailed solar resource profiles. Although the total generation requirement from the power sector capacity is the same as before, this enhancement more accurately reflects the demand and resource availability by time slice.
Reserve margins (the percentage of capacity in excess of peak demand required to adequately maintain reliability during unforeseeable outages) are established for each region by its governing body—public utility commission, NERC region, or Independent System Operator (ISO)/Regional Transmission Organization (RTO). The reserve margin values from the AEO2018 Reference case are set based on these regional Reference Margins reported to NERC, ranging from 14% to 17% [5].
Operating reserves In addition to the planning reserve margin requirement, system operators typically require a specific level of operating reserves—generators available within a short period of time to meet demand in case a generator goes down or another supply disruption occurs. These reserves can be provided through plants that are already operating but not at full capacity (spinning reserves) as well as through capacity not currently operating but that can be brought online quickly (non-spinning reserves). This assumption is particularly important as more intermittent generators are added to the grid because technologies

March 2018
U.S. Energy Information Administration | Assumptions to the Annual Energy Outlook 2018: Electricity Market Module 12
like wind and solar have uncertain availability that can be difficult to predict. Since AEO2014, the capacity and dispatch submodules of the EMM have been updated to include explicit constraints requiring spinning reserves in each load slice. The amount of spinning reserves required is computed as a percentage of the load height of the slice plus a percentage of the distance between the load of the slice and the seasonal peak. An additional calculated requirement is a percentage of the intermittent capacity available in that period to reflect the greater uncertainty associated with the availability of intermittent resources. All technologies except storage, intermittents, and distributed generation can be used to meet spinning reserves. Different operating modes are developed for each technology type to allow the model to choose between operating a plant to maximize generation versus contributing to spinning reserves, or a combination. Minimum levels of generation are required if a plant is contributing to spinning reserves, and they vary by plant type, with plant types typically associated with baseload operation having higher minimums than those that can operate more flexibly to meet intermediate or peak demand.
Variable heat rates for coal-fired power plants Low natural gas prices and rising shares of intermittent generation have led to a shift in coal plant operations from baseload to greater cycling. The efficiency of coal plants can vary based on their output level, with reduced efficiency when plants are run in a cycling mode or to provide operating reserves. The AEO2017 code introduced variable heat rates for coal plants based on the operating mode chosen by the EMM to better reflect actual fuel consumption and costs.
A relationship between operating levels and efficiencies was constructed from data available for 2013 through 2015 in the EPA continuous emission monitoring system (CEMS) and other EMM plant data. A statistical analysis was used to estimate piecewise linear equations that reflect the efficiency as a function of the generating unit’s output. The equations were estimated by coal plant type, taking into account the configuration of existing environmental controls, and by the geographic coal demand region for the plant, based on the plant-level data. Equations were developed for up to 10 different coal plant configurations across the 16 coal regions used in the EMM. The form of the piecewise linear equations for each plant type and region combination can vary and has between 3 and 11 steps.
Within the EMM, these equations are used to calculate heat-rate adjustment factors to normalize the average heat rate in the input plant database (which is based on historical data and associated with a historical output level), and to adjust the heat rate under different operating modes. The EMM currently allows six different modes within each season for coal plants. They are based on combinations of maximizing generation, maximizing spinning reserves, or load following, and they can be invoked for the full season (all three time slices) or for approximately half the season (only peak and intermediate slice). Each of these is associated with different output levels, and the heat rate adjustment factor is calculated based on the capacity factor implied by the operating mode.
Fossil fuel-fired and nuclear steam plant retirement Fossil-fired steam plant retirements and nuclear retirements are determined endogenously within the model. Generating units are assumed to retire when continuing to run them is no longer economical. Each year, the model determines whether the market price of electricity is sufficient to support the continued operation of existing plant generators. A generating unit is assumed to retire if the expected
March 2018
U.S. Energy Information Administration | Assumptions to the Annual Energy Outlook 2018: Electricity Market Module 13
revenues from the generator are not sufficient to cover the annual going-forward costs and if the overall cost of producing electricity can be lowered by building replacement capacity. The going-forward costs include fuel, O&M costs, and annual capital additions, which are unit-specific and based on historical data. The average annual capital additions for existing plants are $9 per kW for oil and gas steam plants, $18 per kW for coal plants, and $26 per kW for nuclear plants (in 2017 dollars). These costs are added to the estimated costs at existing plants regardless of their age. Beyond 30 years of age, an additional $7 per kW capital charge for fossil plants and $35 per kW capital charge for nuclear plants is included in the retirement decision to reflect further investment to address the impacts of aging. Age-related cost increases are attributed to capital expenditures for major repairs or retrofits, decreases in plant performance, and/or increases in maintenance costs to mitigate the effects of aging.
EIA assumes that all retirements reported as planned during the next 10 years on the Form EIA-860, Annual Electric Generator Report, will occur, in addition to some others that have been announced but not yet reported to EIA. This assumption includes 5.1 GW of nuclear capacity retirements and 33.5 GW of coal capacity retirements after 2017.
An additional external analysis of factors affecting the potential for nuclear power plant retirement was undertaken for AEO2018. In recent years, nuclear power plants have faced challenging local market conditions because of low electricity prices, flat demand growth, rising operating costs and/or growth in subsidized renewable generation. Many of these factors are not adequately captured in the larger regions modeled by the EMM or represent economic decisions not considered explicitly in NEMS. The external analysis assigned risk factors related to retirements to the existing nuclear fleet and approximately 13 GW of nuclear capacity was determined likely to retire in all AEO cases. This analysis was implemented using regional derate factors, with the timing and location of the derates based on the analysis.
For AEO2018, EIA updated the nuclear unit operating costs using inputs from an Idaho National Laboratory (INL) Report [6], which was based on a review of public and proprietary cost data for three plant types:
– Small single-unit nuclear plants (less than 900 MW)
– Large single-unit nuclear plants (greater than or equal to 900 MW)
– Multiple-unit nuclear plants
EIA compared the INL data with the average unit cost data previously used in the EMM for these plant types and found that for multiple-unit plants the EIA data were close to the reported INL costs. However, for the single-unit plants, the costs were substantially lower than the INL estimates, particularly for small single-unit nuclear plants. The input nuclear O&M cost assumptions were updated to be consistent with the INL costs, and additional endogenous nuclear unit retirements are projected for AEO2018 Reference case beyond the announced nuclear unit retirements and derates mentioned above.
Biomass co-firing Coal-fired power plants are assumed to co-fire with biomass fuel if doing so is economical. Co-firing

March 2018
U.S. Energy Information Administration | Assumptions to the Annual Energy Outlook 2018: Electricity Market Module 14
requires a capital investment for boiler modifications and fuel handling. This expenditure is assumed to be $543 per kW of biomass capacity. A coal-fired unit modified to allow co-firing can generate up to 15% of the total output using biomass fuel, assuming sufficient residue supplies are available.
Nuclear uprates The AEO2018 nuclear power projection assumes capacity increases at existing units. Nuclear plant operators can increase the rated capacity at plants through power uprates, which are license amendments that must be approved by the U.S. Nuclear Regulatory Commission. Uprates can vary from small (less than 2%) increases in capacity, which require very little capital investment or plant modification, to extended uprates of 15% to 20%, requiring significant modifications. AEO2018 assumes that uprates reported to EIA as planned modifications on the Form EIA-860 will take place in the Reference case, representing 42 MW of additional capacity. EIA also analyzed the remaining uprate potential by reactor, based on the reactor design and previously implemented uprates, and developed regional estimates for projected uprates. A total of 3.8 GW of increased nuclear capacity through uprates is assumed to occur in 2018 through 2040.
Interregional electricity trade Both firm and economy electricity transactions among utilities in different regions are represented within the EMM. In general, firm power transactions involve the trading of capacity and energy to help another region satisfy its reserve margin requirement, while economy transactions involve energy transactions motivated by the marginal generation costs of different regions. The flow of power from region to region is constrained by the existing and planned capacity limits as reported in the NERC and Western Electricity Coordinating Council Summer and Winter Assessment of Reliability of Bulk Electricity Supply in North America, as well as information obtained from the Open Access Same-Time Information System (OASIS). Known firm power contracts are compiled from the Federal Energy Regulatory Commission (FERC) Form 1, "Annual Report of Major Electricity Utility," as well as information provided in the latest available Summer and Winter Assessments and individual ISO reports. The EMM includes an option to add interregional transmission capacity. In some cases it may be more economical to build generating capacity in a neighboring region, but additional costs to expand the transmission grid will be incurred. Explicitly expanding the interregional transmission capacity may also make the transmission line available for additional economy trade.
Economy transactions are determined in the dispatching submodule by comparing the marginal generating costs of adjacent regions in each time slice. If one region has less-expensive generating resources available in a given time period (adjusting for transmission losses and transmission capacity limits) than another region, the regions are assumed to exchange power.
International electricity trade Two components of international firm power trade are represented in the EMM—existing and planned transactions and unplanned transactions. Data on existing and planned transactions are compiled from the FERC Form 1 and provincial reliability assessments. Unplanned firm power trade is represented by competing Canadian supply with U.S. domestic supply options. Canadian supply is represented via supply curves using cost data from the U.S. Department of Energy report, Northern Lights: The Economic and Practical Potential of Imported Power from Canada (DOE/PE-0079). International economy trade is

March 2018
U.S. Energy Information Administration | Assumptions to the Annual Energy Outlook 2018: Electricity Market Module 15
determined endogenously based on surplus energy expected to be available from Canada by region in each time slice. Canadian surplus energy was determined using a mini-dispatch model that utilizes Canadian provincial plant data, load curves, demand forecasts, and fuel prices to determine the excess electricity supply by year, load slice, supply step, step cost, and Canadian province.
Electricity pricing Electricity pricing is projected for 22 electricity market regions for fully competitive, partially competitive, and fully regulated supply regions. The price of electricity to the consumer comprises the price of generation, transmission, and distribution, including applicable taxes.
Transmission and distribution are considered to remain regulated in the AEO. This assumption means that the price of transmission and distribution is based on the average cost to build, operate, and maintain these systems using a cost of service regulation model. The price of electricity in the regulated regions consists of the average cost of generation, transmission, and distribution for each customer class.
In the competitive regions, the energy component of price is based on marginal cost, which is defined as the cost of the last (or most expensive) unit dispatched. The competitive generation price includes the marginal energy cost (fuel and variable operations and maintenance costs), taxes, and a capacity payment. The capacity payment is calculated as a combination of levelized costs for combustion turbines and the marginal value of capacity calculated within the EMM. The capacity payment is calculated for all competitive regions and should be viewed as a proxy for additional capital recovery that must be procured from customers rather than the representation of a specific market. The capacity payment also includes the costs associated with meeting the spinning reserves requirement discussed earlier. The total cost for both reserve margin and spinning reserve requirements in a given region is calculated within the EMM and allocated to the sectors based on their contribution to overall peak demand.
The price of electricity in the regions with a competitive generation market consists of the competitive cost of generation summed with the average costs of transmission and distribution. The price for mixed regions reflects a load-weighted average of the competitive price and the regulated price, based on the percent of electricity load in the region subject to deregulation. In competitively supplied regions, a transition period is assumed to occur (usually over a 10-year period) from the effective date of restructuring, with a gradual shift to marginal cost pricing.
The AEO2018 Reference case assumes full competitive pricing in the three New York regions and in the ReliabilityFirst Corporation/East region and 95% competitive pricing in New England (Vermont being the only fully-regulated state in that region). Eight regions fully regulate their electricity supply, including the Florida Reliability Coordinating Council, four of the SERC Reliability Corporation subregions–Delta (SRDA), Southeastern (SRSE), Central (SRCE) and Virginia-Carolina (SRVC), the Southwest Power Pool Regional Entities (SPNO and SPSO), and the Western Electricity Coordinating Council/Rockies (RMPA). The Texas Reliability Entity, which in the past was considered fully competitive by 2010, is now only 88% competitive, since many cooperatives have declined to become competitive or allow competitive energy to be sold to their customers. California returned to almost fully regulated pricing in 2002, after beginning a transition to competition in 1998, with only 10% competitive supply sold currently in the
March 2018
U.S. Energy Information Administration | Assumptions to the Annual Energy Outlook 2018: Electricity Market Module 16
Western Electricity Coordinating Council (WECC)/California (CAMX) region. All other regions reflect a mix of both competitive and regulated prices.
Pricing structures for ratepayers in competitive states have experienced ongoing changes since the inception of retail competition. AEO has incorporated these changes as they have been incorporated into utility tariffs. For instance, as a result of volatile fuel markets, state regulators have sometimes had a hard time enticing retail suppliers to offer competitive supply to residential and smaller commercial and industrial customers. Subsequent state legislation has led to generation service supplied by regulator or utility-run auction or competitive bid for the market energy price plus an administration fee.
Typical charges that all customers must pay on the distribution portion of their bill (depending on where they reside) include transition charges (including persistent stranded costs), public benefits charges (usually for efficiency and renewable energy programs), administrative costs of energy procurement, and nuclear decommissioning costs. Costs added to the transmission portion of the bill include the Federally Mandated Congestion Charges (FMCC), a bill pass-through associated with the FERC passage of Standard Market Design (SMD) to enhance reliability of the transmission grid and control congestion. Additional costs not included in historical data sets have been added in adjustment factors to the transmission and distribution capital, O&M costs, which affect the cost of both competitive and regulated electricity supply. Since most of these costs, such as transition costs, are temporary in nature, they are gradually phased out over the projection period.
Electricity distribution prices would be adjusted for two aspects related to the Clean Power Plan (CPP), a state level program to reduce CO2 emissions, if the program were assumed to be in place. As described in more detail in the Legislation and Regulations section below, the AEO2018 Reference case no longer includes the CPP, but several case scenarios do reflect its inclusion. The CPP would be expected to induce incremental energy efficiency (EE) due to programs implemented by the end-use sectors but affecting consumers costs. The residential and commercial modules pass the costs associated with any incremental EE programs to the EMM where they are added to the distribution component of electricity price. Additionally, as the program is implemented in the CPP cases, a CO2 emission cap is in place that results in CO2 allowances being allocated. If allowances are allocated to load serving entities, as assumed in the CPP cases, the costs of purchasing the allowances (by generators) is reflected in the generation price, but distribution prices are reduced to reflect the revenues that the load-serving entities receive from the sale of the allowances and rebate back to consumers.
Fuel price expectations Capacity planning decisions in the EMM are based on a life-cycle cost analysis over a 30-year period, which requires foresight assumptions for fuel prices. Expected prices for coal, natural gas, and oil are derived using rational expectations, or perfect foresight. In this approach, expectations for future years are defined by the realized solution values for these years in a prior model run. The expectations for the world oil price and natural gas wellhead price are set using the resulting prices from a prior model run. The markups to the delivered fuel prices are calculated based on the markups from the previous year within a NEMS run. Coal prices are determined using the same coal supply curves developed in the NEMS Coal Market Module. The supply curves produce prices at different levels of coal production, as a

March 2018
U.S. Energy Information Administration | Assumptions to the Annual Energy Outlook 2018: Electricity Market Module 17
function of labor productivity, and costs and utilization of mines. Expectations for each supply curve are developed in the EMM based on the actual demand changes from the prior run throughout the projection horizon, resulting in updated mining utilization and different supply curves.
The perfect foresight approach generates an internally consistent scenario for which the formation of expectations is consistent with the projections realized in the model. The NEMS model involves iterative cycling of runs until the expected values and realized values for variables converge between cycles.
Nuclear fuel prices Nuclear fuel prices are calculated through an offline analysis that determines the delivered price to generators in mills per kilowatthour (kWh). To produce reactor-grade uranium, the uranium (U3O8) must first be mined and then sent through a conversion process to prepare for enrichment. The enrichment process takes the fuel to a given purity of uranium-235, typically 3% to 5% for commercial reactors in the United States. Finally, the fabrication process prepares the enriched uranium for use in a specific type of reactor core. The price of each of the processes is determined, and the prices are summed to get the final price of the delivered fuel. The analysis uses forecasts from Energy Resources International for the underlying uranium prices.
Legislation and regulations Clean Air Act Amendments of 1990 (CAAA1990) and Cross-State Air Pollution Rule (CSAPR) AEO2018 includes the implementation of the Cross-State Air Pollution Rule (CSAPR), which addresses the interstate transport of air emissions from power plants. After a series of court rulings over the years, the Supreme Court in October 2014 lifted its stay and upheld CSAPR as a replacement for the Clean Air Interstate Rule. On September 7, 2016, EPA finalized an update to the CSAPR ozone season program. AEO2018 incorporates the associated program emission budgets and target dates.
Under CSAPR, 27 states must restrict emissions of sulfur dioxide (SO2) and/or nitrogen oxide (NOx), which are precursors to the formation of fine particulate matter (PM2.5) and ozone. CSAPR establishes four distinct allowance trading programs for SO2 and NOx composed of different member states based upon the contribution of each state to downwind non-attainment of National Ambient Air Quality Standards (Figure 2). In addition, CSAPR splits the allowance trading program into two regions for SO2, Group 1 and Group 2, with trading permitted only between states within a group (approximated in NEMS by trade between coal demand regions) but not between groups.
In addition to interstate transport, the Clean Air Act Amendments of 1990 introduced the requirement for existing major stationary sources of NOx located in nonattainment areas to install and operate NOx controls that meet Reasonably Available Control Technology (RACT) standards. To implement this requirement, EPA developed a two-phase NOx program, with the first set of RACT standards for existing coal plants put in place in 1996 and the second set was implemented in 2000. Dry bottom wall-fired and tangential-fired boilers, the most common boiler types, referred to as Group 1 Boilers, were required to make significant reductions beginning in 1996 and further reductions in 2000. Relative to their uncontrolled emission rates, which range roughly between 0.6 and 1.0 pounds per million British thermal units (Btu), these boilers are required to reduce NOx emissions by 25% to 50% to meet the Phase I limits. Further reductions are required to meet the Phase II limits. EPA did not impose limits on existing oil and gas plants, but some states have instituted additional NOx regulations. All new fossil

March 2018
U.S. Energy Information Administration | Assumptions to the Annual Energy Outlook 2018: Electricity Market Module 18
units are required to meet current standards. In pounds per million Btu, these limits are 0.11 for conventional coal, 0.02 for advanced coal, 0.02 for combined cycle, and 0.08 for combustion turbines. These RACT NOx limits are incorporated in EMM.
Figure 2. Cross-State Air Pollution Rule
Source: U.S. Environmental Protection Agency, https://www.epa.gov/airmarkets
Table 7 shows the average capital costs for environmental control equipment used in NEMS for existing coal plants as retrofit options to remove SO2, NOx, mercury (Hg), and/or hydrogen chloride (HCl). In the EMM, plant-specific costs are calculated based on the size of the unit and other operating characteristics, and these numbers reflect the capacity-weighted averages of all plants falling into each size category. Flue gas desulfurization (FGD) units are assumed to remove 95% of the SO2 and selective catalytic reduction (SCR) units are assumed to remove 90% of the NOx.
Table 7. Coal plant retrofit costs 2017 dollars per kW
SCR Capital Costs Coal Plant Size (MW) FGD Capital Costs FF Capital Costs
<100 967 276 434
100–299 638 195 273
300–499 524 169 234
500–699 472 156 215
>=700 422 144 197

March 2018
U.S. Energy Information Administration | Assumptions to the Annual Energy Outlook 2018: Electricity Market Module 19
Clean Power Plan with New Source Performance Standards for power generation The CPP is not included in the AEO2018 Reference case, but results are reported for a CPP side case and the set of core side cases both with and without the CPP. EPA finalized the CPP in October 2015 as a means to implement performance standards for existing fossil fuel-fired plants under the Clean Air Act (CAA) Section 111(d) [7]. However, the future of national CO2 regulation is uncertain at this time because of recent court rulings, Executive Orders, and actions by EPA. The CPP was stayed by the Supreme Court on February 9, 2016, in a ruling on a lawsuit filed by 29 states and is now being held in abeyance by the appellate court at the request of the U.S. Department of Justice [8]. Following an Executive Order on Energy Independence, signed March 28, 2017, EPA issued a Notice of Proposed Rulemaking (NOPR) to repeal the CPP on October 12, 2017, based on the finding that it is inconsistent with the CAA [9, 10].
EPA further announced it will conduct an Advanced Notice of Proposed Rulemaking (ANPRM) to guide further regulatory action on the CPP, which may result in a narrower, more state-oriented interpretation of the CAA, or no further action. The CPP specified a 2018 deadline for state compliance plans to be filed with EPA, but Court rulings and EPA policy prohibit action on those plans. EIA will continue to monitor U.S. EPA rulemaking and will include any final rules in subsequent AEOs. While not included in the Reference case, the EMM assumptions and modeling of the CPP are unchanged from AEO2017 in scenarios specifically modeling this policy.
EPA also finalized carbon pollution standards for new, modified, and reconstructed power plants under CAA Section 111(b) in October 2015 [11]. The standards are included in the AEO2018 Reference case and all side cases by assuming that new coal technologies must have at least 30% carbon capture to ensure the ability to meet the standard of 1,400 lb CO2/MWh. New coal plants without CCS technology cannot be built. The new natural gas combined-cycle plants modeled in previous AEOs were already below the 1,000 lb CO2/MWh standard, and no change was necessary to the natural gas technology assumptions to reflect the final rule. The NEMS electricity model does not explicitly represent modified or reconstructed power plants, which are also covered by the rule.
The CPP set interim and final CO2 emission performance rates for two subcategories of fossil fuel-fired electric generating units (EGUs): existing fossil steam units (interim/final rate, 1,534/1,305 lb CO2/MWh net) and existing stationary combustion turbines (interim/final rate, 832/731 lb CO2/MWh net). The interim target was to be met in 2022 and the final target in 2030. EPA provided a phased-in approach over three steps during the implementation period.
States were given significant flexibility in implementing the CPP rule. EPA developed both rate-based and mass-based state-specific standards that are an equivalent quantitative expression of the source-specific rates, and the states may choose between the two program types. In so doing, each state could determine whether to apply its emissions reduction requirements to affected EGUs, or to meet the equivalent state-wide CPP rate-based goal or mass-based goal. After choosing the rate-based or mass-based compliance option, states would then choose between: (1) an Emission Standards Plan Type, in which the state places all requirements directly on its affected EGUs, with all requirements federally enforceable; and (2) a State Measures Plan Type, which can include a mix of measures that may apply to affected EGUs and/or other entities, and may lead to CO2 reductions from affected EGUs, but are not

March 2018
U.S. Energy Information Administration | Assumptions to the Annual Energy Outlook 2018: Electricity Market Module 20
federally enforceable. States could use a wide variety of measures to comply with the rate-based standards, including options not assumed by EPA in the calculation of the standard. For example, new nuclear generation, new end-use renewable generation, and incremental demand reductions resulting from energy efficiency could be used as zero-emitting compliance options to offset emissions from affected generators.
The EMM can represent both average rate-based or mass-based goals, with the option controlled by user input. Because the EMM is not a state-level model, EIA represents the CPP using EMM regions as compliance regions, implicitly assuming some level of state cooperation. EPA’s state-level targets are mapped to EMM regions using a generation-based weighting. Additional levels of cooperation across EMM regions can also be modeled. For the CPP cases, EIA assumed that all regions opted to meet a mass-based target and that trading was only performed within EMM regions.
EPA developed two different mass-based targets, one covering only existing sources and another including new sources. EIA assumed the target including new sources was implemented in the CPP cases because this satisfies EPA’s requirement to show that leakage of emissions to new sources will not occur as a result of implementation of the CPP. Other methods to limit leakage have not yet been well specified.
Under a mass-based program, an assumption must be made regarding the distribution of the initial allowances, which could be allocated to generators or load-serving entities, or sold through auction. The EMM was revised to represent any of these assumptions, with the impact flowing through to retail prices. The CPP cases assume allowances are allocated to load-serving entities, which provide the revenue back to consumers through lower distribution prices.
Mercury regulation The Mercury and Air Toxics Standards (MATS) were finalized in December 2011 to fulfill EPA’s requirement to regulate mercury emissions from power plants. MATS also regulate other hazardous air pollutants (HAPS) such as HCl and fine particulate matter (PM2.5). MATS applies to coal- and oil-fired power plants with a nameplate capacity greater than 25 megawatts. The standards took effect in 2015, but they allowed for a one-year waiver to comply and required that all qualifying units achieve the maximum achievable control technology (MACT) for each of the three covered pollutants. For AEO2018, EIA assumes that all coal-fired generating units affected by the rule are in compliance in terms of meeting HCl and PM2.5, which the EMM does not explicitly model.
All power plants are required to reduce their mercury emissions to 90% below their uncontrolled emissions levels. When plants alter their configuration by adding equipment such as an SCR to remove NOx or an SO2 scrubber, removal of mercury is often a resulting co-benefit. The EMM considers all combinations of controls and may choose to add NOx or SO2 controls purely to lower mercury if it is economic to do so. Plants can also add activated carbon-injection systems specifically designed to remove mercury. Activated carbon can be injected in front of existing particulate-control devices, or a supplemental fabric filter can be added with activated carbon injection capability.
The equipment to inject activated carbon in front of an existing particulate control device is assumed to cost approximately $7 (2017 dollars) per kW of capacity [12]. The costs of a supplemental fabric filter with activated carbon injection (often referred as a COPAC unit) are calculated by unit, with average

March 2018
U.S. Energy Information Administration | Assumptions to the Annual Energy Outlook 2018: Electricity Market Module 21
costs shown in Table 7. The amount of activated carbon required to meet a given percentage removal target is given by the following equations [13].
For a unit with a cold-side electrostatic precipitator (CSE), using subbituminous coal, and simple activated carbon injection:
• Hg Removal (%) = 65 - (65.286 / (ACI + 1.026))
For a unit with a CSE, using bituminous coal, and simple activated carbon injection:
• Hg Removal (%) = 100 - (469.379 / (ACI + 7.169))
For a unit with a CSE and a supplemental fabric filter with activated carbon injection:
• Hg Removal (%) = 100 - (28.049 / (ACI + 0.428))
For a unit with a hot-side electrostatic precipitator (HSE) or other particulate control and a supplemental fabric filter with activated carbon injection:
• Hg Removal (%) = 100 - (43.068 / (ACI + 0.421))
ACI = activated carbon injection rate in pounds per million actual cubic feet of flue gas
Power plant mercury emissions assumptions The EMM represents 36 coal plant configurations and assigns a mercury emissions modification factor (EMF) to each configuration. Each configuration represents different combinations of boiler types, particulate control devices, SO2 control devices, NOx control devices, and mercury control devices. An EMF represents the amount of mercury that was in the fuel that remains after passing through all the plant’s systems. For example, an EMF of 0.60 means that 40% of the mercury in the fuel is removed by various parts of the plant. Table 8 provides the assumed EMFs for existing coal plant configurations without mercury-specific controls.
EIA assumes that all planned retrofits, as reported on the Form EIA-860, will occur as currently scheduled. For AEO2018, retrofits include 2.2 GW of planned SO2 scrubbers.

March 2018
U.S. Energy Information Administration | Assumptions to the Annual Energy Outlook 2018: Electricity Market Module 22
Table 8. Mercury emission modification factors
Configuration EIA EMFs EPA EMFs
SO2 Control Particulate Control
NOx Control Bit Coal Sub Coal Lignite Coal Bit Coal Sub Coal Lignite Coal
None BH -- 0.11 0.27 0.27 0.11 0.26 1.00
Wet BH None 0.05 0.27 0.27 0.03 0.27 1.00
Wet BH SCR 0.10 0.27 0.27 0.10 0.15 0.56
Dry BH -- 0.05 0.75 0.75 0.50 0.75 1.00
None CSE -- 0.64 0.97 0.97 0.64 0.97 1.00
Wet CSE None 0.34 0.73 0.73 0.34 0.84 0.56
Wet CSE SCR 0.10 0.73 0.73 0.10 0.34 0.56
Dry CSE -- 0.64 0.65 0.65 0.64 0.65 1.00
None HSE/Oth -- 0.90 0.94 0.94 0.90 0.94 1.00
Wet HSE/Oth None 0.58 0.80 0.80 0.58 0.80 1.00
Wet HSE/Oth SCR 0.42 0.76 0.76 0.10 0.75 1.00
Dry HSE/Oth -- 0.60 0.85 0.85 0.60 0.85 1.00 Notes: Under SO2 Control - Wet = Wet Scrubber and Dry = Dry Scrubber; Under Particulate Control - BH = fabric filter/baghouse, CSE = cold-side electrostatic precipitator, HSE/Oth = hot-side electrostatic precipitator/other/none; Under NOx Control - SCR = selective catalytic reduction. — = not applicable, Bit = bituminous coal, Sub = subbituminous coal. The NOx control system is not assumed to enhance mercury removal unless a wet scrubber is present, so it is left blank in such configurations. Sources: Environmental Protection Agency emission modification factors (EPA EMFs): www.epa.gov/clearskies/technical.html. EIA EMFs not from EPA: Lignite EMFs, Mercury Control Technologies for Coal-Fired Power Plants, presented by the Office of Fossil Energy on July 8, 2003. Bituminous coal mercury removal for a Wet/HSE/Oth/SCR configured plant, Table EMF1, Analysis of Mercury Control Cost and Performance, Office of Fossil Energy & National Energy Technology, U.S. Department of Energy, January 2003, Washington, DC.
Carbon capture and sequestration retrofits The EMM includes the option of retrofitting existing coal plants for CCS. The modeling structure for CCS retrofits within the EMM was developed by the National Energy Technology Laboratory [14] and uses a generic model of retrofit costs as a function of basic plant characteristics (such as heat rate). The costs have been adjusted to be consistent with costs of new CCS technologies. The CCS retrofits are assumed to remove 90% of the carbon input. The addition of the CCS equipment results in a capacity derate of about 30% and a reduced efficiency of 43% at the existing coal plant. The costs depend on the size and efficiency of the plant, with the capital costs averaging $1,733 per kW and ranging from $1,260 per kW to $2,421 per kW. This analysis assumes that only plants greater than 500 MW and with heat rates below 12,000 Btu per kWh would be considered for CCS retrofits.
Beginning in AEO2018, the EMM includes the option to retrofit existing natural gas-fired combined-cycle plants with CCS technology, also based on the modeling structure developed by NETL.
Heat rate improvement retrofits Since AEO2015, the EMM has included the capability to evaluate the potential for making heat rate improvements at existing coal-fired generators. A generator with a lower heat rate can generate the same quantity of electricity while consuming less fuel, therefore reducing corresponding emissions of
March 2018
U.S. Energy Information Administration | Assumptions to the Annual Energy Outlook 2018: Electricity Market Module 23
SO2, NOx, mercury, and CO2. Improving heat rates at power plants can lower fuel costs and help achieve compliance with environmental regulations. Heat rate improvement is a planning activity as it considers the tradeoff between the investment expenditures and the savings in fuel and/or environmental compliance costs. The amount of potential increase in efficiency can vary depending on the type of equipment installed at a unit, and the beginning configuration of the plant. The EMM represents 32 configurations of existing coal-fired plants based on different combinations of particulate, SO2, NOx, mercury, and carbon emission controls (Table 9). These categories form the basis for evaluating the potential for heat rate improvements.
EIA entered into a contract with Leidos, Inc. to develop a methodology to evaluate the potential for heat-rate improvement at existing coal-fired generating plants [15]. Leidos performed a statistical analysis of the heat-rate characteristics of coal-fired generating units modeled by EIA in the EMM. Specifically, Leidos developed a predictive model for coal-fired electric generating unit heat rates as a function of various unit characteristics. Leidos employed statistical modeling techniques to create the predictive models.
For the EMM plant types, the coal-fired generating units were categorized according to quartiles, based on observed versus predicted heat rates. Units in the first quartile (Q1), which perform better than predicted, were generally associated with the least potential for heat-rate improvement. Units in the fourth quartile (Q4), representing the least-efficient units relative to predicted values, were generally associated with the highest potential for heat-rate improvement. Leidos developed a matrix of heat-rate improvement options and associated costs, based on a literature review and the application of engineering judgment.
Little or no coal-fired capacity exists for the EMM plant types with mercury and carbon-control configurations; therefore, estimates were not developed for those plant types. These plant types were ultimately assigned the characteristics of the plants with the same combinations of particulate, SO2, and NOx controls. Plant types with relatively few observations were combined with other plant types having similar improvement profiles. As a result, nine unique plant type combinations were developed for the purposes of the quartile analysis, and for each of these combinations, Leidos created a maximum potential for heat-rate improvement along with the associated costs to achieve those improved efficiencies.
Leidos used the minimum and maximum characteristics as a basis for developing estimates of mid-range cost and heat-rate improvement potential. The mid-range estimates were used as the default values in the EMM (Table 10).

March 2018
U.S. Energy Information Administration | Assumptions to the Annual Energy Outlook 2018: Electricity Market Module 24
Table 9. Existing pulverized-coal plant types in the NEMS Electricity Market Module
Plant Type Particulate SO2 NOx Mercury Carbon
Controls Controls Controls Controls Controls
B1 BH None Any None None
B2 BH None Any None CCS
B3 BH Wet None None None
B4 BH Wet None None CCS
B5 BH Wet SCR None None
B6 BH Wet SCR None CCS
B7 BH Dry Any None None
B8 BH Dry Any None CCS
C1 CSE None Any None None
C2 CSE None Any FF None
C3 CSE None Any FF CCS
C4 CSE Wet None None None
C5 CSE Wet None FF None
C6 CSE Wet None FF CCS
C7 CSE Wet SCR None None
C8 CSE Wet SCR FF None
C9 CSE Wet SCR FF CCS
CX CSE Dry Any None None
CY CSE Dry Any FF None
CZ CSE Dry SCR FF CCS
H1 HSE/Oth None Any None None
H2 HSE/Oth None Any FF None
H3 HSE/Oth None Any FF CCS
H4 HSE/Oth Wet None None None
H5 HSE/Oth Wet None FF None
H6 HSE/Oth Wet None FF CCS
H7 HSE/Oth Wet SCR None None
H8 HSE/Oth Wet SCR FF None
H9 HSE/Oth Wet SCR FF CCS
HA HSE/Oth Dry Any None None
HB HSE/Oth Dry Any FF None
HC HSE/Oth Dry Any FF CCS Notes: Particulate Controls - BH = baghouse, CSE = cold-side electrostatic precipitator, HSE/Oth = hot-side electrostatic precipitator/other/none; SO2 Controls - Wet = wet scrubber, Dry = dry scrubber; NOx Controls - SCR = selective catalytic reduction; Mercury Controls - FF = fabric filter; Carbon Controls - CCS = carbon capture and storage

March 2018
U.S. Energy Information Administration | Assumptions to the Annual Energy Outlook 2018: Electricity Market Module 25
Table 10. Heat rate improvement (HRI) potential and cost (capital, fixed O&M) by plant type and quartile as used for input to NEMS
Plant type and
quartile
combination
Count of Total
Units
Percentage HRI
Potential
Capital Cost
(million 2014 $/MW)
Average Fixed O&M Cost
(2014 $/MW-yr)
B1-Q1 32 (s) 0.01 200
B1-Q2 15 1% 0.10 2,000
B1-Q3 18 4% 0.20 4,000
B1-Q4 20 6% 0.90 20,000
B3-Q1 13 (s) 0.01 300
B3-Q2 24 1% 0.05 1,000
B3-Q3 16 6% 0.20 3,000
B3-Q4 15 9% 0.60 10,000
B5C7-Q1 16 (s) (s) 80
B5C7-Q2 42 1% 0.03 700
B5C7H7-Q3 84 7% 0.10 2,000
B5C7H7-Q4 59 10% 0.20 4,000
B7-Q1 27 (s) (s) 70
B7-Q2 25 1% 0.04 800
B7-Q3Q4 30 7% 0.30 5,000
C1H1-Q1 148 (s) 0.01 200
C1H1-Q2 117 1% 0.10 2,000
C1H1-Q3 72 4% 0.40 8,000
C1H1-Q4 110 7% 1.00 30,000
C4-Q1 15 (s) (s) 80
C4-Q2 27 1% 0.04 900
C4-Q3 32 6% 0.20 2,000
C4-Q4 39 10% 0.30 5,000
CX-Q1Q2Q3Q4 15 7% 0.20 4,000
H4-Q1Q2Q3 13 3% 0.20 3,000
IG-Q1 3 (s) (s) 60
TOTAL SET 1,027 4% 0.30 6,000 (s) = less than 0.05% for HRI potential or less than 0.005 million $/MW for capital cost. Note: Leidos selected the plant type and quartile groupings such that each grouping contained at least 10 generating units, with the exception of the integrated gasification combined-cycle (IG) type, which has essentially no heat rate improvement potential. Source: U.S. Energy Information Administration/Leidos Corporation.

March 2018
U.S. Energy Information Administration | Assumptions to the Annual Energy Outlook 2018: Electricity Market Module 26
State air emissions regulation AEO2018 continues to model the Northeast Regional Greenhouse Gas Initiative (RGGI), which applies to fossil-fuel powered plants more than 25 MW in the northeastern United States. New Jersey withdrew from the program at the end of 2011, leaving nine states in the accord. The rule caps CO2 emissions from covered electricity generating facilities and requires that they account for each ton of CO2 emitted with an allowance purchased at auction. The original cap was revised downward in 2014 and reflected in previous AEOs. The participating states conducted a program review leading to an Updated Model Rule in December 2017 [16]. AEO2018 incorporates the updates to the original rule, including specifying a cap through 2030, modifications to the Cost Containment Reserves (available if defined allowance-price triggers are exceeded), and creation of an Emissions Containment Reserve (to be used if prices fall below established trigger prices).
The California Senate Bill 32 (SB32), passed in October 2016, revised and extended the greenhouse gas (GHG) emission reductions that were previously in place through the Assembly Bill 32 (AB32), the Global Warming Solutions Act of 2006, which implemented a cap-and-trade program with emission targets required by 2020 from the electric power sector as well as from industrial facilities and fuel providers. SB32 requires the California Air Resources Board (CARB) to enact regulations ensuring the maximum technologically feasible and cost-effective GHG emission reductions and sets a new state emission target of 40% below 1990 emission levels by 2030. A companion law, Assembly Bill 197 (AB197), directs the CARB to consider social costs when determining implementation of any programs to reduce emissions and to prioritize reducing direct emission reductions from stationary, mobile, and other sources. The California Assembly Bill 398 (AB398), passed in July 2017, provided more clarification on how the new targets will be achieved. AEO2018 assumes that a cap-and-trade program remains in place, with the new target specified in 2030 and remaining constant afterward. The emission constraint is in the EMM but accounts for the emissions determined by other sectors. Within the power sector, emissions from plants owned by California utilities but located outside of state, as well as emissions from electricity imports into California, count toward the emission cap, and estimates of these emissions are included in the EMM constraint. An allowance price is calculated and added to fuel prices for the affected sectors. Limited banking and borrowing of allowances as well as an allowance reserve and offsets have been modeled, as specified in the bills, providing some compliance flexibility and cost containment. Changes in other modules to address SB32 and AB197, such as assumed policy changes that affect vehicle travel and increases in energy efficiency, are described in the appropriate chapters of this report.
State revenue support for existing nuclear power plants Two states passed legislation in 2017 to provide price support for existing nuclear units that could be at risk of early closure due to declining profitability. The New York Clean Energy Standard [17] creates zero emission credits (ZECs) that are applicable for certain nuclear units. The New York load-serving entities are responsible for purchasing ZECs equal to their share of the statewide load, providing an additional revenue source to the nuclear units holding the ZECs. The program is set to cover a 12-year term, and the annual value of the ZEC is determined by the state, taking into account the state-determined value of clean energy, and will be reevaluated over time.
The Illinois Future Energy Jobs Bill [18] also creates a ZEC program covering a 10-year term. Nuclear power plants serving at least 100,000 customers in Illinois are eligible for ZECs. The Illinois Power Agency

March 2018
U.S. Energy Information Administration | Assumptions to the Annual Energy Outlook 2018: Electricity Market Module 27
must procure ZECs to cover 16% of utility sales in 2014. The value of the ZEC is capped at a state-determined value of clean energy and will increase over time, subject to an annual cap of $250 million.
This legislation is modeled in AEO2018 by explicitly requiring nuclear units located in Illinois and upstate New York to continue to operate through the program period (the model cannot choose to endogenously retire the plant). The cost of each program is determined by comparing the affected plants’ costs with the corresponding revenues based on the modeled marginal energy prices to evaluate plant profitability. If plant costs exceed revenues, a subsidy payment is applied. The cost of the subsidy payment is recovered through retail prices as an adder to the electric distribution price component, to represent the purchase of ZECs by load-serving entities.
Energy Policy Acts of 1992 (EPACT1992) and 2005 (EPACT2005) The provisions of EPACT1992 include revised licensing procedures for nuclear plants and the creation of exempt wholesale generators (EWGs). EPACT1992 also implemented a permanent 10% ITC for geothermal and solar facilities and introduced a PTC for eligible renewable technologies (subsequently extended and expanded). EPACT2005 provides a 20% ITC for Integrated Coal-Gasification Combined-Cycle capacity and a 15% ITC for other advanced coal technologies. These credits are limited to 3 GW in both cases. These credits have been fully allocated and are not assumed to be available for new, unplanned capacity built within the EMM. EPACT2005 also contains a PTC of 1.8 cents (nominal) per kWh for new nuclear capacity beginning operation by 2020. This PTC is specified for the first eight years of operation and is limited to $125 million annually and to 6 GW of new capacity. However, this credit may be shared to additional units if more than 6 GW were under construction by January 1, 2014. EPACT2005 extended the PTC for qualifying renewable facilities by two years, or through December 31, 2007, and also repealed the Public Utility Holding Company Act (PUHCA).
The investment and energy PTCs initiated in EPACT92 and amended in EPACT2005 have been further amended through a series of acts that were incorporated in previous AEOs. A history of these tax credits is described in AEO2016 Legislation and Regulations LR3 - Impact of a Renewable Energy Tax Credit extension and phase-out [19]. AEO2018 continues to reflect the most recent changes implemented through the 2016 Consolidated Appropriation Act passed in December 2015. Utility-scale solar projects under construction before the end of 2019 receive an ITC of 30%, while those starting construction in 2020 and 2021 qualify for credits of 26% and 22%, respectively. The ITC is 10% for plants under construction after 2021.
The PTC is a per-kWh tax credit available for qualified wind, geothermal, closed-loop and open-loop biomass, landfill gas, municipal solid waste, hydroelectric, and marine and hydrokinetic facilities. The value of the credit, originally 1.5 cents/kWh, is adjusted for inflation annually and is available for 10 years after the facility has been placed in service. For AEO2018, wind, poultry litter, geothermal, and closed-loop biomass resources receive a tax credit of 2.4 cents/kWh; all other renewable resources receive a 1.2 cent/kWh (that is, one-half the value of the credit for other resources) tax credit. EIA assumes that biomass facilities obtaining the PTC will use open-loop fuels, as closed-loop fuels are assumed to be unavailable and/or too expensive for widespread use during the period that the tax credit is available. The PTC has been recently extended by the 2016 Consolidated Appropriation Act passed in December 2015 for projects under construction through 2016. The PTC is scheduled to phase down in value for wind projects as follows: 80% of the current PTC if construction begins in 2017; 60% of

March 2018
U.S. Energy Information Administration | Assumptions to the Annual Energy Outlook 2018: Electricity Market Module 28
the current PTC if construction begins in 2018; and 40% of the current PTC if construction begins in 2019. Plants that begin construction in 2020 or later do not receive a PTC. Based on documentation released by the Internal Revenue Service, EIA assumes that wind plants will be able to claim the credit up to four years after beginning construction.
The ITCs and PTCs are exclusive of one another and thus may not both be claimed for the same facility. EIA assumes that the PTC is chosen for new geothermal plants when it is available (through December 2016) and that the 10% ITC is chosen for plants developed after 2016. Both onshore and offshore wind projects are eligible to claim the ITC in lieu of the PTC. While onshore wind projects are expected to choose the PTC, EIA assumes offshore wind farms will claim the ITC because of the high capital costs for offshore wind.
American Recovery and Reinvestment Act (ARRA) Smart grid expenditures The ARRA provides $4.5 billion for smart grid demonstration projects. While somewhat difficult to define, smart grid technologies generally include a wide array of measurement, communications, and control equipment employed throughout the transmission and distribution system that will enable real-time monitoring of the production, flow, and use of power from the generator to the consumer. Among other things, these smart grid technologies are expected to enable more-efficient use of the transmission and distribution grid, lower line losses, and greater use of renewables. Smart grid technologies also provide information to utilities and their customers that will lead to greater investment in energy efficiency and reduced peak load demands. The funds provided will not support a widespread implementation of smart grid technologies, but the investments could stimulate more rapid development than would otherwise occur.
Several changes were made throughout NEMS to represent the impacts of the smart grid funding provided in ARRA. In the electricity module, line losses are assumed to fall slightly, peak loads are assumed to fall as customers shift their usage patterns, and customers are assumed to be more responsive to pricing signals. Historically, line losses, expressed as the percentage of electricity lost, have been falling for many years as utilities have made investments to replace aging or failing equipment.
FERC Orders 888 and 889 FERC issued two related rules (Orders 888 and 889) designed to bring low-cost power to consumers through competition, ensure continued reliability in the industry, and provide for open and equitable transmission services by owners of these facilities.
Specifically, Order 888 requires open access to the transmission grid currently owned and operated by utilities. The transmission owners must file nondiscriminatory tariffs that offer other suppliers the same services that the owners provide for themselves. Order 888 also allows these utilities to recover stranded costs (investments in generating assets that are unrecoverable due to consumers selecting another supplier). Order 889 requires utilities to implement standards of conduct and an Open Access Same-Time Information System (OASIS) through which utilities and non-utilities can receive information regarding the transmission system. As a result, utilities have functionally or physically unbundled their marketing functions from their transmission functions.

March 2018
U.S. Energy Information Administration | Assumptions to the Annual Energy Outlook 2018: Electricity Market Module 29
These orders are represented in EMM by assuming that all generators in a given region are able to satisfy load requirements anywhere within the region. Similarly, the EMM assumed that transactions between regions will occur if the cost differentials between them make those transactions economical.
March 2018
U.S. Energy Information Administration | Assumptions to the Annual Energy Outlook 2018: Electricity Market Module 30
Notes and sources [1] Review of Power Plant Cost and Performance Assumptions for NEMS, Leidos Engineering, April 2016, https://www.eia.gov/analysis/studies/powerplants/capitalcost/pdf/capcost_assumption.pdf.
[2] Review of power Plant Cost and Performance Assumptions for NEMS, Technology Documentation Report Addendum, January 2017, https://www.eia.gov/analysis/studies/powerplants/capitalcost/pdf/eiatasks_10388_10687addendum.pdf.
[3] Numerous press announcements regarding coal to gas conversions, for example, “NRG Energy completes four coal to gas projects”, December 20, 2016, http://www.elp.com/articles/2016/12/nrg-energy-completes-four-coal-to-gas-projects.html; and “IPL burns coal for the last time at Harding Street Station”, February 25, 2016, https://www.iplpower.com/Our_Company/Newsroom/News_archives/2016/IPL_burns_coal_for_the_last_time_at_Harding_Street_Station/
[4] Documentation for EPA Base Case v.5.13 Using the Integrated Planning Model, November 2013, https://www.epa.gov/sites/production/files/2015-07/documents/documentation_for_epa_base_case_v.5.13_using_the_integrated_planning_model.pdf
[5] North American Electric Reliability Corporation, 2013 Summer Reliability Assessment (Atlanta, GA: May 2013), http://www.nerc.com/pa/RAPA/ra/Reliability%20Assessments%20DL/2013SRA_Final.pdf.
[6] Idaho National Laboratory Economic and market challenges facing nuclear fleet (September 2016), https://gain.inl.gov/Shared%20Documents/Economics-Nuclear-Fleet.pdf
[7] U.S. Environmental Protection Agency, "Carbon Pollution Emission Guidelines for Existing Stationary Sources: Electric Utility Generating Units" (Washington, DC: October 23, 2015), https://www.federalregister.gov/articles/2015/10/23/2015-22842/carbon-pollution-emission-guidelines-for-existing-stationary-sources-electric-utility-generating
[8] L. Deniston, SCOTUSBlog, "Carbon Pollution Controls Put On Hold" (Washington, DC: February 9, 2016), http://www.scotusblog.com/2016/02/carbon-pollution-controls-put-on-hold
[9] White House, Presidential Executive Order on Promoting Energy Independence and Economic Growth, https://www.whitehouse.gov/presidential-actions/presidential-executive-order-promoting-energy-independence-economic-growth
[10] Repeal of Carbon Pollution Emission Guidelines for Existing Stationary Sources: Electric Utility Generating Units, Environmental Protection Agency, Proposed Rule, Federal Register, Vol. 82, No. 198, (October 16, 2017).

March 2018
U.S. Energy Information Administration | Assumptions to the Annual Energy Outlook 2018: Electricity Market Module 31
Notes and sources (cont.) [11] U.S. Environmental Protection Agency, "Standards of Performance for Greenhouse Gas Emissions From New, Modified, and Reconstructed Stationary Sources: Electric Utility Generating Units" (Washington, DC: October 23, 2015), https://www.federalregister.gov/articles/2015/10/23/2015-22837/standards-of-performance-for-greenhouse-gas-emissions-from-newmodified- and-reconstructed-stationary
[12] These costs were developed using the National Energy Technology Laboratory Mercury Control Performance and Cost Model, 1998.
[13] U.S. Department of Energy, Analysis of Mercury Control Cost and Performance, Office of Fossil Energy & National Energy Technology Laboratory, January 2003.
[14] Retrofitting Coal-Fired Power Plants for Carbon Dioxide Capture and Sequestration - Exploratory Testing of NEMS for Integrated Assessments, DOE/NETL-2008/1309, P.A. Geisbrecht, January 18, 2009.
[15] Analysis of Heat Rate Improvement Potential at Coal-Fired Power Plants, May 2015, Leidos, Inc. http://www.eia.gov/analysis/studies/powerplants/heatrate/pdf/heatrate.pdf
[16] 2017 Model Update, The Regional Greenhouse Gas Initiative, https://www.rggi.org/program-overview-and-design/program-review
[17] State of New York Public Service Commission, Order Adopting a Clean Energy Standard, August 1, 2016, https://www.nyserda.ny.gov/All-Programs/Programs/Clean-Energy-Standard
[18] State of Illinois, “Future Energy Jobs Bill”, Public Act 099-0906, June 1, 2017, https://www2.illinois.gov/sites/ipa/Pages/default.aspx
[19] U.S. Energy Information Administration, Annual Energy Outlook 2016, Legislation and Regulations LR3, DOE/EIA-0383(2016) (Washington, DC, August 2016), https://www.eia.gov/outlooks/archive/aeo16/section_legs_regs.cfm
Related Documents