Chapter 8 Economic Growth

Chapter 8 Economic Growth. -- measured by % change in real GDP -- common measurement is real GDP per capita (known as the avg standard of living) Real.
Dec 26, 2015
Welcome message from author
This document is posted to help you gain knowledge. Please leave a comment to let me know what you think about it! Share it to your friends and learn new things together.
Transcript

Chapter 8
Economic Growth

Economic Growth
-- measured by % change in real GDP
-- common measurement is real GDP per capita (known as
the avg standard of living)
Real GDP per capita = Real GDP
Population
-- Economic growth occurs when real GDP per capita is increasing increase in avg standard of living
Growth Rates in real GDP per capita are determined by one of two methods:
1) % ∆ Real GDP Per Capita
-- traditional % ∆ formula that is computed for relatively short time frames

Example:
If in 1996, real GDP per capita = $31,403
in 2000, real GDP per capita = $34,788
% ∆ Real GDP/Capita = ($34,788 - $31,403)
$31,403
= 10.8%
2) Avg Annual Growth Rate (Compound Avg Growth Rate)
-- used primarily for longer time frames

Example:
If in 1954, real GDP per capita = $10,300
in 2000, real GDP per capita = $34,788
Interpretation:

Factors Causing Economic Growth
1) Increase in employment or # of population working
2) Increase in labor productivity
labor productivity: quantity of goods and services that can be produced per worker
Note: Labor productivity is more commonly measured as output per hr worked vs. per worker to smooth out fluctuations in work days and # employees.
x=

Labor Productivity is influenced by:
1) Amount of Human Capital
-- knowledge, skills, education, experience and other qualities of work force
-- influx of human capital provides the foundation for rapid economic growth or increase in labor productivity
-- By itself, it may not be strong enough to positively influence labor productivity
2) Physical Capital
-- Increase or accumulation of capital stock (machines, equipment, factories, etc used to produce other goods and services) normally leads to increased labor productivity
-- coupled with Human Capital, the existence of ample physical capital can lead to high levels of labor productivity

Per-Worker Production Function
-- Relationship between real GDP per hour worked and capital per hr worked, with technology held constant.
-- used to illustrate increase in labor productivity (drives economic growth) due to increase in capital
-- as capital stock per hr worked increases, labor productivity increases (i.e. adding additional machines can generate more output per hr worked).

Let K = Capital; L = Labor and; Y = Real GDP
Impact of Increase in Capital-- ↑ in quantity of capital per hr worked increases quantity of output each worker produces, but at a diminishing rateA to B ∆ Capital per hr worked is $10,000
∆ Output per hr worked is $50B to C ∆ Capital per hr worked is $10,000
∆ Output per hr worked is $40
Capital per hr worked (K/L)
Real GDP per hr worked (Y/L)
Production Function
$10,000
$50
$20,000 $30,000 $40,000
$100
$140
$160
A
B
C

Observation: Equal incremental changes in capital per hr worked results in smaller changes in output per hr worked.
-- reflects the law of diminishing returns adding more of a variable input (capital) to a fixed amount of another input (labor), causes the causes the marginal product of marginal product of the variable input to declinethe variable input to decline
-- eventually marginal real GDP per hr worked is nearly $0
3) Technological Change
-- technology is defined as the quantity of output firms can produce with a given quantity of inputs
-- ability to develop and apply new technology and production methods with goal of increasing productivity is the essence of technological change
-- most powerful agent for economic change
-- shifts the production function upward (given the same amount of capital per hr worked, real GDP per hr worked increases)
-- major factor is the level of R & D spending by firms

2) Impact of Technological Change
-- shifts the production function upward (assume positive change)
-- given the same amount of capital per hr worked, real GDP per hr worked increases

Observation:
-- Increase in technology shifts the production function from Production Function 1 to Production Function 2 and further technological changes pushes it up to Production Function 3
-- Since each production function reaches diminishing returns to capital, to maintain increase in avg standard of living, there must be technological change.

4) Land and Other Natural Resources
-- includes land, energy and raw materials
-- ability to buy or harness domestically increases productivity
-- productivity is magnified as quality improves
5) Entrepreneurship and Management
Entrepreneurship: individuals involved in new
business ventures
-- level or number of entrepreneurs depends on the existence and amount of incentives for risk involved
-- must create an environment that promotes activity through a balance of risks and rewards

Management
-- Day-to-day operations are run by managers and their philosophies, actions and direction has the ability to increase labor productivity.
-- Japan, for instance, has been instrumental in adopting effective production management styles that both motivates employees and is productively efficient (i.e. “The Toyota Way”)
-- also includes the organization of a production system such that operations are run in the most efficient manner.
Eg.) work stations and parts are organized in the most strategic places to promote efficiency (in Toyota’s terms eliminating “muda” or waste)
-- Actions can make a very direct effect on productivity and within a short time frame
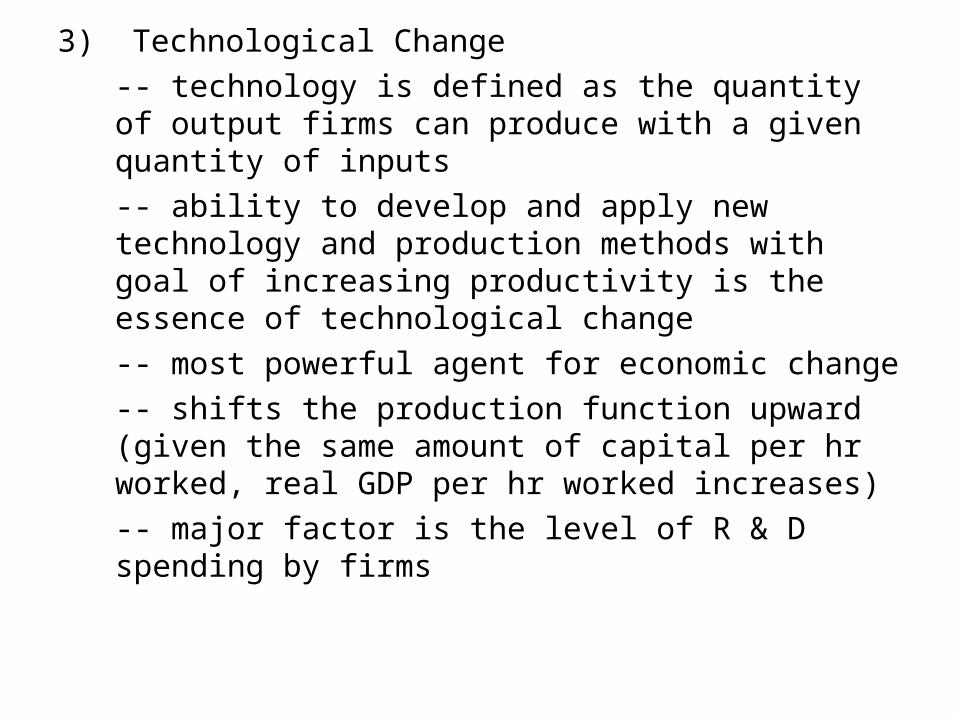
6) Political and Legal Environment
-- Gov’t role in creating an environment that promotes increased
productivity
1) Enforce Property Rights and Rule of Law
Rule of Law
-- ability of a Gov’t to enforce laws relating to private property and contracts
-- properties are protected and can not be arbitrarily seized
-- clearly defined rules for determining who owns the resources and how they are used helps to create a stable climate for production
2) Political Stability
-- leads to increased productivity through sustained confidence of investors in the political environment where they are conducting business
-- less likely to invest money or resources in a country that has ongoing political issues

Promoting Economic Growth
1) High Standards of Health and Education
-- old cliché holds true…healthy individuals are more productive individuals
-- highly educated and skilled workers promote technological change
-- rising incomes from economic growth can limit the amount of “brain drain” (highly educated people leaving one country for another which holds greater opportunity)
-- free public education and Gov’t subsidies for higher education
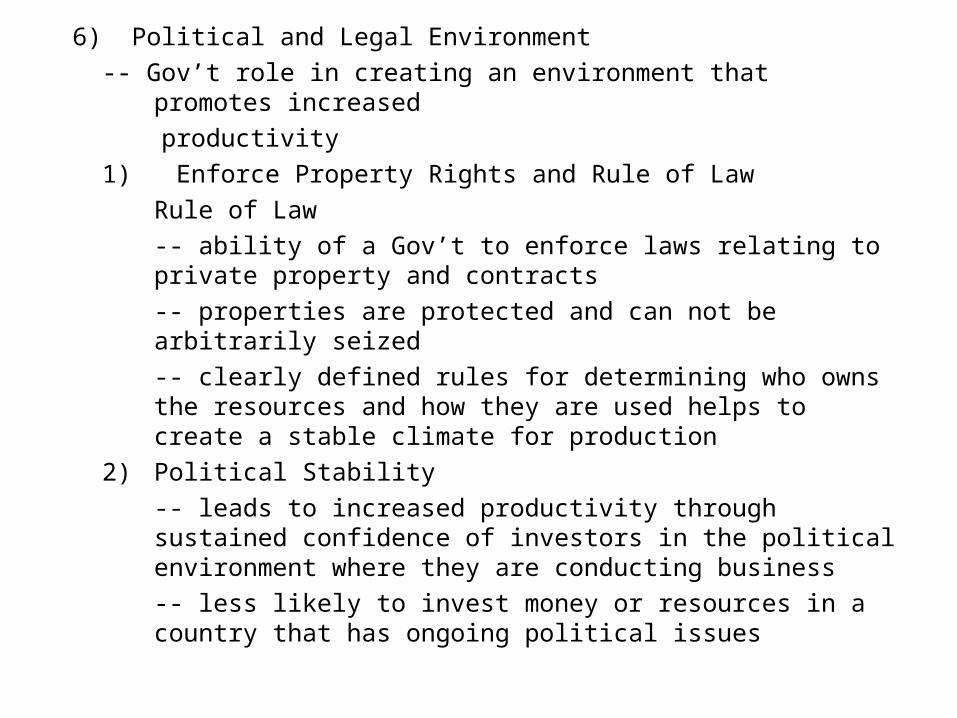
2) Technology Policiesi) Countries relaxing restrictions to FDI (Foreign Direct Investment)
-- allowing foreign firms to build factories or to buy domestic firms
-- gain access to technology that can be used for domestic-owned industries
ii) Subsidization of R & D / Increased R & Da) Increased Gov’t funds to universities and tax incentives to private research labsb) Enhance patent protection Patents are exclusive rights to a new product
for 20 yrs from date patent is approvedc) Gov’t expansion of own R & D spendingd) Implement any Gov’t policy that stimulates
investment spending

3) Policies Leading to Increased Saving and Investment
Techniques aimed at household saving
-- household savings are used to supply funds to firms for investment
1) Behavioral change in savings due to security of employment, anticipation of early retirement, increased in life expectancy, etc
2) Gov’t decrease in Capital Gains Tax
-- Capital Gains Tax is a tax on profits earned when a financial asset is sold at more than the acquisition price
-- stocks and bonds become more rewarding to own
3) Convert U.S. Income Tax to Consumption tax
-- deduct your savings from your income so only income spent is taxed (tax on part of income spent)

Techniques aimed at Firms
-- targets increase in planned investment spending
1) Reduce Corporate Profits Tax
-- allows corporations to retain more profits to make further investments
2) Introduce Investment Credits
-- reduction in taxes for firms that invest in certain types of capital

Economic Growth in U.S. and Economic Growth in U.S. and AbroadAbroad

Real GDP per Capita, 1870-2003 (in 2000 US Real GDP per Capita, 1870-2003 (in 2000 US Dollars)Dollars)

Growth of Real GDP per Capita, Growth of Real GDP per Capita, 1870 - 20031870 - 2003
CountryAnnual % Change
1870 – 2003
Annual % Change
1950 – 2003
Annual % Change
1979 - 2003
US 1.9% 2.1% 1.8%
UK 1.4 2.1 2.0
Germany 1.8 3.1 1.3
Japan 2.6 4.6 2.0
Brazil 1.6 2.3 0.5
China 1.7 4.6 6.6
Ghana 0.9 0.4 0.5
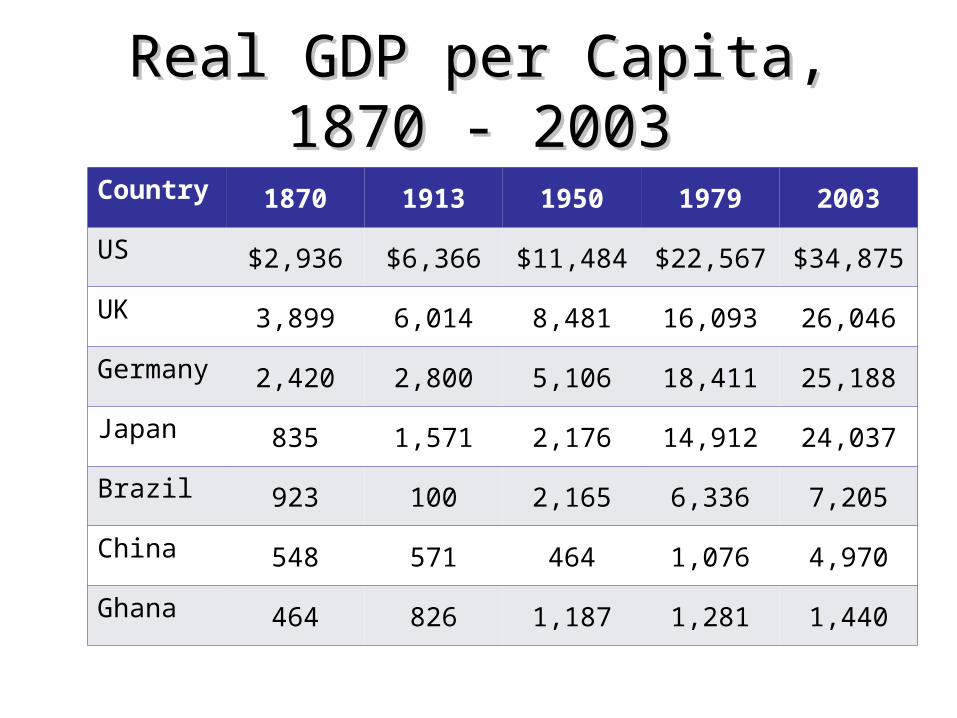
Real GDP per Capita, 1870 - Real GDP per Capita, 1870 - 20032003
Country 1870 1913 1950 1979 2003
US $2,936 $6,366 $11,484 $22,567 $34,875
UK 3,899 6,014 8,481 16,093 26,046
Germany 2,420 2,800 5,106 18,411 25,188
Japan 835 1,571 2,176 14,912 24,037
Brazil 923 100 2,165 6,336 7,205
China 548 571 464 1,076 4,970
Ghana 464 826 1,187 1,281 1,440

Using Compound Interest Rates to Demonstrate Magnitude of Long-Term Growth
• In 1870, Brazil's GDP per capita was twice Ghana'sIn 1870, Brazil's GDP per capita was twice Ghana's
– By 2003, the multiple increased to 5 timesBy 2003, the multiple increased to 5 times
– Brazil's growth over the period was 1.6% and Ghana's Brazil's growth over the period was 1.6% and Ghana's was 0.9%was 0.9%
• Compound interest Compound interest pays interest on the original deposit pays interest on the original deposit and all previously accumulated interestand all previously accumulated interest
-- -- payment of interest on initial deposit and all payment of interest on initial deposit and all previous previous interest (cumulative)interest (cumulative)
-- Interest paid in year 1 earns interest in year 2-- Interest paid in year 1 earns interest in year 2
Initial Deposit x (1+interest) Initial Deposit x (1+interest)
Eg) $50 deposited at 4% interest in 1800 is $ in 2005Eg) $50 deposited at 4% interest in 1800 is $ in 2005
$50 x (1.04)$50 x (1.04)205205 = $155,169 = $155,169
# yrs

Small differences in annual growth rates add up over time
GDP per capita is about $400 now.
In 50 years, it would grow to about:
_________ if the growth rate were 1%.
_________ if the growth rate were 3%.
_________ if the growth rate were 5%.

The Rule of 70• The Rule of 70 is useful for financial as well as
demographic analysis. It states that to find the doubling time of a quantity growing at a given annual percentage rate, divide the percentage number into 70 to obtain the approximate number of years required to double. For example, at a 10% annual growth rate, doubling time is 70 / 10 = 7 years. Similarly, to get the annual growth rate, divide 70 by the doubling time. For example, 70 / 14 years doubling time = 5, or a 5% annual growth rate. The following table shows some common doubling times:

Globalization Has Opened the Doors toGlobalization Has Opened the Doors to
Economic GrowthEconomic Growth
-- Process of countries becoming more -- Process of countries becoming more open to foreign trade and investmentopen to foreign trade and investment FDI (Foreign Direct Investment): FDI (Foreign Direct Investment):
allowing foreign firms to build allowing foreign firms to build factories or to buy domestic firmsfactories or to buy domestic firms
-- lead many countries to experience -- lead many countries to experience economic growth or achieving economic growth or achieving increases in real GDP per capitaincreases in real GDP per capita
Related Documents